+ All Categories
Home > Documents > Natality Report by Racial and Ethnic Population Groups, Kansas, 2011

Natality Report by Racial and Ethnic Population Groups, Kansas, 2011

Date post: 03-Feb-2022
Category:
Upload: others
View: 2 times
Download: 0 times
Share this document with a friend
29
Natality Report by Racial and Ethnic Population Groups, Kansas, 2011 Kansas Department of Health and Environment Division of Public Health Bureau of Epidemiology and Public Health Informatics Curtis State Office Building – 1000 SW Jackson, Topeka, KS, 66612-1354 http://www.kdheks.gov/bephi/ September 2013
Transcript


Natality Report by Racial and Ethnic Population Groups, Kansas, 2011


Kansas Department of Health and Environment Division of Public Health

Bureau of Epidemiology and Public Health Informatics Curtis State Office Building – 1000 SW Jackson, Topeka, KS, 66612-1354

http://www.kdheks.gov/bephi/ September 2013

This Research Summary Was Prepared By:

Kansas Department of Health and Environment

Robert Moser, MD, Secretary

Bureau of Epidemiology and Public Health Informatics D. Charles Hunt, MPH, Director and State Epidemiologist

Elizabeth W. Saadi, PhD, Deputy Director and State Registrar

in consultation with

Center for Health Equity Aiko Allen, Director

Prepared by: Cathryn Savage, PhD Greg Crawford, BA

Desktop Publishing by: Laurie Stanley .

Data for this report were collected by:

Office of Vital Statistics

Donna Calabrese, Director

Our Vision – Healthy Kansans living in safe and sustainable environments Our Mission – To protect and improve the health and environment of all Kansans

Introduction The purpose of this report is to present statistics for 2011 on Kansas resident live births by maternal population group based on race/Hispanic origin. Birth outcome indicators include maternal age, education level, marital status, adequacy of prenatal care, primary pay source, WIC service utilization and gestational age of infant at birth. These indicators are examined among population groups by normal birth outcomes and by a summary measure of poor birth outcomes.

Report tables may be used as source information in the determination of disparate outcomes. Information may also be used for program planning purposes.

Methods Data in this report are based on Kansas resident birth records provided to the Bureau of Epidemiology and Public Health Informatics Office of Vital Statistics by hospitals and health care providers in Kansas and from vital statistics programs in other states. The records are considered 99.99 percent complete. Tables of counts and percentage rates were prepared for selected birth outcomes and maternal characteristics by population groups (see Technical Notes for definitions of selected birth outcomes).

Items for which no response was provided are shown as “not stated” (n.s.) in tables throughout this publication. The “not stated” count has been included in the denominator when calculating percentages for population groups.

Population groups used in this report are Non-Hispanic White, Non-Hispanic Black, Non-Hispanic Native American,

Non-Hispanic Asian/Pacific Islander (Asian/PI), Non-Hispanic Multi-race, Other Non-Hispanic and Hispanic any race.

A poor birth outcome was defined as one or more of the following indicators: Low birth weight (less than 2500 grams), prematurity (less than 37 weeks gestation), congenital anomalies and abnormal conditions of the newborn (see Technical Notes for detailed definitions and the list of abnormal conditions of the newborn).

Results Twenty tables containing counts and percentage rates were prepared.

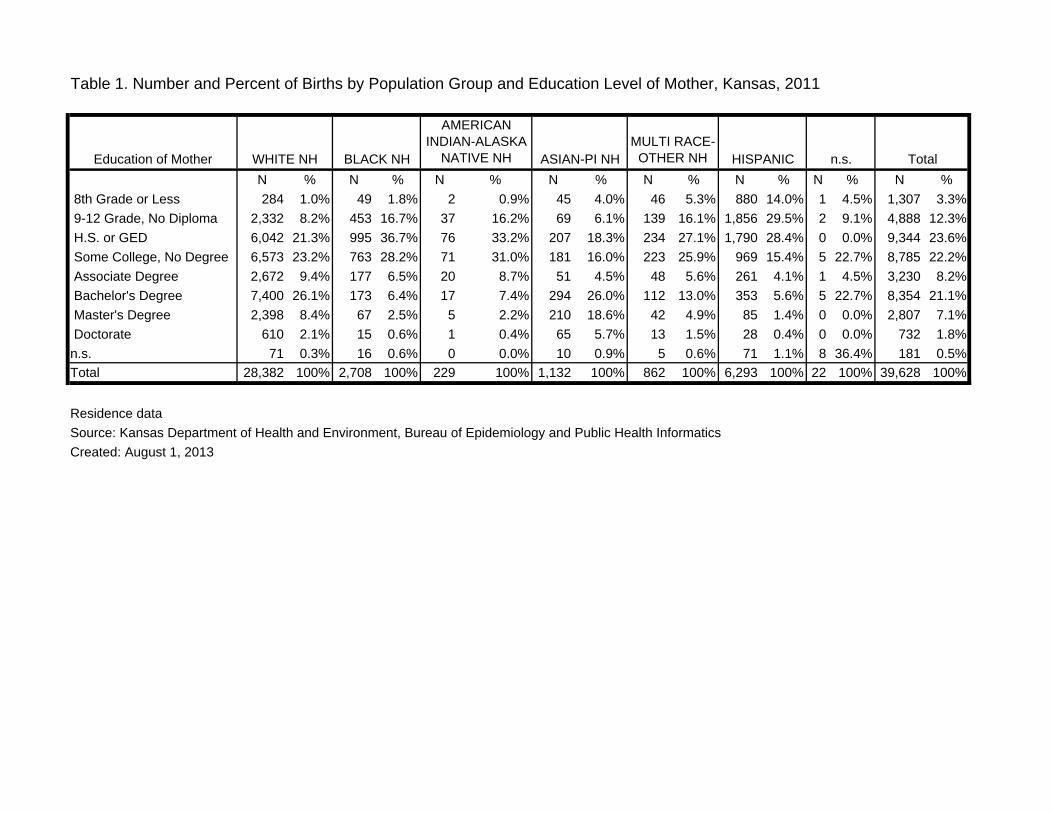
Table 1. Number and percent of births by population group and education level of mother, Kansas, 2011

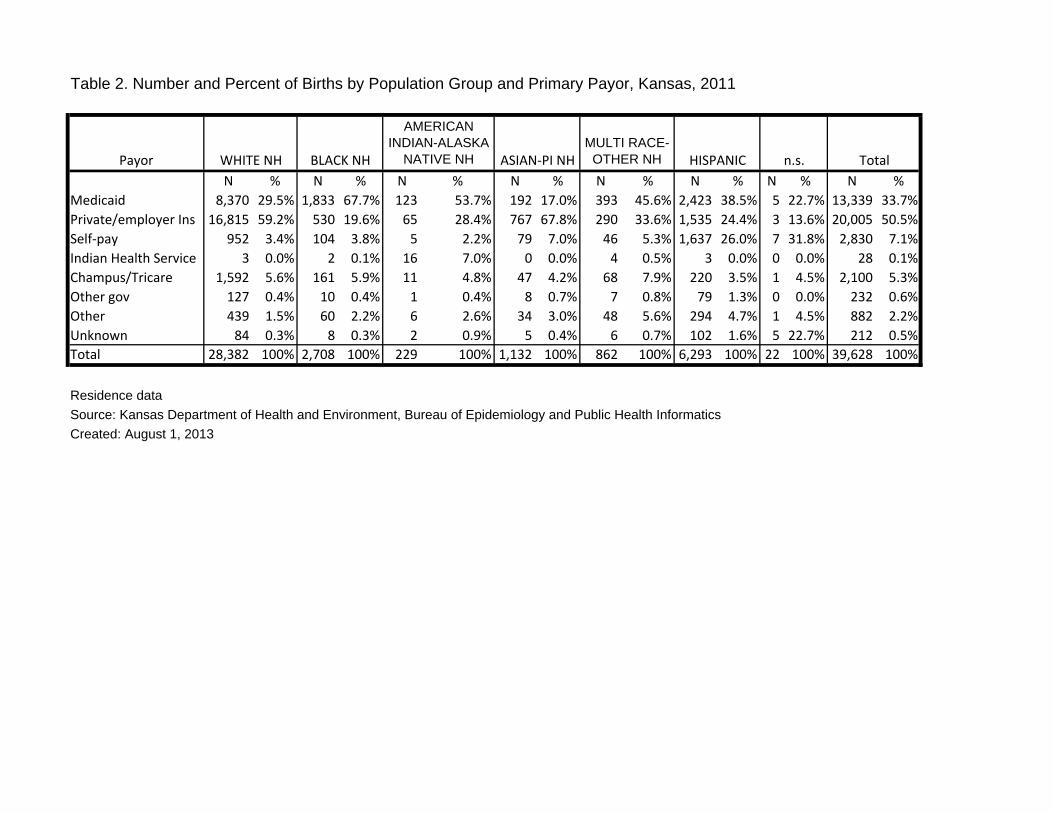
Table 2. Number and percent of births by population group and primary payor, Kansas, 2011

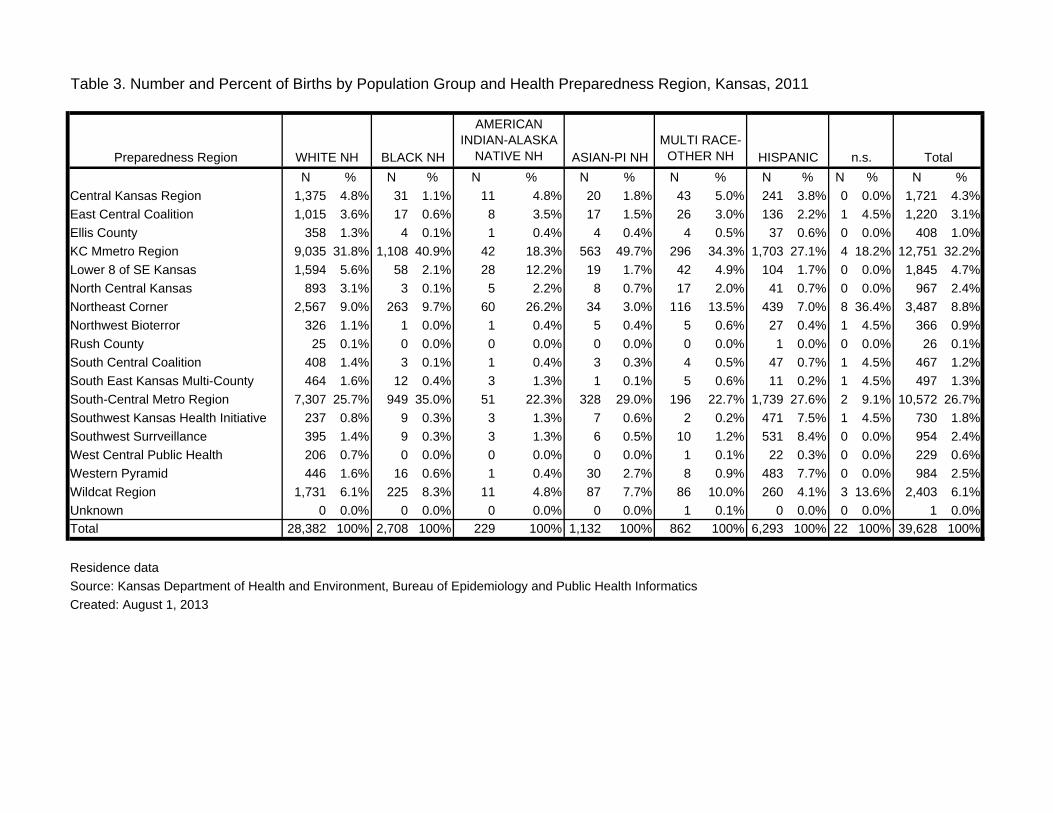
Table 3. Number and percent of births by population group and health preparedness region, Kansas, 2011

Table 4. Number and percent of births by population group and mother's marital status, Kansas, 2011

Table 5. Number and percent of births by population group and adequacy of prenatal care, Kansas, 2011

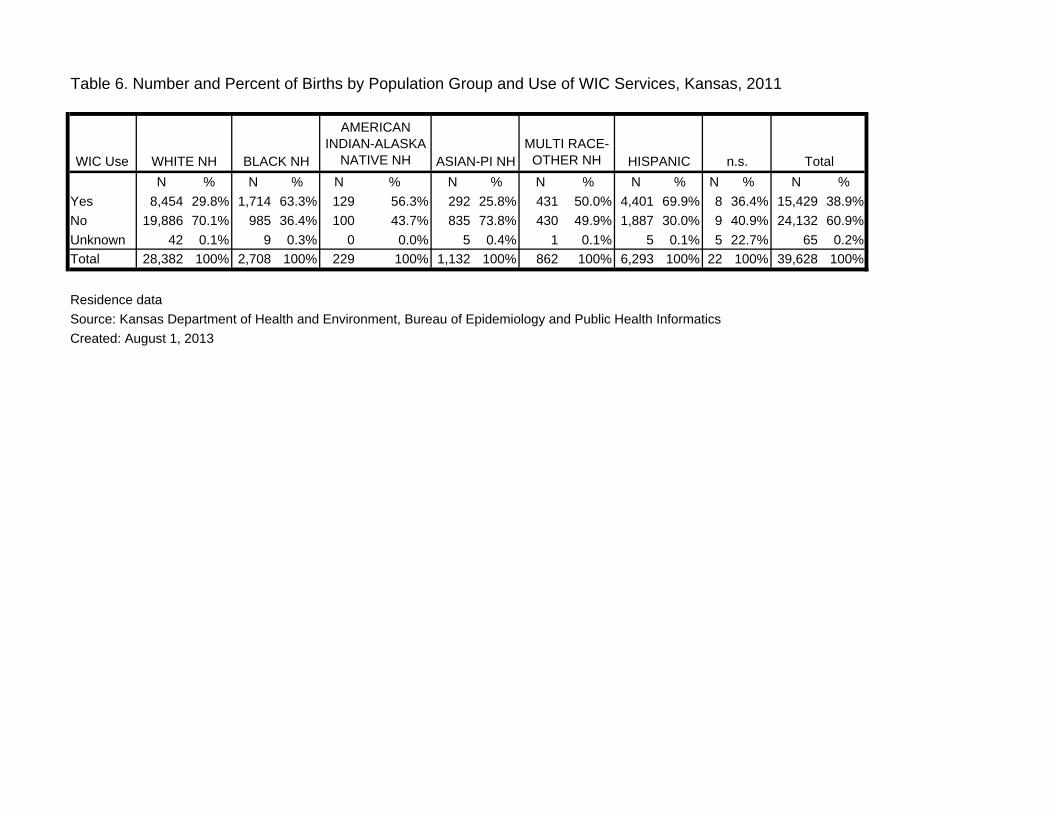
Table 6. Number and percent of births by population group and use of WIC services, Kansas, 2011

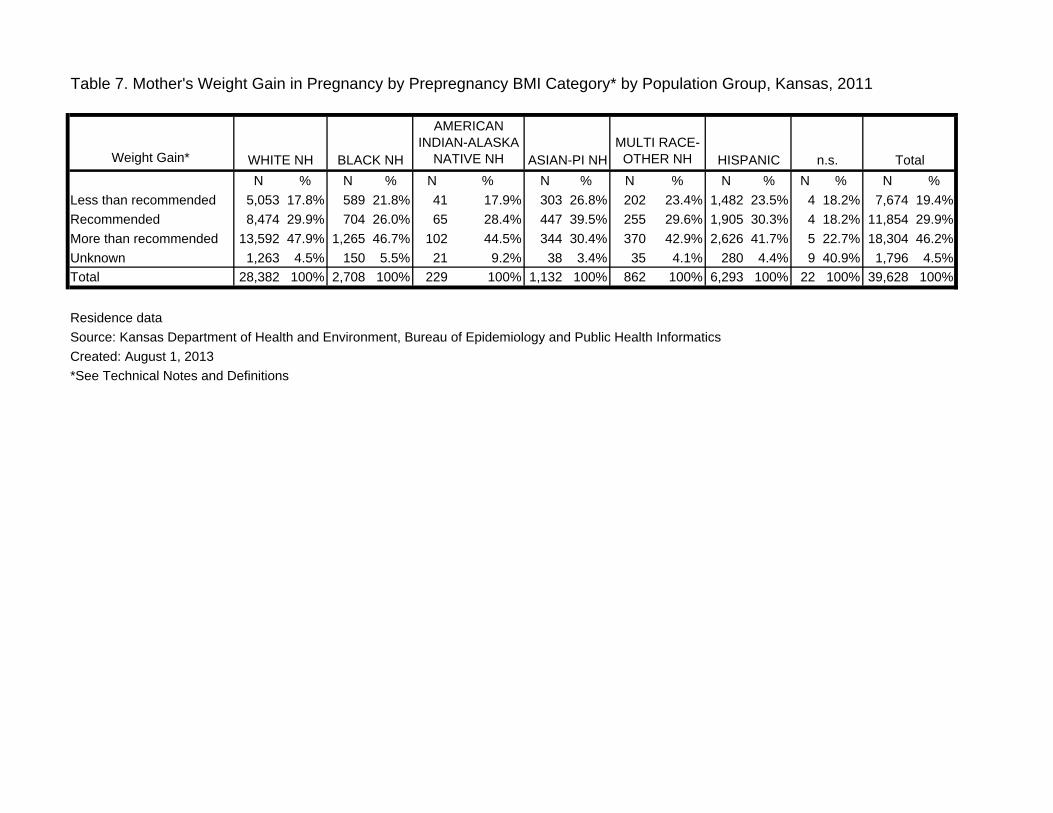
Table 7. Mother's weight gain in pregnancy by prepregnancy BMI category by population group, Kansas, 2011

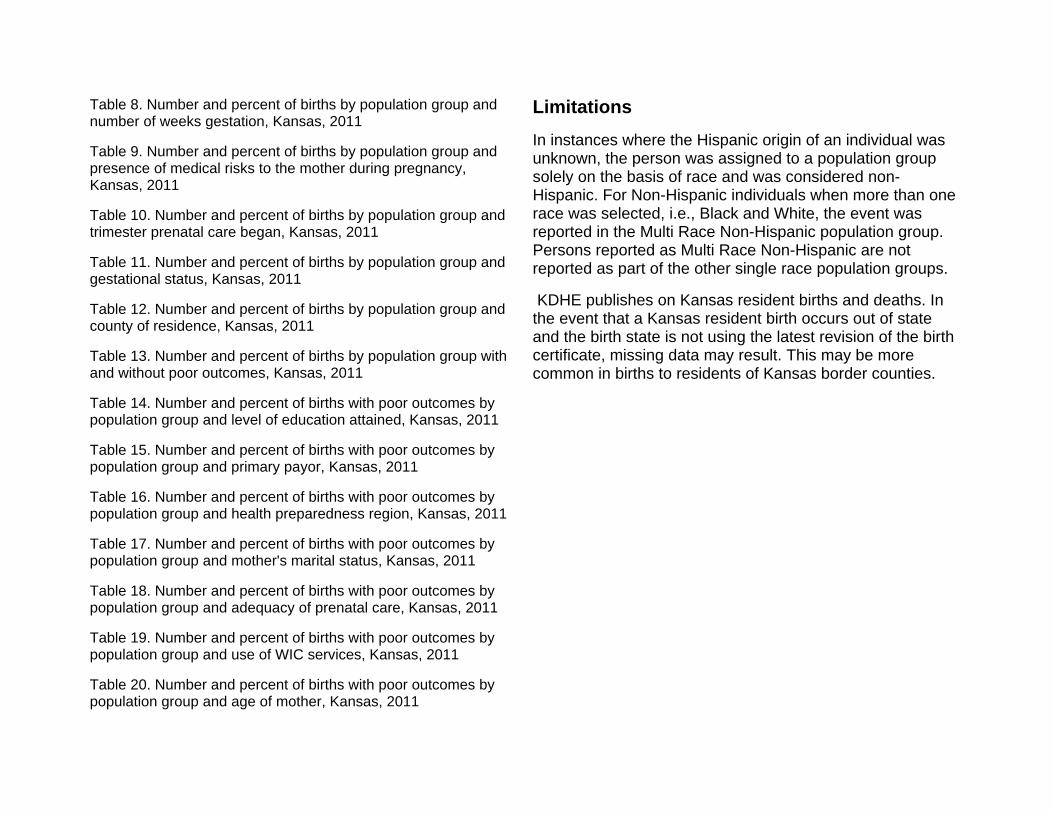
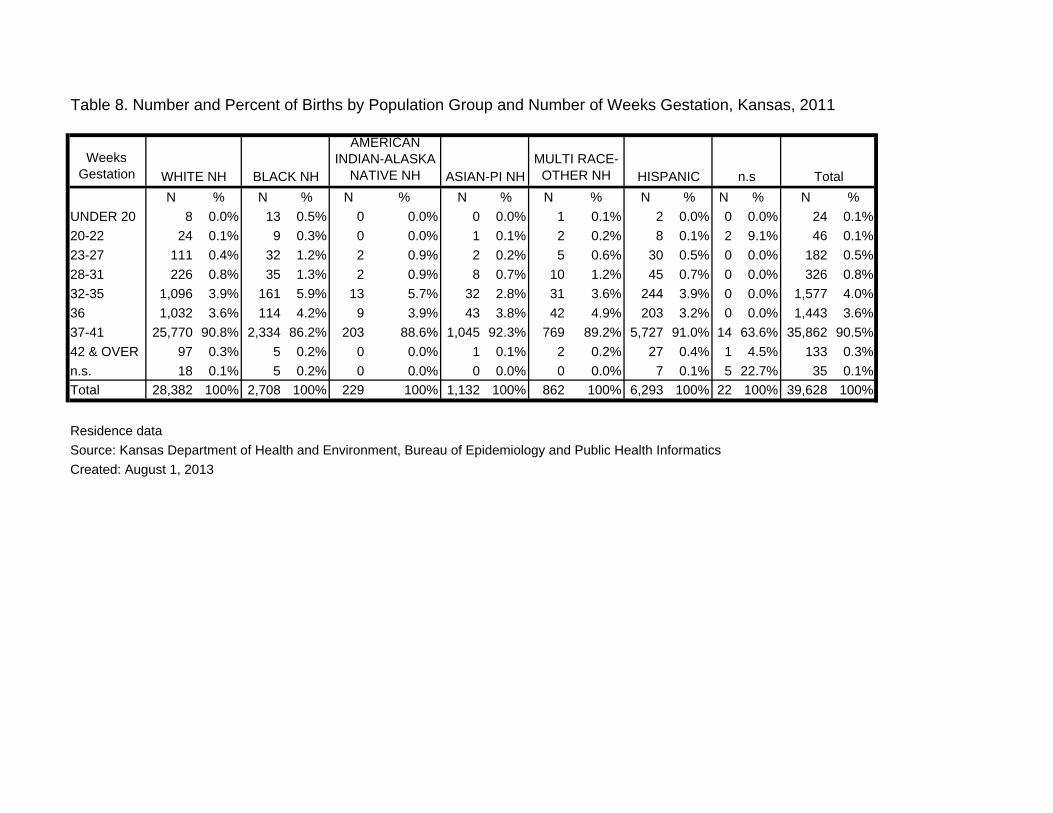
Table 8. Number and percent of births by population group and number of weeks gestation, Kansas, 2011

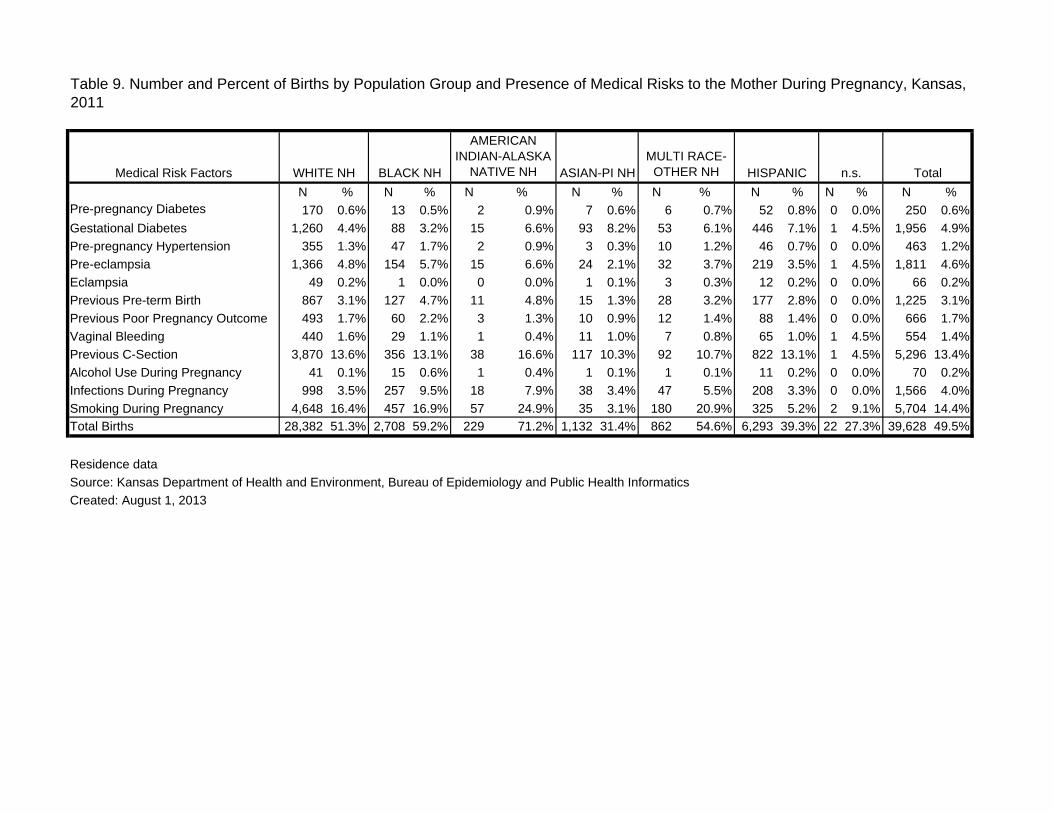
Table 9. Number and percent of births by population group and presence of medical risks to the mother during pregnancy, Kansas, 2011

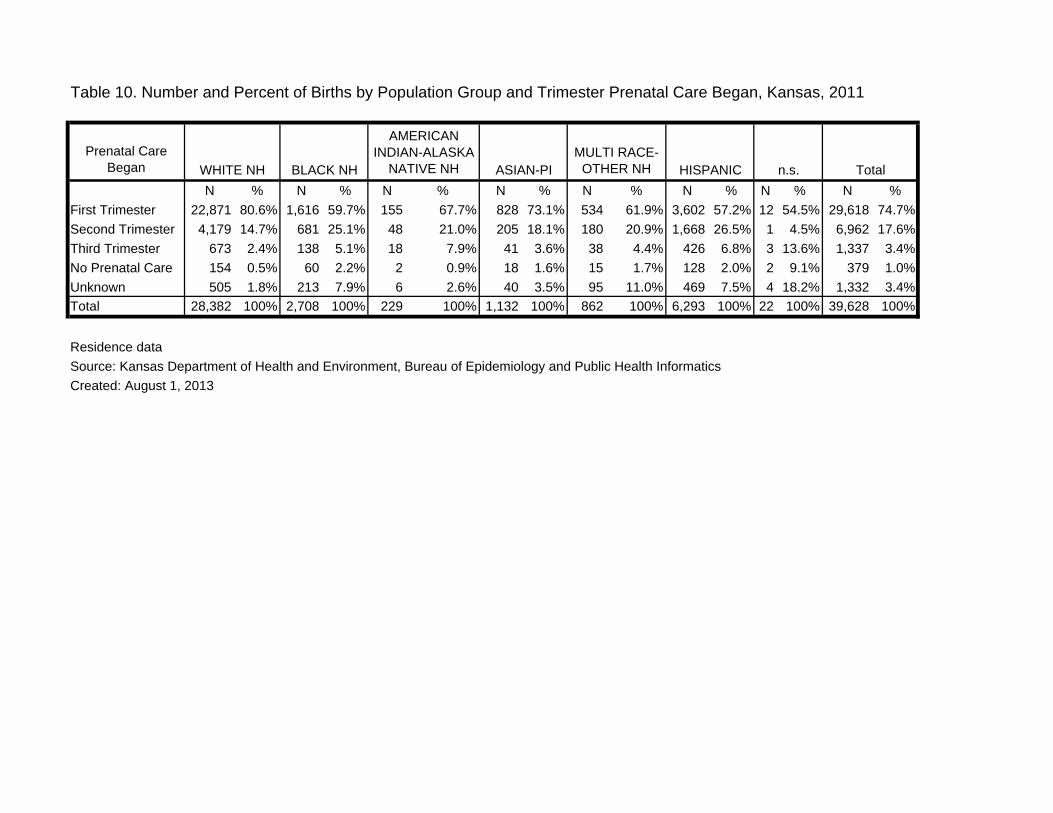
Table 10. Number and percent of births by population group and trimester prenatal care began, Kansas, 2011

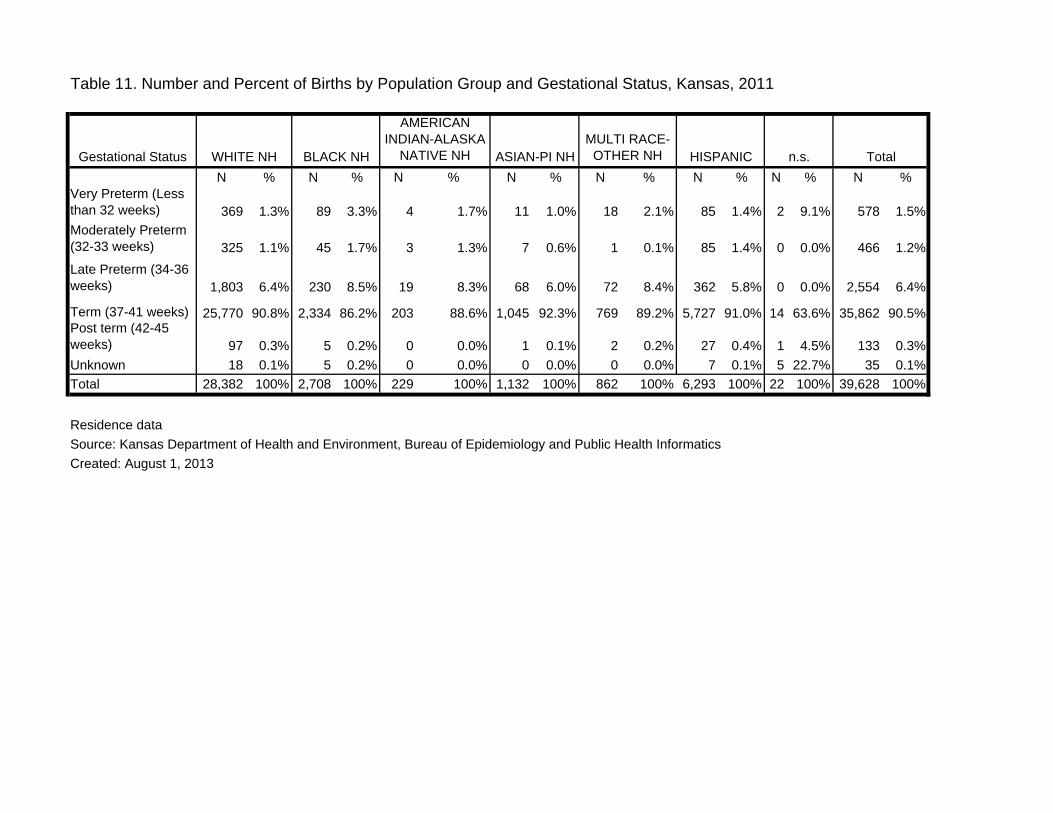
Table 11. Number and percent of births by population group and gestational status, Kansas, 2011

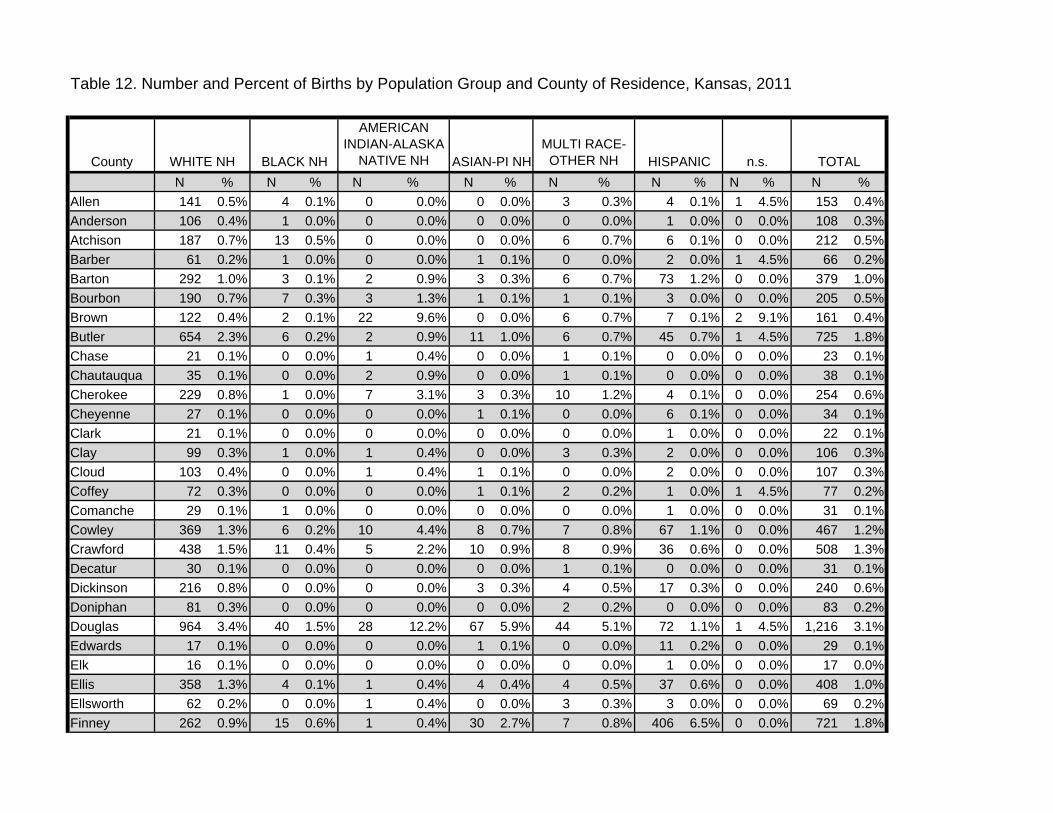
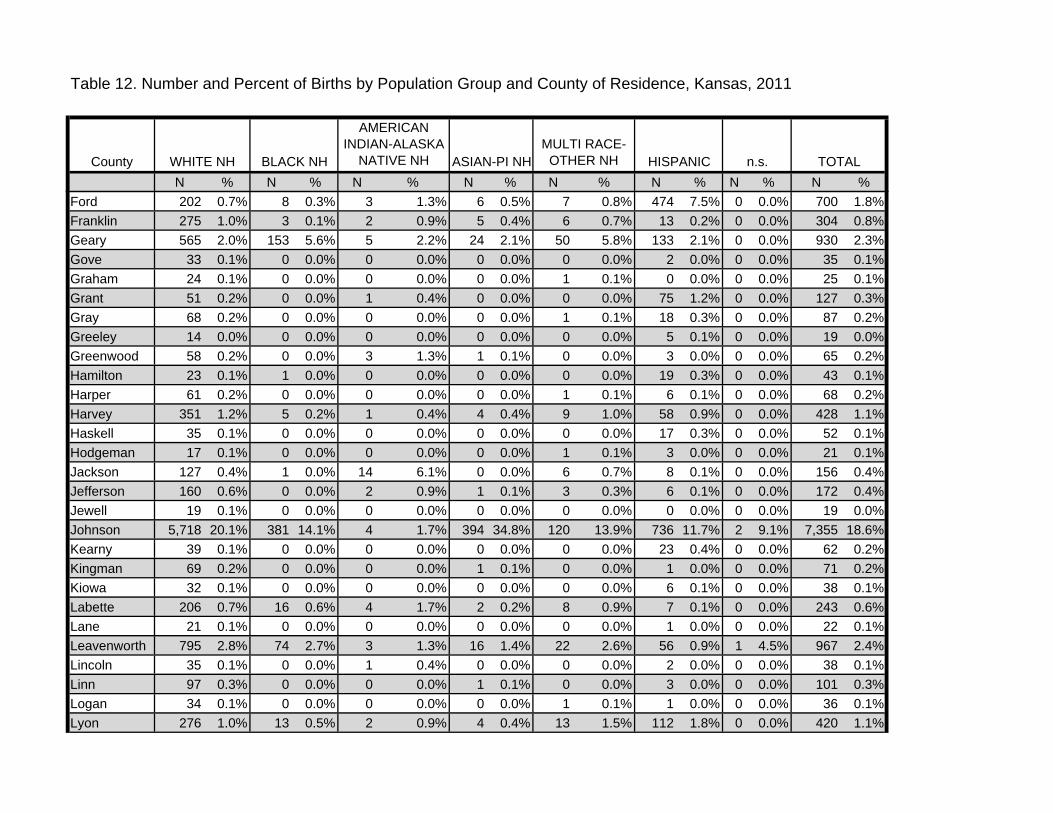
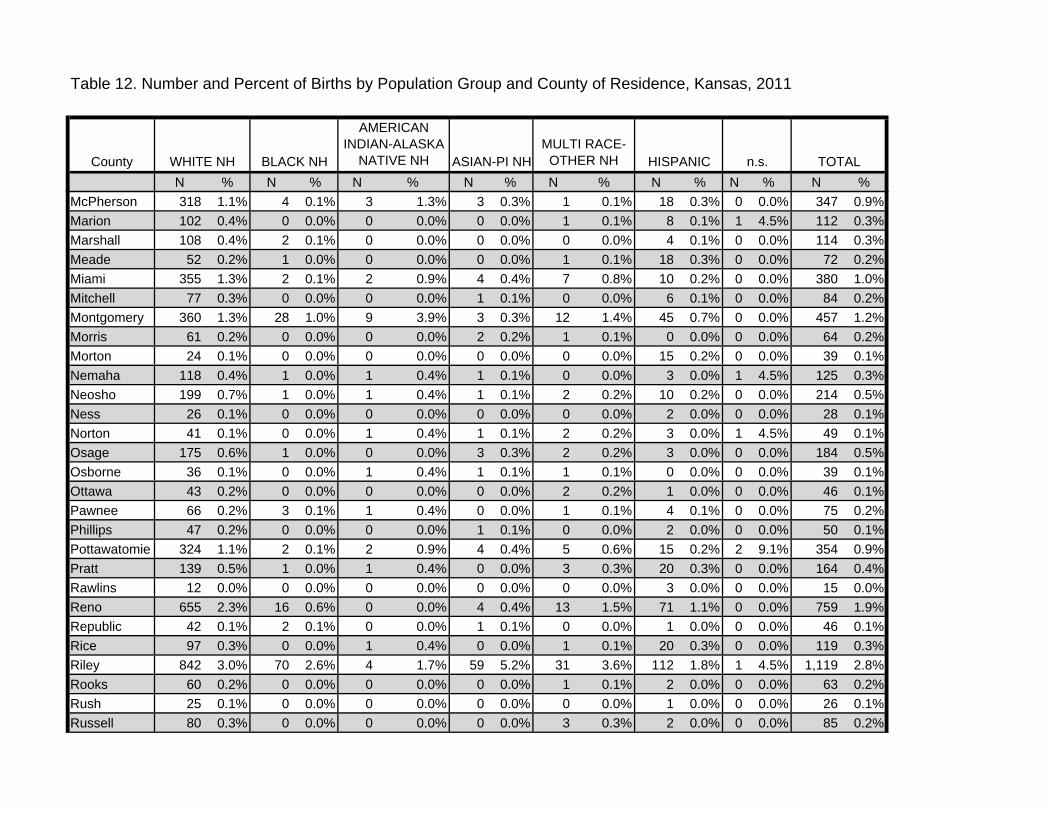
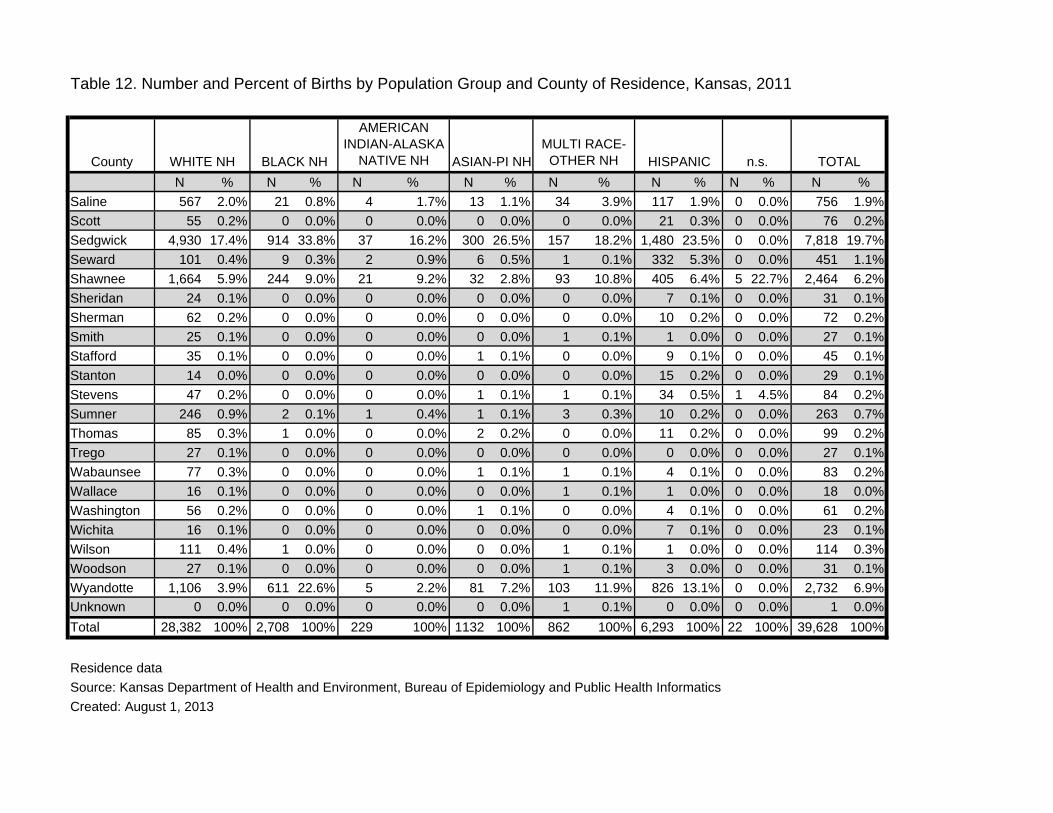
Table 12. Number and percent of births by population group and county of residence, Kansas, 2011

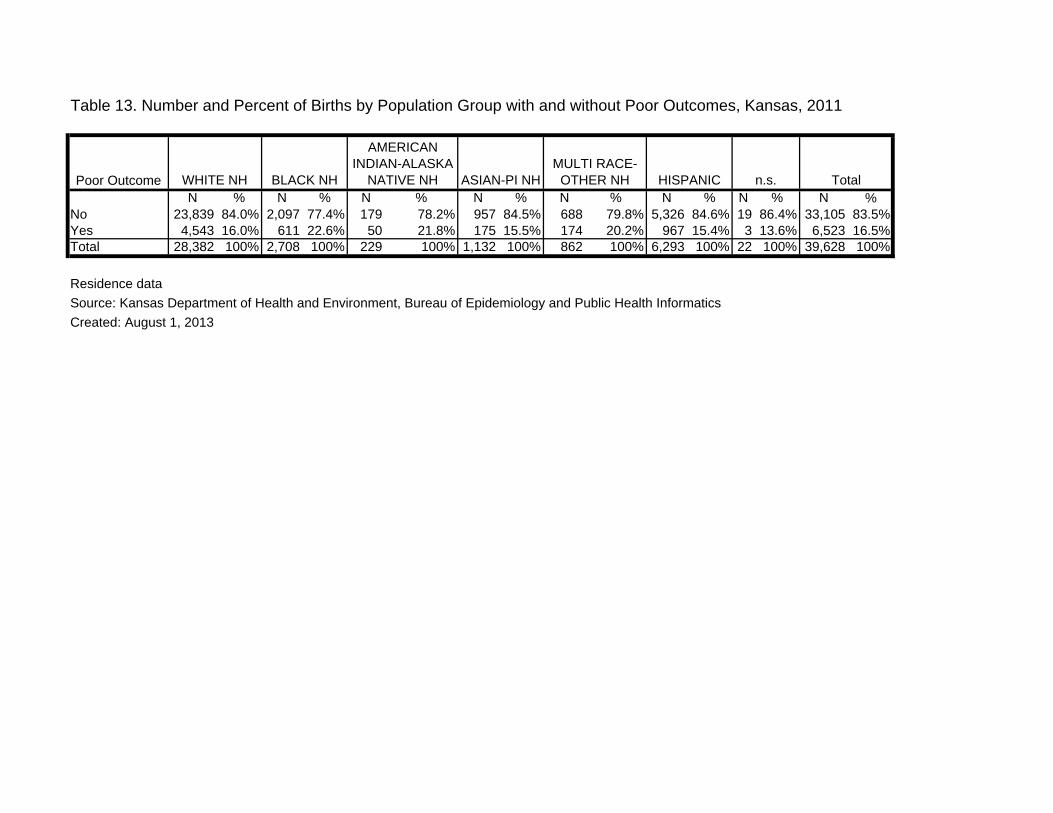
Table 13. Number and percent of births by population group with and without poor outcomes, Kansas, 2011

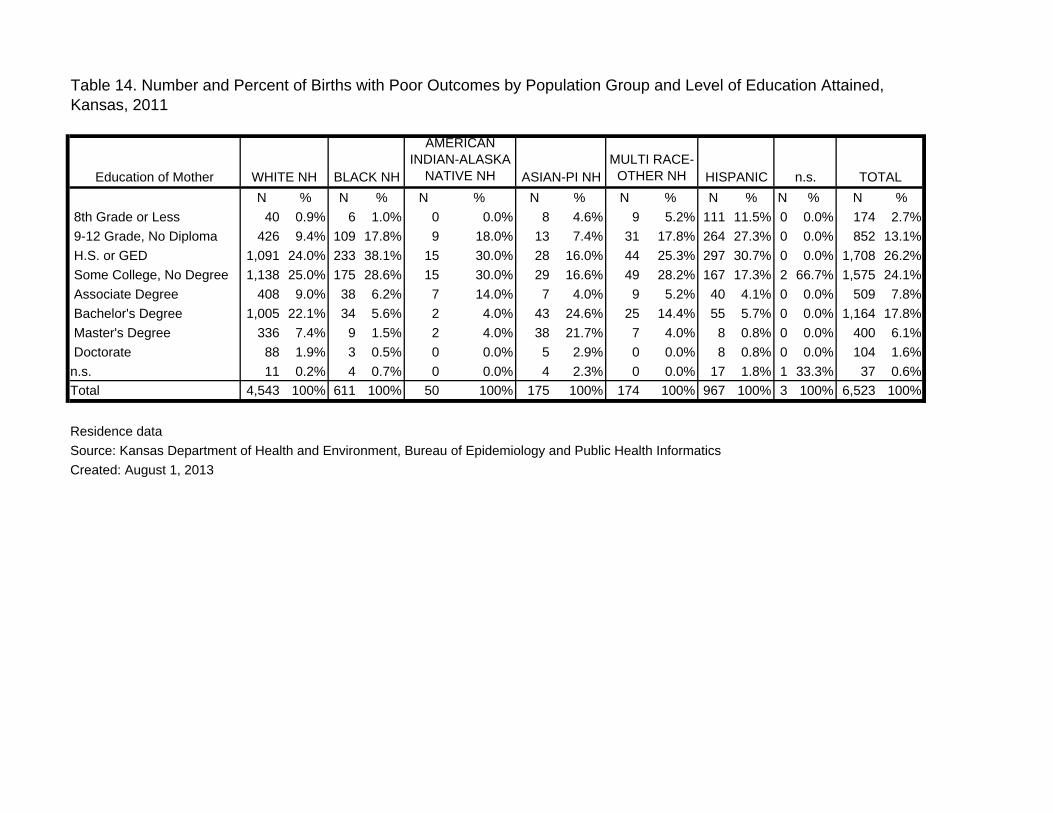
Table 14. Number and percent of births with poor outcomes by population group and level of education attained, Kansas, 2011

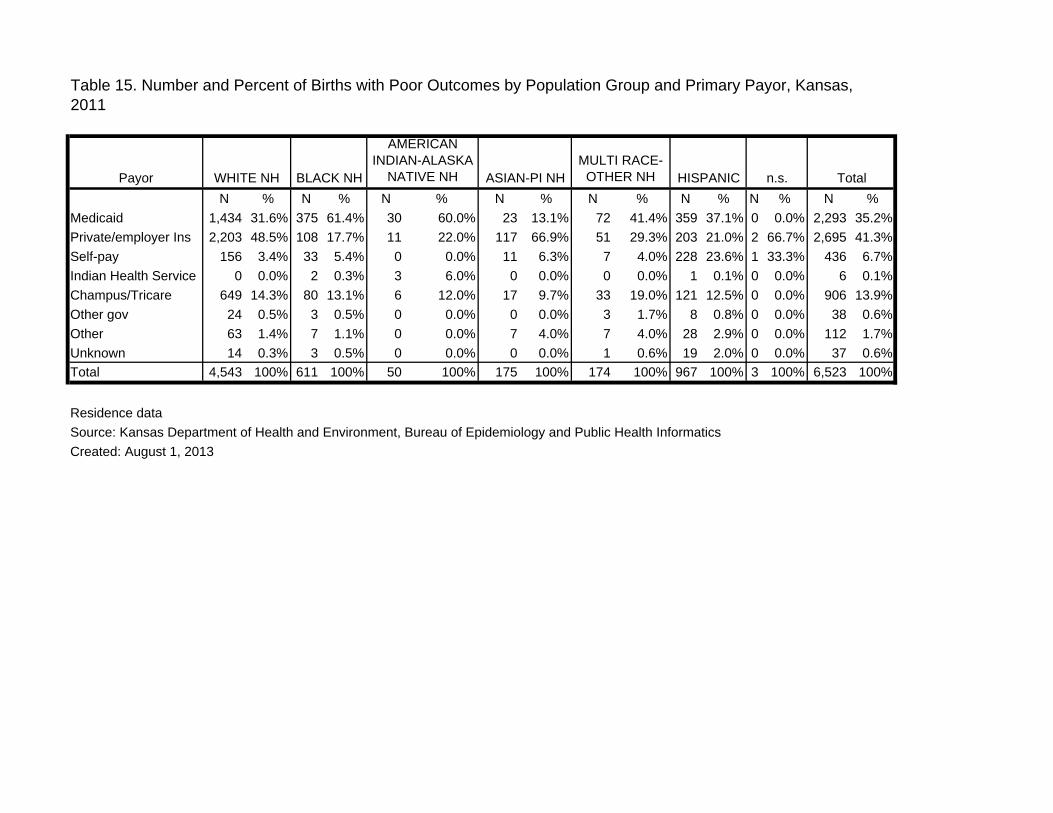
Table 15. Number and percent of births with poor outcomes by population group and primary payor, Kansas, 2011

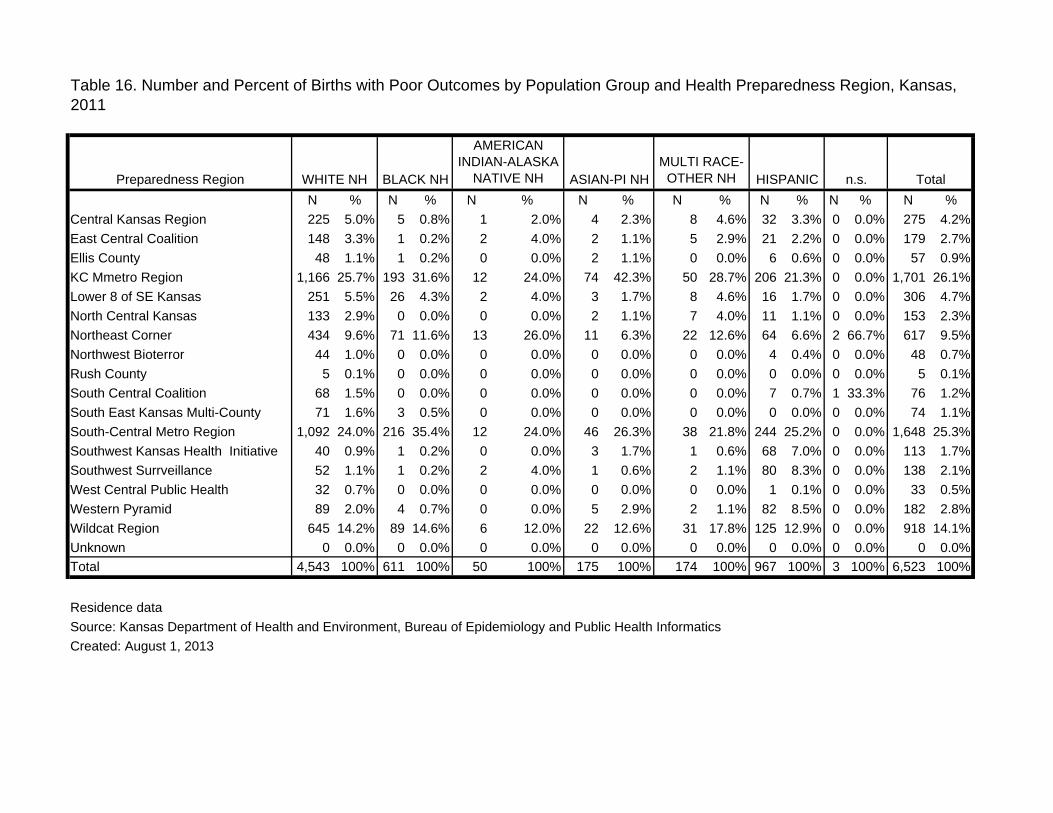
Table 16. Number and percent of births with poor outcomes by population group and health preparedness region, Kansas, 2011

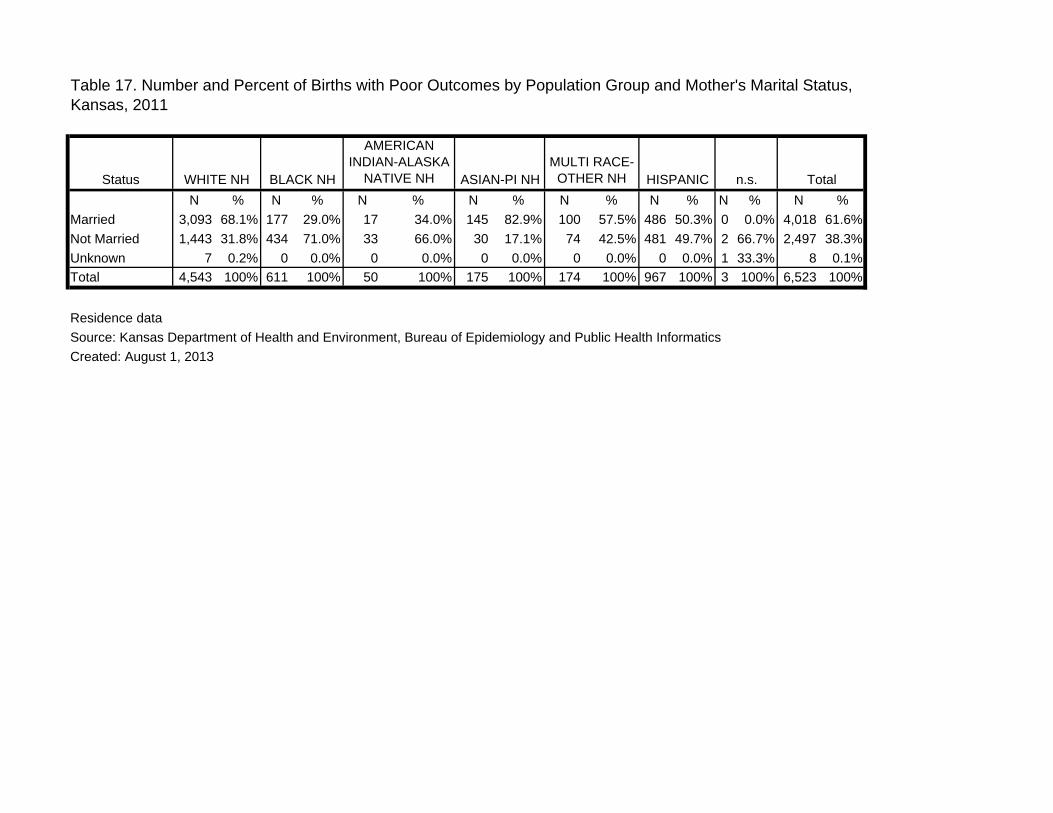
Table 17. Number and percent of births with poor outcomes by population group and mother's marital status, Kansas, 2011

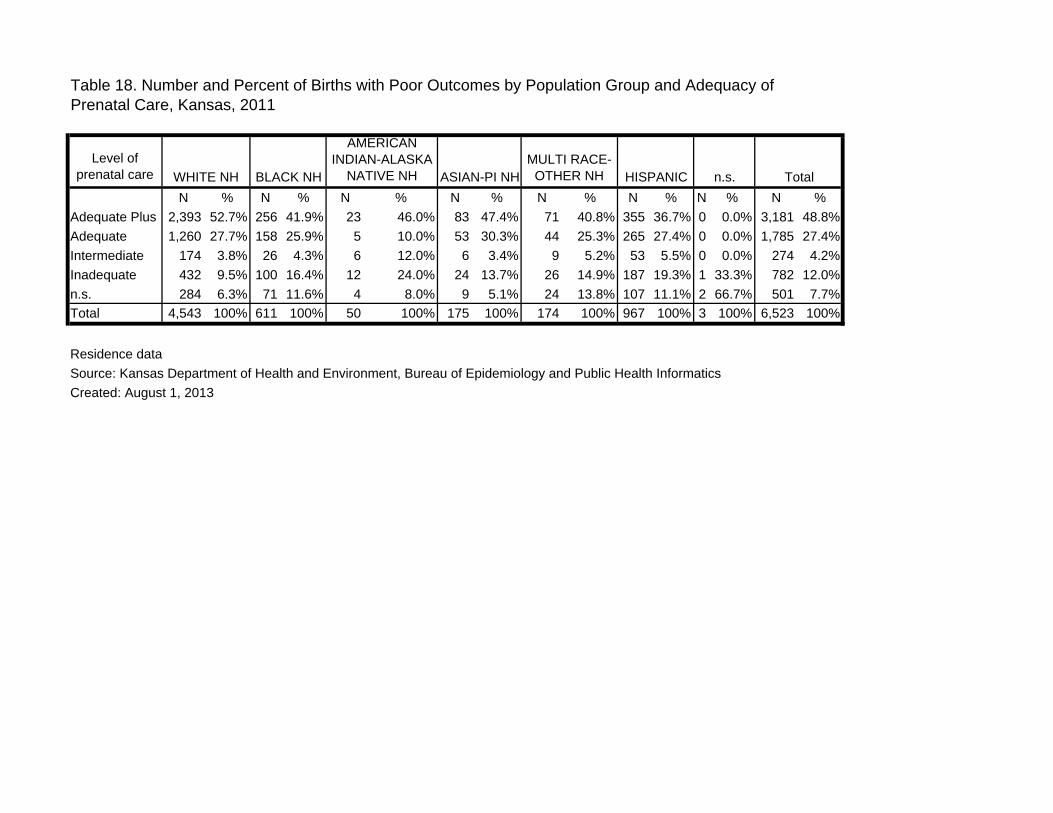
Table 18. Number and percent of births with poor outcomes by population group and adequacy of prenatal care, Kansas, 2011

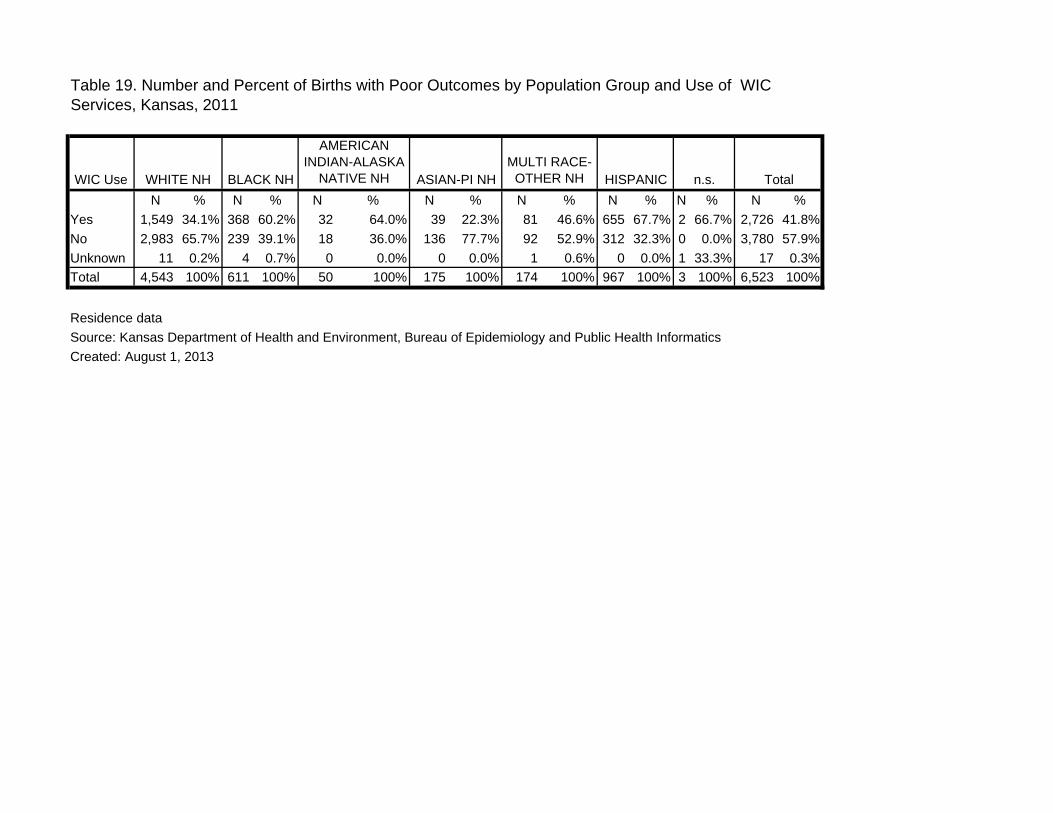
Table 19. Number and percent of births with poor outcomes by population group and use of WIC services, Kansas, 2011

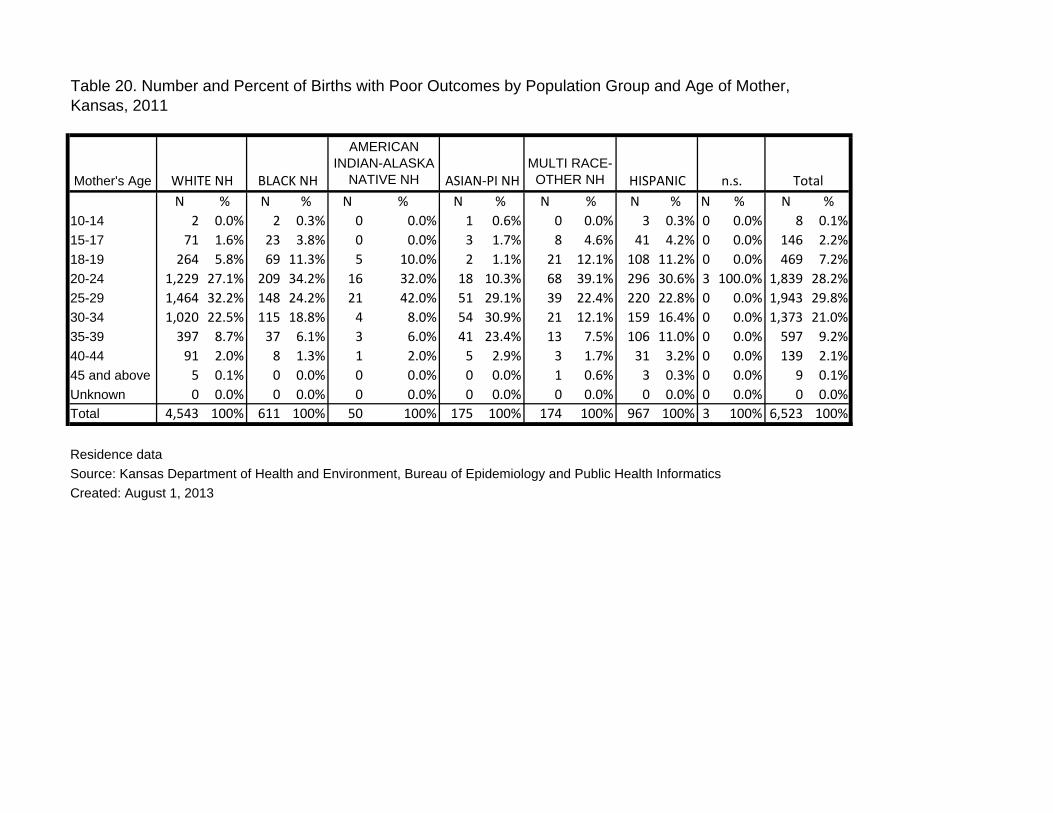
Table 20. Number and percent of births with poor outcomes by population group and age of mother, Kansas, 2011

Limitations In instances where the Hispanic origin of an individual was unknown, the person was assigned to a population group solely on the basis of race and was considered non-Hispanic. For Non-Hispanic individuals when more than one race was selected, i.e., Black and White, the event was reported in the Multi Race Non-Hispanic population group. Persons reported as Multi Race Non-Hispanic are not reported as part of the other single race population groups.

KDHE publishes on Kansas resident births and deaths. In the event that a Kansas resident birth occurs out of state and the birth state is not using the latest revision of the birth certificate, missing data may result. This may be more common in births to residents of Kansas border counties.

Education of MotherN % N % N % N % N % N % N % N %

8th Grade or Less 284 1.0% 49 1.8% 2 0.9% 45 4.0% 46 5.3% 880 14.0% 1 4.5% 1,307 3.3% 9-12 Grade, No Diploma 2,332 8.2% 453 16.7% 37 16.2% 69 6.1% 139 16.1% 1,856 29.5% 2 9.1% 4,888 12.3% H.S. or GED 6,042 21.3% 995 36.7% 76 33.2% 207 18.3% 234 27.1% 1,790 28.4% 0 0.0% 9,344 23.6% Some College, No Degree 6,573 23.2% 763 28.2% 71 31.0% 181 16.0% 223 25.9% 969 15.4% 5 22.7% 8,785 22.2% Associate Degree 2,672 9.4% 177 6.5% 20 8.7% 51 4.5% 48 5.6% 261 4.1% 1 4.5% 3,230 8.2% Bachelor's Degree 7,400 26.1% 173 6.4% 17 7.4% 294 26.0% 112 13.0% 353 5.6% 5 22.7% 8,354 21.1% Master's Degree 2,398 8.4% 67 2.5% 5 2.2% 210 18.6% 42 4.9% 85 1.4% 0 0.0% 2,807 7.1% Doctorate 610 2.1% 15 0.6% 1 0.4% 65 5.7% 13 1.5% 28 0.4% 0 0.0% 732 1.8%n.s. 71 0.3% 16 0.6% 0 0.0% 10 0.9% 5 0.6% 71 1.1% 8 36.4% 181 0.5%Total 28,382 100% 2,708 100% 229 100% 1,132 100% 862 100% 6,293 100% 22 100% 39,628 100%

Residence dataSource: Kansas Department of Health and Environment, Bureau of Epidemiology and Public Health InformaticsCreated: August 1, 2013

Table 1. Number and Percent of Births by Population Group and Education Level of Mother, Kansas, 2011

n.s. TotalWHITE NH BLACK NH

AMERICAN INDIAN-ALASKA

NATIVE NH ASIAN-PI NHMULTI RACE-

OTHER NH HISPANIC

PayorN % N % N % N % N % N % N % N %

Medicaid 8,370 29.5% 1,833 67.7% 123 53.7% 192 17.0% 393 45.6% 2,423 38.5% 5 22.7% 13,339 33.7%Private/employer Ins 16,815 59.2% 530 19.6% 65 28.4% 767 67.8% 290 33.6% 1,535 24.4% 3 13.6% 20,005 50.5%Self‐pay 952 3.4% 104 3.8% 5 2.2% 79 7.0% 46 5.3% 1,637 26.0% 7 31.8% 2,830 7.1%Indian Health Service 3 0.0% 2 0.1% 16 7.0% 0 0.0% 4 0.5% 3 0.0% 0 0.0% 28 0.1%Champus/Tricare 1,592 5.6% 161 5.9% 11 4.8% 47 4.2% 68 7.9% 220 3.5% 1 4.5% 2,100 5.3%Other gov 127 0.4% 10 0.4% 1 0.4% 8 0.7% 7 0.8% 79 1.3% 0 0.0% 232 0.6%Other 439 1.5% 60 2.2% 6 2.6% 34 3.0% 48 5.6% 294 4.7% 1 4.5% 882 2.2%Unknown 84 0.3% 8 0.3% 2 0.9% 5 0.4% 6 0.7% 102 1.6% 5 22.7% 212 0.5%Total 28,382 100% 2,708 100% 229 100% 1,132 100% 862 100% 6,293 100% 22 100% 39,628 100%

Residence dataSource: Kansas Department of Health and Environment, Bureau of Epidemiology and Public Health InformaticsCreated: August 1, 2013

Table 2. Number and Percent of Births by Population Group and Primary Payor, Kansas, 2011

n.s. TotalWHITE NH BLACK NH

AMERICAN INDIAN-ALASKA

NATIVE NH ASIAN‐PI NHMULTI RACE-

OTHER NH HISPANIC

Preparedness RegionN % N % N % N % N % N % N % N %

Central Kansas Region 1,375 4.8% 31 1.1% 11 4.8% 20 1.8% 43 5.0% 241 3.8% 0 0.0% 1,721 4.3%East Central Coalition 1,015 3.6% 17 0.6% 8 3.5% 17 1.5% 26 3.0% 136 2.2% 1 4.5% 1,220 3.1%Ellis County 358 1.3% 4 0.1% 1 0.4% 4 0.4% 4 0.5% 37 0.6% 0 0.0% 408 1.0%KC Mmetro Region 9,035 31.8% 1,108 40.9% 42 18.3% 563 49.7% 296 34.3% 1,703 27.1% 4 18.2% 12,751 32.2%Lower 8 of SE Kansas 1,594 5.6% 58 2.1% 28 12.2% 19 1.7% 42 4.9% 104 1.7% 0 0.0% 1,845 4.7%North Central Kansas 893 3.1% 3 0.1% 5 2.2% 8 0.7% 17 2.0% 41 0.7% 0 0.0% 967 2.4%Northeast Corner 2,567 9.0% 263 9.7% 60 26.2% 34 3.0% 116 13.5% 439 7.0% 8 36.4% 3,487 8.8%Northwest Bioterror 326 1.1% 1 0.0% 1 0.4% 5 0.4% 5 0.6% 27 0.4% 1 4.5% 366 0.9%Rush County 25 0.1% 0 0.0% 0 0.0% 0 0.0% 0 0.0% 1 0.0% 0 0.0% 26 0.1%South Central Coalition 408 1.4% 3 0.1% 1 0.4% 3 0.3% 4 0.5% 47 0.7% 1 4.5% 467 1.2%South East Kansas Multi-County 464 1.6% 12 0.4% 3 1.3% 1 0.1% 5 0.6% 11 0.2% 1 4.5% 497 1.3%South-Central Metro Region 7,307 25.7% 949 35.0% 51 22.3% 328 29.0% 196 22.7% 1,739 27.6% 2 9.1% 10,572 26.7%Southwest Kansas Health Initiative 237 0.8% 9 0.3% 3 1.3% 7 0.6% 2 0.2% 471 7.5% 1 4.5% 730 1.8%Southwest Surrveillance 395 1.4% 9 0.3% 3 1.3% 6 0.5% 10 1.2% 531 8.4% 0 0.0% 954 2.4%West Central Public Health 206 0.7% 0 0.0% 0 0.0% 0 0.0% 1 0.1% 22 0.3% 0 0.0% 229 0.6%Western Pyramid 446 1.6% 16 0.6% 1 0.4% 30 2.7% 8 0.9% 483 7.7% 0 0.0% 984 2.5%Wildcat Region 1,731 6.1% 225 8.3% 11 4.8% 87 7.7% 86 10.0% 260 4.1% 3 13.6% 2,403 6.1%Unknown 0 0.0% 0 0.0% 0 0.0% 0 0.0% 1 0.1% 0 0.0% 0 0.0% 1 0.0%Total 28,382 100% 2,708 100% 229 100% 1,132 100% 862 100% 6,293 100% 22 100% 39,628 100%

Residence dataSource: Kansas Department of Health and Environment, Bureau of Epidemiology and Public Health InformaticsCreated: August 1, 2013

Table 3. Number and Percent of Births by Population Group and Health Preparedness Region, Kansas, 2011

n.s. TotalWHITE NH BLACK NH

AMERICAN INDIAN-ALASKA

NATIVE NH ASIAN-PI NHMULTI RACE-

OTHER NH HISPANIC

StatusN % N % N % N % N % N % N % N %

Married 19,676 69.3% 705 26.0% 90 39.3% 978 86.4% 451 52.3% 2,931 46.6% 11 50.0% 24,842 62.7%Not Married 8,676 30.6% 2,003 74.0% 139 60.7% 152 13.4% 411 47.7% 3,360 53.4% 8 36.4% 14,749 37.2%Unknown 30 0.1% 0 0.0% 0 0.0% 2 0.2% 0 0.0% 2 0.0% 3 13.6% 37 0.1%Total 28,382 100% 2,708 100% 229 100% 1,132 100% 862 100% 6,293 100% 22 100% 39,628 100%

Residence dataSource: Kansas Department of Health and Environment, Bureau of Epidemiology and Public Health InformaticsCreated: August 1, 2013

Table 4. Number and Percent of Births by Population Group and Mother's Marital Status, Kansas, 2011

n.s. TotalWHITE NH BLACK NH

AMERICAN INDIAN-ALASKA

NATIVE NH ASIAN-PI NHMULTI RACE-

OTHER NH HISPANIC

Level of Prenatal Care

N % N % N % N % N % N % N % N %Adequate Plus 9,548 33.6% 713 26.3% 65 28.4% 325 28.7% 245 28.4% 1,313 20.9% 1 4.5% 12,210 30.8%Adequate 14,163 49.9% 1,053 38.9% 91 39.7% 549 48.5% 333 38.6% 2,490 39.6% 7 31.8% 18,686 47.2%Intermediate 1,252 4.4% 141 5.2% 18 7.9% 64 5.7% 39 4.5% 502 8.0% 2 9.1% 2,018 5.1%Inadequate 2,555 9.0% 547 20.2% 45 19.7% 149 13.2% 140 16.2% 1,418 22.5% 5 22.7% 4,859 12.3%n.s. 864 3.0% 254 9.4% 10 4.4% 45 4.0% 105 12.2% 570 9.1% 7 31.8% 1,855 4.7%Total 28,382 100% 2,708 100% 229 100% 1,132 100% 862 100% 6,293 100% 22 100% 39,628 100%

Residence dataSource: Kansas Department of Health and Environment, Bureau of Epidemiology and Public Health InformaticsCreated: August 1, 2013

Table 5. Number and Percent of Births by Population Group and Adequacy of Prenatal Care, Kansas, 2011

n.s. TotalWHITE NH BLACK NH

AMERICAN INDIAN-ALASKA

NATIVE NH ASIAN-PI NHMULTI RACE-

OTHER NH HISPANIC

WIC UseN % N % N % N % N % N % N % N %

Yes 8,454 29.8% 1,714 63.3% 129 56.3% 292 25.8% 431 50.0% 4,401 69.9% 8 36.4% 15,429 38.9%No 19,886 70.1% 985 36.4% 100 43.7% 835 73.8% 430 49.9% 1,887 30.0% 9 40.9% 24,132 60.9%Unknown 42 0.1% 9 0.3% 0 0.0% 5 0.4% 1 0.1% 5 0.1% 5 22.7% 65 0.2%Total 28,382 100% 2,708 100% 229 100% 1,132 100% 862 100% 6,293 100% 22 100% 39,628 100%

Residence dataSource: Kansas Department of Health and Environment, Bureau of Epidemiology and Public Health InformaticsCreated: August 1, 2013

Table 6. Number and Percent of Births by Population Group and Use of WIC Services, Kansas, 2011

n.s. TotalWHITE NH BLACK NH

AMERICAN INDIAN-ALASKA

NATIVE NH ASIAN-PI NHMULTI RACE-

OTHER NH HISPANIC

Weight Gain*

N % N % N % N % N % N % N % N %Less than recommended 5,053 17.8% 589 21.8% 41 17.9% 303 26.8% 202 23.4% 1,482 23.5% 4 18.2% 7,674 19.4%Recommended 8,474 29.9% 704 26.0% 65 28.4% 447 39.5% 255 29.6% 1,905 30.3% 4 18.2% 11,854 29.9%More than recommended 13,592 47.9% 1,265 46.7% 102 44.5% 344 30.4% 370 42.9% 2,626 41.7% 5 22.7% 18,304 46.2%Unknown 1,263 4.5% 150 5.5% 21 9.2% 38 3.4% 35 4.1% 280 4.4% 9 40.9% 1,796 4.5%Total 28,382 100% 2,708 100% 229 100% 1,132 100% 862 100% 6,293 100% 22 100% 39,628 100%

Residence dataSource: Kansas Department of Health and Environment, Bureau of Epidemiology and Public Health InformaticsCreated: August 1, 2013*See Technical Notes and Definitions

Table 7. Mother's Weight Gain in Pregnancy by Prepregnancy BMI Category* by Population Group, Kansas, 2011

n.s. TotalWHITE NH BLACK NH

AMERICAN INDIAN-ALASKA

NATIVE NH ASIAN-PI NHMULTI RACE-

OTHER NH HISPANIC

Weeks Gestation

N % N % N % N % N % N % N % N %UNDER 20 8 0.0% 13 0.5% 0 0.0% 0 0.0% 1 0.1% 2 0.0% 0 0.0% 24 0.1%20-22 24 0.1% 9 0.3% 0 0.0% 1 0.1% 2 0.2% 8 0.1% 2 9.1% 46 0.1%23-27 111 0.4% 32 1.2% 2 0.9% 2 0.2% 5 0.6% 30 0.5% 0 0.0% 182 0.5%28-31 226 0.8% 35 1.3% 2 0.9% 8 0.7% 10 1.2% 45 0.7% 0 0.0% 326 0.8%32-35 1,096 3.9% 161 5.9% 13 5.7% 32 2.8% 31 3.6% 244 3.9% 0 0.0% 1,577 4.0%36 1,032 3.6% 114 4.2% 9 3.9% 43 3.8% 42 4.9% 203 3.2% 0 0.0% 1,443 3.6%37-41 25,770 90.8% 2,334 86.2% 203 88.6% 1,045 92.3% 769 89.2% 5,727 91.0% 14 63.6% 35,862 90.5%42 & OVER 97 0.3% 5 0.2% 0 0.0% 1 0.1% 2 0.2% 27 0.4% 1 4.5% 133 0.3%n.s. 18 0.1% 5 0.2% 0 0.0% 0 0.0% 0 0.0% 7 0.1% 5 22.7% 35 0.1%Total 28,382 100% 2,708 100% 229 100% 1,132 100% 862 100% 6,293 100% 22 100% 39,628 100%

Residence dataSource: Kansas Department of Health and Environment, Bureau of Epidemiology and Public Health InformaticsCreated: August 1, 2013

Table 8. Number and Percent of Births by Population Group and Number of Weeks Gestation, Kansas, 2011

n.s TotalWHITE NH BLACK NH

AMERICAN INDIAN-ALASKA

NATIVE NH ASIAN-PI NHMULTI RACE-

OTHER NH HISPANIC

Medical Risk FactorsN % N % N % N % N % N % N % N %

Pre-pregnancy Diabetes 170 0.6% 13 0.5% 2 0.9% 7 0.6% 6 0.7% 52 0.8% 0 0.0% 250 0.6%Gestational Diabetes 1,260 4.4% 88 3.2% 15 6.6% 93 8.2% 53 6.1% 446 7.1% 1 4.5% 1,956 4.9%Pre-pregnancy Hypertension 355 1.3% 47 1.7% 2 0.9% 3 0.3% 10 1.2% 46 0.7% 0 0.0% 463 1.2%Pre-eclampsia 1,366 4.8% 154 5.7% 15 6.6% 24 2.1% 32 3.7% 219 3.5% 1 4.5% 1,811 4.6%Eclampsia 49 0.2% 1 0.0% 0 0.0% 1 0.1% 3 0.3% 12 0.2% 0 0.0% 66 0.2%Previous Pre-term Birth 867 3.1% 127 4.7% 11 4.8% 15 1.3% 28 3.2% 177 2.8% 0 0.0% 1,225 3.1%Previous Poor Pregnancy Outcome 493 1.7% 60 2.2% 3 1.3% 10 0.9% 12 1.4% 88 1.4% 0 0.0% 666 1.7%Vaginal Bleeding 440 1.6% 29 1.1% 1 0.4% 11 1.0% 7 0.8% 65 1.0% 1 4.5% 554 1.4%Previous C-Section 3,870 13.6% 356 13.1% 38 16.6% 117 10.3% 92 10.7% 822 13.1% 1 4.5% 5,296 13.4%Alcohol Use During Pregnancy 41 0.1% 15 0.6% 1 0.4% 1 0.1% 1 0.1% 11 0.2% 0 0.0% 70 0.2%Infections During Pregnancy 998 3.5% 257 9.5% 18 7.9% 38 3.4% 47 5.5% 208 3.3% 0 0.0% 1,566 4.0%Smoking During Pregnancy 4,648 16.4% 457 16.9% 57 24.9% 35 3.1% 180 20.9% 325 5.2% 2 9.1% 5,704 14.4%Total Births 28,382 51.3% 2,708 59.2% 229 71.2% 1,132 31.4% 862 54.6% 6,293 39.3% 22 27.3% 39,628 49.5%

Residence dataSource: Kansas Department of Health and Environment, Bureau of Epidemiology and Public Health InformaticsCreated: August 1, 2013

Table 9. Number and Percent of Births by Population Group and Presence of Medical Risks to the Mother During Pregnancy, Kansas, 2011

n.s. TotalWHITE NH BLACK NH

AMERICAN INDIAN-ALASKA

NATIVE NH ASIAN-PI NHMULTI RACE-

OTHER NH HISPANIC

Prenatal Care Began

N % N % N % N % N % N % N % N %First Trimester 22,871 80.6% 1,616 59.7% 155 67.7% 828 73.1% 534 61.9% 3,602 57.2% 12 54.5% 29,618 74.7%Second Trimester 4,179 14.7% 681 25.1% 48 21.0% 205 18.1% 180 20.9% 1,668 26.5% 1 4.5% 6,962 17.6%Third Trimester 673 2.4% 138 5.1% 18 7.9% 41 3.6% 38 4.4% 426 6.8% 3 13.6% 1,337 3.4%No Prenatal Care 154 0.5% 60 2.2% 2 0.9% 18 1.6% 15 1.7% 128 2.0% 2 9.1% 379 1.0%Unknown 505 1.8% 213 7.9% 6 2.6% 40 3.5% 95 11.0% 469 7.5% 4 18.2% 1,332 3.4%Total 28,382 100% 2,708 100% 229 100% 1,132 100% 862 100% 6,293 100% 22 100% 39,628 100%

Residence dataSource: Kansas Department of Health and Environment, Bureau of Epidemiology and Public Health InformaticsCreated: August 1, 2013

Table 10. Number and Percent of Births by Population Group and Trimester Prenatal Care Began, Kansas, 2011

n.s. TotalWHITE NH BLACK NH

AMERICAN INDIAN-ALASKA

NATIVE NH ASIAN-PIMULTI RACE-

OTHER NH HISPANIC

Gestational StatusN % N % N % N % N % N % N % N %

Very Preterm (Less than 32 weeks) 369 1.3% 89 3.3% 4 1.7% 11 1.0% 18 2.1% 85 1.4% 2 9.1% 578 1.5%Moderately Preterm (32-33 weeks) 325 1.1% 45 1.7% 3 1.3% 7 0.6% 1 0.1% 85 1.4% 0 0.0% 466 1.2%Late Preterm (34-36 weeks) 1,803 6.4% 230 8.5% 19 8.3% 68 6.0% 72 8.4% 362 5.8% 0 0.0% 2,554 6.4%

Term (37-41 weeks) 25,770 90.8% 2,334 86.2% 203 88.6% 1,045 92.3% 769 89.2% 5,727 91.0% 14 63.6% 35,862 90.5%Post term (42-45 weeks) 97 0.3% 5 0.2% 0 0.0% 1 0.1% 2 0.2% 27 0.4% 1 4.5% 133 0.3%Unknown 18 0.1% 5 0.2% 0 0.0% 0 0.0% 0 0.0% 7 0.1% 5 22.7% 35 0.1%Total 28,382 100% 2,708 100% 229 100% 1,132 100% 862 100% 6,293 100% 22 100% 39,628 100%

Residence dataSource: Kansas Department of Health and Environment, Bureau of Epidemiology and Public Health InformaticsCreated: August 1, 2013

Table 11. Number and Percent of Births by Population Group and Gestational Status, Kansas, 2011

n.s. TotalWHITE NH BLACK NH

AMERICAN INDIAN-ALASKA

NATIVE NH ASIAN-PI NHMULTI RACE-

OTHER NH HISPANIC

CountyN % N % N % N % N % N % N % N %

Allen 141 0.5% 4 0.1% 0 0.0% 0 0.0% 3 0.3% 4 0.1% 1 4.5% 153 0.4%Anderson 106 0.4% 1 0.0% 0 0.0% 0 0.0% 0 0.0% 1 0.0% 0 0.0% 108 0.3%Atchison 187 0.7% 13 0.5% 0 0.0% 0 0.0% 6 0.7% 6 0.1% 0 0.0% 212 0.5%Barber 61 0.2% 1 0.0% 0 0.0% 1 0.1% 0 0.0% 2 0.0% 1 4.5% 66 0.2%Barton 292 1.0% 3 0.1% 2 0.9% 3 0.3% 6 0.7% 73 1.2% 0 0.0% 379 1.0%Bourbon 190 0.7% 7 0.3% 3 1.3% 1 0.1% 1 0.1% 3 0.0% 0 0.0% 205 0.5%Brown 122 0.4% 2 0.1% 22 9.6% 0 0.0% 6 0.7% 7 0.1% 2 9.1% 161 0.4%Butler 654 2.3% 6 0.2% 2 0.9% 11 1.0% 6 0.7% 45 0.7% 1 4.5% 725 1.8%Chase 21 0.1% 0 0.0% 1 0.4% 0 0.0% 1 0.1% 0 0.0% 0 0.0% 23 0.1%Chautauqua 35 0.1% 0 0.0% 2 0.9% 0 0.0% 1 0.1% 0 0.0% 0 0.0% 38 0.1%Cherokee 229 0.8% 1 0.0% 7 3.1% 3 0.3% 10 1.2% 4 0.1% 0 0.0% 254 0.6%Cheyenne 27 0.1% 0 0.0% 0 0.0% 1 0.1% 0 0.0% 6 0.1% 0 0.0% 34 0.1%Clark 21 0.1% 0 0.0% 0 0.0% 0 0.0% 0 0.0% 1 0.0% 0 0.0% 22 0.1%Clay 99 0.3% 1 0.0% 1 0.4% 0 0.0% 3 0.3% 2 0.0% 0 0.0% 106 0.3%Cloud 103 0.4% 0 0.0% 1 0.4% 1 0.1% 0 0.0% 2 0.0% 0 0.0% 107 0.3%Coffey 72 0.3% 0 0.0% 0 0.0% 1 0.1% 2 0.2% 1 0.0% 1 4.5% 77 0.2%Comanche 29 0.1% 1 0.0% 0 0.0% 0 0.0% 0 0.0% 1 0.0% 0 0.0% 31 0.1%Cowley 369 1.3% 6 0.2% 10 4.4% 8 0.7% 7 0.8% 67 1.1% 0 0.0% 467 1.2%Crawford 438 1.5% 11 0.4% 5 2.2% 10 0.9% 8 0.9% 36 0.6% 0 0.0% 508 1.3%Decatur 30 0.1% 0 0.0% 0 0.0% 0 0.0% 1 0.1% 0 0.0% 0 0.0% 31 0.1%Dickinson 216 0.8% 0 0.0% 0 0.0% 3 0.3% 4 0.5% 17 0.3% 0 0.0% 240 0.6%Doniphan 81 0.3% 0 0.0% 0 0.0% 0 0.0% 2 0.2% 0 0.0% 0 0.0% 83 0.2%Douglas 964 3.4% 40 1.5% 28 12.2% 67 5.9% 44 5.1% 72 1.1% 1 4.5% 1,216 3.1%Edwards 17 0.1% 0 0.0% 0 0.0% 1 0.1% 0 0.0% 11 0.2% 0 0.0% 29 0.1%Elk 16 0.1% 0 0.0% 0 0.0% 0 0.0% 0 0.0% 1 0.0% 0 0.0% 17 0.0%Ellis 358 1.3% 4 0.1% 1 0.4% 4 0.4% 4 0.5% 37 0.6% 0 0.0% 408 1.0%Ellsworth 62 0.2% 0 0.0% 1 0.4% 0 0.0% 3 0.3% 3 0.0% 0 0.0% 69 0.2%Finney 262 0.9% 15 0.6% 1 0.4% 30 2.7% 7 0.8% 406 6.5% 0 0.0% 721 1.8%

Table 12. Number and Percent of Births by Population Group and County of Residence, Kansas, 2011

HISPANIC n.s. TOTALWHITE NH BLACK NH

AMERICAN INDIAN-ALASKA

NATIVE NH ASIAN-PI NHMULTI RACE-

OTHER NH

CountyN % N % N % N % N % N % N % N %

Table 12. Number and Percent of Births by Population Group and County of Residence, Kansas, 2011

HISPANIC n.s. TOTALWHITE NH BLACK NH

AMERICAN INDIAN-ALASKA

NATIVE NH ASIAN-PI NHMULTI RACE-

OTHER NH

Ford 202 0.7% 8 0.3% 3 1.3% 6 0.5% 7 0.8% 474 7.5% 0 0.0% 700 1.8%Franklin 275 1.0% 3 0.1% 2 0.9% 5 0.4% 6 0.7% 13 0.2% 0 0.0% 304 0.8%Geary 565 2.0% 153 5.6% 5 2.2% 24 2.1% 50 5.8% 133 2.1% 0 0.0% 930 2.3%Gove 33 0.1% 0 0.0% 0 0.0% 0 0.0% 0 0.0% 2 0.0% 0 0.0% 35 0.1%Graham 24 0.1% 0 0.0% 0 0.0% 0 0.0% 1 0.1% 0 0.0% 0 0.0% 25 0.1%Grant 51 0.2% 0 0.0% 1 0.4% 0 0.0% 0 0.0% 75 1.2% 0 0.0% 127 0.3%Gray 68 0.2% 0 0.0% 0 0.0% 0 0.0% 1 0.1% 18 0.3% 0 0.0% 87 0.2%Greeley 14 0.0% 0 0.0% 0 0.0% 0 0.0% 0 0.0% 5 0.1% 0 0.0% 19 0.0%Greenwood 58 0.2% 0 0.0% 3 1.3% 1 0.1% 0 0.0% 3 0.0% 0 0.0% 65 0.2%Hamilton 23 0.1% 1 0.0% 0 0.0% 0 0.0% 0 0.0% 19 0.3% 0 0.0% 43 0.1%Harper 61 0.2% 0 0.0% 0 0.0% 0 0.0% 1 0.1% 6 0.1% 0 0.0% 68 0.2%Harvey 351 1.2% 5 0.2% 1 0.4% 4 0.4% 9 1.0% 58 0.9% 0 0.0% 428 1.1%Haskell 35 0.1% 0 0.0% 0 0.0% 0 0.0% 0 0.0% 17 0.3% 0 0.0% 52 0.1%Hodgeman 17 0.1% 0 0.0% 0 0.0% 0 0.0% 1 0.1% 3 0.0% 0 0.0% 21 0.1%Jackson 127 0.4% 1 0.0% 14 6.1% 0 0.0% 6 0.7% 8 0.1% 0 0.0% 156 0.4%Jefferson 160 0.6% 0 0.0% 2 0.9% 1 0.1% 3 0.3% 6 0.1% 0 0.0% 172 0.4%Jewell 19 0.1% 0 0.0% 0 0.0% 0 0.0% 0 0.0% 0 0.0% 0 0.0% 19 0.0%Johnson 5,718 20.1% 381 14.1% 4 1.7% 394 34.8% 120 13.9% 736 11.7% 2 9.1% 7,355 18.6%Kearny 39 0.1% 0 0.0% 0 0.0% 0 0.0% 0 0.0% 23 0.4% 0 0.0% 62 0.2%Kingman 69 0.2% 0 0.0% 0 0.0% 1 0.1% 0 0.0% 1 0.0% 0 0.0% 71 0.2%Kiowa 32 0.1% 0 0.0% 0 0.0% 0 0.0% 0 0.0% 6 0.1% 0 0.0% 38 0.1%Labette 206 0.7% 16 0.6% 4 1.7% 2 0.2% 8 0.9% 7 0.1% 0 0.0% 243 0.6%Lane 21 0.1% 0 0.0% 0 0.0% 0 0.0% 0 0.0% 1 0.0% 0 0.0% 22 0.1%Leavenworth 795 2.8% 74 2.7% 3 1.3% 16 1.4% 22 2.6% 56 0.9% 1 4.5% 967 2.4%Lincoln 35 0.1% 0 0.0% 1 0.4% 0 0.0% 0 0.0% 2 0.0% 0 0.0% 38 0.1%Linn 97 0.3% 0 0.0% 0 0.0% 1 0.1% 0 0.0% 3 0.0% 0 0.0% 101 0.3%Logan 34 0.1% 0 0.0% 0 0.0% 0 0.0% 1 0.1% 1 0.0% 0 0.0% 36 0.1%Lyon 276 1.0% 13 0.5% 2 0.9% 4 0.4% 13 1.5% 112 1.8% 0 0.0% 420 1.1%

CountyN % N % N % N % N % N % N % N %

Table 12. Number and Percent of Births by Population Group and County of Residence, Kansas, 2011

HISPANIC n.s. TOTALWHITE NH BLACK NH

AMERICAN INDIAN-ALASKA

NATIVE NH ASIAN-PI NHMULTI RACE-

OTHER NH

McPherson 318 1.1% 4 0.1% 3 1.3% 3 0.3% 1 0.1% 18 0.3% 0 0.0% 347 0.9%Marion 102 0.4% 0 0.0% 0 0.0% 0 0.0% 1 0.1% 8 0.1% 1 4.5% 112 0.3%Marshall 108 0.4% 2 0.1% 0 0.0% 0 0.0% 0 0.0% 4 0.1% 0 0.0% 114 0.3%Meade 52 0.2% 1 0.0% 0 0.0% 0 0.0% 1 0.1% 18 0.3% 0 0.0% 72 0.2%Miami 355 1.3% 2 0.1% 2 0.9% 4 0.4% 7 0.8% 10 0.2% 0 0.0% 380 1.0%Mitchell 77 0.3% 0 0.0% 0 0.0% 1 0.1% 0 0.0% 6 0.1% 0 0.0% 84 0.2%Montgomery 360 1.3% 28 1.0% 9 3.9% 3 0.3% 12 1.4% 45 0.7% 0 0.0% 457 1.2%Morris 61 0.2% 0 0.0% 0 0.0% 2 0.2% 1 0.1% 0 0.0% 0 0.0% 64 0.2%Morton 24 0.1% 0 0.0% 0 0.0% 0 0.0% 0 0.0% 15 0.2% 0 0.0% 39 0.1%Nemaha 118 0.4% 1 0.0% 1 0.4% 1 0.1% 0 0.0% 3 0.0% 1 4.5% 125 0.3%Neosho 199 0.7% 1 0.0% 1 0.4% 1 0.1% 2 0.2% 10 0.2% 0 0.0% 214 0.5%Ness 26 0.1% 0 0.0% 0 0.0% 0 0.0% 0 0.0% 2 0.0% 0 0.0% 28 0.1%Norton 41 0.1% 0 0.0% 1 0.4% 1 0.1% 2 0.2% 3 0.0% 1 4.5% 49 0.1%Osage 175 0.6% 1 0.0% 0 0.0% 3 0.3% 2 0.2% 3 0.0% 0 0.0% 184 0.5%Osborne 36 0.1% 0 0.0% 1 0.4% 1 0.1% 1 0.1% 0 0.0% 0 0.0% 39 0.1%Ottawa 43 0.2% 0 0.0% 0 0.0% 0 0.0% 2 0.2% 1 0.0% 0 0.0% 46 0.1%Pawnee 66 0.2% 3 0.1% 1 0.4% 0 0.0% 1 0.1% 4 0.1% 0 0.0% 75 0.2%Phillips 47 0.2% 0 0.0% 0 0.0% 1 0.1% 0 0.0% 2 0.0% 0 0.0% 50 0.1%Pottawatomie 324 1.1% 2 0.1% 2 0.9% 4 0.4% 5 0.6% 15 0.2% 2 9.1% 354 0.9%Pratt 139 0.5% 1 0.0% 1 0.4% 0 0.0% 3 0.3% 20 0.3% 0 0.0% 164 0.4%Rawlins 12 0.0% 0 0.0% 0 0.0% 0 0.0% 0 0.0% 3 0.0% 0 0.0% 15 0.0%Reno 655 2.3% 16 0.6% 0 0.0% 4 0.4% 13 1.5% 71 1.1% 0 0.0% 759 1.9%Republic 42 0.1% 2 0.1% 0 0.0% 1 0.1% 0 0.0% 1 0.0% 0 0.0% 46 0.1%Rice 97 0.3% 0 0.0% 1 0.4% 0 0.0% 1 0.1% 20 0.3% 0 0.0% 119 0.3%Riley 842 3.0% 70 2.6% 4 1.7% 59 5.2% 31 3.6% 112 1.8% 1 4.5% 1,119 2.8%Rooks 60 0.2% 0 0.0% 0 0.0% 0 0.0% 1 0.1% 2 0.0% 0 0.0% 63 0.2%Rush 25 0.1% 0 0.0% 0 0.0% 0 0.0% 0 0.0% 1 0.0% 0 0.0% 26 0.1%Russell 80 0.3% 0 0.0% 0 0.0% 0 0.0% 3 0.3% 2 0.0% 0 0.0% 85 0.2%

CountyN % N % N % N % N % N % N % N %

Table 12. Number and Percent of Births by Population Group and County of Residence, Kansas, 2011

HISPANIC n.s. TOTALWHITE NH BLACK NH

AMERICAN INDIAN-ALASKA

NATIVE NH ASIAN-PI NHMULTI RACE-

OTHER NH

Saline 567 2.0% 21 0.8% 4 1.7% 13 1.1% 34 3.9% 117 1.9% 0 0.0% 756 1.9%Scott 55 0.2% 0 0.0% 0 0.0% 0 0.0% 0 0.0% 21 0.3% 0 0.0% 76 0.2%Sedgwick 4,930 17.4% 914 33.8% 37 16.2% 300 26.5% 157 18.2% 1,480 23.5% 0 0.0% 7,818 19.7%Seward 101 0.4% 9 0.3% 2 0.9% 6 0.5% 1 0.1% 332 5.3% 0 0.0% 451 1.1%Shawnee 1,664 5.9% 244 9.0% 21 9.2% 32 2.8% 93 10.8% 405 6.4% 5 22.7% 2,464 6.2%Sheridan 24 0.1% 0 0.0% 0 0.0% 0 0.0% 0 0.0% 7 0.1% 0 0.0% 31 0.1%Sherman 62 0.2% 0 0.0% 0 0.0% 0 0.0% 0 0.0% 10 0.2% 0 0.0% 72 0.2%Smith 25 0.1% 0 0.0% 0 0.0% 0 0.0% 1 0.1% 1 0.0% 0 0.0% 27 0.1%Stafford 35 0.1% 0 0.0% 0 0.0% 1 0.1% 0 0.0% 9 0.1% 0 0.0% 45 0.1%Stanton 14 0.0% 0 0.0% 0 0.0% 0 0.0% 0 0.0% 15 0.2% 0 0.0% 29 0.1%Stevens 47 0.2% 0 0.0% 0 0.0% 1 0.1% 1 0.1% 34 0.5% 1 4.5% 84 0.2%Sumner 246 0.9% 2 0.1% 1 0.4% 1 0.1% 3 0.3% 10 0.2% 0 0.0% 263 0.7%Thomas 85 0.3% 1 0.0% 0 0.0% 2 0.2% 0 0.0% 11 0.2% 0 0.0% 99 0.2%Trego 27 0.1% 0 0.0% 0 0.0% 0 0.0% 0 0.0% 0 0.0% 0 0.0% 27 0.1%Wabaunsee 77 0.3% 0 0.0% 0 0.0% 1 0.1% 1 0.1% 4 0.1% 0 0.0% 83 0.2%Wallace 16 0.1% 0 0.0% 0 0.0% 0 0.0% 1 0.1% 1 0.0% 0 0.0% 18 0.0%Washington 56 0.2% 0 0.0% 0 0.0% 1 0.1% 0 0.0% 4 0.1% 0 0.0% 61 0.2%Wichita 16 0.1% 0 0.0% 0 0.0% 0 0.0% 0 0.0% 7 0.1% 0 0.0% 23 0.1%Wilson 111 0.4% 1 0.0% 0 0.0% 0 0.0% 1 0.1% 1 0.0% 0 0.0% 114 0.3%Woodson 27 0.1% 0 0.0% 0 0.0% 0 0.0% 1 0.1% 3 0.0% 0 0.0% 31 0.1%Wyandotte 1,106 3.9% 611 22.6% 5 2.2% 81 7.2% 103 11.9% 826 13.1% 0 0.0% 2,732 6.9%Unknown 0 0.0% 0 0.0% 0 0.0% 0 0.0% 1 0.1% 0 0.0% 0 0.0% 1 0.0%Total 28,382 100% 2,708 100% 229 100% 1132 100% 862 100% 6,293 100% 22 100% 39,628 100%

Residence dataSource: Kansas Department of Health and Environment, Bureau of Epidemiology and Public Health InformaticsCreated: August 1, 2013

Poor OutcomeN % N % N % N % N % N % N % N %

No 23,839 84.0% 2,097 77.4% 179 78.2% 957 84.5% 688 79.8% 5,326 84.6% 19 86.4% 33,105 83.5%Yes 4,543 16.0% 611 22.6% 50 21.8% 175 15.5% 174 20.2% 967 15.4% 3 13.6% 6,523 16.5%Total 28,382 100% 2,708 100% 229 100% 1,132 100% 862 100% 6,293 100% 22 100% 39,628 100%

Residence dataSource: Kansas Department of Health and Environment, Bureau of Epidemiology and Public Health InformaticsCreated: August 1, 2013

Table 13. Number and Percent of Births by Population Group with and without Poor Outcomes, Kansas, 2011

n.s. TotalWHITE NH BLACK NH

AMERICAN INDIAN-ALASKA

NATIVE NH ASIAN-PI NHMULTI RACE-

OTHER NH HISPANIC

Education of MotherN % N % N % N % N % N % N % N %

8th Grade or Less 40 0.9% 6 1.0% 0 0.0% 8 4.6% 9 5.2% 111 11.5% 0 0.0% 174 2.7% 9-12 Grade, No Diploma 426 9.4% 109 17.8% 9 18.0% 13 7.4% 31 17.8% 264 27.3% 0 0.0% 852 13.1% H.S. or GED 1,091 24.0% 233 38.1% 15 30.0% 28 16.0% 44 25.3% 297 30.7% 0 0.0% 1,708 26.2% Some College, No Degree 1,138 25.0% 175 28.6% 15 30.0% 29 16.6% 49 28.2% 167 17.3% 2 66.7% 1,575 24.1% Associate Degree 408 9.0% 38 6.2% 7 14.0% 7 4.0% 9 5.2% 40 4.1% 0 0.0% 509 7.8% Bachelor's Degree 1,005 22.1% 34 5.6% 2 4.0% 43 24.6% 25 14.4% 55 5.7% 0 0.0% 1,164 17.8% Master's Degree 336 7.4% 9 1.5% 2 4.0% 38 21.7% 7 4.0% 8 0.8% 0 0.0% 400 6.1% Doctorate 88 1.9% 3 0.5% 0 0.0% 5 2.9% 0 0.0% 8 0.8% 0 0.0% 104 1.6%n.s. 11 0.2% 4 0.7% 0 0.0% 4 2.3% 0 0.0% 17 1.8% 1 33.3% 37 0.6%Total 4,543 100% 611 100% 50 100% 175 100% 174 100% 967 100% 3 100% 6,523 100%

Residence dataSource: Kansas Department of Health and Environment, Bureau of Epidemiology and Public Health InformaticsCreated: August 1, 2013

Table 14. Number and Percent of Births with Poor Outcomes by Population Group and Level of Education Attained, Kansas, 2011

HISPANIC n.s. TOTALWHITE NH BLACK NH

AMERICAN INDIAN-ALASKA

NATIVE NH ASIAN-PI NHMULTI RACE-

OTHER NH

PayorN % N % N % N % N % N % N % N %

Medicaid 1,434 31.6% 375 61.4% 30 60.0% 23 13.1% 72 41.4% 359 37.1% 0 0.0% 2,293 35.2%Private/employer Ins 2,203 48.5% 108 17.7% 11 22.0% 117 66.9% 51 29.3% 203 21.0% 2 66.7% 2,695 41.3%Self-pay 156 3.4% 33 5.4% 0 0.0% 11 6.3% 7 4.0% 228 23.6% 1 33.3% 436 6.7%Indian Health Service 0 0.0% 2 0.3% 3 6.0% 0 0.0% 0 0.0% 1 0.1% 0 0.0% 6 0.1%Champus/Tricare 649 14.3% 80 13.1% 6 12.0% 17 9.7% 33 19.0% 121 12.5% 0 0.0% 906 13.9%Other gov 24 0.5% 3 0.5% 0 0.0% 0 0.0% 3 1.7% 8 0.8% 0 0.0% 38 0.6%Other 63 1.4% 7 1.1% 0 0.0% 7 4.0% 7 4.0% 28 2.9% 0 0.0% 112 1.7%Unknown 14 0.3% 3 0.5% 0 0.0% 0 0.0% 1 0.6% 19 2.0% 0 0.0% 37 0.6%Total 4,543 100% 611 100% 50 100% 175 100% 174 100% 967 100% 3 100% 6,523 100%

Residence dataSource: Kansas Department of Health and Environment, Bureau of Epidemiology and Public Health InformaticsCreated: August 1, 2013

Table 15. Number and Percent of Births with Poor Outcomes by Population Group and Primary Payor, Kansas, 2011

HISPANIC n.s. TotalWHITE NH BLACK NH

AMERICAN INDIAN-ALASKA

NATIVE NH ASIAN-PI NHMULTI RACE-

OTHER NH

Preparedness RegionN % N % N % N % N % N % N % N %

Central Kansas Region 225 5.0% 5 0.8% 1 2.0% 4 2.3% 8 4.6% 32 3.3% 0 0.0% 275 4.2%East Central Coalition 148 3.3% 1 0.2% 2 4.0% 2 1.1% 5 2.9% 21 2.2% 0 0.0% 179 2.7%Ellis County 48 1.1% 1 0.2% 0 0.0% 2 1.1% 0 0.0% 6 0.6% 0 0.0% 57 0.9%KC Mmetro Region 1,166 25.7% 193 31.6% 12 24.0% 74 42.3% 50 28.7% 206 21.3% 0 0.0% 1,701 26.1%Lower 8 of SE Kansas 251 5.5% 26 4.3% 2 4.0% 3 1.7% 8 4.6% 16 1.7% 0 0.0% 306 4.7%North Central Kansas 133 2.9% 0 0.0% 0 0.0% 2 1.1% 7 4.0% 11 1.1% 0 0.0% 153 2.3%Northeast Corner 434 9.6% 71 11.6% 13 26.0% 11 6.3% 22 12.6% 64 6.6% 2 66.7% 617 9.5%Northwest Bioterror 44 1.0% 0 0.0% 0 0.0% 0 0.0% 0 0.0% 4 0.4% 0 0.0% 48 0.7%Rush County 5 0.1% 0 0.0% 0 0.0% 0 0.0% 0 0.0% 0 0.0% 0 0.0% 5 0.1%South Central Coalition 68 1.5% 0 0.0% 0 0.0% 0 0.0% 0 0.0% 7 0.7% 1 33.3% 76 1.2%South East Kansas Multi-County 71 1.6% 3 0.5% 0 0.0% 0 0.0% 0 0.0% 0 0.0% 0 0.0% 74 1.1%South-Central Metro Region 1,092 24.0% 216 35.4% 12 24.0% 46 26.3% 38 21.8% 244 25.2% 0 0.0% 1,648 25.3%Southwest Kansas Health Initiative 40 0.9% 1 0.2% 0 0.0% 3 1.7% 1 0.6% 68 7.0% 0 0.0% 113 1.7%Southwest Surrveillance 52 1.1% 1 0.2% 2 4.0% 1 0.6% 2 1.1% 80 8.3% 0 0.0% 138 2.1%West Central Public Health 32 0.7% 0 0.0% 0 0.0% 0 0.0% 0 0.0% 1 0.1% 0 0.0% 33 0.5%Western Pyramid 89 2.0% 4 0.7% 0 0.0% 5 2.9% 2 1.1% 82 8.5% 0 0.0% 182 2.8%Wildcat Region 645 14.2% 89 14.6% 6 12.0% 22 12.6% 31 17.8% 125 12.9% 0 0.0% 918 14.1%Unknown 0 0.0% 0 0.0% 0 0.0% 0 0.0% 0 0.0% 0 0.0% 0 0.0% 0 0.0%Total 4,543 100% 611 100% 50 100% 175 100% 174 100% 967 100% 3 100% 6,523 100%

Residence dataSource: Kansas Department of Health and Environment, Bureau of Epidemiology and Public Health InformaticsCreated: August 1, 2013

Table 16. Number and Percent of Births with Poor Outcomes by Population Group and Health Preparedness Region, Kansas, 2011

n.s. TotalWHITE NH BLACK NH

AMERICAN INDIAN-ALASKA

NATIVE NH ASIAN-PI NHMULTI RACE-

OTHER NH HISPANIC

StatusN % N % N % N % N % N % N % N %

Married 3,093 68.1% 177 29.0% 17 34.0% 145 82.9% 100 57.5% 486 50.3% 0 0.0% 4,018 61.6%Not Married 1,443 31.8% 434 71.0% 33 66.0% 30 17.1% 74 42.5% 481 49.7% 2 66.7% 2,497 38.3%Unknown 7 0.2% 0 0.0% 0 0.0% 0 0.0% 0 0.0% 0 0.0% 1 33.3% 8 0.1%Total 4,543 100% 611 100% 50 100% 175 100% 174 100% 967 100% 3 100% 6,523 100%

Residence dataSource: Kansas Department of Health and Environment, Bureau of Epidemiology and Public Health InformaticsCreated: August 1, 2013

Table 17. Number and Percent of Births with Poor Outcomes by Population Group and Mother's Marital Status, Kansas, 2011

HISPANIC n.s. TotalWHITE NH BLACK NH

AMERICAN INDIAN-ALASKA

NATIVE NH ASIAN-PI NHMULTI RACE-

OTHER NH

Level of prenatal care

N % N % N % N % N % N % N % N %Adequate Plus 2,393 52.7% 256 41.9% 23 46.0% 83 47.4% 71 40.8% 355 36.7% 0 0.0% 3,181 48.8%Adequate 1,260 27.7% 158 25.9% 5 10.0% 53 30.3% 44 25.3% 265 27.4% 0 0.0% 1,785 27.4%Intermediate 174 3.8% 26 4.3% 6 12.0% 6 3.4% 9 5.2% 53 5.5% 0 0.0% 274 4.2%Inadequate 432 9.5% 100 16.4% 12 24.0% 24 13.7% 26 14.9% 187 19.3% 1 33.3% 782 12.0%n.s. 284 6.3% 71 11.6% 4 8.0% 9 5.1% 24 13.8% 107 11.1% 2 66.7% 501 7.7%Total 4,543 100% 611 100% 50 100% 175 100% 174 100% 967 100% 3 100% 6,523 100%

Residence dataSource: Kansas Department of Health and Environment, Bureau of Epidemiology and Public Health InformaticsCreated: August 1, 2013

Table 18. Number and Percent of Births with Poor Outcomes by Population Group and Adequacy of Prenatal Care, Kansas, 2011

n.s.HISPANIC TotalWHITE NH BLACK NH

AMERICAN INDIAN-ALASKA

NATIVE NH ASIAN-PI NHMULTI RACE-

OTHER NH

WIC UseN % N % N % N % N % N % N % N %

Yes 1,549 34.1% 368 60.2% 32 64.0% 39 22.3% 81 46.6% 655 67.7% 2 66.7% 2,726 41.8%No 2,983 65.7% 239 39.1% 18 36.0% 136 77.7% 92 52.9% 312 32.3% 0 0.0% 3,780 57.9%Unknown 11 0.2% 4 0.7% 0 0.0% 0 0.0% 1 0.6% 0 0.0% 1 33.3% 17 0.3%Total 4,543 100% 611 100% 50 100% 175 100% 174 100% 967 100% 3 100% 6,523 100%

Residence dataSource: Kansas Department of Health and Environment, Bureau of Epidemiology and Public Health InformaticsCreated: August 1, 2013

Table 19. Number and Percent of Births with Poor Outcomes by Population Group and Use of WIC Services, Kansas, 2011

HISPANIC n.s. TotalWHITE NH BLACK NH

AMERICAN INDIAN-ALASKA

NATIVE NH ASIAN-PI NHMULTI RACE-

OTHER NH

Mother's AgeN % N % N % N % N % N % N % N %

10-14 2 0.0% 2 0.3% 0 0.0% 1 0.6% 0 0.0% 3 0.3% 0 0.0% 8 0.1%15-17 71 1.6% 23 3.8% 0 0.0% 3 1.7% 8 4.6% 41 4.2% 0 0.0% 146 2.2%18-19 264 5.8% 69 11.3% 5 10.0% 2 1.1% 21 12.1% 108 11.2% 0 0.0% 469 7.2%20-24 1,229 27.1% 209 34.2% 16 32.0% 18 10.3% 68 39.1% 296 30.6% 3 100.0% 1,839 28.2%25-29 1,464 32.2% 148 24.2% 21 42.0% 51 29.1% 39 22.4% 220 22.8% 0 0.0% 1,943 29.8%30-34 1,020 22.5% 115 18.8% 4 8.0% 54 30.9% 21 12.1% 159 16.4% 0 0.0% 1,373 21.0%35-39 397 8.7% 37 6.1% 3 6.0% 41 23.4% 13 7.5% 106 11.0% 0 0.0% 597 9.2%40-44 91 2.0% 8 1.3% 1 2.0% 5 2.9% 3 1.7% 31 3.2% 0 0.0% 139 2.1%45 and above 5 0.1% 0 0.0% 0 0.0% 0 0.0% 1 0.6% 3 0.3% 0 0.0% 9 0.1%Unknown 0 0.0% 0 0.0% 0 0.0% 0 0.0% 0 0.0% 0 0.0% 0 0.0% 0 0.0%Total 4,543 100% 611 100% 50 100% 175 100% 174 100% 967 100% 3 100% 6,523 100%

Residence dataSource: Kansas Department of Health and Environment, Bureau of Epidemiology and Public Health InformaticsCreated: August 1, 2013

Table 20. Number and Percent of Births with Poor Outcomes by Population Group and Age of Mother, Kansas, 2011

n.s. TotalWHITE NH BLACK NH

AMERICAN INDIAN-ALASKA

NATIVE NH ASIAN‐PI NHMULTI RACE-

OTHER NH HISPANIC

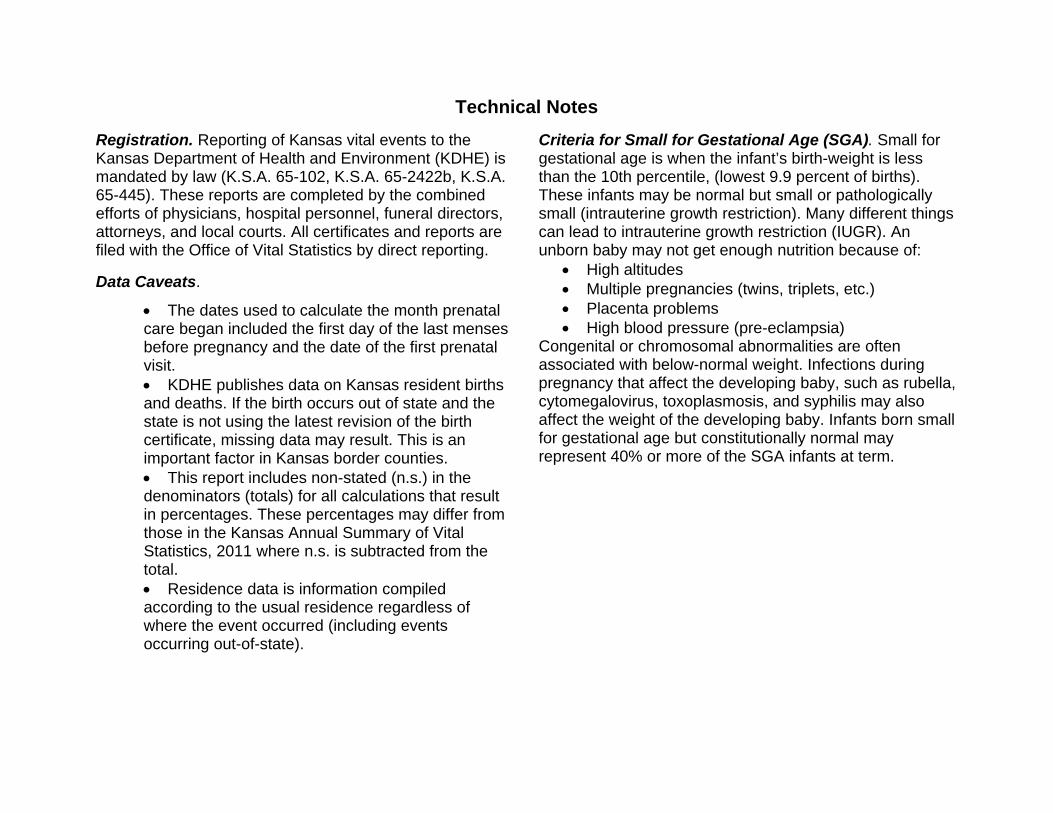
Technical Notes Registration. Reporting of Kansas vital events to the Kansas Department of Health and Environment (KDHE) is mandated by law (K.S.A. 65-102, K.S.A. 65-2422b, K.S.A. 65-445). These reports are completed by the combined efforts of physicians, hospital personnel, funeral directors, attorneys, and local courts. All certificates and reports are filed with the Office of Vital Statistics by direct reporting.

Data Caveats.

The dates used to calculate the month prenatal care began included the first day of the last menses before pregnancy and the date of the first prenatal visit. KDHE publishes data on Kansas resident births and deaths. If the birth occurs out of state and the state is not using the latest revision of the birth certificate, missing data may result. This is an important factor in Kansas border counties. This report includes non-stated (n.s.) in the denominators (totals) for all calculations that result in percentages. These percentages may differ from those in the Kansas Annual Summary of Vital Statistics, 2011 where n.s. is subtracted from the total. Residence data is information compiled according to the usual residence regardless of where the event occurred (including events occurring out-of-state).

Criteria for Small for Gestational Age (SGA). Small for gestational age is when the infant’s birth-weight is less than the 10th percentile, (lowest 9.9 percent of births). These infants may be normal but small or pathologically small (intrauterine growth restriction). Many different things can lead to intrauterine growth restriction (IUGR). An unborn baby may not get enough nutrition because of:

High altitudes Multiple pregnancies (twins, triplets, etc.) Placenta problems High blood pressure (pre-eclampsia)

Congenital or chromosomal abnormalities are often associated with below-normal weight. Infections during pregnancy that affect the developing baby, such as rubella, cytomegalovirus, toxoplasmosis, and syphilis may also affect the weight of the developing baby. Infants born small for gestational age but constitutionally normal may represent 40% or more of the SGA infants at term.

Definitions

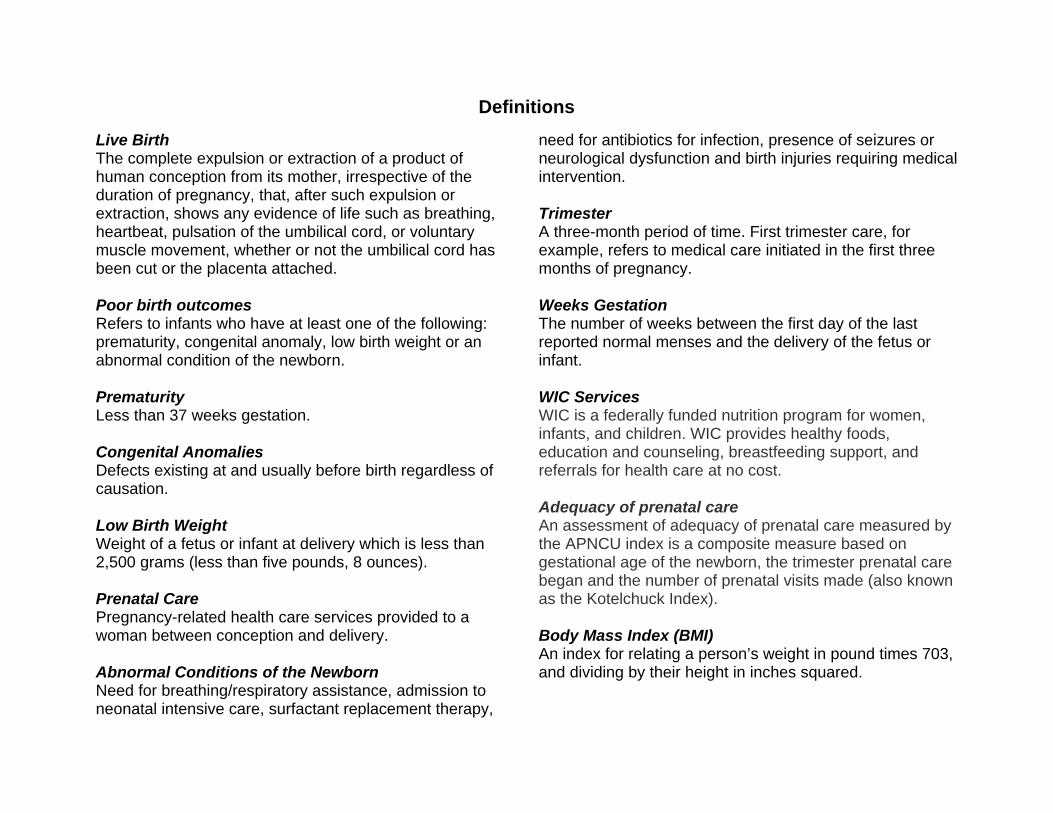
Live Birth The complete expulsion or extraction of a product of human conception from its mother, irrespective of the duration of pregnancy, that, after such expulsion or extraction, shows any evidence of life such as breathing, heartbeat, pulsation of the umbilical cord, or voluntary muscle movement, whether or not the umbilical cord has been cut or the placenta attached. Poor birth outcomes Refers to infants who have at least one of the following: prematurity, congenital anomaly, low birth weight or an abnormal condition of the newborn. Prematurity Less than 37 weeks gestation. Congenital Anomalies Defects existing at and usually before birth regardless of causation. Low Birth Weight Weight of a fetus or infant at delivery which is less than 2,500 grams (less than five pounds, 8 ounces). Prenatal Care Pregnancy-related health care services provided to a woman between conception and delivery. Abnormal Conditions of the Newborn Need for breathing/respiratory assistance, admission to neonatal intensive care, surfactant replacement therapy,

need for antibiotics for infection, presence of seizures or neurological dysfunction and birth injuries requiring medical intervention. Trimester A three-month period of time. First trimester care, for example, refers to medical care initiated in the first three months of pregnancy. Weeks Gestation The number of weeks between the first day of the last reported normal menses and the delivery of the fetus or infant. WIC Services WIC is a federally funded nutrition program for women, infants, and children. WIC provides healthy foods, education and counseling, breastfeeding support, and referrals for health care at no cost. Adequacy of prenatal care An assessment of adequacy of prenatal care measured by the APNCU index is a composite measure based on gestational age of the newborn, the trimester prenatal care began and the number of prenatal visits made (also known as the Kotelchuck Index). Body Mass Index (BMI) An index for relating a person’s weight in pound times 703, and dividing by their height in inches squared.


Recommended