Page 1
1
The effect of hematocrit on solid-phase microextraction
Nathaly Reyes-Garcés, Md. Nazmul Alam, Janusz Pawliszyn*
Department of Chemistry, University of Waterloo, Waterloo, Ontario, Canada N2L 3G1
* Corresponding author: Tel.: +1 519 888 4641; fax: +1 519 746 0435. E-mail address:
[email protected] (J. Pawliszyn).
The final publication is available at Elsevier via https://doi.org/10.1016/j.aca.2017.11.014 © 2017. This
manuscript version is made available under the CC-BY-NC-ND 4.0 license
http://creativecommons.org/licenses/by-nc-nd/4.0/
Page 2
2
Abstract
Solid-phase microextraction (SPME) is an approach to sample preparation that has demonstrated
its appropriateness for isolating/enriching analytes present in complex biofluids with minimum
sample pre-treatment. Several prior in vitro and in vivo studies have used SPME to monitor the
concentrations of various drugs and metabolites in blood samples. In this work, we present the
results of an investigation into how various levels of hematocrit (Hct) affect SPME recoveries. The
matrices for this study consisted of whole blood samples that had been adjusted at three
different Hct levels (20%, 45%, and 70%), and the selected model compounds were drugs with
different physicochemical characteristics (log P range from 0.33 to 6.36). In addition, two
experimental setups were employed to conduct the extractions: hydrophilic lipophilic balanced
(HLB) coated SPME devices (HLB-D) at 1500 rpm (vortex agitation), and mixed mode SPME fibres
(MM-F) at 400 rpm (orbital shaking agitation). Our results demonstrated that the Hct effect in
SPME is dependent on the analytes of interest, and that different outcomes can be attained by
altering experimental conditions, such as coating type, convection, and extraction time.
Interestingly, a target compound’s relative affinity for the matrix components and for the coating
material proved to be one of the main factors that determine the final effect that different
erythrocyte levels have on SPME recoveries. Finally, although the Hct content affects each
analyte differently and the final Hct effect depends on the experimental parameters, matrix
variability can be corrected by using appropriate internal standards, thereby resulting in correct
quantification.
Page 3
3
Key words: solid-phase microextraction, SPME, blood, red blood cells, hematocrit effect,
sample preparation
Abbreviations: Solid-phase microextraction (SPME), hematocrit (Hct), hydrophilic lipophilic
balanced (HLB), hydrophilic lipophilic balanced coated SPME devices (HLB-D), mixed mode
fibres (MM-F), dried blood spots (DBS)
Highlights:
• In this work an investigation into how the hematocrit (Hct) affects SPME recoveries is
presented.
• Our results demonstrated that the Hct effect in SPME is dependent on the analytes, and
that different outcomes can be attained by altering experimental conditions.
• The relative affinity of a target compound for the matrix components and for the coating
proved to be a critical factor that determines the final Hct effect on SPME.
• By using appropriate internal standards, variable SPME recoveries due to different Hct
levels can be corrected.
Page 4
4
1. Introduction
Many bioanalytical studies and clinical tests rely on the quantitative determination of small
molecules in whole blood samples. Given the complexity of this type of matrix, developing simple
analytical workflows that can provide satisfactory results while remaining compliant with health
regulations can be a challenging undertaking. Whole blood is comprised of two main
components: plasma and blood cells. Plasma has a relatively simpler composition than whole
blood, which makes it a commonly-used matrix for many routine bioanalytical determinations,
the most representative case of which being the therapeutic monitoring of multiple drugs. The
second main component of whole blood is the cells, which can be classified into three main types:
red blood cells (erythrocytes, ~96 %), white blood cells, and platelets [1]. Hematocrit (Hct) is a
term that refers to the fraction of blood volume made up of red blood cells, and its typical values
are within the ranges of 40 – 50% for men, and 36 – 44 % for women [2]. However, Hct levels can
fall outside of these ranges in particular cases, such as individuals living at high altitudes,
newborns, or anemic people [3]. Although plasma and serum are the specimens of choice for
several standardized analytical procedures, the direct analysis of whole blood samples is required
in certain instances (e.g. in forensic toxicology, in the determination of immunosuppressive
drugs, among others). Hence, understanding and evaluating Hct’s effect on whole blood samples
analysis should always be a matter of consideration.
Numerous sample preparation methodologies for analyzing small compounds (<1500 Da) in
whole blood samples using liquid chromatography coupled to mass spectrometry have been
reported in the literature [4–11]. Among such approaches, liquid-liquid extraction (LLE) and
Page 5
5
protein precipitation (PP)—which, in some cases is followed by cleaning steps involving online or
offline solid-phase extraction—are perhaps the most commonly used strategies. For substances
that display a high affinity for red blood cells, the use of additives that induce hemolysis and the
release of compounds from erythrocyte membranes (e.g. zinc sulfate) have been reported as
effective means of normalizing the sample matrix composition [12–14]. Nonetheless, the use of
appropriate internal standards is always recommended in order to ensure satisfactory method
accuracy and precision. Due to the highly-invasive nature of traditional blood collection,
alternative blood micro sampling strategies have been garnering much interest. For instance,
dried blood spots (DBS), which is a well-established sampling and whole-blood-analysis
methodology, has been broadly reported in several applications due to its low invasiveness
[7,9,15–18]. In DBS, a small drop of whole blood is placed on filter paper, allowed to dry, and
subsequently analyzed by desorbing fixed-diameter discs punched out from the dried spots. Prior
studies have found that Hct’s effect on DBS analysis is mostly associated with the variable
spreading pattern that blood samples exhibit when spotted onto DBS cards [2,3,7]; the viscosity
of blood samples is directly related to their Hct values, and samples with higher Hct values
produce smaller spot radii. The best strategy for overcoming Hct’s impact in relation to variable
blood spreading is to analyze whole spots of volumetrically-applied blood [3,7,19]. The
incorporation of appropriate internal standards via spraying prior to DBS extraction has proven
to be a feasible way of mitigating the variations related to matrix effects or recoveries [20,21].
Another absorptive-based approach recently introduced to overcome the Hct issues associated
with DBS is volumetric absorptive microsampling (VAMS) [8], which uses an absorptive polymeric
material immobilized on a pipette tip to collect fixed volumes of blood via wicking. Several studies
Page 6
6
have demonstrated that VAMS devices are able to collect reproducible blood volumes
independent of their Hct levels [8,22,23]. However, some issues with VAMS have also been
reported, particularly in relation to bias in the determination of blood concentrations, low
recoveries at high Hct levels, and interoperator variability [22,23]. Further evaluation of VAMS is
still required as it is still a relatively new microsampling approach.
Solid-phase microextraction (SPME) is a non-exhaustive extraction technique that uses a matrix-
compatible coating structure, which enables the analysis of complex samples, such as plasma and
even whole blood. In fact, the literature contains several prior studies that document SPME’s
usefulness as a sample preparation approach for such matrices prior to LC-MS or direct MS
instrumental analysis [11,24–28]. Interestingly, SPME’s applicability is not only limited to ex vivo
determinations; indeed, several studies have documented its suitability for in vivo blood analysis
in different animal models [29–36]. In regards to the principle of SPME, it is worth mentioning
that the extraction and pre-concentration of analytes occurs by directly exposing a defined
amount of a biocompatible extraction phase to the sample matrix for a given period of time. The
amount of analyte collected during the extraction process is proportional to the analyte’s
concentration and depends on the analyte’s affinity for the biocompatible coating and for the
sample matrix at the extraction conditions. Considering that the SPME matrix compatible coating
is highly selective for small compounds and that a washing step is carried out after the extraction,
the presence of proteins, salts, and other interferences that could affect the instrumental analysis
is easily avoided. In regards to the extraction mechanism, it is worth emphasizing that, in SPME,
the uptake of analytes from the sample media to the coating material happens via free analyte
concentration [37]. Therefore, if we consider a complex system, such as blood samples, where
Page 7
7
multiple co-existing phases can display an affinity for a given target compound, the amount of
analyte extracted by the SPME probe will be correlated to the free concentration of analyte at
the end of the extraction. As a matter of fact, parameters such as lipophilicity, charge, molecular
weight, diffusion coefficient, and structural moieties govern the distribution of any compound
into different blood compartments [38]. Likewise, such parameters strongly determine the
affinity that a target analyte exhibits for a particular SPME coating. In addition to the analyte’s
physicochemical characteristics, there are other factors that play an important role in the
microextraction process; for example, extraction time, extraction phase characteristics,
temperature, and convection conditions all determine the final recovery provided by an SPME
device. Given that red blood cells comprise a significant portion of a whole blood sample, this
work aims to investigate how varying Hct levels affect the amount of analyte extracted by SPME
devices. For this purpose, ten drugs with different polarities and physicochemical properties were
chosen as model compounds, and blood samples with three different Hct levels (20%, 45%, and
70 %) were selected as sample matrices. The effects of the coating type, sample convection, and
extraction time were also taken into consideration.
2. Experimental
2.1. Materials and supplies
Methamphetamine, stanozolol, codeine, codeine-d3, (±)11-nor-9-carboxy-Δ9-THC (THCCOOH),
(±)11-nor-9-carboxy-Δ9-THC-d3 (THCCOOH-d3), oxycodone-d3, testosterone-d3, cannabidiol-d3
and methadone-d3 standards were obtained from Cerilliant Corporation (Round Rock, TX, USA).
Nikethamide, propranolol, metoprolol, clenbuterol, exemestane, and salbutamol were
Page 8
8
purchased from Millipore Sigma (Oakville, ON, Canada), and salbutamol-d3 was purchased from
CDN Isotopes (Pointe Claire, Quebec, Canada). Sodium chloride, potassium chloride, potassium
phosphate monobasic, sodium phosphate dibasic, and formic acid were also purchased from
Millipore Sigma (Oakville, ON, Canada). LC-MS grade acetonitrile, methanol, and water were
obtained from Fischer Scientific.
Biocompatible SPME fibres (MM-F) coated with a mixed-mode extraction phase (C18 and
benzene sulfonic acid functionalities, 1.5 cm coating length, 45 μm coating thickness, and a total
diameter of 300 µm) were generously provided by Millipore Sigma (Bellefonte, PA, USA). SPME
devices prepared on a plastic support with a hydrophilic lipophilic balanced (HLB) extraction
phase (HLB-D) (2 cm coating length, 150 µm coating thickness, and 2 mm total diameter) were
made as described in [25].
Blood samples were purchased from Bioreclamation IVT (Westbury, New York, USA). These
samples were from healthy donors (with K2-EDTA as anticoagulant), and had Hct levels that had
been adjusted to 20%, 45%, and 70%.
2.2. Working solutions
A stock methanolic solution (20 µg mL-1) containing all analytes (nikethamide, salbutamol,
codeine, metoprolol, methamphetamine, clenbuterol, exemestane, propranolol, stanozolol and
THCCOOH) was prepared and further dilution was done as required. A stock solution (8 µg mL-1)
containing different deuterated compounds as internal standards was prepared in methanol.
2.3. SPME procedure
Page 9
9
Prior to the experiments, the blood samples with adjusted Hct content were spiked with stock
methanolic solutions containing all the analytes, while ensuring that the organic solvent content
was kept below 1% in all cases. For the construction of the calibration curves, the spiked blood
samples were pre-incubated for at least 1 hour at constant agitation; for the determination of
the extraction time profiles, blood samples incubation was allowed overnight. Before the
extractions, MM-F and HLB-D were first pre-conditioned in a 1:1 (v/v) methanol:water solution
for 30 min using vortex agitation at 1500 rpm. Subsequently, all devices were rinsed in ultrapure
water for 10 s to remove any remaining organic solvent from the coating surface. In order to
guarantee a stable sample pH (close to physiological pH) over the entire extraction process, 1080
µL of spiked blood aliquots were mixed with 120 µL of 1 M phosphate buffer adjusted at a pH of
7. Furthermore, 15 µL of internal standard solution were added to the samples used for the
calibration curve experiments. The extractions were then carried out by immersing both types of
SPME devices into the sample matrix for a pre-set period of time at constant agitation conditions.
To construct the calibration curves, the extraction time was set at 90 min, the calibration range
was set between 5 and 100 ng mL-1 for all target analyte, and four calibration curve replicates
were constructed on two consecutive days. Time points of 15, 30, 60, 90, 120 and 180 min were
selected for the extraction time profiles, and all the extractions were conducted in triplicates.
The agitation parameters were set as follows: vortex agitation was set at 1500 rpm for the HLB-
D, and orbital shaking agitation was set at 400 rpm for the MM-F. Once the extraction step was
completed, three consecutive rinsing steps in water (5 s each) were performed following the
procedure reported by Reyes-Garces et al [25]. Finally, desorption of the devices was carried out
for 20 min at 1500 rpm in 300 and 600 µL of desorption solution (4:1 methanol:acetonitrile) for
Page 10
10
MM-F and HLB-D, respectively. To determine the amount of analyte extracted by the SPME
devices in each experiment, an instrumental calibration curve (from 0.1 to 150 ng mL-1) was
prepared using the same solvent composition that was used for the desorption solution.
2.4. LC-MS/MS conditions and data processing
All the collected extracts and the instrumental calibration curve were run using the LC-MS/MS
conditions reported in [25]. Briefly, the LC-MS/MS system was comprised of an Accela
autosampler, an Accela pump, and a TSQ vantage triple quadrupole mass spectrometer with a
heated electrospray ionization source operating in positive mode (Thermo Scientific, San Jose,
USA). Chromatographic separation was attained using a Kinetex pentafluorophenyl core shell
column (1.7 µm, 2.1 mm x 10 mm) that had been connected to a PFP security guard ultracartridge
(Phenomenex, Torrance, CA, USA), and LC separation was achieved using a mobile phase system
consisting of 0.1% formic acid (A), acetonitrile with 0.1 % formic acid (B), and methanol with 0.1%
formic acid (C). The gradient elution conditions were set as follows: A, B, and C were held at 90%,
5%, and 5 %, respectively, for 0.5 min; B and C were then increased linearly to 50 % over the
course of 6.5 min; C was then increased to 75 % and B was decreased to 25% over the course of
5 min and held for 3.5 min. Finally, the column was kept at the initial gradient composition for 2
min. The column temperature was kept at 35 ˚C, the total run time was 17.5 min, and the column
flow was set at 0.3 mL min-1. Samples were stored in the autosampler at 5 ˚C, and the injection
volume was 10 µL. MS analysis was conducted using selective reaction monitoring (SRM) mode,
and the conditions of each compound were optimized by directly infusing the standards. Table 1
summarizes information corresponding to SRM transitions of the model compounds The
Page 11
11
following transitions were selected for the deuterated compounds that were employed as
internal standards: salbutamol-d3: 243.16 151.12; codeine-d3: 303.15 165.10; oxycodone-
d3: 319.12 259.15; methadone-d3: 313.21 105.10; testosterone-d3: 292.25 97.14; and
THCCOOH-d3: 348.16 302.28. Other parameters were set as follows: spray voltage = 1300 V;
vaporizer temperature = 275˚C; sheath gas = 45 units; auxiliary gas = 30 units; and capillary
temperature = 280˚C.
2.5. Data analysis
Xcalibur software (2.0.7 SP1) was employed for data acquisition and processing. For the purpose
of this study, the slopes of the calibration curves constructed for each compound with different
Hct levels were statistically compared. Statistical analysis was carried out using one-way ANOVA,
one-tail t-test (equal and unequal variances), and relative standard deviations (RSDs).
3. Results and discussion
In order to elucidate the effect that various Hct levels can have on SPME recovery rates, an
analyte’s affinity for the main blood components (aqueous phase, proteins, and red blood cells)
should be taken into consideration. For this reason, analytes with distinct physicochemical
Page 12
12
properties were selected for this work because they can be expected to display variable affinities
for blood constituents (Table 1). In addition to using various model compounds, two
experimental setups were employed: MM-F at 400 rpm and HLB-D at 1500 rpm. Although both
types of SPME devices have been documented as being suitable and biocompatible for the
analysis of whole blood samples [25,32,39], the attachment of macromolecules is usually
observed in the case of MM-F under aggressive agitation conditions and long extraction times.
Consequently, an orbital shaker operating at 400 rpm was chosen as the agitation setup for MM-
F extractions. In the case of HLB-D, satisfactory results for whole blood samples analysis were
already found when using vortex agitation at 1500 rpm; therefore, the same parameters were
kept [25]. Although high agitation speeds such as 1500 rpm are likely to induce lysis in red blood
cells—and therefore changes in the Hct content during the extraction [40]—the main purpose of
the evaluation was to assess the overall effect of different red blood cell contents on SPME
extractions under typical experimental conditions.
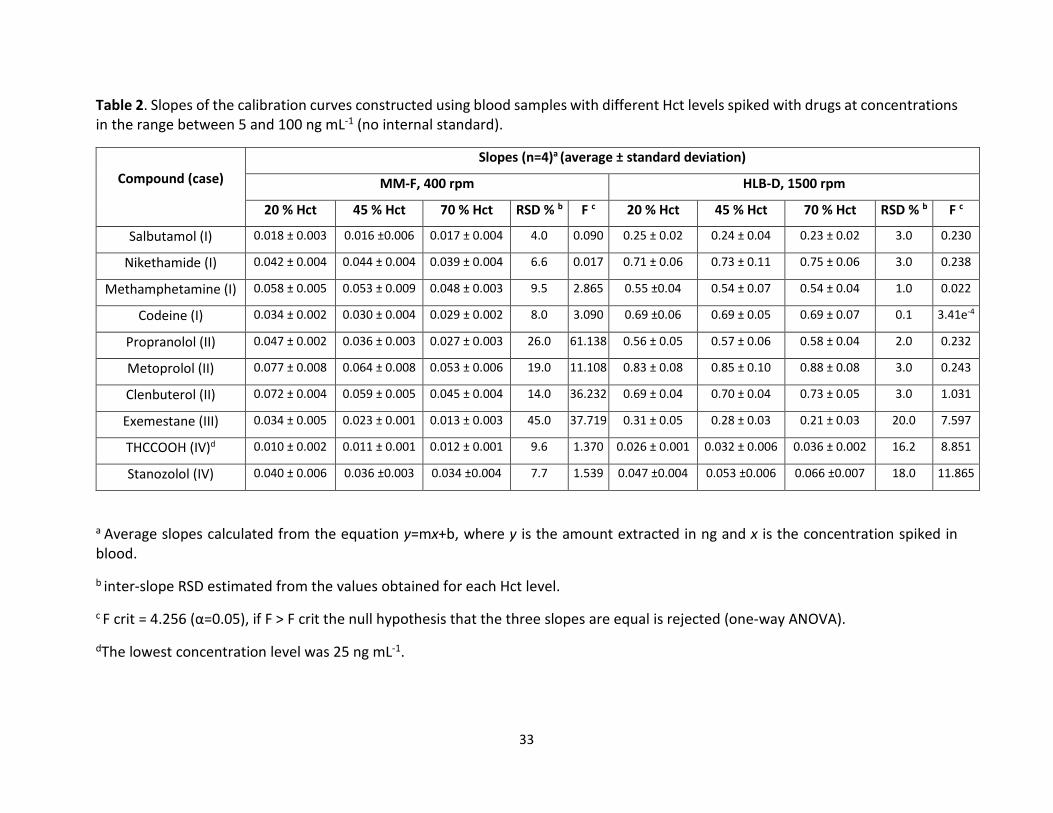
Table 2 presents the results corresponding to the calculated slopes for each of the model analytes
in blood samples with different Hct levels as determined by the two different experimental
setups. It is worth emphasizing that slope calculation was selected as parameter for investigating
Hct effect because it is a well-accepted approach for assessing relative matrix effects [41]. As
shown in Table 2, different outcomes were found depending on the analyte and the experimental
conditions; therefore, in order to simplify things, we classified the observations into four different
cases: no Hct effect at any of the experimental conditions (Case I), Hct effect only when MM-F
were used (Case II), Hct effect in both MM-F and HLB-D experiments (Case III), and Hct effect
when HLB-D were used (Case IV).
Page 13
13
In the first case (Case I), no statistically significant Hct effect was observed for any of the study
conditions (MM-F at 400 rpm and HLB-D at 1500 rpm). Interestingly, salbutamol, nikethamide,
codeine, and methamphetamine, which are all characterized as being relatively polar and/or for
having low protein-binding affinities, were categorized in this first group. In order to explain the
obtained results, parameters such as the polarity and affinity of an analyte for the matrix
components and the extraction phases should be taken into account. With regards to an analyte’s
polarity, it is important to emphasize that highly-polar compounds typically display shorter
equilibration times due to their low affinities for SPME coatings (low K values). This is confirmed
by Equation 1, where the equilibration time in SPME is expressed as a function of the boundary
layer thickness (𝛿𝛿𝑠𝑠 ), the distribution constant (K), the thickness of the SPME coating (L), the
diffusion coefficient of the analyte in the sample matrix (𝐷𝐷𝑠𝑠), and the coating capacity (Г𝑚𝑚𝑚𝑚𝑚𝑚)
[42].
𝑡𝑡𝑒𝑒𝑒𝑒 ≈ 𝑡𝑡95% = 𝛿𝛿𝑠𝑠𝐾𝐾𝐾𝐾𝐷𝐷𝑠𝑠Г𝑚𝑚𝑚𝑚𝑚𝑚
(1)
In this context, it is worth mentioning that, when extractions are performed at conditions close
to equilibrium, the amount of analyte collected is mostly determined by the analyte’s distribution
constant. Conversely, when the extraction process is interrupted at an earlier stage, the diffusion
of the analytes in the sample matrix plays a more important role. Since 90 min was chosen as the
extraction time for the Hct effect assessment, it was relevant for the interpretation of the results
to determine at what point of the extraction process the comparison was being conducted. As
shown in Figure 1A, a relatively polar compound like salbutamol was close to reaching
equilibrium after 90 min of extraction using MM-F at 400 rpm. This means that variations in the
Page 14
14
analyte’s diffusivity due to differences in the matrix viscosity will not have an important effect on
the analyte’s uptake. Moreover, as can be seen in the same plot, minimal differences were found
in the profiles constructed at the three Hct levels. Considering salbutamol’s high polarity and low
protein binding, variable levels of matrix constituents are not expected to greatly affect SPME
recoveries as a result of decreasing the analyte’s free concentration. In the case of HLB-D, a
slightly different situation was observed for the same compound. As can be seen in Figure 1B,
although there is an overlap in the constructed time profiles for blood samples adjusted at
different Hct levels, a plateau in the extracted amounts of salbutamol was not achieved, even
after 180 min of extraction at high-speed agitation. These results can be explained based on HLB’s
much higher affinity for polar analytes and the thicker HLB-D coatings that permit the extraction
of much larger amounts of analyte. Under such experimental conditions, the stronger affinity
that HLB-D displays for the target analytes—compared to the one exhibited by the matrix
constituents—will contribute to lessening the differences that can occur in SPME recoveries due
to variations in the matrix composition. It is also noteworthy that the convection parameters in
the HLB-D experiments were significantly higher than those in the MM-F extractions. Faster
agitation conditions allow for a decrease in the thickness of the boundary layer, which in turn
accelerates the mass transfer process occurring from the sample matrix to the SPME coating.
Given this principle, the combination of improved convection conditions and HLB-D’s strong
extraction capacity will result in a reduced Hct effect in the extraction of analytes that do not
show a specific affinity for erythrocytes. In the case of compounds such as methamphetamine
and codeine, which are less polar than salbutamol and nikethamide but still meet the conditions
to be classified as Case I, it is noteworthy that the slopes of the calibrations curves constructed
Page 15
15
with MM-F showed higher RSD values (9.5% and 8%) than those obtained with HLB-D (1% and
0.1%). In fact, when MM-F was used, the slopes for methamphetamine and codeine were
statistically higher in blood samples adjusted at 20 % Hct than for blood samples adjusted at 70
% Hct (methamphetamine (20% vs 70% Hct): one-sample t(6)=3.52, p-value<0.01; codeine (20%
vs 70% Hct): one-sample t(6)=4.42, p<0.01). Since these compounds are slightly hydrophobic, and
considering the fact that codeine binds to the red blood cell plasma membrane, the presence of
variable levels of matrix components is likely to alter the concentration of analytes available for
SPME extractions [43]. Interestingly, this effect becomes more pronounced when devices with
weaker affinities and lower extraction capacities, such as MM-F, are employed for extraction. In
light of the discussed results, it is clear that the affinity of target analytes for the coating and the
matrix components has a highly-significant effect on the final SPME recoveries when analyzing
blood samples with different Hct levels.
In order to explain the experimental findings corresponding to Case II, the same rationale
regarding various analytes’ affinities for coatings and for matrix constituents should be taken into
consideration. As can be seen in Table 2, Case II analytes had different outcomes that were
dependent on the SPME experimental parameters. On the one hand, a pronounced decrease in
the slopes as a function of erythrocyte levels was observed in the experiments conducted with
MM-F; on the other hand, the statistical comparison of the slopes showed no Hct effect for
extractions carried out with HLB-D (propranolol: F(2,9)=0.232, p-value=0.80; metoprolol:
F(2,9)=0.243, p-value=0.79; clenbuterol: F(2,9)=1.031, p-value=0.40). The lack of observed
differences when HLB was used can be attributed to the high convection conditions, as well as
the fact that, as was discussed in relation to Case I, HLB-D has a much higher affinity for the target
Page 16
16
analytes than MM-F and matrix components. Moreover, since the Case II analytes are overall less
polar than those in Case I, they can be expected to have a higher degree of interaction with matrix
components (lower free concentrations) and larger K values, and therefore longer equilibration
times (Equation 1). Figure 1C presents the extraction time profile constructed for propranolol
using MM-F at 400 rpm. As can be seen, the recoveries corresponding to the profile in 20% Hct
blood samples are considerably higher than those obtained for the other two Hct levels. This
outcome can be explained based on the fact that higher concentrations of matrix components—
in this case, red blood cells—lead to lower concentrations of propranolol available for SPME
extraction; thus, lower amounts of propranolol are collected at 70 % Hct. Given that MM-F lacks
sufficient extraction capability for inducing the release of bound analytes in order to further
enhance the extraction recoveries, such experimental conditions tend to exhibit a significant Hct
effect. Moreover, taking into account that the extraction process is still close to the linear regime
at 90 min, it is possible that differences in the analyte’s diffusivity as a function of matrix viscosity
could be partly responsible for variations in the uptake rate [44]. Although equilibrium is far from
being reached at 90 min in HLB-D (Figure 1D), its high affinity for propranolol and the high
convection conditions largely mitigate any effect that variable Hct levels can have on the final
recoveries. Indeed, HLB’s high capacity for adsorption is able to deplete the analyte’s free
concentration and induce the release of bound analytes back to their free forms, thereby
increasing the total recovery. While possible changes in the matrix composition due to vigorous
agitation [40] should be considered when explaining the different recoveries obtained using the
two experimental setups, the results that will be presented in the next case clearly indicate that
red blood cells remain a significant compartment after 90 min of vortex agitation.
Page 17
17
In the third case noted in this study (Case III), a similar Hct effect for both MM-F and HLB-D was
found; that is, the amount of analyte extracted decreased in proportion to the blood erythrocyte
levels. This particular behavior was observed for exemestane, a relatively non-polar steroidal
compound (Figures 1E and 1F). As shown in Table 2, extractions conducted with both MM-F and
HLB-D produced higher calibration curve slopes for 20% Hct blood samples than for the ones
calculated at 70% (MM-F (20% vs 70% Hct): one-sample t(5)=7.25, p<0.01; HLB-D (20% vs 70%
Hct): one-sample t(4)=3.37, p<0.05). In the case of MM-F, a more pronounced variation was
observed in the slopes of the calibration curves constructed at the different Hct levels due to the
previously described effects of lower coating affinity and slower agitation. To the best of our
knowledge, there is no information in the literature regarding the partitioning of exemestane
into red blood cells. In fact, stanozolol, another steroidal compound that was used as a model
analyte in this study, did not exhibit the same Hct effect. In order to confirm that exemestane
was being partitioned into the erythrocytes, the recoveries of extractions from 70% Hct blood
samples and fully-hemolyzed 70% Hct blood samples were compared using HLB-D. Complete
blood hemolysis was achieved by storing pre-spiked 70% Hct blood samples for two hours at -80
°C (i.e. freeze and thaw). As shown in Figure 2, the recovery of exemestane increased by
approximately 60% when extracted from hemolyzed blood; this confirms that this drug is being
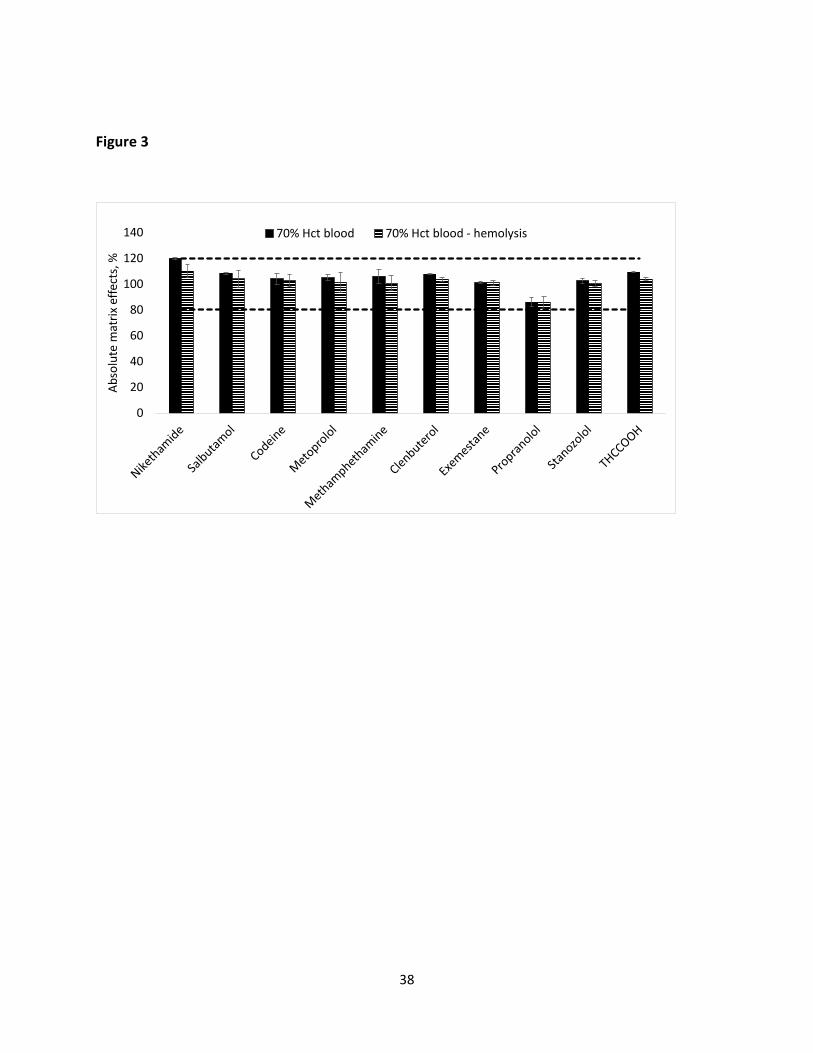
partitioned into the red blood cells. To verify that the changes observed in exemestane recoveries
were due to blood hemolysis and not due to ionization effects (suppression/enhancement),
absolute matrix effects were assessed in 70% Hct blood samples (hemolyzed and non-hemolyzed)
according to the procedure proposed by by Matuszewski et al (Figure 3) [41]. Based on these
results, it is evident that exemestane’s affinity for the matrix is much higher than that of other
Page 18
18
model analytes categorized in the previous cases such that even pronounced differences are
observed when HLB-D are used. Therefore, the use of an internal standard that displays the same
affinity for red blood cells is crucial to ensuring the successful analysis of exemestane in blood
samples obtained from different patients.
Similar to Case II, two different trends that were dependent on the SPME experimental conditions
were observed in Case IV. Interestingly, the model compounds that were categorized within this
last case are highly lipophilic and capable of significant protein binding. The slopes for these
analytes were significantly higher at 70% Hct content when the extractions were carried out using
HLB-D at 1500 rpm (THCCOOH (20% vs 70% Hct): one-sample t(5)=-8.58, p<0.01; stanozolol (20%
vs 70% Hct): one-sample t(6)=-4.89, p<0.01) (Table 2). On the contrary, no statistical differences
in the slopes were observed for the calibration curves constructed with MM-F (THCCOOH:
F(2,8)=1.371, p-value=0.31; stanozolol: F(2,9)=1.539, p-value=0.27). One of the model
compounds that exhibited this behavior was THCCOOH, the main secondary metabolite of THC.
THCCOOH is a considerably non-polar analyte (logP 6.38) with 92.0 ± 8.7% protein binding [45].
In addition, according to previous studies, THCCOOH’s distribution into red blood cells is
restricted [45,46]. Based on this behavior, the concentration of THCCOOH in plasma will be
significantly higher than its concentration in whole blood (blood-to-plasma ratio = 0.65)[45].
Therefore, if we take into account that the volume of plasma is substantially less at 70% Hct than
at 20% and 45% Hct, we can anticipate that a higher free analyte concentration will be available
for SPME extractions at 70% Hct than at the other two Hct levels. This trend is reflected in the
slopes for THCCOOH that were obtained with HLB-D (Table 2), and in its extraction time profile
(Figure 1H). A similar behavior was also observed in the slopes for stanozolol that were
Page 19
19
constructed under the same conditions. Stanozolol is also known for being highly lipophilic (logP
4.43), but, to the best of our knowledge, there have been no prior studies that have analyzed its
distribution in different blood components. With respect to the results obtained using MM-F, we
hypothesize that the concentration available for SPME extractions, the convection conditions,
and the diffusion of analytes all played an important role in the final outcome. As can be seen in
Figure 1G, the THCCOOH uptake in MM-F is still in its linear regime at 90 min due to the slow
convection and the compound’s high affinity for the coating. Hence, the analytes’ diffusion has a
more significant effect on the extraction process than it does in cases where extractions are
closer to equilibrium. In addition, it is important to consider that the flux of analyte from the
sample matrix towards the coating (or analyte uptake) is proportional to the concentration
gradient between the coating surface and the sample. Since a higher concentration of analyte is
available for SPME extractions at 70% Hct, a higher uptake rate can be expected due to the
concentration gradient. Based on this information, the estimated slopes for MM-F represent a
combination of both the variation in analyte diffusion at different sample viscosities, and the
changes in analyte uptake rates due to the concentrations available for SPME extractions at
different Hct levels.
As has been discussed so far, the Hct effect in SPME is completely dependent on the analytes of
interest, and different outcomes can be obtained by changing the experimental conditions.
Parameters such as an analyte’s physicochemical properties (lipophilicity, molecular weight,
diffusivity, etc), distribution constants, convection conditions, and, to some extent, sample
viscocity are all important in determining how Hct differences affect SPME recoveries.
Nevertheless, as in any other sample preparation approach, the use of internal standards
Page 20
20
represents the best way to account for any matrix variability. Table 3 presents the slopes after
internal standard correction for those cases where F>Fcrit. Among seven deuterated drugs tested
as internal standards (please refer to section 2.1), only those able to provide acceptable
corrections were selected. Unfortunately, none of the available deuterated standards exhibited
the same affinity for red blood cells shown by exemestane; as such, we could not provide the
corrected data for that compound. As can be seen in Table 3, the RSD values corresponding to
the corrected slopes of those analytes that were significantly affected by variable red blood cell
content were rewarding. Interestingly, compounds that were not necessarily deuterated
analogues of the target analytes were able to provide adequate correction. Several studies in
which SPME was used to analyze multiple substances in biofluids have described the use of a
small set of internal standards as a practical and cost-effective strategy for correcting all of the
target analytes [24,25,47]. However, as has been noted above, the behavior of a given analyte in
a specific matrix depends on several factors, and a proper assessment of an internal standard’s
suitability at various Hct levels is required when dealing with real blood samples. Indeed,
although a given internal standard can effectively correct for extraction variations in a single
blood lot, this does not necessarily mean that the same internal standard will properly account
for varying Hct content.
Further investigation should be conducted into alternative strategies for overcoming the Hct
effect observed in SPME. These strategies may focus on full red blood cell lysis via a combination
of using additives (e.g. zinc sulfate or organic solvents) or freezing and the addition of appropriate
internal standards, preferably deuterated analogues. In the case of in vivo blood sampling, special
Page 21
21
attention should be given to the Hct effect when external calibration curves are used for
quantitation, as no internal standard can be introduced into the samples.
3. Conclusions
In this study, the effect of varying levels of Hct on SPME recoveries was investigated by using
distinct model compounds and two different experimental setups. As expected, the observed
effect was dependent on the analyte’s characteristics and the extraction parameters. For
instance, variable Hct levels did not show any effect on the recovery of polar compounds with
low protein affinities (e.g. salbutamol) under any of the study conditions. However, the extraction
of more hydrophobic analytes, such propranolol, was strongly affected by the red blood cell
content only when MM-F was used at 400 rpm. Similarly, for compounds such as
methamphetamine, codeine, propranolol, metoprolol and clenbuterol, the use of HLB-D with
high convection conditions produced negligible differences in the SPME recoveries from blood
samples adjusted at various Hct levels. This demonstrated that an analyte’s relative affinity for
the matrix and the extraction phase is critical when matrices with varying compositions are
analyzed. Other model analytes, such as exemestane and THCCOOH, exhibited a negative and
positive correlation, respectively, between the SPME recoveries and the Hct content due to their
opposite affinity for red blood cells. Lastly, despite variations in analyte recovery due to different
erythrocyte contents, it was possible to correct for relative matrix effects by using appropriate
internal standards. Overall, since each analyte can display different Hct effects, variable red blood
Page 22
22
cell levels within the final experimental conditions should be always properly assessed when
analyzing whole blood samples with SPME.
Acknowledgment
This study was financed by the Natural Sciences and Engineering Research Council (NSERC) of
Canada. The authors of this work would like to thank Dr. Barbara Bojko for her suggestions at the
beginning of this study.
References
[1] J. Schaller, S.A. Gerber, U. Kampfer, S. Lejon, C. Trachsel, Human Blood Plasma Proteins:
Structure and Function, John Wiley & Sons, 2008.
[2] P. Denniff, N. Spooner, The effect of hematocrit on assay bias when using DBS samples
for the quantitative bioanalysis of drugs, Bioanalysis. 2 (2010) 1385–1395.
doi:10.4155/bio.10.103.
[3] P.M. De Kesel, N. Sadones, S. Capiau, W.E. Lambert, C.P. Stove, Hemato-critical issues in
quantitative analysis of dried blood spots: challenges and solutions, Bioanalysis. 5 (2013)
2023–2041. doi:10.4155/bio.13.156.
[4] L. Nováková, H. Vlcková, A review of current trends and advances in modern bio-
Page 23
23
analytical methods: chromatography and sample preparation., Anal. Chim. Acta. 656
(2009) 8–35. doi:10.1016/j.aca.2009.10.004.
[5] H. Gika, G. Theodoridis, Sample preparation prior to the LC–MS-based
metabolomics/metabonomics of blood-derived samples, Bioanalysis. 3 (2011) 1647–
1661. http://www.future-science.com/doi/pdfplus/10.4155/bio.11.122 (accessed March
16, 2017).
[6] D. Grote-Koska, S. Czajkowski, K. Brand, Performance of the New RapidFire System for
Therapeutic Monitoring of Immunosuppressants, Ther. Drug Monit. 37 (2015) 400–404.
doi:10.1097/FTD.0000000000000139.
[7] W. Li, F.L.S. Tse, Special Issue: Review Dried blood spot sampling in combination with LC-
MS/MS for quantitative analysis of small molecules, Biomed. Chromatogr. 24 (2010) 49–
65. doi:10.1002/bmc.1367.
[8] P. Denniff, N. Spooner, Volumetric Absorbtive Micro Sampling (VAMS): A Novel Dried
Sample Collection Technique for Quantitative Bioanalysis, Anal. Chem. 86 (2014) 8489–
8495. doi:10.1021/ac5022562.
[9] M. Wagner, D. Tonoli, E. Varesio, G. Hopfgartner, The use of mass spectrometry to
analyze dried blood spots, Mass Spectrom. Rev. 35 (2016) 361–368.
doi:10.1002/mas.21441.
[10] M. Abdel-Rehim, Recent advances in microextraction by packed sorbent for bioanalysis,
J. Chromatogr. A. 1217 (2010) 2569–2580. doi:10.1016/j.chroma.2009.09.053.
Page 24
24
[11] É. a. Souza-Silva, N. Reyes-Garcés, G. a. Gómez-Ríos, E. Boyacı, B. Bojko, J. Pawliszyn, E.
Boyaci, B. Bojko, J. Pawliszyn, A critical review of the state of the art of solid-phase
microextraction of complex matrices iii. bioanalytical and clinical applications, TrAC
Trends Anal. Chem. 71 (2015) 249–264. doi:10.1016/j.trac.2015.04.017.
[12] D.S. Jain, G. Subbaiah, M. Sanyal, U.C. Pande, P. Shrivastav, Liquid chromatography–
tandem mass spectrometry validated method for the estimation of indapamide in human
whole blood, J. Chromatogr. B. 834 (2006) 149–154. doi:10.1016/j.jchromb.2006.02.040.
[13] C. Seger, K. Tentschert, W. Stöggl, A. Griesmacher, S.L. Ramsay, A rapid HPLC-MS/MS
method for the simultaneous quantification of cyclosporine A, tacrolimus, sirolimus and
everolimus in human blood samples., Nat. Protoc. 4 (2009) 526–534.
doi:10.1038/nprot.2009.25.
[14] R.A. Koster, E.C.F. Dijkers, D.R.A. Uges, Robust, High-Throughput LC-MS/MS Method for
Therapeutic Drug Monitoring of Cyclosporine, Tacrolimus, Everolimus, and Sirolimus in
Whole Blood, Ther. Drug Monit. 31 (2009) 116–125.
doi:10.1097/FTD.0b013e318192304c.
[15] A. Thomas, H. Geyer, S. Guddat, W. Schänzer, M. Thevis, Dried blood spots (DBS) for
doping control analysis, Drug Test. Anal. 3 (2011) 806–813. doi:10.1002/dta.342.
[16] J. Déglon, A. Thomas, P. Mangin, C. Staub, Direct analysis of dried blood spots coupled
with mass spectrometry: concepts and biomedical applications., Anal. Bioanal. Chem.
402 (2012) 2485–98. doi:10.1007/s00216-011-5161-6.
Page 25
25
[17] A. Thomas, H. Geyer, W. Schänzer, C. Crone, M. Kellmann, T. Moehring, M. Thevis,
Sensitive determination of prohibited drugs in dried blood spots (DBS) for doping
controls by means of a benchtop quadrupole/Orbitrap mass spectrometer., Anal.
Bioanal. Chem. 403 (2012) 1279–89. doi:10.1007/s00216-011-5655-2.
[18] Q.C. Ji, G. Liu, C.J. D’Arienzo, T. V Olah, M.E. Arnold, What is next for dried blood spots?,
Bioanalysis. 4 (2012) 2059–65. doi:10.4155/bio.12.168.
[19] R. Verplaetse, J. Henion, Hematocrit-Independent Quantitation of Stimulants in Dried
Blood Spots: Pipet versus Microfluidic-Based Volumetric Sampling Coupled with
Automated Flow-Through Desorption and Online Solid Phase Extraction-LC-MS/MS
Bioanalysis, Anal. Chem. 88 (2016) 6789–6796. doi:10.1021/acs.analchem.6b01190.
[20] P. Abu-Rabie, P. Denniff, N. Spooner, B.Z. Chowdhry, F.S. Pullen, Investigation of different
approaches to incorporating internal standard in DBS quantitative bioanalytical
workflows and their effect on nullifying hematocrit-based assay bias, Anal. Chem. 87
(2015) 4996–5003. doi:10.1021/acs.analchem.5b00908.
[21] P. Abu-Rabie, N. Spooner, B.Z. Chowdhry, F.S. Pullen, Optimization of an automated IS
addition system for use in high-throughput quantitative DBS analysis, Bioanalysis. 7
(2015) 2763–2775. doi:10.4155/bio.15.196.
[22] P.M.M. De Kesel, W.E. Lambert, C.P. Stove, Does volumetric absorptive microsampling
eliminate the hematocrit bias for caffeine and paraxanthine in dried blood samples? A
comparative study, Anal. Chim. Acta. 881 (2015) 65–73. doi:10.1016/j.aca.2015.04.056.
Page 26
26
[23] N. Spooner, P. Denniff, L. Michielsen, R. De Vries, Q.C. Ji, M.E. Arnold, K. Woods, E.J.
Woolf, Y. Xu, V. Boutet, P. Zane, S. Kushon, J.B. Rudge, A device for dried blood
microsampling in quantitative bioanalysis: overcoming the issues associated blood
hematocrit, Bioanalysis. 7 (2015) 653–659. doi:10.4155/bio.14.310.
[24] N. Reyes-Garcés, B. Bojko, J. Pawliszyn, High throughput quantification of prohibited
substances in plasma using thin film solid phase microextraction, J. Chromatogr. A. 1374
(2014) 40–49. doi:10.1016/j.chroma.2014.11.047.
[25] N. Reyes-Garcés, B. Bojko, D. Hein, J. Pawliszyn, Solid Phase Microextraction Devices
Prepared on Plastic Support as Potential Single-Use Samplers for Bioanalytical
Applications, Anal. Chem. 87 (2015) 9722–9730. doi:10.1021/acs.analchem.5b01849.
[26] G.A. Gómez-Ríos, J. Pawliszyn, Development of coated blade spray ionization mass
spectrometry for the quantitation of target analytes present in complex matrices.,
Angew. Chem. Int. Ed. Engl. 53 (2014) 14503–7. doi:10.1002/anie.201407057.
[27] G.A. Gómez-Ríos, N. Reyes-Garcés, B. Bojko, J. Pawliszyn, Biocompatible Solid-Phase
Microextraction Nanoelectrospray Ionization: An Unexploited Tool in Bioanalysis, Anal.
Chem. 88 (2016) 1259–1265. doi:10.1021/acs.analchem.5b03668.
[28] H. Piri-Moghadam, F. Ahmadi, G.A. Gómez-Ríos, E. Boyaci, N. Reyes-Garcés, A.
Aghakhani, B. Bojko, J. Pawliszyn, Fast Quantitation of Target Analytes in Small Volumes
of Complex Samples by Matrix-Compatible Solid-Phase Microextraction Devices, Angew.
Chemie - Int. Ed. 55 (2016) 7510–7514. doi:10.1002/anie.201601476.
Page 27
27
[29] J. Chung, I. De Lannoy, B. Gien, D. Vuckovic, Y. Yang, B. Bojko, J. Pawliszyn, Semi-
automated in vivo solid-phase microextraction sampling and the diffusion-based
interface calibration model to determine the pharmacokinetics of methoxyfenoterol and
fenoterol in rats, Anal. Chim. Acta. 742 (2012) 37–44. doi:10.1016/j.aca.2012.01.034.
[30] D. Vuckovic, S. Risticevic, J. Pawliszyn, In vivo solid-phase microextraction in
metabolomics: opportunities for the direct investigation of biological systems., Angew.
Chem. Int. Ed. Engl. 50 (2011) 5618–28. doi:10.1002/anie.201006896.
[31] D. Vuckovic, I. de Lannoy, B. Gien, R.E. Shirey, L.M. Sidisky, S. Dutta, J. Pawliszyn, In vivo
solid-phase microextraction: capturing the elusive portion of metabolome., Angew.
Chem. Int. Ed. Engl. 50 (2011) 5344–8. doi:10.1002/anie.201006715.
[32] D. Vuckovic, I. De Lannoy, B. Gien, Y. Yang, F.M. Musteata, R. Shirey, L. Sidisky, J.
Pawliszyn, In vivo solid-phase microextraction for single rodent pharmacokinetics studies
of carbamazepine and carbamazepine-10,11-epoxide in mice., J. Chromatogr. A. 1218
(2011) 3367–3375. doi:10.1016/j.chroma.2010.07.060.
[33] X. Zhang, A. Es-Haghi, J. Cai, J. Pawliszyn, Simplified kinetic calibration of solid-phase
microextraction for in vivo pharmacokinetics., J. Chromatogr. A. 1216 (2009) 7664–9.
doi:10.1016/j.chroma.2009.09.021.
[34] F.M. Musteata, I. de Lannoy, B. Gien, J. Pawliszyn, Blood sampling without blood draws
for in vivo pharmacokinetic studies in rats., J. Pharm. Biomed. Anal. 47 (2008) 907–12.
doi:10.1016/j.jpba.2008.03.028.
Page 28
28
[35] X. Zhang, A. Es-haghi, F.M. Musteata, G. Ouyang, J. Pawliszyn, Quantitative in vivo
microsampling for pharmacokinetic studies based on an integrated solid-phase
microextraction system, Anal. Chem. 79 (2007) 4507–4513. doi:10.1021/ac070177c.
[36] F.M. Musteata, M.L. Musteata, J. Pawliszyn, Fast in vivo microextraction: A new tool for
clinical analysis, Clin. Chem. 52 (2006) 708–715. doi:10.1373/clinchem.2005.064758.
[37] B. Bojko, E. Cudjoe, G. a Gómez-Ríos, K. Gorynski, R. Jiang, N. Reyes-Garcés, S. Risticevic,
É. a S. Silva, O. Togunde, D. Vuckovic, J. Pawliszyn, SPME--quo vadis?, Anal. Chim. Acta.
750 (2012) 132–51. doi:10.1016/j.aca.2012.06.052.
[38] P.H. Hinderling, Red blood cells: a neglected compartment in pharmacokinetics and
pharmacodynamics., Pharmacol. Rev. 49 (1997) 279–295.
file:///Users/Aniradha/Desktop/Dropbox/Papers2/Library.papers3/Files/2C/2C76C202-
E9DF-4726-A8D5-E3499CC2D344.pdf%5Cnpapers3://publication/uuid/000db765-aa91-
415b-a07d-47bc09a39c86.
[39] M.L. Musteata, F.M. Musteata, J. Pawliszyn, Biocompatible solid-phase microextraction
coatings based on polyacrylonitrile and solid-phase extraction phases., Anal. Chem. 79
(2007) 6903–6911.
[40] A. Tan, S. Gagné, I.A. Lévesque, S. Lachance, N. Boudreau, A. Lévesque, Impact of
hemolysis during sample collection: How different is drug concentration in hemolyzed
plasma from that of normal plasma?, J. Chromatogr. B. 901 (2012) 79–84.
doi:10.1016/j.jchromb.2012.06.002.
Page 29
29
[41] B.K. Matuszewski, M.L. Constanzer, C.M. Chavez-Eng, Strategies for the assessment of
matrix effect in quantitative bioanalytical methods based on HPLC-MS/MS., Anal. Chem.
75 (2003) 3019–30. http://www.ncbi.nlm.nih.gov/pubmed/12964746.
[42] M.N. Alam, L. Ricardez-Sandoval, J. Pawliszyn, Calibrant Free Sampling and Enrichment
with Solid-Phase Microextraction: Computational Simulation and Experimental
Verification, Ind. Eng. Chem. Res. 56 (2017) 3679–3686. doi:10.1021/acs.iecr.7b00131.
[43] S.S. Mohammed, M.M. Christopher, P. Mehta, A. Kedar, S. Gross, H. Derendorf, Increased
Erythrocyte and Protein Binding of Codeine in Patients with Sickle Cell Disease, J. Pharm.
Sci. 82 (1993) 1112–1117. doi:10.1002/jps.2600821109.
[44] A.R. Pries, D. Neuhaus, P. Gaehtgens, Blood viscosity in tube flow: dependence on
diameter and hematocrit., Am. J. Physiol. 263 (1992) H1770-8.
http://www.ncbi.nlm.nih.gov/pubmed/1481902 (accessed June 6, 2017).
[45] G. Skopp, L. Pötsch, M. Mauden, B. Richter, Partition coefficient, blood to plasma ratio,
protein binding and short-term stability of 11-nor-Δ9-carboxy tetrahydrocannabinol
glucuronide, Forensic Sci. Int. 126 (2002) 17–23. doi:10.1016/S0379-0738(02)00023-3.
[46] M.A. Huestis, Estimating the Time of Last Cannabis Use from Plasma 9-
Tetrahydrocannabinol and 11-nor-9-Carboxy- 9-Tetrahydrocannabinol Concentrations,
Clin. Chem. 51 (2005) 2289–2295. doi:10.1373/clinchem.2005.056838.
[47] E. Boyacı, K. Gorynski, A. Rodriguez-Lafuente, B. Bojko, J. Pawliszyn, Introduction of solid-
phase microextraction as a high-throughput sample preparation tool in laboratory
Page 30
30
analysis of prohibited substances, Anal. Chim. Acta. 809 (2014) 69–81.
http://www.sciencedirect.com/science/article/pii/S0003267013015110 (accessed
January 13, 2014).
[48] ChemSpider | Search and share chemistry, (2015).
http://www.chemspider.com/?gclid=Cj0KEQjw0tCuBRDIjJ_Mlb6zzpQBEiQAyjCoBuRuclLsj
hkbZ_HWuKBN5uhjex7TiSjf_30nthgViMwaAh1M8P8HAQ (accessed August 19, 2015).
[49] DrugBank, (n.d.). http://www.drugbank.ca/ (accessed July 6, 2014).
[50] R.S. Obach, F. Lombardo, N.J. Waters, Trend analysis of a database of intravenous
pharmacokinetic parameters in humans for 670 drug compounds, Drug Metab. Dispos.
36 (2008) 1385–1405. doi:10.1124/dmd.108.020479.
[51] I. Yamamoto, K. Iwata, M. Nakashima, Pharmacokinetics of plasma and urine clenbuterol
in man, rat, and rabbit., J. Pharmacobiodyn. 8 (1985) 385–91.
http://www.ncbi.nlm.nih.gov/pubmed/4045696 (accessed May 23, 2017).
Page 31
31
Table 1. Model compounds with their corresponding physicochemical properties and MS/MS detection parameters. Analytes are listed in order of hydrophobicity.
Compound SRM transition
Collision energy, S-lenses
Structure (molecular weight, MW) logP[48] Plasma protein
binding, %[49]
Nikethamide 179.10 108.10
18, 76 MW: 178.23
0.33 NA
Salbutamol 240.14 148.10
18, 59
MW: 239.31
0.64 8[50]
Codeine 300.11 165.10
64, 104
MW: 299.36
1.19 7 – 25
Metoprolol 268.14 116.15
18, 94 MW: 267.36
1.88 12
Methamphetamine 150.11 91.12
19, 45 MW: 149.24
2.07 10 – 20
Clenbuterol 277.068 203.049
15, 70 MW: 276.08
2.61 89 - 98[51]
Exemestane 297.173 121.118
19, 72
MW: 296.18
3.11 90
Page 32
32
Propranolol 260.12 116.14
17, 89 MW: 259.16
3.48 > 90
Stanozolol 329.229 81.108
44, 130
MW: 328.25
4.42 NA
THCCOOH 345.153 299.27
18, 90
MW: 344.45
6.36 92.0 ± 8.7[45]
NA= not available
Page 33
33
Table 2. Slopes of the calibration curves constructed using blood samples with different Hct levels spiked with drugs at concentrations in the range between 5 and 100 ng mL-1 (no internal standard).
Compound (case) Slopes (n=4)a (average ± standard deviation)
MM-F, 400 rpm HLB-D, 1500 rpm
20 % Hct 45 % Hct 70 % Hct RSD % b F c 20 % Hct 45 % Hct 70 % Hct RSD % b F c
Salbutamol (I) 0.018 ± 0.003 0.016 ±0.006 0.017 ± 0.004 4.0 0.090 0.25 ± 0.02 0.24 ± 0.04 0.23 ± 0.02 3.0 0.230
Nikethamide (I) 0.042 ± 0.004 0.044 ± 0.004 0.039 ± 0.004 6.6 0.017 0.71 ± 0.06 0.73 ± 0.11 0.75 ± 0.06 3.0 0.238
Methamphetamine (I) 0.058 ± 0.005 0.053 ± 0.009 0.048 ± 0.003 9.5 2.865 0.55 ±0.04 0.54 ± 0.07 0.54 ± 0.04 1.0 0.022
Codeine (I) 0.034 ± 0.002 0.030 ± 0.004 0.029 ± 0.002 8.0 3.090 0.69 ±0.06 0.69 ± 0.05 0.69 ± 0.07 0.1 3.41e-4
Propranolol (II) 0.047 ± 0.002 0.036 ± 0.003 0.027 ± 0.003 26.0 61.138 0.56 ± 0.05 0.57 ± 0.06 0.58 ± 0.04 2.0 0.232
Metoprolol (II) 0.077 ± 0.008 0.064 ± 0.008 0.053 ± 0.006 19.0 11.108 0.83 ± 0.08 0.85 ± 0.10 0.88 ± 0.08 3.0 0.243
Clenbuterol (II) 0.072 ± 0.004 0.059 ± 0.005 0.045 ± 0.004 14.0 36.232 0.69 ± 0.04 0.70 ± 0.04 0.73 ± 0.05 3.0 1.031
Exemestane (III) 0.034 ± 0.005 0.023 ± 0.001 0.013 ± 0.003 45.0 37.719 0.31 ± 0.05 0.28 ± 0.03 0.21 ± 0.03 20.0 7.597
THCCOOH (IV)d 0.010 ± 0.002 0.011 ± 0.001 0.012 ± 0.001 9.6 1.370 0.026 ± 0.001 0.032 ± 0.006 0.036 ± 0.002 16.2 8.851
Stanozolol (IV) 0.040 ± 0.006 0.036 ±0.003 0.034 ±0.004 7.7 1.539 0.047 ±0.004 0.053 ±0.006 0.066 ±0.007 18.0 11.865
a Average slopes calculated from the equation y=mx+b, where y is the amount extracted in ng and x is the concentration spiked in blood.
b inter-slope RSD estimated from the values obtained for each Hct level.
c F crit = 4.256 (α=0.05), if F > F crit the null hypothesis that the three slopes are equal is rejected (one-way ANOVA).
dThe lowest concentration level was 25 ng mL-1.
Page 34
34
Table 3. Corrected calibration curve slopes for those cases where F>Fcrit.
Compound (internal standard)
Slopes (n=4)a (average ± standard deviation)
20 % Hct 45 % Hct 70 % Hct RSD % Fb
Propranolol, MM-F (Methadone-d3) 0.018 ± 0.002 0.019 ± 0.001 0.017 ± 0.001 5.4 2.538
Metoprolol, MM-F (Methadone-d3) 0.0053 ± 0.0002 0.0054 ± 0.0002 0.0055 ± 0.0003 1.2 0.331
Clenbuterol, MM-F (Methadone-d3) 0.024 ± 0.001 0.024 ± 0.001 0.023 ± 0.001 3.1 3.058
THCCOOHb, HLB-D (THCCOOH-d3) 0.011 ± 0.001 0.011 ± 0.001 0.012 ± 0.001 5.8 3.872
Stanozolol, HLB-D (THCCOOH-d3)
0.41 ± 0.06 0.42 ± 0.02 0.46 ± 0.03 5.9 1.653
a Average slopes calculated from the equation y=mx+b, where y is the ratio area analyte/area internal standard and x is the concentration spiked in blood.
b F crit = 4.256 (α=0.05), if F > F crit the null hypothesis that the three slopes are equal is rejected (one-way ANOVA).
cThe lowest concentration level was 25 ng mL-1.
Page 35
35
Figures captions
Figure 1. Extraction time profiles obtained at different experimental conditions for four representative analytes: salbutamol (a and b), propranolol (c and d), exemestane (e and f), THCCOOH (g and h). Plots on the left side summarize results for MM-F at 400 rpm, and plots on the right side summarize results for HLB-D at 1500 rpm.
Figure 2. Relative recoveries obtained after extracting from 70% Hct blood samples (hemolyzed vs. non-hemolyzed) spiked at 100 ng mL-1. These experiments were conducted using HLB-D at 1500 rpm and an extraction time of 90 min.
Figure 3. Absolute matrix effects assessed in 70% Hct blood samples (hemolyzed and non-hemolyzed). Extracts from blank blood samples obtained with HLB-D (90 min extraction at 1500 rpm) were spiked with the model compounds at 50 ng mL-1, and their response was compared with the one from standards spiked in neat solvent at the same concentration level. Acceptable absolute matrix effect range is represented in dotted lines (80 to 120%).
Page 36
36
Figure 1
0.0
0.5
1.0
1.5
2.0
2.5
3.0
3.5
0 50 100 150 200
Amou
nt e
xtra
cted
, ng
Extraction time, min20% Hct 45% Hct 70% Hct
0
5
10
15
20
25
30
35
0 50 100 150 200
Amou
nt e
xtra
cted
, ng
Extraction time, min
20% Hct 45% Hct 70% Hct
0.0
1.0
2.0
3.0
4.0
5.0
6.0
7.0
8.0
0 50 100 150 200
Amou
nt e
xtra
cted
, ng
Extraction time, min20% Hct 45% Hct 70% Hct
05
101520253035404550
0 50 100 150 200
Amou
nt e
xtra
cted
, ng
Extraction time, min20% Hct 45% Hct 70% Hct
0.0
1.0
2.0
3.0
4.0
5.0
6.0
7.0
0 50 100 150 200
Amou
nt e
xtra
cted
, ng
Extraction time, min20% Hct 45% Hct 70% Hct
0
5
10
15
20
25
30
35
0 50 100 150 200
Amou
nt e
xtra
cted
, ng
Extraction time, min20% Hct 45% Hct 70% Hct
0.0
0.2
0.4
0.6
0.8
1.0
0 50 100 150 200
Amou
nt e
xtra
cted
, ng
Extraction time, min20% Hct 45% Hct 70% Hct
0.00.51.01.52.02.53.03.54.04.55.0
0 50 100 150 200
Amou
nt e
xtra
cted
, ng
Extraction time, min
20% Hct 45% Hct 70% Hct
A B
C D
E F
G H
Page 37
37
Figure 2
020406080
100120140160180
Rela
tive
reco
verie
s, %
70 % HCt blood 70 % HCt blood - hemolysis
Page 38
38
Figure 3
0
20
40
60
80
100
120
140
Abso
lute
mat
rix e
ffect
s, %
70% Hct blood 70% Hct blood - hemolysis
Page 39
39
Graphical abstract
Whole blood
Bioc
ompa
tibl
e SP
ME
0
1
2
3
4
5
6
0 20 40 60 80 100 120
Amou
nt e
xtra
cted
, ng
Concentration spiked in blood, ppb
20 % Hct
45 % Hct
70 % Hct
0
50
100
150
200
250
300
350
400
0 20 40 60 80 100 120
Ratio
A/A
is
Concentration spiked in blood, ppb
20 % Hct
45 % Hct
70 % Hct
No IS
With IS
Fibre core SPME coating
Boundary layer Whole blood
Kfs
DAs
krp
kfp
kfc krc
Analyte
DAPs
kfp krp
DPs


![NATHALY TUITHOF › node › 7317 › pdf › book.pdf · NATHALY TUITHOF Height: 168 cm [5' 51"] B/W/H: 94 77 93 [37" 30" 37"] Size: 38 Shoes: 38 Hair: brown Eyes: green](https://static.documents.pub/doc/80x56/5f1e3a306106b7523625d901/nathaly-tuithof-a-node-a-7317-a-pdf-a-bookpdf-nathaly-tuithof-height.jpg)


![ars.els-cdn.com · Web view[48] E. Cudjoe, J. Pawliszyn, Optimization of solid phase microextraction coatings for liquid chromatography mass spectrometry determination of neurotransmitters,](https://static.documents.pub/doc/80x56/5fe9031f6990715df873f5ec/arsels-cdncom-web-view-48-e-cudjoe-j-pawliszyn-optimization-of-solid-phase.jpg)


