Page 1
National Aeronautics and
Space Administration
www.nasa.gov
ARSETApplied Remote Sensing Traininghttp://arset.gsfc.nasa.gov
@NASAARSET
Introduction to Remote Sensing for Disaster Management
Instructors:
• Tim Stough (ARSET, [email protected] )
• Maggi Glasscoe (Guest Speaker, [email protected] )
Week 1
Page 2
National Aeronautics and Space Administration Applied Remote Sensing Training Program 2
Course Structure
• One session per week on June 9, 16, 23, and 30, 2016
– 11 a.m. – 12 p.m. EDT (UTC-4)
– 6 p.m. – 7 p.m. EDT (UTC-4)
• Each session may include
– Presentation
– A homework assignment
• Q&A following each session or by email to Tim Stough ([email protected] ) or
Amita Mehta ([email protected] )
Page 3
National Aeronautics and Space Administration Applied Remote Sensing Training Program 3
Prerequisite
http://arset.gsfc.nasa.gov/webinars/fundam
entals-remote-sensing
• Session 1: Fundamentals of Remote
Sensing
– A general overview of remote sensing
and its application to disasters, health &
air quality, land, water resource, and
wildfire management
Fundamentals of Remote Sensing: Session 1
Page 4
National Aeronautics and Space Administration Applied Remote Sensing Training Program 4
Course Material
Webinar presentations, exercises, homework assignments, and recordings
http://arset.gsfc.nasa.gov/disasters/webinars/disaster-overview-2016
Links will be available on the
ARSET course page
Page 5
National Aeronautics and Space Administration Applied Remote Sensing Training Program 5
Homework and Certificate
• Homework
– Hands-on exercises
– Answers to homework questions via Google form
– Available at https://arset.gsfc.nasa.gov/disasters/webinars/disaster-overview-2016
• Certificate of Completion
– Attend all 4 webinar sessions
– Complete all homework assignments
– Certificates will be emailed approximately 2 months after the course finishes by
Marines Martins ([email protected] )
Page 6
National Aeronautics and Space Administration Applied Remote Sensing Training Program 6
Course Objectives
• Participants will become aware of
available NASA resources for disaster
management
• Participants will learn to access remote
sensing observations for local disaster
events
GeoGateway interface showing Napa earthquake interferogram with
Line of Sight profile across the main rupture.
Page 7
National Aeronautics and Space Administration Applied Remote Sensing Training Program 7
Course Outline
Week 1: Monitoring Earthquakes, and Tsunamis
Using NASA Remote Sensing and Models
Week 2: Overview of Remote Sensing for
Wildfire Applications
Week 3: Observation of Oil Spills Using Remote
Sensing Measurements
Week 4: Monitoring Storms, Flooding, and
Landslides Using Remote Sensing Observations
Page 8
National Aeronautics and Space Administration Applied Remote Sensing Training Program 8
Agenda: Week 1
• Monitoring Volcanoes and Volcanic Ash
– Pre-Eruption Monitoring
– SAR-VIEWS
– Volcanic Ash
– Remote Sensing Resources
• Monitoring Earthquakes, and Tsunamis
– How do we respond to earthquakes?
– Remote Sensing Techniques to Monitor Earthquakes
– Remote Sensing Techniques to Monitor Tsunamis
Page 9
Part 1: Monitoring Volcanoes and Volcanic
Ash using NASA Remote Sensing
Page 10
National Aeronautics and Space Administration Applied Remote Sensing Training Program 10
• Deformation
– Interferometric Synthetic Aperture
Radar (InSAR)
– Global Navigation Satellite
System stations (GNSS, GPS,
GLONASS)
– Tilt meters
• Seismic Activity
Pre-Eruption Monitoring
Descending (150609-150727)
Cosmo-SkyMed InSAR – processed by Dr. Falk Amelung, University of Miami
Cotopaxi Volcano 2015
Page 11
National Aeronautics and Space Administration Applied Remote Sensing Training Program 11
Cotopaxi Unrest and Steam Eruption, August, 2015Analysis by Dr. Falk Amelung, University of Miami
InSAR based analysis allows inflation to be monitored without ground based sensors
Page 12
National Aeronautics and Space Administration Applied Remote Sensing Training Program 12
SAR-VIEWS: SAR Volcano Integrated Early Warning System
Okmok Eruption, July, 2008
University of Alaska Fairbanks, Dr. Franz Meyer
Eruptive Period
20/06/08 30/06/08 10/07/08 20/07/08 30/07/08 9/08/08 19/08/08
Jul 12, 20:00 – Start of eruption
Page 13
National Aeronautics and Space Administration Applied Remote Sensing Training Program 13
SAR-Views: SAR Volcano Integrated Early Warning System
Okmok Eruption, July, 2008
University of Alaska Fairbanks, Dr. Franz Meyer
Eruptive Period
20/06/08 30/06/08 10/07/08 20/07/08 30/07/08 9/08/08 19/08/08
Jun 12, 20:20 – First thermal
signal in remote sensing data
Jul 12, 20:00 – Start of eruption
Page 14
National Aeronautics and Space Administration Applied Remote Sensing Training Program 14
SAR-VIEWS: SAR Volcano Integrated Early Warning System
Okmok Eruption, July, 2008
University of Alaska Fairbanks, Dr. Franz Meyer
Eruptive Period
20/06/08 30/06/08 10/07/08 20/07/08 30/07/08 9/08/08 19/08/08
Jun 12, 20:20 – First thermal
signal in remote sensing data
Jul 12, 20:00 – Start of eruption
Jun 12, 19:40 – First seismic signals (only 20min before)
Page 15
National Aeronautics and Space Administration Applied Remote Sensing Training Program 15
SAR-VIEWS: SAR Volcano Integrated Early Warning System
Okmok Eruption, July, 2008
University of Alaska Fairbanks, Dr. Franz Meyer
Eruptive Period
20/06/08 30/06/08 10/07/08 20/07/08 30/07/08 9/08/08 19/08/08
Jun 12, 20:20 – First thermal
signal in remote sensing data
Jul 12, 20:00 – Start of eruption
Jun 12, 19:40 – First seismic signals (only 20min before)
Automatic SAR product shows
deformation ~25 days before eruption
19-Jun-2008
∆t = 350 days
Page 16
National Aeronautics and Space Administration Applied Remote Sensing Training Program 16
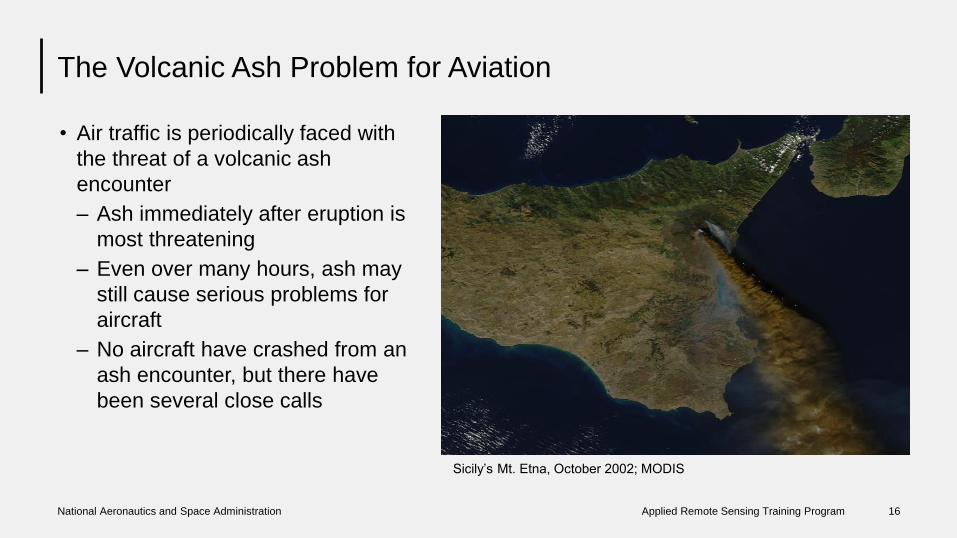
• Air traffic is periodically faced with
the threat of a volcanic ash
encounter
– Ash immediately after eruption is
most threatening
– Even over many hours, ash may
still cause serious problems for
aircraft
– No aircraft have crashed from an
ash encounter, but there have
been several close calls
Sicily’s Mt. Etna, October 2002; MODIS
The Volcanic Ash Problem for Aviation
Page 17
National Aeronautics and Space Administration Applied Remote Sensing Training Program 17
Detecting Volcanic Ash with Remote Sensing
Eyjafjallajökull Volcano, April 17, 2010
• Satellite imagers typically provide
the best source of information about
ash location
• This visible light image is the sort
that typically comes to mind
Eyjafjallajökull, April 2010; MODIS
Page 18
National Aeronautics and Space Administration Applied Remote Sensing Training Program 18
Multi-Spectral Imaging
Making Full Use of Space-Based Imagers for Volcanic Cloud Monitoring
NOAA and MetOp AVHRR Terra and Aqua MODIS SNPP-VIIRS
GOES-13-15 MTSAT-(1r and 2)
LE
OG
EO
Met-(8,9,10) SEVIRI
Courtesy UW NOAA CIMSS, Madison WI
Page 19
National Aeronautics and Space Administration Applied Remote Sensing Training Program 19
Aura/OMI SO2 Data
NOAA/NESDIS Volcanic Alert System: www.ospo.noaa.gov/Products/atmosphere/vaac/
Page 20
National Aeronautics and Space Administration Applied Remote Sensing Training Program 20
The European Support Aviation Control
Service (SACS) uses operational volcanic
SO2 column and Ash Index data from
• Aura/OMI
• SNPP/OMPS
• Aqua/AIRS
AIRS, OMI, OMPS SO2 Data
European SACS Volcanic Alert System: http://sacs.aeronomie.be/
Page 21
National Aeronautics and Space Administration Applied Remote Sensing Training Program 21
• High vertical resolution (60m) of
backscatter profiles
• Optical parameters provide unique
capability to detect volcanic ash and its
vertical structure
• Operating since 2006 in a polar orbit
• Equatorial crossing-time at 0130 and
1330 LET
• Repeat cycle of 16 days
CALIOP – the CALIPSO Lidar
NASA
NASA/LaRC, BATC; eoPortal
Page 22
National Aeronautics and Space Administration Applied Remote Sensing Training Program 22
Enhanced Characterization
Assimilating Series of CALIPSO Curtains Into Dispersion Forecast Models
Ensemble of trajectories
Volcanic ash cloud
NASA
Page 23
National Aeronautics and Space Administration Applied Remote Sensing Training Program 23
Multi-angle Imaging SpectroRadiometer (MISR)
Adding Stereo-Derived Plume Heights
km0
2
4
6
0~1.1 km
spatial
resolution
curtain has
limited utility
5
4
3
2
1
0km
Plume 1
Plume 2
Hei
gh
t: B
lue
= W
ind
-co
rrec
ted
R. Kahn, D. Nelson, and the MISR Team, NASA JPL and GSFC
Page 24
National Aeronautics and Space Administration Applied Remote Sensing Training Program 24
NASA Remote Sensing for Volcanic Ash Resources
• MODIS
– Near Real-Time Data:
https://worldview.earthdata.nasa.gov
• ASTER
– Land Processes DAAC:
https://lpdaac.usgs.gov/data_access
– Using ASTER for Volcano Monitoring:
https://www.youtube.com/watch?v=A39FnHdSo
Nk
• CALIPSO Lidar Curtains
– https://eosweb.larc.nasa.gov/project/calipso/cal
ipso_table
• MISR Plume Height Project 2
– https://www-
misr.jpl.nasa.gov/getData/accessData/MisrMinx
Plumes2/
• Aura, OMI, OMPS SO2 Data
– NOAA/NESDIS volcanic alert system website:
http://satepsanone.nesdis.noaa.gov/pub/OMI/O
MISO2/
– Global Sulfur Dioxide Monitoring Home Page –
NASA Goddard: http://so2.gsfc.nasa.gov
• The European Support Aviation Control
Service (SACS)
– http://sacs.aeronomie.be
Page 25
Part 2: Monitoring Earthquakes, and Tsunamis
Using NASA Remote Sensing and Models
Page 26
National Aeronautics and Space Administration Applied Remote Sensing Training Program 26
Monitoring Earthquakes and Tsunamis
Talk Outline
• Introduction
• How do we respond to earthquakes?
• Remote Sensing Techniques to Monitor Earthquakes
– 2014 Napa, CA
– 2015 Gorkha, Nepal
• Remote Sensing Techniques to Monitor Tsunamis
– 2011 Northeast Japan Earthquake
• Conclusions
Maggi Glasscoe
Page 28
National Aeronautics and Space Administration Applied Remote Sensing Training Program 28
• Annualized losses from earthquakes in
the United States are $5.3B (FEMA,
2008)
• From 2000 – 2009, earthquakes killed
more people globally than other natural
disasters (OFDA/CRED 2009)
• From 1980 – 2009 6 of the 7 natural
disasters with the largest economic
impact were earthquakes (OFDA/CRED,
2009)
• In the 21st century earthquakes are
expected to kill 1.9 – 3.2 million people
globally (Holzer and Savage, 2013)
Damaging earthquakes are concentrated near coastal areas. Here two
decades of potentially damaging earthquakes are displayed over East
Asia and the Pacific, colored by depth. (Data are from the Advanced
National Seismic System, Glasscoe, et al. 2016, Decadal Survey White
Paper #2).
Introduction
Earthquake and tsunami risk
Page 29
National Aeronautics and Space Administration Applied Remote Sensing Training Program 29
Introduction
Earthquake and tsunami risk
• 2004 Indian Ocean Tsunami
– Reached heights of 65-100 ft in Sumatra
– Caused 200,000+ deaths across 11 countries
– Registered on tide gauges globally
• 1964 Alaska Tsunami– Resulted in 110 deaths
• 1918 Earthquake & Tsunami– Killed 118 people in Puerto Rico alone
• 1700 Pacific Tsunami– Overran Native American fishing camps
– Caused damage in Japan
(USGS fact sheet, 2006-3023)Global tsunami source zones highlighted by color. Source: ITIC, http://itic.ioc-unesco.org/index.php?option=com_content&view=category&id=1166&Itemid=1166
Page 30
National Aeronautics and Space Administration Applied Remote Sensing Training Program 30
• Faults are made up of a central core surrounded by a damage zone
• Earthquakes occur when stress builds on the fault lines and then it falls
• Ground shaking and displacement
– lead to injury & loss of life
– cause damage to infrastructure, homes, and injury
• Tsunamis occur when the seafloor is displaced by an underwater earthquake or landslide
– generates waves that grow when they reach shore
(Top): Artwork Chuck Carter, JPL; Donnellan, et al., Decadal Survey White
Paper #2. (Bottom) Surviving a Tsunami – Lessons from Chile, Hawaii, and
Japan, USGS
Introduction
Earthquake and tsunami mechanism
Page 31
How do we respond to earthquakes/tsunamis?
Page 32
National Aeronautics and Space Administration Applied Remote Sensing Training Program 32
• Researchers gather information
from various sources, including
satellites
• The International Charter may
be invoked in order to target
space-borne assets for disaster
response
Scenes from Banda Aceh, nearly 3 km from the coast, following a tsunami. Dec
26, 2004. Credit: Where the first wave arrives in minutes, UNESCO, 2010.
When an earthquake/tsunami occurs
How do we respond?
Page 33
National Aeronautics and Space Administration Applied Remote Sensing Training Program 33
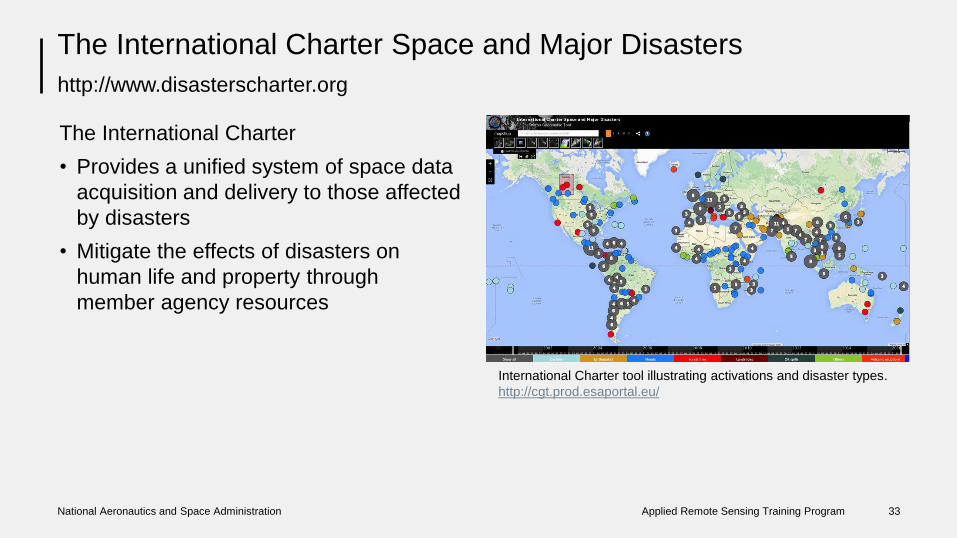
The International Charter
• Provides a unified system of space data
acquisition and delivery to those affected
by disasters
• Mitigate the effects of disasters on
human life and property through
member agency resources
International Charter tool illustrating activations and disaster types.
http://cgt.prod.esaportal.eu/
The International Charter Space and Major Disasters
http://www.disasterscharter.org
Page 34
Remote Sensing Observations for Monitoring
Earthquakes
Page 35
National Aeronautics and Space Administration Applied Remote Sensing Training Program 35
• Radar is very useful for studying Earth
processes
• Repeat visit allows creation of a
landscape change image
• High definition:
– 7m pixel size (UAVSAR)
– 10m pixel size (Satellite)
• Sensitive: sees 1cm surface fault slip
• NASA instruments:
– UAVSAR airborne
– Planned NISAR satellite
Left: satellite for the NASA-ISRO SAR
Mission (NISAR)
Below: Uninhabited Aerial Vehicle
Synthetic Aperture Radar (UAVSAR)
Synthetic Aperture Radar (SAR)
http://uavsar.jpl.nasa.gov; http://nisar.jpl.nasa.gov
NISAR
Page 36
National Aeronautics and Space Administration Applied Remote Sensing Training Program 36
• Magnitude 6.0 earthquake: Aug 25, 2014
• Strongest to occur in San Francisco Bay
Area since 1989
• NASA data aided in response & analysis
• UAVSAR instrument flew a week before
and in subsequent months
Above: A comparison of UAVSAR data collected May 29, 2014 and Aug 29,
2014, revealing that multiple strands of the fault slipped near the quake’s center.
Credit: NASA/JPL-Caltech/ASI/Google Earth; Left: Automated image processing
identifying fractures in UAVSAR images to be validated in the field.
Uninhabited Aerial Vehicle Synthetic Aperture Radar (UAVSAR)
2014 Napa Earthquake Response
Page 37
National Aeronautics and Space Administration Applied Remote Sensing Training Program 37
• Produced an Interferometric Synthetic Aperture Radar
(InSAR) map of coseismic displacement
• Derived from COSMO-SkyMed data
• Produced a Damage Proxy Map (DPM)
• Technique uses a prototype algorithm for detecting
surface changes
Advanced Rapid Imaging and Analysis (ARIA)
http://aria.jpl.nasa.gov
Right: InSAR image of ground
deformation resulting from the Napa
earthquake. Credit: NASA/JPL-
Caltech/ASI/Google Earth
Left: DPM showing potential earthquake
damage. Credit: NASA/JPL-
Caltech/ASI/Google Earth
Page 38
National Aeronautics and Space Administration Applied Remote Sensing Training Program 38
• Allows users to find and use NASA
geodetic imaging data products for
analysis of deformation pre- and post-
event
• Users can access and analyze UAVSAR
repeat pass interferometry (RPI)
products
• California faults can be displayed over
UAVSAR RPI products
• Can extract line of site profiles
• Convention shows “ground range
change”
GeoGateway interface showing Napa earthquake interferogram with
Line of Sight profile across the main rupture.
Geodetic Data Exploration (GEOGateway)
http://geo-gateway.org
Page 39
National Aeronautics and Space Administration Applied Remote Sensing Training Program 39
• April 25, 2015, aftershock May 12
• 8 million people affected
• 8,700 deaths
– Including ~150 in May 12 aftershock
• 22,000 people injured
• 505,000+ homes destroyed
– 279,000+ homes damaged
• Estimated 40% of Nepal affected
– 39/75 districts reporting damage
• NASA and partners developed products using optical & radar satellites to support analysis and assessment efforts
2015 M7.8 Gorkha, Nepal, Earthquake Response
http://weather.msfc.nasa.gov/sport/disasters/nepal/
Page 40
National Aeronautics and Space Administration Applied Remote Sensing Training Program 40
• Analyzed interferometric SAR images
from Copernicus Sentinel-1A
• False-color map shows permanent
surface movement
• Produced a Damage Proxy Map
– Uses X-band interferometric SAR
data from ASI’s COSMO-SkyMed
• Uses a prototype algorithm to detect
surface changes
• Color variations (yellow-red) indicate
significant ground surface change
• DPMs can be field verified
2015 Nepal Earthquake Response (ARIA)
http://aria.jpl.nasa.gov
Clockwise (top left):
InSAR deformation
map, Damage Proxy
Map, Perspective
Damage Proxy Map
with field validation (for
more information see
http://aria.jpl.nasa.gov/n
ode/43)
Page 41
National Aeronautics and Space Administration Applied Remote Sensing Training Program 41
• Transition unique observations and
research capabilities to operational
weather community
• Produced as an experimental image
showing a decrease in emitted light
• Derived from comparing pre- and post-
earthquake imagery
• Warm colors indicate largest reduced
light emissions; purple indicates clouds
• This can help relief operations determine
areas that may be affected by electrical
outages
Short-Term Prediction Research and Transition (SPoRT)
http://weather.msfc.nasa.gov/sport
Image Credit: NASA SPoRT, MSFC
Page 42
National Aeronautics and Space Administration Applied Remote Sensing Training Program 42
• First obtained April 30
• Acquired first (mostly) cloud-free image of
Langtang Valley
• Scientists analyzed imagery and compared with
pre-earthquake imagery
• Part of Langtang village was completely buried
– Eastern part appears to have been destroyed
by pressure wave from related avalanche
• Large landslides or avalanches affected other
villages
• Extend of damage will require further
investigation using higher-res imageryImage Credit: USGS/NASA
Landsat 8 Images of Earthquake-induced Ground Failure
http://landsat.gsfc.nasa.gov
Page 43
Remote Sensing Observations for Monitoring
Tsunamis
Page 44
National Aeronautics and Space Administration Applied Remote Sensing Training Program 44
• Largest earthquake in Japan’s modern history
– 4th largest recorded in the world
• Japan Meteorological Agency and NOAA reported max tsunami heights:
– Iwate Prefecture: 38.9m
– Kamaishi: 4.1m
– Soma: 7.3 m
– Oarai: 4.2 m
• Max tsunami inundation distance of 7.9 km inland
• 15,800+ deaths
– 6,000+ injured
– 228,000+ displaced
• 127,000+ buildings collapsed
– 272,000+ ‘half collapsed’
– 747,000+ buildings partially damaged
NASA Earth Observatory with data from
USGS and ORNL
M9 Northeast Japan Earthquake and Tsunami
March 11, 2011
Page 45
National Aeronautics and Space Administration Applied Remote Sensing Training Program 45
• Emergency Data Enhanced
Cyber Infrastructure for Disaster
Evaluation (E-DECIDER)
• Provides decision support for
disaster management and
response
• Provided map data response
products as part of the
International Charter activation
Change detection product using two MODIS images to estimate tsunami
inundation extent. Credit: JPL/Indiana University
Tsunami Inundation
http://e-decider.org
Page 46
National Aeronautics and Space Administration Applied Remote Sensing Training Program 46
• International Charter also
provides access to high
resolution commercial satellite
imagery for disaster response
purposes
• E-DECIDER provided the map on
the right to the Charter and
Japanese government to assess
tsunami damage
Extent of inundation, and high resolution allows identification of damaged
buildings and bridges. Credit: Digital Globe/JPL/Indiana University.
Tsunami Inundation
http://e-decider.org
Page 47
National Aeronautics and Space Administration Applied Remote Sensing Training Program 47
• Advanced Spaceborne Thermal
Emission and Reflection Radiometer
(ASTER)
• Obtains hi-res (15-90 sq m per pixel)
– 14 different wavelengths
• Areas covered by vegetation are shown
in red
• Cities (and unvegetated areas) shown in
blue-gray
• In after image, many areas are no
longer vegetated Two ASTER images (left: March 14, 2011, right: August 2008 ) compare Northeastern coastal cities of Ofunato and Kesennuma. Image Credit: NASA/GSFC/METI/ERSDAC/JAROS
ASTER Images Showing Effects
http://asterweb.jpl.nasa.gov/
Page 48
National Aeronautics and Space Administration Applied Remote Sensing Training Program 48
• Multi-angle Imaging Spectroradiometer
• Views Earth simultaneously at 9 widely spaced angles
• Provides ongoing global coverage with accurate measures of brightness, contrast, and color of reflected sunlight
• Provides stereoscopic images
– Allows viewers to distinguish and measure height of plumes of smoke and aerosols
• During Toshoku earthquake, MISR identified oil refineries and industrial complexes on fire
MISR images show a large smoke plume that appears to be
associated either with Shiogama incident or Sendal port fires. Right
image is an anaglyph, showing the plume as an airborne feature.
Image Credit: NASA/GSFC/LaRC/JPL, MISR Team
MISR Images of Tsunami Damage
http://www-misr.jpl.nasa.gov/
Page 49
National Aeronautics and Space Administration Applied Remote Sensing Training Program 49
• GPS – using Global Navigation System
Satellites (GNSS) – can estimate tsunami
potential
• Can be used to:
– detect severity and direction after an
earthquake
– estimate tsunami wave heights within
minutes
• Figure on right uses 3 historic earthquakes to
predict resulting tsunamis
• Pink arrows are GPS displacement
measurements
GPS Modeling of Tsunami Wave Heights
http://www.gdgps.net/; http://cddis.gsfc.nasa.gov/Techniques/GNSS/GNSS_Overview.html
Image courtesy of T. Song, 2007, Geophysical Research
Letters
Page 51
National Aeronautics and Space Administration Applied Remote Sensing Training Program 51
Part 2: Monitoring Earthquakes & Tsunamis
• Earthquakes and tsunamis pose substantial risk globally
• Remote sensing techniques can be used to effectively assess the effects of
earthquakes and tsunamis
• A number of NASA and other remote sensing platforms, including UAVSAR, satellite
InSAR, MODIS, ASTER, MISR, Landsat, SPoRT, GPS and commercial optical imagery
can be used to assess and monitor effects of the disaster
• In large natural or man-made disasters, the International Charter may be invoked in
order to target space-borne assets for disaster response
Conclusions