1 October 19, 2014 National Association for Home Care & Hospice 2014 Annual Meeting Innovative Incentive Compensation Planning for Home Health Clinicians Agenda • Introduction • Compensation Planning Process • Case Study • Lessons Learned 1 0100.015\317211(pptx)-E2
Transcript
1
October 19, 2014
National Association for Home Care & Hospice2014 Annual Meeting
Innovative Incentive Compensation Planning for Home Health Clinicians
Agenda
• Introduction
• Compensation Planning Process
• Case Study
• Lessons Learned
10100.015\317211(pptx)-E2
2
IntroductionSutter Care at Home
20100.015\317211(pptx)-E2
• Leading provider of in-home care services throughout northern CA
• Operate 10 business lines in 18 counties within Sutter Health’s footprint
Home Health (skilled nursing, rehabilitation therapy, social work)
• Complete over 550,000 home health & hospice visits in patients’ homes
• Personal medical alert devices installed in over 1,000 homes
• Over 700 volunteers who provide 30,000+ hours of service annually
• Administer over 41,000 flu shots and 1,000 flu clinics
• Provide over 284 wellness clinics
Sutter Care at Home (SCAH) is part of Sutter Health, a large California health system.
IntroductionSituational Assessment
• SCAH clinicians include nurses, therapists, home health aides, social workers, and registered dietitians who conduct home visits for critically ill or recently hospitalized patients.
• All SCAH field clinicians are nonexempt employees are paid an hourly wage and overtime pay for more than 8 hours per day.
• SCAH wanted to explore options outside of the traditional home health industry compensation plan design that would:
– Include a balanced scorecard of measures, with performance incentives beyond productivity metrics.
– Align with how reimbursement is provided.
– Offer better incentives for managing the health of a population of patients.
30100.015\317211(pptx)-E2
SCAH historically paid its home health clinicians hourly, without formal incentive pay.
3
0.00
0.50
1.00
1.50
2.00
2.50
3.00
3.50
4.00
4.50
RN SN PT RD PTA OT AIDE ST MSW
40100.015\317211(pptx)-E2
IntroductionVisits Per Day
The overall average number of visits per 8-hour day was 3.03; however, this ranged across branches and disciplines.
This lagged industry standards of 5 visits per day.
Visits Per Day by Branch
Source: Productivity reports provided by Gregg Davis. Represents data for the pay period beginning March 20 and ending July 9, 2011.
Visits Per Day by Discipline
• The visits per day average ranged from 2.70 to 3.32 across the regional branches.
• The RN category had the fewest visits per day at 2.36.
• SN visits per day were also below the overall average at 2.76.
• PT visits per day were above the average at 3.51.
0.00
0.50
1.00
1.50
2.00
2.50
3.00
3.50
SA SR CO MA LA SM SF SL RS
Average
Average
IntroductionECG
50100.015\317211(pptx)-E2
• ECG is a national consulting firm focused on offering strategic, management, and financial advice exclusively to healthcare providers.
• Our clients are the nation’s leading hospitals, health systems, academic medical centers, and group practices.
• We are particularly known as experts in compensation planning, strategic hospital/provider relationships, ambulatory operations improvement, and payor contracting/reimbursement strategy.
• We have been in existence for more than 40 years and have approximately 150 consultants operating out of offices in Boston, Dallas, San Diego, San Francisco, Seattle, St. Louis, and Washington, D.C.
Since 1973, our mission has been to provide exceptional management consulting services to healthcare clients.
Boston Dallas San Diego San Francisco Seattle St. Louis Washington, D.C.
ECG Offices
4
60100.015\317211(pptx)-E2
The organizational goals determine the foundation of an incentive compensation plan.
Plan principles include the philosophical direction and clinical objectives specific to the compensation plan.
Parameters and metrics selected should support the organizational goals and align with the plan principles.
Plan Principles
Parameters and Metrics
Compensation Plan
Organizational Goals
The detailed compensation plan mechanics are the final result of the planning process.
Compensation Planning Process
Typically, the development of a compensation plan is rooted in a series of goals and principles, which ultimately manifest in specific plan metrics and design elements.
0100.015\317211(pptx)-E2
Compensation Planning ProcessBuilding Blocks
The building blocks of the compensation plan design process are outlined below.
Today’s discussion will focus on the conceptual model and incentive categories.
Conceptual Model
Standards or Incentive Categories
Metrics
Measurement Levels
Targets
• Magnitude of incentive/degree of risk• Participating clinicians
• Productivity• Quality• Patient satisfaction• Other
• Visits per day• OASIS accuracy
• Individual• Care team/branch• Organization• Frequency – weekly/monthly/quarterly/annually
• Four visits per 8-hour day• 90% OASIS accuracy rate
7
5
80100.015\317211(pptx)-E2
Compensation Planning ProcessPotential Components
Standard or Incentive Category Potential Performance Metric
Productivity/Efficiency • Visits per defined period
• Points (i.e., relative evaluation of visit intensity)
• Managed caseload
Quality CMS home health quality indicators
Access/Coordination of Care • Time to initial visit
Intangible Contribution to Organization • Citizenship/contribution to organization
• Collegiality (peer-to-peer rating)
• Leadership
Once the conceptual model is identified, the components for the incentive portion can then be selected and weighted.
The components should support the overarching compensation plan principles.
90100.015\317211(pptx)-E2
Compensation Planning ProcessKey Questions
• Participating Clinicians – Will the plan be designed for case managers or be developed to be applicable to all clinicians?
• Degree of Variation Within the Plan – How important is it to have consistent design and plan parameters for case managers as opposed to other clinicians?
• Compensation Risk – How willing is SCAH to put base pay rates at risk?
• Time-Based Pay Element – Given regulatory constraints, how will overtime pay factor into the performance-based plan design?
• Funding – What are the total dollars available to fund the plan, and what is the degree of acceptable financial risk?
As we began the development of the compensation plan, several key questions were posed to shape the plan.
6
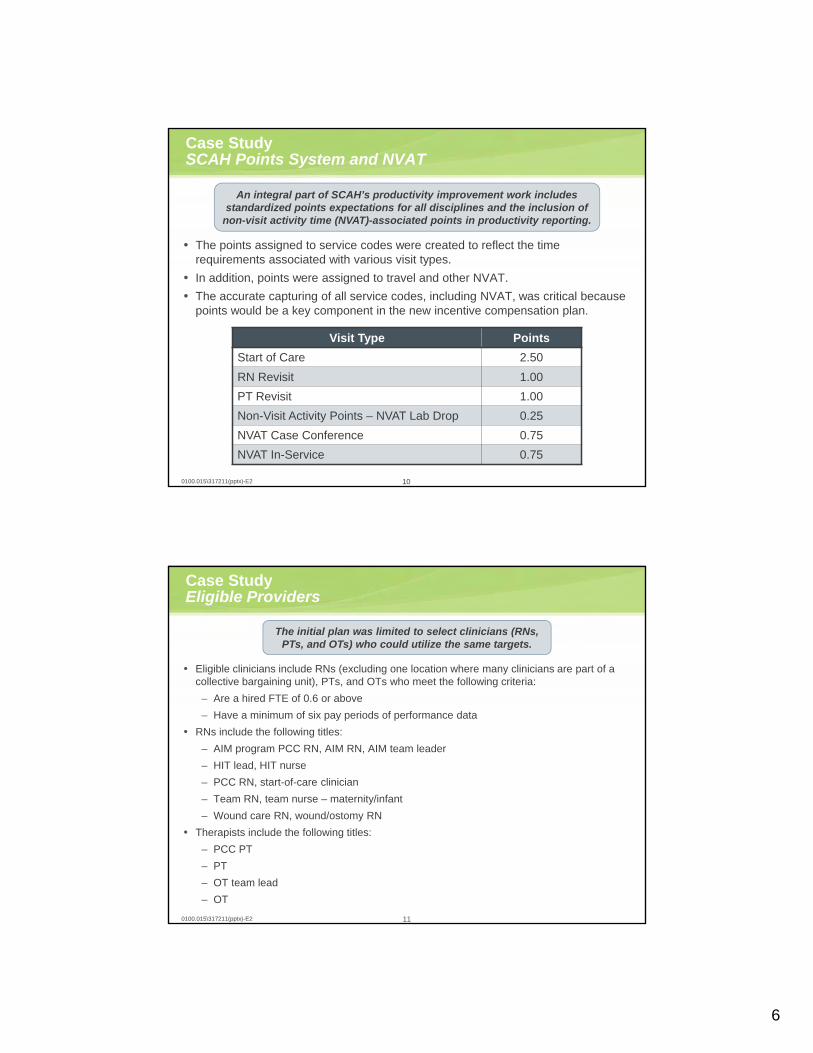
Case StudySCAH Points System and NVAT
• The points assigned to service codes were created to reflect the time requirements associated with various visit types.
• In addition, points were assigned to travel and other NVAT.
• The accurate capturing of all service codes, including NVAT, was critical because points would be a key component in the new incentive compensation plan.
100100.015\317211(pptx)-E2
An integral part of SCAH’s productivity improvement work includes standardized points expectations for all disciplines and the inclusion of
non-visit activity time (NVAT)-associated points in productivity reporting.
Visit Type Points
Start of Care 2.50
RN Revisit 1.00
PT Revisit 1.00
Non-Visit Activity Points – NVAT Lab Drop 0.25
NVAT Case Conference 0.75
NVAT In-Service 0.75
Case StudyEligible Providers
• Eligible clinicians include RNs (excluding one location where many clinicians are part of a collective bargaining unit), PTs, and OTs who meet the following criteria:
– Are a hired FTE of 0.6 or above
– Have a minimum of six pay periods of performance data
• RNs include the following titles:
– AIM program PCC RN, AIM RN, AIM team leader
– HIT lead, HIT nurse
– PCC RN, start-of-care clinician
– Team RN, team nurse – maternity/infant
– Wound care RN, wound/ostomy RN
• Therapists include the following titles:
– PCC PT
– PT
– OT team lead
– OT
110100.015\317211(pptx)-E2
The initial plan was limited to select clinicians (RNs, PTs, and OTs) who could utilize the same targets.
7
Ba
se R
ate
Case StudyNew Plan Description
Bonus Structure
• An incentive program was developed to provide up to 25% in additional earning potential for eligible clinicians based on several performance categories:
– Productivity
– Quality
– Patient satisfaction
• Clinicians maintained their current hourly pay rates, with incentive bonuses paid to high performers.
Minimum Standard
• Upon full implementation, those not reaching a minimum productivity threshold in a given quarter would be subject to a 10% decrease in their hourly pay rate in the subsequent quarter.
• However, if clinicians demonstrated three consecutive pay periods of performance above the minimum standard, they could request that their base rate be restored.
120100.015\317211(pptx)-E2
In the new compensation plan, clinicians were eligible for bonus compensation if they achieved performance targets in several categories.
Plan Illustration
Details regarding productivity, quality, and patient satisfaction targets are provided on the upcoming slides.
Bo
nu
s P
ote
ntia
l
Patient Satisfaction: 5%
Quality: 5%
Productivity: 15%
Base at Risk: 10%
Guaranteed Hourly Rate: 90%
Case Study Performance Metrics
• Patient satisfaction was based on the average percentile rank by branch.
130100.015\317211(pptx)-E2
Under the new plan, clinicians received between 90% and 125% of current hourly pay rates, depending on performance.
Plan Illustration
Ba
se R
ate
Bo
nu
s P
ote
ntia
l
Patient Satisfaction: 5%
Quality: 5%
Productivity: 15%
Base at Risk: 10%
Guaranteed Hourly Rate: 90%
• Quality performance was based on the average performance, by branch, for the: (1) timely initiation of care and (2) acutecare hospitalization rate.
• Productivity performance was calculated as the average FTE-adjusted points per pay period for each clinician.
• After a shadow period, 10% of the base pay rate was at risk based on productivity performance.
Figure Percentage
SampleHourlyRate
Current Pay Rate 100% $49.38
Base at Risk 10% $4.94
ProductivityIncentive
15% $7.41
PatientSatisfaction Incentive
5% $2.47
Quality Incentive 5% $2.47
Total Bonus Potential
25% $12.34
Minimum Rate 90% $44.44
Maximum Rate 125% $61.72
Sample Earning Potential
NOTE: Figures may not be exact due to rounding.
8
Case StudyPerformance Targets: Productivity
• Clinicians could earn significant bonus pay for productivity above 56 points per pay period.
• After the shadow period, clinicians needed to achieve 45 points per pay period to maintain their current pay rates.
• Points per pay period included select NVAT.
• Points were adjusted for hours worked, including overtime.
140100.015\317211(pptx)-E2
A minimum of 45 points per pay period was required for clinicians to receive 100% of the current hourly rate. More
productive clinicians had a larger bonus percentage potential.
Productivity Targets and Tiers
TierPerformance Target (FTE-
Adjusted Points Per Pay Period)Estimated Visits
Per Day Payment Potential
Tier 6 75 and Above 5.00 and Above 15%
Tier 5 68 4.53 10%
Tier 4 64 4.27 7.5%
Tier 3 60 4.00 5%
Tier 2 56 3.73 2.5%
Tier 1 45 3.00 0%
Minimum Threshold Below 45 Below 3.00 -10%
FTE Adjustments
A calculated FTE was used to adjust points for each pay period, based on actual hours worked over an 80-hour period.
Impact of Overtime
An adjustment was made to discount points for overtime hours in a given pay period.
• If overtime hours represent 10% of total hours worked, 10% of total points will be discounted by 33%.
• The purpose of this adjustment is to discourage rewarding high performance that may be attributed to overtime because that time is already paid at a premium.
150100.015\317211(pptx)-E2
The plan points were adjusted based on hours worked and overtime, reflecting a points per productive hour metric.
Pay Period
Pay Period Productive Hours Calculated FTE Pay Period Points
Adjusted Points Per Pay Period
A B = A ÷ 80 C D = C ÷ B
Pay Period 1 16.00 0.20 9.00 45.00
Pay Period 2 41.50 0.52 24.75 47.71
Pay Period 3 66.25 0.83 41.00 49.51
Pay Period 4 73.50 0.92 48.83 53.15
Pay Period 5 79.00 0.99 43.33 43.88
Pay Period 6 79.00 0.99 47.50 48.10
FTE Calculation Example
NOTE: Figures may not be exact due to rounding.
Case StudyPoints Per Pay Period Calculation Example
9
Case StudyOvertime Adjustment Calculation Example
Impact of Overtime Example
0100.015\317211(pptx)-E2
TotalProductive Pay Period
Hours
Over-time
Hours
Overtime Hours as a Percentage
of Total Productive
Hours
Total Pay
Period Points
PointsSubject to
Adjustment
Overtime Percentage
Points Adjustment
Total Overtime-Adjusted
Points
A B C = B ÷ A D E = D × C F = E × 33% G = D – F
Example Clinician
80 8 10% 50 5 1.65 48.35
16
Case StudyPerformance Targets: Patient Satisfaction and Quality
• Unlike the individual productivity incentive, patient satisfaction and quality targets was set based on the average performance by each branch.
• Performance for these measures was evaluated quarterly.
• Clinicians performing below 45 points per pay period on average (and thus subject to pay rate reductions) were not eligible for these branch bonus payments.
170100.015\317211(pptx)-E2
TierNumber ofTargets Met
Bonus Percentage Potential
Tier 3 2 of 2 Targets 5.0% (Max.)
Tier 2 1 of 2 Targets 2.5%
Tier 1 0 of 2 Targets 0.0%
Quality Targets and Tiers
Patient Satisfaction Targets and Tiers
TierPerformance Target
(Percentile)Bonus Percentage
Potential
Tier 3 55th 5.0% (Max.)
Tier 2 50th 2.5%
Tier 1 Below 50th 0.0%
Tiers were also set to allow partial payment in patient satisfaction and quality.
Metric Target1
Timely Initiation of Care Above 92.2%
Acute Care Hospitalization Rate Below 18.3%
1 Based on the SHP California average for Q3 2012.
10
Case StudyShadow Period and Plan Timing
180100.015\317211(pptx)-E2
The bonus timing included monthly productivity payments and quarterly patient satisfaction/quality payments.
• June performance statement
• July performance statement
• July productivity bonus payment with first August paycheck
• August performance statement
• August productivity bonus payment with first September paycheck
• September performance statement
• September productivity bonus payment with first October paycheck
• May performance statement
• October performance statement
• October productivity bonus paymentwith first November paycheck
• November performance statement
• November productivity bonus payment with first December paycheck
Nov. Dec.April May June July Aug. Sept. Oct.
Partial Plan Implementation
• Bonuses paid• Base pay protected
Q3 Bonus – Paid November Q4
• Quality bonus• Patient satisfaction
bonus
Full Plan Implementation • Bonuses paid• Base pay at risk
Shadow Period • Informational
statements only
Lessons LearnedPlan Impact
190100.015\317211(pptx)-E2
Plan Reviewed 12 Months After Implementation
• Employees were surveyed.
• We analyzed the impact, productivity, quality, and patient satisfaction.
• The results were not trending as we had hoped.
Overall Findings
• The plan was too complicated. Non-visit activity points and overtime calculations were too complex to manage both administratively and from an employee’s perspective.
• Staff viewed the plan as a compensation plan instead of an incentive plan.
• The plan was not inclusive. While geared to a full-time employee and certain disciplines, if a part-time employee qualified for a productivity bonus during a specific pay period, he/she was not appropriately rewarded for his/her performance.
Once the plan was implemented, feedback from clinicians was gathered to inform potential plan adjustments.
11
Lessons LearnedPlan Modifications
200100.015\317211(pptx)-E2
Simplified Plan to Support Our Goals and Employees
• Removed overtime calculation.
• Removed NVAT points.
• Removed FTE-equivalency calculation. All disciplines and all FTE statuses are eligible. We’ve found that by being fair and transparent in our incentive plan, we can improve our operational/cost efficiencies in the organization at the same time.
New Incentive Parameters
• Productivity – points acquired through completed visits.
• Quality and patient satisfaction:
– Same metrics, but payments are not paid on a percentage of base hourly rate.
– This portion of the incentive was made available to all employees who impact these measures, not just clinicians.
– Employees can earn up to $400 annually for quality and patient satisfaction measures (for a total of $800) based on the performance of their assigned branch location.
We learned a lot over the course of the first year. Ultimately, we modified the original incentive plan to simplify the methodology and support our employees.
Lessons LearnedVisits Per Day Post-Revision
210100.015\317211(pptx)-E2
0
0.5
1
1.5
2
2.5
3
3.5
4
4.5
Visits Per Day by Branch – 1 Month of Revised Plan Parameters
0.000.501.001.502.002.503.003.504.004.505.00
Visits Per Day by Discipline – 1 Month of Revised Plan Parameters
• Visits per day improvement from 3.66 to 3.78
• Goal of 4.20 visits per day by December 31, 2014
Today, we are seeing improved productivity as a result of the plan and hope this trend will continue.
Quality performance has also improved since the incentive plan was implemented.