NATIONAL BUREAU OF STANDARDS REPORT NBS PROJECT 27302 -2730424 March 1, 1969 NBS REPORT 9725 8 ,WWVB/WWVL FIELD STUDIES John B. Milton Frequency -Time Broadcast Services Section Time and Frequency Division Institute for Basic Standards National Bureau of Standards Boulder, Colorado 80302 IMPORTANT NOTICE NATIONAL BUREAU OF STANDARDS REPORTS are usually preliminary or progress accounting documents intended for use within the Government Before material in the reports is formally published it is subjected to additional evaluation and review For this reason, the publication, reprinting, reproduction, or open literature listing of this Report, either in Hnole or in part, IS not authorized unless permission is obtained in writing from the Office of the Director, National Bureau of Standards, Washington, D C 20234 Such permission is not needed however by the Government agency for which tne Report has been specifically prepared if that agency wishes to reproduce additional copies tor its own use u.s, NAT DEPARTMENT OF COMMERCE ONAL BUREAU OF STANDARDS
Transcript
NATIONAL B U R E A U OF STANDARDS R E P O R T
NBS PROJECT 27302 -2730424 March 1, 1969
NBS REPORT 9725
8
,WWVB /WWVL FIELD STUDIES
John B . Milton
Frequency -Time Broadcas t Services Section Time and Frequency Division Institute for Bas ic Standards National Bureau of Standards
Boulder, Colorado 80302
IMPORTANT NOTICE
N A T I O N A L B U R E A U OF S T A N D A R D S REPORTS are usually prel iminary or progress accounting documents intended for use w i th in the Government Before mater ia l i n the reports is formal ly published i t is subjected to addi t ional evaluation and review For th is reason, the publ icat ion, repr int ing, reproduction, o r open l i terature l is t ing of t h i s Report, either i n Hnole or in part, IS no t authorized unless permission is obtained i n wr i t i ng f rom the Office of the Director, Nat ional Bureau of Standards, Washington, D C 20234 Such permission is not needed however by the Government agency for which tne Report has been specifically prepared if t ha t agency wishes to reproduce addi t ional copies tor i ts own use
u.s, NAT
DEPARTMENT OF COMMERCE ONAL BUREAU O F STANDARDS
FORE WORD
This NBS Report on Project 2730424 covers work performed by the Frequency-Time Broadcast Services Section of the Time and Frequency Division, National Bureau of Standards, Boulder, Colorado. The project covered the period June 1964 to July 1968, and was sponsored by the Office of Civil Defense and the U . S. Army Strategic Communications Command.
4 . 1 Stanclbv W W V B Transmi t t e r . . . . . . . . . . . . 5 4 .2 T’rovision for Switching Antenna and T r a n s m i t t e r s . . 5 4 . 3 Provis ion for OCD Frequency Generation and Control 5 4.3 Radio Tc.letypc Control Equipment and Switching Gear . 5
5 . RECEPTIONSTUDIES . . . . . . . . . . . . . . . . . 6 5 . 1 Evaluating the Radio Teletype Capability . . . . . . 6 5 . 2 Coherent v e r s u s Non-Coherent Detection . . . . . . 1
A . MEASITRED DAYTIME FIELD INTENSITIES IN THE UN1TI;:D STAI’ES AT VLF’. LF. AND M F . . . . . . -A
1 3 . SlMI’L. IF1E.D IIlIAWINCS AND BLOCK DIAGRAMS . . E
c. . f’I!, E.1.1hlINARY E:NGINEERING AND COST S T U D Y 01’ V I . F / / I . F 7’I<ANSMISSION FACILITY FOR NJLS A N D o c r ) . . . . . . . . . . . . . . . . . . ( -
LIST O F FIGURES
Page
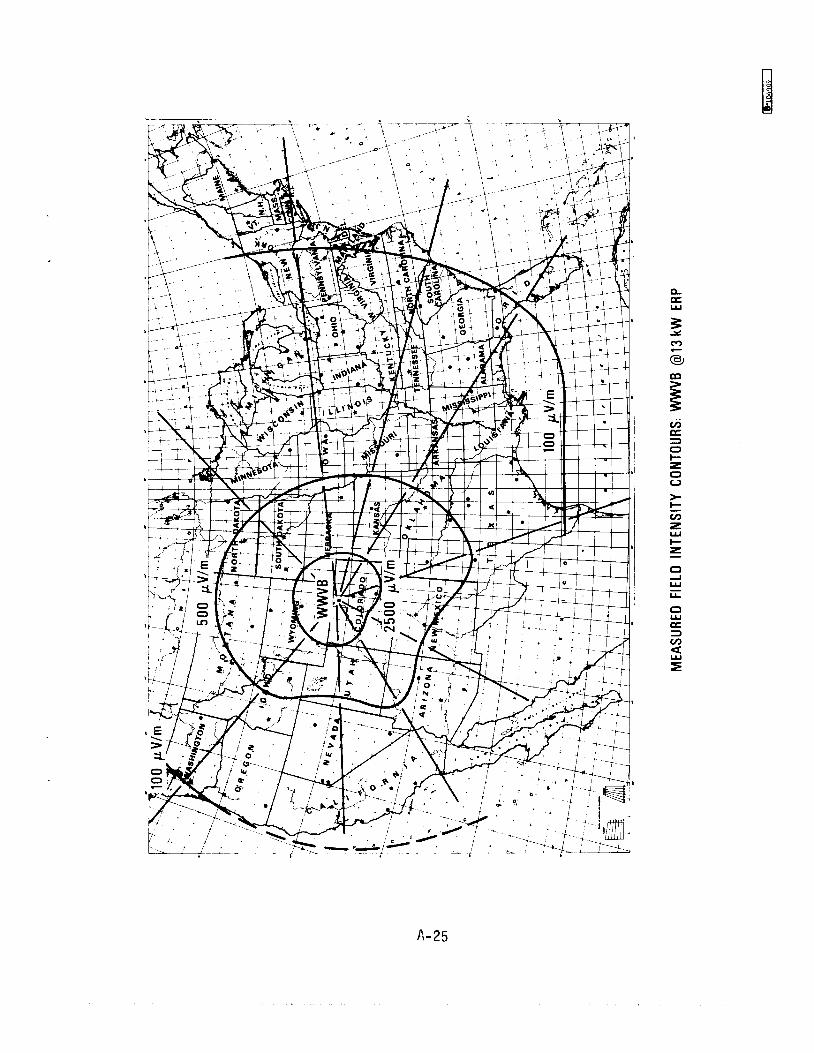
Measured Field Intensity Contours--WWVB @ 13 kw e r p e . a A-25
Simplified Drawing of WWVB Transmi t t e r and Antenna System. . B-1
Simplified Control-Room Units for OCD T e s t s and Exper iments a B-2
Joint NBS/OCD Faci l i ty Functional Diagram . . e e e . C-6
Conceptual Layout, Station A r e a . . . . . . C-9
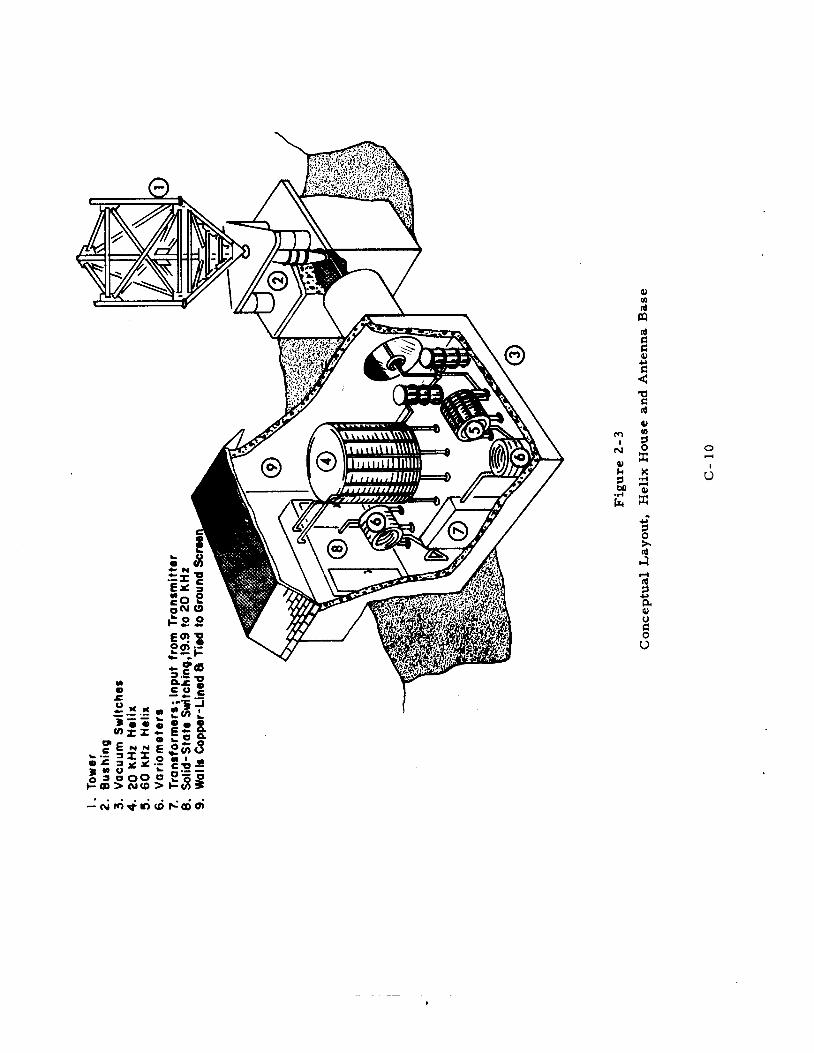
Conccptual Layout, Helix House and Antenna Base . a a . . C-10
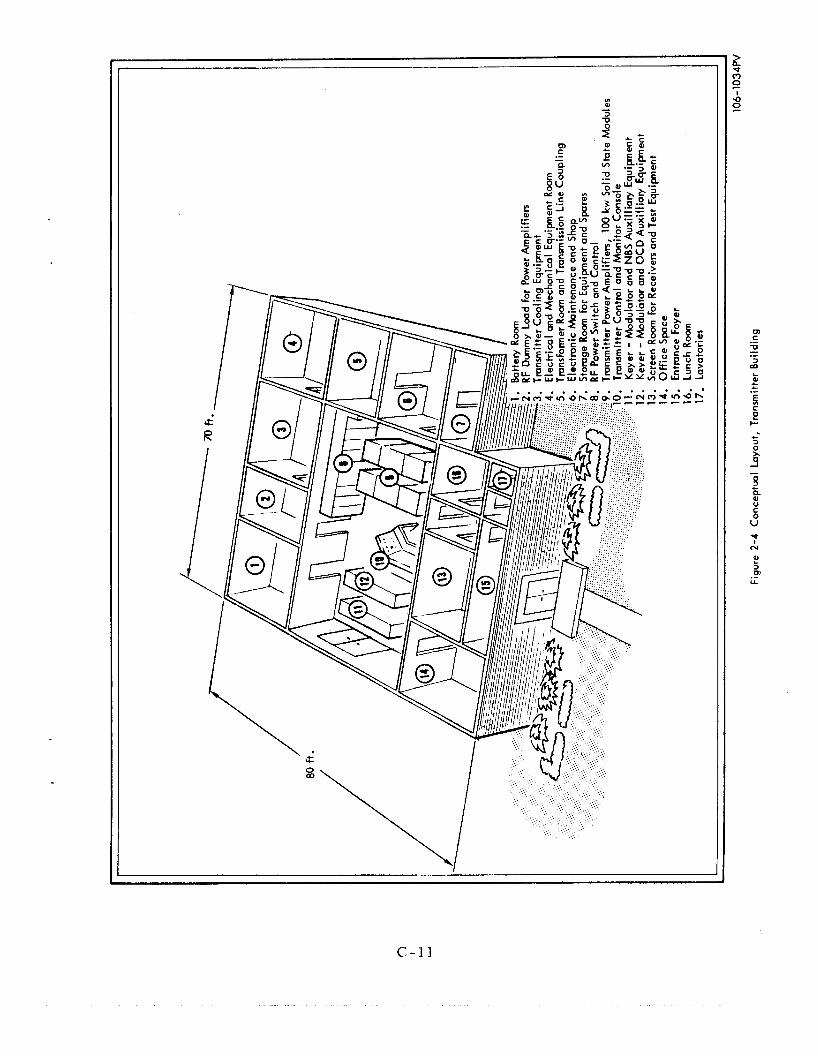
Conceptual Layout, T ransmi t t e r Building . . . . . . . . . C - 11
Minimum Distance f rom Targe t s for Antenna Tower and Pcrsonnel Nuclear Effects Survival. . . . e . . C-17
Transmi t t e r and Receiver Sites . e . . . . . . c - 1 8
Relationship between Percent of Time Availability o r Service Probabili ty and Normalized Deviation. . . . . . . I C - 2 1
The Variations i n T.A. and S. P. Possible by Changing Radiated Power P db (with f = 25 kHz) . . . . . . . C-22 r
The Variations i n T. A. and S , P. Possible by Changing Radiated Power P db (with f - 50 kHz) e . . e . . ,, ‘ C - 2 3
r
l’hc Variations i n T.A. and S. P. Possible by Changing Radiated Power P db (with f = 75 kHz) . . . . . . . C-24
l’owcr Requirements vs . Frequency a t Various Locations. C-26-C-31
€3 ‘it1iatc.d Powc r and Trans in is sion Rate Trade Relative to
r
S y s t c i r i Operating at 75 Baud. . e . e I) . . . . . C-33
Radiatrd Powe r and Receive r Pe rfornmnce Trade Relative to Ncdr Optimum System Operating in Atmospheric Noise with € la rd Clipping and 0.170 Charac te r E r r o r s e . . C-34
I:xciinl>lc of Coding and Modulation . . . . I . . . . . . . C-38
Ni1iiibc.r of Poss ib le Messages, m; Number of Different Frequencies M; E l rmcn t s in the Message n; and E<c*quired Signal-to-Noise Dt.nsity for Probabili ty o f M e s s a g e E r r o r Equal to 10- 4 . . . . . ~ C - 4 5
Rl.latlon of M c s s a g c Tinic and Required Signal-to-Noise Density. C -46
ii
. . . I l l
WWVB/WWVL FIELD STUDIES
John B. Milton
Pro jec t 2730424, WWVB/WWVL Field Studies, was a cooperative effort between the National Bureau of Standards, the Office of Civil Defense, and the U. S. Army Strategic Communications Command. The effort included aiding in producing a field strength map of the United States at 20 kHz and 60 kHz; upgrading the WWVL and WWVB antenna systems; providing a standby t r ansmi t t e r for WWVB; evaluating some FSK receiving systems; cooperating in FSK t ransmiss ion tes t s ; and providing, through a private contractor , a pre l imi- nary study of a joint NBS-OCD high power t ransmit t ing facility
Key Words: Emergency broadcasts , VLF t ransmiss ions , Field mapping, OCD (Office of Civil Defense), FSK (frequency sh i f t keying)
1 INTRODUCTION
1 . 1 The OCD and Emergency Communications
The Office of Civil Defense i s , as par t of its effort, responsible
for a l e r t and warning coinmunications in case of national emergency.
These communications have utilized such sys t ems a s CONELRAD, the
Emergency Broadcast Systeni, and the Emergency Action Notification
System.
A iiiurc coriiprehensive sys tem has been proposed, and will uti l ize
a h ighly reliable sys t em of radio links on th ree levels.
casting sys t em will communicate direct ly with elements of s ta te and
local government, police, and f i r e protection groups, civil defense
local headquarters , and a s c r i c s of low o r medium frequency relay
A L F broad-
stations.
rnunicate dircct ly with the populus a s well a s to actuate a l a r m s and
s i r e n s for those people out of radio communication.
It w i l l be the responsibil i ty of these relay stations to com-
1.2 Pro jec t Pu rposes
This project has been a cooperative effort between the OCD and
NBS a imcd a t determining the feasibil i ty of this LF emergency com-
munication system. The NBS has:
a. Provided upgraded faci l i t ies at WWVB and WWVL. This has included replacing obsolete and de ter iora ted equipment and components.
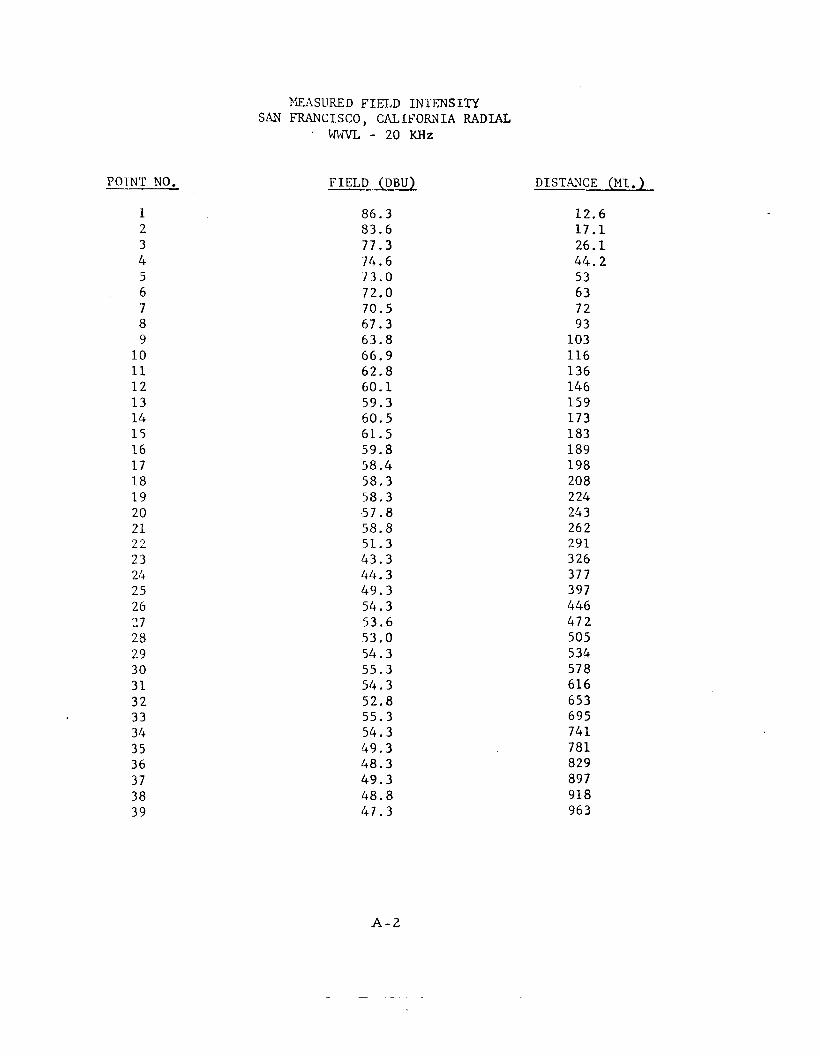
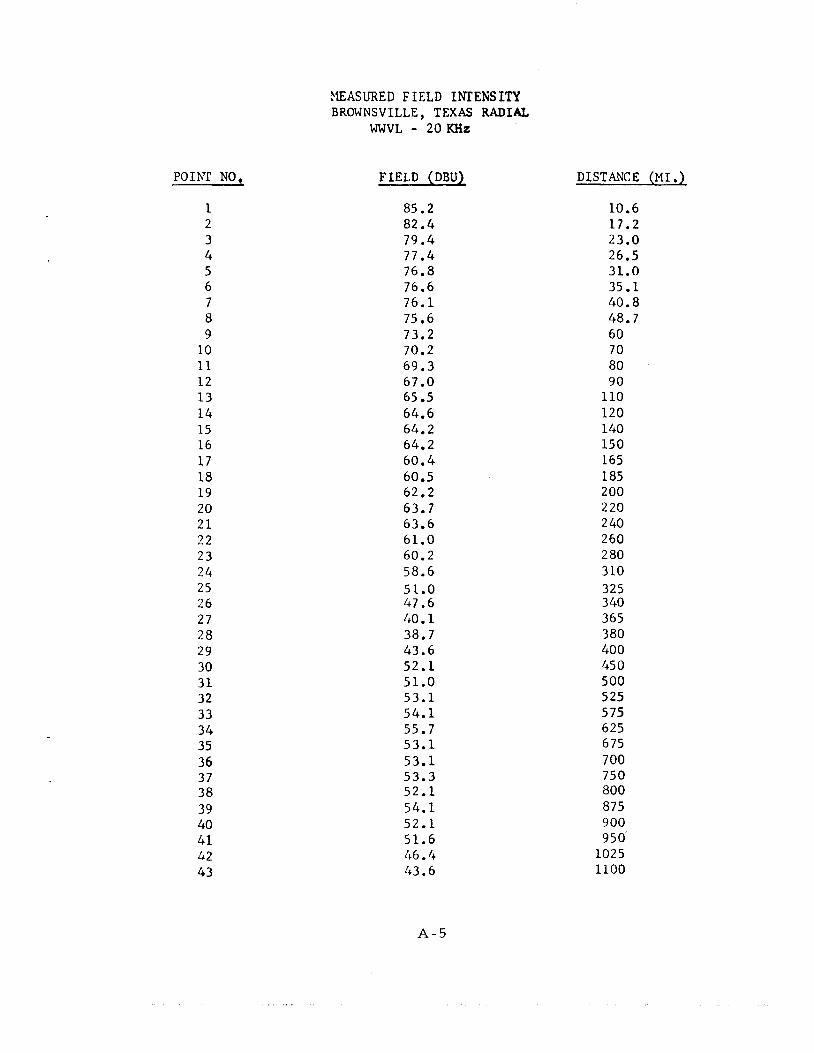
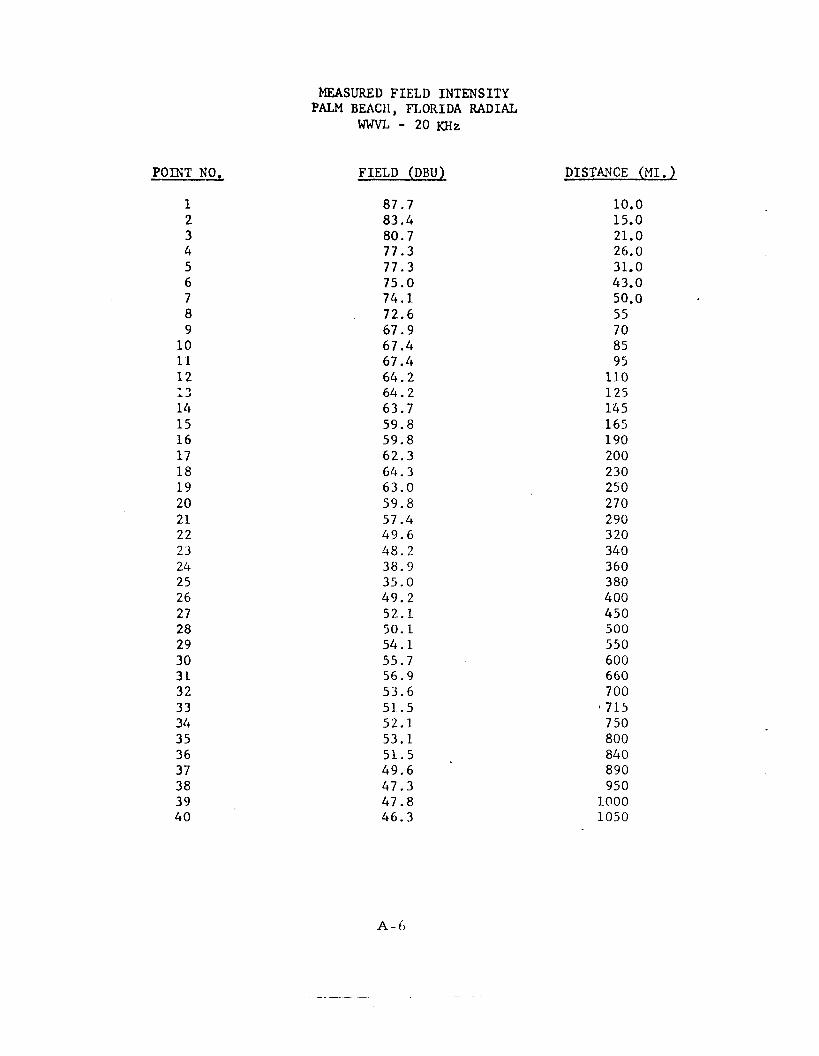
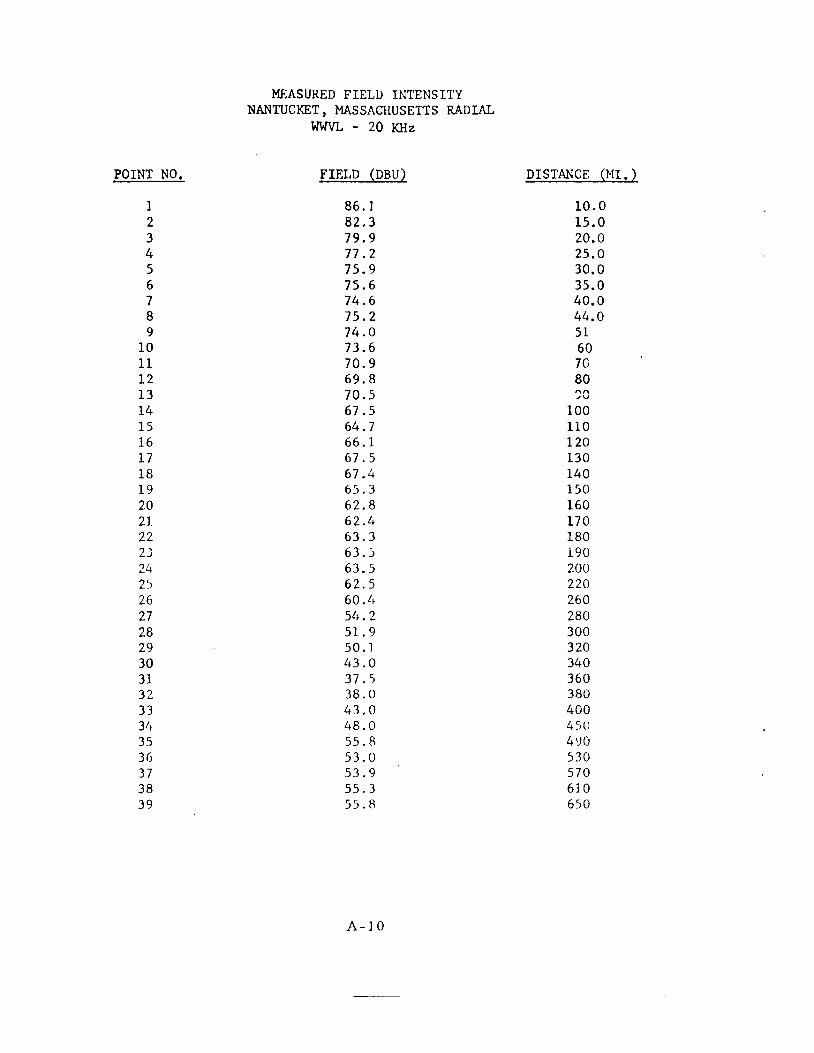
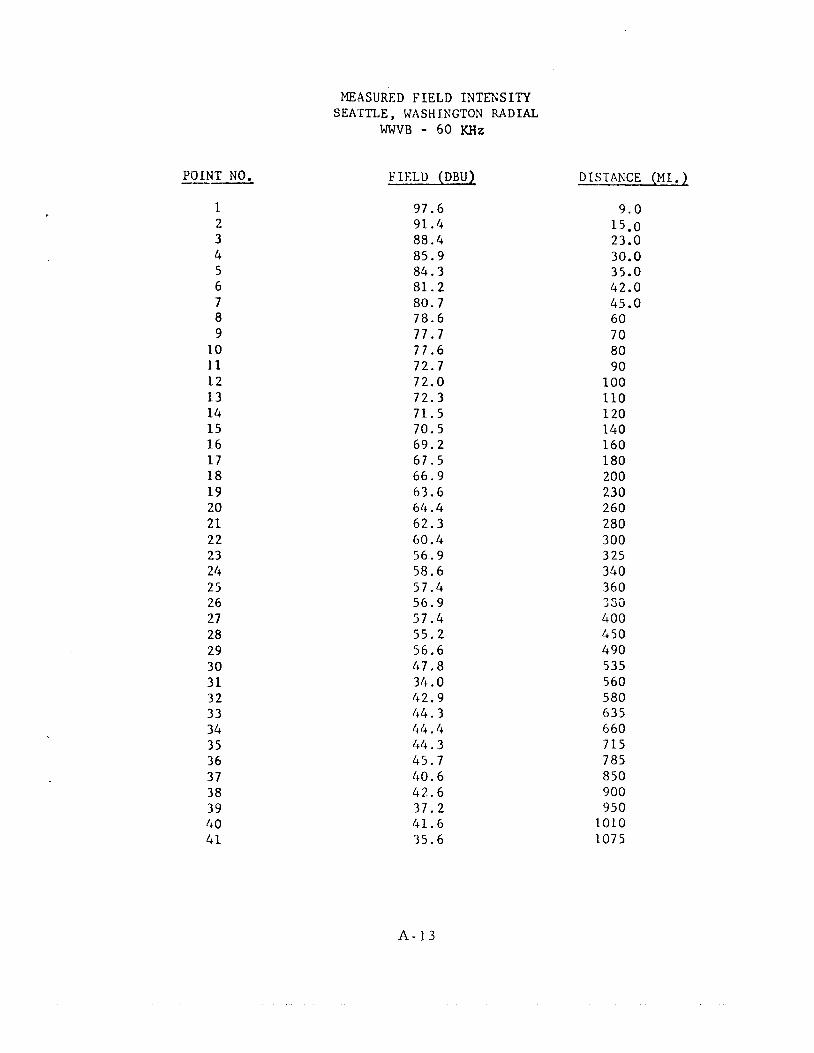
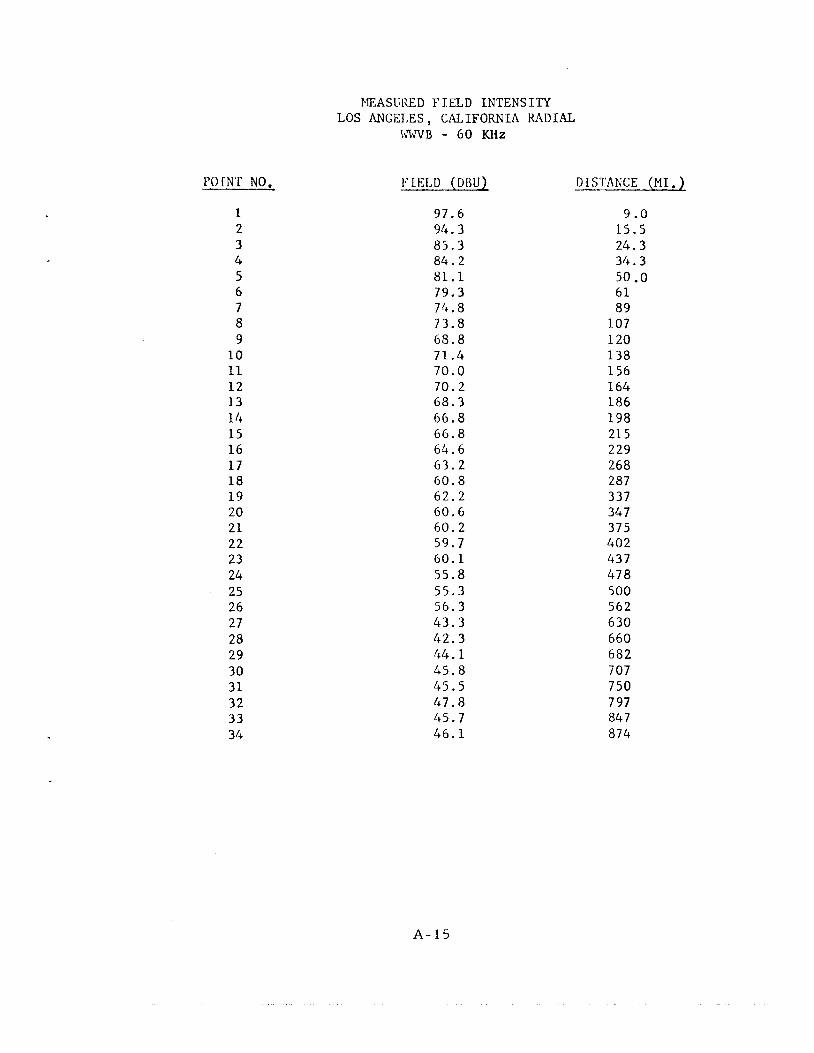
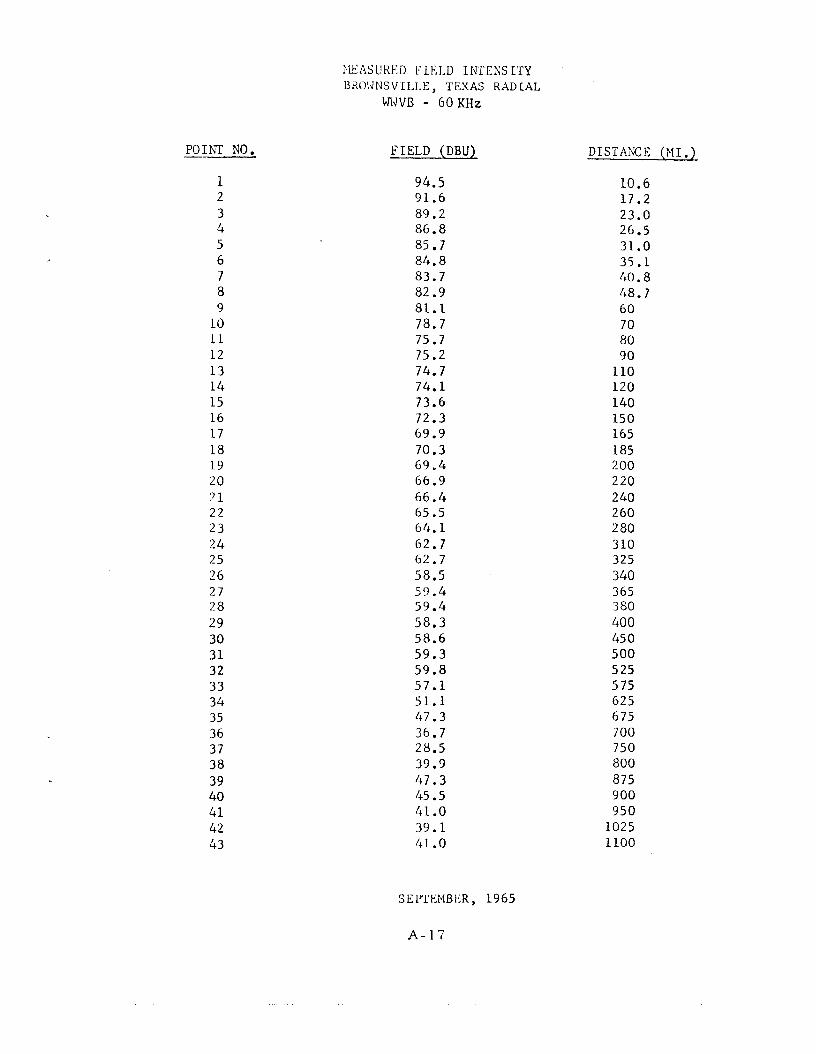
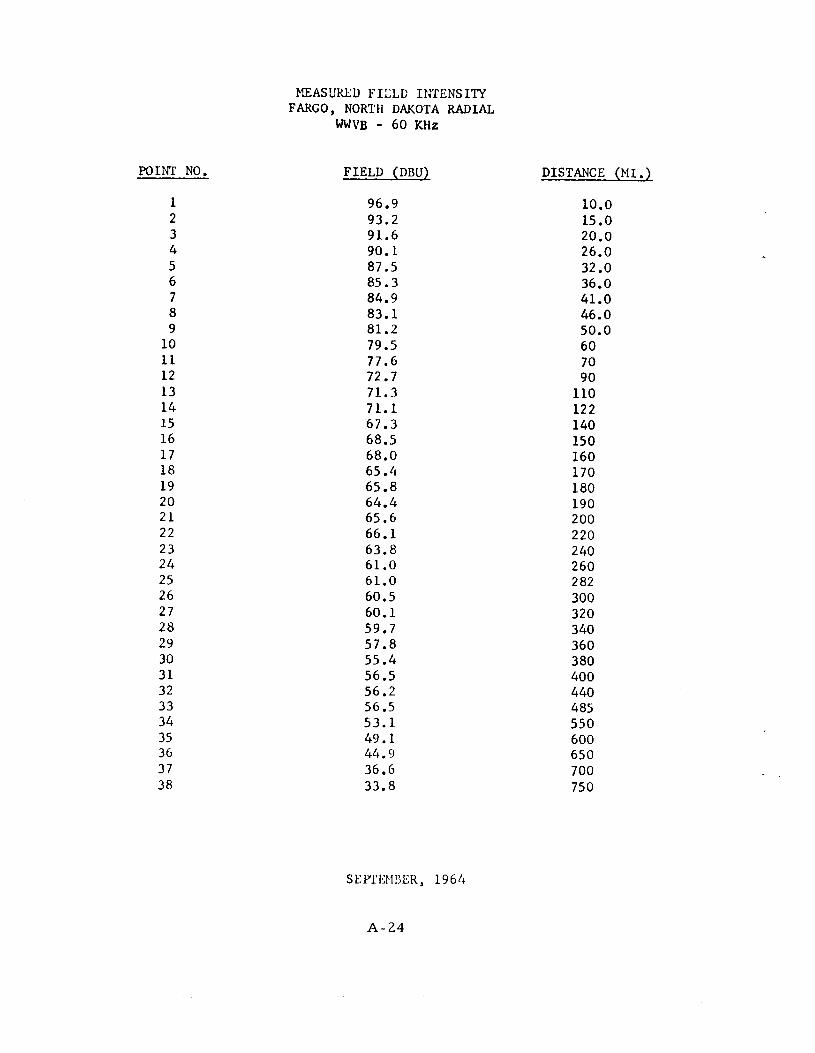
Aided in a field mapping project conducted by a pr ivate contractor . arid on nine rad ia l l ines f r o m WWVB was measu red in th i s work . miles
Evaluated var ious V L F and L F receiving techniques- - c oh cl r c nt ve r s u s non - c oh e r c nt d e t e c t ion, f r e que n c i e s , data r a t e s , e tc . , and
b. Field s t rength on nine radial l ines f r o m WWVL
Distanccs f r o m thc t r ansmi t t e r ranged up to 1743
c .
d. Provided, through a subcontractor, a pre l iminary engineering study for a high power VLF/LF transmit t ing facility.
2. FIELD STUDIES
2. 3 Calibration Services by NBS
The radiated power f rom WWVL and WWVB was m e a s u r e d by the
2';lc.ctronic- Calibration Center , Division 272.00, of the NBS. A plot of
antciin'i vcsrsus radiated power was obtained for u se in the field mapping
\v o r k
2
2 .2 F ie ld Mapping
(;nutnc\y and Jones Communications, Incorporated, conducted the
lu'tl i i i c i l i l ) i r i ~ w o r k . N i n c rclrlial 1inc.s f rom WWVB and WWVI, wcrc'
~ i t i l i z ~ ~ c l a i ~ c l WC.I-<- t l irc .ctc . t l as rollows:
2
3
4
5
G
7
8
9
Directed Toward
Seatt le, Washington
San Franc isco , California
Los Angeles, California
Douglas, Arizona
Brownsville, Texas
Jupi te r , F lor ida
Cape F e a r , North Carol ina
Nantucket, Massachuse t t s
Fargo , North Dakota
Di s t ancvs ranged u p t o over 1700 m i l e s f r o m the station.
obtained and th r field s t rength map that resul ted a r e l is ted in Appendix
A. Thc data contained in this appendix is pa r t of Gautney and Jones
Cornniunications, Inc. , "Measured Daytime Field Intensi t ies i n the
Unitcd Statcs at VLF, F L and MF, " In tc r im Report fo r the Department
of the Army and the Office of Civil Defense, May 1966.
The data thus
3. UPGRADING EXISTING FACILITIES
3 . 1 WWVL Antenna and Transmi t t c r
The> c)riginal WWVL hclix and var ionicter wcrc wound with litz
w i rc o f a very e a r l y ventagc.
rcwintl both thc hcilix and the varionicitc3r with two paral le l conductors.
E a c h concluctor has a capacity of 100 rf amperes .
Sufficicnt ncw wire was purchased to
3
The antenna was lowered and all connections upgraded to allow for
The antenna i s capable of about 1 .8 a higher c u r r e n t car ry ing capacity.
kw radiated power, 3 3 . 4 kw input to the antenna and a n antenna cu r ren t
uf 183 an iperes . The limiting factor now is the f lashover voltage of the
dntcnn'i bushing, th i s voltage being approximately 100 kv.
Tht. 20 kHz final tank c i rcu i t was redesigned to provide the p rope r
load inipcdanc-e for the final aniplifivr, and thc p rope r coupling to the
,uitc\nnd and t r ansmiss ion line. Thc tank coi ls were rewound with new
75 cit i i i>crc cclpaci ty l i tz wi re .
3. 2 WWVB Antcnna and Transmi t t e r
The> var ious opcrLttions pcrfornicld on thc. W W V L antcnna were a l so
rc\l>catcd on t h c . WWVB antcnna. The 60 kHz helix and va r iome te r w e r e
also rewound. In this case , these units were triple-wound. Sincc the
tcrmin,il rcactancc of thc 60 kliz antenna is much lower than t h a t C J f the
2 0 k l l z 'intciinrl, the WWVB antcnna cu r ren t could be ra1sc.d to d full
j 0 0 I-f ai i i l>c-rc~s bcior(> tltc bushing flcisliovcr voltagc was r c ~ c h ( ~ c l a Thc
o r i g i n a l grid-type ground systcni w3s improved by the addition of a
radial ground screen . This s y s t r t i i o f 300 radials , increased thc
cbl'fic.ic.nc-y of thcs antcnna froni 14% t o 30'%1.
W W V D is a i i x c d serv icc and as s u c h could not bc intc.rruptctd
d i i r i n g t h c , h( , l ix and dntc.nnd itiotlificcition work. S'I 'RATCOM, through
projec-t 25 10421, provided for the construction of a s p a r e antcnna utilizing
two of t l i c W WVB/VL niclsts.
~ o n i ~ * w l > a t rcsduct.d powc'r, WWVB was able to continue opcxrations.
With this dntcnna, and in operating a t
A5 i n the. cast' of thc W W V I , tr,ilisniittcr, thtb (10 kHz tank c i rcu i t
LL'IS rc.clc.signc\d and rebuilt with thci nclw litz wi rc .
4. N E W FACILITIES
4 . 1 Standby WWVB T r a n s m i t t e r
A standby 50 kw power amplif ier has been constructed utilizing the
power supply, f r a m e and some pa r t s of a surp lus AN/FRT-6 high
frequency t r a n s m i t t e r ,
t ransfor incr i n place of the m o r e conventional tank circui t .
tn i t ter is operated at zero-b ias in the c l a s s "B" mode, and the band-
width is f 5 kHz.
This standby unit ut i l izes an i ron -co re output
The t r a n s -
T h e or iginal WWVL t r a n s m i t t e r that had been operated at Sunset,
Colorado, is being modified f o r u se as a d r i v e r fo r the new 60 kHz
trclnsrnittcr. This modification i s near ly complete as of this writing.
4 . 2 Provis ion for Switching Antenna and T r a n s m i t t e r s
The ncw 60 kHz untuned t r a n s m i t t e r has an output impedance tha t
i s equal to thc Zo of the t r ansmiss ion line, but the or iginal tuned unit
opcralc-s with a standing wavc on the t r ansmiss ion l ine.
i s ~ l l a n ~ ~ ~ t l froin one t r a n s m i t t e r t o the other , vacuum switches a r e
uscd t u changc the line f r o m onc unit to the o ther as well as switching
the. coupling configuration a t t h e helix.
When serv ice
A,, 3 I>rovision for OCD Frequency Generation and Control
In thc e a r l y days o f this project, spec ia l FSK kcyers were obtained
froin 3 manufacturer o f V L F phase t racking r ece ive r s . These units
w c r c d(~r.nicd .tdc.quatc for t e s t pruposcs but they required tedious
ad.justnic)nt.
t-cconitiicndcd that thcsc keyers be replaced.
in l igh t of the> changc f rom f 100 Hz to f 50 Hz in the FSK mode.
For use a t a lcss experimental s tage of the work, it i s
This i s especial ly t r u e
It is rccommended that thc new kcyc r s be capable o f full coherent
t rciiisiiiissioii c-apability. This will not only conserve bandwidth and
5
enhance both the effective t ransmit ted power and rece iver bandwidth
requirements , but will permi t thc maximum utilization of the OCD
t r ansmi t t e r s by other government agencies for the t ransmiss ion of
standard frequency signals which can be used for ionospheric experi-
ments , timing t e s t s , etc. The small additional cost to obtain fully
cuhcrciit keyers is fully justified both for OCD reception improvement
and civilian use of the i r t r ansmi t t e r s .
4.4 Radio Tcletype Control Equipment and Switching Gear
Equipment intended for operation, but not yet obtained, will allow
the OCD to have a c c e s s to the W W V B t ransmiss ion system. Upon a
signal f rom OCD, a vacuum switch at the helix house (installed) will
changc the antenna resonance f r o m 60 kHz to the OCD center frequency
of 61.15 k H z .
removed and the OCD FSK generator activated. If the tuned t r ansmi t t e r
is in serv ice , switches will automatically actuate the untuned amplifier.
Radio tcletypc t ransmiss ions will begin within some 30 seconds of the
init ial OCD signal. The text of the t ransmiss ions will be remotely
controlled by OCD and station pcrsonnc.1 will i n no way be involved.
It is intended that for t e s t purposes, the OCD m a y use up to five minutes
pc r hour fdr FSK t cs t s . (See Appendix R for equipment drawings.)
At the s a m e t ime the 60 kHz driving frequency will be
5. RECEPTION STUDIES
5. 1 Evaluating the Radio Tcletype Capability
Following the field mapping work by Gautney and Jones, t e s t s w e r e
pc rfo rnicd to determine the reception quality of the FSK t ransmiss ions .
Rcceivc-rs were se t up a t var ious locations and experimental t ransmiss ions
wcrc instituted.
Jones Communications, Inc. Thc resu l t s were considered satisfactory.
The receiving work was c a r r i e d out by Gautney and
6
5 . 2 Coherent ve r sus Non-Coherent Detection
Using the same FSK generators , some rece iver studies were
pcrformcd a t NBS Boulder Laborator ies .
did operate satisfactorily.
the technique can be considered sound.
performed at the f 50 Hz shift.
Two coherent rece iver sys t ems
They were able to receive perfect copy and
All t e s t s on the rece ivers w e r e
The TMC Resea rch rece iver supplied by the OCD on loan was used
a s a standard of comparison. It, too, operated sat isfactor i ly and did so
a t both the na r row and wide frequency shift ranges. It required r epa i r s
twice during the tes t s . Both fai lures were minor , but they gave r i s e to
a rcconuncndation that the manufac turer be consulted on solutions to the
probleni by rcdcsign of t h e solid s ta te switch used to dr ive the te lepr inter
line. I t i s possiblc that only this rece iver has had this problem and, i f
so, the. recoiiiinendation should be qualified to say that this problem is
iiotcd and should be investigated fur thcr i f t rouble is reported f rom other
1 - t ' ~ c x i v c . r s of this typc.
N o n c o f the r ece ive r s were tes ted with noisy signals. The project
c.ffort was l imited to testing only thc practicali ty and feasibil i ty of the
colicrent rece iver technique.
wc.11 known under cxtrcniely noisy conditions and it was not felt justified
to rnak(. any noise tests on this project.
rc.c.c.ivc.rs o f th is type should be nicntioncd here .
docs not tuanilcst thc "threshold" cffoct of the ordinary F S K rece iver .
W i t h cl suitablc timr, constant, the rece ivers developed on this task effort
c < i n inc1ec.d approach their dcsign l imit of tracking a weak signal buried
i n noise.
t h c y should produce good copy within 30 seconds of s t a r t of t ransmiss ion .
'I'1ic.y d i d i1ic)r.t that specification. Note, however, that thc present OCD
r ~ ~ q u i r c ~ n i c n t precludes bc,ing ablc to wait for that period of t imc.
The benefits of coherent detection a r e
However, one advantage of
The coherent rece iver
The procureincnt specification for these rece ivers was that
7
5. 3 Recommcndations on Receiver Types
The original cohercnt reception technique a s proposed does work
and can he cxploited by OCD for those locations where a t ime delay in
rcl(.cption can bc tolcratcd.
N U S station WWVB would suggest a t ime constant of a t l eas t 50 seconds
on the rcce ivcrs .
minutes could be expected at s i tes using these rece ivers .
thc OCD docs not feel t he re i s sufficicnt need for rece ivers at s i tes that
can wait for dependable communication to be established, then the
cohcrcnt rccc iver technique should be abandoned in favor of the a l t e r -
natives of increased t r ansmi t t e r power. At the receiving s i tes where
only a shor t delay in communication can be tolerated, the non-coherent
reccption method will be a requirement.
Experience gained f r o m field t e s t s of the
This would mean that a delay of f r o m one to ten
If, i n fact,
6 . PROJECT WORK B Y OTHER GROUPS
6. 1 Joint Faci l i ty Study
Ear ly in thc projcbct i t was proposed that NBS and OCD colaborate
i n the dcsign, construction and use of a high powcr LF/VLF facility.
At that t imc, a prel iminary study €or such a facility was provided by
Doco Electronics , Division of General Elec t r ic . Appendix C contains
that study .
7. SUMMARY
During the four -year duration of this project, N B S and the OCD
h i ~ v e coopcratcd in a n important vcnture. The rcliabil i ty, power, and
cjucllity of the NBS L F and VLF facility have been markedly increased.
Thc OCD has bcnrfited by having acccss to a t ransmit t ing sys t em that
d l o w c d Cautncy and Joncs Comiiiunications, Inc. , to complete a ficld
8
strength mapping of the United States at both 20 kHz and 60 kHz.
tcsts wcre run and proved reliable enough for OCD to continue their
work on the L F c’mcrgency broadcasting network for the United States.
Continued testing on WWVB is planned for the future.
broadcasting facility will soon be readily accessible to the OCD for
continued experiments.
FSK
The 60 kHz
Thc r ece ive r evaluation has concluded that non-coherent detection
is probably best for the requirements of the OCD.
recommended that the new OCD FSK kcyers provide coherent keying
with provision for cw operation at ei ther m a r k o r space.
It is, however,
As stated i n the previous section, Appendix C contains a p r e -
l iminary study for a joint NBS-OCD facility.
At that t ime, i t was felt by NBS that a higher power VLF t ime and
frequency station should be acquired in o rde r to provide worldwide
timing. Support came f r o m NASA, JPL , USNO, forcign s tandards
laborator ies , and others .
This study is dated 1966.
In 1968, it became apparent that the financial r e sources of NBS
would not support such a venture.
g:ovt.rnnicmt agencies in the f i e lds of LF and V L F broadcasting,
and portable clocks made any NBS effort toward a higher power station
scientifically que stionablc.
withdraw f r o m any cooperative effort toward a joint facility.
Also, work in the timing a r e a by other
satel l i tes ,
I t was then decided that NBS would officially
9
A P P E N D I X A
M E A S U R E D D A Y T I M E FIELD I N T E N S I T I E S I N I ‘ I IE U N I T E D STATES AT
V L F , LF, AND M F
NEASURED FIELD INTENSITY SEATTLE, \JASl1lNGTON RADIAL
2 - 1 . l o i t i t NI\S/OCl) b'ai.ility k'unctional Diagram . . . . . . . . 2 - 2 Conceptual Layout. Station Area . . . . . . . . . . . . . . . 2 - 3 Conccptual Layout. Helix House and Antenna Base . . . . . 2 - 4 Conccptual Layout. T ransmi t t e r Building . . . . . . . . . . 3 - 1 Minlmum Distance t roni Targe ts for Antenna Tower and
Pcrsonnel Nuclear Effects Survival . . . . . . . . . . . . . 3 - L', 'T'ransmittcir and Rrce ive r Si tes . . . . . . . . . . . . . . . 3 - 3 R(.lationship between P e r c e n t 01 Time Availability o r
Scbrvice Probabi l i ty and Normalized Deviation . . . . . . . 3 - 4 The Variations in .['. A . and S . P . Possible by Changing
Radiated Power A P db . . . . . . . . . . . . . . . . . . . r
'5-4 ' [ . l i t ! Variations i n 'T . R . a n d S . P . Poss ib le by Changing Radiated Power A l3 db . . . . . . . . . . . . . . . . . . .
Radiated Power A P db . . . . . . . . . . . . . . . . . . . 3-7 Powc.r I iequircrnents vs . E'rcquency . . . . . . . . . . . . 3 - 8 i 'o\v~:i* Rccluircnicnts vs . Frequency . . . . . . . . . . . . $ - ( ) Pow(?r Rc:quj rcin(xrits vs . 1~'rc~cluc:ncy . . . . . . . . . . . .
r 3 - 0 'l'hc? Variat ions in 'I. . A . and S . P . Poss ib le by Changing
r
5 - 10 Power Requirements v s . Frequency . . . . . . . . . . . . 3 - 1 1 Power Rcquirenients vs . E'rcquctncy . . . . . . . . . . . . i - 1 2 Power Kequircments vs . Frequency . . . . . . . . . . . .
: < y s t e i n Optirating a t 75 baud . . . . . . . . . . . . . . . . . . i- 1 5 liat1iiitc.d P o w e r and 'I 'ransrnission Rate T r a d e Relative to
5 - 1 4 l<acli;iL~~cl Powcr nntl Kcicc ivcr l'orforniarice T r a d e Relative t o Ncxnr- Uptiinuiii Sys tiim Opcbrating in Atmospheric Noise with Hard Clipping and 0 . 170 Charac te r E r r o r s . . . . . . .
. $ - 1 5
. 3 - l ( 1 Nuin t)L\ 1 ol Poss ib le M c s s a g c s . m; Number of Different
E;xnmplc of Coding and Modulation . . . . . . . . . . . . . .
b.rcqu(~n(.i(.s. M; ilnd F:lenients in the M e s s a g e . n; and 1 < I q u i r (: d S i g na 1 - to - N o i s c> D c: n s i t y fo r P r o 13 ab i 11 t y o f Me s s age - 4 b; t-i-or k;cluiL1 to 10 . . . . . . . . . . . . . . . . . . . . . .
Page
2-5
L- 7
2 - 8
2 - 9
3 - 3
3 - 4
3 - 7
3 - 8
3-9
3 - 1 0
3 - 1 2
3 - 1 3
3 - 1 4
3 - 1 5
3 - 1 6
3 - 1 7
3-19
-5 . 20
3-24
3 - 3 1
c
C: -ii
F i g u r e N o . Title Page
3-17
3 . 1 H
i- i o 3 . LO
3-21
3 - 2 2
. 3 . 23
3 - 2 4
3 - 2 5
. 3 . L6
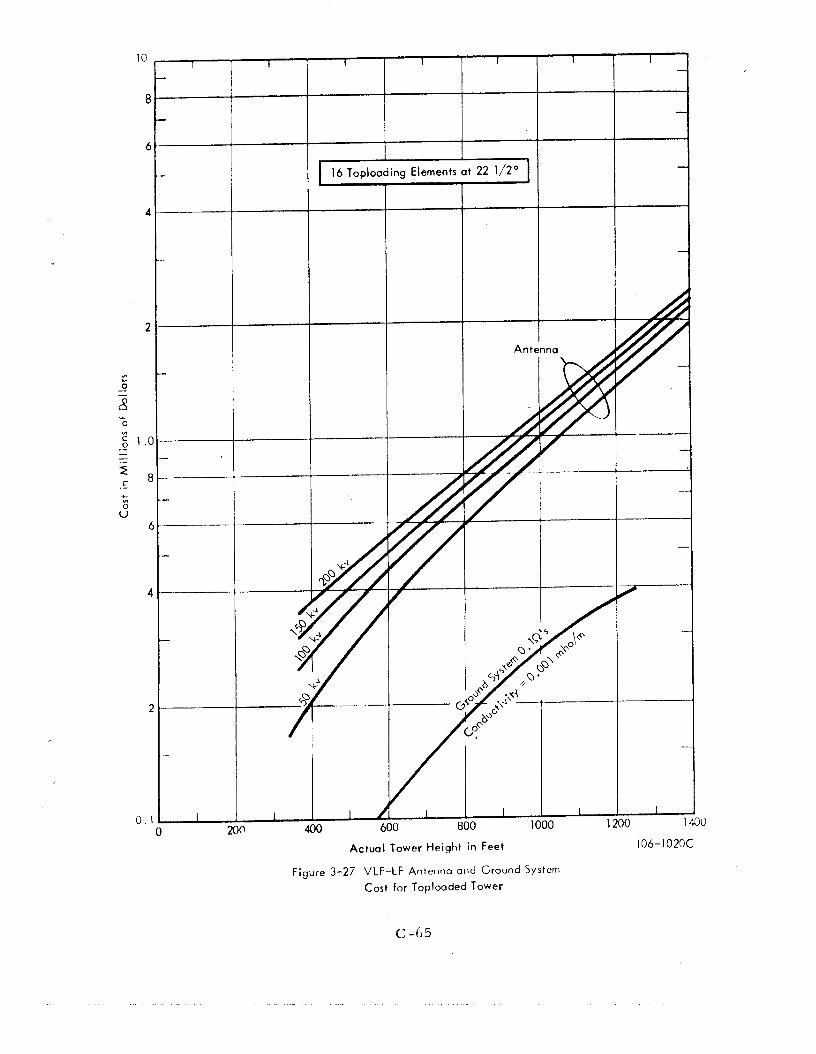
3 . 27
3 - 2 8
5-29
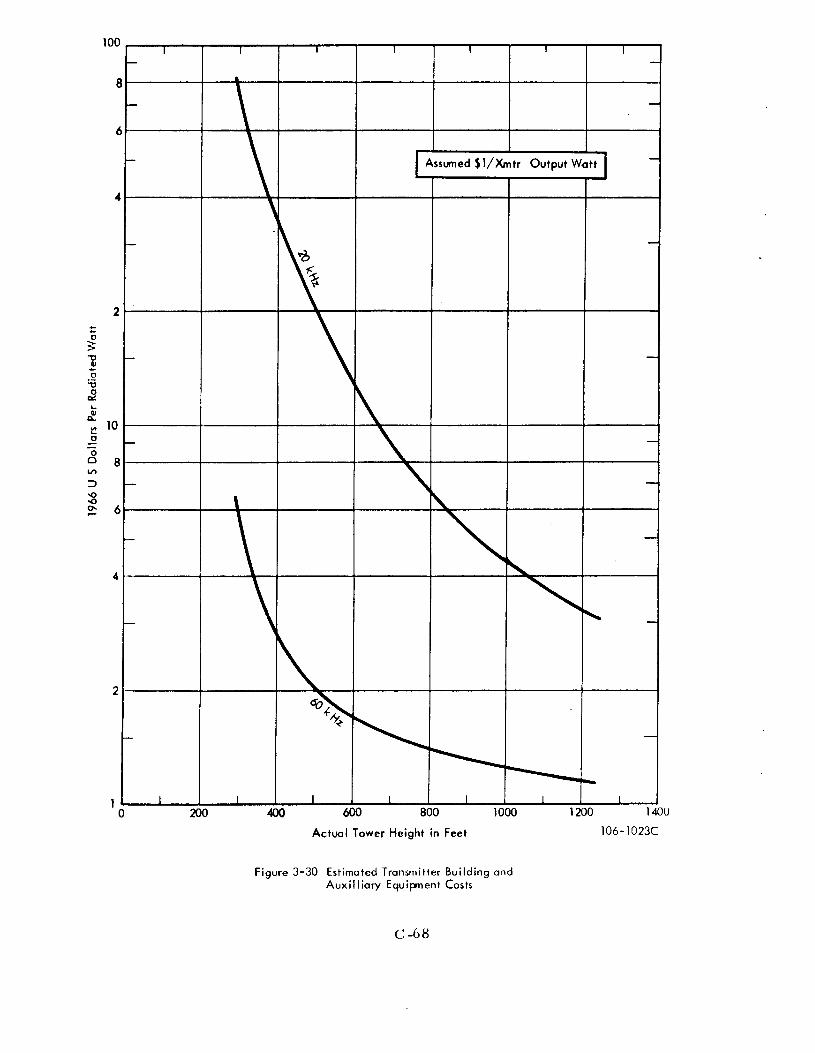
3 - 3 0
3 - 3 1
5-32
3 - 3 3
i-34
Relation of Message Time and Required Signal-to-Noise D e n s i t.y . . . . . . . . . . . . . . . . . . . . . . . . . . . . . l < ( ~ ~ ~ u i r t ~ c l Signal-to-Noise Density Ratio as a Function of M v s s a g c . L c ng t h f o 1- M (3 s s a g e R c! cognition
Tii i ic . availability v s . Service Probabili ty for 60 kHz . . . . . T irne Availability -Se rvice Probabili ty T rade - 0 f f s for Seve ra l Diiferent T ransmi t t e r Powers . Codes and Detectors . . . . .
. . . . . . . . . .
Radiation Capabilities vs . Tower Height . . . . . . . . . . . Antenna System Bandwidth and Efficiency . . . . . . . . . . Radiation Resis tance. Capacitance. and Effective Height of Antenna . . . . . . . . . . . . . . . . . . . . . . . . . . . . . Ground Configuration to Minimize Cost of Wire and Total c o s t . . . . . . . . . . . . . . . . . . . . . . . . . . . . . . Ground System Cost and Configuration for Total Ground Res is tance of 0 . 1 ohm for 60 kHz . 1200’ Tower . . . . . . . Est imated Land Costs for Toploaded Towers . . . . . . . . . V L F / L k ’ Antenna and Ground System Cost for Toploaded Tower . . . . . . . . . . . . . . . . . . . . . . . . . . . . . . Cost of Tuning Inductor and Enclosure
Es t imated Transmi t t e r Costs per Watt Radiated
Est imated Transmi t t e r Building and Auxiliary Equipment c o s t . . . . . . . . . . . . . . . . . . . . . . . . . . . . . .
. . . . . . . . . . . . . . . . . . .
Auxiliary Power Costs Including Generator . Building. and Switching Equipment . . . . . . . . . . . . . . . . . . . . . ‘Total Station Costs vs . Antenna Height . . . . . . . . . . . . T ran s mi t t e r - Re c e i v e r C os t T r a de s . . . . . . . . . . . . . . Receiver Cost as a Function of Sophistication of Per formance
3 - 3 2
3 - 3 3
3-37
3-38
3-41
3-42
3-43
3 - 4 5
3-46
3-50
3 - r 1
3 - 5 2
3 - 5 3
3 -54
3 - 5 b
3-58
3-60
3-62
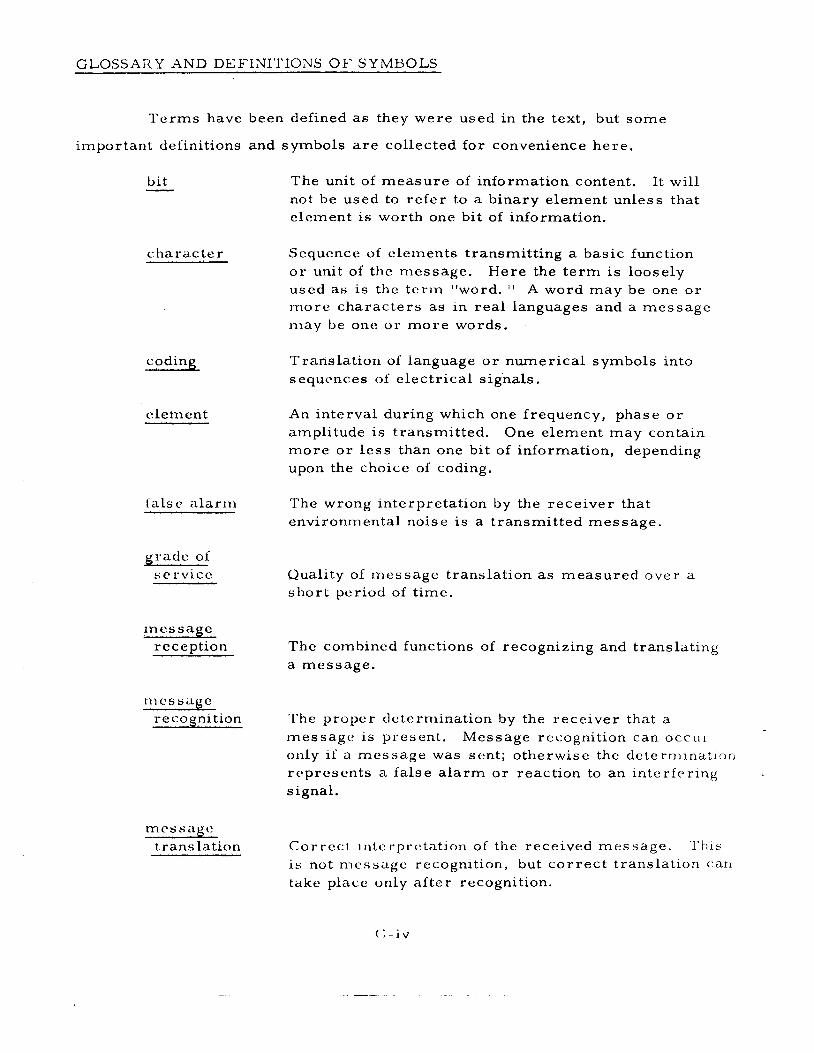
GLOSSARY A N D DEFINITIONS O F SYMBOLS
T e r m s have been defined as they were used in the text, but some
important definitions and symbols a r e collected for convenience here .
bit -
c- ha r a c t e r
vpdihg
clement
fa lse a l a r m
grade of s c rv i cc
In cs sage reception
111 c s s LLg c recognition
mcssagc t rans lation
The unit of m e a s u r e of information content. It will not be used to r e fe r to a binary element unless that e lement is worth one bit of information.
Sequence of e lements t ransmit t ing a basic function o r unit of the message . used as is the tc r in "word. " A word may be one or m o r e cha rac t e r s as in real languages and a message niay be one os rnore words.
Here the t e r m is loosely
Translat ion of language o r numerical symbols into sequences of e lec t r ica l signals.
An interval during which one frequency, phase or amplitude is t ransmit ted. One element may contain m o r e o r l e s s than one bit of information, depending upon the choice of coding.
The wrong interpretat ion by the rece iver that environmental noise is a t ransmi t ted message .
Quality of message t ranslat ion as measu red over a shor l period of t ime.
The combined functions of recognizing and t ranslat ing a message.
'The propcr dotorniination by the rece iver that a messagc' is present . only i f a message w a s scnt ; otherwise the determination represents a fa l se alarm o r reaction to an interfer ing signal.
Message recognition can occur
Correc t intcrprctat ion of the received message . is not nicssclge recognition, but c o r r e c t t ranslat ion cdri take placc only a f te r recognition.
This
systc.11) l ) t ’rforl l>an(.c*, E/ N One measure of the system’s capabilities in t e r m s of quality not cas t . Indicative of the signaling power required to achieve a specified grade of s e rv i ce a t a given rate .
0
se rv ice probability
tin1 c x availability
Probabili ty of achieving o r exceeding specified grade of s e rv i ce fo r a given percentage of the t ime.
Pe rcen t t ime during which a specified grade of s e rv i ce will be achieved with a cer ta in probability.
-: ra t io of cnergy per bit to a tmospheric noise spec t r a l power density. Usually expressed in db.
ii E / N
111 1iurnt)c.r of unique messages o r symbols i t is possible o r required to send.
= frequency modulation index.
=
f in
M s i ze o f the signaling alphabet o r number of frequencies.
n = number of elements o r signaling intervals per symbol.
= charac te r e r r o r ra tes for teletypewriter.
e r r o r r a t e for an a l e r t message o r switching function.
C P
= PS
= required signal power to a tmospheric noise power density ratic) to achieve a given grade of se rv ice .
a S / N
- - = mean value of available signal power to a tmospheric noise power
dcnsity ra t io a t a reception point. a S I N
AUSTRACT
An LF transmit t ing station for the Office of Civil Defense is descr ibed,
whicli is c.apable of meeting the s t r ingent requirements of ex t r eme reliabil i ty
for sptbcial control and warning messages during a national emergency. The
s ta t ion 's emergency operating frequency is 60 kHz, but i t is planned that it
m a y a l so be operated on a regular basis a t 20 kHz by the National Bureau of
Standards as a high-powered outlet for s tandard frequency and timing s ignals .
This joint operation increases the economic feasibil i ty and provides added
insurance of continuous availability for emergency use.
'l'hc station capabili t ies and a budget es t imate a r e outlined in the i i r s t
pa r t oi tlic report .
da ta and cos t - t radc f igurcs for the recommended facility.
La ter sections give the pre l iminary engineering support
<:-vi
' l ' h t a Office of Civil Defense has a requirement to t r ansmi t reliably,
and a t any t ime, cer ta in control signals and warning messages to the E m e r -
gency Broadcas t Industry and local government agencies in the event of a
national emergency.
s e rv i ce with, coverage over l a rge areas f rom a single s ta t ion .
implemented station can provide extremely high communications reliabil i ty
and t ime availability with a n extremely small probability of fa lse alarm.
Low frequenzy t ransmiss ion faci l i t ies can provide such
A properly
Since such stations would involve a large init ial investment and have
l imited emergency use , it? s e e m s reasonable to consider a joint operation
whereby another agency could operate and maintain the station on a regular
basis .
feasibil i ty and the probability of proper operation when required by OCD.
This a r rangement of dual-purpose station use inc reases the economic
The National Bureau of Standards is present ly disseminating frequency
and t ime interval s tandards on allocated frequencies of 20 kHz and 60 kHz.
This se rv i ce could be substantially improved by increasing the radiated
power a t these frequencies .
requirements can provide increased radiation capabilities a t 20 kHz. The
"cost- t rades" for a station compatible to both NBS and OCD, and for OCD
u s e only, are included.
The antenna and t ransmi t te r which mee t OCD's
One recommended facility and the corresponding budget es t imate is
given in Section 2 of this report .
engineering work and support data which f o r m the bas is f o r this selection.
Using the information of Section 3 , i t is also possible to define other
s imi l a r facil i t ies in t e r m s of performance and cost .
Section 3 indicates the pre l iminary
2 . 1 L)c:s( , r i l~t~or~ o f s tation p(:rfoririance charac te r i s t ics
'The t ransmi t te r station recommended h e r e has the approximate
charac te r i s t ics l is ted below.
61 kHz when under OCD control during tes t and emergency use.
operation i s assumed to b e a t 20 kMz by NBS.
The station opera tes in the neighborhood of
Normal
Ope rating F'requency
L< adi a t e d Pow e r
- 6 0 kHz
500 kw
U and w i dt h ( Ant t? nna S y s t e m )
Antenna System Efficiency . 83
T rans mi tte r Output Pow e r
1200 H z
Required 600 kw
1000 kw 'I'otal Facil i ty Input Power
20 k H z
3 0 kw
40 HI,
. 3 0
100 kw
200 kw
The OCD portion of the sys tem has the following a s sumed operational
cha rac t e r i s t i c s .
ovc r the poorest path assuming the t r ansmi t t e r s located in the vicinity of
Washington, D.C. and F o r t Collins, Colorado. Noise is assumed to have a
r in s -to-avc rage ra t io , (Vel), of 10 db in a 300 H z effective bandwidth.
Per formance specifications apply for wors t t ime noise
ALERT MESSAGE MODE:
Code 8 element
Signaling Kate 1 baud
T ime pe r message 8 seconds
Total number of messages pos s i hle 256
Modulation FSK, mf = 50 ( A f = * 25 H z )
c; - 2
ALERT MESSAGE MODE: (continued)
Probabili ty of message e r r o r
Probabili ty of fa lse alarm
Serv ice probability
Time availability (with noise suppression)
Timc availability (no noise s uppres sion)
Message recognition
Synchronization
1 in 3 yea r s fo r 300 rece ivers
0 . 9
98. 87'0
Determined by noise threshold exceedance s
Element synchronization established during t e s t periods and held between such periods using adequate osci l la tor stability. Charac te r synchronization established by message recognition, s torage and threshold logic.
TELETYPEWRITER MODE:
Code 7 element s t a r t - s top
Signaling ra te 50 baud
Information r a t e 3 5 . 7 b i t s / s ec .
Word r a t e 71.4 words /min .
Mo dul a t io n FSK, mf = 1 (Af = f 25 H z )
Detection Limiter-Dis c r imina tor
Pe rcen t charac te r e r r o r s 0.1%
S e r vi c e probability 0 . 9
Time availability (with noise s uppres sion) 937'0
The performance specifications apply for reception only and do not include the
input control l inks. This a s sumes that two t r ansmi t t e r s will be used, one nea r
c-3
k’ort Collins, Colorado, covering the West-Central and Western portion of
the continental United States , and the o ther nea r Washington, D. C . , for
E a s t e r n and Eas t -Cent ra l portions.
select ion, originating a t warning centers , will be received via microwave a t
the station f o r automatic OCD operation.
that in southern Louisiana.
1000 Iiours durllig the sunimor.
rllls -to-avel-age ratio, v
Switching control functions and message
The m o s t c r i t i ca l reception a r e a is
A wors t ca se noise occurs between 1200 and
CCIK predictions indicate this noise will have
of 10 db in a 300 H z bandwidth. The noise
suppression is a s s u m e d to be a s imple diode clipper s e t to clip the noise
1OYo o r niorc of the tirne.
d’
Various rece iver configurations were considered to es tabl ish performance
charac te r iza t ion of the sys tem.
of operation incorporates nar row band f i l t e rs and dual envelope detectors
lo r Inessage interpretat ion and a noise threshold f o r message recognition.
‘The pcriormanct. of a noncoherent detector of this type is not as good a s a
L ohcrc~nt rece iver , but the complcxity and cost is reduced by a substantial
,i t i l o u n t .
The recommended type for the a l e r t mode
‘The synchronization problems for OCD rece ive r s have not been worked
o n t i n detail.
is not recommended par t ly because of cos t considerations for the m o r e
c.:c.>mpl(-s rece iver and because of the required lock-up t imes which reduced
thc t ime available f o r e lement detection and increased signal-to-noise
I-cquirciricnts. Since signals will not be continuously available, e lement
synchronization should preferably I)e inherent in the rece iver itself a n d could
,ic.hicved during OCD tes t periods and maintained between such per iods ,
Some genera l concepts should be noted. Coherent detection
Geric.rally, nt.arly optimum performance i s real ized i f e lement synchronj za t ion
is vstablished within 10‘70 of an elenicnt length.
n~ei+iis elei-ric.nt synchronization should be established within f 100 mil l iseconds.
Such t i inii ig r an cbasily be chcckc,d 1)ctween OCD t e s t periods by using
iiidepi>ndc:iit means such as NBS timing signals f rom W WV.
F o r a 1 baud systerri this
The station i s expected to be a manned operation, although i t is
possiblc that remote monitor and control s i tes could be located a very
sho r t distance away.
have personnel available a t the s i te on shor t notice.
With any station of this s i ze i t is desirable to
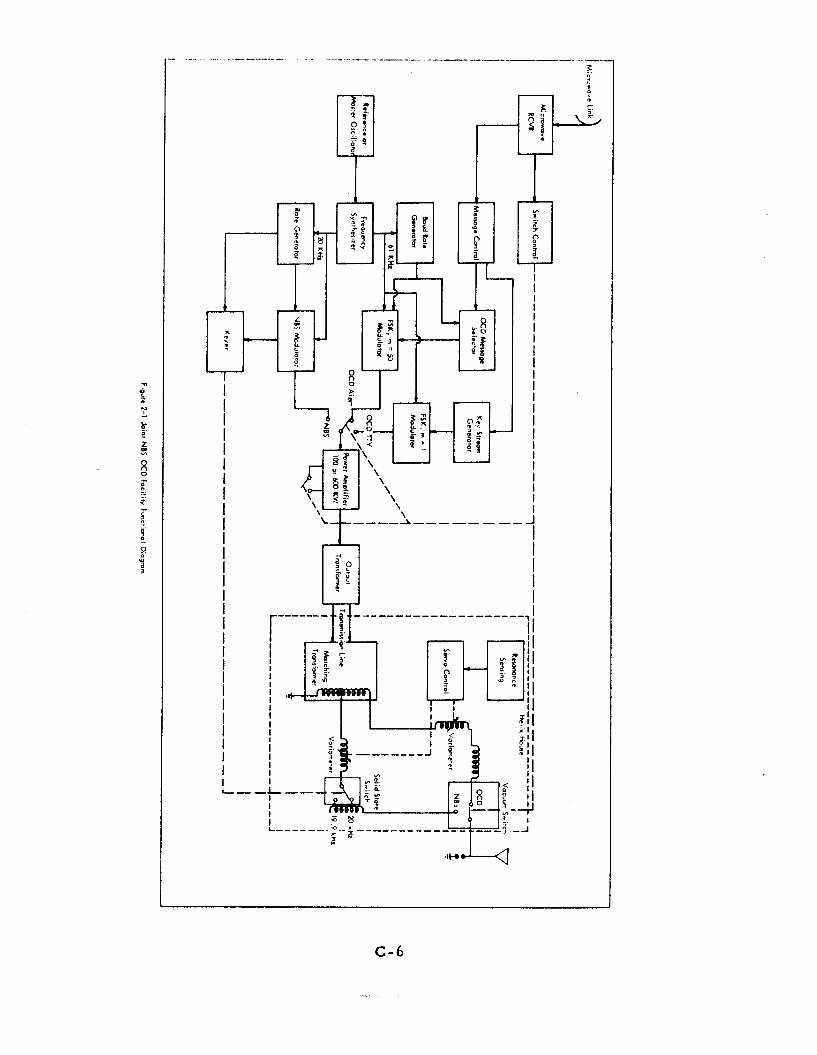
A diagram showing the basic functions to be performed by the
t r ansmi t t e r station is shown in Figure 2-1 .
LO kHz by NBS.
remote switching via the microwave link. This a lso s e r v e s as the station
control during an emergency, and such switching functions m u s t over r ide
any NBS operations.
the other t ransmi t te r power amplifier modules will be switched to standby
during normal operation.
to check operating s ta tus .
Normal station operation is a t
Per iodic testing and tes t messages may be sent by OCD by
Since NBS requi res only 100 kw of t r ansmi t t e r output,
NBS may al ternate the use of 100 kw modules
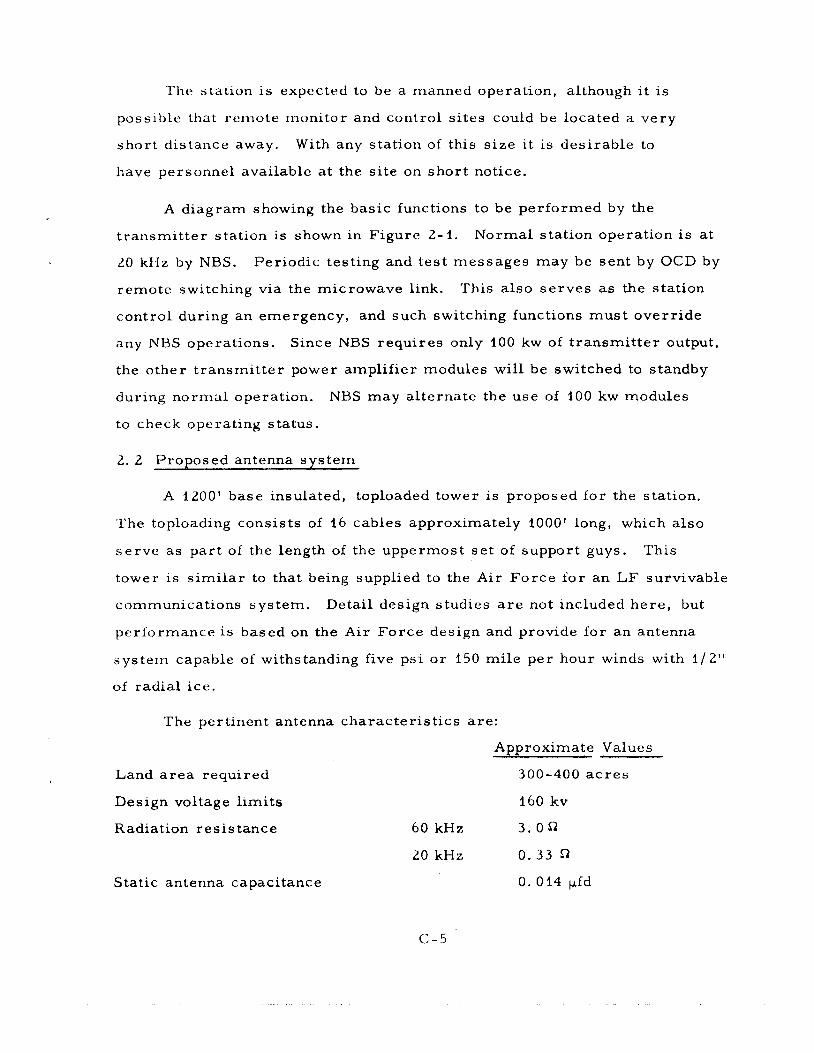
2. 2 Proposed antenna sys t em
A 1200' base insulated, toploaded tower is proposed for the station.
The toploading consists of 16 cables approximately 1000' long, which a l so
s e r v e a s par t of the length of the uppermost s e t of support guys. This
tower i s s imi l a r to that being supplied to the A i r Fo rce f o r a n LF survivable
communications sys tem. Detail design studies are not included he re , but
performance is based on the A i r Fo rce design and provide for an antenna
sys tem capable of withstanding five psi o r 150 mi le per hour winds with 1 / 2 "
of radial ice .
The pertinent antenna charac te r i s t ics a r e :
Approximate Values
Land a r e a required 300-400 a c r e s
Design voltage l imits 160 kv
Radiation res i s tance 60 kHz 3 . on 20 kHz 0 . 3 3
Static antenna capacitance 0. 014 pfd
c-5
I I I I I 1 I I I I I I I I I I I I I I I I I I I I I I I
v) .. 7
n
E i -
C - 6
Antenna base cu r ren t (for 30 kw at 20 kHz)
Efficiency @ 20 kHz
Efficiency @ 60 kHz
Actual height
Effective height
Inherent bandwidth 20 kHz
Inherent bandwidth 60 kHz
Inductance to tune 20 kHz
60 kHz
Hclix Q
Resonant frequency
2. 3 Faci l i tv lavout
300 amps
. 3 0
. 8 3
1220 feet
220 m e t e r s
12 Hz
980 Hz
4 . 2 mh
0. 17 m h
1300
74 kHz
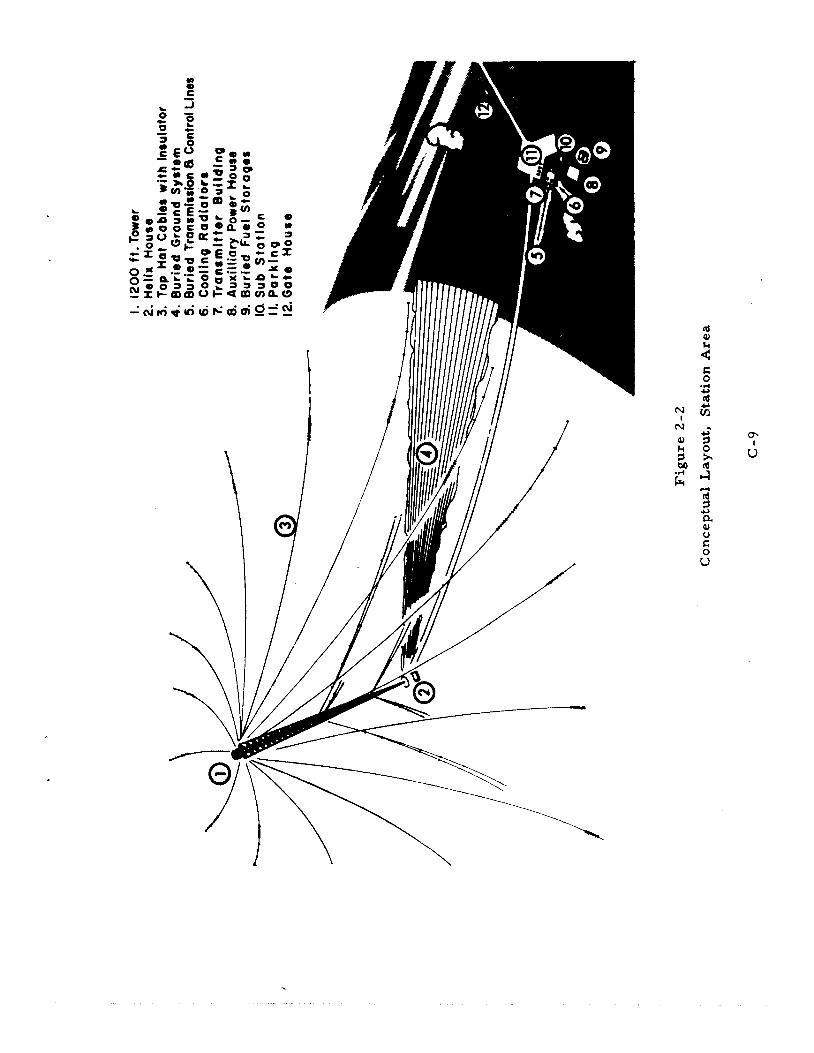
A perspective view of the recommended facil i ty is shown in F igure 2-2.
Details of a tentative antenna sys tem, t r ansmi t t e r and helix house are shown
i n E’igures2-2, 2 - 3 and 2-4. These figures should not be construed as
engineering drawings, but do show the conceptual magnitude of the envisioned
facility.
The antenna is essent ia l ly the s a m e as that being implemented for the
Air Fo rce 487 L program.
s i x 100 kw R F modules, each occupying a 4 x 4 x 6 foot space.
module includes built-in power supply, and is water cooled.
The t ransmi t te r power amplif ier consis ts of
Each
2. 4 Station costs
The c r i t e r i a used for the cost breakdown is outlined in Section 3 . 6.
The minimum antenna height which meets all the requirements is
chosen s ince this resu l t s in minimum total station costs . The costs for
the NBS/OCD station which meets the requi red 500 kw nea r 60 kHz and
3 . C;r.crurld radial sys tcm ( r e s i s t ance = 0. 1 ohms, Dia =:
4 LO 0 ' ) 70,000
4. Tuning inductors (helix house and inductors only) 110 ,000
5. Solid-state t r ansmi t t e r (600 kw) @ $2. OO/watt installed 1 , 2 0 0 , 0 0 0
breakdown that follows) 575,000 6. T ransmi t t e r building and auxiliary equipment (see
7. Auxiliary power (2-500 kw genera tors ) (includes complete installation, building and fuel s torage , switching and remote control, auto s t a r t and monitoring capabili t ies) 290,000
Total Station Costs - - $4, 215, 000
Costs shown here include allowances for plans and specifications of
thc complete station, but do not include provisions for personnel housing s ince
this requirement may not be essent ia l .
1200' tower antenna sys t em of the Air F o r c e sys t em present ly being implemented.
Curves and data, which form the basis of these es t imates , are given i n Section 3 .
Some savings may resu l t by using the
F o r a 500 kw station for OCD operation only, o r for joint operat ion with
NHS at 60 kHz, the cos t is as follows for a station with the s a m e performance
capabili t ies. Actual costs may differ somewhat. For example, t r ansmi t t e r
inodules may only be available in 100 kw units. It would ordinar i ly be m o r e
rea l i s t ic to s t a r t with availablc power output and le t the radiation capabili t ies ,
and thus the performance charac te r i s t ics , be degraded slightly.
1, Land - 280 a c r e s @ $ 7 5 0 / a c r e $ 210,000
' r h e c o s t s for the t ransmi t te r building include not only the s t ruc tu re but
all of the equipment auxiliary to, but excluding the power amplifier.
es t imated cost breakdown for the principal auxiliary equipment is tabulated
An
below for the joint station.
Auxiliary Equipment Costs
Item
Microwave link ( 2 )
Message logic c i rcui ts ( 2 )
OCD-FSK modulators ( 2 )
Frequency s tandard (ces ium)
Frequency synthesizer ( 2 )
Switch control ( 2 )
NBS signal generator (1)
Dummy load (1)
Monitor and control console (1)
Matching t r ans fo rmer ( 2 )
Variometcrs ( 2 )
Solid s ta te switch (500 a m p s ) (1)
Vacuum switch ( 2 )
Est imated Installed Cost
$ 50,000
10,000
20 ,000
(3) 75 ,000
50,000
15,000
10,000
30,000
35 ,000
30,000
20,000
7 5 , 0 0 0
10,000
Sensing and se rvo control ( 2 ) 15,000
Total Auxiliary - - $445,000
Building - 5200' @ $25 sq. ft. 130 ,000
Total Building and Auxiliary - - $575 ,000
The total provides $130, 000 for the 5200 square foot building, o r $25 per
squa re foot. This $25 per square foot building cos ts should be sufficient
to allow for the following special features .
1. Tempera ture and humidity control.
2. CO fire-extinguishing system.
3. 2
Sub-iloor space in t r ansmi t t e r room and associated a r e a s for cable- t ray interconnection.
4. Screened room.
5.
0 .
Special plunibinK for liquid cooling of solid s ta te t r ansmi t t e r .
Special shielding and grounding requirements .
2 . 5 P r i m e power cos t s
Elec t r ic r a t e s a r e general ly based on a demand cha rge plus the
energy charge .
the demand and thus the operating cos t s by a considerable amount.
1000 kw of demand p r i m e power and using typical r a t e schedules the cos t
per month is approximately $2500. This is approximately five t imes the
cos t /month for the station operating a t normal power levels for 20 kHz
requi red by NBS.
Intermit tent operation of the station by OCD inc reases
F o r
C-14
In S ~ * c * t i u n I! t l i t . (.h,irc1cteristic-s and c o s t s were given for the
rt'c 0Illlklt.ndt~d st,itioii.
engineering s tudies using station c r i t e r i a given by OCD and N B S and using
ce r t a in essent ia l and reasonable assumptions.
given in the following sect ions along with the pre l iminary engineering data .
l 'his recommendation was based on p re l imina ry
These operational c r i t e r i a a r e
3 . 1 Siting
The selection of a location for the V L F / L F facil i ty is par t ly dependent
on fdctors which d o not necessa r i ly affect the performance of the station
i tself , but wi l l de te rmine i ts operational capabili t ies. These include:
1)
2 ) Isolation f rom p r i m e t a rge t s
3 ) Rndioactivc fallout danger
4)
5)
Fac tors which do affect performance, and therefore c o s t s , and should
Input or control link requi rements
Availability ut p r i m a r y power and other servicing requi rements
Protect ion of facil i ty and control links from sabotage
be considered when the specific s i t e is chosen include:
1 ) Ground conductivity which affects the e lec t r ica l per formance of the radiation s y s t e m
Site t e r r a i n and geological fea tures in proximity 2 )
3) Natural hazards such as wind, icing, and frequency of local t hun d e r s t o r m a c t iv i t y
Propagation paths to des i red reception points
The. alt i tudc which affects the voltage l imi t s on the antenna
4)
5 )
Location of the t ransmit t ing antenna and station operating personnel
w i t h r e spec t to ta rge ts l iable to a tomic at tack may be determined f r o m
Figure 3-1 . A distance of four mi les , for example, gives adequate p ro -
tection f rom 1 megaton blast and nuclear radiation for tower and personnel ,
proviciing the towcr has hcen dcsigned to withstand 75 mph gusts of wind. A
distance of 15 miles is required to l imi t exposed pe r sons to f i r s t deg ree
burns f rom the result ing the rma l radiation.
dependent upon effects of a i r density, alt i tude of explosion and intervening
objects , s o a safety factor of t h ree should probably be considered in actual
si t ing.
These cu rves a r e quite
This study a s sumes the antenna is located a t s e a level. Although two
t ransmit t ing s i t e s a r e requi red only the one in Virginia is expected to be
used by N B S for 20 kHz where the antenna voltage l imi t s r e s t r i c t the radiated
power. The antenna s y s t e m a t Ft. Collins, Colorado will be approximately
5000 feet above s e a level and will be operated by N U S only a t 60 kHz.
antenna i i t this s i t e is expected t o be input-power l imited and the altitude affect
can bc neglected.
The
3.2 Frequency tlepcntlencc o f ratliated power recluirements
An initicil task on the. cont rac t was to calculate the radiated power
requi rements as a function of frequency for a typical TTY s y s t e m during the
w o r s t c a s e tinie-block and over paths selected by the Government.
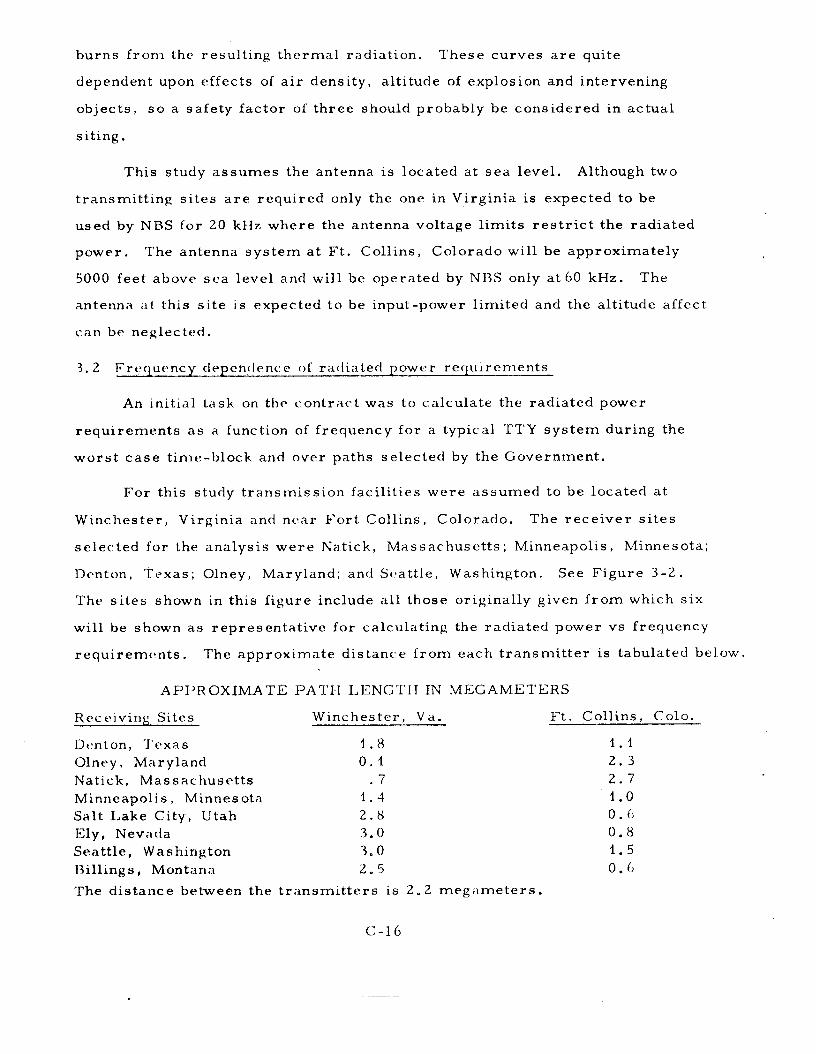
F o r this study t r ansmiss ion facil i t ies were assumed to be located a t
Winchester , Virginia and near F o r t Collins, Colorado. The r ece ive r s i t e s
selected for the analysis w e r e Natick, Massachuse t t s ; Minneapolis, Minnesota;
Denton, 'Tcxas; Olney, Maryland; and Soattle, Washington. See F igu re 3-2.
The si tes shown in this f igure include a l l those originally given f r o m which s ix
will be shown as representa t ive for calculating the radiated power vs frequency
requirements. The approximate dis tance f r o m each t r ansmi t t e r is tabulated below.
APPROXIMATE PATH LENG'l 'II IN MEGAMETERS
Iicc eiviny Si tes Winchester , V d . F t . Collins, Colo.
Dt.n t on, T e x a s 1 .8 1 . 1 Olney , Maryland 0 . 1 2 . 3 Na t i c k , Ma s s a c hu s e t t s Minneapolis, Minnesota 1 . 4 1 .0 Salt. Lake City, Utah 2 .8 0 . 0 Ely, Nevada 3 . 0 0 . 8 S e n ttle , Was hing ton 3.0 1 .5 Hillings, Montanii 2 . 5 0. 6
. 7 2 . 7
The dis tance between the t r a n s m i t t e r s is 2.2 megameters .
C-16
0
*
Y
0 0, n
0
c
L 3
U P o ) .-
c-17
I I
C-18
Signal levels were computed fo r only six paths and for different frequencies
in the LF band f rom the ground wave equation,
- S (ground wave, db) = 109. 5 - 20 log d t W
g
where
d = path distance on the surface of the ear th in km;
W = amplitude loss in db associated with the effect of the ea r th on the radiated field;
and the sky wave equation,
- S (sky wave, db) = 103. 6 -D t A t 20 log cos \k-L -L t C ' P t t r m
-ml: - (m-1) I i g
where
D
A
L
= inverse distance attenuation in db relative to unit r a y distance;
= t ransmit t ing antenna f ree-space gain in db a t the launching angle, \Is
= t ransmit t ing antenna launching loss in db relative to a loop in
P
t
f r e e space;
L = receiving antenna launching loss in db relative to a loop in f ree r
C '
space ;
= total effective convergence due to a curved ionosphere and ear th , m
in db;
m = number of ray hops;
I = ionospheric reflection loss in db; i
I = ground reflection o r diffraction loss over a homogeneous ea r th in db. g
The mean noise level a t each frequency was obtained f rom CCIR Report 322 [I]. - - The mean value of available signal-to-noise-density ratio,
be determined.
1 kw. The requi red t ransmi t te r power, relative to 1 kw a t a given frequency,
S/Na can then
This was done by normalizing t r ansmi t t e r radiated power to
can then be obtained from:
X P (db) = 20 log S / N -20 log S / N t T
1' a a
wlicrc. S / N is the signal-to-noise-density voltage rat io required by the rece iver - - a
to give the des i red grade of s e rv i ce and S / N
available a t the rece iver for 1 kw radiated by the t ransmi t te r .
f ac to r to account for the temporal and spat ia l variations of S, N
'The magnitude of T
is the signal-to-noise-density ra t io a T is the variabil i ty
a ' a - X
S and E . is a function of the t ime availability ( T . A . ) , the se rv i ce
X
probability ( S . P. ), i. e . , the repeatability and predictability of the signal-to-
noise ratio. Thus
- - T = x u ( S / N a. ) t x2 up(E) X 1
- - where u ( S / N ) depends on the signal fading and noise variation over a given
path and within a par t icu lar t ime block.
uncertainties of all the pa rame te r s involved in the prediction p rocesses . 1
x can be read f rom Figure 3 - 3 for a par t icular t ime availability o r se rv i cc
probability of i n t e re s t , Techniques for deriving u ( S / N ) and u ( E ) a re given
i n re fe rence [ 2 ] , and will not be descr ibed he re .
a u (E) combines s ta t is t ical ly the
P x and
- - 2
a P
Since T is a lunction of x and x which a r e de te rmmed by an X 1 2'
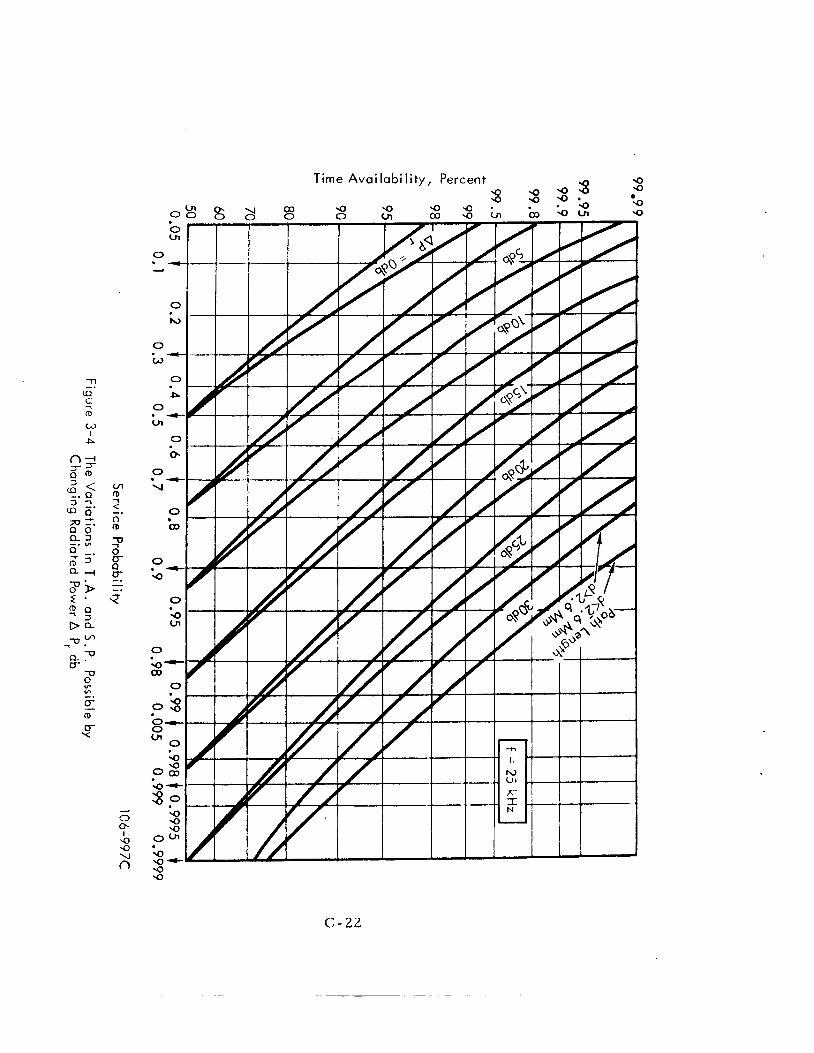
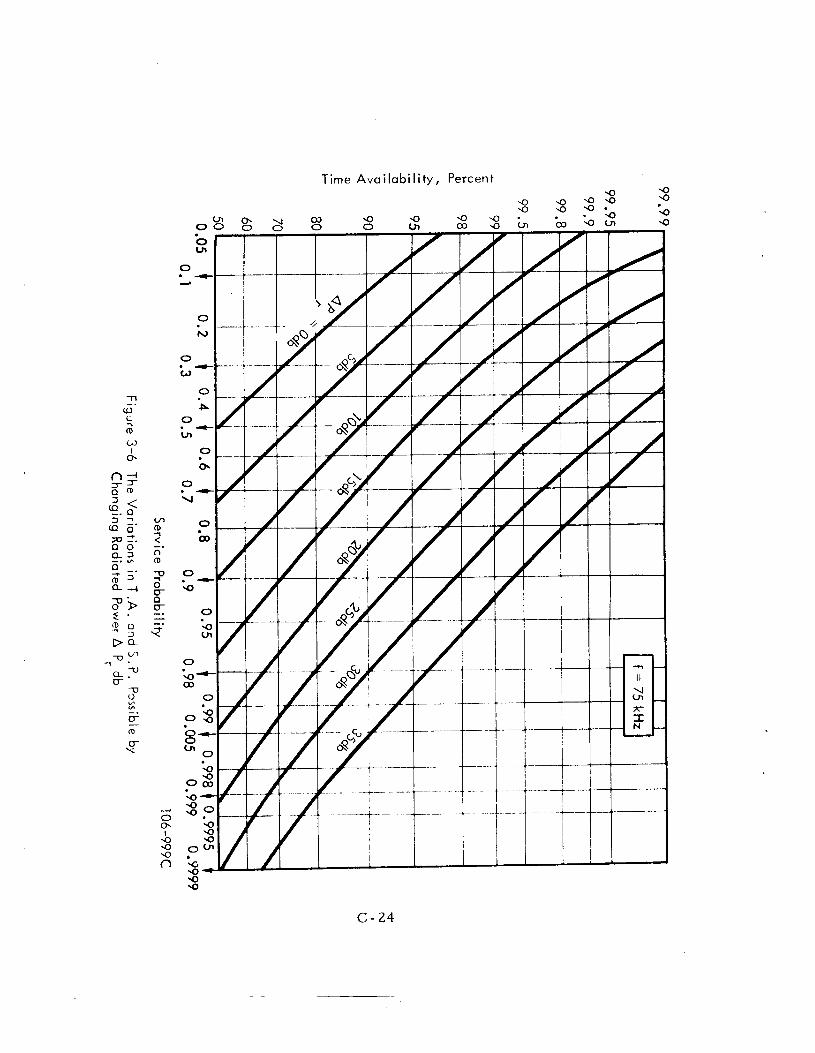
a r b i t r a r y choice of t ime availability and se rv ice probability, there is a t rade-
off ,ivailablc between these two fac tors . The variation in t ime availability and
s( ' rvice probability pcssible by changing the radiated power A P
for three frequencies: 25, 50 and 75 kHz in F igures 3 - 4 , 3-5, and 3 - 6 . Curves
&I-c parainctr ic in A P , the amount which must be added to the P
cxdculated for T = 0.
db is shown r
that was r r
X
A specific radiated power rcquirement can now be determined as a
function of frequency for any givcn T. A . and S. P. i f the ra t io of energy per
inlormation bit-to-noise power density requi red f o r a specifled e r r o r r a t e a t
the. rece iver is given,
s o u r c e , thc signal design, the information, the modulation, and the detection
s c l i ( ~ m c used.
This ra t io depends on the information content of the
c-21
+ -0: E o 0: Ov)
-9 ~g 0 0
0 co
0 -0:
v)
0 0:
-?
c9
0
0
h
0 t .
9 0
,"! 0 *
0
,c! 0
N
0
7 ).. 0
rr) 0 0
x D
-n _. w c m w I 0.
..1
0 0.
Time Avai labi l i ty , Percent
9 9
C - 24
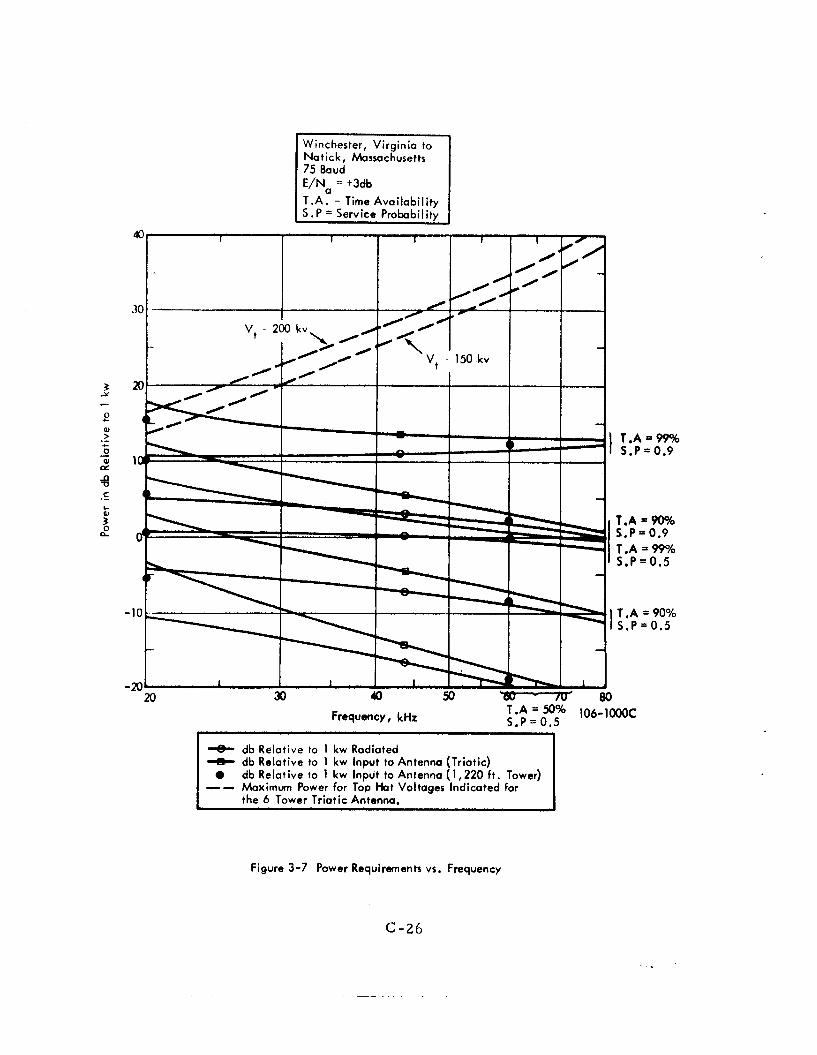
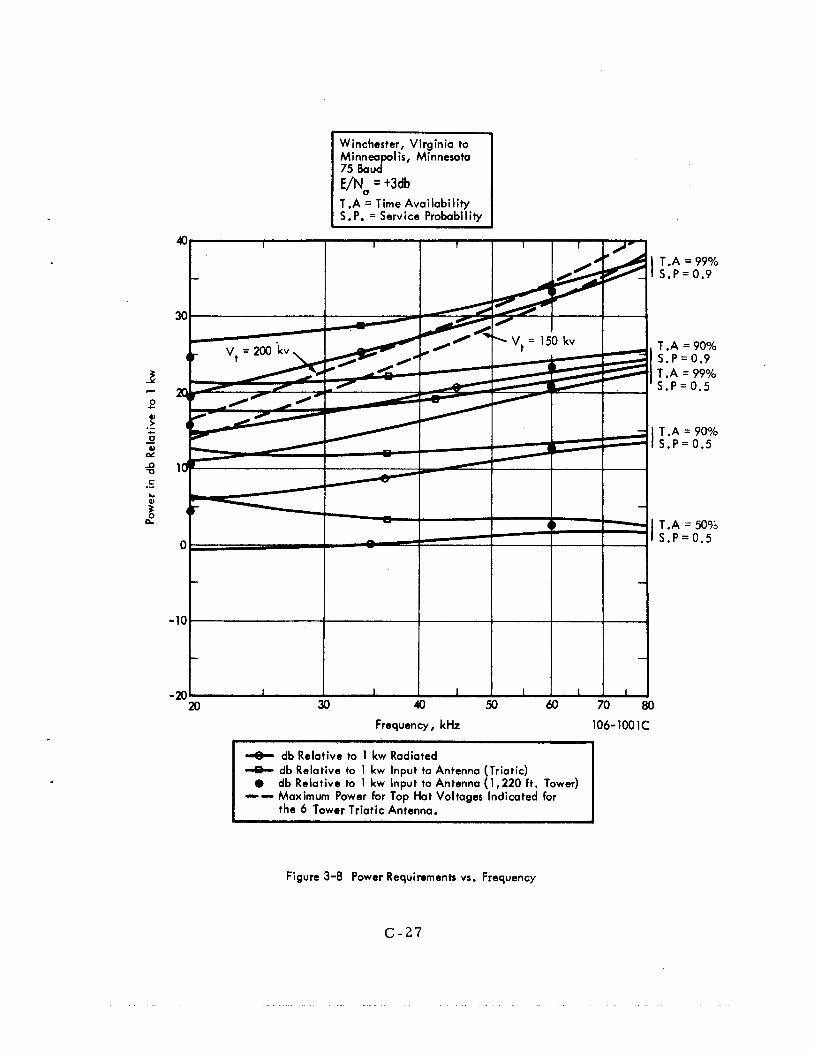
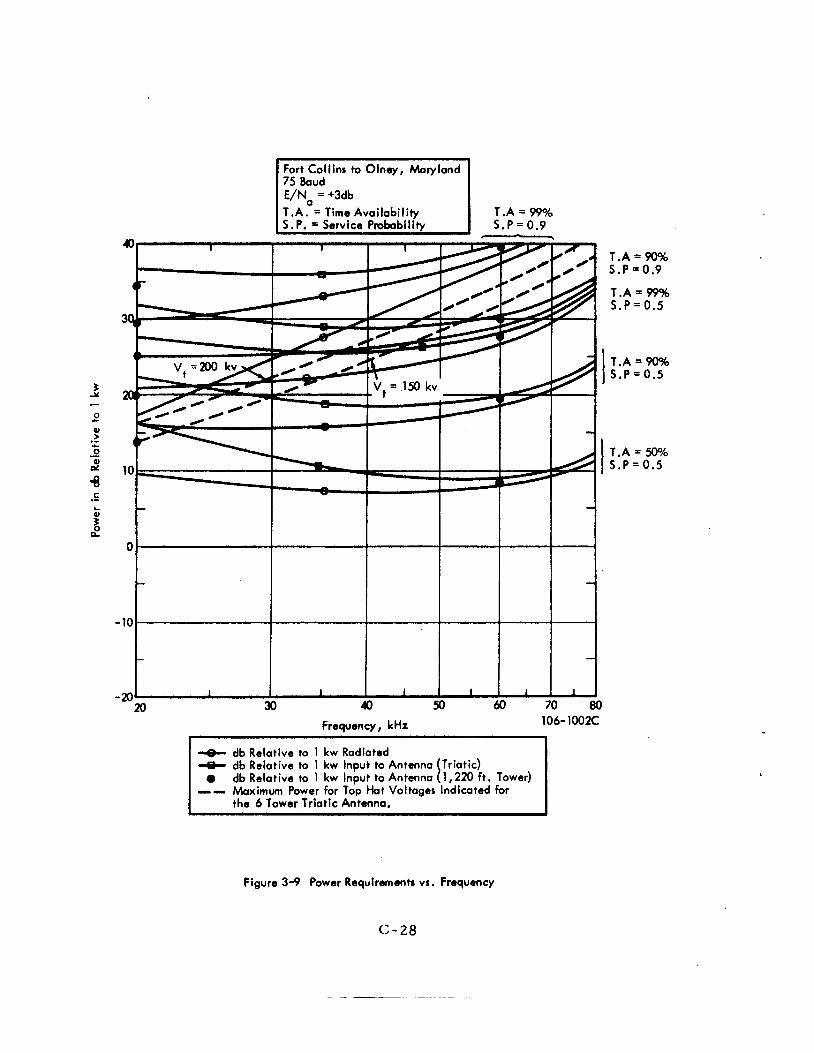
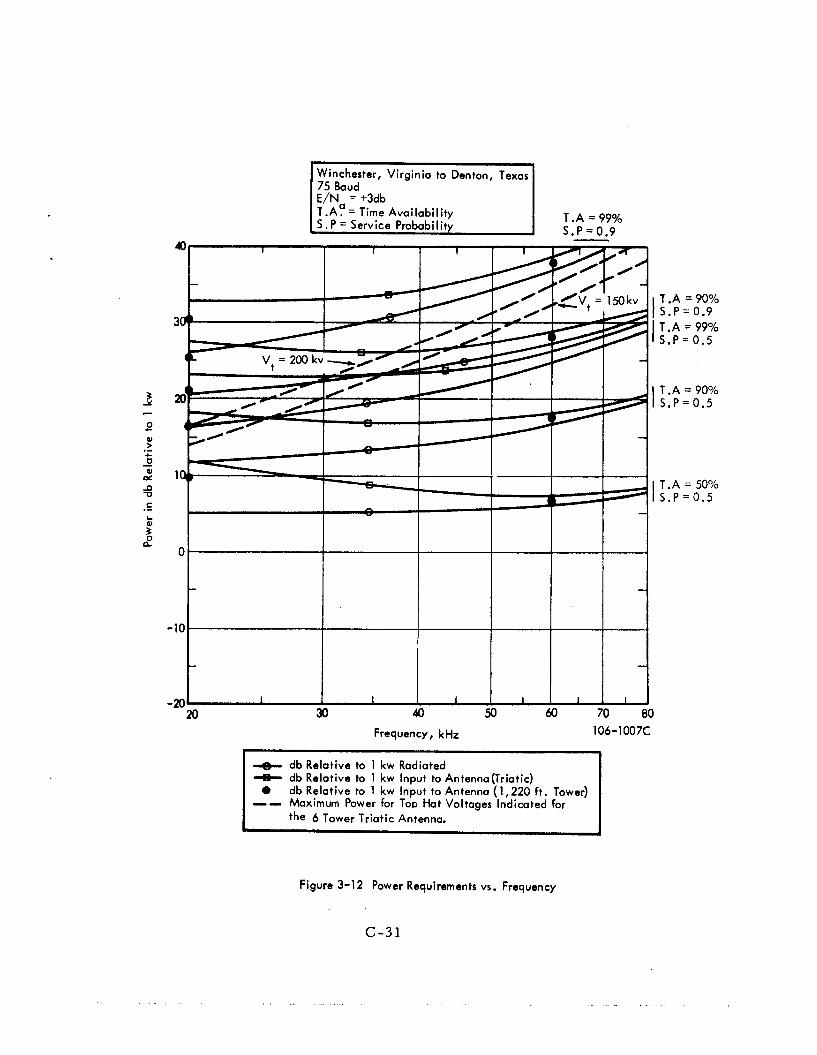
Examplcs a r e given for cer ta in paths in F igures 3 - 7 through 3-12 fo r
ii tclctypc sys t em opcra t ing a t 75 baud.
r t ~ s u m ~ : d to rcqujre E / N = t 3 db fo r 0. 1% charac te r e r r o r s . This is
a c l ~ l ~ ~ ~ ~ b l ~ ~ with an optimum 1’SK sys tem and a modulation index of 1 / 2
opc I-;iting with noise clipping i n the atmospheric noise environment.
oI’ t . h c . w o r s t t ime block, the curves a r e plotted in db relative to 1 kw of radiated
powr.1- ,ind also in db rclative to 1 kw o i antenna input power.
c ‘ u r v ( ’ s is most indicative of the performance cost of the station. These input
1~owc- r c u r v t > s a r e obtained by dividing those relative to radiated power by the
;.intc’nna cfficic-ncy which changes considcrably with frequency.
inclic,;itcd i c ) r both a six tower t r ia t ic type of antenna and a single, toploaded
1LLO’ towcr.
with 150 and L O O kv voltage l imi t s on the t r ia t ic antenna.
voltage-limit curves should be increascd a,pproximately 0. 8 db a t 20 Hz and
2. 1 db a t 60 Z-lz.
The performance of the sys t em is
a
.I, -4.
Typical
The l a t t e r s e t of
Points a r e
Also shown by dashed l ines a r e the power radiation capabilities
F o r the tower these
Based on this data alone i t would appear that the optimum frequency for
F o r the longest paths thc: OCD sys t em would be at the lower end of the LF band.
and fo r thc higher t ime availability and serv ice probability the power ve r sus
f r c . c l u c n c y curve shows a fa i r ly broad minimum around 30 kHz. Discussions
w i t h OCD personnel, however, indicated a preference for the 60 kHz region
becaus c U i frequency allocation considerations and a l s o because m o r e is known
about the propagating media in this region. This knowledge is available largely
ticcause o i measurements on the existing NBS 60 kIlz standard frequency station
located i n Colorado.
::-‘l’hc: optiiiiuiri FSK sys tem pcrformance can be realized when mf = % using ;i correlation typc: dctector. o r iiic.ompatiblc (denoted MSK) with s imple l imi t e r discr iminator detectors dc.pending on the keying logic a t the t ransmi t te r . r a t h e r than a correlat ion detector are usedwith FSK, m = yi signaling then the pertorrnanc:c is degraded approximately 3 db o r essentially the s a m e as E’SK, m . . 1 systcms. z t 3 db is for a 75 baud sys tem in typical a t inosphrr ic noisc with a reasonabtc amount of clipping. shown latLbr i n Sc3ctiorl 3 . 3 . 6 as E / N = f1 db, but h e r e i t is for 50 baud a t a specific noisc environment and clipplng level.
The lower end of the band (around 30 kHz) is a t ransi t ion
Such a sys tem is compatible(s0metimes denoted CSK)
If mark-space references
The value of E / N This same system is
a
Winchester, Virginia to Natick, Massachusetts 75 Baud E/Na = +3db
T.A. = Time Avai labi l i ty S.P = Service Probability
3 Y c
0
W +
.- c Q W
p?
-0 C
W
n
.- L
z (L
T.A = 50% 106-1000~ S.P = 0.5 Frcqumcy , kHz
-8- db Relative to 1 kw Radiated -6. db Relative to 1 kw Input to Antenna (Triatic) 0 db Relative to 1 kw Input to Antenna (1,220 ft . Tower) -- Maximum Power for TOP k t Voltages Indicated far
the 6 Tower Triatic Antenna.
Figure 3-7 Power Requirements vs. Frequency
C-26
W inchester , Virgin io to Minnea l is, Minnesota 75 B a u r E/Na = +3db T .A = Time Availability S.P. = Service Probability
.4.. db Relative to 1 kw Input to Antenna (Triotic)
-- Maximum Power for Top Hat Voltages Indicated for 0 db Relative to 1 kw Input to Antenna (1,220 ft. Tower)
the 6 Tower Triatic Antenna.
Figure 3-8 Power Requirements vs. Frequency
C-27
T.A = 99% S.P= 0.9
T.A = 90% S.P = 0.9 T .A = 99% S.P= 0.5
T.A = 90% S.P = 0.5
T.A = 50% S.P = 0.5
I Fort Collins to Olney, Maryland 75 Baud E/Na = +3db T.A. = Time Availability
T.A = 90% S.P=0.9
T.A = 99% S.P = 0.5
Frequency, kHz 106- l002C
-8- db Relative to 1 kw Radiated db Relative to 1 kw Input to Antenna Triatic)
-- Maximum Power for Top Hat Voltages Indicated for the 6 Tower Triatic Antenna,
0 db Relative to 1 kw Input to Antenna I 1,220 ft. Tower)
T.A = 90% S.P = 0.5 I T.A = 50% S.P=0.5 I
3
Figure 3-9 Power Requirements VI. Frequency
C-28
Fort Collins to Denton, Texas 75 Baud E/Na = +3db T.A. = Time Availability S.P. =Service Probability
-10
-20)
- - I 1 I I I 1 ,
106- 1003C Frequency, k H r
+ db Relative to 1 kw Input to Antenna (Triatic)
-- Maximum Power for Top Hat Voltages Indicated for db Relative to 1 kw Input to Antenna (1,220 ft. Tower)
the 6 Tower Triatic Antenna.
Figure 3-10 Power Requirements VI. Frequency
C - 2 9
T.A = 99% S.P = 0.9
T .A = 90% S.P = 0.9 T.A = 99% S.P = 0.5
T .A = 90% S;P= 0.5
T.A= 50% S.P=0.5
Fort Collins to Seattle, Washington 75 Baud E/Na = +3db T.A = Time Availability
T.A = 99% S.P = 0.9
T .A = 90% S.P = 0.9 T.A = 99% S.P = 0.5
T .A = 90% S.P = 0.5
T,A = 50% S.F = 0.5
+ db Relative to 1 kw Radiatrd + db Relative to 1 kw Input to Antenna (Triatic) 0 db Relative to 1 kw Input to Antonna (1,220 ft. Tower) - - Maximum Power for Top Hat Voltages Indicated for
the 6 lower Triatic Antenna.
Figure 3-1 1 Power Requiranentr vs. Frequency
C-30
.-
Winchester, Virginia to Denton, Texas 75 Baud -1 E/Na = +3db T.A. = Time Availability
1 I 1 1 I I 40
T.A = 99% S.P=0.9 c__
I
1CAL.. I 1
Frequency, kHz 106- 1007C ~~~
+ db Relative to 1 kw Radiated -8- db Relative to 1 kw Input to Antennauriotic)
-- Moximum Power for TOD Hot Voltages Indicated for 0 db Relative to 1 kw Input to Antenna (1,220 ft. Tower)
the 6 Tower Triatic Antenna.
Figure 3-12 Power Requirements vs. Frequency
T.A = 90% S.P = 0.9 T.A = 99% S.P = 0.5
T .A = 90% S . P = 0 . 5
T .A = 50% S . P = 0.5
C-31
. .
I g i ~ w l i v r c both mode and r i l y L ~ ~ v J ~ Y h i ~ v c : ccr ta in lirnitdtioiis, i m t f p r c b d i ~ L ~ ~ ~ J I
Thus i t was lcll t t : ~ . , ~ . i .uvs may not be as reliablc as indicated by these curves.
that using a frcqucncy near 60 kHz would be preferable and would minimize the
amount of power required to achieve a reaaonable confidence in sys t em performailc:
Subsequent analysis has a s sumed an OCD operation near 60 kHz and is *
l imited to the toploaded tower configuration.
1~’igurcs 3-7 through 3-12 a r c plotted for a specific sys t em operatiiig at a
c l i ~ t ~ i ra te oL 75 baud and having a E / N
Pow(*i* rcquircmentv for other baud and sys t ems with different E / N requi re -
mc!nt-s at this error ratc can also bc tlelerrnined ueing Figures 3-13 and 3-14.
‘rlicsc: show the increase or dec rease in power required in db relative to the
75 baud sys tem,
r a t e in baud, and Figure 3-14 gives the power t rade as a function of E / N _ .
of t3 db for 0. 1% cha rac t e r e r r o r s . a
a
Figure 3-13 8hawv the power t rade as a function of t ransmission
ri
The following sect ions descr ibe s o m e of tha operational requiremc>nts
oi thcb OCD s y s t e m and s o m e techniques for minimizing the power requirements
by proper signal design to m e e t these needs. The per formance charac te r i s t ics
of the recommended sys t em a r e then shown, In Section 3. 5 cost-per-radiated-
watt curves a r e derived fo r a transmitt ing facil i ty with a toploaded tower by
evaluc&ting the costs of each m a j o r section as a function of antenna heights.
‘l’hose curves a r e then uscd to determine over -a l l costs of some typical
.L, lation configurations.
w i l h pc rfo rmance data and make reasonable choices af suitable faci l i t ies .
It is then possible to combine this cost information
:::Actually three diffcrent typee of antennas w e r e included in the initial studies of optimum frequency, namely the toploaded tower, a t r ia t ic type of antenna s i m i l a r to that used by the Navy at Annapolis, Maryland, and the supported toploadcd :+nicnnn s imi l a r to that used a t Cut ler , Maine. At a meeting between OCD, NDS, and IIECO personncl la te in 1965 some cost t rades between s e v e r a l antenna coniigurations wcre shown. nic>gciwattH a t frequencies as low as 14 kHz and appeared high in cost re la t ive to t h e m u r c siniplc toploacl tower for a few 100 kw capability a t 60 kHz. argurric!nts apply, but to a l e s s e r extent, when comparing costs of the t r ia t ic typc. Thus o n l y the toploaded tower was considered in l a t e r studies once a frequcncy nL’dr 00 kI4z was selected and i t appeared the radiation requirements would bt. on t h c o r d e r of hundreds of kilowatte.
The Cutler type was originally developed for radidtin,
Similar
C-32
---I--- t - - - -
I
I
I
106-1008C
3600 1-901 Change in Required Radiated Power, db
I N w
I
%
I N VI
I
2
I
u -
I
C -
I U
C
i L
I
C
VI
c- 34
3 . 3 OCD requirements and systc-.m concepts
The> O C D operational requirements for a radio warning sys tem involve
basically three types of se rv ice , namely:
1. A highly reliable switching serv ice . F o r example, provisions to turn on civil defense warning s i r ens and operate other auto- mat ic portions of the radio warning sys tem f rom the National Warning Center .
Teletype traffic to the civil defense subs t ruc ture and to federa l and s ta te government agencies.
Voice information to the general public.
2 .
3 .
The two stations operating near 60 kHz a r e expected to provide se rv ice of
type 1 and 2 . Voice se rv ice to the public will be supplied by other stations.
The highly reliable switching se rv ice is the p r imary link to various warning
centc.rs and niust b e capable of instantaneous se rv ice , extremely high t ime
availability and minimum false a l a r m ra t e throughout the day and night and
for all seasons oi the year .
s e rv i ce a t minimum cos t , will depend on a number of factors including the
total number of different messages required, the t ime available to send one
m e s s a g e , the allowable false a l a r m ra te , the des i red reliability, the
permiss ib le t ime availability, the number and location of rece ivers to which
information must be supplied, and the t ransmi t te r location and power radiation
capabili t ies.
discussions with OCD.
noted below.
The optimum sys tem, which can provide this
The magnitude of some of these pa rame te r s were based on
Other numerical values were assigned a rb i t r a r i l y as
‘The total number of warning o r switching messages required lies
somewhere between 16 and 256.
teletypewriter ( T T Y ) addressing is desired.
of these messages i s 1 2 seconds.
has a l ready taken place, but some allowance must s t i l l be made for
synchronizing and performing other operations.
rccc ivers in 3 y r ’ a r s and a message reliability of 1 message e r r o r in 1 0 , 0 0 0 ai-(’
as s urn cd.
The higher number is required i f spccial re l ia1 , l~
A maximum t ime for t ransmit t ing on(.
This assumes that t r ansmi t t e r switching
A fa lse a l a r m ra t e of 1 i n 3 0 0
c - 3 5
Following the warning message the station should be capable of con-
verting to s tandard TTY format operating a t 50 o r 75 baud, using 7-unit,
s t a r t - s top code to t ransmi t general information and instructions to the
various agencies.
charac te r e r r o r s .
Teletype e r r o r ra tes should be on the o r d e r of 0. 1 %
It should be noted that the s ta ted o r proposed values for s e rv i ce
probability, t ime availability, false a l a r m ra t e and probabilities of m e s s a g e
and element e r r o r apply to the expected condition for only the w o r s t signal-
to-noise ratio.
environment, and those in the l ea s t favorable locations will s e e the wors t
noise conditions only a ra ther small pa r t of the t ime.
Most of the rece ivers will be si tuated in a bet ter per formance
When the station is normal ly operated by NBS, periodic tes t s will be
required by OCD.
every one o r two hours , and should include the ent i re l ine f r o m control center
to the station via microwave link and to all reception points.
These tes ts a r e expected to involve a few minutes out of
3 . 3 . 1 Coding and modulation
Coding precedes modulation and concerns the choice of means for
translating the verbal o r numer ic information into e lec t r ica l variations.
A code using two o r m o r e d iscre te levels o r signals ra ther than continuous
variation improves reliabil i ty of reception i f bandwidth is res t r ic ted , but,
m o r e important , i t provides for machine operations to be easily understood
and c a r r i e d out a t unmanned stations.
Modulation involves the application of the coded message to a c a r r i e r
wave by varying c a r r i e r amplitude, phase o r frequency.
frequency often r e s t r i c t s the choice of modulation methods that a r e practicable.
The l imitations a r e generally based on reasonable t ransmi t te r and antenna
designs and available frequency space.
voltage l imitations for l a rge radiated powers make pract ical the use of
s ing le channel (o r possibly t ime-multiplexed) frequency-shift keying with
A choice of c a r r i e r
In the vicinity of 60 kHz, t ransmi t te r
C - 3 6
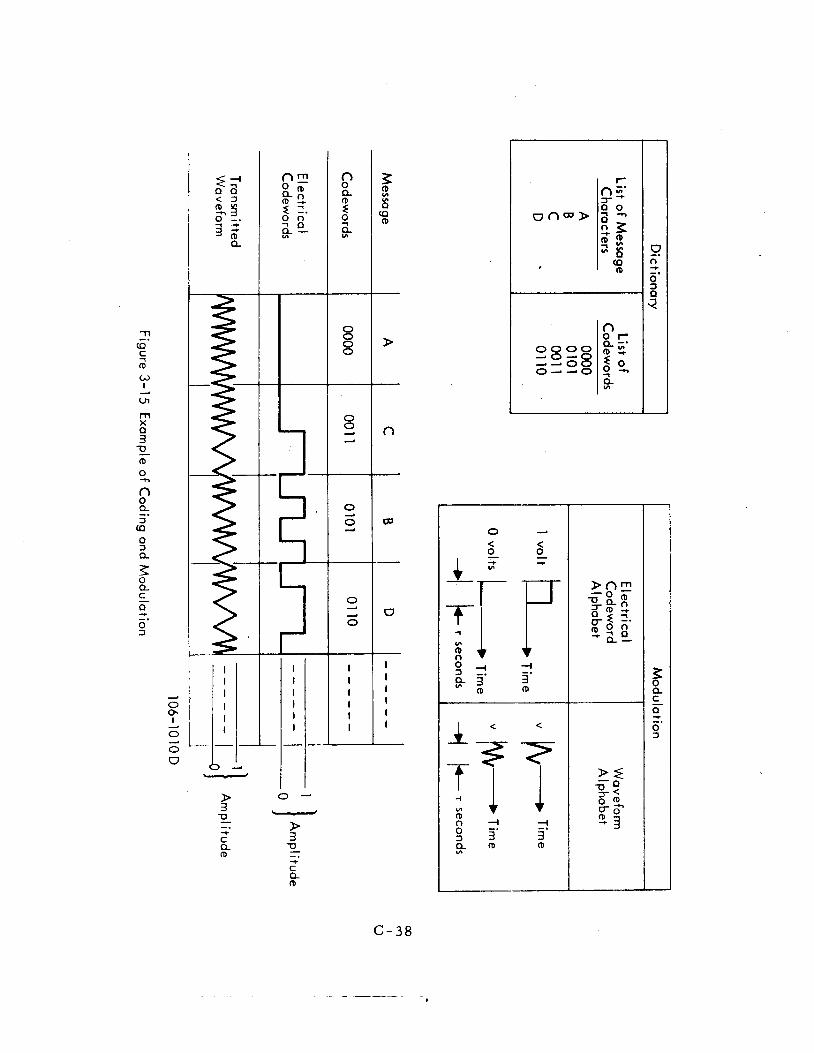
ptids(. c o n t i n u i t y a t c.lemt.rit t ransi t ions.
to us ing on ly two frequencies , however.
?'he sys tem need not be l imited
See Figure 3 - 1 5 for an example
of coding and modulation.
3 . 3 . L Info rniatioti content
'To i nc rcase the efficiency of information t ransfer i t is necessa ry to
have some measu re of the information content of each message that might be
sent.
can be made.
and all messages are equally likely to be sent , the information content of each
i s :
Frequently this is ra ther easy to do i f some res t r ic t ing assumptions
F o r example, if there is a finite number of possible messages
I = log m bits 2
where m i s the number of possible messages . If no other factors were to
bc considered, the most reasonable coding would make all these messages
of equal length and complexity.
The s imples t example is the binary waveform where a detector mus t
decide whether frequency f o r f was sent. If one is as likely as the other
to be sent , the information content in each decision is one bit. To build on
this example, i f there a r e 3 2 possible messages the detector m u s t make
only log ( 3 2 ) = 5 binary decisions in o r d e r to determine which message
was sent . (Inversely, with five binary decisions made , up to 2 = 3 2
combinations o r different words may be t ransmit ted. ) Of course , i f noise
i s p resent there is uncertainty in the decision and hence some probability
of making one o r m o r e decisions incorrect ly .
1 2
5 L
Another possibility would be to send only one of 3 2 different f requencies .
Then there) i s only one decision to be made, but that decision provides five
bits of information. In this case , the detector may have five t imes as long
in which to make the decision and s t i l l del iver information a t the s a m e
ra t e as for the previous case of five sepa ra t e decisions. Generally, f o r a
c-37
0 3 Q
-. 0 3
0 0 4
- 0 0 4
4
0
0
A
4
- I I I I I I -
a
U
- I I I I I I
0 4
< 0, -c
z? P 3
(D
I < <
C- 38
g iven signal-to-noise-density ratio, increased t ime in which to make the
decision can be used to increase the quality of the decision. Conversely,
f o r a given quality of decision, increased decision t ime will reduce the
required signal - to -nois e -density ratio.
3 . 3 . 3 Some available trade-offs
In o r d e r to evaluate various signal designs and detection methods, two
rat ios will be called upon.
where S is average signal power received by the antenna and N
power density r e fe r r ed to the s a m e place in the circui t as the signal power
measurement . The second rat io is energy-to-noise-density ra t io , E / N
where E is signal energy per bit of information and N The
two rat ios a r c re la ted by:
The f i r s t i s signal-to-noise-density ratio, S / N 0
is the noise 0
4
0
is as above. 0
where T i s the t ime requi red to send one bit of information.
t h e s c quantities leads to seve ra l useful conclusions.
that for a given detection scheme an inc rease in available E / N
probability of cor r e ct de cision,
Consideration of
When i t is understood
inc reases the 0
1. Increasing t ransmi t te r power i s equivalent to increasing the t ime to send each bit of information (that is , the t ime in which the detector has to make a decision).
2. The detection method which required the l ea s t E / N for 0 a given probability of message e r r o r is m o s t efficient of
t r ansmi t t e r power.
F o r the data r a t c s that need to be considered he re , available bandwidth
is not a problem, but in the detection process , reduction of bandwidth (to a
minirriuim of I/T, where T is the duration of a n element) improves performancfs
b y excluding noise.
It was a s sumed in an example above that all messages that could be
sen t wt'rc' equally likely to be s e n t dnd thus all were a s sumed to be equal
c - 3 9
in length and complexity of coding.
likelihood, i t m a y be that some messages a r e m o r e important than o thers
and should have higher probability of c o r r e c t reception.
t ime is allowed fo r each message , the coding of the important messages
should be made s imple r than for the less important ones; that is, fewer
decisions to be made in a given t ime in o r d e r that those decisions may be
made m o r e reliably.
the eas i e r i t w i l l be for unintentional jamming to cause the received m e s s a g e
to be in e r r o r o r to cause the rece iver to believe a message was present
when i t was not. However, the s imple r message need not make i t e a s i e r
f o r noise to cause mistaken identification of the presence of a message .
It can b e shown that the use of multiple frequencies reduces the signal-to-
noise density requirements for a fixed date r a t e and grade of se rv ice .
Details can be found in the bibliography given in Section 3 . 7.
Whether o r not the messages have equal
If a fixed length of
On the other hand the s imple r the m e s s a g e coding
3 . 3 . 4 Detector and signal design considerations
P e r f o r m a n c e of a detector is related to the accu racy by which the
detector knows t ime respect ive to the t r ansmi t t e r and path delay o r t r ave l
t ime of the signal.
is mos t re l iable i f exact phase of the message waveform is known b y the
detector.
form reasonably well if i t only knows when each element begins o r when the
f r equcncy is changed, but the rece iver is useless unless i t can de te rmine
when each word o r message began. Each of the t ime determinations wi l l
b e r c fe r r ed to as synchronization o r sync. That is , phase sync improves
per formance but i s not required, e lement sync i s required to s o m e degree
for c o r r e c t interpretat ion, and message sync i s absolutely required.
Specifically, the decision process in the presence of noise
Without that much accuracy , the detector may be designed to p e r -
c - 4 0
A rece iver which is not handling continuous traffic o r is not i n some
manner synchronized on the message is a t quite a disadvantage and is
subject to interpret ing noise and interfer ing signals as message information
and producing fa l se a l a rms .
decision to whatever i t receives will produce a random s t r e a m of such
decis ions.
will look like some par t icular message . F o r example, i f a 50 baud, 7-unit
teletype pr in te r is operated ent i re ly by noise i t will pr int any par t icular
sequence of t h ree l e t t e r s o r symbols an average of once every th ree hours
and in the process use yards of paper.
alarm would be produced a t an average r a t e of one every two minutes .
A rece iver designed to r eac t with a binary
The re i s some probabili ty that a sequence of such decisions
F o r 100 such pr in te rs the fa l se
If additional fac tors a r e considered such as sett ing threshold levels
o r sending added, redundant symbols and if m o r e sophisticated processing
i s applied to the detector output, the probability of fa lse alarm may be made
a rb i t r a r i l y small, but with added cost and possibly some sacr i f ice in allow-
able minimum S / N . 0
Some consideration should be given to coding in such a way that
unintentional interfer ing signals a r e not likely to be in te rpre ted as messages .
This is general ly not difficult if intuitive notions a r e used.
possibil i ty of intentional interference o r intelligent jamming the problems
If there is a
a r e complicated but a l so solvable.
3 . 3. 5 Charac te r i s t ics of some pract ical sys t ems
It is useful to compare seve ra l general ways the coding might be
handled and the advantages and disadvantages that obtain for a par t icular
case .
follows:
The assumed conditions upon the message and detector a r e as
1. It will be assumed that there a r e 256 sepa ra t e functions which may be sent , including addres s and message . Each message may be considered to contain log 256 = 8 bits of information.
, 2
c-31
2. The maximum total t ime for message o r information t ransfer wi l l be eight seconds. synchronizing rece ivers and t ime for the rece iver to operate upon and t rans la te the received message .
This excludes t ime for a ler t ing and
3 . The rece iver will not know t ime accurately enough to synchronize on signal phase, but it will know the beginning and duration of elements. accura te to about one-tenth of the element duration.
This requires knowing the start of each e lement
4. Since the rece iver does not know when a message will begin, i t m u s t not mis in te rpre t environmental noise a s a message . will be a rb i t r a r i l y required t h a l e s s than once in three yea r s wi l l one of 300 such rece ivers produce a false alarm by in t e r - preting the noise a s any of the 256 possible messages . pract ice , the rece ivers in fringe a r e a s will be m o s t susceptible to e r r o r and par t icular ly during t imes of the year when the signal-to-noise ra t io is the worst . a l a r m s is s t i l l expected to be in proportion to the total number of r e c e i v e r s , if the threshold is de te rmined by noise only.
It
In
The frequency of fa l se
5 . It will be a s sumed that the rece iver mus t be able to recognize the presence of a message and find the most probable beginning and end for the message . The re i s , then, some probability of message recognition which is the probability that i f a m e s s a g e is present , the rece iver will cor rec t ly recognize the fact. This may be a different number , in general , f rom the probability that the message is cor rec t ly translated. It is a s sumed that the rece iver must recognize the presence of a message - and t rans la te i t with a probability of e r r o r of only one in 10, 000.
Two general types of coding will be compared below and discussed in
terms of preventing false alarms.
( a ) Sending 50 baud teletype, two l e t t e r s o r cha rac t e r s compris ing a m e s s age .
(1) To detect the presence of a message and prevent fa lse a l a r m s , a cer ta in sequence may be sen t to a l e r t the rece iver to the fact that a m e s s a g e is coming.
( 2 ) Alternatively, fa l se a l a r m s m a y be avoided i f the average signal levels a r e compared to noise to watch for exceedancc of a threshold value.
C, -42
( t ] ) Sc ' i i d i i~g (Jrlly o11(' 8-tjit word to r c p r e s c n t onc of t h e 256 possiblf t rnc>ss;igvs, and utilizing m o r e of the allowed message t ime to i r r i p 1-0 v t r e lia b i l i t y . ( 1 ) Eight binary decisions could be required; one of four
frequencies could be used requiring four decisions, o r one: of 16 frequcncies could be used requiring only two decisions.
( 2 ) Again a LhrcshoLd would be established which average s ignal levels must exceed.
T h c following table coinpares the required S / N for message e r r o r 0
- 4 probCib1litics of 10
y ~ x . ~ rs.
and fn l sc a l a rm ra tes of one rece iver (of 300) in three
Al1uwc.d ni<..;sngc. transniission t ime is cight seconds.
'1'lirc.c important general prlnciplvs follow which a r e useful in this
s i t u a t i o n where n i ( * s s a g r ~ s a r c Infrequcnt, t ransmit ted in a fixed Length of
11 i 11 c ,ind r t'qiiir c high reliability.
1 . 110 not s c n d m o r e iiilorniat1on than necessary . W i t h n binary clemcnts , L different messages could be sent . Conversely, dvcragc. inforni<ition content of each of m messages I S
n
c; - 3 3
d' reliabil i ty is approximately inversely proportional to t ime, available to make a decision.
for message reliability. K1 S / N E -
0 T, U
Figures 3-16 and 3-17 show the relationship between the number of possible messages , t ime to send the message and S / N for message e r r o r s of 1 in 10, 000.
S(.t sonie threshold which signal mus t exceed for a message to be recognized. Establishment of a threshold requi res a n S / N value which i s approximately inversely proportional to total message tin1 e .
requile d 0
3 .
o
foi. low false alarm rate . K1 S / N - 0 T m
Required S / N inc reases , as shown by Figure 3-18 and a l so the preceding table, but that effect is secondary.
increases slightly as the number of decisions 0
As a n cxample relating to the conclusions above, i f an aler t ing message
Like that Incntioned for teletype operation were used to prevent fa l se a l a r m
a n d i f i t we re followed by a sequence of eight message bi ts , instead of two
icxletypc c h a r a c t e r s , a S / N of 13. 3 db would be adequate to achieve message
r ~ ~ l i a b i l i t y i f 58 seconds were used to send the whole sequence.
w o r d s , i t would require 58 t imes as long for each decision as for decisions
< i t the 50 baud ra te . In addition, j u s t to prevent false alarm, many m o r e
cxlc>ments were sen t than w e r e required for message information.
tlireshuld nirthod of preventing falsc alarm i s much m o r e conservative of
tiiiic and signal power.
0
In o ther
The
3 . 3 . o P c ~ r f o r m a n c ~ ~ ~ of cer ta in sys t ems in a tmospheric noise
'l'lic radiated powe r required to achievc a cer ta in quality of message
r<.c.c.ption depends on t h e availahlc energy per bit of inforn-lation relative to
t i l ( , noisc. power spec t r a l density a t a reception point and the ability of the
i.t\cc:c!ivcr to make co r rec t decisions under these conditions. The availablt:
106-1011C S/N db
Figui-c 3-16 Nuriibci o f Posib le Messages, rn; Number of Different Frequeiicics M; Elements in t h e Message n; and Requii ed Signa I -to -Noise-Densi ty for Proba b i I i ty of Message Error Equal t o 10-4
c -45
. I
S/No in db Required to Receive 1 of the Possible Messages in Time Given + - . -
9 0 w P 4
h) d
I I I I I I I I I F
h
qP ON/S
c -47
'The E / N requi red by a r ece ive r to achieve a given reliabil i ty depends o n
s ignal design and the detection methods used.
operating in Gaussian noise can be determined theoret ical ly and a l so demon-
s t r a t e d with prac t ica l sys t ems . See Section 3. 2. 3 . However, the E / N
requi red by a r ece ive r operating in a tmospher ic noise may be quite different.
W i t h a l inear r ece ive r the E / N
than, that obtained i n Gaussian noise.
in information r a t e and thus reception bandwidth. With noise reduction
c i r cu i t s , however (and this general ly impl ies a nonlinear r ece ive r ) , the
E / N requi red for a given e r r o r r a t e may be considerably l e s s than that
achieved in Gaussian noise.
on (1) the input noise cha rac t e r i s t i c s ; ( 2 ) the presuppress ion and post
suppress ion bandwidths; ( 3 ) the suppress ion technique i tself; (4 ) the detection
s c h e m e , and (5) interfer ing s ignal levels .
improvement in requi red E/ N
E / N fo r different sys t ems
a
can be made to approach, but never be l e s s
This is accomplished by a reduction a
a The amount of improvement depends p r imar i ly
It is useful to demonst ra te the
which can be rea l ized under typical conditions. a
The r m s value, N , and fo rm fac tor , V of the input noise envelope a d' w i l l be used to desc r ibe the noise.
width of 300 H z is typical and will be used for comparison purposes.
p rcsuppress ion to post suppress ion bandwidth ra t io is a s sumed to be 10 o r
more . A s imple symmetr ical ' clipping c i rcu i t is employed. This normally
gives good suppress ion if the noise voltage is clipped 10 percent o r m o r e
of' the t imc.
and will be neglected. Interfer ing s ignals will be assumed nonexistent, but it
mus t bc noted that mos t suppress ion techniques r equ i r e wide input bandwidths
A V = 10 db in a presuppress ion band- d The
The effects of using different detection schemes a r e not l a rge
C -48
and therefore a r e quite susceptible to interference. Results a r e shown for
two types of 50 baud, 7-unit code teletype systems operating with 0. 1 percent
character e r ro r s and for one highly reliable warning system using one eight-bit
word to send one of 256 possible messages in eight seconds with a message
e r ro r probability of 10
three years.
-4 and a false a larm rate of one receiver out of 300 in
TABLE 3 . 3 . 6
Baud Er ro r Rate E/N (Gaussian) E / N (Atmos.) S/N 0 a a - Code - System
8 db - 3 TTY (correlation 7 unit 50 P = 10
detector, m = 1 / 2 ) (start-stop)
TTY (non-coherent,7 unit 50 P = 10 m = l o r % ) ( start-stop)
8-bit word 8 unit = 10 13 db
C
1 2 db - 3 f
C
-4 f
ps (synchronous)
1 db 16.5 db
5 db 20. 5 db
3 db 3 . 0 db
The improvement noted for atmospheric noise is a conservative estimate
based on an input noise with V, = 10 db and clipping 10 percent o r more of
the time. The last
service indicated.
predicted values of
where T is the time
case paths the S/N a - -
I
U
column indicates the S/N The S/N which must be available can be obtained from the
E / N a
required to obtain the grade of a
a and the information rate nince
ST E/Na = - a N
required to send one bit of information.
has been predicted assuming 1 kw radiated as follows:
For the worst
Fort Collins to Denton, Texas 21. 5 db
Winchester to Denton, Texas 15.5 db
Either transmitter to south Louisiana 13. 5 db
This is for a summer daytime path during the worst time block 1200 - 1600. These, of course, a r e the mean values and do not necessarily
c -49
- - exis t a t a l l t imes .
available o r exceeded, i. e . , the t ime availability, is a function of the
variations of the signal and noise with t ime and can be estimated.
probability that the given S / N of bet ter will be available involves the
predictability o r se rv ice probability of S / N . Generally, the se rv i ce
probability can be improved (g rea t e r confidence in the predicted t ime
availability) by actual path measu remen t s . Such measu remen t , however,
mus t cover all seasons of the year and many paths in the coverage a r e a .
The percent of t ime during which a given S / N rat io is a
The - -
a
a
Because of their s ta t is t ical nature , it is possible to in te r re la te t ime
availability and serv ice probability and this is a convenient method of
character iz ing the per formance of a system.
shows the percent t ime availability ve r sus se rv i ce probability for a 60 kHz
c i rcu i t during the wors t -case noise t ime block. Curves a r e giyen paramet r ic
in relative radiated power expressed in db for a typical s u m m e r daytimepath.
(See Section 3 . 2. ) Figure 3-19
3 . 4 Radiated power, requirements and per formance character izat ions
Using the curves of Section 3 . 3 . 6 , the S / N requi red by a par t icular a - -
rece iver and the S / N
charac te r ize some actual sys tems.
available over a par t icular path i t is now possible to a
Results a r e shc2-vn in Figure 3-20 for the three types of sys t ems given
i n Table 3 . 3 . 6 and for reception in southern Louisiana.
is approximately equidistant f rom the F o r t Collins and the Winchester
t r ansmi t t e r s , I t becomes obvious that the reliabil i ty required for the
50-baud teletype circui t m a y be a determining f a c t o r in choice of radiated
power.
This reception a r e a
F o r 500 kw radiated and a reasonable value of 0. 9 for serv ice
probability the highly reliable l-baud c i rcu i t has a t ime availability of about
99 .97 percent for the wors t - case noise t ime block.
teletype c i rcu i t for this s a m e path and t ime has a t ime availability of
96. 5 percent.
The best 50-baud
C - 5 0
iTI
m 0.
N I Y
0 9
b 2 U
.- - .- a 0 I)
a a, u
2
.- L a,
m
> x
YI
+ .- - .- I) 0
0 >
a,
I-
o. I c)
- .- Q
E .-
- 2 3 7n U .-
C-51
Percent Time Availability
“ 4 K ”
C-52
It is interesting to note that for the case where an interfer ing signal
prohibits the use of noise suppression, the minimum E / N is 13 db for the
high reliability c i rcui t . The T.A. versus S , P. fo r this ca se is a l so shown
on Figure 3-20 f o r 500 kw radiated.
probability and 500 kw radiated is now reduced to 9 8 . 8 % f rom the suppressed
noise value of 99. 97%.
3. 5 Radiation system
a
Time availability for 0. 9 serv ice
3 . 5. 1 Antcnna design
'I-hC~ antenna charac te r i s t ics were obtained by scaling data obtained
f r o m modeling a 1200' toploaded tower.
dependcncy of some of the pa rame te r s a r e tabulated below.
The frequency and effective height
2 e
Kadiation resis tance R cc f 2 h r
Copper lo s s
Ground los s
e a r% h
cu R
x 2 e R c f h
g
a f - '
a: f - ' h - I
di Dielectric loss
Helix loss Rh e
The Q of the antenna tuning inductor was assumed to be constant at
1300 and constant with frequency.
with h
with sca l e factor s .
A fixed antenna configuration was a s sumed
and Ca a s , when antenna s i z e var ies in all l inear dimensions cc s e
The radiated power in kw is given by;
2 C 2 h f f 2 s i n ( r / 2 e f / f r ) - 13 Vt e r P = 2 . 8 2 X 10
r and thc antenna sys tem bandwidth by;
e b ( 3 db) = 1. 11 X I O - 1 3 as
.ind antenna sys t em efficiency;
R t R t R t R d i t R h 'as = r C U i2
whc-rcs MKS units a r e used.
c - 5 3
a h
h - 1.575. - c
l 'hc> <Liitenii,i cdpacitrincc. lor various heights is tabulated below,
h ( f t . ) i l
h ( m e t e r s ) t!
C (pfds. ) a
LO 6
284
387
5 16
7 25
1060
1550
40
55
75
100
140
20 0
300
. 0 0 2 5
,0034
.0047
.(IO62
.0087
.0123
.0190
b'or these values of h and C and a fixed frequency, i t i s possible to e a calculate the voltage-limited radiation capability of the antenna ve r sus actual
height. This is shown in F igure 3-21 for 20 kHz and 60 kHz and for 50, 100,
150 and LOO kv voltage l imits .
f o r 20 and 60 kHz curves a r e shown in F igure 3-22.
hc~ight and radiation res i s tance versus actual height a r e given in F igure 3-L3.
The bandwidth and efficiency ve r sus height
Capacitance, effective
IJsrng Figure 3-21, i t is possible to choose antenna heights which a r e
c-:apai)lc oi nieeting various combinations of radiated power capabilities a t on<.
o r h t i i i requencies and then to develop costs versus antenna heights by
c.onil)ining this with the corresponding efficiency curves to determine
c - 5 4
1000
100
f - 6
6
.- Y
P)
0.
U
0 -0 0 cz 73 P)
L
c .-
c .- E .- -1
QI 0) 0 c -
10 8
1
Figure 3-21 Radiation Capabilities vs. Tower Height (Assumes Top Loading Consisting of 16 Radials)
3
c-55
1 OO(
8
4
4
N 2
C
X .- f 2 3 U
H E c
100
+ $ 8
v)
0
C 4
-0' 6 YI
4
2
10 I
I
I
c
1 2
I
f 1
6
f
I
I
I I 1 I 800 1000 12
Actual Tower Height in Feet
Figure 3-22 Antenna System Bandwidth and Efficiency
100
10
1 IO
106-101 5C
c C
2 0) 0
C .- VI 0
I= x 0 C
u
W
.- Lz Y
E c : v)
0 C 0) c
d
C-56
10
E
4
2 L
M
b l
E 6 C
0) U C
.-
1 . c .- E c 8 IY
.- + 0
73 0
.-
- 6
4
2
0.1
1000 - - -
- I" -100- a
- >
U
.- c
- a - %.. v- w
-10- 2
Actual Tower Height in Feet 106- 10 1 6C
Figure 3-23 Radiation Resistance, Capacitance, and Effective Height of Antenna
G - 5 7
. .
transrii i t tcr requi rements .
pos s ihle combinations of joint NBS/OCD operations and a l so for s ta t ions
nieetirig only OCD requi rements .
This i s done in Section 3 . 6. L for s e v e r a l
3 . 5. 2 Ground svs tem design and cos t considerat ions
This cos t analysis a s s u m e s a s imple ground s c r e e n configuration
consisting of N rad ia l w i re s with length L and uniform angular spacing
throughout.
lind miriimuni cost solutions for different values of ground conductivity.
A fixcd total effective ground loss res i s tance of 0. 1 ohm was allowed and
is consis tiint with the antenna sys t em efficiencies given previously.
The length and number of w i re s were allowed to va ry to
Two solutions a r i s e ; one achieves a minimum wire length and cos t
o f w i r e placement, while the o ther , m o r e pertinent solution, gives
tninimuni total cost , including land. Because land cos t va r i e s as L while
wi re cos t i s proportional to L, the land cos t controls i f the unit cos t is
g r e a t c r than $50 a n a c r e .
through an actual minimum within the range of allowed values of L and N.
'The niinimum total cost , however, is found for the l e a s t amount of land
that can b c used and s t i l l have the ground r e s i s t ance l e s s than 0. 1 ohm.
' T h e rcqui red land was a s sumed to be a squa re a r e a 2L on each s ide.
two solutioris a r e shown in F igure 3-24 as a function of ground conductivity.
2
Thus the total requi red w i r e length pas ses
The
The total cos t of land and ground sys t em is shown by Figure 3 - 2 5 as it
va r i e s with unit cos t of land. Actual p rac t i ca l designs may have the number
o f radials change beyond s o m e given dis tance f rom the cen te r , but in such a
CJSC= tho cos t f igures given h e r e would probably be affected by only a s m a l l
p c r c t! n t ag e?
3 . 6 Cost t r ades
The economics of a communication s e r v i c e play a l a rge pa r t i n
select ing thc means to provide that se rv ice .
s c r v i c c wi l l be de te rmined by the radiated signaling power of the t r ansmi t t e r
The reliabil i ty o r grade of
c - 5 8
I \
h f
I
U C 0 -I Le
0
0 u c w
v)
-0 al
T I 3
V C
-
- i
Cost of Land and Ground System, Thousands Dollars
C-60
a r i d the. per iormance characterization of the receiver . Increasing the
(.iipirhllltl<:H o f the t ransmi t te r , the receiver o r both generally implies an
increase in cos ts ,
trade-offs available between increasing power a t the t ransmi t te r and
increasing performance a t the receiver .
It i s useful to examine these costs and note the economic
Since the concern here is also a possible joint use of the facil i ty by
NBS and OCD, the relative costs for this joint type of se rv ice mus t also be
examined in o rde r to a r r i v e a t the mos t economical station which m e e t s the
needs of both u s e r s .
3 . 6. 1 Basis for cost es t imates
These budget es t imates a r e based on experience a t DECO with such
stations a s VLF PAC, Omega-Trinidad, Omega-Haiku, Omega-Norway, Air
F o r c e SLFCS (487L), and Cutler, Maine, The station costs a r e a tentative
est imate based on a prel iminary engineering phase of the station design.
relative costs of different station configurations a r e quite useful in de t e r -
mining the minimum cost station which meets the des i red operational
capabilities.
those given he re and in some cases by a considerable amount.
typical values have been used. F o r instance, the station ground sys t em
cost is a function of the land a r e a and the number of radials required to
mee t a specified ground plane resis tance, and this will depend on the s i te
chosen.
itself may cost l e s s than est imated h e r e because of present development work.
A l l the est imates a r e believed to be fair ly conservative.
been made for the following i tems.
The
Because of cer ta in fac tors , the absolute costs may vary f r o m
Average o r
Land costs a r e difficult to predict accurately. The antenna sys t em
Allowances have
1. Detailed plans and specifications.
2. Acceptance testing.
3 . Sufficient redundancy to insure high component reliability.
4. Ext remely reliable OCD warning, although possibly a t reduced power if a power amplifier module fails .
M o s t i tems include a contingency to cover unforeseen requirements . 5.
Itcins not included a r e :
1. Personnel support facil i t ies.
2. Allowance for proof testing.
3 . Budget factor to allow for inflationary t rends.
were assumed.
1966 U.S. dol lars
3. 6. 2 Station cost breakdown
The costs involved in the station can be broken into seve ra l m a j o r
categories each a function of the actual height of the antenna employed.
major breakdowns a r e antenna, ground sys tem, including land a r e a , tuning
inductance with enclosure, t r ansmi t t e r power amplif ier , t ransmi t te r building
and auxiliary equipment, and auxiliary power costs .
These
Land costs a r e difficult to a s s e s s , being dependent on the location
chosen and the s i t e conductivity, since poor conductivity would requi re that
a grea te r area be covered by the ground system.
related also to tower height, and for this tower configuration the a r e a can be
a s sumed to be a squa re which encloses the c i rcu lar ground system.
conductivity, 0. 001 m h o / m e t e r , and expensive land are a s sumed h e r e for cost
purposes. As shown by Figure 3-25, a n improvement in conductivity by a
factor of 10 and reduction in land cost to $500 pe r a c r e would resu l t in half
the ground sys t em cost, o r a reduction of 13 percent in total es t imated cost .
The required a r e a is
A poor
F o r 0 .001 m h o / m ground, the required land a r e a is 3. 5 h on a s ide , a where h is the actual antenna height. Thus, the a r e a in square feet is
given by a
2 A r e a i n squa re feet = (3. 5 h ) a
whcre h is in feet. a
C - 6 2
The a r e a required in a c r e s is then
- 4 2 A = 12. 25 h X 2 .296 X I O e 5 x 2.8 X 10 ha . a
Figure 3-26 shows the total land costs for typical cos t s / ac re . Es t imated
antenna and ground sys t em costs versus antenna height a r e shown in Figure 3-27.
The antenna costs include the tower, feed sys tem, guys, top hat, insulators ,
foundation, anchors and installation cos ts , They a r e shown paramet r ic in
rms voltage l imits .
The tuning inductor and enclosure costs a r e given in Figure 3-28 for
20 kHz and 60 kHz.
the ma jo r costs a r e involved in the lower frequency unit.
helix Q ' s on the o rde r of 1000 - 1500 a r e required.
F o r joint operation two inductors will be required, but
It is a s sumed that
Transmi t te r power amplifier costs per radiated watt versus antenna
height w e r e obtained s tar t ing with the basic assumption of $2 per watt of
amplifier output power. This is a typical installed cost for e i ther a i r -cooled,
vacuum-tube power amplif ier , o r liquid-cooled, solid-state units. The curve
actually shows costs per radiated watt and accounts for variations in antenna
sys t em efficiency with antenna height a t 20 kHz and 6OkHz.
radiated watt is given by
This cost per
$2
%S
Dollar cost per radiated watt = -
where
height.
is the antenna sys t em efficiency a t a given frequency and antenna as This is shown in Figure 3-29.
The t ransmi t te r building and auxiliary equipment costs in dol lars per
These costs radiated watt versus antenna height a r e given in Figure 3-30.
can be expected to be related to required t ransmi t te r output power.
in turn, is related to radiated power by the antenna sys tem efficiency which
i s a function of frequency.
This ,
Examination of the costs of other stations such as
C - 6 3
106-10 19C ha
Actual Antenna Height in Feet,
Figure 3-26 Estimated Land Costs for Top Loaded
Towers, Ground Conductivity mho/"
C - 6 4
10
8
6
4
2
u) L
0 - - s : 1.0
2
- 0 VI
.- - - .-
.- c 8 c %,l
0 V
6
4
2
0.1
7
I 0 1
Actual Tower Height in Feet
Figui-e 3-27 VLF-LF Antenna and Ground System
106-102OC
Cost for Toploaded Tower
‘100
C -65
Actual Tower Height in Feet 106-1021 C
Figure 3-28 Cost of Tuning Inductor and Enclosure
(: - 6 6
1 00
8
6
4
2 c c
r” 00 c 0
o w V
%
L
10
0 8
n
5 - - 0
w l 3
8 E 6
4
2
1 30
Actual Tower Height in Feet 106- 1022C
Figure 3-29 Estimated Transmitter Costs per Watt Radiated
C-67
Actual Tower Height in Feet
Figure 3-30 Estimated Transmitter Building and Auxill iary Equipnent Costs
106- 1023C
V L F PAC, Omega-Haiku, and the A i r Fo rce 487 L system, showed that
$1 per t ransmi t te r output watt is a typical value. The curves show cost
per radiated watt as obtained f rom
$1 Dollar cost = 7 'as
where q
height.
is antenna sys tem efficiency a t the des i red frequency and antenna as
Auxiliary power costs a r e based on a quoted figure of $320/kw. This
includes building, switch gear and all equipment associated with the generating
equipment.
to include not only antenna sys tem efficiency but the t ransmi t te r sys t em efficiency
and thc power supply efficiency.
be 0. 8.
sys t ems average around 0. 6.
mi t t e r s is given by,
In o r d e r to convert this to costs per radiated watt it is necessa ry
The power supply efficiency is a s sumed to
Solid-state t ransmi t te r efficiencies approach 0. 9 and vacuum tube
The cost pe r output watt fo r sol id-s ta te t r ans -
w $0.45, $. 3 2 Cost per t ransmi t te r output watt =
0. 8 X 0. 9
For vacuum tube t r ansmi t t e r s the cost i s ,
Cost per t ransmi t te r output watt - $ . 3 2 -
0. 8 X 0. 6 N N $0. 67.
In t e r m s of radiated power this gives
Cost/output watt Cost per radiated watt =
'as
Values for 60 and 20 kHz a r e shown in F igure 3 - 3 1 as a function of antenna
height for both types of t ransmi t te rs .
3 . 6. 3 Examples of station cost t rade with antenna height
As an example of the use of these curves a typical station will be
a s sumed and the antenna height and voltage l imi t which resu l t s i n a minimum
c -60
Actual l o w e r Height in Feet
Figure 3-31 Auxi l l iary Power Costs Including Generator, Building and Switching Equipment
1 06- 1024C
c - 7 0
I , , - ,L C J C ’ t C t-rrliried. 1 or O L D station capable of radiating 100 kw the m i n l m m
d r i t c r ~ n ~ i kicights d r e f rom Figure 3 -21 , 490 f ee t with 200 k v , 580 feet wlth
1 5 0 kv, 730 feet with 100 kv, dnd 1110 feet with 50 kv.
C o s t s of the ma jo r portions a r e obtained f rom Figures 3-26 through
.Z - 3 1 by iiiultiplying the appropriate curves by the radiated power required
kvl1ic.h 1s 100 Icw for this specific case. For this example the following table
r c b s ults : ‘I’ow(.r 1 Ieinht arid Operating Voltdcc
T r a n s . powclr ampl. 430, 000 350 ,000 300 ,000 240, 000
A u x i l i a r y Power 105, 000 88 ,000 7 5 , 0 0 0 6 0 , 0 0 0
?‘OCTAL 1‘. : ct 1.1 li t y cos t s $1, 300 ,000 $1, 223,000 $1, 291 ,000 $1,867,000
‘l’hus ior this type of antenna and 100 kw radiated at 60 kHz there is a
S imi la r broad minimum in station costs with tower heights of 600 to 700 feet .
tables have been made fo r other radiated powers and fo r stations meeting
various combined capabilities of both OCD and NBS.
and is s h o w n i n Figure 3 - 3 2 .
iiicludcd i n the. F’igurc.
only.
c.;tixibility increases .
c: ‘I p;t I, i li ti e s fo r e a c h f r e quen c y .
Data has been plotted
Costs of personnel support faci l i t ies were not
The solid lines indicate cost t rades for OCD operation
‘Tho minimum cost occurs a t increasing antenna heights as the radiation
Dashed l ines a r e for joint operations with noted radiation
L‘hough ;i 1200’ tower is not consistent with cost minimization a t the
c hoscn output powers, such a tower requi res a voltage over 150 kv for the NES
c-71
z I I c
-487L Towc
Total Facility Cost Millions of US Dollars w P VI 0.
1
C-72
oj>f:r;ition.
to show in such a plot, but i t is thought wise to choose h e r e the solution
calling f o r the higher tower ra ther than operating voltages approaching
200 kv.
C o s t increases effected by extremely high voltages a r e difficult
3 . 6.4 Rcceiver cost t rades
It is reasonable to expect that the m o r e r ece ive r s that a r e s e r v e d by a
given t ransmi t te r , the m o r e worthwhile i t is to simplify the rece iver .
a l ly , the simplification process will degrade the sys t em ' s performance and
requi re increased radiation capabilities to insure adequate coverage. This
t rade between rece iver costs and signaling costs is worth examination.
Gener-
The transmitt ing facility cost differential incur red by doubling the
radiation capabilities of a station meeting OCD requirements is indicated
i n F igure 3 - 3 2 .
f rom 200 kw to 400 kw would cost approximately 1 million additional dol lars .
If, ra ther than doubling the t ransmi t te r power to provide acceptable performance,
the rece iver per iormance itself wassimproved by a factor of two, then the s a m e
opcrational capabilities would resul t .
use of m o r e sophisticated coding, modulation, and detection techniques.
Increasing rece iver performance will generally inc rease the cost because
of more sophisticated signaling concepts and increased complexity of the
decoding schemes .
A D , (where AD is the cost difference of an increased radiated power and r
tlic number of rece ivers se rved) , in o r d e r for this method to resu l t in the most
economical over -a l l communication system. F igure 3 - 3 3 shows some t rans - mit t e r station and rece iver cost t rades for 3 db improvement and pa rame t r i c
in t.he number of rece ivers .
a 200 k w station is comparable to doubling the performance of 50 rece ivers
a t $ L O , 0 0 0 per rece iver .
performance and cost relationships using various M - a r y codes.
This shows, for example, that doubling the radiated power
This may be accomplished through the
The cost per improved rece iver mus t be l e s s than
1'
F o r example, the cost of doubling the power of
It is informative to examine some single r ece ive r
F o r a
c-73
Initial 1 idioted Power, Kilowatts
c - 7 4
binary sys t em with a synchronous eight-element code capable of 256 message
symbols , the element e r r o r ra te mus t be slightly l e s s for the s a m e m e s s a g e
e r r o r r a t e s ince m o r e elements a r e required to produce each symbol.
symbol e r r o r ra te p
The
in t e r m s of the element e r r o r ra te , p is given by S e’
-4 -5 F o r a p of 10 a s sumed he re , p = 1. 25 X 10 for the 8-element
This amounts to an additional difference of about 0. 2 db in performance. S e
code.
Thus for a 16-ary code capable of 256 messages the improvement over the
binary ( m = 256) i s 5 . 4 db.
envelope detection and post detection logic to define a symbol is a s sumed to
cost approximately $ i O , O O O . A coherent sys t em can be expected to cost
considerably m o r e (possibly a factor of 3 o r 4) because of the necessi ty for
phase lock and correlat ion detectors . The alphabet s i ze , M, is expected to
be a p r i m a r y factor in determining cost.
increase direct ly with M since cer ta in portions of the rece iver a r e the s a m e
regard less of M.
somewhere between the binary cost and M t imes the binary cost .
The binary 8-element code rece iver using
hk
However, cost is not expected to
Thus the cost of an M-a ry receiver can be expected to be
A value of
1 ‘
(q ) X binary cost appears to be a reasonable assumption. This cost
versus M is shown in Figure 3-34.
As one example a s s u m e that a quartenary alphabet w e r e used with
four elements pe r symbol.
approximately a 3 db improvement in required S / N
binary.
Figure 3-33.
would give the s a m e operational capability as doubling the t ransmi t te r power
from 200 kw to 400 kw.
This gives a total message capability of 256 and
over the 8-element a (See Figure 3-16. ) The cost increase per rece iver i s $4, 000 f rom
This i nc rease could be applied to 250 rece ivers and the sys t em
’: This figure includes antenna, sync c i rcu i t s , fa lse alarm protection, installation and checkout; in fact , the complete receiving system.
c - 7 5
v) L
0 - - 0"
5
'*- 0
5
3 0 -t t- C .- c m 0 U L 0) > Q) V 0, cx
D al 0
.-
+
E .- + v)
w
4 8 16 0 2
M-ary Code, M 106-102'C
Figure 3-34 Receiver Cost as a Function of Sophist icat ion o f Per forman ce
C-76
If the 3 db performance improvement was obtained by a coherent
cor re la t ion type of detection, r a the r than the M-a ry coding methods and non-
coherent detection, the added cost per r ece ive r is expected to be g r e a t e r
(possibly $LO, 000 o r m o r e ) , and only 50 o r fewer improved r ece ive r s could
be. obtained for the s a m e total cost.
difficult to actually rea l ize for an intermit tent communicating link, s ince the
c a r r i e r sync t ime requi red will subt rac t f rom the total allowed message t ime.
Also, the 3 db improvement m a y be
It should be noted that if the coverage a r e a of a given t ransmit t ing s ta t ion
i s s e rv i ced by a ce r t a in number of r ece ive r s they cer ta inly will not all necessa r i ly
r equ i r e the s a m e performance capability. Generally, however, because of
logis t ics and maintenance problems, i t is des i rab le to make all units essent ia l ly
the s a m e o r a t l e a s t to l imi t the type of r ece ive r s to be used.
3 . 6. 5 Manned versus unmanned operation and reliabil i ty requiremc>nts
In the or iginal effort as proposed, manned operation and joint NBS/OCD
operat ion of the s ta t ion w e r e a s sumed synonymous.
to be considered for operat ion by OCD only.
considered in detai l s ince 1) the added cos t fo r unmanned operation would be but
a s m a l l portion of the total s ta t ion cost , 2) for a s ta t ion of this magnitudc and the
ex t remely high rel iabi l i ty requirement the unmanned operation does not s e e m
feasible .
Unmanned operat ions w e r e
This single u s e r si tuation was not
A one-hour r epa i r o r replacement t ime was allowed for niost substat ions.
Component and subsys tem rel iabi l i t ies w e r e assumed throughout to Lie
commensura te with power amplif ier specifications.
to achieve this capability.
Redundancy niny be required
The specifications for each sol id-s ta te 100 kw nioclulc
a r e as follows:
Mean - t ime - between - f a i lu r e M 3000 hours
Mean- t ime - to - r epa i r M 1 hour
No standby power amplif ier units were included, because of this low
fa i lure r a t e and r epa i r t ime.
s t i l l opera te a t reduced radiated power.
sufficient to war ran t standby units.
Even i f one module should fail the sys t em would
This reduction does not appear
. , . . ( ' I I
~ ' l i t > 0 1 1 1 i i i i i i i i i ( I P H igii ot any raclio corri i~~unication sys tem requi res
I ) . I H i t ' t i i l ~ r i i ~ , i ~ i o t i , 1x)t ti c.xperiiiicntal and theoret ical , f rom many d ive r se
I ' i c -Lt l s ixicludiiig information theory, modulation, radio propagation, noise ,
antc'nrias arid instrumentation. Much of this ma te r i a l is beyond the scope
of this repor t but was used in developing the concepts and genera l design
features that w e r e given.
by DECO on other contracts .
individuals who des i r e m o r e detailed information than given in the text.
addition, t he re a r e many pertinent r epor t s available in the l i terature .
a r e not a l l l isted he re but o thers can a l so be found in the re ferences given
in DECO repor t s .
Much of the basic work was actually accomplished
The following l i s t of repor t s may be useful to
In
These
Beach, C. D. , Trinidad Omega antenna, Bureau of Ships Contract NObsr 80689, 25 August 1965, DECO Final Report 96-F.
Croghan, R. D. , Analysis of V L F propagation data , U. S. Navy Contract 85360, 1963, Vol. I, P a r t 1, DECO Report 34-A-1.
Croghan, R. D. , Predict ions of path performance a t low frequency, LF, submitted to CRPL, National Bureau of Standards on Contract CST-7453, 1964, DECO Report 75.
DECO Report 3 1, V L F Communication Faci l i t ies , Pacific, P re l imina ry Eng. Report , Vol. 1 through 4 , June 1961.
Single modified Cutler antenna and VLF antenna comparisons, Supple- ment, July 1961.
Single modified Cutler antenna model study data , November, 1961.
Single modified Cutler antenna aspect ra t io study, December 1961.
DECO Rcaport 43, V L F Communications Faci l i t ies , Pacific:
1962 Conductivity Study Basis of selection of V L F antenna configuration Antenna conductor study Model s tudies VLF rad ia l ground sys t em cor ros ion tes t
c- 78
I.IE(;O 34-5- 1 Measured pcr formance of the Collins minimum shift keying system at VLF’ ( U ) , Bureau of Ships Contract NObsr 85360, 1961, (Confidential ).
Linfield, R. F. , and C. A. Samson, Duration and spacing of sferic pulses , P roc . IRE, Le t t e r s t o the Edi tor , Apri l 1962.
Linfield, R. F. , and R. W . Plush, Measurement of V L F sys t em per formance in a tmospher ic noise , ( U ) , Bureau of Ships Contract NObsr 85360, 196 3 , (Secret) .
Linfield, R. F. , and J. W. Al len , Parameters which cha rac t e r i ze L F / V L F s y s t e m s , Contract CST 7669 for Environmental Science Serv ices Administration, Institute for Telecommunication Science’s and Aeronomy, 16 December 1965; DECO Fina l Report 101-F.
Linfield, R. F. and D. C. George, Per formance and cos t considerations f o r U. S. N. E. L. t e s t facil i ty a t Haiku, Hawaii; Bureau of Yards & Docks contract NBy 66302 (0 & E ) , December 1965; DECO Fina l Report 103-F.
Maxwell, E. L. , F. S. Mathews, and A. D. W a t t , Pe r fo rmance of a mult i - frequency shift teletype sys t em, NBS Report 6719, October 1960.
Maxwell, E. L. , and E. H. Whelan, Applications and per formance of multi- frequency shift teletype in naval communications, NBS Report 4BB103, (Confidential), December 1960.
Maxwell, E. L. and D. L. Stone, Natural noise fields f r o m 1 cps to 100 k c / s , IEEE Trans . on Antennas and Propagation, Vol. A P - 1 1 , No. 3 , May, 1963.
Mathews, F. S. and A. D. W a t t , Charac te r i s t ics of some past and present V L , F t ransmit t ing antennas, Bureau of Ships Contract NObsr 85360, Vol , 11, P a r t 1, DECO Report 34-A-1, 1963.
P lush , R. W . , R. D. Croghan, and B. D. Smith, Phase dis tor t ion and bandwidth l imitations of the V L F propagation media , Bureau of Ships Contract NObsr 85360, DECO Report 34-R-5, 1963.
Plush, R. W . , R. F. Winebarger , and R. D. Croghan, Inter im repor t on field s t rengths obtained f r o m an a i rborne V L F t ransmit t ing facil i ty, ( U ) Contract N62269-1723, 1963, DECO Report 50 (Secret) .
Plush, R. W . , A. D. W a t t and 0. E. Cummings, Observed low frequency f ie lds and propagation cha rac t e r i s t i c s in Arc t ic regions, presented at the joint URSI and IRE meeting, Boulder, Colorado, Winter 1960.
c-79
Plush, R. W . , R. F. Lirifield, and A. 3. Fars t ad , The per formance of coherent communications sys t ems in a thermal noise environment and band limited channel, U. S. Navy Contract NObsr 85360, 1964, DECO Report 34-R-7, (Confidential).
Plush, R. W . , R. R. Reed, R. K. Salaman, and G. R. Welti, Modulation s tudies , U. S. Navy Contract NObsr 85360, 1964, DECO Report 34-R-1.
Plush, R. W . , R. F. Linfield, and A. J. Fa r s t ad , The per formance of coherent communications s y s t e m s in a the rma l noise environment and band limited channel ( U ) , U. S. Navy Contract NObsr 85360, 1964, DECO Report 34-R-7, (Confidential).
Samson, C. A. , and R. F. Linfield, Sfer ic observation of the seve re weather on May 1 9 , 1960, Jour . Geophysical Research , Februa ry 1962.
Smith, A . N. , Charac ter i s t ics of a thin cylindrical monopole and i t s per formance as a corona-limited rad ia tor , U. S. Navy Contract NObsr 85360, 1962, DECO Report 34 - C - 4.
Smith, A. N. , V L F antenna charac te r i s t ics and performance, submitted to CRPL, National Bureau of Standards on Contract CST-7453, 1964. DECO Report 75.
Smith, A. N. , and T. E. Devaney, A study of cu r ren t s in e lectr ical ly short ground s y s t e m s of few rad ia l s , U. S. NEL Tech. Memo 272, Februa ry 1958.
Smith, A . N. , and T. E. Devaney, Fields in e lectr ical ly short ground sys t ems : An experimental study, NBS Jour . of R e s . , Section D, Vol. 63, No. 2 , Sept. -0c t . 1959.
Watt, A. D. , Statist ical charac te r i s t ics of sampled and integrated a - m and f - m noise, NRL Report 3856, October 1951.
Watt, A. D . , R. M. Coon, E. L. Maxwell, and R. W. Plush, Pe r fo rmance of some radio sys t ems in the presence of t he rma l and a tmospher ic noise, Proc . IRE, Vol. 46, No. 12, DecembtL 1958.
Watt, A. D . , and E. L. Maxwell, Charac te r i s t ics of a tmospher ic noise f r o m 1 to 100 k c / s , P roc . IRE, Vol. 4S, pp. 287-794, June 1957.
Watt, A. D. , and E. L. Maxwell, Measured s ta t is t ical charac te r i s t ics of VLF a tmospher ic noise, Proc . IRE, Vol. 45, No, 1, January 1957.
c -80
Watt, A. D. , and R. W . Plush, Powcr requirements and choice of an optirnum frequency fo r a worldwide standard-frequency broadcasting station, Journa l of Research , NBS, D, Radio Propagation, Vol. 63D, No. 1, July- August 19 5 9.
Watt, A. D . , R. W . Plush, W. W. Brown, and A. H. Morgan, Worldwide V L F standard frequency and t ime signal broadcasting, Journal of Research NBS, D, Radio Propagation, Vol. 65D, No. 6, November-December 1961.
Watt, A. D . , E. L. Maxwell, and R. W. Plush, V L F field s t rength manual, U. S. Navy Contract NOnr 3399(00), NRL, 1961.
Watt, A . D. , A note on the phase stability of V L F radio c i rcu i t s , submitted to Navy Dept. on Contract NObsr 85360, 1961.
Watt, A. D. and R. D. Croghan, Comparison of observed VLF attenuation r a t e s and excitation fac tors with theory, NBS Jour. of Research , Vol. 68D, No. 1, January 1964.
Watt, A . D. , and R. W. Plush, Measured distribution of the instantaneous envelope amplitude and instantaneous frequency of c a r r i e r s plus the rma l and atmospheric noise, NBS Report 5583, June 1958. (Also appeared in Statist ical Methods of Radio Wave Propagation Symposium Record , Pergamon Press 1960. )
Watt, A. D. , and A. J. Fa r s t ad , Increasing V L F antenna bandwidth, U. S. Navy Contract NObsr 85360, Vol. 11, Part 2 , 1963, DECO Report 34-A-1 .
Watt, A. D. , Corona charac te r i s t ics as related to VLF antennas, U. S. Navy Contract NObsr 85360, 1962, DECO Report 34-R-4.
Watt, A . D. , Selection of an optimum efficiency for a V L F t ransmit t ing static;n, U. S . Navy Contract 4107(00), 1964, DECO Report 54-1.
Watt, A. D. , R. M. Coon, E. L. Maxwell, and R. W . Plush, Per formance o f some radio sys t ems in the presence of t he rma l and atmospheric noise , P roc . IRE, Vol. 46, No. 12, December 1958. ..
Watt, A. D. , R. M. Coon, and V. J. Zurick, Reduction of adjacent-channel in te r fe rence by shaping of t r ansmi t t e r keying waveforms, NBS Report 2415, March 1953.
Watt, A. I). , R. M. Coon, and V. J . I ,urick, Reduction of adjacent-channel in te r fe rence f r o m on-off keyed c a r r i e r s , IRE Trans . on Comm. Sys tems, CS-4, pp. 41-58, October 1956.
c - 81
t . . . . . , . . .. .., . . . , . .-. , '
Watt, A. D. , R. M. Coon, and V. J. Zurick, Reduction of adjacent-channel interference from on-off and frequency shift-keyed carriers, NBS Report 5 5 4 3 , December 1957.