27
Page 1 National Business Case for investing in making cycling a safer and more attractive transport choice Strategic Assessment JULY 2015

Page 1
National Business Case for
investing in making cycling
a safer and more attractive
transport choice
Strategic Assessment
JULY 2015

Page 2
Contents
Executive Summary .............................................................................................................................................. 3
1 Purpose of this document ........................................................................................................................ 4
2 The need for investment in cycling ..................................................................................................... 4
2.1 Why invest in cycling? ............................................................................................ 4
2.2 The benefits of investing in cycling ....................................................................... 4
2.3 Evidence base ....................................................................................................... 5
3 Strategic Context ......................................................................................................................................... 10
3.1 Gearing up in cycling – a changing context .......................................................... 10
3.2 Role of the Transport Agency .............................................................................. 13
4 Scope of investing in cycling and where the costs and benefits will fall ....................... 15
5 Partners and Key Stakeholders ............................................................................................................ 15
6 Anticipated Strategic Fit .......................................................................................................................... 16
Appendix A – Investment Logic Map and Potential KPIs ......................................................................
Appendix B – Initial Benefits Map .....................................................................................................................
Appendix C - Measures, targets, results and milestones for SOI priority and SPE
Appendix D – Wider benefits of cycling as a safer and more attractive transport choice ..
Appendix E – Institutions, policy documents and initiatives to deliver the government’s
intent for cycling ......................................................................................................................................................

Page 3
EXECUTIVE SUMMARY
Why invest in cycling?
This strategic case outlines why the New Zealand Transport Agency (the Transport Agency), working with
our partners and stakeholders, needs to invest more to improve safety for cyclists and make cycling a
more attractive transport choice so it plays a greater role in realising an optimised, total land transport
network. Currently:
cycling has a greater safety risk leading to a higher rate of deaths and serious injuries compared to
other transport modes
perceptions that cycling is unsafe, unattractive and inconvenient mean it is not effectively contributing
to the transport system
a focus on a narrow range of benefits has led to poor stakeholder buy-in across the country
cyclist and potential cyclist requirements are not fully understood, increasing the potential for
investments not being optimised.
There is compelling evidence to support our assessment of these problems. For example, while cycling
comprises only 1.6 percent of total time travelled in New Zealand, cyclists comprise around 8 percent of
all serious injuries in motor vehicle crashes and about 3 percent of on-road deaths.
What are the benefits?
Increased Transport Agency investment (including time and resources) in these areas will enable cycling to
play a greater role in realising an optimised land transport system and reduce safety risks for people who
cycle. The primary benefits will be:
improved safety for cycling
a more efficient transport network, particularly in urban areas
more effective delivery of cycling investment (i.e. better planned, coordinated and targeted).
While transport benefits will be the primary focus of the programme, the investment is also likely to result
in a range of wider benefits. Widely evidenced through research, these generally result from increased
levels of cycling safety and participation. They include transport, societal and individual benefits and we
acknowledge their value and importance. This investment programme will need to be delivered with a
range of partners and stakeholders, including the Ministry of Transport and in particular local government.
Context: Gearing up in cycling for New Zealand
There has been significant, growing interest in cycling and cycle safety in New Zealand leading to
increased central and local government investment and a greater focus on improving safety. Despite
demand, New Zealand has not yet put in place the changes needed to fully realise the benefits cycling can
deliver, particularly for the transport system in urban areas. Stakeholders’ expectations are that the
Transport Agency will take more of a lead role in realising the benefits of cycling.
In response to this demand, we are developing a comprehensive work programme to support our ‘gearing
up’ in cycling. We see this as an important part of the Transport Agency’s ‘One Network’ goal and whole
of transport system approach. This has implications across the Agency for:
our role and positioning
investment decisions
how we work across the Agency and with our partners.
Programme priority
The programme is considered high priority for the Transport Agency as it is a key part of how we can
provide a whole of system approach to land transport. It is a new priority within our Statement of Intent
and a very good strategic fit with our investment criteria for the National Land Transport Programme.

Page 4
1. PURPOSE OF THIS DOCUMENT
This strategic case outlines the context and rationale for the Transport Agency, in conjunction
with our partners and stakeholders, to invest in a significant programme of activity aimed at
making cycling a safer and more attractive transport choice in New Zealand.
As the programme is already underway, this strategic case has been developed in order to shape
and prioritise the programme moving forward to ensure that any core problems are identified at
the outset and that there is a clear focus on benefits.
2. THE NEED FOR INVESTMENT IN CYCLING
2.1 Why invest in cycling?
Increased Transport Agency investment in making cycling a safer and more attractive transport
choice will enable cycling to play a greater role in realising an optimised land transport network. It
will also reduce safety risks for people who cycle and ensure we get the most out of the significant
investment planned in cycling over the next four years.
Hastings, one of the two cycling and walking model communities, has demonstrated that cycling
can be made safer in New Zealand. Cycle crash rates there have fallen to about one-third of what
they were in only two years despite early indications from year two cycle counts showing a healthy
20 percent increase in cycle numbers. Elsewhere in New Zealand, cycling leads to about double
the rate of on-road deaths and five times the rate of serious injuries in motor vehicle crashes for
total time travelled than its proportionate use of the network.
Within the context outlined in section 3, the following problems in relation to cycling as a safer
and more attractive transport choice have been identified:
cycling has a greater safety risk leading to a higher rate of deaths and serious injuries
compared to other modes
perceptions that cycling is unsafe, unattractive and inconvenient mean it is not effectively
contributing to the transport system
a focus on a narrow range of benefits has led to poor stakeholder buy-in across the country
cyclist and potential cyclist requirements are not fully understood, increasing the potential
for investments not being optimised.
Our evidence base for these problems is discussed in Section 2.3. An investment logic map is
attached as Appendix A.
2.2 The benefits of investing in cycling
The following benefits of investing in making cycling a safer and more attractive transport choice
have been identified:
improved safety for cycling
a more efficient transport network
more effective delivery of cycling investment.
Our evidence for these benefits is discussed in Section 2.3. An initial benefits map (covering
benefits we identified at the start of developing the strategic case) is attached as Appendix B.
While transport benefits will be the primary focus of the programme, the investment is also likely
to result in a range of wider benefits. These generally result from improved levels of cycling safety
and participation and are widely evidenced through research. They include transport, societal and
individual benefits and we acknowledge their value and importance.

Page 5
Developing further cycling infrastructure and increasing the number of cyclists on the transport
network may mean some disbenefits to other network users. These could include negative
impacts on traffic congestion, bus speeds and the freight sector if the impacts were not mitigated.
Other disbenefits may also accrue to residents on main arterial routes who lose on-street car
parking near their houses, and business owners who lose customer car parks.
Our evidence for the wider benefits and disbenefits is discussed in Appendix D.
2.3 Evidence base
Key problems
2.3.1 Cycling has a greater safety risk leading to a higher rate of deaths and serious
injuries compared to other transport modes
The Cycling Safety Panel confirmed in their recent report that cycling has a greater safety risk
compared to other transport modes. Reasons for this include:
the network has been designed primarily for motorised vehicles
speed of vehicles
mass of vehicles
vulnerability of cyclists
volume of vehicles
the low number of cyclists (meaning drivers don’t always expect to see them)
car driver and bike user behaviour.
Cyclists comprise around 8 percent of all serious injuries in motor vehicle crashes in New Zealand
and about 3 percent of on-road deaths. This is disproportionate to their participation in the road
network where cycling comprises 1.6 percent of total time travelled.
Cyclists have a number of risk factors that do not affect car drivers. The main risk factors are
decreased stability and a much lower level of protection than that provided by a car. In addition, a
cyclist is less visible to other road users than a car or truck.
These factors combined give cyclists a level of risk per unit of time travelled over 3 times higher
than the risk for car drivers. The risk per km travelled on the road is about 10 times higher for
cyclists than car drivers. Cyclists cover less distance in a given time than cars.
The greater risk to cyclists of death and injuries compared to most other modes is illustrated in
Figure 1.

Page 6
Figure 1: Deaths/injuries per million hours spent travelling July 2009 – June 20131
Over the last decade in New Zealand, crashes between cyclists and motor vehicles have resulted in
an annual average of nine-ten deaths and over 300 admissions to hospital. With 28.2 cyclists
killed per billion kilometres travelled, New Zealand’s cyclist fatality rate is nearly three times that
of the Netherlands and nearly doubles that of Denmark and Germany. The social costs of these
crashes have been estimated at $870 million over the last five years. There is a risk that deaths
and serious injuries, and the related social costs, will significantly increase if steps are not taken
to make cycling safer.
2.3.2 Perceptions that cycling is unsafe, unattractive and inconvenient mean it is not
effectively contributing to the transport system
Relative to other transport modes, and the potential for cycling as a transport choice, cycling has
very low levels of use so is not effectively contributing to the transport system.
Fewer people are cycling and they are cycling less often. With an average of only 73km of bicycle
travel per person per year, New Zealand ranks poorly compared to countries with a strong cycling
culture. For example, the Netherlands has an average of 864km of bicycle travel per person per
year and Denmark 513km. Despite a more recent up-turn, between 1990 and 2014 the number of
people cycling to work and school in New Zealand declined by approximately 75 percent.2
The
availability of cheap imported cars and increased traffic volumes over this period is likely to have
contributed to this decrease.
There is evidence that perceptions that cycling is unsafe, unattractive or inconvenient is driving
this. These perceptions are a significant barrier to cycling being chosen more often as a transport
choice.
According to the Cycling Safety Panel: “Cycling surveys consistently state the number one reason
people do not cycle, or do not let their children cycle, is they believe it is too dangerous.”
1
New Zealand Cycling Safety Summit briefing notes, 15 April 2014, http://www.nzta.govt.nz/consultation/cycling-
safety-panel/docs/cycling-safety-summit-briefing-notes-apr-2014.pdf
2
Cycling Safety Panel, Safer Journeys for People Who Cycle, December 2014
0
20
40
60
80
100
120
140
160
180
200
Motorcyclists Cyclists Light 4 wheeled vehicle
drivers
Light 4 wheeled vehicle
passengers
Pedestrians Bus passengersD
eath
s/i
nju
ries p
er
mil
lio
n h
ou
rs s
pen
t tr
avell
ing
Mode of travel
Deaths/injuries per million hours spent travelling (July 2009 - June 2013)

Page 7
For most people, cycling is not considered viable in major urban centres unless there is good
quality separation for cyclists. A multi-method New Zealand study with a large number of
respondents found that the “preferred cycling facility was a comprehensive, consistent network of
cycle-only paths with separation from motor vehicles”.3
The lack of connected cycle networks is generally the second main reason people give for not
cycling. Auckland Transport reported that “55,000 of our customers (3.9% of Auckland) have told
us that safety and connectivity are the biggest barriers to cycling”. In order for cycling to be
attractive people want their whole journey – departure point to destination - to be on safe,
connected networks. If dangerous intersections or other infrastructure needs to be negotiated, the
benefits of other improvements on the route can be negated.
Other research has indicated that potential cyclists face a mix of barriers in relation to the
attractiveness of cycling relative to their current transport choices. Transport for London observed
that these can be described via seven specific barriers which are known from attitudinal research
to be particularly important to cyclists and non-cyclists. These are: fear and vulnerability;
identification and attractiveness; feasibility and alternatives; access to a bike; physicality; lack of
confidence; and lack of infrastructure.
It is viable for New Zealanders to be cycling a lot more. The Auckland Regional Transport
Authority (ARTA) estimates that approximately 43 percent of peak morning trips are less than
5km, and that approximately 67 percent of these are currently undertaken by car. The World
Health Organization (WHO) recommends that journeys of less than 5 km be viewed as appropriate
for active transport modes, and a New Zealand strategy, Getting There, suggested that
destinations within a 7km radius could be reached by bicycle, and within 2km by walking.
Some New Zealand communities have had success in boosting cycling uptake following
investment in their infrastructure. New Plymouth saw a 35 per cent increase in cycling between
2006 and 2013. The council reported the increase in cycling was occurring generally on shared
pathways, with increases of commuter cyclist numbers on key walkways in excess of 50 per cent.
Overseas examples of leading the way in boosting cycling uptake include Portland, USA where
cycling to work increased from 1.1 per cent in 1990 (equivalent to Auckland today), to more than
6.4 percent city wide in 2008. The Portland example showed the most rapid growth coming after
the construction of around 400 kilometres of cycleway. In Melbourne, in March 2014, bicycles
made up almost 15 percent of all vehicle movements into the city in the morning peak. Five years
earlier that percentage was only 9 percent.4 Vancouver experienced a 40 per cent increase in
cycling in four years through making some key changes, and cycling doubled in London and
Copenhagen over 10-12 year periods.
2.3.3 A focus on a narrow range of benefits has led to poor stakeholder buy-in across
the country
Cycling investment often struggles to get buy-in from different stakeholders, including decision
makers, other road users and local communities.
This leads to a lack of supportive leadership within organisations and a shared and compelling
vision of how cycling can contribute to the transport system. It also contributes to a lack of
sustained focus, prioritisation and investment in cycling locally and nationally.5
The key reason is that investment in cycling is often promoted on the basis of a narrow set of
benefits or cycling being somehow inherently ‘good’. This is despite there being compelling
evidence of the benefits of cycling investment.6
It would be better if cycling was promoted based
3
Kingham, S, Taylor, K, and Koorey, G, Assessment of the type of cycling infrastructure required to attract new cyclists,
NZ Transport Agency research report 449, October 2011.
4
City of Melbourne, http://www.melbourne.vic.gov.au/ParkingTransportandRoads/cycling/Pages/Bicycledata.aspx
5
The Cycling Safety Panel noted, for example, that: “Cycling projects struggle to access funding because they are not
accorded sufficiently high priority within either the [Road Controlling Authorities] or the Transport Agency. There have
been many instances over recent years where cycling projects experienced difficulty either gaining local council support
or meeting Transport Agency investment criteria. Councils have told the Panel they would like a clear national
commitment to sustained investment in cycling and a partnership approach from the Agency”.
6
Research to estimate the increase in total kilometres travelled by cyclists required to justify the infrastructure
investment (i.e. obtain a benefit-cost ratio of 1) suggested, for example, that only a 14 percent increase would be

Page 8
on a compelling case for change and a clear view of the benefits sought in order that these can be
traded off against dis-benefits and stakeholder concerns.
Part of the reason for the focus on a narrow range of benefits is that the benefits may be seen as
relevant to a specific group of stakeholders only. Some benefits accrue primarily to the national
economy, others primarily to the local economy, and yet others primarily to individuals.
This narrow focus therefore fails to resonate with a range of stakeholders, particularly if they are
impacted by the investment. This is particularly the case for new cycle facilities which involve
reallocation of road space from other road users or from car parking.
Evidence of this can be seen where councils have struggled with consultation processes on cycling
facilities as there is a lack of a compelling case for investment or the wider benefits that are being
sought. In these cases stakeholders are often vocal in their opposition to increased cycling
infrastructure. For example, motorised vehicle drivers and retailers frequently express concern
about loss of road and parking space.
2.3.4 Currently, cyclist and potential cyclist requirements are not fully understood,
increasing the potential for investments not being optimised
There is evidence that cyclist and potential cyclist requirements are currently not fully understood
and this is increasing the potential for investments not being optimised.
Reasons cyclist and potential cyclist requirements are not fully understood include:
it is not always clear who the cyclists and potential cyclists are
cyclists and potential cyclists are of many different types, physical abilities and
confidence, have a range of reasons for cycling and cycle in different conditions
there is a lack of examples of good cycling infrastructure that demonstrates what meeting
cyclist and potential cyclist requirements looks like
there is limited understanding of the levels of service required to meet the needs of the
significant ‘interested but concerned’ group who would take up cycling as a made of
transport if it was seen to be safe, and
there is a lack of good data about cyclists’ needs and desires for cycling facilities from
location-specific research and evaluation and no central collection point for data that does
exist.
With cyclists comprising only a small percentage of road users, it is perhaps to be expected that
they would not receive the same attention from road controlling authorities (RCAs) and the
Transport Agency as other road users. Consequently, most of the road network has been, and
continues to be, designed primarily for motorised vehicles, with little space provided to separate
cyclists from fast moving and large vehicles and little done to address the high risk to the safety
of cyclists at intersections.
Cycling networks are also fragmented and are not well connected between popular transport trip
origins and destinations, or to public transport hubs. Improvements struggle to gain local council
support despite overseas experience showing that connected networks and their links to public
transport hubs being the most key cyclist requirements. There is therefore an incentive for anyone
other than the very small percentage of ‘strong and fearless’ cyclists to continue to use their cars
and for investment being directed to providing the much more expensive infrastructure for motor
vehicle transport.
The historic annual underspend of the appropriation for the Walking and Cycling Activity Class in
the National Land Transport Fund is an indicator that investment in cycling infrastructure needs
fresh impetus. Walking and cycling expenditure currently tends to occur in the lower half of the
funding range. There are different perspectives on why this is the case. Local authorities advise
that this is because of the rigour and required ‘strategic fit’ of the Transport Agency investment
required in Christchurch and a 16-23 percent increase in Wellington. Such increases should be thought of as completely
unambitious. A 23 percent increase in cycling in Wellington would mean that Wellingtonians would still be doing only
about one-tenth of the cycling of the people of the Netherlands.

Page 9
criteria and processes. Our experience tends to be that local authorities either don’t prioritise
investment for cycling relative to other (transport and non-transport) priorities or do not deliver to
programme and utilise available funding that has been approved.
The Transport Agency plans to address this deficit in knowledge about cyclist and potential cyclist
requirements through a number of work-streams.
Key benefits
2.3.5 Improved safety for cycling
There is evidence that an increase in people cycling directly reduces the rate of risk of serious
injury and fatality per cyclist involving motor vehicles. This is due to a number of factors,
including:
greater expectation amongst drivers that cyclists will be present
greater awareness of cyclists who are present
more drivers knowing what it is like to be on a bicycle and behaving more safely around
them; and
drivers’ attitudes improving.
This is called the ‘safety in numbers’ phenomenon.
There also appears to be a link between providing dedicated cycling infrastructure and improving
cycle safety. In countries such as Denmark, Germany, and the Netherlands, where cycle networks
are well established, more people cycle and there is a significantly lower fatality risk for cyclists. In
New Zealand, a recent Canterbury University study found that the installation of simple painted
cycle lanes along monitored streets resulted in an average 23 percent reduction in cycle crash
rates.
Serious injuries and fatalities to car occupants and pedestrians could also be expected with
reduced car use.
Testament to the value of good cycling infrastructure is Hastings, one of the two cycling and
walking model communities, where cycle crash rates have fallen to about one-third of what they
were in only two years despite early indications from year two cycle counts showing a healthy 20
percent increase in cycle numbers.
2.3.6 A more efficient transport network
There is evidence that an increase in cycling would potentially reduce traffic congestion that
causes long and unreliable travel times (sub-optimal network performance).
Initiatives that result in even a few people switching from using their cars to using other forms of
transport can markedly reduce congestion. On the congested 5km Petone to Ngauranga section of
State Highway 2, for example, it has been suggested that only 10-30 vehicles out of the 250-280
vehicles occupying the space at congested times are causing the congestion.7
Bicycles are considered to impose 95 percent less traffic congestion than an average car.8
A recent
study on the benefits of cycling in the European Union, commissioned by the European Cyclists’
Federation, found that the internal and external economic benefits of congestion-easing due to
cycling in the EU at the 2010 mode share level was €24.2 billion per year. Early reports on
evaluation of Hastings’ iWay initiative indicate a 3.6% reduction in traffic volumes.
7
Money, C., The Importance of Making Best Use of Existing Networks in Promoting Productivity, Hyder Consulting (NZ)
Ltd, 2009.
8
From Australian Bicycle Council, National Cycling Strategy 2011-2016: Gearing up for active and sustainable
communities, Austroads, p.8.

Page 10
Studies suggest that having predictable and reliable journey times may be more important to
people than saving time itself.9
On congested roads, traffic flow and travel time reliability is
dramatically decreased. Traffic conditions affect the speeds of people cycling less than they affect
the speeds of people driving, so cycling is generally going to deliver more reliable travel times for
people who cycle.10
Network reliability for other users is also likely to be improved with a mode
shift from cars to bicycles.
Furthermore, many people tend to overestimate travel times by bicycle, and when travel time is
measured door to door, distances up to 5km on congested roads are often quicker on bicycle than
in a motor vehicle.11
Fifty-six percent of Copenhagen cyclists surveyed say that cycling is the
fastest mode of transport for their purposes.12
In such contexts, providing people with a further
option for the transport mode they could choose by providing appropriate customer levels of
service can directly contribute to optimising the transport network.
2.3.7 More effective delivery of cycling investment
There is evidence that local authority investment in cycling infrastructure and complementary
initiatives would be more effective if the Transport Agency took a leadership role and partnered
with road controlling authorities to ensure the investment is better planned, coordinated and
targeted. In order to do this and achieve better delivery, we will focus on ensuring the cycling
programme is well run, all partners and stakeholders have sufficient knowledge and
understanding of cycling, and a collaborative approach is taken.
Cycle networks are currently fragmented, sometimes of poor design, and often not connected to
public transport hubs. This leads to sub-optimal use. Through setting clear integration and quality
requirements for any Transport Agency support for cycling infrastructure, from any funding
source, and through providing advice, support and information, the Agency can positively
influence cycling investment. This influence will be enhanced with a greater level of funding.
3. STRATEGIC CONTEXT
3.1 Gearing up in cycling – a changing context
Cycling is a key part of New Zealand’s land transport system. The context around cycling, and its
role in the transport system, is changing. There has been significant, growing interest in cycling
and increasing safety for people who cycle from a range of stakeholders over the past few years.
The report from the Cycling Safety Panel provides a strong impetus for an increased focus on
making cycling safer. It found that cycling has a greater safety risk leading to a higher rate of
deaths and serious injuries compared to other transport modes.
The Transport Agency has significantly elevated its focus on cycling by making it a new priority in
its Statement of Intent. This will have implications across the Agency for our role, as discussed in
Section 3.2.
Increased cycling will also lead to a significant range of wider benefits. While not the focus of this
strategic case, these are very well documented – ranging from making our towns and cities great
places to live, to economic benefits, to contributing to healthier communities. These benefits are
yet to be fully realised in New Zealand.
9
Aldred R, ‘Benefits of Investing in Cycling’, British Cycling,
http://www.britishcycling.org.uk/zuvvi/media/bc_files/campaigning/BENEFITS_OF_INVESTING_IN_CYCLING_DIGI_FINAL.
10
Ibid.
11
From Australian Bicycle Council, National Cycling Strategy 2011-2016: Gearing up for active and sustainable
communities, Austroads, p.8.
12
Copenhagen City of Cyclists, Bicycle Account 2012, www.kk.dk/cityofcyclists

Page 11
3.1.1 Customer demand for cycling
Cycling for transport purposes in New Zealand, e.g. to work and education, has increased among
adults since the early 2000s (although it is still significantly less than 1990 levels13
).
Research has also confirmed that an increasing number of people would like to cycle more.14
For
example, a Wellington City Council cycling survey carried out between March and June 2014 found
that 9% cycle to work regularly and an additional 22% would prefer to cycle to work, but currently
don’t for one reason or another. A survey by Auckland Transport produced almost identical
results.
Despite the demand for increased cycling, New Zealand has not yet put in place the changes
needed to enable this to happen and thereby fully realise the benefits of cycling, particularly for
the transport system in urban areas.
Numerous studies have also found that while a lot of people would like to cycle more, many don’t
because they perceive it to be unsafe because infrastructure such as dedicated cycle lanes is
fragmented or does not exist. There is therefore strong latent demand for good cycling
infrastructure.
The 2013 census showed that the number of people choosing to cycle to work across the country
on census day increased by 16 percent (6,093 people) from 2006. In Wellington and Auckland,
between 2007 and 2012, the number of cyclists counted during peak hours grew by
approximately 40 percent and 22 percent, respectively.
Internationally, cycling is seeing a resurgence in many countries that were previously regarded as
‘cycling unfriendly’. From a consumer perspective, this growth appears to be driven by a range of
personal benefits ranging from avoiding traffic congestion and its associated unreliable travel
times, desire for improved health and fitness, saving money and wanting to be more
environmentally sustainable.
From an infrastructure provider perspective, it appears to be driven by a desire to realise all of the
benefits of cycling for transport network efficiency, economies and society. Many other countries
primarily invest in cycling transport for health, rather than just transport, benefits.
It is likely, however, that supply of improved cycling infrastructure is also driving demand as the
ambience and convenience of cycle travel is improved and cycling is perceived as a safer and more
attractive transport option.
New Zealand has seen significant growing interest in cycling and cycling safety over the past few
years for similar reasons. This has resulted in the New Zealand Cycle Trails, Walking and Cycling
Model Communities, more focus on cycle facilities by many councils, the Cycle Safety Panel, and
increased Government funding through the $100 million Urban Cycleways Fund.
Other motivators for investment in cycling infrastructure include protecting New Zealand’s
reputation as a desirable tourism destination and ‘clean-green’ nation. Cycling is also recognised
as a key part of New Zealand’s land transport system and having an important role in optimising
the overall land transport network.
The success of the New Zealand Cycle Trails and the two Walking and Cycling Model Communities
(in Hastings and New Plymouth) provide some validation for increasing levels of infrastructure. An
evaluation of the New Zealand Cycle Trails project found that across 439 local businesses
surveyed in the case study regions, about 50 full-time positions had been created as a result of
the trails opening. One trail had an estimated 100,000 users in a four-month period. Early reports
from Hastings indicated a healthy 20 percent or greater increase in cycle numbers per annum,
13
Between 1990 and 2014, the number of people cycling to work and school in New Zealand declined by approximately
75 percent. 14
A recent study commissioned by the Transport Agency found a significant difference in transport mode preferences amongst
Generation Y compared to previous generations. Significantly, it found that “While a high latent demand for public transport use was found, preliminary data … suggested that latent demand for active transport modes (eg walking and cycling) could in fact be higher, with respondents indicating a desire to increase their travel by cycling the most…” Rive et al, Public Transport and the Next Generation, 2014, p.13.

Page 12
visitors being attracted to the area because of its cycling opportunities, and local businesses
associated with cycling reporting significant business growth.
3.1.2 Increasing Government focus on cycling
The Government has noted that there are opportunities for cycling to take a greater role in
providing transport system capacity in our urban areas and seeks increased safe cycling through
improvement of cycle networks.15
The context for this includes: increasing uptake of cycling as active transport nationally and
internationally; increasing demand for infrastructure to separate cyclists from traffic and that is
connected; concerns about the safety of cycling; and a desire to realise all of the benefits that
cycling as active transport can bring to the economy and society.
The Government’s intent for cycling is expressed through a number of organisations, policy
documents and initiatives that are facilitating increased focus on, and investment in, cycling.
These are discussed in Appendix E.
The most recent central government initiative is the establishment of the Urban Cycleways
Programme, which with the allocation for cycling in the National Land Transport Programme
(NLTP), plus local share funding, means up to $300 million is available for urban cycling initiatives
over the next four years.
It is imperative that this investment is wisely directed in order to maximise benefits. This will be
informed by this strategic case.
This funding complements the Government’s previous $50 million investment in the New Zealand
Cycle Trails initiative and other government efforts towards making the road network safer for
cyclists in response to the Cycling Safety Panel report.
3.1.3 Increasing local government interest and investment in cycling
For reasons similar to those that drove increased central government interest, there has also been
increased local government interest in cycling. Increased cycling often aligns well with not only
transport outcomes sought by local government, but also broader community outcomes such as
liveability, place-making, economic development, tourism, safety and health.
Increased local government interest has resulted in increasing levels of recognition in strategic
documents and availability of resources, and many councils have increased their actual or
proposed investment in cycle facilities. For example, in the 2014/15 financial year, Auckland
Transport invested $12 million into cycling and Wellington City Council is looking to significantly
increase its cycling budget for 2015-18.
Outside of Auckland and the model communities, there are, however, only a few examples of
councils that have managed to make a significant difference in addressing barriers to cycling and
increasing participation levels. Where this has been the case – such as Nelson - this has taken
many years of sustained effort and investment.
The Cycling Safety Panel report also provides a number of recommendations that local
government will need to consider and act on as part of a duty of care for cyclists.
3.1.4 Increased activity for cycling from other stakeholders
Other key stakeholders have also increased their activity for cycling as active transport. For
example, Cycling New Zealand (formerly Bike NZ) has developed a ‘Community Cycling Strategy
2015-2020’ that incorporates a wider focus on growing regular participation in cycling.
The New Zealand Cycle Trails have also supported the growth of a number of strong local trusts
and organisations focused around cycling activity. These organisations have been pivotal in
leveraging significant additional local investment in these projects, and increasing cycling as a
recreational and tourist activity. A new section of Te Awa – Great New Zealand River Ride will take
shape this year thanks to a $4.5M funding partnership between Te Awa Trust, central government,
Waikato District Council and the Transport Agency.
3.1.5 Past investment and outcomes
Relative to the level of investment potentially required to improve the safety and attractiveness of
cycling16
, there has been a low level of central and local government investment.
15
Government Policy Statement on Land Transport 2015/16-2024/25.

Page 13
Past central government investment in cycling has primarily been through the National Land
Transport Programme (NLTP). While there has been significant money potentially available through
the National Land Transport Fund (Government Policy Statement on Land Transport 2012-15
provided for up to $30 million per year), walking and cycling expenditure currently tends to occur
in the lower half of the funding range.17
There are different perspectives on why this is the case. Local authorities advise that this is
because of the rigour and required ‘strategic fit’ of the Transport Agency investment criteria and
processes. Our experience tends to be that local authorities either don’t prioritise investment for
cycling relative to other (transport and non-transport) priorities or do not deliver to programme
and utilise available funding that has been approved.
There is clear evidence that there has been systemic under-delivery of cycling projects relative to
those that are approved through planning processes. As a result, there has been a lack of
progress for urban cycle networks.
The exception to this has been the highly successful New Zealand Cycle Trails programme over
the past 5 years which has seen $50 million investment from central government leverage an
additional $30 million from other local sources.
3.2 Role of the Transport Agency
There is significant stakeholder expectation that the Transport Agency should take a leading role
in making cycling a safer and more attractive transport choice.
In response we are developing a comprehensive programme of work to support our ‘gearing up’ in
cycling and made cycling a new priority in our Statement of Intent. We see this as part of
positioning the Agency to take a whole of transport system approach and an important part of the
Transport Agency’s one network goal. It requires that we ‘change gear’ in cycling and has
implications for our role and position with our partners and the wider sector.
3.2.1 Position of the Transport Agency and alignment with our organisational goals
The proposed Transport Agency role in providing leadership to make cycling a safer and more
attractive transport choice is very strongly aligned with our organisational goals and desired
outcomes and those of our partners.
Through this strategic case process we have begun developing our position in relation to cycling
with respect to the Statement of Intent, our stakeholders, and our customers. This is an evolving
piece of work that will feed into strategy sessions with our Board in early 2015.
Our emerging thinking has involved input from a wide range of key stakeholders from the public
and private sectors.
To deliver on this, we feel it would be useful to adopt a simple clear position to ‘make cycling a
safer and more attractive transport choice’.
The Statement of Intent objectives would be met by increasing cycling’s contribution to moving
people where they need to go in a timely manner, reducing the harms from transport and
improving resiliency. Increased cycling will also help to ensure travel around New Zealand’s towns
and cities is seamless and more efficient, safe and reliable, and contributes to maximising returns
for New Zealand.
Increased cycling will also contribute to the Ministry of Transport’s objective of developing a
transport system that maximises the economic and social benefits for New Zealand and minimises
harm.
16
Estimates are that it would cost around $500 million to central and local government to complete the highest priority
components of strategic cycling networks in Auckland, Wellington and Christchurch.
17
Total investment in cycling for the 2012-2015 period is estimated to be around $90 million, made up of $55 million
from the National Land Transport Fund and $35 million from local authorities. In addition, there is around another $80
million of investment on items such as cycle lanes, wider shoulders, road marking, and cycle-focused user behaviour
programmes. Funding for this work comes primarily from the Highways Improvements, Local Road Improvements, and
Road User Behaviour activity classes.

Page 14
3.2.2 Our role and focus – early thinking
We are in the process of developing a programme of work to respond to this strategic case. Our
initial work on this suggests that to be successful, our role, focus and priorities need to
encompass:
An innovative investment, infrastructure, and user behaviour programme in partnership with
councils and the wider sector.
Cross sector leadership, balancing the needs of cyclists with other network users through
guidance/standards, collaborative planning and investment, and effective delivery to
maximise benefits sooner.
We would need to develop suitable measures and targets for this. Linked to the cycleway
investment programme over the next four years, this could include measures and targets which
are acceptable to the Government and encompass safety.
This early thinking also indicates that we would need to focus on three key customer and
stakeholder groups:
cyclists – current and future: Building a strong cycling culture means lowering real and
perceived risks of cycling in New Zealand
other network users: All road users need to be part of the solutions to increase cycling
decision makers: A case needs to be built with a vision that includes the whole transport
system.
The programme of work to deliver on this would need to include a number of dimensions to
provide:
Vision: The cycling community looks to this programme for leadership and an articulation
of a comprehensive plan for the future of cycling in New Zealand.
Connected networks: We need safe connected networks for all users, including to public
transport hubs. The programme will ensure optimisation and delivery of the investment
over the next few years. This will include optimisation across the NLTP, the Urban
Cycleways Fund, and local investment.
Behaviour: By targeting all network users we can ensure cycling is seen as an integral part
of the transport system. We will also target behaviour across the Agency so everyone
understands how their role contributes to our goal.
Rationale: We need a clear business case that spells out the benefits and value for money
for cycling investment for stakeholders and decision makers. The programme will provide
this nationally, and thereby support our regional and local partners.
3.2.3 Working with others
This programme of work will need to be delivered in partnership with others. How this will occur
will need to be clarified.
There is strong synergy of positions, programmes and organisational goals amongst the partners
and key stakeholders. Commonalities in areas of focus include:
vision for the transport network
connected networks
better network performance
safety of the network.
There are few areas of misalignment of positions, programmes and organisational goals.
Differences in areas of focus across the partners, key stakeholders and customers of the
participating organisations appear limited to:

Page 15
priority of use of road space (for example, for car drivers and parking vs cyclists)
order of priority of regional and local implementation.
Motorised vehicle drivers and retailers frequently express concern about loss of road and parking
space.
There are also tensions between funding cycleways with the highest benefit-cost ratios as the
highest priorities and ensuring regional equity, and funding cycleways that are focused on
recreational and tourism benefits rather than primarily everyday transport benefits.
4. SCOPE OF INVESTING IN CYCLING AND WHERE
THE COSTS AND BENEFITS WILL FALL
The scope of investing to make cycling a safer and more attractive transport choice will
encompasses multiple organisations and progressing a number of projects through collaboration
and joint investment.
The contributing parties are anticipated to be the Transport Agency (through the Urban Cycleways
Programme and the NLTP) and the local authorities that make up the 15 main urban centres (some
25 councils). Costs are therefore anticipated to accrue primarily to central and local government.
Benefits are anticipated to accrue to the national economy and central government agencies
(primarily through reduced costs), and to local economies, local government and individuals in the
areas in which investments are made.
5. PARTNERS AND KEY STAKEHOLDERS
The Transport Agency’s key partners to this strategic case are:
Local authorities in the 15 main urban centres;
Ministry of Transport;
Local Government New Zealand; and
Cycling New Zealand.
The other key stakeholders include: Urban Cycleways Investment Panel; the New Zealand Treasury;
New Zealand Police; Ministry of Health; ACC; Ministers of the Crown; Members of Parliament;
regional cycling groups and clubs; advocacy groups (e.g. CAN, Bike NZ, Living Streets Aotearoa);
Campaign for Better Transport (which hosts transportblog.co.nz); bike manufacturers; Generation
Zero; AA; Bus and Coach Association; industry groups; community and business associations;
media; EECA; MBIE (tourism); cycle tour operators; NZCT (Inc); Sport NZ; Coronial Services of New
Zealand; Ministry of Justice; Road Transport Forum NZ; Road Transport Association NZ; Ministry
for the Environment; health groups; researchers; the general public and international
stakeholders.
Customers of the participating organisations relevant to this investment include:
cyclists – current and future
other network users
decision makers in the partner and stakeholder organisations.

Page 16
6. ANTICIPATED STRATEGIC FIT
This investment proposal is aimed at making cycling a safer and more attractive transport choice.
This aim is consistent with our new Statement of Intent which lists cycling as one of its six
priorities and has a success indicator of ‘By 2019 we will increase total annual cycling trips by 10
million to grow transport choices for urban customers’.
The programme is considered a high strategic fit with the Investment Assessment Framework
(IAF).
This is because the programme will involve delivering primary cycling corridors within cycling
strategic networks in main urban areas for the purposes of utility cycling, including associated
facilities to put the corridors into service. It also aims to invest in corridors, or sites, with a high
walking and cycling crash risk.
Work will be undertaken with partners to ensure the programme has a high effectiveness rating
and delivers good value for money. An indication of this is that the $300million investment could
lead to some $1.5billion of benefits.


Page III
APPENDIX A
INVESTMENT LOGIC MAP AND POTENTIAL KPIS
Cycling has a greater safety risk leading to a higher rate of deaths and serious injuries compared to other transport modes
30%
Perceptions that cycling is unsafe, unattractive and
inconvenient mean it is not effectively
contributing to the transport system
20%
A focus on a narrow range of benefits has
led to poor stakeholder buy-in across the country
40%
Cyclist and potential cyclist requirements
are not fully understood,
increasing the potential for
investments not being
optimised 10%
Improved safety for cycling 30%
KPI 1: Lower rate of fatal and injury
crashes involving cyclists on the road
network by time spent cycling
KPI 2: Lower rate of fatal and injury
crashes involving cyclists on the road
network by total cyclists.
Problem Benefit / KPIs
More efficient transport network 45%
KPI 3: Number of cyclists in
Auckland, Wellington & Christchurch
KPI 4: Percentage increase in cycling
mode share across Auckland,
Wellington and Christchurch
KPI 5: Number of people moved by
mode in Auckland, Wellington &
Christchurch
KPI 6: Perceptions of ease of cycling
in Auckland, Wellington &
Christchurch
KPI 7: Proportion of population living
within 500metres of a cycle facility.
More effective delivery of cycling investment 25% KPI 8: Degree of development of the
planned urban cycleway networks
across Auckland, Wellington and
Christchurch
KPI 9: Percentage of central and local
govt monies planned for investment
into the cycling programme actually
invested
KPI 10: Percentage of planned
activity delivered to time.

Page III
APPENDIX B
INITIAL BENEFITS MAP
Improved safety for cycling
30%
Benefit Investment
benefit
Improve safety
Measure Description Baseline Target
DSI by mode nn%
DSI nn%
Number of DSI by mode by time spent
cycling
Number of DSI Total cyclists
TBD Mm/yyyy
TBD Mm/yyyy
Reduced deaths. No increase in SI
Mm/yyyy TBD
(Interim: Main urban centres)
Mm/yyyy
More efficient transport network
45%
Increase throughput
Improve customer experience
Access to key destinations
Throughput cycles nn%
Mode share cycles nn%
Throughput people by mode
nn%
Perceived ease of cycling
nn%
Spatial coverage nn%
More effective delivery of
cycling investment
25%
Improve customer experience
Actual cycle lanes and paths
nn%
Total investment from programme
nn%
Cycling programme
nn%
Number of cyclists
% share of cyclists
Number of people moved…
Level of satisfaction regarding ease of
cycling
TBD 1.6% of journeys Mm/yyyy
Double by 2020 Mm/yyyy
TBD Mm/yyyy
Main urban centres
Mm/yyyy
Increase (corridors TBD)
Mm/yyyy
TBD User surveys Mm/yyyy Access to
destinations etc
Improve Mm/yyyy
% contribution to completion of strategic
cycle network
TBD Mm/yyyy
Increasing Mm/yyyy
% of money invested by local govt / Govt
into programme
$80million Mm/yyyy
$275-$320million Mm/yyyy
Delivery to time 50% of planned
activity Mm/yyyy
90%-100% 3 yrs Mm/yyyy
Proportion of popn living w/in 500m of a cycle
facility nn%
Page III
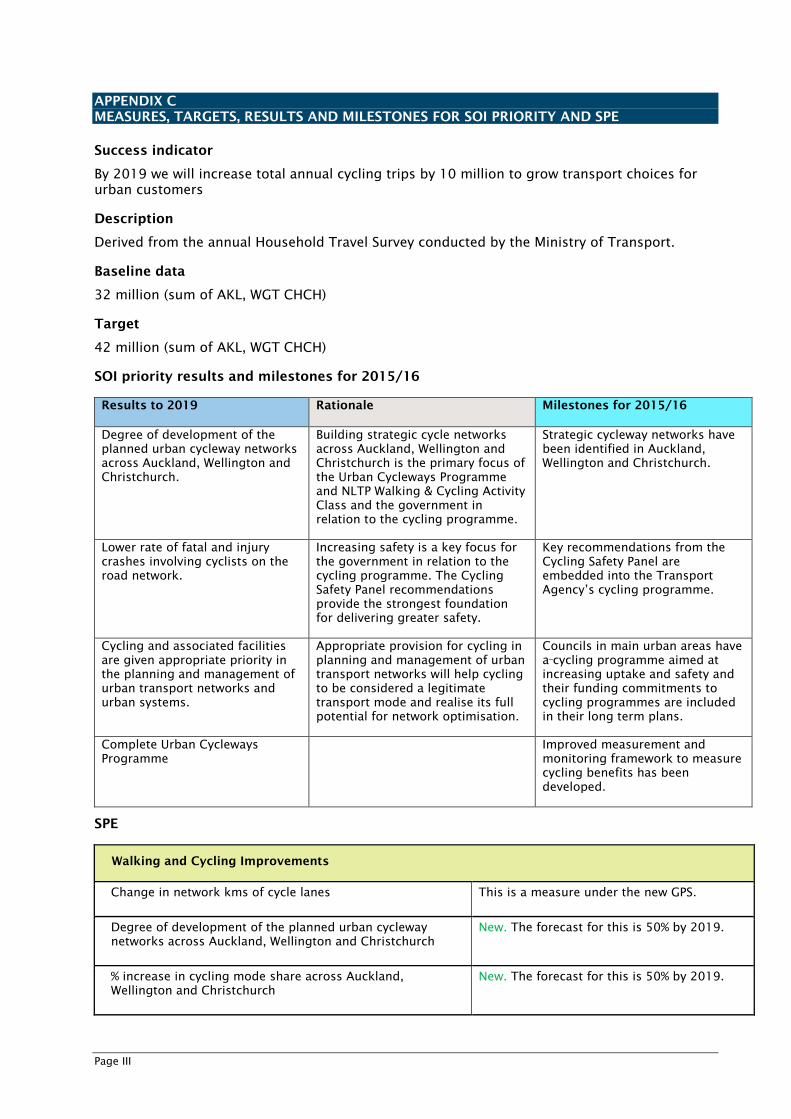
APPENDIX C
MEASURES, TARGETS, RESULTS AND MILESTONES FOR SOI PRIORITY AND SPE
Success indicator
By 2019 we will increase total annual cycling trips by 10 million to grow transport choices for
urban customers
Description
Derived from the annual Household Travel Survey conducted by the Ministry of Transport.
Baseline data
32 million (sum of AKL, WGT CHCH)
Target
42 million (sum of AKL, WGT CHCH)
SOI priority results and milestones for 2015/16
Results to 2019 Rationale Milestones for 2015/16
Degree of development of the
planned urban cycleway networks
across Auckland, Wellington and
Christchurch.
Building strategic cycle networks
across Auckland, Wellington and
Christchurch is the primary focus of
the Urban Cycleways Programme
and NLTP Walking & Cycling Activity
Class and the government in
relation to the cycling programme.
Strategic cycleway networks have
been identified in Auckland,
Wellington and Christchurch.
Lower rate of fatal and injury
crashes involving cyclists on the
road network.
Increasing safety is a key focus for
the government in relation to the
cycling programme. The Cycling
Safety Panel recommendations
provide the strongest foundation
for delivering greater safety.
Key recommendations from the
Cycling Safety Panel are
embedded into the Transport
Agency’s cycling programme.
Cycling and associated facilities
are given appropriate priority in
the planning and management of
urban transport networks and
urban systems.
Appropriate provision for cycling in
planning and management of urban
transport networks will help cycling
to be considered a legitimate
transport mode and realise its full
potential for network optimisation.
Councils in main urban areas have
a cycling programme aimed at
increasing uptake and safety and
their funding commitments to
cycling programmes are included
in their long term plans.
Complete Urban Cycleways
Programme
Improved measurement and
monitoring framework to measure
cycling benefits has been
developed.
SPE
Walking and Cycling Improvements
Change in network kms of cycle lanes This is a measure under the new GPS.
Degree of development of the planned urban cycleway
networks across Auckland, Wellington and Christchurch
New. The forecast for this is 50% by 2019.
% increase in cycling mode share across Auckland,
Wellington and Christchurch
New. The forecast for this is 50% by 2019.

Page III
APPENDIX D
WIDER BENEFITS OF CYCLING AS A SAFER AND MORE ATTRACTIVE TRANSPORT CHOICE
The strategic case outlines the key problems and benefits to be addressed. While these will be the
focus of the programme, it is important to note that the investment is also likely to result in a range of
wider benefits.
These generally result from increased levels of cycling safety and participation, are evidenced through
research, and include transport, societal and individual benefits.
These wider benefits would primarily be realised through reductions in:
negative externalities such as pollution, greenhouse gas emissions, and noise
urban road and parking infrastructure maintenance, operation, disposal and renewal costs
public transport costs (for provision and personal use)
vehicle operating costs (including fuel costs)
health and productivity costs of physical inactivity
social isolation and economic disadvantage and their attendant consequences, and
other costs of motorised transport that are difficult to estimate but are not trivial.
The benefits would also include creating more liveable, vibrant and attractive communities with
stimulated economies and improved mobility options, particularly for non-drivers.
These benefits are discussed below.
Reducing negative externalities from motorised vehicles
There is evidence that an increase in cycling would potentially reduce negative externalities from
motorised vehicles such as pollution, greenhouse gas emissions and noise.
Motor vehicles are major contributors to the production of air pollutants, such as carbon oxides and
sulphur oxides. These are widely known to contribute to chronic disease and respiratory ailments.
Furthermore, even a small reduction in short vehicle trips can generate a significant reduction in
carbon emissions. Shifting 5 percent of car trips to bicycle could reduce emission impacts by up to 8
percent.18
The Queensland Department of Transport and Main Roads found that: “The combined environmental
benefits of reducing noise and greenhouse gas emissions, and improving air quality, equates to around
5.9 cents per kilometre walked or cycled”.19
Reducing urban road and parking infrastructure provision costs
There is evidence that an increase in cycling could allow urban road and parking infrastructure
provision costs to be avoided. This is strongly demonstrated in Christchurch where 70,000 additional
car trips per day are predicted in the city by 2041 unless a mode shift to walking, cycling and public
transport occurs. Catering for an additional 70,000 car trips would be considerably more expensive
than providing for increased walking, cycling and public transport and would make the city less
liveable. A threefold increase in the use of cycling and public transport is estimated to avoid the
significant additional road capacity and parking provision that would otherwise be required. In 2013,
4.9 percent of employed people cycled to work in Christchurch.
The Queensland Department of Transport and Main Roads found that the avoided cost of infrastructure
provision through a mode shift towards active travel equates to about 5.2 cents per kilometre.20
Similarly, the (US) Victoria Transport Policy Institute found that “Shifts from driving to walking or
bicycling provide roadway facility and traffic service cost savings of approximately 5 cents per mile for
urban driving and 3 cents per mile for rural driving, including indirect travel reductions leveraged by
non-motorized transport improvements”. As the Institute points out, “Typically 10-20 bicycles can be
18
From Australian Bicycle Council, National Cycling Strategy 2011-2016: Gearing up for active and sustainable
communities, Austroads, p.9.
19
See Queensland Department of Transport and Main Roads 2011, Benefits of inclusion of active transport in
infrastructure projects, prepared by SKM and PWC, Table EX.1: Benefits summary.
20
See Queensland Department of Transport and Main Roads 2011, Benefits of inclusion of active transport in
infrastructure projects, prepared by SKM and PWC.

Page III
stored in the space required for one automobile…” and cycling requires less road space and imposes
less wear, and so the cost per mile of travel is less.21
Reducing urban public transport costs (for provision and personal use)
There is evidence that an increase in cycling would potentially reduce urban public transport provision
costs. As stated earlier in this paper, a 2014- study commissioned by the Transport Agency (Rive et al,
Public Transport and the Next Generation), found that “While a high latent demand for public transport
use was found, preliminary data collected in the survey suggested that latent demand for active
transport modes (eg walking and cycling) could in fact be higher, with respondents indicating a desire
to increase their travel by cycling the most…”.22
This finding contributes to the evidence that enabling people to cycle will be likely to reduce the costs
of personal use of public transport.
Reducing vehicle operating costs
It is clear that an increase in cycling would reduce vehicle operating costs. The Queensland Department
of Transport and Main Roads noted that the vehicle operating cost savings benefit in its report was
calculated at around 35 cents per kilometre for a generic walking and riding infrastructure project.23
In
terms of impacts on personal finances, it has been estimated that it costs up to $1.00 per kilometre to
operate a car compared to $0.06 per kilometre to cycle.
Reducing health costs of physical inactivity
There is evidence that an increase in cycling would potentially reduce health costs of physical inactivity.
The Ministry of Health reports that only 50.5 percent of NZ adults are regarded as sufficiently active for
health benefits24
and physical inactivity is the second leading risk factor of disability adjusted life years
(DALYs) in New Zealand, with 7 percent of DALYs being attributable to inactivity.25
The strongest evidence for the health benefits of cycling comes from relative risk data from two
combined Copenhagen cohort studies cited by the World Health Organization (WHO). The WHO noted
that: “This study included 6954 20-60-year-old participants, followed up for average of 14½ years. It
found a relative risk of all-cause mortality among regular commuter cyclists of 0.72 (95% confidence
interval (CI): 0.57-0.91) compared to non-cycling commuters, for 3 hours of commuter cycling per
week”.26
A study for British Cycling found that if people in urban England and Wales cycled and walked as much
as people do in Copenhagen, the National Health Service could save around £17 billion within 20 years.
A Dutch study quantifying the impact (life-years gained or lost) of all-cause mortality if 500,000 people
made a transition from car to bicycle for short trips on a daily basis in the Netherlands estimated that,
for individuals, beneficial effects of increased physical activity are substantially larger (3-14 months
gained) than the potential mortality effects of increased inhaled air pollution doses (0.8-40 days lost)
and the increase in traffic accidents (5-9 days lost). Repeating their calculations for the United
Kingdom, where the risk of dying per 100 million kilometres for a cyclist is about 2.5 times higher,
they found the benefits of cycling were still 7 times larger than the risks.
Notably, Polis, a network of European cities and regions working together to develop innovative
technologies and policies for local transport, recommend the systematic internalisation of health costs
21
Litman T., Evaluating Non-Motorized Transportation Benefits and Costs, Victoria Transport Policy Institute 24
November 2011, p.31.
22
Rive et al, Public Transport and the Next Generation, NZ Transport Agency, 2014.
23
Australian Department of Infrastructure and Transport, Walking, Riding and Access to Public Transport: Draft Report
for Discussion – October 2012, p.64. 24
Ministry of Health. 2008. A portrait of health: Key results of the 2006/07 Health Survey. Wellington: Ministry of
Health. Cited in Genter J.A., Donovan, S., Petrenas, B., and Badland, H. 2008. Valuing the health benefits of active
transport modes, NZ Transport Agency Research Report 359.
25
Ministry of Health. 2001. The burden of disease and injury in New Zealand. Wellington: Ministry of Health. Cited in
Genter J.A., Donovan, S., Petrenas, B., and Badland, H. 2008. Valuing the health benefits of active transport modes, NZ
Transport Agency Research Report 359.
26
World Health Organization, Health economic assessment tools (HEAT) for walking and cycling: Methods and user
guide, 2014 update, Economic Assessment of Transport Infrastructure and Policies, WHO, 2014.

Page III
in transport (current and future, linked to physical inactivity) and integrating health considerations in
transport planning.27
Reducing productivity costs of physical inactivity
There is evidence that an increase in cycling would potentially improve productivity. A number of
studies have suggested that reducing congestion would result in productivity benefits.28
In relation to
fitter and healthier workers, studies have found that such workers tend to be more productive and take
fewer sick days.
Reducing social isolation and economic disadvantage
There is evidence that an increase in cycling would potentially reduce social isolation and economic
disadvantage and its attendant consequences. Improved accessibility of cycling would achieve this
through improving mobility options, particularly for non-drivers. As Litman (2011) argues, for example:
“People who are physically, economically and socially disadvantaged often rely significantly on non-
motorised modes, so non-motorised improvements can help improve social equity and economic
opportunity”.29
Reducing other costs
There is some evidence that an increase in cycling would potentially reduce a number of other costs of
motorised transport that are difficult to estimate but are not trivial. These include severance of
communities (that is, the social impacts caused by a barrier such as a busy road reducing community
interaction and cohesion), loss of tranquillity, degradation of landscape and countryside, the
opportunity cost of land used for roads and parking, waste disposal (cars, tyres, used oil), diffuse water
pollution from oil runoff, and wildlife casualties. Many of these effects impact on the liveability of
areas.
More liveable, vibrant and attractive communities with stimulated economies
There is evidence that increased cycling infrastructure can create more liveable, vibrant and attractive
communities with stimulated economies. Cities such as New York, Melbourne, London and indeed
Auckland have chosen to invest in cycling to improve liveability. Additionally, studies have shown that
retail vitality is best served by traffic restraint, public transport improvements, and a range of measures
to improve the walking and cycling environment. Studies have also found that improvements in the
walking and cycling environment have the potential to increase the value of residential and retail
properties.
Overall
Overall, there is evidence for the benefits of increasing investment in ‘cycling specific’ infrastructure. In
their report, Making a Cycling Town: a compilation of practitioners’ experiences from the Cycling
Demonstration Towns programme 2005-2009 the UK Department for Transport and Cycling England
state that:
…even high-cost infrastructure pays back. Cycling England has shown that even a piece of cycling
infrastructure costing £1m needs to convert only 109 people to regular cyclists in order to pay
back in terms of health, congestion and pollution benefits30
. The investment in the CDTs had a
high benefit-cost ratio, estimated to be at least 2.59:1, taking account only of benefits in reduced
mortality. The total benefit (including benefits in terms of congestion, pollution and carbon
emissions) will be higher than this.
A 2010 report for the UK Department of Health concluded that: “… the economic justification for
investments to facilitate cycling and walking has been undervalued or not even considered in public
27
POLIS, Health and Transport: Promoting Active Travel, April 2014,
http://www.internationaltransportforum.org/2014/pdf/polis-active.pdf
28
Money, C., The Importance of Making Best Use of Existing Networks in Promoting Productivity, Hyder Consulting (NZ)
Ltd, 2009. 29
Litman, Todd, Evaluating Non-Motorized Transportation Benefits and Costs, Victoria Transport Policy Institute, 2011.
30
“An investment of £1m would require only 109 additional cyclists (cycling at least 3 times per week through the full
life of the project – assumed for the purposes of calculation to be 30 years). This does not mean that the same people
must continue to cycle, but that on average, there should be 109 more cyclists each year than would be the case were
the investment not made” (p.10).

Page III
policy decision-making. Yet, almost all of the studies report economic benefits which are highly
significant, with benefit to cost ratios averaging 13:1 (UK and non-UK)”.31
Disbenefits
Developing further cycling infrastructure and increasing the number of cyclists on the transport
network will mean some disbenefits to other network users. Transport for London undertook strategic
modelling to estimate the high-level impacts of cycling on the road network in London and found, with
population growth also occurring, there would be negative impacts on traffic congestion and bus
speeds if the impacts were not mitigated. It found that traffic congestion would also impact on the
freight sector. However, Transport for London identified a range of mitigation measures to address
these disbenefits and noted that population growth, increased cycling levels and increased traffic flows
are likely to result in delays occurring for general traffic and buses in central London (if not mitigated)
with or without its Cycle Vision investment.
Other disbenefits are likely to accrue to residents on main arterial routes who lose on-street car
parking immediately outside their houses, and business owners who lose customer car parks
immediately outside of their premises (although research suggests the loss of customer car parks is
likely to be more than outweighed by increased custom from cyclists).
31
http://webarchive.nationalarchives.gov.uk/20050301192906/http:/dft.gov.uk/stellent/groups/dft_econappr/docume
nts/pdf/dft_econappr_pdf_022512.pdf

Page III
APPENDIX E
INSTITUTIONS, POLICY DOCUMENTS AND INITIATIVES TO DELIVER THE GOVERNMENT’S
INTENT FOR CYCLING
New Zealand Transport Agency
The Transport Agency contributes to and delivers the land transport network for New Zealand as set out in
the Land Transport Management Act 2003. It does this through four main functions:
Planning the land transport networks
Investing in land transport
Managing the state highway network, and
Providing access to and use of the land transport system.
The Transport Agency’s desired outcomes include better use of existing transport capacity, more efficient
freight, and a safe, resilient and secure transport network. With its partners, the Transport Agency aspires
to ease severe urban congestion, reduce deaths and serious injuries from road crashes, and reduce
adverse environmental effects from land transport.
The Transport Agency’s Statement of Intent 2015-19 Goal ‘Integrate one effective and resilient network for
customers’ identifies “There is an optimal range of travel and transport choices for each location” as a
success indicator with the percentage of walking a cycling mode share increasing as a desired trend.
Land Transport Management Act 2003 (LTMA)
The LTMA requires the Transport Agency to assess all potential projects against the GPS, the relevant
Regional Land Transport Strategy and Connecting New Zealand’s three key areas of focus across the
transport system:
economic growth and productivity
value for money
road safety.
The National Infrastructure Plan (NIP)
The NIP sets out a vision for New Zealand's infrastructure to be resilient, co-ordinated and contributing to
economic growth and improved quality of life. It supports this through promoting better use of existing
assets and better allocation of new investment.
The NIP sets out guiding principles to respond to infrastructure challenges, outlines infrastructure issues
in relation to transport and other matters, and includes a programme of action to drive change. The next
edition is to be published in 2015.
Of relevance to the aim of making cycling a safer and more attractive transport choice is an action in the
2011 NIP: “… the government will focus on how to improve the efficiency and performance of its own
assets and asset management systems. This will include learning lessons from those agencies that are
leaders in asset management within the government”.
Connecting New Zealand
Connecting New Zealand draws together the policy direction that has been set out in a number of policy
decisions and guidance documents over the last two years. These include the NIP, the Government Policy
Statement on Land Transport Funding 2012/13–2021/22, the New Zealand Energy Efficiency and
Conservation Strategy, the KiwiRail Turnaround Plan and Safer Journeys: New Zealand’s Road Safety
Strategy 2010–2020. It seeks to help understanding of the government's broad policy direction for the
whole transport sector and enable stakeholders to consider this when they make their own investment
decisions.
The key themes underpinning Connecting New Zealand are economic growth and productivity, value for
money, and road safety.
In relation to walking and cycling, Connecting New Zealand notes:
The government will support groups with specific transport needs by improving the efficiency and
safety of the roading network…and supporting the development of built environments that are
walking and cycling friendly.

Page III
Investment in walking and cycling also makes a contribution to economic growth and productivity.
To maximise these benefits, the government will direct funding to reduce congestion and/or
improve pedestrian and cyclist safety. Investment is being concentrated on fewer, more targeted
activities, for example in model communities, rather than spreading the funding across a greater
number of activities with a lower overall level of return.
Good progress has already been made in New Zealand’s first two model communities — Hastings
and New Plymouth. The planned walking and cycling infrastructure for these two communities is
expected to be completed over the course of Connecting New Zealand. The government will also
develop further model community initiatives as funding allows.
These targeted investments will encourage more people to walk and cycle more often, and more
safely. They will also help to offer people more transport choices — an important consideration
during times of high fuel prices.
Government Policy Statement on Land Transport 2015/16-2024/25
The Government Policy Statement on Land Transport 2015/16-2024/25 (GPS 2015) lists an objective of ‘A
land transport system that provides appropriate transport choices’ and a result of ‘Increased safe cycling
through improvement of cycle networks’ (p.16). It further states:
GPS 2015 will support this result through:
a. Increased investment in cycle networks:
Additional investment is needed in safe cycle facilities in urban areas. GPS 2015 will enable:
extension of the dedicated cycle networks in the main urban areas
improved suburban routes for cyclists.
Economic Evaluation Manual
The Transport Agency's Economic Evaluation Manual (EEM) is the industry's standard for the economic
evaluation of transport activities and is used by approved organisations for economic evaluation and the
preparation of funding applications to the Transport Agency. The EEM sets out procedures and values to
be used for calculating benefits and preparing applications for investment from the Transport Agency in
line with the Transport Agency’s investment policy and assessment frameworks.
Safer Journeys strategy 2010-2020
The Ministry of Transport’s Safer Journeys strategy 2010-2020 states that:
By 2020 we will have a safe road environment that encourages more people to walk and cycle,
where vehicles travel at safe speeds and there is a culture of sharing the road. We will aim to
achieve a significant reduction in the number of pedestrians and cyclists killed and seriously injured
while at the same time encouraging people to use these modes through safer roading
infrastructure. (p.38)
Walking and cycling model communities
In 2009 the Transport Agency set in motion the process to invest in one or two walking and cycling model
communities. New Plymouth and Hastings were selected and programmes were developed in these
communities to encourage and enable people to leave their cars behind and try active transport. Shared
pathways, cycle lanes and pedestrian facilities around both cities were completed.
New Zealand Cycle Trails initiative
The New Zealand Cycle Trails initiative has developed 23 ‘Great Rides’ around the country and is
establishing a network of connections between them. The Government allocated $50 million in 2009 to
implement these trails and allocated a further $1 million in 2014 to maintain and enhance them.
Cycling Safety Panel report
In 2014, the Transport Agency convened the Cycling Safety Panel in response to the findings of a coronial
review of cycling safety in New Zealand, released in November 2013 by Coroner Gordon Matenga. The
panel developed a comprehensive report, Safer Journeys for people who cycle (2014), and set of
recommendations for how central and local government can ensure that on-road cycling is provided for as
a safe transport option.
Page III
Cycling and Walking Activity Class in the National Land Transport Programme (NTLP)
The 2010-15 Walking and Cycling Activity Class in the NTLP in relation to cycling facilities provides for the
construction/implementation of new or improved cycle facilities, and shared pedestrian and cycle paths.
The construction of on road interventions required to improve the safety and amenity value of cycling, for
example a wider carriageway, vehicle parking configurations, pinch points or kerb structure is eligible for
funding assistance.
Road Safety Promotion Activity Class in the NTLP
This activity class promotes the safe use of the land transport network through education, advertising,
raising awareness and public information activities.
Urban Cycleways Programme
In 2014, to address under-delivery of cycling projects, Cabinet agreed to appropriate $100 million over 4
years to an urban cycleway programme between 2014/15 and 2017/18. The criteria for projects to be
funded is that they must be part of a primary corridor within a cycling strategic network in a main urban
area, for the purposes of cycling to key destinations such as to workplaces, school, and/or shops, and
priority will be given to investment that:
accelerates, completes or significantly develops primary cycling corridors
leverages local share contribution towards completing cycling strategic networks
is on corridors that have medium to high benefit cost ratios
will substantially complete projects or corridors within 4 years
considers agreed actions following the government’s decisions on the Cycling Safety Panel’s
recommendations.


