National Council on Strength & Fitness April 12, 2018
2
BACKGROUND
The National Council on Strength and Fitness (NCSF) is a professional, member-driven,
education and credentialing organization for personal trainers and exercise science
professionals. The NCSF is committed to serving the public through research, service,
and advancement of the certified strength coach profession.
The NCSF sponsors the Certified Personal Trainer examination. The purpose of this
report is to document the test and item analysis performed by Prometric Test
Development Solutions in an effort to evaluate the psychometric quality of the
examination for the year 2017.
COMPREHENSIVE TEST DEVELOPMENT
In cooperation with Prometric Test Development Solutions, the NCSFBC develops and
administers a legally defensible, psychometrically sound examination. The processes and
procedures used to develop and maintain these exams are summarized in the table below.
Test
Des
ign
Job Analysis Define the tasks, knowledge, and skill important for performing the
specified role
Test
Specifications
Subject matter experts (SMEs) review the importance and determine
how many items should be written to each objective
Test Definition Defines the purpose, scope, target population, general topics, duration,
number of forms, number of items and types of items
Item
Dev
elo
pm
ent
Item Writing Provide training on item writing to meet the test specifications and
amounts listed in the blueprint
Technical Item
Reviews Review items for language and technical accuracy
Psy
cho
met
rics
Item Analysis Compute statistics that measure item performance
Item Selection Assign items for inclusion on final forms, discarding or rewriting
Form Assembly Distribute items across forms so that each form meets the specifications
of the blueprint plan and remain equally difficult
Beta Test Evaluate items and examinations before scored use
Standard
Setting Set the cut score
In-s
ervi
ce
Maintain
Exams
Conduct ongoing analysis of item and test statistics and revise test
periodically
NCSF Annual Report
National Council on Strength & Fitness April 12, 2018
3
TEST DESIGN: CONDUCTING A JOB ANALYSIS STUDY TO DETERMINE TEST SPECIFICATIONS
NCSFBC test design process starts by conducting a job analysis. Job analysis process is
designed to determine the tasks performed on a job as well as the critical knowledge
and/or skills needed to adequately perform those tasks. For purposes of developing
NCSFBC examinations, the job analysis identified important tasks and knowledge
necessary for competent performance as a personal trainer. Job analysis is also a highly
appropriate and useful method for gathering information to inform continuing education
and professional development efforts.
ITEM DEVELOPMENT: VALID PROCESSES FOR DEVELOPING TEST ITEMS
The NCSFBC and Prometric work together to write relevant examination items and
construct valid test forms according to the approved test specifications. Prometric test
developers assists NCSF subject-matter experts in writing and reviewing exam items to
achieve the following outcomes:
• The option indicated as the item key has been correctly identified.
• The language of each item is clear and unambiguous.
• The item is appropriately classified in terms of the test plan or blueprint; and valid
references have been provided.
• Items are appropriately difficult and not encumbered with irrelevant sources of
difficulty (such as inappropriately complex sentence construction or difficult
vocabulary).
• Items are free from content inaccuracies.
• Language, symbols, words, phrases, or examples that can be regarded as sexist,
racist, or otherwise potentially offensive, inappropriate, or negative toward any
group is identified and removed. Additionally, each item is reviewed for possible
bias in language or social context.
PSYCHOMETRICALLY SOUND TEST CONSTRUCTION PROCESSES FOR VALID EXAMS
NCSFBC approved examination items are assembled into multiple test forms in
accordance with the pre-determined test specifications, ensuring that the appropriate
number of items from each knowledge, skill or ability area is incorporated in to each
form. As one or more test forms are assembled, pretest and operational test item data is
used to anticipate the statistical characteristics of each form. This data is used to verify
adequate test functioning and test form comparability. Test analysis assures that test
forms exhibit expected pass rates, adequate reliability and pass/fail decision consistency,
NCSF Annual Report
National Council on Strength & Fitness April 12, 2018
4
tolerable measurement error, expected item response consistencies and interrelationships
between test parts, adequate response times and comparability between forms. These
attributes are critical to valid interpretation and use of test scores.
ITEM ANALYSIS FOR EXAM MAINTENANCE
A key contributor to examination validity is regular analysis of exam-level and item-level
statistics. Prometric’s staff of expert psychometricians analyze NCSFBC examination
items and produce detailed item analysis reports for test review and development
meetings. There are four main objectives of classical item analysis:
1. Confirm that each item has an expected and appropriate level of difficulty.
2. Determine the degree to which performance on each item is an indicator of
performance on the overall test (discrimination).
3. Determine if candidates are selecting or constructing an answer to the item in a
way that is consistent with a well-formed test item.
4. Establish item parameter estimates for assigning items appropriately to test
forms.
Item analysis generates statistics that assess item and exam performance against the
above objectives. These statistics allow our analysts to observe item-level and exam-level
characteristics, such as:
• The proportion of candidates answering each question correctly.
• The correlation between the question score (correct or incorrect) and the total
test score.
• The correlation between distracters and the total test score.
• The average score for the total test and each of its subsections.
• The pass ratio for each test.
• The reliability of each test.
STANDARD SETTING PROCESS TO DETERMINE A PASSING SCORE FOR EACH EXAM
The NCSFBC establishes and validates an appropriate minimum passing score for each
examination using the Modified Angoff and Beuk Relative-Absolute Compromise
methodologies for standard setting. It is extremely important to set the cut score
appropriately for each examination. If the cut score is set too high, qualified people will
fail the examination. If the cut score is set too low, unqualified candidates will pass. The
cut score is a policy judgment, but it must be defensible because of the societal and
personal consequences that flow from it. The NCSFBC ensures that the established cut
score is reasonable and is based on qualified judgment and empirical evidence.
NCSF Annual Report
National Council on Strength & Fitness April 12, 2018
5
THE CERTIFIED PERSONAL TRAINER EXAM
The Certified Personal Trainer exam is a computer based test. The candidates need to
complete the examination within 180 minutes. Two forms (Form I and Form J) were in
the field in 2017. Each form consisted of 150 multiple-choice items, including 125
operational, scored items and 25 pretest, unscored items. The cut score to pass the
examination is 72 on form I and 73 on form J (i.e., 58% of operational items with normal
rounding on Form I and 58% of operational items rounded down on Form J).
TEST FORM ANALYSIS
Table 1 provides the summary statistics of the NCSF examination for each form. The
table includes the total number of candidates, pass rates for forms, the number of scored
(operational) items in the examination, the score range (i.e., minimum and maximum
total raw score), the median score, the mean score, the standard deviation of scores, and
the skewness and kurtosis of the score distribution. The overall proportion of candidates
passing the NCSF CPT examination (on both forms combined) in 2017 was 0.7986 or
79.86% given the cut scores.
The skewness indicates the degree of asymmetry in the distribution of scores. A positive
value indicates that the tail of the distribution stretches toward higher scores; a negative
value indicates that the tail extends toward the lower scores. The kurtosis indicates the
degree of peakedness in a distribution of scores. The Pearson Kurtosis of a normal
distribution is 3.0. As Figure 1 and Figure 2 also show, the score distribution of the
NCSF CPT examination forms are close to normal ( skewness values of form I and J
respectively are -0.60 and -0.42), and are also close to normal with respect to kurtosis
(2.53 and 2.25).
NCSF Annual Report
National Council on Strength & Fitness April 12, 2018
6
Table 1: NCSF CPT Exam Summary Test Statistics, January 1, 2017 — December
31, 2017
Form I Form J
Number of candidates 1246 1222
Proportion passing 0.827 0.770
# of operational Items 125 125
Maximum score 124 123
Median score 94 92
Minimum score 33 33
Mean score 90.93 87.76
Standard Deviation of scores 18.32 19.78
Skewness -0.60 -0.42
Kurtosis 2.53 2.25
Summary Item Statistics
Mean Item Difficulty (P+) 0.73 0.71
St. Dev. of Item Difficulty 0.14 0.13
Mean Item Discrimination (Biserial) 0.50 0.50
St. Dev. of Item Discrimination 0.16 0.14
Table 1 also includes the mean and the standard deviation for the item difficulty index
(P+) and item discrimination (point-biserial correlation and biserial) for each form. The
difficulty index indicates the proportion of candidates that answered the item correctly.
The mean P+ is the average of the proportions of candidates answering the items
correctly averaged across all items included in the score. The standard deviation P+ is
the standard measure of dispersion of P+ values around the mean P+.
The point-biserial correlation is the Pearson Product-Moment correlation. It correlates
how candidates score on individual dichotomously-scored (correct or incorrect) items
with how they score on the exam overall, so it is called an item-total correlation and is an
indication of how well individual items discriminate between higher ability and lower
ability candidates. A high positive point-biserial correlation suggests that candidates who
performed well on the item also performed well overall, while candidates who did not
perform well on the item did not perform well overall. The mean point-biserial
correlation is the average of the item-total correlations averaged across all items included
in the score. Biserial correlation is another kind of item-total correlation that is used with
a dichotomized variable (correct vs. incorrect item scores) and a continuous variable
(total scores). It assumes the continuous variable is normally distributed, tends to be
systematically larger than the point-biserial correlation, and differs from the point-biserial
correlation more at the extremes of the distribution. The standard deviation of a biserial
correlation is the standard measure of dispersion of biserial correlations around the mean
biserial correlation.
NCSF Annual Report
National Council on Strength & Fitness April 12, 2018
7
Figure 1: NCSF CPT Exam Form I Score Frequency Distribution 2017
Cases 1246
Items 125
Maximum 124.00
Median 94.00
Minimum 33.00
Mean 90.93
SD 18.32
Skew -0.60
Kurtosis 2.53
Alpha 0.941
SEM 4.46
Passing 0.827
Figure 2: NCSF CPT Exam Form J Score Frequency Distribution 2017
Max. Freq. 30
Cases 1222
Items 125
Maximum 123.00
Median 92.00
Minimum 33.00
Mean 88.76
SD 19.78
Skew -0.42
Kurtosis 2.25
Alpha 0.947
SEM 4.55
Passing 0.770
Fre
quen
cy
Cond
itio
nal
SE
M
Score
0
5
10
15
20
25
30
0.0
1.0
2.0
3.0
4.0
5.0
30 40 50 60 70 80 90 100 110 120 130
CSEM@Cut = 5.27
Fre
quen
cy
Cond
itio
nal
SE
M
Score
0
5
10
15
20
25
30
35
40
0.0
1.0
2.0
3.0
4.0
5.0
30 40 50 60 70 80 90 100 110 120 130
CSEM@Cut = 5.24
NCSF Annual Report
National Council on Strength & Fitness April 12, 2018
8
RELIABILITY AND DECISION CONSISTENCY STATISTICS
Internal consistency reliability estimates were computed using Cronbach’s coefficient alpha (Cronbach, 1951) among each of the scales in the test, given by:
where n is the number of items, is the sum of the item variances, and is the variance
of score X. Cronbach’s alpha is a generalization of the KR20 when data are dichotomous.
The SEM is an estimate of the standard deviation of the distribution of observed scores around the true score. The SEM can be interpreted as an index of expected variation occurring if the same examinee was tested repeatedly on different forms of the same test without benefiting from practice or being hampered by fatigue.
The SEM of a raw score is computed from the reliability estimate (ax ) and the standard
deviation (SDx ) of the scores by the formula:
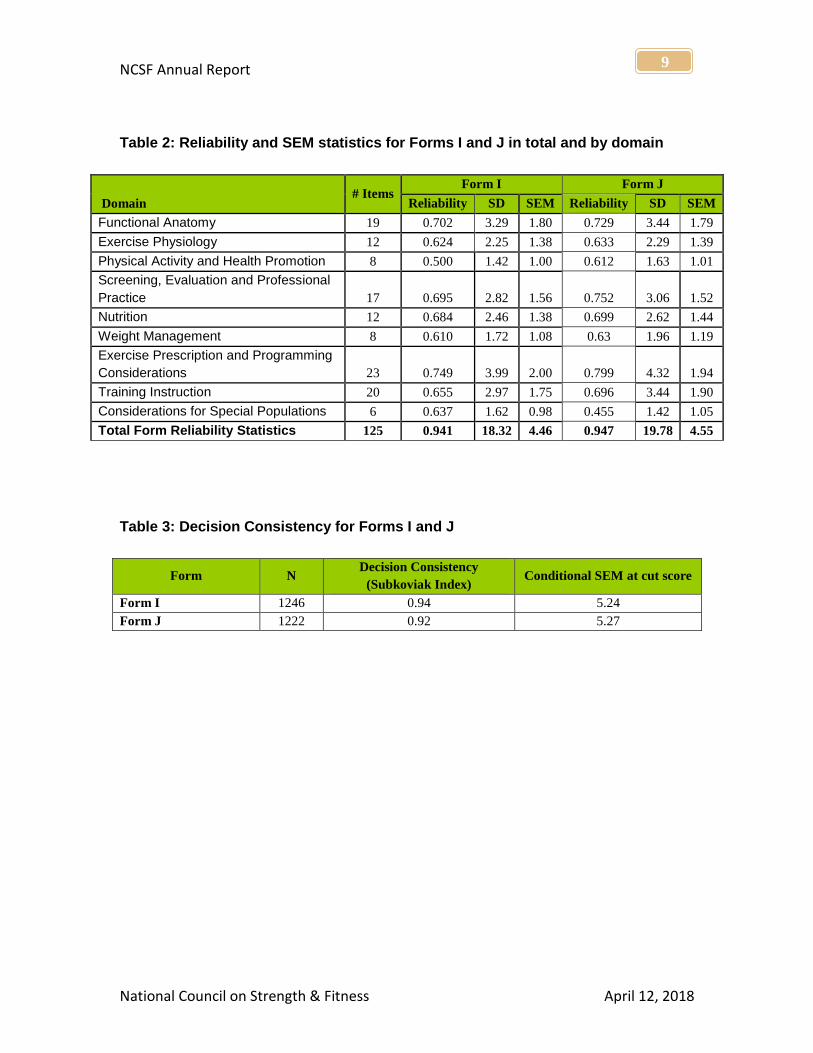
Table 2 below presents the internal consistency reliability estimate (KR-20) and the
associated standard error of measurement for the total Forms I & J and for each domain
in each of the two forms and for the total.
Table 3 below reports the Decision consistency. Decision consistency measures the extent to which classifications based on test scores match the decisions based on scores from a second, parallel form of the same test. The single decision consistency estimates using formula presented by Subkoviak (1976) and the conditional SEM (CSEM) at the cut score are reviewed.
Decision consistency estimates were computed using the Subkoviak statistic. The Subkoviak statistic provides an estimate of the decision consistency of a pass/fail decision. Using the passing score selected, it estimates the probability that an individual would receive the same decision on two separate administrations of the test. The Subkoviak C statistic uses KR-20 (Alpha) as a reliability estimate and assumes that scores are characterized by the compound binomial distribution. The Subkoviak C is estimated as suggested by Lord and Novick (1968, p. 525).
NCSF Annual Report
National Council on Strength & Fitness April 12, 2018
9
Table 2: Reliability and SEM statistics for Forms I and J in total and by domain