27
National Data Buoy Center National Data Buoy Center Presented to the QARTOD III Workshop November 2, 2005 Wave Data Quality Control Chung-Chu Teng
| Date post: | 19-Dec-2015 |
| Category: |
Documents |
| View: | 214 times |
| Download: | 0 times |
Nat
iona
l Dat
a B
uoy
Cen
ter
National Data Buoy Center
Presented to the
QARTOD III Workshop
November 2, 2005
Wave Data Quality Control
Chung-Chu Teng
Nat
iona
l Dat
a B
uoy
Cen
ter
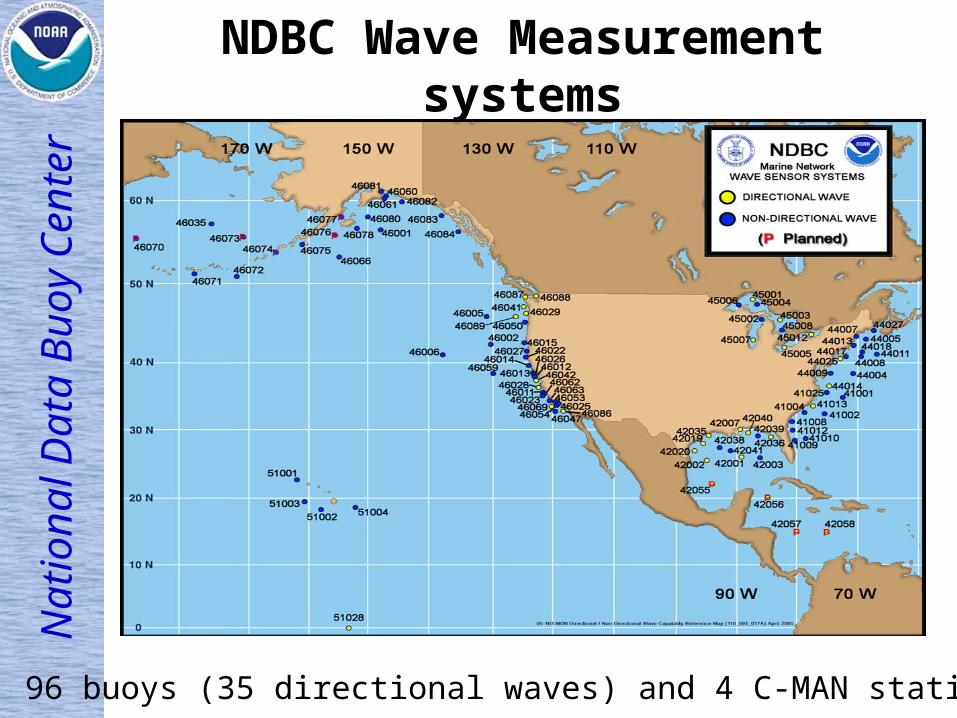
NDBC Wave Measurement systems
96 buoys (35 directional waves) and 4 C-MAN stations
Nat
iona
l Dat
a B
uoy
Cen
ter
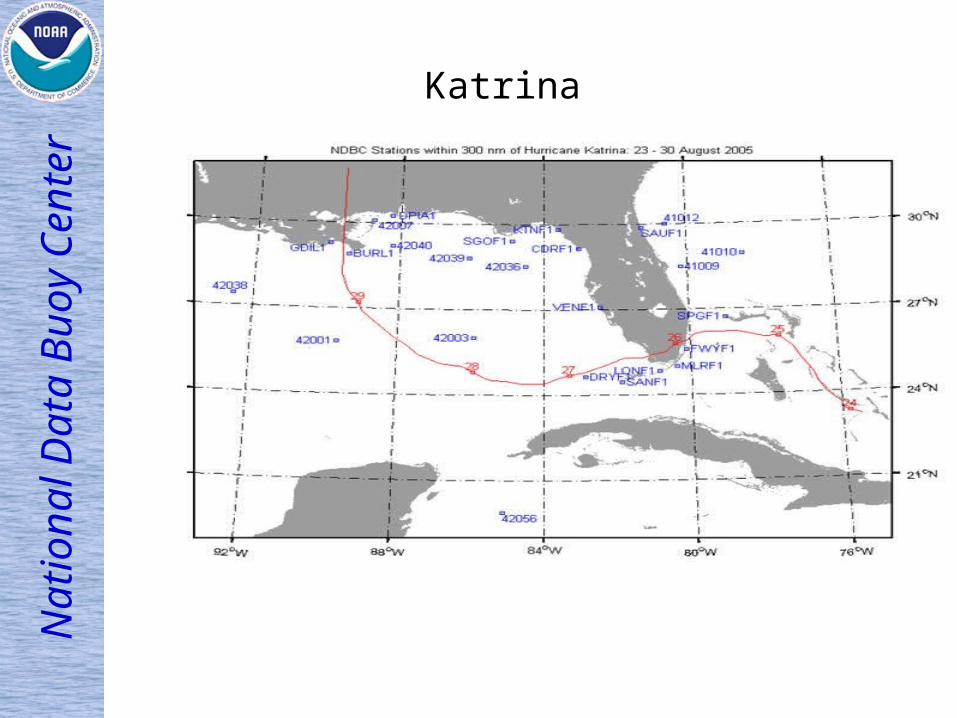
Katrina
Nat
iona
l Dat
a B
uoy
Cen
ter
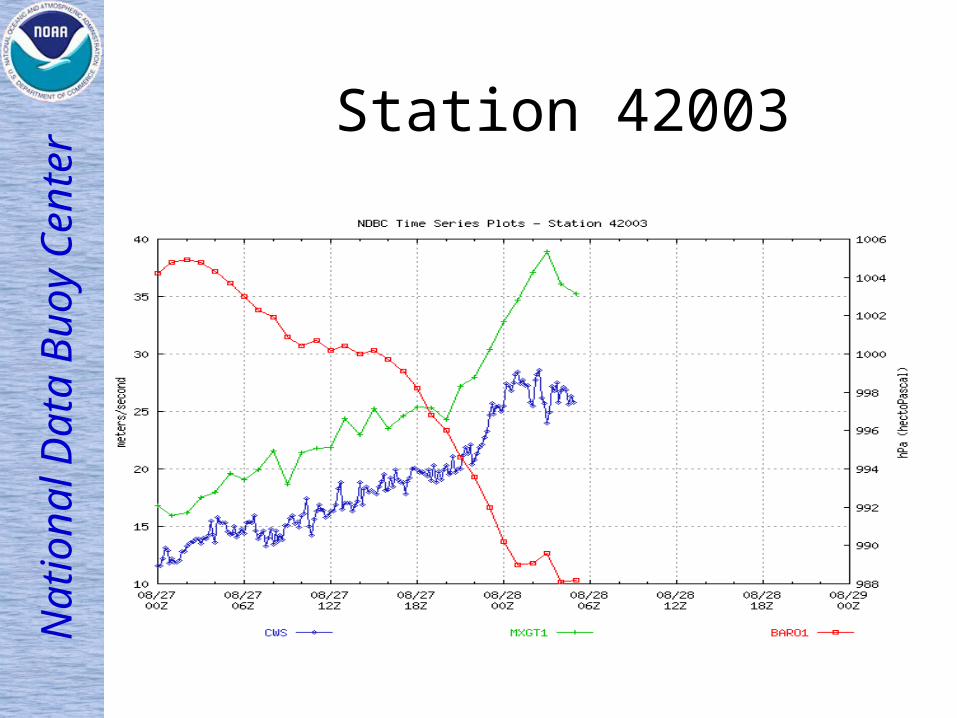
Station 42003

Nat
iona
l Dat
a B
uoy
Cen
ter Station 42003

Nat
iona
l Dat
a B
uoy
Cen
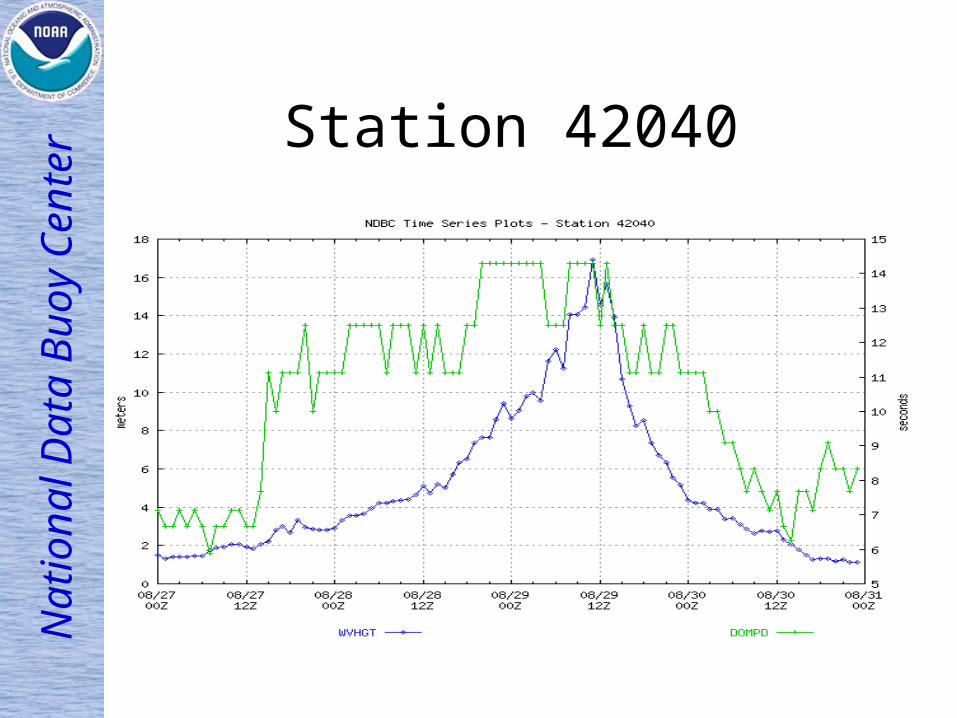
ter Station 42040
Nat
iona
l Dat
a B
uoy
Cen
ter Station 42040

Nat
iona
l Dat
a B
uoy
Cen
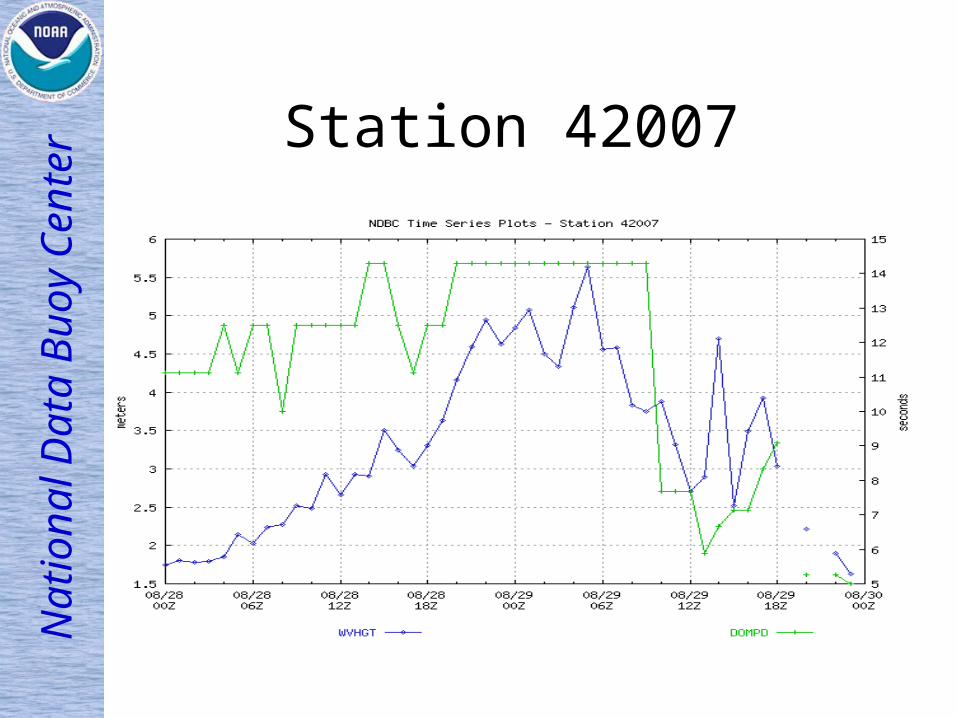
ter Station 42007
Nat
iona
l Dat
a B
uoy
Cen
ter Station 42007

Nat
iona
l Dat
a B
uoy
Cen
ter
• Sensor Evaluations
• Individual Sensor Calibrations
• Payload Testing
• System Lab Testing
• Blue-tag System Testing
• Burn-In
• Data Evaluation at deployment
Data Quality Control:The Last Line of Defense, after…
Nat
iona
l Dat
a B
uoy
Cen
ter
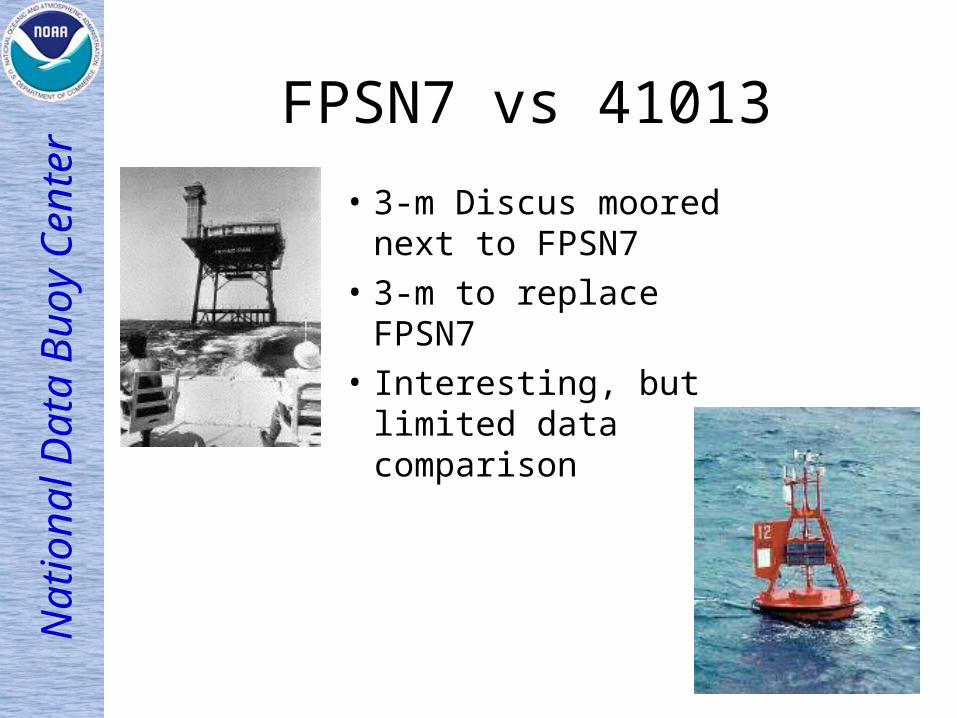
FPSN7 vs 41013
• 3-m Discus moored next to FPSN7
• 3-m to replace FPSN7
• Interesting, but limited data comparison
Nat
iona
l Dat
a B
uoy
Cen
ter
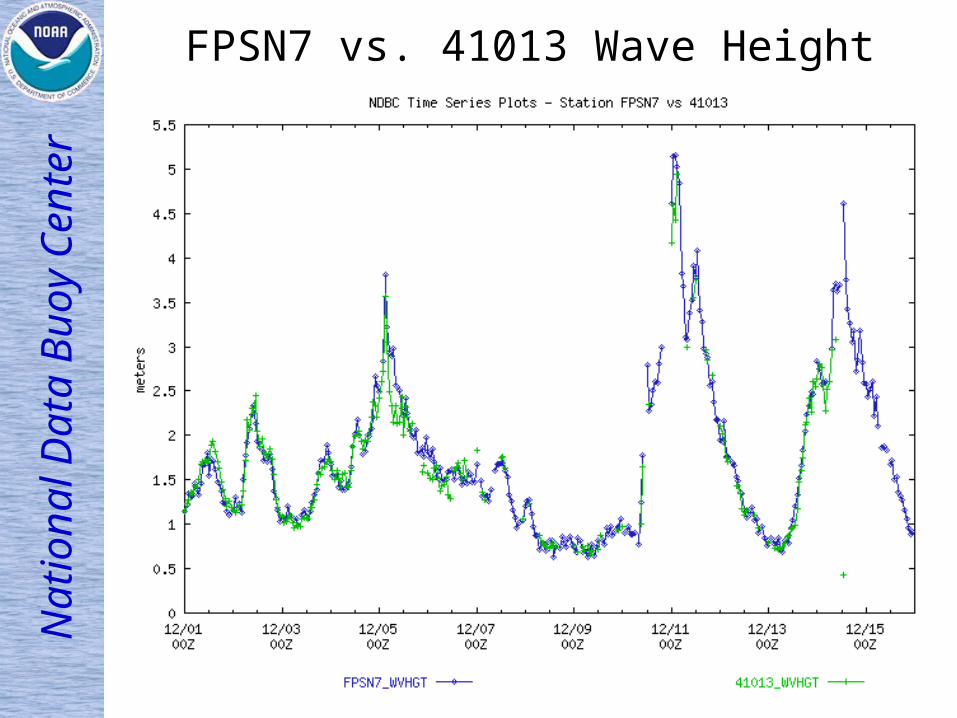
FPSN7 vs. 41013 Wave Height
Nat
iona
l Dat
a B
uoy
Cen
ter
• Performed On:– NDBC and Regional Observatory Data
• Consists Of:– Automated Real-Time Checks
– Man-Machine Mix
• Outputs:– Withhold, adjust real-time data
• NOTICE: Users don’t see flags
– Archive Data Set
Data Quality Control
Nat
iona
l Dat
a B
uoy
Cen
ter Quality Control Process Flow
• Real-Time:– Message Integrity – Automated Hard-Flag– Automated Soft-Flag
• Post-Release, Pre-Archive: Data Analyst

Nat
iona
l Dat
a B
uoy
Cen
ter Quality Control of Wave Data
• No QC Done Onboard the Buoy• Handbook of Automated Quality Control Checks and Procedures of
the National Data Buoy Center
http://www.ndbc.noaa.gov/handbook.pdf• Automated QC Done in Real-Time at NWSTG• Hard-flags:
– Stop the Release and Archive of Data unless Analyst Overrides.• Override in advance – Storm Limits• Remove before archive
– Hierarchical: Order of Precedence, Fail One and Stop
• Soft-flags: Warning

Nat
iona
l Dat
a B
uoy
Cen
ter
Hard-Flagsby hierarchy - highest to lowest:
• T Transmission parity error• M Missing sensor data• W wave message is short, checksum or parity errors.• E Calculation limits are exceeded or are in error • D Delete measurement• S Invalid statistical parameter• V Failed time continuity. • L Failed range limits. • R Related measurement has failed a hard QC check.
Nat
iona
l Dat
a B
uoy
Cen
ter Time Continuity Check
• Dependent on time since last valid observation.
• Max. allowed value = 0.58*Std.dev.*SQRT(TimeDiff)
• Std. dev. Chosen 50% higher climatic standard dev. within a month
• Only Applied to Wave Height
Nat
iona
l Dat
a B
uoy
Cen
ter
If data fails time continuity,it may still be released if:
• Wave Height: Current wind speed > 15 m/s
• Storm Limits: Allows Release of Failed Time Continuity with Approach of a Hurricane, or Storm of the Century
Nat
iona
l Dat
a B
uoy
Cen
ter
The tie between range and time continuity checks
• If WVHGT fails for two consecutive hours, no measurements will be sent until analyst reviews (D-flag)
• Measurements should still be sent if it fails a range check, unless it failed a time continuity check the previous hour.

Nat
iona
l Dat
a B
uoy
Cen
ter Soft-flags for Waves
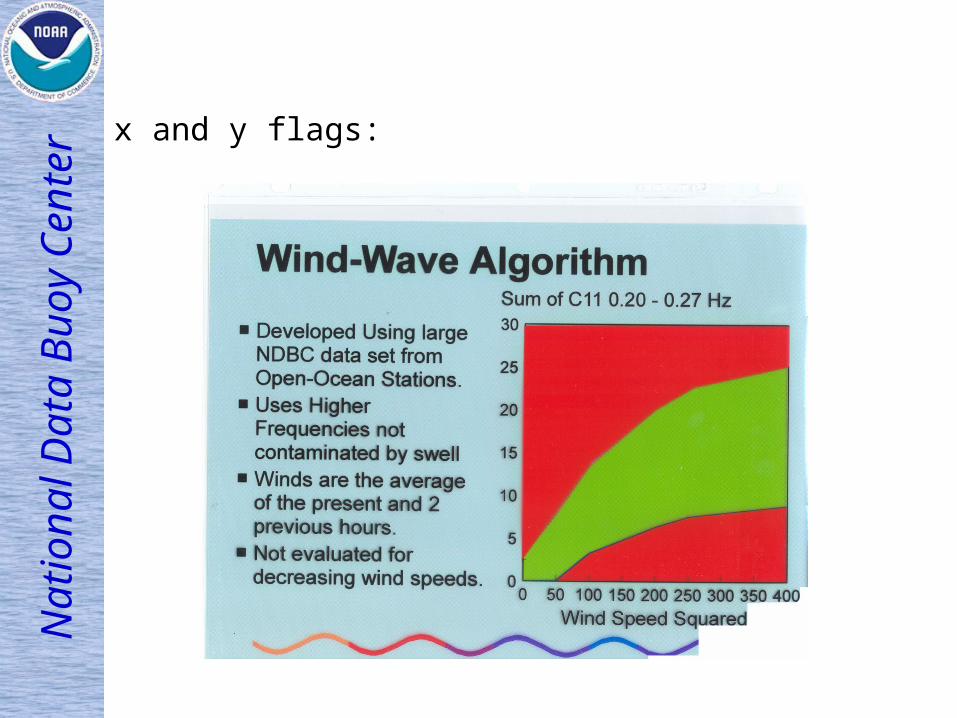
• a: Measurement is above monthly, regional limit.• b: Measurement is below monthly, regional limit.• c: Measurement has been adjusted, or corrected. • f: Measurement failed hourly time continuity. • m: High frequency spikes detected in the wave spectrum.• p: Failed wave height to wave period comparison test.• q: Swell direction is from an improbable direction. • w: Failed wind direction verses wave direction check.• x: Wind wave energy is too high for prevailing wind
speed.• y: Wind wave energy is too low for prevailing wind speed.
Nat
iona
l Dat
a B
uoy
Cen
ter
x and y flags:
Nat
iona
l Dat
a B
uoy
Cen
ter Post-Release Analysis
• Wind vs Wave Energy Scatterplots
• Ad-hoc Comparisons with NCEP WWIII
• Check-Ratio at 0.1, 02., and 03. Hz

Nat
iona
l Dat
a B
uoy
Cen
ter Wind-Wave Scatterplot
Nat
iona
l Dat
a B
uoy
Cen
ter Time Series
• Mean Acceleration or Displacement within Limits (L-flag) and Not Outside of Max/Min (S-flag)
Nat
iona
l Dat
a B
uoy
Cen
ter
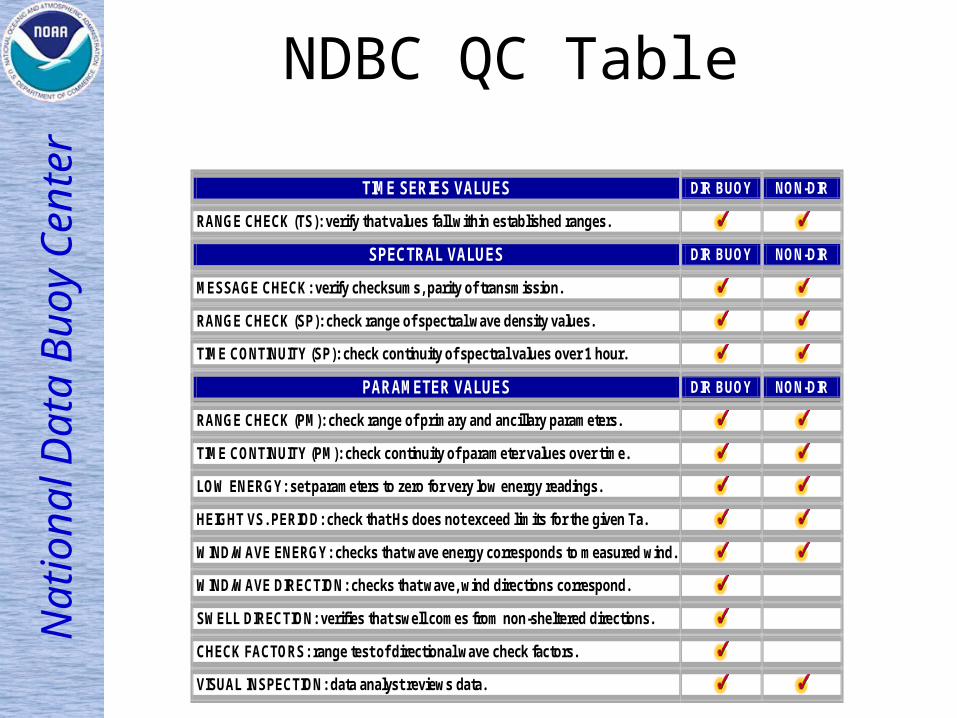
NDBC QC Table
TIME SERIES VALUES DIR BUOY NON-DIR
RANGE CHECK (TS): verify that values fall within established ranges.
SPECTRAL VALUES DIR BUOY NON-DIR
MESSAGE CHECK: verify checksums, parity of transmission.
RANGE CHECK (SP): check range of spectral wave density values.
TIME CONTINUITY (SP): check continuity of spectral values over 1 hour.
PARAMETER VALUES DIR BUOY NON-DIR
RANGE CHECK (PM): check range of primary and ancillary parameters.
TIME CONTINUITY (PM): check continuity of parameter values over time.
LOW ENERGY: set parameters to zero for very low energy readings.
HEIGHT VS. PERIOD: check that Hs does not exceed limits for the given Ta.
WIND/WAVE ENERGY: checks that wave energy corresponds to measured wind.
WIND/WAVE DIRECTION: checks that wave, wind directions correspond.
SWELL DIRECTION: verifies that swell comes from non-sheltered directions.
CHECK FACTORS: range test of directional wave check factors.
VISUAL INSPECTION: data analyst reviews data.
Nat
iona
l Dat
a B
uoy
Cen
ter
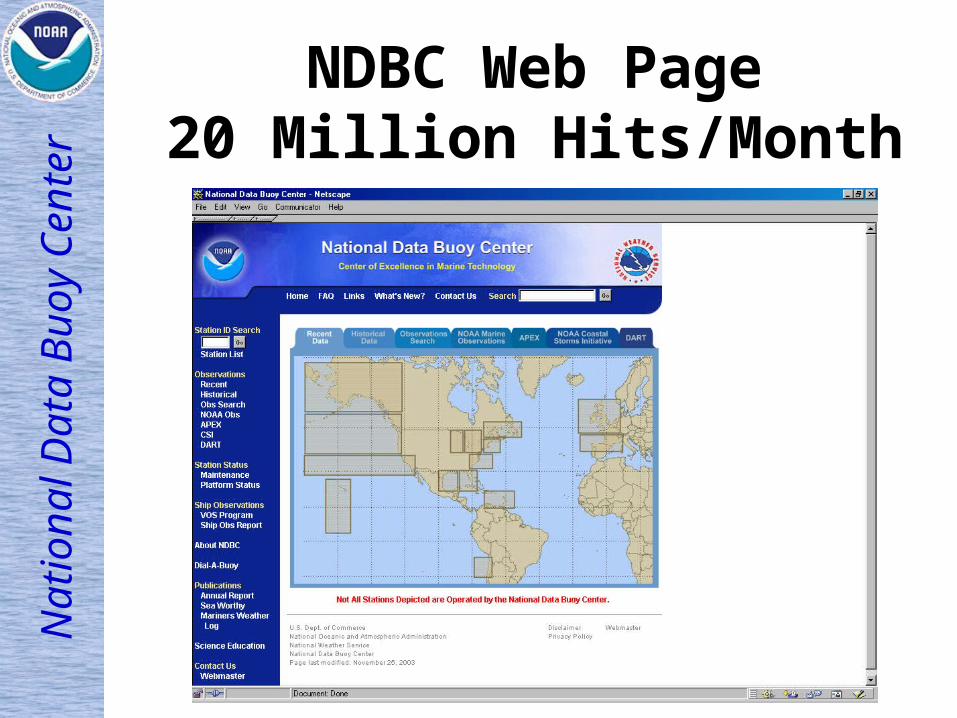
NDBC Web Page20 Million Hits/Month
Nat
iona
l Dat
a B
uoy
Cen
ter
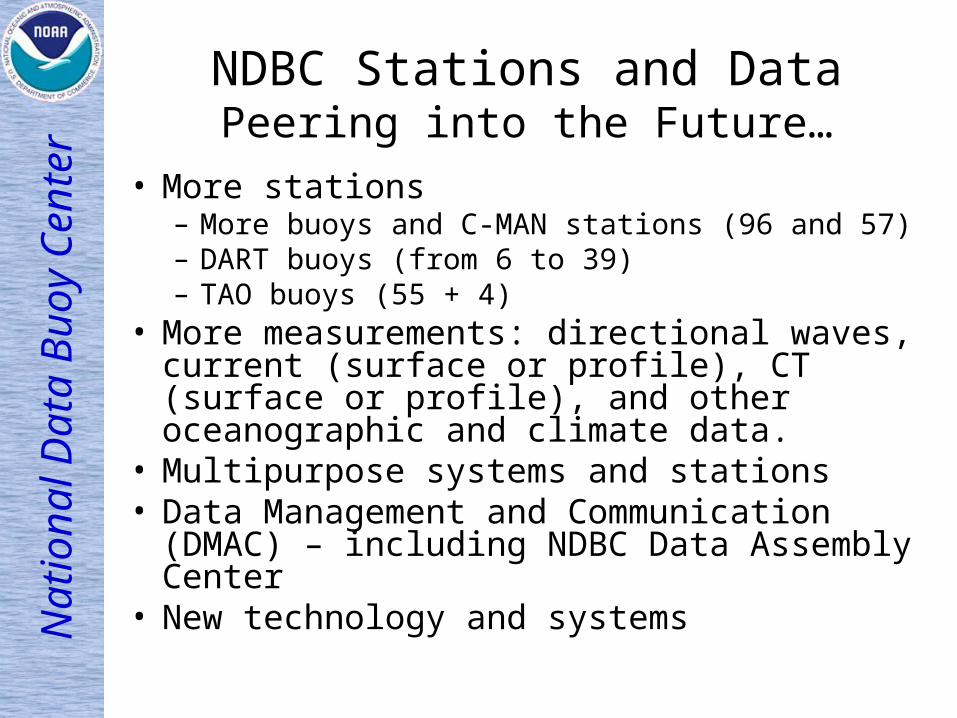
NDBC Stations and DataPeering into the Future…
• More stations– More buoys and C-MAN stations (96 and 57)– DART buoys (from 6 to 39)– TAO buoys (55 + 4)
• More measurements: directional waves, current (surface or profile), CT (surface or profile), and other oceanographic and climate data.
• Multipurpose systems and stations• Data Management and Communication (DMAC) –
including NDBC Data Assembly Center• New technology and systems


