Disclaimer The opinions, advice and information contained in this publication have not been provided at the request of any personbut are offered by Australian Pork Limited solely for informational purposes. While the information provided has beenformulated in good faith, it should not be relied on as a substitute for professional advice. Australian Pork Limited doesnot accept liability in respect of any action taken by any person in reliance on the content of this publication.
Foreword
he National Environmental Guidelines for Piggeries delivers, for the first time, a nationally agreed approach to management of pig production in Australia to achieve environmental
goals. Its release is a further example of the commitment of the pig industry to ensure that pig production in Australia is environmentally sustainable.
T
Pig producers in Australia are under increasing pressure to demonstrate that they take every practicable step to minimise the likely impact that a piggery might have on its environment. This is evident from the increasingly stringent regulatory requirements imposed on piggeries. Unfortunately, these requirements vary between states and between councils within states, and do not always take into account site-specific or management-specific features, which can markedly influence environmental risks. The development of these guidelines, incorporating the most up-to-date scientific information available and a risk assessment approach, will facilitate a consistent environmental regulatory approach throughout Australia and will streamline new development proposals, facility upgrades and compliance with licence and approval conditions. The National Guidelines provide guidance for environmental assessments for developing piggeries and options for existing piggeries to achieve positive environmental outcomes.
In addition, it is important that industry stakeholders are kept up to date with the latest research and development conducted by the industry. The National Guidelines provide a vehicle for the latest research information on piggery environmental management and APL is committed to regular updates as new information becomes available.
The industry’s achievement of its environmental goals will not be possible without the support of all relevant stakeholders. APL’s initiative of developing the National Guidelines has received considerable support from all the stakeholders, in particular, state government departments and environmental authorities, the research community and producers from all major pig-producing states. I trust that the National Guidelines will receive a similar level of adoption by all these stakeholders to help the industry achieve its environmental goals.
Paul Higgins Chairman Australian Pork Limited
iii
iv
Acknowledgments
Australian Pork Limited (APL) thanks the principal authors of these guidelines, Robyn W Tucker, Eugene J McGahan, Peter J Nicholas and Megan R Howard of FSA Consulting.
The significant contribution of Dr Jeya Jeyasingham of APL in the development of these guidelines is also acknowledged.
Comments on the various drafts of the guidelines were obtained through written feedback (particularly on the 11 August 2003 draft), a consultative meeting held in Melbourne (4 July 2003), a consultative meeting held in Sydney (2–3 October 2003) and face-to-face meetings at ‘Environmental Management Plans for Piggeries’ workshops. The time and effort that the following people invested in completing these guidelines is acknowledged:
Peter Best Katestone Environmental
Peter Binns EA Systems Pty Limited
Pat Blackall Department of Primary Industries and Fisheries, Queensland
John Boadle Department of Primary Industries, Victoria
Jock Charles Charles I.F.E Pty Limited
Ian Connaughton Castlemaine Bacon
Brett Cowan Department of Primary Industries and Fisheries, Queensland
Jeff Cummins Environment Protection Authority, Victoria
Garry Davies Department of Environment, Western Australia
Ian Farran Agribiz Engineering
Rod Hamann Australian Pork Farms Group, South Australia
Chris Harris Environment Protection Authority, South Australia
Mark Hogan QAF Meat Industries Pty Limited
Ian Jones CEFN Pty Limited
Chris Keene Western Savannahs Piggery Pty Ltd
Ian Kruger Department of Primary Industries, New South Wales
Simon Lott EA Systems Pty Limited
Danette McLean Department of Primary Industries and Fisheries, Queensland
Michael Moore Rural Solutions, South Australia
v
Jeff Morgan Mt Compass Bacon Company
Robert Nakhla Signium Pty Limited
Robin Ormerod Pacific Air & Environment
Hugh Payne Department of Agriculture, Western Australia
Tim Pollock GHD Pty Limited
Graeme Pope Rural Solutions, South Australia
Michael Power Department of Primary Industries, Water and Environment, Tasmania
Matthew Redding Department of Primary Industries and Fisheries, Queensland
Tony Richardson Producer/consultant
Shannon Rutherford Queensland Health
Bill Slattery Australian Greenhouse Office
Darryl Stewart Queensland Pork Producers Inc
Tim Streeten Department of Primary Industries and Fisheries, Queensland
Peter Thomas Department of Primary Industries, Victoria
Sally Walker Windridge Farms
Guy Watson Department of Environment, Western Australia
Simon Welchmann Department of Environment and Conservation, New South Wales
John Williamson Environment Protection Authority, Victoria
Gary Whytcross Department of Environment and Conservation, New South Wales
Brian Wild Department of Environment and Conservation, New South Wales
Bernie Wilder District Council of Grant
Dean Zeven Department of Primary Industries, Water and Environment, Tasmania
vi
Table of contents
Foreword ............................................................................................................................................ iii Acknowledgments ............................................................................................................................. v Abbreviations.................................................................................................................................. xiii Overview............................................................................................................................................ 15 1 Introduction.......................................................................................................................... 17 2 Planning principles............................................................................................................. 19 3 Environmental outcomes ................................................................................................... 23 4 Types of piggeries ............................................................................................................... 25
4.1 Pig production................................................................................................................ 25 4.2 Piggery definitions ........................................................................................................ 26 4.3 Defining piggery capacity in standard pig units....................................................... 29
5 Site selection ........................................................................................................................ 31 5.1 Planning restrictions...................................................................................................... 31 5.2 Available land area........................................................................................................ 31 5.3 Access to markets .......................................................................................................... 31 5.4 Climate ............................................................................................................................ 32 5.5 Natural resources........................................................................................................... 32
5.6 Community amenity ..................................................................................................... 35 5.6.1 Odour................................................................................................................. 35 5.6.2 Noise .................................................................................................................. 35 5.6.3 Dust and smoke................................................................................................ 35 5.6.4 Flies, rodents and other vermin ..................................................................... 35 5.6.5 Pathogens .......................................................................................................... 35 5.6.6 Visual amenity.................................................................................................. 36
5.7 Cultural heritage............................................................................................................ 36 5.8 Future expansion plans................................................................................................. 36
6 Separation and buffer distances....................................................................................... 37 6.1 Buffer distances from surface water and groundwater............................................ 37 6.2 Separation distances for community amenity ........................................................... 39
7 Cleaner production ............................................................................................................. 41 7.1 Efficient resource use .................................................................................................... 41 7.2 Waste hierarchy ............................................................................................................. 41 7.3 Minimising effluent generation ................................................................................... 42 7.4 By-product use ............................................................................................................... 42
12.2 Management of effluent treatment ponds ................................................................. 63 12.3 Other effluent treatment systems................................................................................ 64
13 Solid by-product storage and treatment areas ............................................................... 65 13.1 Storing solid by-products............................................................................................. 65 13.2 Composting spent bedding, sludge and separated solids....................................... 65
14 Areas of by-product use ..................................................................................................... 67 14.1 Methods for using effluent and solid by-products ................................................... 67
14.1.1 Selecting a suitable area for by-product use ................................................ 67 14.1.2 Land area needed for use of by-product ...................................................... 68 14.1.3 Concentration of nutrients and salts in piggery by-products.................... 68 14.1.4 Application rates.............................................................................................. 70 14.1.5 Expected nutrient removal by plant harvest................................................ 70 14.1.6 Calculating sustainable application rates..................................................... 72
14.2 Intensive outdoor rotational piggeries ....................................................................... 73 14.3 Benefits of using by-products ...................................................................................... 73 14.4 Potential impacts of poor by-product use practices ................................................. 73 14.5 Recommended by-product use practices ................................................................... 74
viii
14.6 Secondary control measures and reducing loss of nutrients................................... 75 14.6.1 Vegetative filter strips ..................................................................................... 75 14.6.2 Terminal ponds ................................................................................................ 76 14.6.3 Graded banks.................................................................................................... 76 14.6.4 Ground cover.................................................................................................... 76 14.6.5 Incorporation of solid by-products................................................................ 76
17 Monitoring and assessment of sustainability................................................................ 85 17.1 Complaints...................................................................................................................... 85
17.5.1 Community amenity impacts......................................................................... 89 17.5.2 Surface water impacts ..................................................................................... 90 17.5.3 Groundwater impacts...................................................................................... 90 17.5.4 Soils of areas of by-product use ..................................................................... 90
18 Environmental management plans .................................................................................. 97 19 Chemical storage and handling........................................................................................ 99 20 Greenhouse gases.............................................................................................................. 101 References........................................................................................................................................ 103 Appendix A National odour guidelines for piggeries .......................................................... 105
A1 Introduction.................................................................................................................. 105 A2 State legislation and guidelines ................................................................................. 105
A2.1 New South Wales........................................................................................... 105 A2.2 Queensland ..................................................................................................... 106 A2.3 Victoria ............................................................................................................ 106 A2.4 South Australia............................................................................................... 106 A2.5 Western Australia .......................................................................................... 106
Table 4.1 SPU conversion factors ............................................................................ 29 Table 6.1 Separation distances between areas of by-product use and
surface waters by reuse category............................................................ 39 Table 8.1 Summary of design considerations for piggery sheds ........................ 44 Table 8.2 Minimum space allowances for housed pigs........................................ 45 Table 8.3 Commonly used stocking densities for deep litter housing
(based on a survey of industry practice) ............................................... 46 Table 9.1 Predicted solids and nutrient output for each class of pig ................. 48 Table 9.2 Typical solid and nutrient content of clean bedding materials.......... 48 Table 11.1 Summary of performance of a range of solids separation
systems....................................................................................................... 56 Table 11.2 Capital cost classifications for different types of solids
separators................................................................................................... 57 Table 11.3 Operating cost classifications for different types of solids
separators................................................................................................... 57 Table 12.1 Suggested anaerobic pond capacities for different climates,
desludging frequencies and pre-treatment options............................. 62 Table 14.1 Characteristics of piggery pond irrigation effluent ............................. 68 Table 14.2 Characteristics of in situ piggery pond sludge..................................... 69 Table 14.3 Nutrient content of spent bedding......................................................... 69 Table 14.4 Nutrient content and anticipated dry matter yield of various
solution nitrate-nitrogen concentration of 10 mg/L at field capacity. ..................................................................................................... 91
Table 17.5 Suggested trigger levels for investigation for phosphorus in topsoil ......................................................................................................... 92
Table 17.6 Rankings for Olsen phosphorus in topsoil (mg/kg) ........................... 92 Table 17.7 Rankings for Bray phosphorus (mg/kg)............................................... 93 Table 17.8 BSES phosphorus (mg/kg) guideline levels ......................................... 93
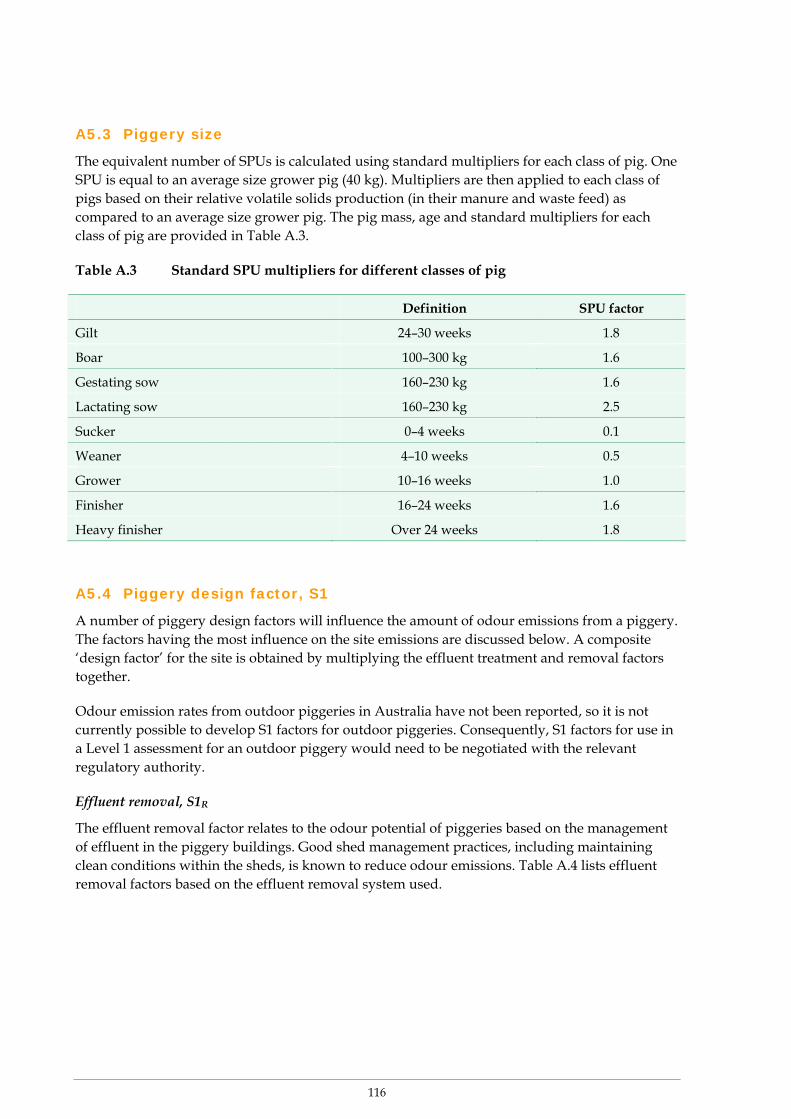
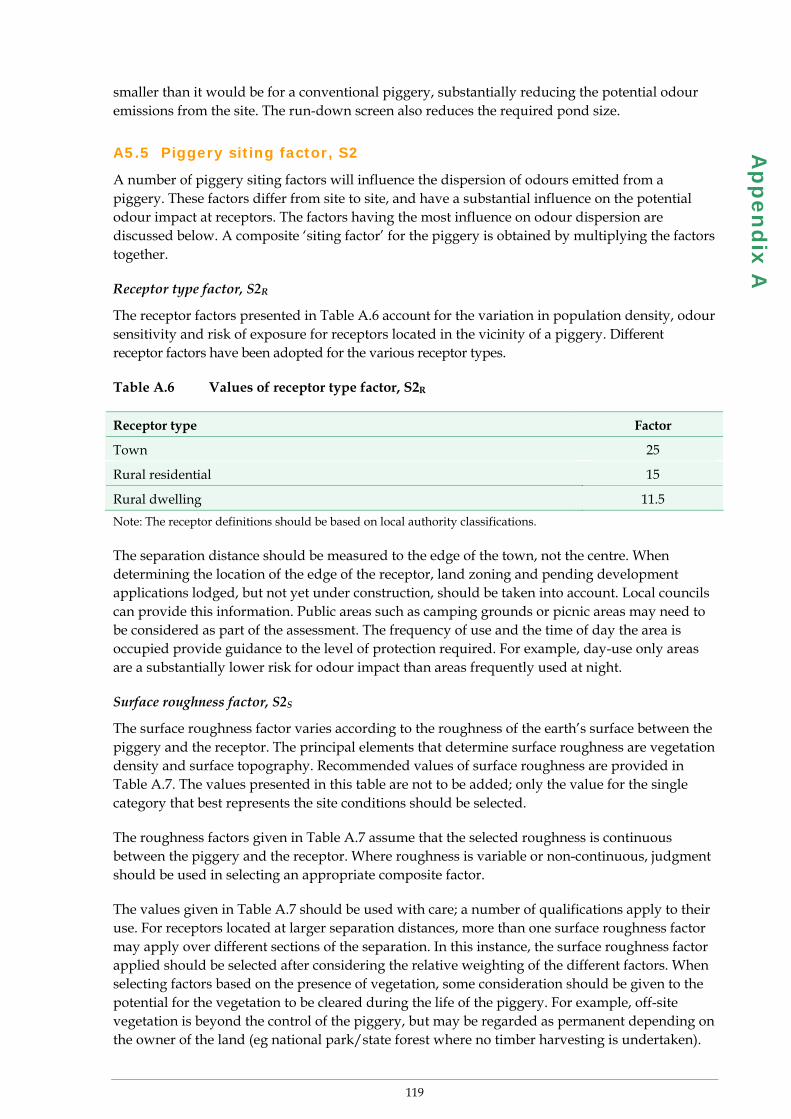
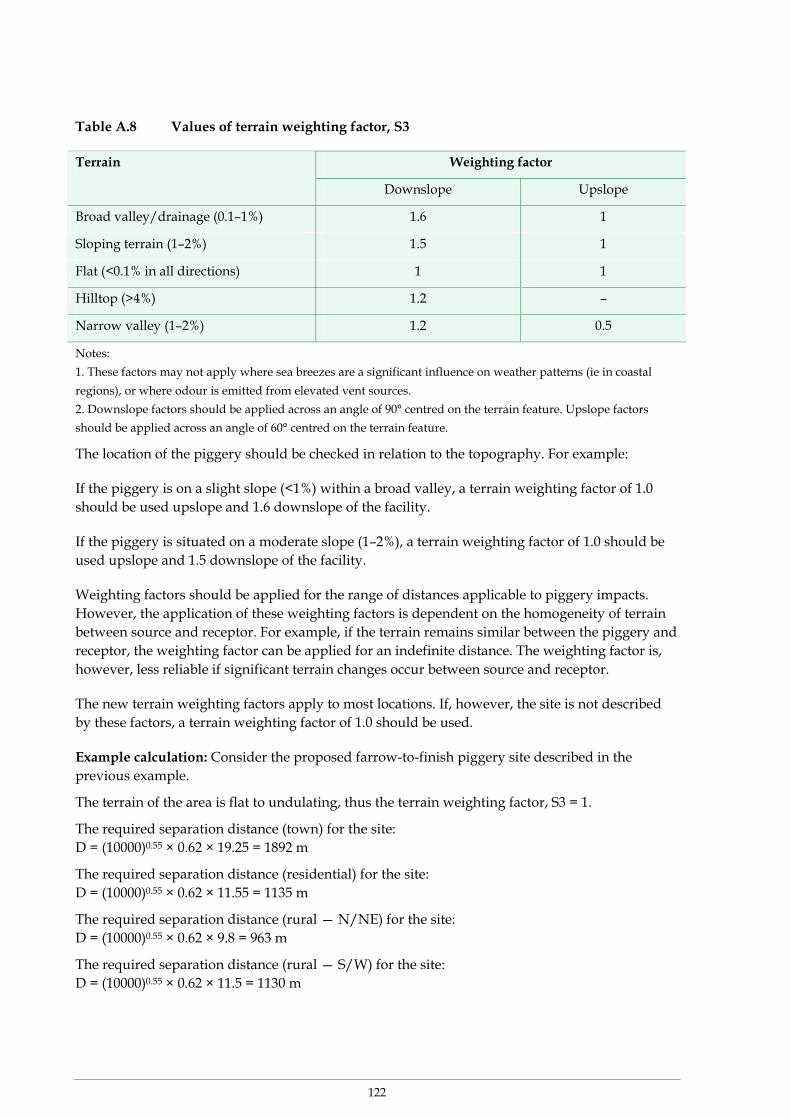
Table A.1 Impact criteria applied in these guidelines......................................... 112 Table A.2 Summary of S factors for use with Level 1 calculations ................... 115 Table A.3 Standard SPU multipliers for different classes of pig ....................... 116 Table A.4 Values of effluent removal factor, S1R ................................................. 117 Table A.5 Values of effluent treatment factor, S1T............................................... 117 Table A.6 Values of receptor type factor, S2R....................................................... 119 Table A.7 Values of surface roughness factor, S2S............................................... 120 Table A.8 Values of terrain weighting factor, S3 ................................................. 122 Table A.9 Separation distances from piggery sites to other relevant
ustralian Pork Limited has worked with industry, the community and government to develop the National Environmental Guidelines for Piggeries. They provide a general
framework for managing the environmental issues associated with piggeries and have been tailored to the circumstances and conditions most commonly encountered.
A
The document is made up of five parts:
Chapters 1–20: National Environmental Guidelines for Piggeries — provides advice on planning and managing piggeries to minimise harm to the environment
Appendix A: National Odour Guidelines for Piggeries — details methods of assessing the impact of odours
Appendix B: Environmental risk assessment — details methods for assessing the likelihood that the piggery will have an impact on the environment
Appendix C: Complaints register —shows an example of a complaints register that be can used to keep track of complaints received and corrective action taken
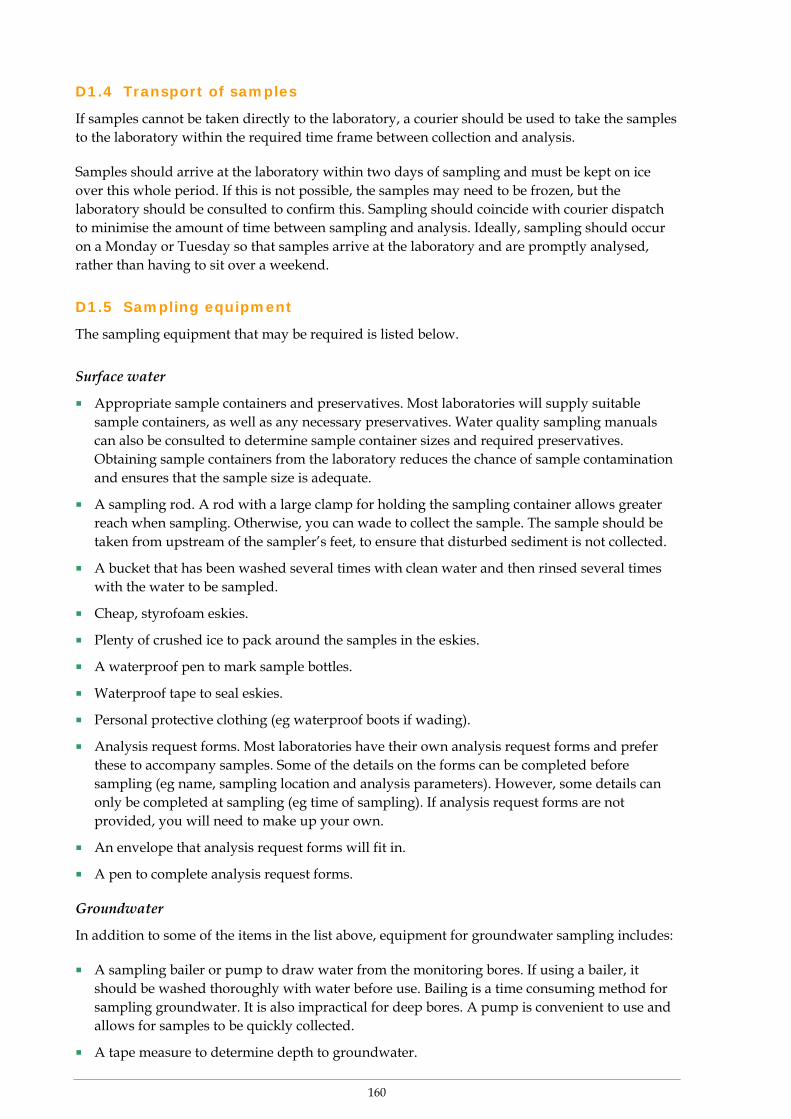
Appendix D: Sample analysis — describes methods for collecting samples (water, soil etc) for analysis
Appendix E: Useful conversions — lists conversions that may be useful in implementing these guidelines.
15
16
1 Introduction
aximising opportunities for industry growth is a strategic objective of Australian Pork Limited (APL). To assist with opportunities for growth in the pig industry, APL has
developed national environmental guidelines. This national approach will promote consistency in proposals for new developments and facility upgrades across the states and territories. It will also help producers to comply with licence and approval conditions and with current regulatory standards.
M
To that end, APL has worked with industry, the community and government to develop these National Environmental Guidelines for Piggeries. The guidelines provide advice on planning and management, including siting and design, so that people developing intensive piggeries can minimise harm to the environment. They are based on up-to-date technical information and will be updated as needed to reflect changes in science and piggery management.
The guidelines provide a general framework for managing the environmental issues associated with piggeries, and they have been tailored to the circumstances and conditions most commonly encountered. However, site-specific conditions must still be considered when applying the guidelines. Similarly, many of the factors discussed in the guidelines are interlinked, and sound management practices must be applied to the suite of considerations, not single issues in isolation, to achieve good environmental practice.
The guidelines may be used to complement, develop or update existing state piggery guidelines. However, it is important to realise that the guidelines do not fully cover all requirements in each state and territory. Each state and territory of Australia has its own legislation, codes of practice and guidelines for the development and operation of piggeries, as well as more general legislation governing water use, land clearing and other relevant issues. There are also applicable local government planning and approval regulations. Consultation with relevant state and territory government departments and local government officers will identify the specific planning requirements, legislation, codes of practice and guidelines. The user is responsible for ensuring that a proposal complies with the specific requirements of the relevant state or territory regulatory authorities.
Legislative and planning requirements over-ride industry guidelines and codes of practice, including these national guidelines. Hence, developers need to be aware that piggery developments may be assessed in a manner or scope outside that contained in these guidelines.
17
18
2 Planning principles
he first step in planning should be to identify any land use or zoning issues from local government, and the state or territory government agencies responsible for piggery licensing
and approval, water licensing, soil conservation and vegetation clearing. Consultation with the relevant agencies, ideally through a prelodgement, on-site meeting, helps determine if the site is suitable, and the major issues to be addressed in an application. These issues are listed below in a checklist.
T
The next step is to gather and compile the information. As the guidelines provide recommended siting, design and management information, they can be used to assemble the supporting information for a piggery development application. Submission of application forms and supporting information, advertising the development, and formal assessment will follow. For large or complex applications, professional assistance may be necessary.
Issues Check Applicant details
Site description (including plans) and assessment
Real property description
- Land tenure
- Land area
- Cadastral plan
Land zoning, and zoning of the surrounding land
Climatic data
- Median annual rainfall
- Average monthly rainfall
- Rainfall intensity data (1-in-20-year design storm, 1-in-20-year 24-hour storm)
- Average monthly evaporation
- Monthly maximum and minimum temperatures
- Wind speed and direction
Soil description for the piggery site (including analysis of basic physical properties) and areas of by-product use (including analysis of basic chemical and physical properties)
Description of groundwater resources and geology of the site
- Details of any bores on the subject property
- Analysis of the chemical properties of groundwater for use in piggery
- Details of any licenses held
19
Issues Check Description of surface water resources on the property or in the vicinity of the
property
- Analysis of the chemical properties of surface waters for use in the piggery
- Details of any licenses held
Description of the current vegetation of the site and the extent of any proposed clearing
Identification of any items, sites or places that may have cultural heritage significance
Description of the proposed piggery operation
Total pig or standard pig unit (SPU) numbers
- Herd composition
- Numbers and weights of incoming and outgoing stock
- Sources of stock
Description of housing and layout plans
Water requirements for drinking, cooling, cleaning and shandying with effluent, and water sources and quality
Bedding requirements and bedding sources
Feed requirements and feed sources
Staff numbers
Hygiene practices
Prediction of manure production and mass balance estimate of the nutrient content of solid and liquid by-products
Design of effluent collection, pre-treatment and treatment system, including plans
Sizing and proposed management of the areas of by-product use including location, area, method, frequency and general management of spreading / irrigation activities
Description of carcase management or disposal, including plan for mass mortalities
Calculation of traffic numbers and consideration of access and road safety. There is also a need to negotiate with state or territory and local governments regarding road upgrading and maintenance responsibilities
Environmental impact assessment
Community amenity impacts - particularly odour, dust, noise, traffic. Calculate separation distances to sensitive receptors
Surface water impacts – quality and availability for other potential users
Groundwater impacts – quality and availability for other potential users
Vegetation impacts – effects of clearing on rare and threatened species and communities
Impacts on items, sites or places of cultural heritage significance
Impacts on soils of by-product use areas
20
Issues Check Summary of design and management features to minimise adverse environmental impacts
Proposed environmental monitoring and reporting
Topographic plan
Watercourses and drainage lines
Flood lines, protected land
Location of nearby residences
Recent aerial photograph
Farm plan
Current land uses
Proposed piggery location
Proposed carcase composting or burial site
Paddocks and areas of paddocks for by-product use
Location of on-farm bores
Location of any soil conservation or drainage works
Piggery layout plan, including location of by-product treatment and storage facilities
Plan of effluent treatment ponds (if applicable)
Separation distance plan
Location of piggery and areas of by-product use
Distances to sensitive areas or receptors
21
22
3 Environmental outcomes
o operate in an ecologically sustainable manner, piggeries need to be sited, designed, constructed and managed to protect many aspects of the environment such as soil, water and
biodiversity. Preservation of community amenity and cultural heritage should also be considered.
T
By-product use should maintain or improve the productive qualities of the land used by considering soil pH, salinity and sodicity, structure and stability, erosion, nutrient levels, organic matter content, micro organisms and hydrological properties. This can be achieved by effective use of the nutrients, organic matter and water in piggery by-products.
Groundwater should be protected through good design and management of pig accommodation, by-product storage and treatment areas, carcase disposal areas and by-product use practices.
Surface waters should be protected through good design and management of the pig accommodation, by-product storage and treatment areas, carcase disposal areas, by-product use and stormwater runoff from areas of by-product use.
Local residents’ comfortable enjoyment of life and property should not be affected by the proposed piggery. The effects of piggery odour, visual impacts, dust, flies, noise and off-site transport should be considered.
Vegetation clearing and by-product use should be managed to protect flora species or communities and fauna species and habitats.
Items, sites or places of cultural heritage significance both to Aboriginal and to other people should be protected.
This document presents detailed information to achieve these environmental outcomes.
23
24
4 Types of piggeries
his section defines the different segments of pig production and piggeries, including an outline of basic differences in design. It also defines a standard pig unit (SPU). T
4.1 Pig production
Pig production can be divided into five main production stages:
breeding
gestating or dry sows
farrowing
weaning
growing/finishing.
The breeding section of a pig herd includes the boars, gilts and dry (gestating) sows awaiting either mating or confirmation of pregnancy and gestation. This section of the piggery is where all the pig mating occurs, including artificial insemination.
Generally, boars are housed individually whereas dry sows are housed in both individual stalls and group pens. Sows are often housed in stalls for the first weeks of gestation to confirm pregnancy, and so they can be individually fed and managed. They may then be moved to group pens to complete their gestation period.
The farrowing section of a piggery houses both sows due to farrow (give birth) and sows with their progeny from farrowing to weaning. Each sow and litter is generally housed in an individual pen providing:
protection from drafts
a creep area segregated from the main stall by side rails to protect the piglets from being crushed by the sow, and to provide access to creep feed by piglets only
extra heat in the creep area.
Weaners can be stressed by a change in diet from milk to solid feed, mixing with other pigs, and environmental changes, increasing their susceptibility to disease. Newly weaned pigs must be housed in a warm, dry, draft-free environment to counter these abrupt changes.
Growing and finishing pigs require less environmental controls than newly weaned pigs. They are often fed in ‘phases’, so that the diet is tailored to provide the optimal nutrition required for each growth stage.
Individual pig farms or production units can include one or more of the above pig life cycle stages but generally fall into one of the following categories:
farrow-to-finish
breeder
weaner
grower/finisher.
25
A farrow-to-finish piggery includes the breeder, weaner and grower/finisher stages. The pigs born at the site are reared until sale age (usually 22–26 weeks of age). Many farrow-to-finish piggeries operate with ‘closed herds’, where no new stock is introduced, and replacement breeding stock are selected from within the herd and/or from artificial insemination. Other farrow-to-finish piggeries import breeding stock from outside herds or use some imported stock and some of their own stock for breeding.
A breeder piggery includes breeding stock, with the progeny being removed from the piggery at or after the weaning phase.
A weaner piggery includes only weaner pigs. These are generally from three or four weeks up to eight or ten weeks of age. Most weaner pigs live in a controlled environment (mechanically ventilated) conventional shed or deep litter housing.
A grower/finisher piggery includes grower (about 10–16 weeks of age) and finisher (from about 16 weeks up to 22–26 weeks of age) pigs. They generally live in conventional sheds, deep litter housing, or in a combination of these.
Figure 4.1 summarises the most common piggery production systems.
g
Figu
4.2
In ansuppis no
In anprodnutr
In anhous
Breeding
re 4.1 Piggery production systems
Piggery definitions
extensive piggery, the animals rely primarily on foraging lementary feed, to meet more than 50% of their nutritiona
t covered by these guidelines.
intensive piggery, pigs are confined within a structure anuction, relying primarily on prepared or manufactured feitional requirements.
intensive indoor piggery, the ‘structure’ may include coning, or accommodation.
26
Weanin
Gestating Farrowing
and grazing, rathel requirements. Th
d fed for the purpedstuffs or rations
ventional housing
Growing/ finishing
e
Weaner / nursery unit
Grower / finisher unit
Sal
Breeding stock / semen (artificial insemination)
Cull breeding stock
r than on is type of system
ose of to meet their
, deep litter
Conventional housing is sheds in which the flooring is usually partly or fully slatted, or includes open channel dunging areas. For sheds with slatted flooring, spilt feed and water, urine and faeces fall through the slats into underfloor channels or pits. These are regularly flushed or drained to remove effluent from the sheds.
Deep litter housing is typically a series of hooped metal frames covered in a waterproof fabric, similar to the plastic greenhouses used in horticulture. Deep litter housing may be established on a specially prepared earth floor or a reinforced concrete slab. Variations include converted conventional sheds or skillion-roof sheds with bedding over the flooring. Pigs are bedded on straw, sawdust, rice hulls or similar loose material that absorbs manure, eliminating the need to use water for cleaning. The used bedding is generally removed and replaced when the batch of pigs is removed, or on a regular basis.
There are two types of intensive outdoor piggeries: rotational and feedlot.
In a rotational outdoor piggery, the pigs are kept in small paddocks, sometimes with huts or other basic housing. The paddocks are rotated with a pasture or cropping phase. During the stocked phase, the pigs are supplied with prepared feed, but can also forage. During the non-pig phase, the area grows pastures or crops that are harvested to remove the nutrients deposited in pig manure during the stocked phased.
Feedlot outdoor piggeries continuously accommodate pigs in permanent outdoor enclosures, sometimes with huts or other basic housing. These enclosures must be located within a controlled drainage area so that all stormwater runoff from within these areas is controlled and kept separate from stormwater runoff from areas outside the pig enclosures. The base of the enclosure must be sealed to prevent nutrients and salts from leaching into groundwaters.
A piggery complex includes:
all buildings or paddocks where pigs live
adjoining or nearby areas where pigs are yarded, tended, loaded and unloaded
adjacent areas where piggery by-products are accumulated or treated pending on-site use or transport off-site
areas where pig-feeding facilities are maintained or areas where feed is stored, handled or prepared (including feedmills).
The piggery complex itself does not include any areas of land where by-products such as effluent, pond sludge or separated solids are applied, unless it is a rotational outdoor intensive piggery. Figure 4.2 shows a piggery complex, the areas of by-product use, and the flow of by-products through both these areas.
27
Solid by-product storage or
composting area
Effluent and solids area of by-product use
On-site
Off-site
Effluent treatment
Solids separation system
Effluent collection system
Channels
Drains
Sumps
Carcase disposal
Burial
Burning
Rendering
Composting
Intensive outdoor enclosures
Conventional sheds
Pig accommodation
Carcases Carcases Carcases
Raw effluent
Separated solids
Raw effluent
Liquid effluent
Liquid effluent
Sol d bi y-products
Spent bedding
Sludge
Deep litter sheds
Figure 4.2 Piggery by-products flow diagram
28
4.3 Defining piggery capacity in standard pig units
A standard pig unit (SPU) is a unit for defining piggery capacity based on by-product output. The manure and waste feed produced by one SPU contains the amount of volatile solids (VS) typically produced by an average size grower pig (90 kg VS/yr). SPU multipliers for other pig classes are based on their comparative VS production.
This definition assumes that the pig is fed a typical diet, has typical feed wastage and is not fed with advanced feeding technologies such as phase feeding. Consequently, there are two methods for specifying the total number of SPUs in a piggery. The first is outlined in Table 4.1, which provides figures that can be used to determine the number of SPUs in different types of piggeries.
SPU=standard pig unit a For this example, it is assumed that the heavy finishers are sold at 26 weeks of age. Note: Refer to Table 9.1 for manure solids and nutrient output for different classes of pigs.
Another method is to:
use the standard SPU conversion figures in Table 4.1 to estimate the standard SPU capacity of the piggery
multiply the standard SPU capacity by 90 to estimate the VS production of the piggery (kg of VS/yr)
estimate the actual VS production/yr of the piggery using an appropriate manure estimation model such as PigBal (Casey et al 2000)
adjust the pig numbers in PigBal (or alternative model) until the VS production matches that calculated using the standard SPU multipliers.
29
If this method is adopted, the reasons for adjusting feed use and feed wastage must be justified, and practices maintained on an ongoing basis. This method is likely to best suit piggeries with high operating standards. An example is given below.
A pig producer wishes to establish a 100-sow farrow-to-finish (26 weeks) piggery. After calculating the number of pigs in each class, the multipliers given in Table 4.1 are used to calculate a herd size of 1200 SPUs. By multiplying 1200 SPUs by 90 kg of VS/SPU/yr, it is determined that a ‘standard’ piggery would produce 108 000 kg of VS/yr. Feed conversion rates from another piggery using similar diets and feeding systems are available and can be used to accurately estimate feed intakes and wastage. After running the PigBal model for the proposed piggery, it is determined that the piggery is only likely to produce 100 000 kg of VS/yr. The pig numbers in PigBal are adjusted up until the model predicts that the piggery will produce 108 000 kg of VS/yr. Thus, the pig producer is able to establish a 108-sow farrow-to-finish piggery, producing the same VS as a ‘standard’ 100-sow farrow-to-finish piggery.
30
5 Site selection
nvironmental advisers can provide guidance on the suitability of a site for a piggery. The main factors to consider include: E
statutory land use planning restrictions
availability of suitable land area
availability of reliable water supply
access to markets and labour
climate
the site’s natural resources
possible effects on community amenity or cultural heritage
any possible future expansion plans.
Each of these factors is discussed below.
Environmental outcome
Protection of natural resources and the community through good piggery siting.
5.1 Planning restrictions
When selecting a piggery site, the current and future land zoning of the property and surrounding land should be discussed with the local government authority. This may quickly identify properties that are unsuitable because of land use, zoning or legal constraints. Agricultural advisers can identify state and territory department planning controls.
5.2 Available land area
Property size is an important consideration. Ideally, a property should be large enough to contain the piggery and any required areas for by-product use. However, it is possible to transport by-products off-site to a third party. Owning land buffers around the piggery complex prevents encroachment by nearby developments. However, owning buffers is not a prerequisite because it is rarely possible to own the large property size needed. The shape of the property also affects the buffer effectiveness. For example, a larger buffer along the direction of the prevailing wind may reduce the number of complaints coming from that end of the piggery.
5.3 Access to markets
Piggeries need to be able to source labour to operate. They should also be located close to feed supplies and abattoirs to reduce operating costs.
31
5.4 Climate
Climate affects many environmental aspects of a piggery’s operations. Rainfall and evaporation rates affect the availability of surface waters. Options for using effluent also depend on local rainfall and evaporation. In most regions, effluent irrigation is needed for intensive conventional piggeries. Climate also influences the required size of the effluent treatment ponds and areas of by-product use, and the plants that can be grown on these areas. Prospective sites in high rainfall areas will usually require significantly more land for the treatment and reuse of effluent, and potentially have higher capital and operating costs. Climate also affects irrigation opportunity. For example, in winter-dominant rainfall areas, effluent may have to be held in storage for up to six months until the soil dries out sufficiently to allow effluent irrigation. In some areas of Australia, the net annual evaporation may allow piggery effluent to be removed solely by evaporation from suitably lined holding ponds. However, this concentrates salts in the sludge, limiting its suitability for reuse.
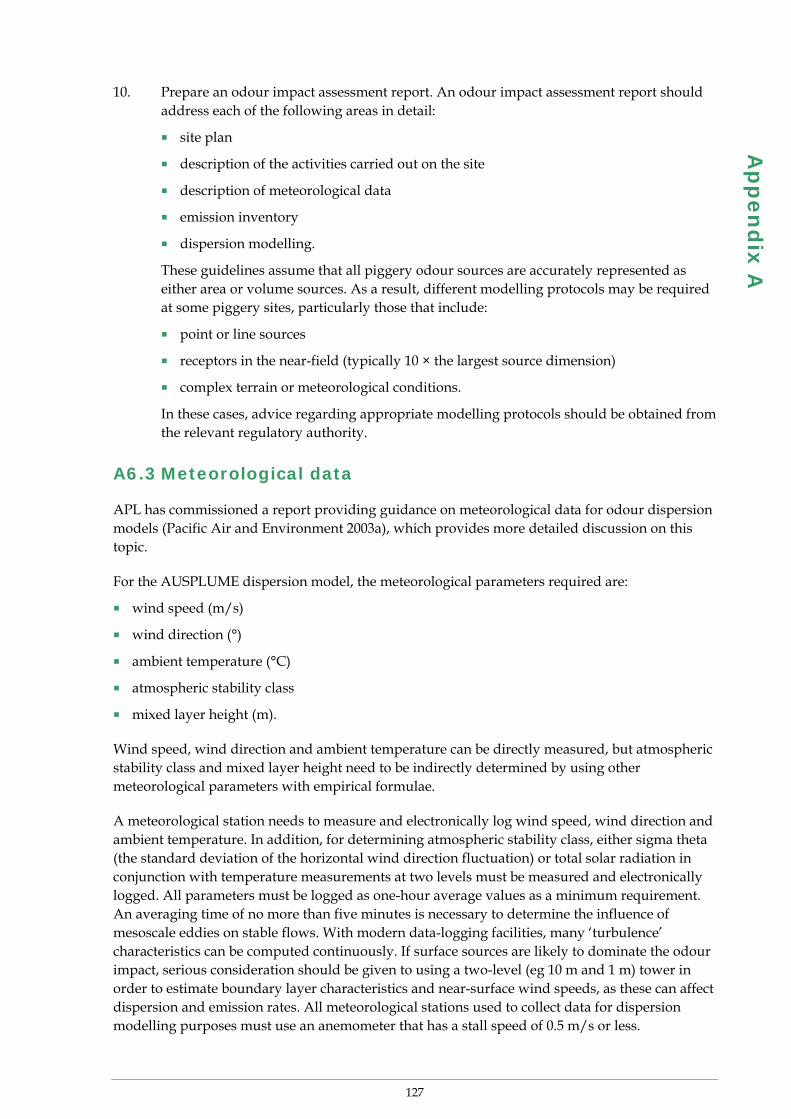
Winds transport odours and dust away from the piggery, so the speed and direction of the local winds partly determine possible adverse effects in nearby receptors. Odour is discussed in greater detail in Appendix A.
5.5 Natural resources
5.5.1 Topography
Suitable topography reduces the likelihood of complaints about community amenity, and saves money during the design and construction of a piggery.
Topographical barriers (hills, ridges etc) between the piggery and sensitive locations are desirable. For some, the sight of a piggery is not aesthetically pleasing. For others, it is a reminder of the presence of a piggery, which may cause complaints. Undesirable sites are often elevated and cleared and therefore provide a clear line of sight between nearby roads or neighbouring houses and the piggery.
The movement and dispersion of odour from the piggery depends on the topography in the vicinity of the property. Under stable atmospheric conditions, concentrated odours tend to ‘flow’ gravitationally down hills, more severely affecting receptors downslope from the source. Odours can also travel significant distances with very little dispersion if the development is in a confined valley. These factors warrant serious consideration when selecting a piggery site.
The ideal site for housing pigs indoors is relatively flat, to minimise the earthworks for shed pad preparation. If the building site is higher than any effluent treatment or storage ponds, effluent and leachate from solid by-products will flow into the treatment and storage ponds. This can eliminate the need for effluent collection sumps and pumping equipment, which may be prone to blockages and breakdowns as well as incurring ongoing energy costs.
For outdoor feedlot piggeries, a slope of 2–6% is needed for drainage. The effluent storage pond must be located downslope of the pens.
Site selection principles for rotational outdoor piggeries are the same as for areas of by-product use. For sites with heavy soils, gently sloping areas of by-product use are less likely to have water-logging and drainage problems. However, an area that is too steep may promote nutrient loss through soil erosion or stormwater runoff. The ideal slope depends on soil type, land use, vegetative cover, rainfall intensity, agronomic practices and the soil conservation measures that are in place.
32
5.5.2 Soils
A preliminary investigation should identify the range and distribution of soil types on the property. The suitability of soils for by-product use, building pads, carcase burial pits and effluent treatment or storage ponds should be considered. For example, loam to medium clay loam soils are often preferred for areas of by-product use as they usually drain well and retain nutrients. Deep clay soils best suit outdoor feedlot piggery pens, effluent ponds and solid by-product storage sites, since these soils can be compacted to provide a low permeability.
Doing a soil survey and chemical and physical analysis early in the planning phase helps to identify:
the suitability and required size of areas of by-product use
the need for imported clay or synthetic liners for outdoor feedlot piggery pens, ponds and by-product storage areas
the types of erosion controls and management that could be needed during construction and operation.
Soil analysis data for areas of by-product use also provide a benchmark for assessing future monitoring results.
5.5.3 Water
Water supply
Water is needed for drinking, shed cleaning and sometimes for summer cooling. It is essential to confirm that enough water of suitable quality is available.
The drinking water requirement varies depending on climate, season and drinker type. Approximately 8 L/SPU/day is required. The needs of a breeding herd may be 50% higher. An additional 10–50% should be allowed for drinking wastage. Emergency water storage of at least one to two day’s worth of drinking water should be provided. Shed flushing and hosing requirements vary widely, depending on shed type and design, pig class, water quality, by-product treatment and use, and whether treated effluent is recycled for flushing.
Water licensing requirements vary between states and territories, and regions within them. It is essential to confirm that water can legally be used in a piggery. The holding of a water allocation may not guarantee the supply of that volume. Pump testing of bores is recommended.
Water quality influences herd health and performance, effluent pond function and options for by-product use. Potential water sources should be analysed to identify suitable supplies. Suggested analysis parameters include total dissolved solids (TDS), bicarbonate, calcium, fluoride, magnesium, nitrate, nitrite, sulphate, hardness, pH and Escherichia coli (E. coli). For surface water supplies, check if the supply is susceptible to blue-green algal blooms. A pig husbandry or veterinary consultant can advise on drinking water suitability. As a general guide, the total dissolved salts in drinking water should be less than 3000 mg/L.
It is also highly desirable to have access to reliable fresh water irrigation supplies. This enables more effective use to be made of the nutrients in piggery by-products by ensuring that consistently high crop or pasture yields are obtained in the areas of by-product use. Effluent can also be mixed or “shandied” with fresh water to suit specific crop requirements. The land area needed for by-product spreading can also be minimised because irrigation increases crop yield and therefore nutrient use.
33
Surface water protection
Good siting, design and management of piggeries and areas of by-product use protects surface water quality. Practices that allow nutrients and organic matter to enter surface waters promote algae and aquatic weed growth. When these die their decay strips oxygen from the water, killing aquatic life and creating offensive odours. High nitrogen levels can cause nitrate and ammonia to accumulate to levels that may be toxic to animals. High phosphorus levels in surface water are linked to the occurrence of potentially toxic blue-green algal blooms.
Flood risk
Flooding may cause stock losses, building damage and surface water contamination, so the piggery complex should be above the 1-in-100-year flood level. Information on land submerged by a 1-in-100-year flood is available from local government authorities, or state water resources agencies. All-weather access to the piggery complex is essential for feed delivery and pig transportation. The areas of by-product use should be above the 1-in-5-year flood level. Where this is not possible, levee banks may be constructed (with appropriate approvals/permits) to protect land from flooding.
Groundwater protection
Groundwater is also protected through good siting, design and management of piggeries and areas of by-product use.
Sites where the soil type, geology and groundwater depth combine to pose a high risk for groundwater contamination should be avoided, as this may affect the siting and design of effluent treatment or storage ponds, ongoing by-product management, and groundwater monitoring requirements.
Piggery by-products need careful management to prevent nutrients leaching into and contaminating the groundwater. Nitrogen is highly mobile when in nitrate form and readily leaches. While most soils are capable of safely storing significant quantities of phosphorus, if excessive levels are applied to soils over a prolonged period, leaching into groundwater may eventually occur. Potassium also readily leaches when oversupplied in the soil.
Ideally, by-product reuse areas should be located on land where groundwater is deep, stored within confined aquifers or well protected by a clay blanket. The risk to groundwater from effluent reuse depends upon the protection afforded by soil type (eg a deep clay blanket may afford good protection, a sandy loam soil provides relatively poor protection) and the geology and type of aquifer (eg a confined aquifer versus an alluvial aquifer).
The consequences of nutrient or salt leaching into groundwater depend on the quality of the groundwater (eg potable water versus brackish water). However, it is important to protect the groundwater so that options for current and future use are not restricted.
5.5.4 Flora and fauna
Avoid areas of remnant vegetation, wildlife habitats and natural wetlands when selecting a site for a piggery or for by-product use. Relevant local, state and territory authorities should be consulted to determine any restrictions on tree clearing.
For rotational intensive outdoor piggeries, a good resilient vegetative cover (eg pasture or stubble) is essential within the pig enclosures. Both rotational and feedlot intensive outdoor piggeries should also have a good resilient vegetative cover around the perimeter.
34
5.6 Community amenity
Most conflicts between pig farms and neighbours relate to odour, but they sometimes relate to noise, dust, flies and rodents, pathogens or visual amenity. Conflicts arising from these issues are often very emotive, and the people involved sometimes experience great personal stress. In the interests of community harmony and farm security, conflicts must be resolved. A combination of appropriate site selection, layout, design, management and communication strategies will prevent these problems.
The main community amenity issues are discussed in the following sections, and should be considered carefully when selecting a site for a piggery development.
5.6.1 Odour
Odour nuisance is a very complex issue. An odour assessment can determine if an unreasonable odour impact is likely at off-site receptors. Each state and territory has its own legislation, codes of practice and guidelines for piggery odour impact assessment. Odour impact assessment is covered in detail in Appendix A, which provides a three-level evaluation process.
5.6.2 Noise
Each state and territory has its own regulations or guidelines pertaining to noise.
Feed milling, hand feeding, ventilation systems and transport inherently generate noise. Restricting transport, feed milling and hand feeding to daylight hours where possible often eliminates noise nuisance. In hot weather, early morning stock loading may be needed to protect animal welfare, but neighbours usually understand if they are advised in advance. Appropriate mufflers and noise attenuation equipment should be fitted to machinery. Careful selection of routes and considerate driving styles also help to reduce traffic noise.
5.6.3 Dust and smoke
Piggery dust and smoke should be minimised through good design and management.
Most piggery dust is from traffic along unsealed roads, feed milling and feed distribution. Traffic dust should be reduced by road watering, using sealed routes (if available) and driving at suitable speeds. Feed dust should be reduced through suitable milling and diet formulations. Shed dust should be reduced through regular cleaning. Smoke should be eliminated by not burning carcases or rubbish.
5.6.4 Flies, rodents and other vermin
Fly, rodent and vermin control relies on maintaining clean sheds, promptly removing waste feed, immediately disposing of carcases, and managing by-product properly. Mosquitoes need protected water habitats for the wriggler stage of breeding; ponds with steep banks, flat bases and no vegetative growth do not provide suitable habitats for breeding.
5.6.5 Pathogens
APL has recently funded research investigating the pathogens present in pig effluent and the public heath risks associated with effluent reuse (APL Project 1353). The research found that the range of pathogens potentially present in Australian piggery effluent is much narrower than the range found in human sewage. Significantly, piggery effluent lacks many of the major pathogens that are of concern when reuse of human sewage is considered (eg Vibrio cholerae and human
35
pathogenic viruses such as norovirus). The only pathogens in piggery effluent that need consideration are bacteria, as the only virus likely to be present is rotavirus, and this virus does not generally cross the species-host barrier.
Of the pathogens potentially present in piggery effluent, campylobacter, salmonella, erysipelothrix and E. coli (as an indicator organism) are probably of most interest from a public health perspective. Analysis of effluent from the treatment ponds of 13 southeast Queensland piggeries identified low campylobacter counts in 11 final ponds and low salmonella counts in only three final ponds. Erysipelothrix and rotavirus were not detected in any final pond. The results were evaluated using a quantitative microbial risk assessment approach for a real-life scenario in which piggery effluent was being used to irrigate turf. The study found that relatively small separation distances (eg 125 m at wind speeds of 0.5 m/s and 300 m at wind speeds of 2.5 m/s) were needed to minimise any health risks from campylobacter and salmonella in the irrigation aerosols.
5.6.6 Visual amenity
Piggeries are often perceived negatively by the community, so it is desirable to screen the piggery from public view. The natural topography and vegetation can be used for this purpose when planning a new development. Vegetation around the complex can significantly improve the visual appeal of a piggery, and can help in dispersing odour, noise and dust. Visual screens and vegetative buffers can be intentionally established and maintained specifically for this purpose.
5.7 Cultural heritage
Items, sites or places of Aboriginal or European cultural significance should be considered when selecting a piggery site. If these are present, consult the appropriate bodies (including the traditional landowners) to determine the most suitable course of action. The issue may be resolved by properly recording, preserving or relocating special objects to allow development to proceed, or parts of the property may need to be permanently sectioned off to prevent access and any potential detrimental effects.
5.8 Future expansion plans
During the site selection process, any plans for future expansion should be considered. This may include allowing extra area around the piggery for additional sheds and by-product treatment systems, and ensuring that enough land is available for sustainable by-product use. Considering these aspects during the site selection stage helps to simplify any future expansion processes.
During the planning stage, it may be worth ensuring that separation distances will allow for future expansions. This might involve investigating the potential for acquisition or rezoning of nearby land to protect or expand the buffer areas available.
36
6 Separation and buffer distances
ood design, construction and management are the most important factors for preventing impacts on sensitive locations and receptors. However, providing adequate separation and
buffer distances between piggeries and sensitive locations is an important secondary measure for reducing the risk of environmental degradation and avoiding conflicts relating to community amenity.
G
Local authorities may have specific by-laws or other planning instruments that stipulate separation distances and buffers for piggeries. Appropriate planning is needed to maintain these separation distances and buffers between established piggeries and receptors, watercourses and groundwater.
Sections 6.1 and 6.2 include recommended buffers for surface water and groundwater, and separation distances for community amenity, respectively. These separation and buffer distances are not applicable to existing piggeries.
Environmental outcome
The community, water resources and vegetation are protected by providing buffers
and separation distances that mitigate potential runoff and odour impacts.
6.1 Buffer distances from surface water and groundwater
Surface waters should be protected through sound design and management of piggery complexes and areas of by-product use. These areas should be managed and sized to achieve a nutrient balance or sustainable nutrient storage. Application of by-product should be carefully timed by irrigating with effluent when the soil is not saturated and rain is not expected, to minimise the risk of nutrients in stormwater runoff. Ideally, by-products should be applied when crops are actively growing, to ensure nutrient uptake and to minimise nutrient losses by leaching.
Buffers provide secondary protection against:
effluent entry to surface waters through runoff of tailwater from irrigated effluent nutrient-rich stormwater runoff from areas of by-product use spray drift from irrigation with effluent.
Vegetative cover in the buffer area between the area of by-product use and any watercourse should be maintained wherever possible, particularly riparian vegetation, to minimise the movement of nutrient-rich runoff and eroded soil into surface waters.
The appropriate buffer width depends on the vegetative cover of the buffer area and the presence of other stormwater control devices, such as diversion banks and terminal ponds. Vegetative filter strips (VFS) can very effectively reduce nutrient entry to watercourses. They reduce the nutrient concentration of runoff through particle trapping, and reduce runoff volumes by increasing infiltration. Generally, wider VFSs can effectively trap larger quantities of soil eroded from upslope areas. However, for the same soil loss rate, areas with steeper slopes need a wider VFS than areas with a gentler slope. Place VFSs as close as possible to the areas of by-product use
37
to minimise additional runoff through the filter strip. It is also critical to place the VFS before any convergence of runoff.
As a safeguard, a buffer should be provided between piggeries and areas of by-product use, and groundwater bores and surface waters. The required buffer distance should be assessed on a case-by-case basis with the aim of protecting sensitive waters, while not being overly onerous. For instance, only a relatively small buffer would be needed if there is a well-developed and maintained VFS between an area of by-product use and a watercourse. Similarly, good irrigation practices, such as direct injection, should only require a small buffer. Under some state and territory requirements, fixed buffer distances may apply.
Major stores of potable water and watercourses within drinking water catchments generally need the greatest protection. (A watercourse is a naturally occurring drainage channel such as a river, stream or creek. It has a clearly defined bed and bank, with intermittent (ephemeral) or continuous (perennial) water flows. Also refer to relevant state or territory acts for legal definitions).
Piggeries should be 800 m from major water supply storages (including public water supply storages, lakes, lagoons, marshes or swamps). Restrictions may apply in catchment areas for major water storages owned by water boards or local authorities. The measuring point for the buffer distance from a watercourse should be the maximum level to which the water surface of a watercourse may reach before overtopping of a bank begins (bank-full discharge level). Relevant state or territory legislation should be consulted for the legal definition in each area.
In all cases the relevant regulatory authority should be consulted where a piggery is proposed within a declared catchment area or a declared groundwater area. A reduced separation distance may be allowed if it can be demonstrated via a risk assessment that the feature will be protected. For highly sensitive or vulnerable resources, or under some state and territory requirements, the distance may need to be increased.
Table 6.1 provides recommended buffer distances from areas of by-product use to surface waters, by reuse category.
38
Table 6.1 Separation distances between areas of by-product use and surface waters, by reuse category
Reuse category Distance from major
water supply (m)
Distance from
watercourse (m)
Effluent that is discharged or projected to a height in excess of 2 m above ground level
By-products that remain on the soil surface for more than 24 hours (ie are not immediately ploughed in)
Spent bedding that is spread immediately (ie not stockpiled/composted) and remains on the soil surface for more than 24 hours
Flood irrigation systems
Rotational outdoor piggery pens
800 100
Mechanical spreaders and downward discharge nozzles. The discharged material shall not be projected to a height in excess of 2 m above ground level
Spent bedding that has been stockpiled before spreading
800 50
Discharge by injection directly into the soil (to a depth of not greater than 0.4 m) and at a rate not exceeding either the hydraulic or nitrogen, phosphorus or potassium limits determined for the local soil types
Spent bedding/solids that have been composted
Application of effluent/spent bedding/solids in combination with immediate incorporation of material into the soil (< 24 hrs)
800 25
Note: Distances should be measured from the perimeter of the area used for handling or using by-products
The fixed separation distances surrounding areas of by-product use are to be used as a guide. Dispensation may be obtained for these distances following site-specific assessment by the relevant authority. For example, appropriate vegetative buffers and terminal ponds designed to catch the first 12 mm of runoff from areas of by-product use will be considered in reducing the required distance to watercourses.
6.2 Separation distances for community amenity
An odour assessment can determine if an unreasonable odour impact is likely at off-site receptors. However, the success of a proposed piggery development also relies on community acceptance. Community consultation during the planning stage will often provide enough information to allay concerns. For community consultation to be effective, it is important to structure the process to suit the individual situation.
39
On-going two-way communication between piggery operators and receptors (particularly neighbouring residents) reduces the risk of unacceptable odour impacts. Research in North America concluded that piggery odour emissions may lead to a range of physical symptoms in some people, including headaches, nausea and vomiting (Schiffman et al 1995, 1998).
Odour modelling uses data representing a site and applies simplifying assumptions to estimate the odour dispersion (movement away) from the site over time. Modelling is generally conducted by estimating odour dispersion each hour over a period of one year. These models estimate odour occurrences at specific points according to odour impact criteria. Input data include odour sources, odour source dimensions, source odour emission rates, meteorological variables for the site, and site surface characteristics. Odour modelling accuracy is limited by the simplifying assumptions inherent in the model used, and by the accuracy of input data, particularly meteorological conditions and odour emission rates. Appendix A provides a three-level approach for assessing the likely odour impacts of a proposed piggery or piggery expansion. Appendix A is unsuitable for application to existing piggeries, and is not to be used for this purpose.
The Level 1 assessment uses a standard formula to calculate variable separation distances from piggeries to different types of receptors. The formula considers the number of SPUs, receptor type, topography, vegetation (surface roughness) and piggery design and operation. Fixed separation distances are also provided to ensure appropriate buffers between the piggery and features such as roads and property boundaries. Both the variable and fixed separation distance to receptors (town, residential and rural) must be calculated and the greater distance of the two applied. Relevant local government planning schemes may have definitions of the location and extent of each receptor type. Fixed separation distances are given in Appendix A.
Separation distances from areas of by-product use to relevant receptors and features are also provided in Appendix A. By-product use areas are considered separately from piggeries because they are infrequently used and may be spread across a farm. Furthermore, piggery operators have a significant degree of control over the timing of by-product application in these areas. These distances are in addition to separation zones for the piggery complex and are determined separately.
Level 2 and Level 3 assessments involve odour modelling. Full details are provided in Appendix A.
40
7 Cleaner production
sing resources more efficiently, reducing the amount of by-product generated and using those by-products can reduce costs and harm to the environment. Cleaner production
involves continuously applying an integrated, preventive strategy to all processes to increase overall efficiency and reduce risks to the environment (including humans).
U
Environmental outcome
Efficient use of resources, minimal waste production and reuse and recycling of
by-products where appropriate.
7.1 Efficient resource use
The major input to any piggery is feed. Reducing wastage improves feed conversion efficiency and reduces the organic loading rate of the effluent treatment ponds and the potential for subsequent odour impacts. Feed wastage can be minimised by providing the pigs with fresh feed, matching the amount of feed delivered to the amount required, and using well-designed feeders and sound feeding practices. Closely matching diet composition to animals’ nutritional requirements and using additives including enzymes (eg phytase) to increase nutrient availability also improves feed conversion efficiency. Industry benchmarks for feed conversion efficiency provide a guide to performance.
Implementing sound shed design principles significantly reduces power use and consequently heating and cooling costs. Well-insulated sheds require less energy for heating and cooling, and orienting sheds east-west reduces heat from the sun. Natural ventilation reduces cooling costs and deep litter housing uses less power.
Water is needed for drinking, cleaning and sometimes cooling. Water use varies widely between piggeries, and this increasingly scarce resource should be used efficiently. It is important to supply cool drinking water in hot weather. Wastage is generally lower for well-designed bowl drinkers (for sows) and bite nipples than for push nipples. Leaking nipples should be adjusted or replaced. Sheds with sandwich panel walls and fully slatted floors are more easily cleaned than those with brick or iron walls, reducing the amount of water used for cleaning. Sweeping conventional shed laneways also reduces the amount of cleaning water required. Recycling treated effluent for flushing reduces the overall water usage but may increase struvite formation in pipelines. Struvite is a crystalline compound that precipitates out of effluent (and sometimes out of bore water), blocking pipes and equipment. The use of deep litter sheds significantly reduces cleaning water requirements. Significant amounts of water can be lost through leaking pipelines, and these need ongoing maintenance. Overall, continuous monitoring of water use can identify excess use and enable rapid rectification of leaks.
7.2 Waste hierarchy
Waste avoidance should be a priority, followed by reuse and then recycling. Disposal should be a last resort.
41
7.3 Minimising effluent generation
Effluent is mainly composed of wastewater from shed cleaning and cooling, drinking water spills and leaks, manure, and waste feed.
Section 7.1 outlines methods for efficiently using water. Optimising feed conversion efficiency reduces manure production. Methods for improving feed conversion are also given in Section 7.1. Feed wastage can be minimised by using well-designed feeders and sound feeding practices.
Using guttering on shed roofs and diversion drains keeps runoff out of the effluent system.
7.4 By-product use
Piggery by-products may be substituted for inorganic fertilisers or used as an energy source for power generation.
The solid and liquid by-products of piggeries contain significant quantities of the nutrients and organic matter that promote plant growth. These can be substituted for inorganic fertilisers. By-products can be spread without treatment, but composting is one way of value-adding to make the product more stable and marketable to a wider range of users.
Methane in the biogas produced by digesting piggery by-products can be captured for electricity generation. The methane can provide power for on-farm facilities or can be sold to electricity suppliers. Because methane digestion is expensive and technically demanding, it will only be viable for a small percentage of producers; economies of scale are important.
42
8 Pig accommodation — design and management
Environmental outcome
Pig accommodation that is designed, constructed and managed for optimal hygiene to
prevent adverse impacts on community amenity.
xpert advice should be sought on the structural design and internal layout of piggery buildings. Design should consider building foundations that suit the soil type, the number of
pigs to be housed, pen layout, the piggery site, local climate, orientation, shading, insulation and ventilation (both natural and mechanical).
E
There are two common forms of intensive indoor piggery housing — conventional sheds that produce liquid effluent, and deep litter sheds that produce spent bedding containing manure.
Conventional sheds suit all classes of pig. Shed environment, nutrition and husbandry can be tightly controlled, but these sheds are relatively expensive to build. Some operating costs are high (eg labour and power). The sheds may also need large quantities of water to be cleaned. Ponds coupled with areas of by-product use or evaporation ponds are usually needed to manage the liquid effluent produced.
Deep litter sheds best suit weaners, growers/finishers and dry sows. Weaners and growers/finishers generally move through these sheds in batches (‘all-in, all-out’), with spent bedding cleaned out only at the end of each batch. They may be relatively inexpensive to build and may provide welfare benefits, but bedding may be difficult and expensive to buy during drought years, particularly for finisher pigs and dry sows as they require more bedding. The spent bedding also requires management. However, much is to be learned about optimising pig performance in this accommodation type. Sections 8.1 and 8.2 and Tables 8.1, 8.2 and 8.3 discuss design considerations for conventional sheds and deep litter sheds. Intensive outdoor accommodation is covered in Section 8.3.
43
Table 8.1 Summary of design considerations for piggery sheds
Design component Considerations
Shed orientation Buildings should be oriented with their long axis east–west to minimise heat load.
General design and materials
New sheds should be constructed from materials with good thermal properties that maintain shed temperature in the required range with minimal mechanical heating or cooling.
The flooring and drainage system should exclude the ingress of clean stormwater runoff and prevent the discharge of effluent, solid by-products or contaminated waters to adjacent areas.
Floors must be concreted for conventional sheds or have low permeability for deep litter sheds (preferably being concreted, otherwise soil compacted for a design permeability of 1 × 10⁻⁹ m/s for a minimum depth of 300 mm comprising two layers each 150 mm thick) to prevent seepage of effluent into soils and groundwater.
Buildings should be located above the 1-in-100-year flood level.
Feeding system design Automatic feeding systems should present feed to all animals simultaneously to reduce the level of noise at feeding times. Ad libitum or continuous feeding systems also reduce feed wastage.
Ventilation Adequate ventilation removes piggery gases, dust and odour, controls air temperature and relative humidity, removes excess heat and moisture, dilutes and removes airborne disease organisms and maintains oxygen levels.
Naturally ventilated sheds should be separated by a distance of five times their height to maximise ventilation.
Air quality The dustier the piggery, the more odorous it will be. Piggery dust may be reduced through adequate ventilation, routine shed cleaning, using pelletised feed, reducing feed-borne dust by adding fat/tallow to diets (making the feed greasy so it will not generate dust), eliminating floor feeding, installing automated feeding equipment, and use of oil sprays.
Visual impact The material types and colours used for structures combine with landscaping to influence visual impact. Careful choices can produce structures that blend with the surroundings.
External landscaping Strategic tree planting around the piggery complex can significantly reduce the visual impacts of the piggery, and may improve odour and dust dispersion.
44
8.1 Conventional shed stocking densities
Shed stocking densities affect pig performance and also the cleanliness and odour production of sheds. Minimum space allowances for conventional sheds are given in Table 8.2.
Conventional sheds need regular sweeping and hosing to keep lanes, pens and handling areas clean. The design and management of effluent collection systems associated with conventional sheds are discussed in detail in Section 10.
Table 8.2 Minimum space allowances for housed pigs
System Minimum space allowance (m2 /pig)
Comments
Up to 10 kg 0.11
11–20 kg 0.18
21–40 kg 0.32
41–60 kg 0.44
61–80 kg 0.56
81–100 kga 0.65
Adult pigs in groups 1.4
Approximately 20–30% of space allowance is for a dunging area
Adult pigs in individual stalls
0.6 × 1.8 m
Boars in pens used for mating
6.25 Minimum length of shortest side 2 m
Lactating sows in: With piglets up to 4 wks of age
Stalls 3.2
Individual pens 5.6
Multi-suckling groups 5.6 For each sow and litter a For export pigs in the 101–120 kg and 121–140 kg weight ranges, provide at least 0.75 m2/hd and 0.85 m2/hd of space, respectively.
Source: Standing Committee on Agriculture and Resource Management (1998).
8.2 Deep litter shed bedding management and stocking densities
Floors in deep litter sheds are covered with straw, sawdust, rice hulls or other bedding materials that absorb spilt drinking water and manure. Low-permeability flooring makes cleaning easier and prevents nutrients leaching into groundwater. Regular bedding top-up is needed to maintain dry, low-odour conditions within sheds. On average, some 0.5–1 kg/pig/day of straw is needed. The bedding should be thoroughly cleaned out and replaced before allowing each new batch of pigs into litter-based sheds. Extending the floor pad at least a metre beyond the shed end allows for bedding to be contained at cleanout. Deep litter sheds with concrete floors are sometimes hosed after bedding removal. This is generally the only liquid effluent stream from these sheds.
45
Stocking rates need careful management to control odour generation. Commonly used stocking densities are given in Table 8.3.
Table 8.3 Commonly used stocking densities for deep litter housing (based on a survey of industry practice)
Class of pig
Space allowance
(m2 /pig)
Weaners (4–10 weeks, 5–25 kg)
0.55–0.75
Growers (10–16 weeks, 24–55 kg)
1.0–1.2
Finishers (16–24 weeks, 55–110 kg)
1.2–1.4
Dry sows 2.5–3.0
Source: Based on data given in Payne (2000).
8.3 Intensive outdoor accommodation
Intensive outdoor piggeries accommodate pigs in small paddocks (rotational) and enclosures (feedlot), sometimes with simple communal shelters for dry sows, kennels for weaners, and individual huts for lactating sows.
For rotational outdoor piggeries it is important to maintain ground cover over paddocks to minimise erosion and nutrient losses. Wallows should also be provided. Paddock management must include regular spelling from pig production with a plant growth and harvest phase to strip the nutrients added by pig production. Pigs should not be allowed to access watercourses.
Feedlot outdoor piggeries need to be located within a controlled drainage area with runoff collected in a holding pond. The retention dam should be designed so overtopping does not occur more than once every 10 years. Volumetric runoff coefficients of 0.8 for the enclosures, roads and laneways, and 0.4 for grassed areas should be used in the calculation of the retention dam volume.
The outdoor feedlot piggery pad must be a compacted base to prevent nutrient leaching. It should have a maximum design permeability equivalent to 1 × 10⁻⁹ m/s for a depth of 300 mm comprising two layers each compacted to 150 mm. Wallows should also be provided. Pigs should not be allowed to access watercourses.
46
9 Estimating the nutrient content of piggery by-products
he nutrients and salts in piggery by-products need quantification to enable good management. This is an essential first step towards calculating by-product treatment
requirements and sizing areas of by-product use. TWhen planning a piggery development, the nutrient content of by-products is best estimated using mass balance principles. Manure quantification and the fate of nutrients, including their partitioning to effluent and solids, can be estimated using predictive mass balance models (eg PigBal, MEDLI and the Piggery Assessment Spreadsheet). These models are discussed in this section.
For existing piggeries, the nutrient content of by-products is best quantified using a concentration and quantity method. This method is detailed in Section 14.1.3.
Environmental outcome
Measuring the amount and quality of by-products, enabling appropriate treatment and
use.
9.1 Estimating volatile solids
Section 4.3 provides the methods for estimating the SPU capacity of a piggery. The manure and waste feed produced by one SPU contains approximately 90 kg of VS/yr. Hence, multiplying the SPU capacity of the piggery by 90 kg of VS provides the estimated VS output of the entire piggery each year.
9.2 Estimating nutrients and salts — mass balance principles
This section provides details to estimate the quantity of nutrients and salts in piggery by-products using mass balance principles.
9.2.1 Mass balance principles for piggeries
A mass balance estimates the quantity of nutrients and salts in by-products through the difference between inputs (generally pigs, feed, water and bedding (if used)) and outputs (pigs, and nitrogen volatilisation in sheds). It may also estimate nitrogen losses via ammonia volatilisation and nutrient partitioning in effluent treatment ponds between supernatant and sludge (if applicable), or from solid by-product stockpiles (if applicable). Each of these elements is important in accurately estimating the nutrient load available for use.
Nutrients and salts excreted by pigs can be estimated using predictive models, such as PigBal and MEDLI (see sections 9.2.2 and 9.2.3) that are based on diet digestibility and mass balance principles. Mass balance principles consider different diets, feed use, feed wastage, water quality and use, bedding quality and use, and other factors affecting the composition and quantity of by-products produced.
47
9.2.2 PigBal model
PigBal 3.1 is an Excel® spreadsheet that estimates the mass of solids, nitrogen, phosphorus, potassium and salt in piggery by-products using diet digestibility and mass balance theory (Casey et al 2000). Table 9.1 provides PigBal estimates for the typical quantities of solids and nutrients in the manure and waste feed of different classes of pig housed in conventional sheds, based on typical diets. For pigs housed on deep litter, the nutrients added by the bedding may need to be considered (particularly potassium if straw is used). Typical nutrient composition data for bedding materials are provided in Table 9.2.
Table 9.1 Predicted solids and nutrient output for each class of pig
Pig class Output (kg/yr)
Total solids
Volatile solids
Ash Nitrogen Phosphorus Potassium
Gilts 197 162 35 12.0 4.6 4.0
Boars 186 151 35 15.0 5.3 3.8
Gestating sows 186 151 35 13.9 5.2 3.7
Lactating sows 310 215 95 27.1 8.8 9.8
Suckers 11.2 11.0 0.2 2.3 0.4 0.1
Sow and litter 422 325 97 50 13 11
Weaner pigs 54 47 7 3.9 1.1 1.1
Grower pigs 108 90 18 9.2 3.0 2.4
Finisher pigs 181 149 32 15.8 5.1 4.1 Note: Refer to Table 4.1 for approximate animal numbers in each pig class per 100-sow production unit.
Table 9.2 Typical solid and nutrient content of clean bedding materials
Content (% dry matter)
Bedding materials Total solids Nitrogen Phosphorus Potassium
Hardwood sawdusta 90 0.22 0.01 0.05
Softwood sawdust/shavingsa 90 0.14 0.01 0.03
Rice hullsb 92 0.53 0.08 1.32
Barley strawb 91 0.69 0.07 2.37
Wheat strawb 89 0.58 0.41 0.51 a based on unpublished data from Department of Primary Industries and Fisheries — Queensland b based on data from National Research Council (1984)
9.2.3 MEDLI Model
MEDLI® is a Windows®-based computer model for designing and analysing effluent treatment systems and use of effluent in land irrigation. It was developed jointly by the CRC for Waste Management and Pollution Control, Department of Primary Industries and Fisheries, Queensland, and the Department of Natural Resources, Mines and Energy, Queensland.
48
MEDLI uses the same principles as PigBal (mass balance and diet digestibility) to predict the effluent stream from the sheds. It follows the effluent stream of a piggery through pre-treatment, treatment and utilisation.
9.2.4 Wastload model
Developed in South Australia, Wastload is an Excel® spreadsheet-based model designed to calculate sustainable by-product spreading rates. Inputs include soil properties, effluent and shandying water composition, land use, and harvested yields. Outputs include potential loading rates for nitrogen, phosphorus and potassium, the sustainable effluent and/or solids application rate and salt dynamics (Clarke 2003).
9.2.5 Piggery assessment spreadsheet
The Department of Primary Industries and Fisheries, Queensland originally developed the ‘Piggery assessment spreadsheet' (Skerman 2000) for use by their regulatory officers in assessing applications for new and expanding piggeries under the relevant state legislation. To enhance its value to the pig industry, the assessment spreadsheet has recently been revised and updated to a more user-friendly form, making it more useful to many producers, consultants and industry advisers. The spreadsheet uses piggery waste excretion estimates derived from PigBal to automate the calculations required in preparing applications, and assists in documenting proposed piggery design characteristics and management practices. It partitions the excreted waste between the liquid effluent, separated solids, pond sludge and deep litter, and performs nutrient mass balances on the effluent and solids land application areas to assess their long-term sustainability. It also calculates pond volumes required for the storage and treatment of effluent.
9.2.6 Fate of nutrients — conventional piggeries
Significant ammonia losses in sheds and ponds reduce the amount of nitrogen available to be used. Ammonia volatilisation losses within piggery sheds account for approximately 10% of excreted nitrogen. Anecdotally, some 15–30% of nitrogen entering a piggery effluent pond deposits to sludge. Volatilisation of ammonia nitrogen from the pond surface may remove 40-70% of the supernatant nitrogen. Cumulative total losses for the entire system might range from 54% to 89%.
Phosphorus is not lost from the pond system through chemical or biological transformations. However, about 90% of the phosphorus in the influent may accumulate in the sludge of a conventional anaerobic pond.
There is little loss of potassium and other salts to sludge. Since potassium is very soluble, the liquid component of sludge has a similar potassium concentration to the supernatant of the pond. Around 10% of the potassium added to the pond is likely to be present in sludge.
The salt content of the effluent stream depends on the salt content of the feed and water used in the piggery. The salt content of the treated effluent also depends on the quantity of effluent removed for use (recycling and irrigation), the climate, and the surface area of the effluent treatment ponds. Conductivity of pond effluent ranges from 2.2 to 14.7 dS/m (Table 14.1, see Section 14). Salinity of piggery sludge ranges from 6.3 to 16.5 dS/m (Table 14.2, see Section 14).
There are few quantitative data on heavy metal excretion by pigs. However, Tables 14.1 and 14.2 provide concentrations of copper, zinc and selenium in piggery effluent and solids.
49
9.2.7 Fate of nutrients — deep litter sheds
Spent litter from deep litter sheds includes nutrients from the manure and bedding. Significant ammonia losses would be expected in the sheds (say 10–20%) and from stored spent litter. However, phosphorus and potassium losses should be minimal. Rates of nitrogen loss through volatilisation after litter clean-out depend on material handling. Composting produces higher loss rates than stockpiling.
Significant dry matter losses occur during the storage/treatment of deep litter. The more intensively the material is treated (composted), the greater are the dry matter and nitrogen losses. This has the effect of increasing the phosphorus concentration of the material and reducing the nitrogen to phosphorus ratio. However, the nitrogen in composted material is more stable and smaller losses will occur during reuse. For material that has not been composted, nitrogen losses on spreading can reduce the nitrogen to phosphorus ratio in the spread material to the same level as the compost.
9.2.8 Fate of nutrients — outdoor piggeries
A significant percentage of the manure nitrogen deposited in feedlot outdoor piggeries will be lost through ammonia volatilisation. Since the base of these piggeries must be properly compacted or sealed, losses of other nutrients and salts should be minimal. The deposited manure will need to be regularly removed from the pad. Nutrient losses from harvested manure and compost are discussed in sections 13.1 and 13.2 respectively. The ponds will collect nutrient-rich stormwater runoff from the feedlot piggery pad. Some nutrients in the pond effluent will be deposited as sludge others will remain in the supernatant.
There will also be significant nitrogen losses from the manure deposited in rotational outdoor piggeries. Low levels of nutrient leaching could also occur.
50
10 Effluent collection systems
aw effluent is moved from conventional intensive sheds to treatment facilities by an effluent collection system that generally includes pits, drains and/or sumps. These facilities must be
large enough for the expected effluent volume and flow rate. Effluent should ideally flow by gravity (rather than pumps that can fail) and along open channels (rather than through pipes that can block). For outdoor feedlot units, runoff needs to be collected by a drainage system.
R
Environmental outcome
Effluent is collected and moved from conventional intensive sheds to treatment
facilities or areas of use with minimal odour generation and no releases to surface
water or groundwater.
10.1 Collection systems
10.1.1 Flushing systems
Flushing systems comprise underfloor channels that are flushed daily to twice weekly with either clean water or treated effluent recycled from the ponds. The drain width, drain length, flush volume, flush rate and flushing frequency need to be carefully matched to ensure effective removal of accumulated manure and cleaning of pits and drains. The maximum recommended flush length is 50 m, and box drains with a 1% slope are preferred. Alternatively, level box drains with a 50 mm lip at one end to retain some water in the base of the drain, can be used. For drains up to 40 m long, the minimum recommended flushing water volume is 700–1000 L/m of drain width/flush. A water velocity of 0.9 m/s, an initial flow depth of 75 mm, and a flush duration of at least 10 seconds will effectively dislodge and transport solids.
10.1.2 Pull-plug systems
‘Pull-plug’ systems store effluent in underfloor pits that are drained ideally at least fortnightly using the gravity release pipes in the centre of the pits. Following complete drainage, the pit is partially refilled with either clean water or recycled effluent to prevent deposited manure from sticking to the pit floor. Pull-plug systems are suitable for sheds with negative pressure ventilation systems. Each shed may be divided into a number of cells serviced by individual pull-plug systems.
10.1.3 Static pits
Static pits are common in old-style piggery sheds. They comprise underfloor pits that store effluent for up to several weeks before it is released via a sluice gate at the end of the shed. These systems do not always adequately clean underfloor pits. They need recharging with 50 mm of water to reduce ammonia releases and prevent manure and waste feed from sticking to the base.
51
10.1.4 Open flush gutters
Some older piggeries collect effluent in open flush gutters or vee drains running along solid flooring within or beside the pens. The gutters rely on pig movements dislodging the manure, which in turn reduces the amount of cleaning water required. However, both the pens and the pigs remain dirtier than in other systems. This increases the potential for odour and for rapid disease transmission along the shed via the cleaning water that runs through or beside each pen.
10.1.5 Drains
Drains or pipes are also needed to move effluent from other systems to sumps or treatment ponds. Drains are preferred to pipes, as pipes are more likely to block because they are more difficult to inspect and clean. There is no significant difference in odour between open drains and pipes, as the effluent is only in these conduits for a short time.
Drains should be made of smooth concrete, fibreglass or other impervious material in spoon or vee channel sections. They should have at least a 0.5% slope to ensure minimum solids retention, and ease of cleaning and drying between uses. Enclosed drains or pipes should have a 1% slope and be flushed with enough fluid to be self-cleaning. Pipe drains should be laid on a constant grade with minimal bends and joins.
Feedlot outdoor piggeries require sealed drains at the base of pens to convey runoff to the retention pond. These will need enough slope (0.5–1%) to prevent significant settling of solids in the drains. The drains will also need regular maintenance to ensure that they are free of deposited solids and vegetation.
10.1.6 Dry scraping systems
Dry scraping systems comprise blades on cables that drag manure and wastewater from effluent channels under sheds. Since flushing water is not added to the manure, the amount of effluent that is treated is greatly reduced. However, the effluent has a very high concentration of solids. Ammonia within sheds may also be significantly higher than in other effluent collection systems. Dry scraping systems work best in climates with very low rainfalls and high evaporation rates, since an odour-controlling crust readily forms over the effluent discharged to a pond or basin. Methods of treatment and use of the solids produced by this method need further research.
10.1.7 Effluent sumps
Sumps store effluent before pre-treatment, or before the effluent is directed to ponds or irrigation. They must be made from strong, corrosion-resistant and impermeable materials, such as concrete, fibreglass, stainless steel, poly-lined steel or enamelled steel.
When sizing sumps, consider the shed flushing frequency, flushing volume, pumping frequency, pumping capacity, possibilities for equipment failure, and stormwater entry. Contingency plans are needed in the event of equipment failure.
Mechanical stirrers or high-velocity pumps are generally used to ensure that solids are kept in suspension to prevent settling, and to enable pumping of the resulting slurry. The type and size of the agitator needed depends on the effluent properties and the size and shape of the collection tank. Diaphragm pumps cause less solids break-up than impeller pumps, enabling maximum solids recovery. If the mixing speed is too high, odour may increase.
52
10.2 Design principles
Effluent collection systems should be designed and constructed to stop surface water runoff from coming in, and effluent from going out. The systems must be impervious to prevent seepage and the possibility of groundwater contamination. They should also be self-cleaning or be regularly cleaned to reduce manure build-up, and to minimise the risk of excessive odour and fly and mosquito breeding. Consider future expansions in piggery capacity when designing and locating the effluent collection system.
The effluent collection system should be managed by ensuring that:
excess manure is not left in the effluent collection and transport system after flushing or emptying
there is no overtopping or leakage from pits, drains and sumps
there is regular emptying or cleaning to minimise odour, adverse effects on pig health and fly breeding.
All components of the effluent collection system need regular inspections for solids accumulation, leakage and deterioration. Drains and sumps need inspection daily, or as required depending on the flushing frequency. Pits need inspection at least weekly.
Ideally, sheds with flushing systems should be flushed daily. Each static pit should be emptied at least weekly, with each pit being emptied in rotation to promote uniform loading of the effluent treatment system.
53
54
55
Tables 11.1–11.3 summarise the efficiency of various methods of pre-treatment solids removal.
The performance of most mechanical solids separation systems improves when there is more than 3% solids in the total volume. However, the effluent from most flushed sheds has a total solids concentration of only about 1%. Thickening can be achieved through gravity settling and/or adding coagulants or flocculants.
Centrifugal forces can be used to separate out solids. Examples are hydrocyclones and horizontal centrifuges. The tangential flow separator tank of a hydrocyclone acts like a cyclone, using lime or other additives to assist solids removal.
Screw or belt presses force the effluent against a filter, which retains the solids and allows the liquid to pass through. As solids build-up on the filter matrix, more of the finer particles are recovered.
Screens separate solids from liquid on the basis of particle size and shape. Types include static rundown screens, vibrating screens and rotating screens.
In gravitational settling, the effluent is held in a basin or tank so that the solids settle. The remaining liquid is then released or removed from the top of the storage unit. Another gravity separation process is dissolved air flotation, which uses air or gas bubbles to remove solids.
Methods for separating solids from liquids include gravitational settling, screens, presses and centrifugal separation.
11.1 Options for solids separation
Solids separation systems designed, constructed and managed to optimise solids
removal and produce manageable solids, while minimising impacts on community
amenity (such as odour and vermin), surface water and groundwater.
Environmental outcome
re-treatment facilities separate larger solids from liquid effluent before the effluent is treated, recycled and used. This reduces the effluent’s organic matter, and consequently the capacity
required of the effluent treatment pond. Nutrients and minerals in the separated solids are thus also removed from the liquid effluent.
P
11 Solids separation systems
The solids separation system should be located within a low permeability, controlled drainage area. The maximum design permeability should be 1 × 10⁻⁹ m/s for a depth of 300 mm comprising two 150 mm-deep layers. Impervious drains or pipes should convey all runoff, separated liquid and leachate from the separated solids to storage ponds.
Separated solids may be stacked, composted or spread directly over land. The separated solids need careful management to minimise odour, fly breeding and surface water or groundwater contamination (see Section 13).
Table 11.1 Summary of performance of a range of solids separation systems
Separation system Indicative capital costsa
Indicative operating costsb
Solids dryness
Maintenance and supervision
Degree of operator training
Pre-treatment needed
Removal efficiency (% of total solids)
1.2 % TS 3.1% TS Sedimentation basin Low–medium Medium to high Low Medium Low Nil 50 50
Sedimentation and evaporation pans
Low Low Low Low Low Nil 60 60
Static rundown screen Medium Low–medium Low Medium Low Nil 20 20
Vibrating screen Medium Low–medium Medium Medium Low Nil 10 20
Rotating screen Medium Low–medium Medium Medium Low Nil 10 15
Baleen filter screen Medium–high Low–medium to medium
Belt presses Medium–high Medium High High High Nil 10 20
Hydrocyclones Medium Low Low Low Low Coarse screen 25 25
Centrifuge/decanters High Medium to high High Low Medium Coarse screen 20 30
Dissolved air flotation High Medium to high Low Medium–high Medium–high Screen+polymer 70 70
Tangential flow separators
High High Low–medium Medium Medium Screw press 50 50
Note: A TS content of 3.1% is quite high for piggery effluent and represents a scenario where low flushing water volumes are used. A TS content of 1.2% is fairly typical for piggery effluent where high flushing water volumes are used. Generally, a larger amount of solids leads to a lower operating cost/ML of wastewater treated. Source: Based on Watts et al (2002).
b Operating costs - see Table 11.3
a Capital costs – see Table 11.2 TS = total solids
56
Table 11.2 Capital cost classifications for different types of solids separators
200-sow farrow-to-finish unit (2002 $) 2000-sow farrow-to-finish unit (2002 $)
Low < 5,000 < 20,000
Low-medium 5,000–20,000 20,000–35,000
Medium 20,000–40,000 35,000–75,000
Medium-high 40,000–60,000 75,000–150,000
High 60,000–256,000 150,000–404,500
Table 11.3 Operating cost classifications for different types of solids separators
200-sow farrow-to-finish unit (2002 $/ML)
2000-sow farrow-to-finish unit (2002 $/ML)
Total solids 3.1% Total solids 1.2% Total solids 3.1% Total solids 1.2%
Low 130–350 80–170 80–150 40–70
Low-medium 350–550 170—330 150–200 70–100
Medium 550–1000 330–760 200–300 100-270
High 1000–4070 760–1510 300–990 270–460
Note: Operating costs vary widely depending on a range of factors, particularly the total solid (TS) content of the effluent and the size of the operation. A TS content of 3.1% is quite high for piggery effluent and represents a scenario where low flushing water volumes are used. A TS content of 1.2% is fairly typical for piggery effluent where high flushing water volumes are used. Generally, a larger amount of solids leads to a lower operating cost/ML of wastewater treated.
11.2 Management of solids separators
Solids separation systems need regular checking and cleaning to maintain optimal performance. For example, screens should be scrubbed with a wire brush and washed occasionally with a high-pressure hose. The out-loading bay (if present) should be kept clean of excess solids.
The system and the solids storage areas should be located on a bunded, low-permeability area to prevent groundwater and surface water contamination. The maximum permeability should be 1 × 10⁻⁹ m/s for a depth of 300 mm comprising two 150 mm-deep layers. Captured rainwater, leachate or spillage from transport vehicles should be directed to an adequately-sized effluent or catchment pond.
For management of separated solids, see Section 13.
57
58
12 Effluent treatment systems
ffluent treatment systems aim mainly to reduce organic matter (volatile solids) in effluent. They may also reduce the nitrogen content of liquid effluent, mainly through ammonia
volatilisation losses, and produce a stabilised sludge. This section deals mainly with effluent ponds. However, alternative systems are available; the most appropriate treatment and use of by-product for each site should be assessed and used.
E
Factors to consider are:
effluent characteristics volume of effluent size of piggery end use of by-products availability of land for by-product use sensitivity of neighbouring environment (including proximity to potential receptors) climate topography soil characteristics groundwater vulnerability nutrient mass balance water balance future expansion plans state or territory regulatory requirements cost reliability maintenance requirement ease of use.
Treatment ponds are an integral part of effluent treatment at most piggeries that have conventional sheds. They are more convenient, simple and robust than most other treatment systems. The effluent produced is unsuitable for stream discharge and is usually used in land spreading or irrigation, providing a rich source of nutrients for the soil.
Environmental outcome
Effluent treatment systems that are designed, constructed and managed to effectively
reduce the volatile solids in effluent, without causing odour nuisance or adverse impacts
on water resources.
59
12.1 Design of effluent treatment ponds
12.1.1 General principles
When selecting the location of an effluent pond, consider the topography, soil type, gravity (for drainage), future expansion of piggery and ponds, cleaning of ponds, proximity to neighbours and public areas, prevailing winds, and the requirements of the local authority and other agencies.
The pond’s shape should assist content mixing. Round, square and rectangular ponds are all effective. The length to width ratio should not exceed two. Ponds with narrow side channels or with sections isolated from the main part of the pond have a reduced volume that can be effectively treated. Inlets and outlets should be positioned to prevent effluent short-circuiting, thus maximising retention time and treatment efficiency. Inlet pipes or channels should discharge into the pond beyond the toe of the pond wall, preferably at a number of points in large ponds.
Ponds need to be accessible for desludging (removing settled solids from the bottom) and maintenance. Bank tops 2.5–4 m wide allow access by vehicles for maintenance. Batters should be designed to maintain the pond integrity based on a soil stability assessment. Below the water level, side slopes should not exceed 1:2 (vertical:horizontal). For slopes that are to be mown, batter grades no steeper than 1:3 (vertical:horizontal) are required. Ideally, there should be no vegetation on the internal pond batters.
Adequate soil compaction and correct moisture content are required to produce a maximum design permeability of less than 1 × 10⁻⁹ m/s for a depth of 300 mm for ponds up to 2 m deep, or 450 mm for deeper ponds (compacted layers should not exceed a depth of 150 mm each). Ponds constructed using soils containing less than 20% clay will require sealing with liners made from imported clay, polyvinyl chloride or high-density polyethylene. For treatment and storage ponds, the base level (base of works) should always be at least 2 m above the water table.
Providing at least 500 mm freeboard allows the pond banks to contain wave action and prevents overtopping due to imperfections in the crest level. Freeboard should not be used for effluent storage. Consequently, the final pond in a series should be equipped with a spillway to avoid pond banks being eroded and breached during spill events that may accompany extreme wet conditions.
The pond system must be able to contain the effluent flowing in, plus rainfall and runoff during extended periods of wet weather, so that overtopping does not occur on average more than once every 10 years. Entry of clean stormwater runoff should be minimised by grading bank tops away from the pond. The ponds should only collect contaminated stormwater runoff, which should be minimised. The overtopping potential of a treatment pond system is most accurately assessed using a water balance model (for example, MEDLI) and long-term local climate data.
When designing a pond, consider future desludging operations. Smaller ponds may be more easily desludged, although desludging may need to be done more frequently. Equipment available for desludging may influence the size and shape of ponds. Consider how to manage and store the piggery effluent flow if a pond needs to be decommissioned during desludging. This may involve the construction of a temporary anaerobic pond beside the primary anaerobic pond. The wall of the primary pond could then be breached to release the supernatant into the temporary pond, while retaining the sludge layer in the primary pond. Alternatively, the supernatant can be pumped out before breaching the wall to release the sludge. However, in both cases, special care would need to be taken when reinstating the breached wall.
60
Operators should observe their responsibilities under workplace health and safety legislation for fencing and signs around ponds.
12.1.2 Anaerobic ponds
Most primary effluent treatment ponds are anaerobic, or lacking dissolved or free oxygen. Anaerobic bacteria within these ponds first convert VS to volatile organic acids, and then to low-odour methane and carbon dioxide. The second stage is pH dependent. Very high VS loading rates produce high concentrations of volatile organic acids that inhibit the methane formers, causing the release of odorous volatile organic acids. A by-product of anaerobic digestion is a stabilised sludge that accumulates at the bottom of the pond at a rate proportional to the amount of effluent treated.
When designing anaerobic ponds, there are three main aims. They are:
to keep odour emissions low by avoiding excessive organic loads that may produce offensive odours through incomplete organic matter stabilisation (although this may not be an issue where piggeries are isolated)
to allocate enough space for sludge storage between desludging
to ensure that supernatant from the pond can be removed and used as needed, and, if required, dilution water can be easily added.
Volume is the most important design criterion. The larger the pond per unit volume of added manure, the greater the amount of liquid and bacteria for effectively degrading the manure. Where the VS loading rate is too high, either because the supernatant volume of the pond is too low or because large amounts of VS are added infrequently, incomplete anaerobic digestion may produce strong odours. Anaerobic ponds are typically 2–8 m deep, but they rarely exceed about 5 m in depth due to practicalities of construction and resultant cost. A deeper pond generally has a smaller surface area for a given volume, which reduces the odour-emitting surface.
Large, deep anaerobic ponds may be expensive to build and difficult to desludge. One solution is to reduce the required pond capacity by planning for frequent, regular desludging (eg annually). An alternative is to design small, heavily loaded, and covered anaerobic ponds. Preliminary APL-funded research indicates that odour reductions of 75–90% may be possible when semipermeable pond covers are used. The same research found that an impermeable pond cover achieves a 100% reduction in odour emission.
Providing parallel anaerobic ponds enables temporary decommissioning of one pond to allow for desludging. Where ponds are used in parallel to process the effluent from a piggery, their capacities can be regarded as additive in assessing whether the required capacity is present. Ponds are often used in series to produce effluent with a lower concentration of organic matter for recycling through the piggery’s flushing system. However, where ponds operate in series, only the capacity of the first pond should be considered when assessing the primary treatment capacity. This is because the first pond receives the entire organic loading and most of the sludge will accumulate there.
Most design methods available today are variations of the Rational Design Standard method developed by Barth (1985). This method sizes ponds based on VS loading rates. The following variables influence the required pond capacity:
climate (in warmer climates biological activity is higher)
the interval (years) between sludge removals
61
effluent composition (TS and VS).
Table 12.1 provides suggested pond capacities for uncovered anaerobic ponds in different climates, with desludging frequencies and pre-treatment regimes based on the Rational Design Standard method. Alternative anaerobic pond design methods may be used if approved by state and territory regulators.
Table 12.1 Suggested anaerobic pond capacities for different climates, desludging frequencies and pre-treatment options
Effluent treatment and desludging frequency (m3/SPU)
Climate Desludging frequency
No pre-treatment Pre-treatmenta
Coolb Annually 4.6 3.5
5 yearly 6.0 4.6
10 yearly 7.7 5.9
Warmc Annually 3.5 2.7
5 yearly 4.9 3.8
10 yearly 6.6 5.1
Hotd Annually 2.9 2.2
5 yearly 4.3 3.3
10 yearly 6.0 4.6 SPU = standard pig unit a Assumes a screen that removes 20% of the TS and 25% of the VS (eg a stationary run-down screen). b The recommended maximum volatile solids loading rate for treatment capacity in a cool climate is 60 g VS/m3 pond capacity/day. Examples of localities with cool climates are Armidale, southern and central Victoria, southern South Australia, and Tasmania. c The recommended maximum volatile solids loading rate for treatment capacity in a warm climate is 80 g VS/m3 pond capacity/day. Examples of localities with warm climates are most of inland New South Wales, South East Queensland, South Australia and southern Western Australia. d The recommended maximum volatile solids loading rate for treatment capacity in a hot climate is 100 g VS m3 pond capacity/day. Examples of localities with hot climates are central to northern Queensland, Moree and Goondiwindi. TS = total solids; VS = volatile solids
12.1.3 Facultative ponds
Facultative ponds are aerobic near the surface and anaerobic at greater depths. They sometimes provide second-stage treatment after the anaerobic pond, improving effluent suitability for use in shed flushing or on land.
Facultative ponds are generally shallower than anaerobic ponds (2–3 m) and have a greater surface area to volume ratio. To keep the upper layer aerobic, a lower organic matter load is needed than for an anaerobic pond. The combination of anaerobic and facultative ponds produces better effluent quality.
62
12.1.4 Aerobic ponds
Aerobic ponds may provide polishing treatment, the final treatment stage before effluent is reused. Aerobic ponds digest organic matter using bacteria that need an abundant supply of oxygen. The oxygen in these ponds is supplied from the atmosphere and from algae in the water. Aerobic ponds are shallow (less than 1 m deep). They require low organic matter loading rates to prevent them from becoming facultative or anaerobic. Piggery effluent is usually too concentrated to allow for true oxygen-rich conditions, without mechanical aeration.
12.1.5 Wet weather ponds and evaporation ponds
Wet weather ponds provide emergency wet weather effluent storage. In cold climates, they also provide winter effluent storage for the months when rainfall exceeds evaporation. They may also store effluent before use, although effluent may be drawn from other ponds in the system for these purposes.
Evaporation ponds provide storage before the effluent is ‘disposed’ by evaporation. Solids remaining in the base of dry evaporation ponds need periodic removal. These may be difficult to deal with due to high salinity.
Wet weather ponds and evaporation ponds need to be sized so that overtopping happens no more than once every 10 years. In environmentally sensitive locations, designing ponds for less frequent overtopping may be warranted. Wet weather ponds may also need to store up to several months worth of effluent.
12.2 Management of effluent treatment ponds
Substances that may inhibit microbial activity, such as foreign material (afterbirth, veterinary equipment, plastic bags etc), toxic chemicals and oxidising agents, should be prevented from entering the effluent treatment pond.
The outer banks of the pond should be grassed to prevent weed infestation, cracking and erosion. Trees, shrubs and woody weeds should not be allowed to establish on pond banks. The grass should be kept short to facilitate regular inspections for signs of deterioration.
Regular primary pond desludging is essential, and is recommended when the sludge layer impinges on the volume that can be treated (usually between a half and two-thirds of the pond depth). The average sludge accumulation depth may be estimated by plunging a T-bar with a 0.3 m-wide ‘T’ into various sites within the pond, but a boat is needed to properly assess sludge deposition throughout the pond. When desludging, consider the size of the pond, the amount of sludge to be removed, proximity to neighbours, how long the extracted sludge will be stored for, where it will be stored, and what it will be used for. When sludge is stored for drying before use, the storage site will need to be properly compacted and bunded to prevent leachate from entering groundwater and surface waters (see Section 13 for further information on storage design).
Pond management usually involves removal of some of the water for use in irrigation. This also removes salts, helping to maintain salinity at an acceptable level. If a pond is not functioning efficiently, it may be necessary to use commercial additives. However, the use of these additives is not a substitute for correct design and management.
The pH of pond effluent should be in the 6.8–8.0 range, and total dissolved solids (TDS) should be monitored to maintain a suitable bacterial population in the pond. Ponds may need to be
63
diluted with fresh water to keep the salinity at an acceptable level. Also, the use of high-salinity effluent on land can cause salt accumulation in the soil, with detrimental effects on plant growth. Surface crusts can impede pond function. There should be no floating islands of vegetation. The presence of purple sulphur bacteria often indicates sound pond function.
Permeable pond covers can effectively control odour from anaerobic treatment ponds. Supported straw and polypropylene fabric covers reduce odour emission rates from these ponds by 75–90%. However, the long-term performance and life of the covers and potential disadvantages are yet to be verified (Hudson 2002).
12.3 Other effluent treatment systems
Other methods for treating effluent include one or more of the following:
artificial aeration
activated sludge
rotating biological contactors
trickling filters
constructed wetlands
biodigesters.
Some of these are discussed in more detail in references such as Kruger et al (1995) and Ryan and Payne (1989). They are not discussed here as they fit into one or more of the following categories:
they are in the experimental stage
they have not yet been proven in Australian piggeries
they are better suited for less concentrated effluent than is produced by piggeries
they are more suited to polishing low-nutrient effluent
they often require large capital expenditure and/or running costs (eg they require expert personnel for good operation)
they are relatively technologically complex and expensive to install and operate
they were primarily designed for treatment of municipal sewerage that is released to watercourses rather than being applied to land (where the nutrients and organic matter can be used effectively to promote plant growth).
64
13 Solid by-product storage and treatment areas
Carcases, spent bedding, separated solids and pond sludge may be stored, composted or treated before use. Carcase composting is covered in Section 15.1.
Environmental outcome
Solid by-product storage and treatment areas designed, constructed and managed to
minimise odour nuisance and adverse impacts on water resources.
13.1 Storing solid by-products
In most cases, solid by-products should only be stored or composted within earth bank- bunded areas with a maximum design permeability of 1 × 10⁻⁹ m/s for a depth of 300 mm comprising two layers each compacted to 150 mm. However, a risk assessment can be used to justify a lower design permeability standard. The depth to the water table from the excavated base elevation should exceed 2 m at all times. Drainage water or leachate from the solids storage area should be directed into the effluent treatment ponds or other collection ponds. Storage areas should be located where they are unlikely to cause complaints about odour. The size of the area needed to store or treat solid by-products is highly variable, depending on the size of the piggery, the type of by-product, the type of machinery used to handle the material, the material handling method, and the dimensions of piles or windrows. A storage area needs to be provided for general and contingency situations. Providing a storage area that can last for six months fits with cropping cycles.
Wet solid by-products may heat up and spontaneously combust. When blended with the solids, bulking agents such as straw, sawdust or rice hulls help to absorb some of the liquid, and raise the carbon to nitrogen ratio for better composting. Regularly turning wet solids also helps to manage heat build-up.
Drying pond sludge is a slow process. Regularly mixing or turning promotes full drying and helps to produce a manageable product.
13.2 Composting spent bedding, sludge and separated solids
Piggery by-products can be composted into a marketable soil amendment. Composted solids are more easily handled and more evenly spread than the raw constituents, and the nutrients are more readily available for uptake by plants. While composting can proceed in a simple stockpile, more intense management (turning and watering) accelerates the composting process. Turning may generate more odours compared to static pile storage, but it significantly reduces the potential for odour when the compost is spread. It is recommended that compost for retail sale should meet the Australian Standard for compost. Three Australian Standards relate to products containing composts:
65
AS 4454 — Composts, Soil Conditioners and Mulches (Standards Australia 2003)
AS 3743 — Potting Mixes (Standards Australia 2002a)
AS 4419 — Soils for Landscaping and Garden Use (Standards Australia 2002b).
The standards facilitate the sustainable recycling of organic materials, guaranteeing that the products are consistent in quality and safe to use. Australian Standard AS 4454–2003 details the practices required to consistently produce high-quality composts, soil conditioners and mulches.
Compost should only be produced within bunded areas with a maximum design permeability of 1 × 10⁻⁹ m/s for a depth of 300 mm, comprising two 150 mm-deep layers. The depth to the water table from base level should exceed 2 m at all times. Drainage water should be directed into the effluent treatment ponds or other collection ponds. The composting area should be located where it is unlikely to cause complaints about odour.
Composting is generally undertaken using windrows. Windrows are typically 1.5–4 m high, 2-3 m wide at the base and 1 m wide at the top. Sufficient space must be allowed for access to the piles or windrows for turning and watering.
The rate of composting is influenced by the amount of moisture, carbon to nitrogen ratio, aeration, and temperature. Moisture content of 40–50% provides enough water for microbial breakdown, while avoiding the anaerobic conditions that cause odour. Since a carbon to nitrogen ratio of 15–30:1 optimises microbial growth, straw, sawdust or other high-carbon materials often need to be added to sludge and separated solids. To keep the pile aerobic, oxygen can be supplied through the addition of bulking agents (eg straw or sawdust), or by pile turning. The ideal temperature range during the active phase is 55–65°C, so that weed seeds and pathogens are destroyed while the required microbial population survives. Provided the other conditions are achieved, the pile temperature will normally rise to the optimal range.
Under optimal conditions, active composting takes around eight weeks, and up to twice as long if management has been less intense. Composting is completed when wetting the pile does not raise the temperature to 55–65°C. A further four-week ‘curing’ period is required to further decompose some compounds and large particles in the compost. The finished product can then be spread on-site (see Section 14) or transported off-site for use or further refinement.
During the composting process, there will be significant loss of dry matter. More frequent turning accelerates the composting process, with increased nitrogen losses.
66
14 Areas of by-product use
The effluent and solid by-products of piggeries contain valuable plant nutrients and carbon that can be spread on farming land to improve soil fertility, structure and microbial activity. These nutrients should be incorporated into a crop, hay or silage production system to achieve a balance between the amount of nutrients applied and the amount removed. Since enclosures used for rotational outdoor piggeries are also areas where by-product is deposited, the same design principles apply.
Environmental outcome
Areas of by-product use designed and managed to benefit from the properties of
by-products while avoiding soil degradation, adverse community amenity impacts and
water contamination.
14.1 Methods for using effluent and solid by-products
Piggery effluent and solid by-products are typically distributed onto land by irrigation or spreading. In outdoor rotational piggeries, the nutrients are spread by pigs depositing their manure, and the by-products can be used both on-farm and off-farm. In both cases, the piggery owner has a duty of care to ensure that the by-products are used sustainably. In some states, the piggery operator is legally responsible for the sustainable off-site use of piggery by-products. Hence, it is recommended that piggery operators have a written agreement with any off-site users defining the type and quantity of by-products involved, and estimating the nutrient content of the by-products.
14.1.1 Selecting a suitable area for by-product use
Ideally, an area of by-product use should:
be suitable for pasture or crop production
comprise well-structured, non-rocky, non-saline and non-sodic loam to medium clay soil
not be located adjacent to a watercourse
not be prone to waterlogging
not flood more than once every five years
have slopes that promote infiltration, rather than runoff and erosion
be located at least 2 m above the shallowest water table
be sufficiently separated from neighbouring residences and other sensitive areas.
Areas that do not have these properties may require better design and more intense management to minimise the risk of environmental harm.
67
14.1.2 Land area needed for use of by-products
Piggery by-products are rich in nutrients. To best use these nutrients, it is necessary to determine or estimate the:
quantity of nutrients and salts in effluent and solid by-products
expected uptake of nutrients by harvest of plants growing on areas of by-product use
nutrient status of the soil
phosphorus storage capacity of the soil
expected nutrient (nitrogen) losses from volatilisation.
14.1.3 Concentration of nutrients and salts in piggery by-products
Tables 14.1 and 14.2 show typical data for the composition of piggery effluent and solids respectively, from conventional intensive piggeries. Table 14.3 provides data for spent bedding from deep litter systems. The wide variation in results reflects the range of design, management, diets, water use and climate. Thus ‘typical’ or ‘average’ composition data from pond supernatant (irrigation water) and pond sludge cannot be provided. Data in Table 14.1 are measured from the final pond, which would most often be used for drawing effluent for irrigation.
Table 14.1 Characteristics of piggery pond irrigation effluent
Element Unit Effluent at worka
DPI datab
average (range) DPI datab
average (range) Dry matter mg/L 3623 4458 (1240–12600) 7900 (1100–44300) Volatile solids mg/L 1809 1809 (220–4400) 1640 (480–5290) pH 8.0 8.0 (7.0–8.7) Total nitrogen or total Kjeldahl nitrogen {TKN}
mg/L {384} {654 (158–1731)} 584 (158–955)
Ammonium-nitrogen mg/L 249 490 (105–1288) 144 (25–243) Total phosphorus mg/L 44 55.9 (11.0–132.0) 69.7 (19.3–175.1) Ortho-phosphorus mg/L 28.5 27.0 (3.0–91.0) 16.3 (2.4–77.9) Potassium mg/L – 616 (97–1845) 491 (128–784) Sulphur – 22 (9–50) – SO4 mg/L – – 47.6 (13.3–87.2) Copper mg/L – – 0.09 (0.00–0.28) Iron mg/L – – 0.56 (0.09–1.61) Manganese mg/L – – 0.02 (0.00–0.05) Zinc mg/L – – 0.47 (0.16–1.27) Calcium mg/L – 18 (7–31) 20.6 (7.3–41.2) Magnesium mg/L – 33 (8–108) 25.0 (6.6–72.3) Sodium mg/L 603 603 (103–2870) 399 (41–1132) Chloride mg/L 810 810 (269–1950) 19.1 (3.6–34.4) Conductivity dS/m – 7.5 (2.2–14.7) 6.4 (2.5–11.7) DPI = Department of Primary Industries and Fisheries, Queensland, TKN = total Kjeldahl nitrogen a Kruger et al (1995) — samples from piggeries in New South Wales, Queensland and Western Australia. b Unpublished data — samples from 10 piggeries in southern Queensland.
68
Table 14.2 Characteristics of in situ piggery pond sludge
Unit Effluent at work (mg/L)a
DPI datab
average (range) DPI data b
average (range) Dry matter % wet
basis – 17 (6–34) 13 (6.9–17.1)
Volatile solids % wet basis
– – 6.9 (5.3–9.5)
pH 7.3 7.4 (7.1–8.0) – Carbon % – 12350 (850–20160) 28.4 (22.5–37.1) Total nitrogen or TKN mg/kg {2617} {4510 (1750–7120)} 3430 (2840–4020) Ammonium nitrogen mg/kg 1156 – 2532 (1472–4422) Total phosphorus mg/kg 1696 4720 (560–8640) 4710 (2830–5900) Ortho-phosphorus mg/kg 1082 – – Potassium mg/kg – 650 (130–2780) 750 (270–1330) Sulphur mg/kg – – 1990 (1530–3080) Copper mg/kg 25 81 (0–247) 1062 (343–1823) Iron mg/kg – – 1120 (520–2210) Manganese mg/kg – – 1035 (786–1389) Zinc mg/kg – – 3184 (2184–3698) Calcium mg/kg 2210 – 7120 (4280–10400) Magnesium mg/kg – – 1920 (1000–3190) Sodium mg/kg 108 – 530 (150–1400) Selenium mg/kg – – 0.47 (0.07–2.41) Chloride mg/kg 232 500 (180–1770) – Conductivity dS/m 8.5 11.4 (6.3–16.5) – DPI = Department of Primary Industries and Fisheries, Queensland; TKN = total Kjeldahl nitrogen a Kruger et al (1995) — samples from piggeries in New South Wales, Queensland and Western Australia. b Unpublished data — samples from 10 piggeries in southern Queensland. Table 14.3 Nutrient content of spent bedding
Content (% dry matter)
Total solids Nitrogen Phosphorus Potassium
Rice hull litter 42 1.56 0.96 1.30
Straw litter 74 1.30 1.30 1.80
Source: Bunge Meat Industries (2000)
For an operating piggery, the quantity of by-product and the concentration of its nutrients can be used to estimate the mass of any element. This is usually the best method to determine rates of applying the by-product, provided that representative samples are collected, and that the mass or volume applied is accurately known.
A method for estimating the nutrient load using mass balance principles is provided in Section 9.2. This method is the most suitable for proposed developments.
69
14.1.4 Application rates
The mass of nutrients applied by irrigation or spreading depends on the application rate and the nutrient content of the by-product. It is important to periodically analyse by-products to quantify the mass of nutrients applied. The results should be matched to the expected nutrient uptake by crops, plus nitrogen volatilisation losses and phosphorus storage.
Nitrogen volatilisation rates for irrigation depend on the application method, the proportion of ammonium nitrogen, and whether irrigation occurs during the day or at night. For effluent irrigation, spray methods may allow 20% of the nitrogen to be lost by volatilisation. Less nitrogen (approximately 10%) is lost when surface flow methods are used. Nitrogen volatilisation rates when solids are applied to land depend on the amount of pre-treatment (eg composting), and whether the solids are immediately incorporated.
From an environmental perspective, the high nutrient concentration of piggery effluent, rather than the hydraulic load, usually determines the application rate of by-product.
14.1.5 Expected nutrient removal by plant harvest
The type of crop grown on the area of by-product use determines the amount of nutrients removed through harvest, depending on the crop’s dry matter yield and nutrient content. Table 14.4 shows typical dry matter nutrient contents and expected yield ranges for a variety of pasture, silage, hay, grain and horticultural crops. The yields presented are for typical cropping soils.
70
Table 14.4 Nutrient content and anticipated dry matter yield of various crops
a Yields may vary from these ranges (refer to historical data for the region for more accurate estimates). b The grazed pasture example assumes a liveweight gain of 75–200 kg/ha/yr, with no ammonia volatilisation losses from the grazed animal’s manure. Sources: Reuter and Robinson (1997) and National Research Council (1984). Grazing removes only low levels of nutrients from areas of by-product use, since most nutrients are recycled in manure. Thus, grazing systems typically require at least five to ten times more area than systems using a removal process (eg cut and cart).
71
14.1.6 Calculating sustainable application rates
It is good agronomic practice to know the nutrient status of areas of by-product use. It is good environmental practice to know both the application rates and the nutrient removal and storage rates through crop harvest, soil phosphorus storage, nitrogen volatilisation and other acceptable losses. This information is essential to manage the area in a sustainable manner.
Mass balance is the recommended method for deciding the appropriate by-product application rate. A balance is needed between nutrient additions (by effluent, solid by-products and/or inorganic fertiliser applications) and removals (by crop harvest and acceptable losses —nitrogen volatilisation and salt leaching— or soil storage where soils are nutrient deficient).
The mass balance could be a desktop study (eg PigBal, MEDLI or Wastload) or could use physical measurements coupled with a desktop study. For example, the expected rates of nutrient removal by cropping, and the analysis of effluent or solids would determine the application rates.
In simple terms, a system is sustainable if nutrient removal by crop harvest or grazing matches the addition of nutrients. However, other factors such as expected losses and safe soil storage may be considered to modify this definition for use of piggery by-products. A suggested mass balance equation for areas of by-product use is:
To solve this equation, it is necessary to quantify expected losses and the capacity for safe phosphorus storage, and consider the management practices and the site’s natural resources.
Expected losses may include nitrogen volatilisation during and after application, and leaching — provided it does not exceed an acceptable level or degrade the groundwater source.
Soils have a varying capacity to temporarily adsorb and store phosphorus, from large amounts in ferosols (kraznozems) to very small amounts in sandy soils. If using phosphorus storage, consider it to be a temporary measure along with good agronomic practices such as spreading solids every few years, and building up soil nutrient concentrations. Soils have a finite capacity to store phosphorus, and sorbed phosphorus will eventually be desorbed and available for leaching if it is not taken up and removed in plant harvests. There are a number of methods to find the storage capacity of soils, including one in Redding (2003).
If phosphorus is applied in amounts exceeding removal rates, the following criteria apply:
the soils must be able to store phosphorus via methods such as those described in Redding (2003)
the soils should be used for crop and pasture production after application of by-products, to ensure that the applied phosphorus is removed before leaching occurs
the soil profile should have a depth of at least 50 cm.
Extensive grazing does not effectively remove nutrients. If this system is used, nutrients should be applied only at levels that improve the soil’s nutrient status. Otherwise, very low application rates should be used.
Nutrient availability should also be considered. Not all the nutrients in effluent and solids are available immediately for plant uptake and some may not become available for several years. There is merit in applying a mass of nutrients several times greater than plant uptake every few years rather than annually applying the amount required for the plant uptake (eg applying three
72
times the annual amount of nutrients required every three years). Thus, when applying organic fertilisers (manure and effluent), the mineralisation of organic components (nitrogen and phosphorus) needs to be sufficient so that there are enough available nutrients to meet crop demand. From an environmental sustainability perspective, this is where organic fertilisers may be superior to inorganic fertilisers, because not all of the nutrients are in a readily available form and at their most mobile (eg nitrate-nitrogen) immediately after application. They become available as the plant requires them and thus are less prone to loss from the system.
14.2 Intensive outdoor rotational piggeries
Dry sows, lactating sows, grower pigs and finisher pigs in outdoor units spread their manure by urinating and defecating about the paddocks. Because they may favour particular areas for dunging, nutrients may not be evenly spread. A sustainable rate of spreading nutrients depends on maintaining an adequate stocking density and a paddock rotation system. It is also important to maintain sufficient ground cover to minimise erosion.
Section 9.2.2 provides the approximate mass of nitrogen and phosphorus in the manure of different classes of pigs. Based on the generic data given in Table 9.1, the annual mass of nitrogen, phosphorus and potassium added by dry sows is likely to be about 13.9 kg/pig, 5.2 kg/pig and 3.7 kg/pig respectively.
The appropriate nitrogen, phosphorus and potassium application rates depend on the land use of the area, the rotational pattern (eg two years of pigs, two years of plant harvest) and the phosphorus sorption of the soil. For any given intensive outdoor rotational piggery, the appropriate nitrogen, phosphorus and potassium application rates need to be determined. These are then used to determine the stocking density corresponding to the applicable nitrogen, phosphorus and potassium application rates. The lowest of the three calculated stocking densities should be used.
14.3 Benefits of using by-products
Benefits of responsible by-product use include:
improved soil structure
improved rainfall infiltration
improved water-holding capacity of soil
improved soil fertility through increased cation exchange capacity and nutrient retention
reduced erosion rates
increased plant yields
reduced inorganic fertiliser costs.
14.4 Potential impacts of poor by-product use practices
Poor use of by-products can have an adverse effect on the air, soil, groundwater and surface water.
73
In the air, potential impacts are:
odour nuisance
dust generation.
To minimise the risk of these impacts, avoid spray irrigating under windy conditions or at night. High-pressure spray irrigators are unsuitable for effluent irrigation because they produce small droplets. Under windy conditions, the resulting aerosol drift can convey odour and pathogens over long distances. Avoid spreading very dry solids.
In soils, potential impacts are:
sodicity and increased soil dispersion, which is associated with structural decline, increased erosion risk, reduced workability and reduced soil permeability
increased soil salinity, which can affect which crops may be grown or crop yields
waterlogging, if very high hydraulic loads are used
elevated nitrate levels, which can cause toxic levels of nitrate in forage or reduced forage palatability
high phosphorus concentration in runoff once the surface soil becomes saturated with phosphorus.
Potential impacts to groundwater include:
elevated phosphorus levels if desorbed phosphorus is not used for plant growth and leaches through the soil profile
elevated nitrogen levels where nitrogen leaches through the soil before it can be used by plants, possibly because nitrogen is applied before crop establishment
increased salinity.
Potential impacts to surface water include:
algal blooms triggered by eutrophication, which can result from dissolution of nutrients in stormwater runoff or erosion of nutrient-rich soil to streams
nutrients entering surface water in situations where contaminated groundwater surfaces in the vicinity of streams.
These potential adverse impacts highlight the importance of careful use of by-products.
14.5 Recommended by-product use practices
Good by-product use practices minimise nutrient exports from reuse areas. The nutrients in by-products need spreading at sustainable rates. Application methods must promote even and controlled distribution. By-products must be spread at suitable times.
Weather is an important factor in reusing by-products. By considering the prevailing wind direction before spreading, odour impact can be reduced. Only irrigating effluent when the soil is unsaturated and it is not raining reduces the risk of runoff during or soon after application. High-pressure spray guns are unsuitable for effluent irrigation as they very finely disperse the effluent, allowing significantly greater drift than low-pressure systems.
74
Irrigation should not cause waterlogging or excess drainage below the plant root zone. Water balance modelling can be used to decide the appropriate short-term irrigation rate. If the nutrients in effluent are applied at sustainable rates (ie using smaller amounts of effluent frequently rather than using large volumes occasionally), waterlogging is not a problem. This method also helps to maximise nutrient uptake and minimise loss from leaching.
Where possible, by-products should be applied just before sowing, or when plants are actively growing, to maximise nutrient uptake and to minimise nutrient losses from leaching.
Surface irrigation methods only suit sites with an even grade, and must be designed and equipped to achieve uniform effluent applications. This often requires measures such as laser grading and the provision of properly designed flow control systems. These methods are unsuitable for sandy or sandy-loam soils, since effluent passes through these soils too quickly. They are also unsuitable for duplex soils with sandy or sandy-loam topsoil, as effluent passes through this layer more quickly than through the heavier subsoil, and then moves laterally over the subsoil layer.
14.6 Secondary control measures and reducing loss of nutrients
Sound spreading or irrigation practices reduce nutrient loss from areas of by-product use. These practices include using appropriate application rates and systems, and applying by-products at appropriate times (eg when plants are actively growing and taking up nutrients). Secondary control measures further reduce nutrient loss when the above practices are insufficient, and may include:
putting vegetative filter strips downhill of the area of by-product use
putting terminal ponds downhill of the area of by-product use
installing contour banks on sloping land
maintaining continuous ground cover
incorporating solid by-products into the soil.
These measures effectively reduce soil erosion and filter nutrients from runoff. However, control measures such as vegetative filter strips and terminal ponds should not be used as a ‘quick fix’ for poor practices. They provide secondary environmental protection to complement sustainable use practices based on mass balance principles and/or monitoring.
14.6.1 Vegetative filter strips
Vegetative filter strips are strips of dense grass between an area of by-product use and a protected area. Section 6.1 provides design details for these.
75
14.6.2 Terminal ponds
Terminal ponds located at the bottom of areas of by-product use should catch the first 12 mm of runoff from a paddock, which may have a higher nutrient concentration than runoff received later in a large storm. The principle is to trap a significant proportion of the dissolved and suspended nutrients in the runoff from the by-product use area. The stored runoff can then be re-irrigated. During storms producing greater than 12 mm of runoff, terminal ponds overflow through a properly designed spillway. However, they can still reduce nutrient export by slowing the flow velocity to enable some settling of suspended soil and organic matter particles. It is important to recycle runoff collected in terminal ponds back to the irrigation storage as soon as possible, to provide storage capacity for the collection of subsequent runoff.
In the past, terminal ponds were used to protect surface waters as a substitute for sound methods of by-product use. Except for flood irrigation systems (which require a terminal pond as part of good design), this does not reflect best management practice as it only provides secondary environmental protection.
14.6.3 Graded banks
Banks constructed along height contours on sloping areas reduce the velocity of runoff and hence erosion. They capture and redirect runoff from smaller areas of a paddock, preventing it from concentrating into larger streams that erode large volumes of soil. While these may effectively prevent the loss of nutrients attached to soil, they do not prevent the loss of nutrients dissolved in runoff.
14.6.4 Ground cover
Maintaining continuous ground cover either through a pasture-based system or through conservation tillage practices promotes infiltration of rainfall and reduces runoff, water velocity and soil movement. Again, this reduces nutrient removal due to soil erosion but may remove some dissolved nutrients.
14.6.5 Incorporation of solid by-products
Incorporating solid by-products reduces the nutrient concentration at the soil surface. This reduces nutrient losses by erosion or dissolution in stormwater runoff.
76
15 Carcase management
rom an environmental perspective, rendering and composting are the preferred methods of disposing of carcases (including stillborn piglets and afterbirth). Suitable alternatives may
include incineration or burial. Irrespective of the method chosen, dead pigs should be immediately removed from the access of other pigs, and disposed of within 24 hours of death.
F
Poor carcase management practices may contaminate groundwater and surface water, cause odour, spread infectious diseases, and attract vermin.
Environmental outcome
Carcase management practices that prevent groundwater and surface water
contamination, odour nuisance, spread of infectious diseases, and breeding of vermin.
15.1 Carcase composting
Well-managed carcase composting is an environmentally acceptable method, and has the advantage of producing a soil amendment. However, compost that contains carcases should not leave the site.
Carcase composting should be done within bunded areas with a maximum design permeability of 1 × 10⁻⁹ m/s for a depth of 300 mm comprising two 150 mm-deep layers. The depth to the water table from base ground level should exceed 2 m at all times. Any leachate or stormwater runoff caught within the composting area should be directed into the effluent treatment ponds or other collection ponds.
Carcases are generally composted in a series of bays, although windrows can be used. The bays can be excavated into the ground (similar to silage bunks), or formed using large hay bales on a prepared pad.
Sawdust is generally the best medium for composting carcases as it produces the ideal carbon to nitrogen ratio. However, used litter is also suitable. Before adding carcases, at least 300 mm of sawdust (or alternative carbon source) should be spread over the base of the bay to ensure that the first layer of carcases is surrounded by high-carbon material, and to absorb leachate. Carcases should then be layered over the floor of the bay, with 300 mm of sawdust covering each layer. Good sawdust coverage assists composting by adding a carbon source, and is essential for controlling odours and deterring feral animals from disturbing the pile. Large carcases need slitting before placing them in the compost pile to reduce the gasses that cause bloating, thus preventing bloated carcases rising out of the pit. When a carcase bay is full, a new one should be started. The carcases in the full bay are then allowed to decompose for around three months.
77
15.2 Rendering
Rendering is an excellent carcase management method because there is little risk of adverse environmental impacts. Rendered carcases can also provide saleable meat and bone meal. However, this method is only economically viable if there is a nearby rendering plant that is willing to receive the carcases.
A bunded area with a low permeability floor must be provided for storing carcases before dispatch. The floor may be concrete or soil compacted for a maximum design permeability of 1 × 10⁻⁹ m/s for a minimum depth of 300 mm comprising two layers each 150 mm thick. This area needs to be well separated from live pigs.
An agreement with the receiving company is needed to ensure regular (preferably daily) receipt of carcases. Similarly, a contingency plan is needed in the event of a failure to dispatch carcases.
15.3 Burial
Burial is a common method of disposing of carcases. However, it should only be used where rendering or composting is not feasible. It is not the preferred method because:
the carcases decompose slowly and need covering to avoid odour problems and scavenging by feral animals
burial pits fill quickly and continually need replacement
nutrients and bacteria can leach into and contaminate groundwater, particularly if there is shallow groundwater and inappropriate sealing of the bottom of the pits
stormwater runoff from pits can contaminate surface water
land can become contaminated.
To avoid these problems:
large carcases should be split to minimise bloating
the pit bases must be at least 2 m above the water table at all times
the pit bases must have a maximum design permeability of 1 × 10⁻⁹ m/s for a depth of 300 mm comprising two 150 mm-deep layers, or at least 300 mm of low-permeability material to minimise nutrient leaching
carcases need to be covered each day with at least 500 mm of soil or other suitable material to avoid scavenging by feral animals and to prevent odour
a further 500 mm of compacted clay soil should cover the filled pit
the pits need to be located within bunding to control runoff in and out of the pit.
An alternative to an earthen pit is an enclosed burial pit constructed from concrete, high-density polyethylene or fibreglass and fitted with a watertight lid.
78
15.4 Burning or incineration
While biologically the safest carcase management method, incineration is generally not ideal because:
it needs to be performed efficiently and effectively to ensure that it is complete, and to avoid complaints about odour and particulates (smoke)
it is not energy efficient and generates greenhouse gases
it is expensive
regulations of some state and territory government departments responsible for environmental protection and local council by-laws do not permit it.
Generally, the requirements are similar to those for clinical waste. The incinerators are either complex multi-chamber units or pyrolysis process types. They typically have a final chamber that operates at 1000ºC with a residence time of at least one second to incinerate the odorous gases that may result from the ignition of the carcase. The fuel and operating practices needed to ensure that combustion does not result in offensive odour mean that this is a specialised activity.
Burning of carcases in open fires is unacceptable, as it creates smoke and odour and is unlikely to maintain a sufficiently high temperature consistently. It is also a biosecurity hazard due to the potential for thermal updraughts to disperse biological matter. Correct burning or incineration is rarely feasible on-farm.
15.5 Mass carcase disposal
Effective responses to emergency disease outbreaks require effective planning. The options available for disposing of carcases after mass deaths depend on the cause of death and resource issues, including soil type and depth to groundwater. However, all piggery operators should identify a disposal site and have a contingency plan for managing the high death rates that may occur as part of a disease outbreak. AUSVETPLAN (1996) is a series of technical response plans for managing exotic disease outbreaks. State government veterinary officers have the main responsibility and resources to combat an exotic disease incursion or endemic disease outbreak. They should be contacted immediately if a disease outbreak is suspected.
If mass carcase disposal is needed, burial is often the preferred method as it is quick, cheap, relatively easily organised, and environmentally clean if properly conducted. If burial is to be used, a suitable site is needed. It should be readily accessible, well separated from sensitive areas (watercourses, bores, neighbours and public land) and be of a soil type that can be compacted for low permeability. The pits should be as deep as possible, while ensuring that the base is at least 2 m above the water table. The pit sides should be vertical. The pit width should not exceed the width of the equipment that will be used to fill the pit, since it is difficult to evenly distribute carcases in wider pits. The carcases must be covered with at least 2 m of soil, with further soil heaped over the pit as overfill. This helps to prevent carcases rising out of the pit as they bloat, filters odours, absorbs fluids released through decomposition, reduces the likelihood of feral animals exposing carcases (AUSVETPLAN 1996) and prevents ponding of water. Ongoing monitoring of mass burial sites may be needed.
For some diseases, incineration may be the preferred method. However, suitable incinerators are rarely likely to be available or readily accessible.
79
Composting is an option for some diseases, or if the deaths result from environmental conditions (eg heat stress). Composting of mass carcases uses the same principles as described in Section 15.1, with long windrows being used instead of small bays. Windrows should only be one pig depth per pile and 1–2 m wide at the base. The windrows need capping in the same manner as burial pits. When the temperature in the pile drops (after about 8–16 weeks), the windrow should be turned and recapped.
80
16 Environmental risk assessment
he purpose of an environmental risk assessment is to identify any actual or likely impacts that a piggery or proposed piggery development may pose to the environment. This
provides the basis for reducing impacts (or risks of impacts) through improved design, improved management or monitoring.
T
Environmental outcome
Identification of the actual or potential environmental impacts that a piggery or
piggery development may pose to the environment.
16.1 The environmental risk assessment process
An environmental risk assessment for a piggery should consider the vulnerability of site resources, the nutrient mass balance of the whole farm, and the design and management of the piggery. The assessment should then use sustainability indicators to decide if adverse environmental impacts are likely. The outcomes of the process are risk appraisals for:
soils of areas of by-product use
groundwater quality and availability
surface water quality and availability
community amenity
targeted environmental monitoring to measure sustainability
plans for any required design or management improvements.
The stages in an environmental risk assessment are summarised in Figure 16.1. A process for undertaking an environmental risk assessment is provided through completion of the APL ‘Environmental Management Plans for Piggeries’ workshop. An alternative process is provided in Appendix B. Other methods are also possible.
81
Risk assessment
Sustainability indicators or benchmarks
Review of design and management
Enterprise whole farm nutrient mass balance
Targeted itoring mon
Environmental improvements
Site assessment
Design and management
Figure 16.1 Stages in environmental risk assessment and risk management
The risk that a piggery poses to the environment depends upon the vulnerability of the natural resources or amenity, and on the standard of design or management of the operation. For instance, good design and management can protect a vulnerable resource, but with lower design and management standards an environmental impact is more likely. A high standard of management is no substitute for poor site selection, and serious implications can arise if high management standards are not maintained. Hence, if there are too many high-risk items for a piggery development, the site may unsuitable.
The environmental risk assessment process included in this section provides a tool for identifying environment areas where changes in the design and management of existing and proposed piggeries may be required. It is a subjective self-assessment tool that should never be used as a rigid and inflexible regulatory instrument.
16.2 Vulnerability ratings — natural resources
The first step in an environmental risk assessment is to rate the vulnerability of each of the major natural resources or amenities associated with the piggery, including:
soils of areas of by-product use (if using by-products on-farm)
groundwater quality and availability
surface water quality and availability
community amenity.
Information to assist in deciding vulnerability of resources and amenity is supplied in Appendix B. Since it is not possible to represent all situations that will occur on all farms, some discretion should be used when evaluating the site vulnerability using these tables. Documenting the reasons for the vulnerability ratings in the comments sections of the Appendix B tables enables more ready identification of required environmental improvement or monitoring later in the risk assessment process.
82
16.3 Risk ratings — piggery design and operation
The second step of the environmental risk assessment is to rate the risk of each of the major design and operation features of the piggery, including:
pig accommodation
nutrient content of the manure
the effluent collection system
the solids separation system
the effluent treatment system
solid by-product storage/treatment
carcase management
design and management of areas of by-product use
chemical storage and use.
Not all of the factors will be applicable to all enterprises. For example, not all piggeries will have a solids separation system. Where factors are irrelevant for a given situation, they do not require evaluation.
To assist in deciding the risk, tables containing some parameters applicable to each rating are supplied in Appendix B. Since it is not possible to represent all situations that will occur on all farms; it is necessary to use some discretion when evaluating the risk using these tables. Documenting the reasons for the risk ratings in the comments sections of the Appendix B tables enables more ready identification of required environmental improvement or monitoring later in the risk assessment process.
16.4 Overall risk rating
The third step in evaluating the likelihood of an environmental impact is assessment of the combined effect of resource vulnerability and the design and operation risk. The two-dimensional matrix supplied in Appendix B can be used for this step.
The overall risk can be used to help decide the action to be taken. A low overall rating would not trigger any action. A medium overall rating may trigger some action. A high overall rating would trigger some action. Actions may be environmental improvements or monitoring. It is necessary to examine the design and/or operation of the piggery to decide the most appropriate action. Examining the reasons for vulnerability and risk ratings listed in the applicable tables in Appendix B can assist in this matter. These National Environmental Guidelines for Piggeries specify appropriate design and management options. Section 17 provides recommendations for risk-based monitoring.
83
84
17 Monitoring and assessment of sustainability
nvironmental monitoring, including using sustainability indicators to interpret results, is critical to the overall environmental management of a piggery. It provides a mechanism to
assess the effectiveness of strategies chosen to minimise environmental harm. EIt is extremely difficult to develop tools for determining and demonstrating sustainability and indicators of sustainability that cover all situations. The tools for determining sustainability will probably overstate the likely environmental risk in some cases. Consequently, where a significant level of environmental risk or impact is identified, it is critical to confirm that this result is accurate through further investigation or action.
Environmental outcome
Identification of adverse environmental impacts through ongoing monitoring and
comparison of monitoring results with sustainability indicators, and assessment of the
effectiveness of management strategies.
17.1 Complaints
17.1.1 Community liaison
Open communication lines between neighbours, piggery owners and regulators can help to confirm complaints, and then identify and fix problems to minimise the impact of a piggery on neighbours. Establishing and maintaining lines of communication from the beginning is better than dealing with complaints as they occur. Good community liaison may include:
informing neighbours in advance of any unusual events or problems that may cause an unavoidable increase in odour, dust or noise, including practices to mitigate the problem, and the expected duration of the problem
participation and cooperation in dispute resolution
gathering relevant evidence, and identifying and implementing strategies to remedy the problem
informing the complainant of the outcome of any investigations and any actions taken to avoid future associated problems, and seeking feedback to ascertain if the problem has been resolved.
17.1.2 Handling complaints
The number of complaints received is one measure of the impact of the piggery on community amenity. While this measure is imperfect, it helps to identify when receptors perceive that the piggery is unreasonably affecting their enjoyment of life and property. Many community amenity impacts are closely related to weather conditions, so consider daily weather monitoring if complaints are ongoing. It can also help in assessing the validity of complaints.
85
Details should be recorded of any complaints received, results of investigations, and corrective actions. Surrounding residents should be encouraged to phone the piggery operator directly with complaints.
For large enterprises, or those that have a history of complaints, installation of an automatic weather station to continuously monitor wind direction and speed, along with other climatic conditions, is recommended. These data can be very useful for complaint validation.
17.1.3 Complaints register
Full details of complaints received, results of investigations into complaints, and corrective actions should be recorded in a ‘complaints register’. An example of a complaints register form is provided in Appendix C.
17.2 Soils
A risk assessment can be used to determine the likelihood of impacts on soil. Where the risk of soil-related impacts is low and at least three years of annual monitoring shows that the system is sustainable, soils from areas of by-product use should be monitored at least every three years. Nitrate-nitrogen should be monitored annually, as it moves quickly through the soil.
Where there is a medium risk of soil impacts and at least three years of monitoring data shows that the system is sustainable, it is suggested that soils from areas of by-product use should be sampled and analysed at least every two years, with annual nitrate-nitrogen monitoring. Effluent and solids used on-site should be analysed annually.
Where there is a high risk of soil impacts, annual soil monitoring is imperative. Effluent and solids used on-site should be analysed annually.
The recommended parameters for monitoring soil are in Table 17.1. Analysis results should be compared with the limits for sustainability indicators given in section 17.5.4, although those limits are triggers for further investigation only. Soils exceeding these trigger values do not necessarily confirm unsustainable by-product use. Tables 17.2 and 17.3 provide recommended monitoring parameters for effluent and solids, respectively.
86
Table 17.1 Recommended soil analysis parameters
Soil test parameter Depth (down profile)
Justification
pH Influences nutrient availability ECse (can measure EC1:5 and convert to ECse)a
0–10 cm 20–30 cm 50–60 cm OR base of root zone
Measure of soil salinity
Nitrate-nitrogen 0–10 cm 20–30 cm 50–60 cm OR base of root zone
Measure of nitrogen available for plant uptake
Available phosphorus (Colwell, Olsen, Bray or BSES) or lactate or calcium chloride or other
0–10 cm 50–60 cm OR base of root zoneb
Measure of phosphorus available for plant uptake
Phosphorus sorption capacity or phosphorus sorption index
0–60 cm OR 0–base of root zonec
Measure of the soils ability to safely store phosphorus - essential if applying more than plant uptake
Organic carbon 0–10 cm Influences soil structure and stability and consequently soil erosion
Exchangeable cations and CEC (calcium, sodium, potassium, magnesium)
0–10 cm 50–60 cm or base of root zone
Needed to calculate ESP, EKP and Ca:Mg, which have important implications for soil structure
EC = electrical conductivity; CEC = cation exchange capacity; ESP = exchangeable sodium percentage; EKP = exchangeable potassium percentage. a ECse levels in the top soil layers are not intended to be a direct sustainability indicator, but will provide useful agronomic information and provide a guide to soil salt movements. b Only check available P levels annually at 50–60 cm (ofr base of root zone) if a sandy soil, otherwise every five years. c Measurement of P sorption capacity to 60 cm or the base (or the root zone) is desirable before use and every five years after initial application. Note: Measuring chloride at 50–60 cm (or base of root zone) may also be warranted if further investigations or actions for salinity are required.
Test parameter Justification Total nitrogen or TKN Measure of nitrogen applied for mass balance
calculations Ammonium-nitrogen Measure of nitrogen available or potentially lost as
ammonia volatilisation Nitrate-nitrogen Measure of nitrogen immediately available for plant
uptake Total phosphorus Measure of phosphorus applied for mass balance
calculations Electrical conductivity and chloride Measure of effluent salinity SAR Measure of effluent sodicity
TKN = total Kjeldahl nitrogen; SAR = sodium absorption ratio
Table 17.3 Recommended solids analysis parameters
Test parameter Justification Dry matter To calculate nutrient applied Total nitrogen or TKN Measure of nitrogen applied for mass balance
calculations Ammonium nitrogen Measure of nitrogen available or potentially lost as
ammonia volatilisation Nitrate nitrogen Measure of nitrogen immediately available for plant
uptake Total phosphorus Measure of phosphorus applied for mass balance
calculations Organic carbon Influences soil stability Electrical conductivity and chloride Measure of solids salinity
TKN = total Kjeldahl nitrogen
Sustainability can be demonstrated through a mass balance including nutrient content of by-product from the piggery and nutrient removal through harvest of plant or animal products from the areas of by-product use. Inputs should be conservative to provide a margin of error. Accepted design tools, such as PigBal, MEDLI or Wastload, may be useful.
Alternatively, sustainability can be demonstrated through physical measurements. The mass of nutrients added to each area of by-product use is calculated by multiplying the measured quantity of effluent or solids applied by its nutrient content. The mass of nutrients removed is calculated by multiplying the measured yield of crop or animal products (eg weight gain, milk, wool) by the nutrient content of the product grown. For the system to be sustainable, the mass of nutrients removed from each area should equal or exceed that added to each area plus sustainable phosphorus storage.
17.3 Surface water
Monitoring of surface water quality may involve analysis of watercourses and other water bodies, or sampling and analysis of effluent spills or stormwater runoff. This monitoring requires sophisticated equipment and trained operators to achieve meaningful results. It is also rarely relevant to piggeries, because they are not a direct discharge industry and they generally use by-products on land. Hence, it is not generally suggested as a routine measure of sustainability.
88
However, in specific high-risk situations a risk assessment may identify the need for analysis of stormwater runoff from areas of by-product use.
Operators should protect surface waters through good design and management. Secondary measures such as buffers, vegetative filter strips or terminal ponds can provide additional protection. Effluent spills that may contaminate surface waters can be avoided by regularly checking the water level of effluent treatment ponds and irrigation. Sound management of by-product application rates coupled with ongoing soil monitoring also helps to prevent surface water contamination through soil erosion or nutrient dissolution in runoff.
17.4 Groundwater
Groundwater quality monitoring is essential for facilities posing a high risk to groundwater, such as those that have inadequate sealing of flooring, drains, ponds or by-product storage areas. For areas of by-product use, soil monitoring usually provides an earlier detection system, enabling correction. However, groundwater monitoring may be warranted to detect nutrient leaching from piggery facilities at vulnerable sites, or where facility design is likely to allow leaching.
Ideally, groundwater monitoring would include sampling and analysis from bores up-gradient and down-gradient from the piggery and/or areas of by-product use. Electrical conductivity and nitrate-nitrogen levels should be determined. On very sandy soils, total phosphorus should also be measured. Monitoring is not required if the facility poses a lower risk to groundwater, such as those that have good sealing of areas used to transport, treat or store by-product.
Knowledge of the hydrogeology of the site is important in planning a groundwater monitoring program. The formation, depth, direction of flow and connectivity of groundwater aquifers underlying the site determine whether there is any value in monitoring groundwater in the first place. They also provide an indication of where any piezometers should be located to provide meaningful data.
Appendix D provides detailed sampling protocols and methodology for surface water, groundwater, soils, effluent, solid by-products and plants.
17.5 Sustainability indicators
This section includes the sustainability indicators that provide the best practical and objective measures of sustainability. In most cases they should provide a good tool for sustainability assessment. However, non-compliance with the standards associated with the indicators does not necessarily mean that the system is unsustainable. In such instances, piggery operators should examine the situation more closely to determine whether alternative indicators are more appropriate to demonstrate sustainability.
17.5.1 Community amenity impacts
The rate of complaints received cannot be used as a sustainability indicator, as it is an imprecise measure of community amenity impact. However, any complaint should be taken seriously by the piggery operator, and should be recorded and properly investigated. An example complaints register form is in Appendix C.
At least monthly, the number of stock in each pig class should be recorded to ensure that the licensed capacity of the piggery is not being exceeded. The details of any unusually high mortality rates should be recorded.
89
17.5.2 Surface water impacts
Since surface water quality monitoring is generally not a relevant measure of sustainability, no indicators are suggested. However, piggery operators should regularly inspect surface waters for algal blooms (such as blue-green algae) that are associated with raised phosphorus and nitrogen levels. Any blooms should be reported to the relevant authority.
Use of surface water should not exceed any allocations set by appropriate government authorities. Another sustainability indicator is the adoption of water-saving strategies that reduce overall water consumption, while still maintaining the production and hygiene standards of the piggery.
17.5.3 Groundwater impacts
In many piggeries, groundwater monitoring is of little practical value because of the particular hydrogeology of the site. However, at sites with suitable hydrogeological conditions, where groundwater monitoring results are likely to be relevant and meaningful, a piggery may be considered sustainable if water sampled from bores down-gradient of the piggery does not indicate contamination by piggery effluent. Contamination is indicated if electrical conductivity, nitrate-nitrogen and total phosphorus levels are higher than in the water sampled from up-gradient bores. However, it is often difficult to conclusively identify the source of contamination, and careful interpretation of groundwater monitoring results is needed since other on-farm or off-farm activities not associated with the piggery may influence results.
17.5.4 Soils of areas of by-product use
This section and tables 17.4–17.9 provide suggested trigger values to assist in deciding if nutrients and salts are being applied sustainably to the soils in areas of by-product use. However, soil properties vary widely and these suggested trigger values are not always the most appropriate measures of sustainability. For this reason, they should be regarded as triggers only for further investigation, such as comparison against background data. The ideal site from which to collect background data would be close to the area of interest, and would have similar soil and land use to the area of by-product use, but would not have received piggery effluent or solid by-products. However, areas that have received heavy fertiliser applications or that have been degraded over time will have different properties compared to their virgin state. It may be necessary to analyse soils from multiple background sites or to use local land and soil management references to interpret results for both background and sites of by-product use. Comparison with historical data and trend analysis may also be useful.
Nitrogen
Nitrate-nitrogen is extremely mobile and readily leached. Consequently, high nitrate-nitrogen levels in the subsoil pose a risk to groundwater.
Subsoil nitrate-nitrogen concentrations exceeding a soil solution concentration of 10 mg NO3N/L may produce some nitrogen leaching losses. This concentration is based on the drinking water standard contained in the Australian Drinking Water Guidelines (National Health and Medical Research Council and Agriculture and Resource Management Council of Australia and New Zealand 1996). Those guidelines state that the nitrate concentration should not exceed 50 mg/L in water used for human consumption (a nitrate-nitrogen concentration of 10 mg/L approximates a nitrate concentration of 50 mg/L).
90
Applying a drinking water quality standard is likely to be too stringent in many cases. Also, this limit is commonly exceeded in normal agricultural soils. When assessing the sustainability of a practice based on nitrogen levels, consider a number of factors, including:
the value or use of surrounding groundwater resources (human consumption, animal consumption, irrigation etc)
the depth to groundwater
the soil type overlying the groundwater (eg clay)
baseline nitrate-nitrogen levels in the soil below the active root zone.
The root zone depth depends on the crop type, soil depth, climate and whether the crop is irrigated. In some cases the active root zone depth may be 1.5–2.0 m or even deeper (eg dryland lucerne). Thus, sampling below the root zone may not always be practically and economically feasible. Sampling to a depth of at least 60 cm is recommended, although deeper sampling (to the base of the root zone) may be required if there are concerns about nitrate leaching.
For different soil types, Skerman (2000) calculated nitrate-nitrogen concentrations equivalent to 10 mg/L of nitrate-nitrogen in soil solution (Table 17.4). This trigger value applies at a depth of 60 cm, or at the base of the root zone. However, soil nitrate-nitrogen concentrations both in areas of by-product use and conventional cropping systems using inorganic fertiliser often exceed those shown in Table 17.4. A nitrate-nitrogen root-zone concentration of 20–50 mg/kg generally provides enough nitrogen for cereal cropping and intensive grazing. The highest nitrate-nitrogen concentration given in Table 17.4 is 4.5 mg/kg. Hence, depending on soil type, nitrate-nitrogen concentrations ranging from 1.2 mg NO3N to 4.5 mg NO3N at the base of the root zone would trigger further investigation. This concentration in the root zone is considered very low for crop production.
Table 17.4 Nitrate-nitrogen concentrations corresponding to a soil solution nitrate-nitrogen concentration of 10 mg/L at field capacity
Soil texture Soil gravimetric moisture content at field capacity
(g water / g soil)
Limiting soil nitrate-nitrogen concentration
(mg NO3 N / kg soil) Sand 0.12 1.2
Sandy-loam 0.15 1.5
Loam 0.17 1.7
Clay-loam 0.20 2.0
Light clay 0.25 2.5
Medium clay 0.35 3.5
Self-mulching clay 0.45 4.5
Nitrate-nitrogen levels throughout the soil profile provide an indication of nitrogen availability for crop growth and sustainability. Once nitrate-nitrogen moves below the plant root zone, it is no longer available for plant uptake, but can leach into groundwaters. A nitrate-nitrogen limit of 10 mg/L below the active root zone is a trigger for further investigation or action. Compare the results with those for background sites. Alternatively, comparison with historical data and trend analysis may be useful. If the nitrate-nitrogen concentration below the active root zone shows signs of build-up over time, review the use of by-product. Comparing nitrate-nitrogen
91
monitoring results against baseline data provides a measure of the nitrogen sustainability of an area.
Other matters to consider when determining nitrogen sustainability include the risk of nitrate moving off-site in surface water and groundwater, the quality of the groundwater, and the amount of deep drainage through the soils. These need evaluation as part of the risk assessment of the area of by-product use.
Phosphorus
Most phosphorus is lost through erosion of soil particles or through dissolution of soluble phosphorus in runoff from manure or soil with a high surface phosphorus concentration. Macropore flow (leakage down cracks in the soil) also causes phosphorus loss below the plant root zone. Leaching can occur when the soil is heavily overloaded with phosphorus and/or when applied phosphorus is not being removed from an area of by-product use.
Tables 17.5–17.8 give acceptable values of phosphorus concentrations in surface soil for various extractable phosphorus tests. These values can provide guidance on concentrations that will meet plant requirements without resulting in significant leaching. Generally, a bicarbonate extraction is the most appropriate (Colwell or Olsen, tables 17.5 and 17.6 respectively), but for very acid soil an acid extraction (Bray or BSES, tables 17.7 and 17.8 respectively) may be better. It should be noted that these limits are commonly exceeded in normal agricultural soils. Thus, they should be used as triggers for further investigation (such as comparison against results from background sites) if there are doubts about sustainability. Alternatively, comparison with historical data and trend analysis may be useful.
Table 17.5 Suggested trigger levels for investigation for phosphorus in topsoil
Clay content PH Colwell phosphorus (mg/kg)
< 30% < 7 31
< 30% > 7 59
> 30% < 7 75
> 30% > 7 85 Notes: 1. These levels do not apply to some soils, eg black vertosols, or to high-productivity systems. 2. Under highly productive agricultural systems, these levels are commonly exceeded. Hence, they should be regarded only as trigger values for further investigation or action. Source: Skerman (2000)
Table 17.6 Rankings for Olsen phosphorus in topsoil (mg/kg)
Very low Moderate High
<12 12–25 >25 Notes: 1. The ranking of high (>25 mg/kg) could be considered a trigger level for further investigation or action. 2. Under highly productive agricultural systems, the ‘high’ levels are commonly exceeded. Hence, they should be regarded only as trigger values for further investigation or action.
92
The New South Wales (NSW) Department of Infrastructure Planning and Natural Resources, Soil and Land Information System database ranks various chemical test results for NSW soil tests, including Bray P (Table 17.7). The high ranking of 20–25 mg/kg Bray P in the surface soil is a guideline trigger for further investigation or action. This further investigation could include comparison against analysis results for a background site.
Table 17.7 Rankings for Bray phosphorus (mg/kg)
Very low Low Moderate High Very high
<5 5–10 10–20 20–25 >25 Note: Under highly productive agricultural systems, the ‘high’ and ‘very high’ levels are commonly exceeded. Hence, they should be regarded only as trigger values for further investigation or action.
Redding (pers comm, 2002) developed limits of available phosphorus in the surface soil for the BSES method, based on the same principles as the limits for Colwell (mean + one standard deviation), depending on the level of clay. These are shown in Table 17.8. These numbers are derived from a relatively small data set and may need refining when more data are available.
> 30% 59 72 131 Note: Under highly productive agricultural systems, these levels are commonly exceeded. Hence, they should be regarded only as trigger values for further investigation or action.
To investigate the possibility of phosphorus leaching, particularly with sandy soils, measurement of available phosphorus levels at 50–60 cm (or the base of the root zone) is also suggested.
Soils vary in their capacity to temporarily absorb and store phosphorus. If phosphorus storage is to be used, it should be regarded as a temporary measure. Both good agronomic practices and good use of by-product are needed (see Section 14.1.6).
Burkitt et al (2002) developed a test to improve the accuracy of phosphorus fertiliser recommendations. The phosphorus buffer capacity (PBC) can be estimated by measuring the amount of phosphorus (mg P/kg) sorbed following the addition of one or two known concentrations of phosphorus (mg/L). It can also be calculated from the Freundlich parameters (a and b):
PBC (mg P/kg) = a (0.35b–0.25b)
Table 17.9 shows the likely range of PBC for various phosphorus sorption capacities from the study of Burkitt et al (2002).
93
Table 17.9 Phosphorus sorption capacity classifications for phosphorus buffer capacity
Potassium is often calculated to be the limiting nutrient for many cropping systems that use piggery effluent. Since salinity would generally cause environmental problems before potassium on its own, it is rarely considered when sizing sustainable areas of by-product use. However, if present in high concentrations the resulting cation imbalance may induce dispersion, which may cause soil structural decline. Also, high exchangeable potassium levels relative to exchangeable magnesium levels may induce hypomagnesia (grass tetany) in grazing ruminants. Hence, it is recommended that by-products should only be spread at very low rates on grazed pastures.
Salts
Areas of by-product use should not show increases in soil salinity that will adversely impact on the productivity of the land over the long term. Pronounced increases in soil salinity may result from additions of effluent or solid by-products, particularly in the topsoil layer. However, these increases need to be offset by leaching losses to ensure no consistent and significant increase in soil salinity in the subsoil layers. In dry years in particular, leaching rates will decline and it will take longer for salt removal to occur. Soils with an electrical conductivity (ECse) of up to 1.9 dS/m fall into the ‘very low’ to ‘low’ salinity rating. Thereafter, any increase in ECse of 2.5 dS/m would shift the soil salinity rating by less than one salinity class. Consequently, a trigger for further investigation or action is considered to be any ECse increase of 2.5 dS/m compared with similar soil sampled from background sites and any result that places the salinity rating at ‘medium’ or higher. Soil ECse should be determined at a depth of 50–60 cm (or base of root zone). Alternatively, comparison with historical data and trend analysis may be useful.
Soil sampling should occur at the end of the main growing season. ECse at the base of the root zone would act as a sustainability indicator, but surface and upper subsoil levels should also be monitored for agronomic purposes and to monitor salt movements through the soil profile.
If further investigation or actions are warranted, the soil sodium (Na+) and chloride (Cl-) concentrations throughout the profile should be measured in both the areas of by-product use and the background sites, since sodium chloride is the main salt of interest from a soil degradation perspective. The soil Na+ and Cl- concentrations of the soil should be less than 150% of background levels.
94
Sodicity
Sodicity is important in effluent-use schemes because of the relatively high sodium content of the effluent and the adverse effects of sodicity on soil structure.
The primary sustainability indicator for sodicity is the exchangeable sodium percentage (ESP) measured at depths of 0–10 cm and 50–60 cm (or base of root zone). ESP is defined as the percentage of a soil’s cation exchange capacity occupied by sodium. A trigger for further investigation or action is a soil ESP exceeding 6%, in which case comparison with the soils of a background site is necessary. Alternatively, comparison with historical data and trend analysis may be appropriate. An ESP level exceeding 150% of background (eg from 6% to more than 9%) in any soil layer is considered unsustainable. It is acknowledged that soil with an ESP exceeding 6% is not necessarily dispersive, particularly if the soil is saline. However, non-dispersive saline soils with a high ESP can become dispersive if the soil salinity declines in the future. For example, during high rainfall, salinity may fall more rapidly than sodicity through increased drainage of the more soluble salts. Declines in soil salinity through drainage may also be more rapid than falls in sodicity after effluent is no longer used. Both these scenarios can lead to soil dispersion. Consequently, calcium application is recommended where the soil ESP exceeds 6%, and strongly recommended where it exceeds 9%.
Applying calcium to the soil in the form of high-quality gypsum or lime helps to displace sodium ions from the clay particles, making them available for leaching below the root zone. Consequently, an ESP level of 6% warrants gypsum or lime application to amend the sodium imbalance. This is strongly recommended where the ESP has risen to 9%. For neutral to acidic sodic soils (ESP = 6–15%), apply 2.5 t/ha of gypsum. Gypsum is less effective for alkaline soils, so a gypsum application rate of 5 t/ha is recommended for sodic alkaline soils. For highly sodic soils (ESP exceeding 15%), apply gypsum at 5 t/ha. For highly sodic, alkaline soils, consider planting acidifying legumes. If highly sodic alkaline soils are fully irrigated, gypsum application rates of up to 10 t/ha may be more appropriate (Rengasamy and Bourne 1997).
Soil pH
Soil pH influences the availability of some nutrients. Ideally, the pH throughout the profile should be within the 5-8 range (1:5 soil:water). Soil pH may inhibit the availability of desirable nutrients to plants, or may increase the availability of toxic elements. The application of lime will raise the pH. It is rarely economical to lower the pH of alkaline soils.
95
96
18 Environmental management plans
Environmental outcome
A system enabling the piggery to be managed in an environmentally sustainable
manner, including processes for continual review and improvement.
n environmental management plan (EMP) is a formal commitment that all reasonable and practical efforts will be made to operate a piggery in an environmentally sustainable
manner. While an EMP is not always mandatory, it is strongly recommended for all piggeries and provides evidence that the operator is committed to pig production in an environmentally sustainable manner. An EMP provides a system for documenting:
A
the environmental risks of a piggery (through an assessment of resource vulnerability, the standard of design and management, and the interaction of these two areas)
how these risks will be minimised (by design or management)
measurement of the effectiveness of these strategies (by monitoring)
how monitoring results will be reported
actions that will reduce risk.
The EMP allows for dynamic, adaptive management and should focus on continuous improvement. It allows variations from the guidelines, and includes the monitoring and feedback loops that provide assurances that environmental impact can be detected and resolved. Proactive and genuine handling of complaints is an integral component of the monitoring and feedback loops.
An EMP typically includes:
identification and contact details
a brief description of the piggery
a commitment that the piggery will be operated in an environmentally sustainable manner
identification of applicable consents, approvals and/or licences to operate the piggery
details of the natural and social resources of the property and the surrounding area
description of the design and management of the piggery
identification of the environmentally vulnerable areas on-farm or in the surrounding area
identification of the resources to be monitored
a listing of contingency plans or emergency strategies
details of any environmental training already undertaken by staff, and any areas where training would be beneficial
identification of the need for periodic review of the EMP to ensure that any changes in regulatory requirements, the operation of the piggery, the environment, the design or management of the piggery, and associated changes in environmental risk are reflected in the plan.
97
Environmentally vulnerable areas would be identified by examination of natural and social resources and looking at how the design and management of the piggery interact with these resources. Identification of an environmental risk may trigger regular monitoring of the natural resource involved. Alternatively, it may prompt changes in the design or management of the piggery to reduce environmental risk. Any proposed changes could form part of a separate program of environmental improvement.
APL has funded the development of several pig industry environmental training packages, including a workshop that piggery operators can use to develop their own EMP (although other EMP formats are acceptable). Further information about APL environmental training materials can be obtained by telephoning 1800 789 099.
98
19 Chemical storage and handling
Environmental outcome
Chemicals are stored and used in ways that protect the community, water resources
and soils.
ach state and territory has its own legislation and mandatory requirements for chemical storage and handling. Factors to consider in reducing environmental problems include: E
minimising the storage and use of chemicals
storing and handling disinfectants and other chemicals correctly, to avoid spills
storing and using chemicals, veterinary chemicals and fuels in accordance with workplace health and safety codes of practice
using agricultural chemicals, drugs, antibiotics, vaccines and disinfectants that are registered for the intended purpose
using agricultural chemicals, drugs, antibiotics, vaccines and disinfectants in strict accordance with label directions or a prescription issued by a qualified veterinarian
selecting chemicals with low toxicity and low water contamination potential where possible
having an emergency response plan in place in case of a chemical spill
having Material Safety Data Sheets for all chemicals stored and used
avoiding spray drift when using farm chemicals, by using well-maintained equipment and avoiding application during windy weather
maintaining records of pesticide use
training staff in the safe use and handling of chemicals, including veterinary chemicals
disposing of empty drums or packaging in accordance with the manufacturer’s instructions
disposing of sharps properly to ensure staff safety (sharps should never be allowed to enter the effluent system).
99
100
20 Greenhouse gases
he pig industry is a relatively small contributor to the overall National Greenhouse Gas Inventory, contributing about 1.2% of non-carbon dioxide emissions. These emissions
comprise methane and nitrous oxide, with the majority contributed by the anaerobic treatment of manure.
T
Intensive piggeries face National Pollutant Inventory (2000) reporting responsibilities if they emit over 10 t/yr ammonia, or for emissions to air associated with biogas, natural gas, diesel or LPG combustion exceeding 400 t/yr or 1 t/hr. A piggery capacity of 1500–1600 SPUs is likely to trigger responsibilities for reporting ammonia.
Greenhouse gas audits and methods for reducing emissions may need to accompany proposals for piggery developments in some states and territories (eg Victoria).
Improved feed conversion reduces greenhouse emissions and generally provides economic advantages. Pond covers significantly reduce emissions. Direct application of by-products to land also offers significant reductions in greenhouse gas emissions compared with traditional anaerobic pond treatment systems. However, this may not always be feasible because of the potential for increased impacts on waterways. An alternative is to use an anaerobic digester, although this requires significant capital investment.
APL has recently developed an environmental strategy that includes greenhouse gases. Reducing the amount of greenhouse gas released has potential marketing advantages through conforming to an image that is clean, green and greenhouse friendly.
101
102
References
AUSVETPLAN (1996). Operational Procedures Manual: Disposal. Agriculture and Resource Management Council of Australia and New Zealand, Canberra.
Barth CL (1985). Livestock Waste Characterisation — a New Approach. In: Agricultural Waste Utilisation and Management (Proceedings of the 5th International Symposium of the American Society of Agricultural Engineers, St Joseph, Michigan: 286–294.
Bunge Meat Industries (2000). Agronomic Value for Broadacre Crops of Deep Litter from Pig Sheds, Pig Research and Development Corporation Report BMI 13/1228, Pig Research and Development Corporation, Canberra.
Burkitt LL, Moody PW, Gourley CJP and Hannah MC (2002). A Simple Phosphorus Buffering Index for Australian Soils. Australian Journal of Soil Research 40:497–513.
Casey KD, McGahan EJ, Atzeni MA, Gardner EA and Frizzo R (2000). PigBal: A Nutrient Mass Balance Model for Intensive Piggeries, Version 2.14. Department of Primary Industries and Fisheries — Queensland.
Clarke TJ (2003) Wastload: An Excel Model, Version 1. PIRSA Rural Solutions: Feedlot and Dairy, Clare.
CRC for Waste Management and Pollution Control Ltd, Department of Natural Resources, Mines and Energy — Queensland, Department of Primary Industries and Fisheries — Queensland (1995). MEDLI Model for Effluent Disposal Using Land Irrigation, Version 1.11. CRC for Waste Management and Pollution Control Ltd, Department of Natural Resources, Mines and Energy (Queensland), Department of Primary Industries and Fisheries — Queensland.
Hudson N (2002). Pond Covers: the Solution to Reduce Anaerobic Pond Odours? Pig Pen, Issue 30. Department of Primary Industries and Fisheries — Queensland. Accessed through http://www.dpi.qld.gov.au/pigpen/11426.html.
Kruger I, Taylor G and Ferrier M (1995). Effluent at Work. NSW Agriculture, Tamworth.
National Health and Medical Research Council and Agricultural and Resource Management Council of Australia and New Zealand (1996). Australian Drinking Water Guidelines. National Health and Medical Research Council and Agricultural and Resource Management Council of Australia and New Zealand, Canberra.
National Pollutant Inventory (2000). Emission Estimation Technique Manual for Intensive Livestock — Pig Farming, Version 1.1. Environment Australia, Canberra.
National Research Council (1984). Nutrient Requirements of Beef Cattle, 6th revised edition. National Academy Press, Washington DC.
Payne H (2000). Review of Alternative Housing Systems for Pigs — Part B, Pig Research and Development Corporation Report DAW41: Project 1465. Pig Research and Development Corporation, Canberra.
Redding MR (2003). Improving the Calculation of Appropriate Piggery Effluent Application Rates to Control Phosphorus Availability — Draft Only. APL Project DAQ 65/1475.
103
Rengasamy P and Bourne J (1997). Managing Sodic, Acidic and Saline Soils. Cooperative Research Centre for Soil and Land Management, Glen Osmond.
Reuter DJ and Robinson JB (eds) (1997). Plant Analysis — An Interpretation Manual. CSIRO Publishing, Collingwood.
Ryan PN and Payne RW (1989). Environmental Management Guidelines for Animal Based Industries and Piggeries. Miscellaneous Publication No. 23/89. Western Australia Department of Agriculture. Perth.
Schiffman SS, Miller EAS, Suggs MS and Graham BG (1995) The effect of environmental odours emanating from commercial swine operations on the mood of nearby residents. Brain Research Bulletin 37(4):369–375.
Schiffman SS, Walker JM, Small R and Millner PD (1998). Workshop on health effects of odours. Animal Production Systems and the Environment, an International Conference on Odor, Water Quality, Nutrient Management and Socioeconomic Issues, Des Moines, Iowa, 1:407–411.
Skerman A (2000). Reference Manual for the Establishment and Operation of Beef Cattle Feedlots in Queensland. Information Series QI99070. Queensland Cattle Feedlot Advisory Committee, Department of Primary Industries and Fisheries — Queensland.
Standards Australia (2002a). AS 3743 — Potting Mixes. Standards Association of Australia, Homebush.
Standards Australia (2002b). AS 4419 — Soils for Landscaping and Garden Use. Standards Association of Australia, Homebush.
Standards Australia (2003). AS 4454 — Composts, Soil Conditioners and Mulches. Standards Association of Australia, Homebush.
Standing Committee on Agriculture and Resource Management (1998). Model Code of Practice for the Welfare of Animals: Pigs, 2nd edition. SCARM Report No. 66, CSIRO Publishing, Collingwood.
Watts PJ, Tucker RW, Pittaway PA, McGahan EJ, Kruger IR and Lott SC (2002). Low Cost Alternatives for Reducing Odour Generation, APL Project 1629 Report Part B — Case Studies of Solids Separation Systems (Milestone 5). APL, Canberra.
104
Appendix A National odour guidelines for piggeries
Ap
pen
dix
A
A1 Introduction
Odour has been identified as the principal community amenity concern in relation to piggery developments. The Australian pig industry has recognised the need to improve its level of environmental performance to comply with rising community expectations. Variations in regulatory requirements throughout Australia, and the application of these requirements, are hindering this improvement. A consistent regulatory approach that provides the latest and best technical information will facilitate new development proposals, upgrades to facilities, and compliance with licence and approval conditions and current regulatory standards for operating piggeries in each state. The industry is driving this change by embracing environmentally sustainable practices and promoting self-regulation through active participation in the development and adoption of these National Odour Guidelines for Piggeries.
These guidelines are primarily based on existing piggery guidelines and codes of practice, but include ideas from other industries relevant to piggery odour assessment. They represent the best available options for assessing potential odour impacts from the information that is currently available.
A2 State legislation and guidelines
Each state of Australia has different legislation, codes of practice and guidelines that are relevant to odour impact assessment for piggeries, and these guidelines have been developed to conform as much as possible to regulatory requirements around Australia. However, regulatory requirements differ on some issues between states and territories, and some regulatory requirements require updating. Consequently, these odour guidelines do not conform to all regulatory requirements in every state and territory. Where there are differences, relevant state and territory requirements will override the odour guideline criteria and methodology.
Relevant acts and documents for each state are listed below, but the relevant regulatory authority should be contacted for information regarding the content or application of legislation, codes of practice or guidelines in a particular area. Early contact with state and territory agencies is recommended to discuss regulatory requirements for any proposed operations or changes to existing operations.
A2.1 New South Wales
Protection of the Environment Operations Act 1997.
Environmental Planning and Assessment Act 1979 (as amended).
Approved Methods and Guidance for the Modelling and Assessment of Air Pollutants in New South Wales — NSW Department of Environment and Conservation, 2001.
Draft Policy — Assessment and Management of Odour from Stationary Sources in NSW — NSW Department of Environment and Conservation, 2001.
Technical Notes Draft Policy — Assessment and Management of Odour from Stationary Sources in NSW — NSW Department of Environment and Conservation, 2001.
105
Note that the Draft Policy — Assessment and Management of Odour from Stationary Sources in NSW provides odour assessment criteria and an odour assessment methodology to be used in NSW. It also provides a process for development of industry-specific odour criteria and variations to the preferred methodology. Before commencing an odour impact assessment in NSW, a proponent should contact the NSW Department of Environment and Conservation to discuss any changes to the odour criteria and/or preferred assessment methodology.
A2.2 Queensland
Environmental Protection Act 1994 – Environmental protection policies are subordinate legislation that set standards and criteria for particular environmental problems. One policy addresses the management of air.
Environmental Code of Practice for Queensland Piggeries — Department of Primary Industries and Fisheries, Queensland, 2000.
Separation Guidelines for Queensland Piggeries — Department of Primary Industries and Fisheries, Queensland, 2001.
Code of Practice Piggeries: An Environmental Code of Practice — Department of Planning and Housing and Department of Food and Agriculture, 1992.
Note that this code of practice is currently being reviewed and updated. A new code is due for release in 2004.
A2.4 South Australia
Environment Protection Act 1993.
Guidelines for Establishment of Intensive Piggeries in South Australia — Government of South Australia, 1998.
Odour Assessment Using Odour Source Modelling — Environment Protection Authority, South Australia, 2003.
A2.5 Western Australia
Environmental Protection Act 1986.
Environmental Guidelines for New and Existing Piggeries — Agriculture Western Australia, 2000.
Odour Methodology Guidelines — Department of Environmental Protection, Western Australia, 2002.
Guidance for the Assessment of Environmental Factors — Assessment of Odour Impacts from New Proposals, No. 47 — Environmental Protection Authority of Western Australia, 2002.
A3 Odour assessment
An odour assessment aims to establish whether an odour will have an unreasonable impact at off-site receptors. This document provides assessment criteria that will achieve this for most sites; however, each site should be considered individually. Three levels of assessment are outlined in these guidelines.
106
In these guidelines, an unreasonable odour impact is assumed to occur when separation distances between a piggery and a receptor are less than those calculated using the methods set out here. A receptor is a location where people are likely to live or to spend large amounts of time, including residences, schools, hospitals, offices or public recreational areas. These guidelines mostly limit odour at a receptor to below that which most people would regard as objectionable.
The first level of assessment uses a standard empirical formula and is suitable for all piggeries. The second level involves modelling using adopted ‘standard’ emission rates and a meteorological data file representative of the site. The third level uses non-standard odour emission rates with at least one year’s worth of meteorological data collected for the site, or an odour concentration / odour intensity relationship.
These guidelines establish a standard odour impact objective (represented by a particular level of odour at receptors) with the objective for each level obtained by slightly varying the standard criteria. The standard odour impact objective represents the best available information regarding piggery odour impacts. The impact objective selected is based on instantaneous exposures, and may be updated as further information becomes available. The simple impact assessment method (Level 1) is less accurate than site-representative assessment (Level 2) or site-specific assessment (Level 3). Therefore the odour impact objective for Level 1 is more conservative than the Level 2 or Level 3 objectives, which are equivalent to the standard odour impact objective.
The three assessment levels outlined below are designed so that the odour impact estimates from each level should be more accurate than the previous one. This means that, for a given facility, the result of a Level 1 impact assessment would be more conservative and less specific about the exact nature and frequency of impact than the result of a Level 2 assessment, and so on.
The levels listed in these guidelines are suitable for assessing the potential for odour impacts from a proposed or expanding facility. They are not useful for assessing the odour impact from an existing facility and should never be used to determine if a facility should continue to operate, or to determine whether any odour impacts being experienced warrant further action or are acceptable. They are not suitable for investigating odour complaints.
These guidelines assume that all piggery odour sources are accurately represented as either area sources (eg ponds) or volume sources (eg piggery sheds). As a result, different modelling protocols may be required at some piggery sites, particularly those that include:
point or line sources
receptors in the near-field (separation up to 10 × the largest source dimension)
complex terrain or meteorological conditions.
In these cases, advice regarding appropriate modelling protocols should be obtained from the relevant regulatory authority.
A3.1 Level 1
Level 1 uses a standard empirical formula, and is a simple, cheap and quick method that offers high levels of protection for community amenity. Hence, the formula is relatively conservative and it could be used as a first screen for a proposed development. It gives the largest separation distances of all three levels. If Level 1 assessment proves unsatisfactory (such as when a piggery of a given size and design does not pass the Level 1 assessment), odour modelling may be required using Level 2 or Level 3 assessment.
Ap
pen
dix
A
107
A3.2 Level 2
Level 2 involves odour modelling with ‘standard’ recommended emission data. This method more closely matches the actual site configuration, but still offers high levels of protection for community amenity. This assessment applies to situations where:
piggery design or management is substantially different from the standard design used for the Level 1 assessment
meteorological data that represents the site are available
receptor locations are not accurately represented by the Level 1 assessment (ie prevailing winds may increase/decrease potential impacts at certain receptors).
The emission data used should be based on the best available data. The APL odour research database contains recommended emissions based on regular review and updating of information (every 3–5 years). The meteorological file should be representative of the site.
Assessment under this level would use the AUSPLUME dispersion model and the standard odour impact criteria.
A3.3 Level 3
Level 3 involves a comprehensive risk assessment, including site-specific (or site-representative) information for each of the major variables influencing odour impact assessment. This assessment applies:
to situations where innovative or unusual piggery design or management processes are implemented on-site
to piggery sites that are spread over large areas, or have multiple units
to piggery sites located in an area with other significant odour sources nearby
where particular odour reduction strategies are used
where the piggery is located in particularly complex terrain or experiences unusual meteorological conditions.
The modelling incorporates the use of site-specific or site-representative emission data, based on system measurements collected to appropriate standards. The modelling also requires the use of at least one year’s worth of reliable meteorological data representative of the site. The odour modelling results need to comply with the odour impact objective or an appropriately designed odour intensity study.
The use of an odour intensity study is not a required part of Level 3 assessment, but is included as an option available for sites that are using innovative designs or management that changes the nature of the odours released. An odour intensity study may provide a better method for assessing odours with non-irritating characteristics, eg those from well-managed compost.
Assessment under this level uses AUSPLUME in situations where it is expected to perform adequately. However, in areas of complex terrain or meteorological conditions, other accepted dispersion models may be used.
108
A3.4 Piggery definitions
Piggeries in Australia are usually indoor and are designed as:
effluent-based systems with flushing sheds and effluent treatment ponds
bedded systems with deep litter sheds
a combination of flushing sheds and deep litter sheds.
However, there are a substantial number of outdoor piggeries in Australia, particularly in the cooler southern areas. Outdoor piggeries should have a low chance of causing a substantial off-site odour impact, provided they are designed and managed according to sustainable nutrient loading rate criteria.
Within the National Environmental Guidelines for Piggeries, three types of outdoor piggery are defined:
extensive — where the dietary requirements of the pigs are obtained from grazing/foraging
intensive rotational — where most of the pigs’ dietary requirements are from formulated feeds, and the pig pens are regularly rotated
intensive feedlot — where most of the pigs’ dietary requirements are from formulated feeds, and pig pens are fixed.
These odour guidelines do not apply to extensive outdoor piggeries.
Intensive rotational outdoor piggeries are not required to meet site-specific separation distances, but are required to meet the minimum separation distances set out in Section A5.8.
These odour guidelines are applied to feedlot outdoor piggeries are described below.
Level 1 assessments for outdoor piggeries require an appropriate S1 factor (piggery design factor — see Section A5.4). However, odour emission rates from outdoor piggeries in Australia have not been reported, so it is not currently possible to develop S1 factors. Consequently, factors for a Level 1 assessment for an outdoor piggery would need to be negotiated with the relevant regulatory authority.
Level 2 assessments for outdoor piggeries require ‘standard’ odour emission rates for outdoor piggeries. Again, as little information is available regarding odour emission rates from outdoor piggeries in Australia, emission rates used in a Level 2 assessment for an outdoor piggery would need to be negotiated with the relevant regulatory authority.
Level 3 assessments for outdoor piggeries are done according to these guidelines.
A4 Modelling protocols and parameters
Before doing an assessment, the data and methods to be used in the assessment should be discussed with the relevant regulatory authority. It is important to note that these guidelines apply to an odour impact assessment for piggery facilities and do not provide a health risk assessment.
Ap
pen
dix
A
109
A4.1 Model used
AUSPLUME is currently the accepted emissions model around Australia, but several shortcomings are acknowledged for the model in odour applications. Other models are available that more accurately represent the dispersion process, particularly in complex terrain. The major disadvantage of these models is that they require more comprehensive meteorological data than AUSPLUME. An APL-commissioned report provides guidance in the selection and use of odour dispersion models (Pacific Air and Environment, 2003b).
If modelling piggeries that are in complex terrain or meteorological conditions, consider other accepted dispersion models. The relevant regulatory authority should be contacted before doing modelling to discuss the appropriate model to be used for each individual site.
A4.2 Odour intensity
Odour intensity is a useful dimension to quantify because some odours are perceived as being stronger than others. In other words, all odours will be just detectable at a concentration of 1 odour unit (OU)/m3, however, at twice the concentration, or 2 OU/m3, some odours may be perceived as very weak while others may be perceived as distinct. At 10 times the concentration, or 10 OU/m3, one odour may be perceived as distinct while another odour may be perceived as very strong.
An odour intensity study uses dynamic olfactometry to determine odour concentration and then odour intensity. These data are used to establish an odour concentration/odour intensity relationship applicable to the odour sources at the site. Specifically, the odour concentration equivalent to the intensity level of ‘weak’ is used in these guidelines.
For proposed developments, this study would need to include odour sources designed and operated in a similar manner to the odour sources at the proposed site. This study would need to comply with the German Standard guidelines (VDI 1992) for determining odour intensity.
A4.3 Percentile occurrence
A wide range of percentile occurrences is available for use in odour impact criteria, with different percentiles generally suited to different purposes. Very high percentile occurrences such as 99.9% (ie odour from a piggery does not cause impact 99.9% of the time each year) allow very few instances where the criteria may be exceeded and the modelling results are thus sensitive to outliers and errors in the meteorological data.
Conceptually, such stringent criteria are suited to acute impacts caused by highly concentrated odours. Piggery odours are complex mixtures of odorants released from area and volume sources. As a result, these odours are at relatively low concentrations at distances away from the odour sources. Consequently, any off-site receptors are more likely to experience a chronic impact (caused by repeated exposure to relatively low concentrations) than an acute impact. Conceptually, such impacts are more accurately represented by lower percentile occurrences.
These guidelines use a 98-percentile odour concentration occurrence to provide a better assessment of repeated low-level odour exposure and reduce the impact on results of outliers in meteorological data files. More detailed discussion on this topic is presented in Pacific Air and Environment (2003c).
110
A4.4 Averaging time
These guidelines use an averaging time consistent with the meteorological data file averaging, which is generally one hour. The use of meteorological data that represent an average condition over the period of one hour means that the actual odour concentration during that hour will be varying above and below the predicted average concentration. As human perception of odour typically occurs over very short periods, odour impacts that do occur may take place at an odour concentration that is higher than the average concentration predicted.
Two main methods are available to account for short-term concentration variations — the use of a reduced averaging time (such as three-minute averaging through the AUSPLUME dispersion model), or the use of a more stringent odour impact criteria. These guidelines incorporate the potential effects of plume concentration fluctuations into the odour impact criteria, rather than using a separate factor.
A4.5 Assessment point for criteria
The assessment point for odour impact criteria should be based on a risk assessment process tailored to the site. For extensive rural areas with low population density, the risk of odour plumes affecting people is low in outlying areas of a property and highest at houses, yards and sheds. In more closely settled areas, it is likely that all areas of the property will be more frequently used, and this needs to be considered as part of a risk assessment, along with the times of day those areas would be used, the potential activities in those areas and the odour potential of those activities. As most piggeries are in rural use areas, odour impact criteria would usually be applied at receptors.
It is important to assess likely future receptor points as part of the risk assessment process. For facilities sited close to towns, the local council should be contacted for an indication of the land zonings in the area surrounding the piggery site. A community consultation process is particularly useful as part of the risk assessment process, as it can assist in identifying future or pending developments on surrounding land.
A4.6 Odour impact criteria
For these guidelines, the standard odour impact criteria are:
3 OU, 98%, 1 hour average for a rural dwelling
2 OU, 98%, 1 hour average for a rural residential receptor
1 OU, 98%, 1 hour average for a town receptor.
These criteria are different from those used in most states. Section A2 provides references for state requirements for odour impact assessments. These references should be consulted or the relevant agency contacted to determine the requirements that must be met.
For Level 1 assessment, the impact criteria are equivalent to 75% of the standard impact criteria. These criteria are applied to the Level 1 assessment to provide conservative results for the standard formula, thus compensating for situations that are not covered well by some of the generalisations made within the formula. For Level 2 and Level 3 assessment the standard impact criteria are used. Table A.1 lists the odour impact criteria used in these guidelines.
Ap
pen
dix
A
111
Table A.1 Impact criteria applied in these guidelines
Odour concentration in OU Impact criteria
Percentile occurrence Rural Residential Town
Averaging time
Assessment point
Level 1 98% 2.25 1.5 0.75 1 hour
Level 2 98% 3 2 1 1 hour
Level 3 98% 3 2 1 1 hour
Receptor
OU = odour unit
A4.7 Meteorological data
High-quality Australian meteorological data are scarce outside the major population centres. As most piggeries are in rural areas it is often difficult to obtain suitable meteorological data for dispersion modelling. CSIRO has developed a model, ‘The Air Pollution Model’, that can generate meteorological data files for dispersion modelling applications (Harris 2002).
Meteorological data should only be generated by someone who understands the capabilities and limitations of the model used. Any data used in dispersion modelling must be assessed for errors, and to ensure that they adequately represent meteorological conditions at the site.
Validated data collected using a meteorological recording station are the preferred source for modelling input data. However, each file should be examined to assess its suitability for a given site. Where no site-representative data are available from surface recording stations, two options are available:
an on-site recording station may be set up to record one year’s worth of on-site data
a computer-generated data file may be used, although care needs to be taken in the selection of model settings to obtain representative data.
The data proposed for use in modelling should be discussed with the regulatory authority. The APL-commissioned report Pacific Air and Environment (2003a) provides guidance on meteorological data for odour dispersion models.
A4.8 Surface roughness
Surface roughness values are an important parameter in dispersion modelling. For Level 1 assessments, values are tabulated and clearly explained (Section A 5.5). For Level 2 and Level 3 assessments, the guidance provided by the model being used should be followed.
A4.9 Risk assessment
During the initial stages of an odour impact assessment, it is important to establish the structure of the assessment and the procedures that will be used. A site risk assessment is useful to ensure that all relevant factors are considered during the assessment, including factors such as:
the location of receptors with respect to prevailing winds, particularly during high temperatures, when modelling mechanically ventilated sheds
background odour levels from other intensive livestock or processing facilities in the area
houses in air drainage lines downstream of piggery sites
unusually high emissions resulting from pond failure or pond desludging.
112
Most of these occurrences will be addressed in the environmental management plan for the site, and most can be prevented or minimised through appropriate site management.
A5 Level 1 assessment
A5.1 Introduction
Odour has been identified as the principal community amenity concern in relation to piggery developments. Separation distance requirements are thus generally determined on the basis of limiting the potential of nuisance odours to an acceptable level. Separation distances can assist in managing some of the community impacts of intensive piggeries, and are used to ensure the long-term protection of the receptor and the piggery enterprise. Optimal separation distances between the piggery complex and receptors depend on a number of factors, including the size of the piggery, the topographical features, vegetation and surface roughness between the piggery and receptors, and the operating and management procedures at the piggery.
Separation distances specified in these guidelines are divided into site-specific and minimum distances. Site-specific separation distances from piggeries to receptors are based on the number of SPUs, receptor type, topography, vegetation (surface roughness), and piggery design and operation. Minimum separation distances provide appropriate distances between the piggery complex and relevant features. Separation distances are measured from the edge of the piggery complex, not the centre.
The minimum fixed distances are included largely to account for inaccuracies with predicting odour impact at close distances. Both the site-specific and minimum separation distance to receptors (each relevant receptor class) must be calculated, and the greater distance of the two applied for each receptor.
The piggery complex is generally considered to be any land, building or other structure or any part thereof whether temporarily or permanently used for the purpose of keeping, feeding or watering of pigs. The term includes any ponds and manure storage areas used in conjunction with the keeping of pigs, any loading or unloading facilities and carcase management sites, but it does not include areas where piggery by-products are used. Separation distances from by-product reuse areas and relevant receptors and features are included in these guidelines, depending on the type of reuse system employed. By-product reuse areas are not included as part of the piggery complex because of the infrequent application of by-products and the diverse spread of reuse areas on a farm.
A detailed explanation of how the Level 1 assessment process was developed is presented in APL Project 1921 (Nicholas and McGahan 2003).
Ap
pen
dix
A
113
A5.2 Calculation method
The separation distance of the piggery complex from receptors depends on a number of factors, including:
piggery size, defined as the number of SPUs in the complex
piggery design, particularly the shed type and the effluent removal and treatment processes used at the piggery
piggery siting:
− receptor type (eg town, rural residence etc)
− topography features (hills etc) between the piggery and the receptor
− vegetation/surface roughness between the piggery complex and the receptor
terrain effects around the site, particularly the effects of terrain features on meteorology of the area.
Site-specific separation distances are based on the dispersion of odours from their source.
Different air quality objectives were chosen for different receptor types based on the assumption that there is more probability that people will be affected by odour in larger population centres, due to the higher population density in these areas.
Calculation of separation distances for each receptor type follows the form:
separation distance (D) = N0.55 × S1 × S2 × S3
Where:
N = number of SPUs. 0.55 = piggery size exponent determined using the results of modelling
S1 = piggery design factor for estimating the relative odour potential for the piggery design selected for a particular site (S1 = effluent removal factor, S1R × effluent treatment factor, S1T)
S2 = piggery siting factor for estimating the relative odour dispersion potential for the selected piggery site (S2 = receptor type factor, S2R × surface roughness factor, S2S)
S3 = terrain weighting factor for estimating the potential changes to odour dispersion in situations where meteorological conditions may be influenced by local terrain influences.
The S factors to be used with this formula are presented in Table A.2.
The separation distance is the distance from the closest point within the piggery complex to the receptor (eg town boundary, residence, school, church or hall). The available separation distances between the piggery complex and receptors are generally the key factors limiting the number of pigs that can be accommodated on a particular site. Separation distances to all relevant receptors must be assessed to ensure that the potential for unacceptable odour nuisance is minimised. Where other significant odour sources are located in proximity to the proposed piggery, the cumulative odour impact from both sites may need to be considered.
114
Table A.2 Summary of S factors for use with Level 1 calculations
Factor description Value S1 factor = effluent removal system factor, s1r × effluent treatment factor, S1T
Effluent removal system Conventional shed — static pit, pull plug or flushing system 1.00 Deep litter system, pigs on single batch of litter ≤ 7 weeks 0.63 Deep litter system, pigs on single batch of litter > 7 weeks 1.00 Effluent treatment Pond with >40% separation of volatile solids before pond 0.80 Pond with 25–40% separation of volatile solids before pond 0.90 Pond with <25% separation of volatile solids before pond 1.00 Permeable pond cover — preliminary factor, subject to change 0.63 Impermeable pond cover 0.50 Deep litter system — spent bedding stockpiled/composted on-site 0.63 No manure treatment or storage on-site — effluent/litter removed from site 0.50 S2 factor = receptor type factor, S2R × surface roughness features factor, S2S
Receptor type Town 25 Rural residential 15 Rural dwelling 11.5 Surface roughness features Limited ground cover/short grass 1.00 Undulating hills 0.93 Level wooded country 0.85 Heavy timber 0.77 Significant hills and valleys 0.68 S3 factor — terrain weighting factor
Weighting factor Terrain Downslope of
site Upslope of site
Narrow valley (1–2%) 1.2 0.5 Sloping terrain (1–2%) 1.5 1 Flat (<0.1% in all directions) 1 1 Broad valley/drainage (0.1–1%) 1.6 1 Hilltop (>4%) 1.2 N/A
Note: S1 factors for an outdoor piggery would need to be negotiated with the relevant regulatory authority.
Ap
pen
dix
A
115
A5.3 Piggery size
The equivalent number of SPUs is calculated using standard multipliers for each class of pig. One SPU is equal to an average size grower pig (40 kg). Multipliers are then applied to each class of pigs based on their relative volatile solids production (in their manure and waste feed) as compared to an average size grower pig. The pig mass, age and standard multipliers for each class of pig are provided in Table A.3.
Table A.3 Standard SPU multipliers for different classes of pig
Definition SPU factor
Gilt 24–30 weeks 1.8
Boar 100–300 kg 1.6
Gestating sow 160–230 kg 1.6
Lactating sow 160–230 kg 2.5
Sucker 0–4 weeks 0.1
Weaner 4–10 weeks 0.5
Grower 10–16 weeks 1.0
Finisher 16–24 weeks 1.6
Heavy finisher Over 24 weeks 1.8
A5.4 Piggery design factor, S1
A number of piggery design factors will influence the amount of odour emissions from a piggery. The factors having the most influence on the site emissions are discussed below. A composite ‘design factor’ for the site is obtained by multiplying the effluent treatment and removal factors together.
Odour emission rates from outdoor piggeries in Australia have not been reported, so it is not currently possible to develop S1 factors for outdoor piggeries. Consequently, S1 factors for use in a Level 1 assessment for an outdoor piggery would need to be negotiated with the relevant regulatory authority.
Effluent removal, S1R
The effluent removal factor relates to the odour potential of piggeries based on the management of effluent in the piggery buildings. Good shed management practices, including maintaining clean conditions within the sheds, is known to reduce odour emissions. Table A.4 lists effluent removal factors based on the effluent removal system used.
116
Table A.4 Values of effluent removal factor, S1R
Effluent removal system Factor
Conventional shed — static pit, pull plug or flushing system 1.00
Deep litter system, pigs on single batch of litter ≤ 7 weeksa 0.63
Deep litter system, pigs on single batch of litter > 7 weeksa 1.00 a The effluent removal factor is 0.63 for deep litter systems stocked at recommended rates with good management practices for up to 7 weeks on a single batch of litter. This assumes that sheds are maintained in a relatively clean condition (eg sufficient bedding equivalent to >0.6 kg of straw/pig/day), there is no liquid effluent treatment system and solid stockpiles are removed from sheds as soon as practical after the end of a batch. Where low bedding rates are supplied (<0.6 kg/pig/day) or pigs are housed >7 weeks between shed clean-outs, a factor of 1 should be used. Where pigs are held for >7 weeks, but higher bedding usage or partial clean-out of the shed is undertaken between shed clean-outs, a factor lower than 1 is justified.
This table refers to the shed odour emissions at a site and represents the reduction in shed odour arising from the design and management of the sheds. The factor used is 1 - (75% of the odour emissions reduction). For example, a reduction in shed odour emissions of 50% gives a factor of 1 - (75% of 50%) = 0.63. Where different building design or management practices exist within the piggery complex, the effluent removal factor should be weighted according to the number of SPUs included in each management system. The effluent removal factor could be adjusted if there is new odour-reducing technology employed that can be demonstrated and quantified.
Effluent treatment, S1T
The effluent treatment factor relates to the odour potential of piggeries based on the design of the effluent treatment system — the anaerobic pond for conventional shed systems, spent deep litter management for deep litter systems. Table A.5 lists effluent treatment factors. For conventional piggery systems, these factors may change according to whether solids separation is used before the pond.
Table A.5 Values of effluent treatment factor, S1T
Effluent treatment Factor
Pond with >40% separation of VS before ponda 0.80
Pond with 25—40% separation of VS before ponda 0.90
Pond with <25% separation of VS before ponda 1.00
Permeable pond coverb — preliminary factor, subject to change 0.63
Impermeable pond coverc 0.50
Deep litter system — spent bedding stockpiled/composted near sheds 0.63
No manure treatment/storage on-site — effluent/litter removed from sited 0.50 VS = volatile solids a Solids separation efficiency should be based on results published in technical reports. Where VS removal is not reported, measures of total solids removal will generally provide a conservative estimate of VS removal efficiency. Summary information for a range of separators is available in Watts et al (2002). The reduction factors in this table assume that pond surface area is reduced as a result of the use of the separator. No reduction applies if the pond surface area remains unchanged. b A permeable pond cover assumes a consistent odour reduction of at least 75%. c An impermeable pond cover assumes a 100% pond odour reduction. d No manure/effluent treatment on-site assumes that some temporary storage or mixing area exists near the sheds, but that design and management of the storage/mixing area minimises emissions from this source.
Ap
pen
dix
A
117
This table refers to the odour emissions from the effluent treatment system and represents the reduction arising from the design and management used. As shed odour emissions have already been considered, reductions in total site odour are presented in this table to ensure that the formula calculations are sensible. For the purposes of these guidelines, a piggery is assumed to have two main odour sources — ponds are assumed to contribute 75% to total site odour and sheds 25%. The factor used is 1 − (75% of the odour emissions reduction). For example, a reduction in total pond odour emissions of 33% will reduce total site odour emissions by 25%, giving a factor of 1 − (75% of 25%) = 0.81. Where different building design or management practices exist within the piggery complex, the effluent treatment factor should be weighted according to the number of SPUs included in each management system.
These guidelines assume a maximum anaerobic effluent treatment pond size equivalent to half the size derived using the Rational Design Standard (Barth 1985) to calculate pond capacity. Under these circumstances, pond treatment efficiency is not significantly affected, but regular desludging is required. Where pond design varies significantly from this design’s volatile solids loading rate, the effluent treatment factor may need to be altered accordingly. Nicholas et al (2003) provide information for estimating the effect of different pond designs.
APL is funding ongoing research to quantify the odour reduction achieved by permeable covers, but preliminary research has suggested that 75–90% reduction may be achieved. Permeable covers are generally only installed over the anaerobic pond, which is assumed to contribute 90% of total pond odour at a piggery (thus contributing 68% of total site odour). The factor used is 1 - (75% of the odour reduction) For example a reduction in anaerobic pond odour of 75% will reduce total site odour by 75% of 90% of 75% = 50%, giving a factor of 1 − (75% of 50%) = 0.63.
Piggery design factor summary
The two factors listed above provide the basis for estimating the relative odour potential for the piggery design selected for a particular site. Multiplying these factors together gives a total piggery design factor (ie piggery design factor, S1 = effluent removal factor, S1R × effluent treatment factor, S1T).
Example calculation: Consider a proposed 1000-sow farrow-to-finish piggery growing pigs out to 24 weeks, breeder pigs housed in conventional sheds, all progeny in deep litter after three weeks of age, and using a run-down screen separator. Batches of weaned pigs are housed in weaner deep litter sheds from 3–10 weeks, then moved into grower deep litter sheds from 10-24 weeks on one batch of litter. Bedding is added to the deep litter sheds at approximately 0.65 kg/pig/day and spent litter is stockpiled on-site before spreading.
The piggery will have approximately 10 000 pigs and approximately 10 000 SPU.
The conventional sheds will house approximately 2000 SPU, the weaner deep litter sheds approximately 1000 SPU and the grower deep litter sheds approximately 7000 SPU.
A properly designed and maintained run-down screen will separate 25% of the VS from the effluent before the pond.
The effluent treatment factor for the site, S1T = (2000 SPU/10 000 SPU ×0.9) + (8000 SPU/10 000 SPU × 0.63) = 0.684.
The piggery design factor for the site, S1 = 0.906 × 0.684 = 0.62.
The relatively low value of this design factor reflects the fact that the piggery is housing most of its pigs on deep litter. Consequently, the size of the anaerobic pond at the site is very much
118
smaller than it would be for a conventional piggery, substantially reducing the potential odour emissions from the site. The run-down screen also reduces the required pond size.
A5.5 Piggery siting factor, S2
A number of piggery siting factors will influence the dispersion of odours emitted from a piggery. These factors differ from site to site, and have a substantial influence on the potential odour impact at receptors. The factors having the most influence on odour dispersion are discussed below. A composite ‘siting factor’ for the piggery is obtained by multiplying the factors together.
Receptor type factor, S2R
The receptor factors presented in Table A.6 account for the variation in population density, odour sensitivity and risk of exposure for receptors located in the vicinity of a piggery. Different receptor factors have been adopted for the various receptor types.
Table A.6 Values of receptor type factor, S2R
Receptor type Factor
Town 25
Rural residential 15
Rural dwelling 11.5 Note: The receptor definitions should be based on local authority classifications.
The separation distance should be measured to the edge of the town, not the centre. When determining the location of the edge of the receptor, land zoning and pending development applications lodged, but not yet under construction, should be taken into account. Local councils can provide this information. Public areas such as camping grounds or picnic areas may need to be considered as part of the assessment. The frequency of use and the time of day the area is occupied provide guidance to the level of protection required. For example, day-use only areas are a substantially lower risk for odour impact than areas frequently used at night.
Surface roughness factor, S2S
The surface roughness factor varies according to the roughness of the earth’s surface between the piggery and the receptor. The principal elements that determine surface roughness are vegetation density and surface topography. Recommended values of surface roughness are provided in Table A.7. The values presented in this table are not to be added; only the value for the single category that best represents the site conditions should be selected.
The roughness factors given in Table A.7 assume that the selected roughness is continuous between the piggery and the receptor. Where roughness is variable or non-continuous, judgment should be used in selecting an appropriate composite factor.
The values given in Table A.7 should be used with care; a number of qualifications apply to their use. For receptors located at larger separation distances, more than one surface roughness factor may apply over different sections of the separation. In this instance, the surface roughness factor applied should be selected after considering the relative weighting of the different factors. When selecting factors based on the presence of vegetation, some consideration should be given to the potential for the vegetation to be cleared during the life of the piggery. For example, off-site vegetation is beyond the control of the piggery, but may be regarded as permanent depending on the owner of the land (eg national park/state forest where no timber harvesting is undertaken).
Ap
pen
dix
A
119
APL has commissioned a report providing guidance on meteorological data for odour dispersion models (Pacific Air and Environment 2003a). This report also provides some guidance regarding surface roughness factors for use in dispersion modelling.
Table A.7 Values of surface roughness factor, S2S
Surface roughness features
Description Factor
Long grass, few trees Open country with few or scattered trees. Topography would be predominantly flat to slightly undulating.
1.00
Undulating hills Situations where topography consists of continuous rolling, generally low-level hills and valleys, but without sharply defined ranges, ridges or escarpments. (Assumes minimal vegetation.)
0.93
Level wooded country Open forest country with tree density not sufficient to provide a continuous canopy, but sufficiently dense to influence air movement. There would be little or no lower storey vegetation. The density is such that the vegetation can be considered as a continuous belt.
0.85
Heavy timber Generally tall forests with dense timber stands, providing a continuous canopy. There is limited understorey vegetation, mainly associated with regrowth.
0.77
Significant hills and valleys
Situations where one or more lines of hills sufficiently large enough to influence air movement exist between the receptor and the piggery.
0.68
Piggery siting factor summary
The factors listed above provide the basis for estimating the relative odour dispersion potential for the selected piggery site. Multiplying these factors together gives a total piggery siting factor (ie piggery siting factor, S2 = receptor type factor, S2R × surface roughness factor, S2S). For sites with more than one receptor type located nearby, a piggery siting factor will be calculated for each receptor type.
Example calculation: Consider the proposed 1000-sow farrow-to-finish piggery described earlier. The site is located 8 km west of the nearest town, but is 2.5 km west of a rural residential subdivision. A number of farmhouses are sited on properties adjoining the proposed piggery site — the nearest is 1150 m to the north, another is 1300 m to the north-east, another 1700 m to the west and another 1950 m to the south. The local council has been consulted regarding the boundary of residential zonings for the town and the rural residential development. The piggery site, town boundary and the boundary of the rural residential site have been located using a global positioning system (GPS) with +/−5 m accuracy. The separation to the farmhouses has been estimated from maps.
The property is located in an area of flat to undulating topography, with mixed farming and forestry the dominant land uses. The forestry land has not been logged for many years, with logging or clearing unlikely to occur in the near future. The land between the proposed piggery site and the farmhouses to the north and north-east is undulating with an established 500 m thick continuous timber-belt along the northern and eastern boundary of the piggery property, located within the property. Forestry land extends from the eastern boundary of the property to the
120
boundary of the rural residential development. The land between the proposed piggery site and the farmhouses to the south and west is flat to undulating with scattered clumps of trees and a few trees along fences.
Separation distances will need to be calculated for three receptor classes, town (S2R = 25), rural residential (S2R = 15) and rural dwelling (S2R = 11.5). Where different surface roughness categories exist for a particular receptor class, separation distances need to be calculated for each combination of receptor class/surface roughness category.
The surface roughness used for the town and the residential area would be heavy timber (S2S = 0.77) due to the well-established continuous stand of forest and the fact that it is unlikely to be cleared.
The surface roughness used for the farmhouses to the north and north-east would be level wooded country (S2S = 0.85) due to the undulating nature of the terrain plus the continuous belt of established timber within the property in those directions.
The surface roughness used for the farmhouses to the south and the west of the residential area would be limited ground cover/short grass (S2S = 1.0) due the flat to undulating nature of the terrain and the lack of a continuous, thick tree cover.
The piggery siting factor (town) for the site: S2 = 25 × 0.77 = 19.25
The piggery siting factor (residential) for the site: S2 = 15 × 0.77 = 11.55
The piggery siting factor (rural — N/NE) for the site: S2 = 11.5 × 0.85 = 9.8
The piggery siting factor (rural — S/W) for the site: S2 = 11.5 × 1 = 11.5
A5.6 Terrain weighting factor, S3
The terrain weighting factor (S3) relates to the potential for a piggery odour plume to be exaggerated in particular directions and relatively small in others. Recently completed work funded by APL (APL Project 1921, Milestone Report 2, Nicholas and McGahan 2003) provides a methodology for incorporating important wind features based on the topography of a specific site. This method provides an estimation of the potential changes to odour dispersion in situations where meteorological conditions may be influenced by local terrain.
The recommended factors are shown in Table A.8, along with the direction in which each factor should be applied. The slope referred to is determined by the topographical features of each site. The use of these terrain weighting factors does not affect the application of surface roughness factors discussed in Section A5.2.
Ap
pen
dix
A
121
Table A.8 Values of terrain weighting factor, S3
Weighting factor Terrain
Downslope Upslope
Broad valley/drainage (0.1–1%) 1.6 1
Sloping terrain (1–2%) 1.5 1
Flat (<0.1% in all directions) 1 1
Hilltop (>4%) 1.2 –
Narrow valley (1–2%) 1.2 0.5
Notes: 1. These factors may not apply where sea breezes are a significant influence on weather patterns (ie in coastal regions), or where odour is emitted from elevated vent sources. 2. Downslope factors should be applied across an angle of 90° centred on the terrain feature. Upslope factors should be applied across an angle of 60° centred on the terrain feature.
The location of the piggery should be checked in relation to the topography. For example:
If the piggery is on a slight slope (<1%) within a broad valley, a terrain weighting factor of 1.0 should be used upslope and 1.6 downslope of the facility.
If the piggery is situated on a moderate slope (1–2%), a terrain weighting factor of 1.0 should be used upslope and 1.5 downslope of the facility.
Weighting factors should be applied for the range of distances applicable to piggery impacts. However, the application of these weighting factors is dependent on the homogeneity of terrain between source and receptor. For example, if the terrain remains similar between the piggery and receptor, the weighting factor can be applied for an indefinite distance. The weighting factor is, however, less reliable if significant terrain changes occur between source and receptor.
The new terrain weighting factors apply to most locations. If, however, the site is not described by these factors, a terrain weighting factor of 1.0 should be used.
Example calculation: Consider the proposed farrow-to-finish piggery site described in the previous example.
The terrain of the area is flat to undulating, thus the terrain weighting factor, S3 = 1.
The required separation distance (town) for the site: D = (10000)0.55 × 0.62 × 19.25 = 1892 m
The required separation distance (residential) for the site: D = (10000)0.55 × 0.62 × 11.55 = 1135 m
The required separation distance (rural — N/NE) for the site: D = (10000)0.55 × 0.62 × 9.8 = 963 m
The required separation distance (rural — S/W) for the site: D = (10000)0.55 × 0.62 × 11.5 = 1130 m
122
A5.7 Maximum pig numbers
The maximum number of pigs allowed on the site can also be calculated, by rearranging the formula as shown in the example below.
Example calculation: Consider the proposed farrow-to-finish piggery site described in the previous example. The factor values are calculated in the same manner as presented in the previous examples.
Maximum pig numbers will need to be calculated for the distance available for each combination of receptor class/surface roughness category. For each combination of receptor class/surface roughness category, choose the closest receptor to use in calculations. The maximum number of pigs allowed for the site is the smallest number of the calculations completed.
Maximum pig numbers N = (D / (S1 × S2 × S3))1/0.55 = (D / (S1 × S2 × S3))1.82.
The maximum pig numbers (town) for the site: N = (8000 / (0.62 × 19.25 × 1))1.82 = 139,250 SPU.
The maximum pig numbers (residential) for the site: N = (2500 / (0.62 × 11.55 × 1))1.82 = 42,480 SPU
The maximum pig numbers (rural — N/NE) for the site: N = (1150 / (0.62 × 9.8 × 1))1.82 = 13,940 SPU
The maximum pig numbers (rural — S/W) for the site: N = (1700 / (0.62 × 11.5 × 1))1.82 = 21,220 SPU
The maximum number of pigs allowed on the proposed site using the proposed design and management options is 13,940 SPU.
A5.8 Minimum separation distances
Minimum separation distances are included largely to account for inaccuracies in predicting odour impact at close distances. Both the site-specific and minimum separation distance to receptors (town, rural residential and rural dwelling) must be calculated and the greater distance of the two applied. The relevant regulatory authority should be contacted to determine the minimum separation distances applicable, or methods for calculating them.
Piggery complex separation
Minimum separation distances required for a piggery complex are shown in Table A.9. Sites that have separate piggery units on the one property should apply the separation formula to the combined units and for each receptor apply the separation distances from the nearest part of the closest piggery complex. Guidance should be obtained from the relevant regulatory authority to apply the separation formula individually to separate units on the same property.
Ap
pen
dix
A
123
Table A.9 Separation distances from piggery sites to other relevant features
Feature Distance (m)
Public road — carrying > 50 vehicles per day 200
Public road — carrying < 50 vehicles per day 100
Town 750
Rural residential 500
Rural dwelling 250
Property boundary 20 Notes: 1. The measuring point for a public road shall be the surveyed boundary of the road on the same side of the road as the piggery unit operation. 2. Traffic volume excludes vehicles associated with the piggery operation. 3. These are minimum fixed separation distances to towns, rural residential areas and rural dwellings. The variable separation distance must also be calculated and the greater distance of the two applied.
Separation from areas of by-product use
Separation distances from areas of by-product use to relevant receptors and features are shown in Table A.10, depending on the type of system employed. Areas of by-product use are not included as part of the piggery complex because of the infrequent application of by-products and the diverse spread of application areas on a farm. These distances are in addition to separation zones for the piggery complex and are determined separately. Whenever by-products (liquids, solids or slurry) are transported or conveyed across a property boundary or along public roads, they should be contained in a closed vessel or pipe. The following categories describe the method employed, with the specified distances for each category listed in Table A.10.
Category 1
Effluent is discharged or projected to a height in excess of 2 m above ground level.
Separated solids or sludge remain on the soil surface for more than 24 hours (ie are not immediately ploughed in).
Spent bedding is spread immediately (ie is not stockpiled/composted) and remains on the soil surface for more than 24 hours (ie is not immediately ploughed in).
Also includes rotational outdoor piggery pens.
Category 2
Mechanical spreaders and downward discharge nozzles. The discharged material shall not be projected to a height in excess of 2 m above ground level.
Spent bedding is stockpiled before spreading.
124
Category 3
Discharge by injection directly into the soil (to a depth not greater than 0.4 metres) and at a rate not exceeding either the hydraulic or nitrogen, phosphorus and potassium limits determined for the local soil type(s).
Spent bedding/solids are composted.
Application of effluent/spent bedding/solids in combination with immediate incorporation of material into the soil.
Where more than one category is used the more (or most) stringent category controls apply.
Table A.10 Separation distances surrounding by-product reuse areas
Category no. Feature
1 2 3
Town 1000 750 300
Rural residential 600 400 150
Rural dwelling 300 200 100
Public road — carrying > 50 vehicles per day 50 25 0
Public road — carrying < 50 vehicles per day 25 15 0
Property boundary 25 20 0 Notes: 1. Distances should be measured from the perimeter of the area used for handling or reuse of effluent. 2. The fixed separation distances surrounding by-product reuse areas should be used as a guide. Dispensation may be obtained for these distances following site-specific assessment from the relevant authority. 3. Traffic volume excludes vehicles associated with the piggery operation.
A6 Odour modelling — Level 2 and Level 3 assessments
A6.1 Introduction
Dispersion models can provide concentration estimates over an almost unlimited grid of user-specified locations, and can be used to evaluate both existing and proposed emissions scenarios. In this capacity, air dispersion modelling is a useful tool in assessing the impacts of existing and proposed piggery emissions on air quality. The results of the dispersion modelling analysis can be used to develop control strategies that should ensure compliance with the odour performance criteria. Dispersion models can also be used to estimate the cumulative impacts of various facilities that are located sufficiently close to one another.
Meteorological conditions govern the transport and dispersion of odours. It is therefore important, when modelling emission sources, to use meteorological data that are specifically representative of the site and the surrounding region in general. Sufficient meteorological data should be available to ensure that ‘worst case’ conditions are adequately represented in the model predictions. This requirement is especially important given that the odour performance criteria need to be determined and reported on a statistical basis. Meteorological data requirements are discussed further in Section A6.3.
The AUSPLUME dispersion model is widely accepted by Australian regulatory authorities as the default model to use for odour impact assessments on new and existing premises, and is the
Ap
pen
dix
A
125
preferred model for carrying out Level 2 and 3 odour assessments. In Level 3 assessments where AUSPLUME is not accurate enough, other accepted models may be used, but these should be checked with the appropriate regulatory authority before conducting an assessment. More detailed discussion on the selection and use of odour dispersion models is provided in Pacific Air and Environment (2003b).
A6.2 Method
The general process for odour modelling is:
1. List all potential odour sources. Include all sources within the site boundary and any nearby sources beyond the boundary if they could contribute to cumulative odour impacts.
2. Gather data for each release point. For each release point:
select area or volume source options within the chosen dispersion model
determine source location coordinates in metres relative to a fixed origin.
3. Determine appropriate impact criteria. Where a range of receptor types is present around a piggery, select the appropriate odour impact criteria for each receptor.
4. For all sites:
Estimate emission quantities. The APL odour database contains recommended emission rates for most piggery odour sources. Site-specific data should be used where available.
Odour emissions should be presented as mass emission rates in OU/second
Where applicable, include periodic variations in emission rates.
Estimate source release parameters. The APL odour database recommends methods for incorporating emission release characteristics into odour modelling.
For diffuse area sources determine surface area, side length and release height
For diffuse volume sources determine side length and release height.
5. Incorporate other dispersion modelling parameters:
appropriate averaging time (ie one hour)
location of receptors (and likely future receptors) such as rural dwellings, rural residential areas, schools and towns
a meteorological data file for the site.
6. For all sites, consider what scenarios to include in analysis. Alternative scenarios may be investigated to assess:
the odour reduction potential of different design and management processes source release parameters
the sensitivity of model results to changes in key model parameters (eg different land use factors).
7. Prepare dispersion model input files and run computer-based model.
8. Process dispersion model output files.
9. Analyse dispersion model results. For Level 2 and Level 3 odour impact assessments, determine the impacts equivalent to the standard odour impact criteria (ie 3 OU, 98%, one hour average). Graphical and tabulated results should be compared to the impact criteria.
126
10. Prepare an odour impact assessment report. An odour impact assessment report should address each of the following areas in detail:
site plan
description of the activities carried out on the site
description of meteorological data
emission inventory
dispersion modelling.
These guidelines assume that all piggery odour sources are accurately represented as either area or volume sources. As a result, different modelling protocols may be required at some piggery sites, particularly those that include:
point or line sources
receptors in the near-field (typically 10 × the largest source dimension)
complex terrain or meteorological conditions.
In these cases, advice regarding appropriate modelling protocols should be obtained from the relevant regulatory authority.
A6.3 Meteorological data
APL has commissioned a report providing guidance on meteorological data for odour dispersion models (Pacific Air and Environment 2003a), which provides more detailed discussion on this topic.
For the AUSPLUME dispersion model, the meteorological parameters required are:
wind speed (m/s)
wind direction (°)
ambient temperature (°C)
atmospheric stability class
mixed layer height (m).
Wind speed, wind direction and ambient temperature can be directly measured, but atmospheric stability class and mixed layer height need to be indirectly determined by using other meteorological parameters with empirical formulae.
A meteorological station needs to measure and electronically log wind speed, wind direction and ambient temperature. In addition, for determining atmospheric stability class, either sigma theta (the standard deviation of the horizontal wind direction fluctuation) or total solar radiation in conjunction with temperature measurements at two levels must be measured and electronically logged. All parameters must be logged as one-hour average values as a minimum requirement. An averaging time of no more than five minutes is necessary to determine the influence of mesoscale eddies on stable flows. With modern data-logging facilities, many ‘turbulence’ characteristics can be computed continuously. If surface sources are likely to dominate the odour impact, serious consideration should be given to using a two-level (eg 10 m and 1 m) tower in order to estimate boundary layer characteristics and near-surface wind speeds, as these can affect dispersion and emission rates. All meteorological stations used to collect data for dispersion modelling purposes must use an anemometer that has a stall speed of 0.5 m/s or less.
Ap
pen
dix
A
127
Methods described in USEPA (2000) to calculate these factors are generally accepted by Australian regulatory authorities. The report should include a description of the meteorological data used or alternatively a reference to a publicly available report that contains this information. The description is to include details on the methodology used to derive stability classes and mixing heights and is to present (as a minimum) the annual wind rose and annual stability frequency distribution. The description should also include details on the quality of the anemometer used and its starting threshold.
It is generally accepted that a minimum of five years of site-specific meteorological data are required in order to obtain confident model predictions. As the data set is reduced, uncertainties and under predictions increase in the model estimates.
A Level 2 or Level 3 odour impact assessment requires at least one year of site-specific meteorological data for impact assessments based on dispersion modelling. Where possible, a one-year, site-specific data set should be correlated against a site-representative meteorological database of at least five years (preferably five consecutive years). If site-specific meteorological data are not available, it is required that at least one year of site-representative meteorological data be used for conducting impact assessments based on dispersion modelling.
To determine whether particular meteorological data are in fact site-representative, it must be clearly established that the data adequately describe the expected meteorological patterns at the site under investigation (eg wind speeds, wind direction, ambient temperature, atmospheric stability class, inversion conditions and katabatic drift).
For complex terrain, consideration should be given to determining streamline deflection and complex drainage flows by the short-term use of a network of 3–4 single-level anemometer stations. It is likely that flow characteristics can be established from 2–3 months of monitoring in both winter and summer.
A6.4 Site sources and emission rates
Piggery odour emissions
From an odour production perspective, the basic piggery designs used in Australia are generally referred to as conventional systems or deep litter (bedded) systems. Any given piggery site may include both conventional and deep litter systems.
The major odour sources in a conventional piggery system are:
effluent treatment ponds
pig accommodation sheds.
The minor odour sources in a conventional piggery system are:
effluent irrigation areas
areas of solid by-product use
areas for storing or composting carcases/separated solids/sludge (some sites)
effluent settling basins (some sites).
The major odour sources in a deep litter piggery system are:
pig accommodation sheds.
128
The minor odour sources in a deep litter piggery system are:
spent bedding storage/composting areas
carcase composting areas (some sites)
areas of solid by-products use.
Piggery layouts vary substantially between sites. In some cases the sheds, effluent treatment and by-product storage or composting areas are all located in close proximity; at other sites, effluent treatment and by-product storage or composting may be separated from the sheds; and at other sites, groups of sheds may be sited separately with their effluent storage and by-product storage or composting areas.
The recommended rates from the APL odour emissions database should be used; these are updated every 3–5 years, unless site-specific or site-representative data are available.
When using site-specific or site-representative data, key points for consideration include:
data quality
seasonal or other temporal factors that impact on odour emissions
similarity of climatic conditions
similarity of design and management practices
possible effects of terrain features on the collection of the initial data
odour measurement methodology and the general level of agreement on any adjustment factors.
Odour concentration should be measured using dynamic olfactometry to the Australian Standard Air quality — Determination of odour concentration by dynamic olfactometry, AS/NZS 4323.3:2001 (Standards Australia/Standards New Zealand 2001).
The APL odour research database provides recommended emission rates and recommended methods for modelling emission variation from each source. These variations should be used in conjunction with the meteorological data file selected for the site to predict the overall variation in odour emissions for the site. Modelling using AUSPLUME can use these predicted variations by creating an emissions input file that defines the emissions from each source for each hour of the meteorological data used by the model. Where practicable, emission rate data should be constructed using an averaging period of one hour, or the sampling time used in the concentration calculations, whichever is less.
Piggery odour sources are generally consistent, but intermittent high emissions may occur as a result of management (eg pond desludging) or other events. As these emissions rarely occur, it is more effective to assess these situations using a site risk assessment and manage the potential impact through a site management plan.
For site-specific sampling of odours, procedures should be discussed with the appropriate regulatory authority. An Australian Standard for sampling odours has been proposed, but is unlikely to be available in the near future.
Publications arising from APL Project 1628 (eg Galvin et al 2002) have discussed the significant variability in odour concentration found from different sampling points on an anaerobic pond surface. For effluent treatment ponds, it is recommended that odour samples be collected from a minimum of six different points set out in a grid across the surface (excluding the surface above the side batters).
Ap
pen
dix
A
129
Smith et al (1999) discuss the variation in odour concentration within pig sheds. Substantial variation was found depending on ventilation design and wind direction. Therefore, sampling requirements will depend largely on the shed ventilation design.
Programs for odour sample collection from piggery sources will need to factor background odours into their design. For downwind samples this can be achieved by collecting samples of background air for analysis by olfactometry, or, for wind tunnels/flux hoods, by charcoal filtering of the air forced through the sampling equipment.
Odour intensity measurements
Using dynamic olfactometry to determine odour concentration to Australian Standard 4323.3:2001 (Standards Australia/Standards New Zealand 2001) and then odour intensity to the German Standard (VDI 1992), a suitable relationship between concentration and intensity can be determined, allowing different odour types to be compared. Stevens Law and the Weber-Fechner Law are examples of formulae that have widespread acceptance for defining the relationship between odour intensity and concentration for a particular odorant (including complex mixtures).
Once the odour intensity/concentration data are available, the Weber-Fechner law (shown below) should be used to develop the mathematical relationship between intensity and concentration. This relationship may then be solved for the odorant concentration that corresponds to an appropriate criterion. Generally, an intensity of three (‘distinct’) is used, but this value may vary depending on the averaging time percentile used in the odour impact criteria.
I = kw log(C/Co) + const
where
I intensity (perceived strength), dimensionless
kw Weber-Fechner constant
C concentration of odorant
Co concentration of odorant at the detection threshold (by definition equals one when using odour units)
const a constant which relates to the use of mean intensity levels. This constant is calculated from the line of best fit for each odorant.
The Weber-Fechner law has been chosen over Stevens Law because it is simpler to derive from experimental data. It is also described in the German Standard (VDI 1992) with a worked example.
Facilities that have multiple odour sources should determine the odour intensity concentration relationship for each source and, as a minimum, use the concentration that relates to the strongest odour (highest intensity) for modelling.
Odour intensity results are used in a dispersion model using a measurement of odour emission rate (OU/s) and the results compared to odour concentration at the receptor equivalent to an intensity level of ‘weak’, for the same averaging period and the same percentile as is used in the odour impact criteria. For sources that are intermittent, and emit odour for only a fraction of the hours of the year, the variation in these emissions should be used to develop a criterion that is applicable for that source. By way of indication, the criterion would be likely to retain an
130
intensity of ‘weak’ over the same averaging period, but with a higher percentile to reflect the degree of intermittency. Such an approach would give a level of protection against the highest events in the year from intermittent sources similar to that given by the above criterion for continuous emissions.
A6.5 Model selection
In these guidelines, Level 2 odour modelling is recommended for piggeries of a relatively standard design in flat terrain, and AUSPLUME is a suitable model to use. For more complex situations, Level 3 assessment is required, and the most appropriate dispersion model for the site should be chosen in discussion with the relevant regulatory authority.
APL has commissioned a report providing guidance in the selection and use of odour dispersion models — APL Project 1980, Task 2 (Pacific Air and Environment 2003b) - which provides more detailed discussion on this topic.
The models and/or worst-case calculation procedures and data employed in the assessment must be demonstrably capable of simulating, or accounting for, all of the features that are important in determining the air quality impact of the project. The proponent is responsible for identifying and properly accommodating these. The following list includes some examples of complex situations that may require the application of alternative processes to those included in these guidelines:
vertical plume dispersion in convective conditions
sea breeze trapping, recirculation of odour
near-surface dispersion under very stable calm conditions (a feature of Western Australian winter meteorology)
topographic influences — impact of plumes on elevated terrain, effect on spatially varying wind fields, valley winds (anabatic and katabatic winds), ponding of air in stable conditions
surface roughness
effects of positive or negative buoyancy.
The AUSPLUME model is frequently used in an acceptable manner for modelling odour emissions, but it has limitations that model users should understand.
A6.6 Multiple odour sources and cumulative impacts
Odours from intensive livestock facilities are typically complex mixtures of many odorants. The cumulative and interactive effects of individual odorants are not well understood, but it is generally assumed that where more than one source of a complex mixture of odorants are located in proximity, the potential odour impact on receptors is the sum of the potential individual impact of all odour sources. This approach is likely to provide a conservative assessment of the potential cumulative odour impacts.
APL has commissioned a report providing guidance in the selection and use of odour dispersion models — APL Project 1980, Task 2 (Pacific Air and Environment 2003b). This report suggests that AUSPLUME should not be used for modelling multiple sites.
Ap
pen
dix
A
131
The necessity of including other odour sources in odour modelling will need to be judged according to individual site assessments. The major factors influencing the potential interaction of odour plumes will be:
the size of each facility
the prevailing meteorological conditions and topography of the area
the design and management of each facility.
A simple method for assessing the need to include other facilities in modelling is to use a separation formula method (where available) to calculate separation distances for each facility. The calculated separation distance essentially approximates the odour plume. Where the odour plume from any neighbouring facility overlaps the odour plume from the facility being modelled, cumulative odour impact is possible, and that neighbouring facility should be included in modelling.
A6.7 Reporting requirements
A6.7.1 Odour sampling
Reports presenting results of odour sampling should include factors listed below.
Objective
Before doing an odour measurement program, it is important to identify the objective of the program so that an appropriate program structure can be developed. The objective should be stated, and referred to when justifying the sampling method and modelling undertaken.
Sampling program
Justification of the sampling method in relation to the measurement objective should be included in the report. The sources sampled and the timing of the samples taken will depend on the objectives of the measurement program. Source conditions at the time of sampling should be appropriate for the purposes of modelling. For example, for most sources it will be necessary to sample during ‘worst case normal’ conditions.
Contour plots
The report should include plots of odour contours at appropriate intervals and values to indicate the predicted impact of the piggery on the surrounding area. Contours should be overlaid on a map of the area if possible, or should at least provide a clear indication of major features such as the source, nearest receptors and major roads.
Complaint verification / ground truthing
Where complaints mapping has been used, a map showing locations from which complaints were received should also be included in the report and compared with modelled results. Maps and tables indicating results of any ground truthing (including comparison with modelled results) should be included in the report.
For environmental odours, ambient odour concentrations will generally be too low for determination using olfactometry, so ground truthing would typically involve qualitative assessment of ambient odour. Ormerod (2002) suggested that field observations can provide estimates of odour concentrations that appear to be similar in reliability to model predictions. It
132
was noted that this work was based on the odour emissions from a stack source, where the odour plume exhibited substantial variation in concentration. Piggery odour plumes typically have lower concentration variation within the plume and more gradual changes in concentration. As a result, it would be difficult to detect concentration variation using field observation and there would be a higher potential for odour habituation to reduce observation accuracy.
Olfactometry testing
All results of olfactometry analysis should include the following information:
how ‘worst case’ conditions were captured by sampling
confirmation of sampling methodology and protocols (what standards were used)
confirmation of what, if any, sample dilution was used during sample collection
laboratory where olfactometry undertaken
confirmation of method used (Australian Standard 4323.3:2001 Stationary source emissions — Determination of odour concentration by dynamic olfactometry is the preferred method); to ensure rigorous quality assurance and quality control procedures are adhered to when using these methods, consultants should generally be accredited by the National Association of Testing Authorities
time between sample collection and olfactometry analysis
number of panellists and identification code of each
certified reference material used and its concentration
result matrices for odour intensity analyses (see Figure 1 of the German Standard (VDI 1992))
plot of the odour intensity-concentration relationship(s).
A6.7.2 Odour modelling
The dispersion modelling and impact assessment report should address the information requirements specified below.
Site plan
layout of the site clearly showing all unit operations
all emissions sources clearly identified
plant boundary
receptors (eg nearest residences)
topography, large water sources in the area.
Description of the activities carried out on the site
plans clearly showing all operations carried out on the premises
detailed discussion of all operations carried out at the site, including possible operational variability
detailed list of all process inputs and outputs
plans and descriptions that clearly identify and explain all odour control equipment and odour control techniques used
Ap
pen
dix
A
133
operational parameters of all potential emission sources, including all operational variability, ie location, release type (eg stack, volume or area) and release parameters (eg stack height, stack diameter, exhaust velocity, temperature, emission rate) and process type (eg batch or continuous).
Description of meteorological data
detailed discussion of the prevailing dispersion meteorology at the proposed site typically including wind rose diagrams and an analysis of wind speed, wind direction, stability class, ambient temperature and joint frequency distributions of the various meteorological parameters
description of the techniques used to prepare the meteorological data into a format for use in the dispersion modelling
quality assurance/quality control analysis of the meteorological data used in the dispersion modelling. Any relevant results of this analysis should be provided and discussed
meteorological data used in the dispersion modelling supplied in a suitable electronic format.
Emission inventory
detailed discussion of the methodology used to calculate the expected odour emission rates for each source
where site specific data are available, all supporting source emission test reports etc
methodologies used for the sampling and analysis for odour emissions
where appropriate, a table showing all stack and fugitive source release parameters (eg temperature, exit velocity, stack dimensions and emission rates).
Dispersion modelling
detailed discussion and justification of all parameters used in the modelling, and the manner in which topography and other site-specific peculiarities that may effect plume dispersion have been treated
the value(s) of the roughness length and details on how this was determined
detailed discussion of predicted odour impacts, based upon predicted concentrations at all receptors
odour isopleths (contours) and tables summarising the predicted odour concentrations at receptors
all input, output and meteorological files used in the dispersion modelling supplied in suitable electronic format
A7 References
Barth CL (1985). Lagoon Planning and Design for Livestock Systems. In: Livestock Environment III. Proceedings of the 3rd International Livestock Environment Symposium, Toronto, 438.
Galvin G, Lowe SA, Atzeni MG, Casey KD and McGahan EJ (2002). Spatial Variability of Odour Emissions from Anaerobic Piggery Ponds. Enviro2002 Conference, Melbourne.
134
Harris C (2002). Use of TAPM to Generate Meteorological Files for Ausplume Modelling of Odour. Enviro2002 Conference, Melbourne.
Nicholas PJ and McGahan EJ (2003). Proposed Separation Formula, APL Project 1921 (Milestone 3). APL, Canberra.
Nicholas PJ, McGahan EJ and Watts PJ (2003). Odour Research and Emission Rates for the Pig Industry — Final Report, APL Project 1889. APL, Canberra.
Ormerod R (2002). Odour Dispersion Modelling and Impact Assessment Issues. National Workshop on Odour Assessment for Piggeries, Sydney.
Pacific Air and Environment (2003a). Guidance on Meteorological Data for Dispersion Modelling, APL Project 1980 (Task 1). APL, Canberra.
Pacific Air and Environment (2003b). Guidance on Odour Dispersion Model Selection and Application, APL Project 1980 (Task 2). APL, Canberra.
Pacific Air and Environment (2003c). Evaluation of the 98th Percentile 1-hour Concentration as an Indicator of Odour Impact. APL Project 1980 (Task 3). APL, Canberra.
Smith RJ, Dalton P and DeBruyn J (1999). Assessment and Reduction of the Odour Impact of Piggeries — Final Report. Pig Research and Development Corporation, Canberra.
Standards Australia/Standards New Zealand (2001). Australian/New Zealand Standard 4323.3 — Stationary source emissions-Part 3: Determination of odour concentration by dynamic olfactometry.
USEPA (United States Environmental Protection Agency) (2000). Meteorological Monitoring Guidance for Regulatory Modeling Applications, EPA-450/R-99-005. Washington DC.
VDI (Verein Deutscher Ingeneure) (1992). Standard 3882: Olfactometry — determination of odour intensity.
Watts PJ, Tucker RW, Pittaway PA, McGahan EJ, Kruger IR and Lott SC (2002). Low Cost Alternatives for Reducing Odour Generation, APL Project 1629 Report Part B — Case Studies of Solids Separation Systems (Milestone 5). APL, Canberra.
Ap
pen
dix
A
135
136
137
Information to assist in deciding resource and amenity vulnerability is supplied in the tables below. Since it is not possible to represent all situations that will occur on all farms, discretion should be used when evaluating the site vulnerability using these tables. Reasons for the vulnerability ratings should be documented in the comments sections of the table to more readily identify required environmental improvement or monitoring later in the risk assessment process.
community amenity.
surface water quality and availability
groundwater quality and availability
soils of areas of by-product use (if using by-products on-farm)
The first step in an environmental risk assessment is to rate the vulnerability of each of the major natural resources or amenities associated with the piggery, including:
B1 Natural resources and amenity (vulnerability ratings)
evaluate the likelihood of an environmental impact.
rate the risk of each of the major design and operation features of the piggery
rate the vulnerability of the major natural resources
The purpose of an environmental risk assessment is to identify any actual or likely impacts that a piggery or proposed piggery development may pose to the environment. This provides the basis for reducing impacts (or risks of impacts) through improved design, improved management or monitoring. There are three steps in this process:
Appendix B Environmental risk assessment
Ap
pen
dix
B
B1.1 Vulnerability rating — soils in areas of by-product use
Rating 1 Rating 2 Rating 3 Rating 4
Areas of by-product use, including outdoor rotational piggeries, are located on flat or gently sloping land.
Soils are:
deep (at least 1.0 m to parent material)
loam (25–30% clay) to medium clay (45–55% clay)
not subject to erosion, salinity, sodicity, soil structural decline, waterlogging or chemical contamination
suited to most crop production.
Areas of by-product use, including outdoor rotational piggeries, are located on land with a slope of less than 5%.
Soils are:
moderately deep (0.5–1.0 m to parent material)
sandy-loam (10–25% clay) to heavy clay (>50% clay)
suited to a range of crop production.
Areas of by-product use, including outdoor rotational piggeries, are located on land with a slope of 5–10%.
Soils are:
shallow (0.25–0.5 m to parent material)
sandy loam (10–25% clay)
suited to limited crop production options.
Areas of by-product use, including outdoor rotational piggeries, are on steep land (eg >10% slope).
Soils are:
very shallow (less than 0.25 m to parent material)
very sandy (<5% clay, >85% sand)
only suited to grazing or forestry.
Comments:
Insert highest rating:
138
B1.2 Vulnerability rating — groundwater quality and availability
Rating 1 Rating 2 Rating 3 Rating 4
Groundwater is well protected (eg at least 40 m below the surface OR groundwater is at least 20 m beneath the surface and there is a significant clay band over the groundwater).
Nearby groundwater sources are only used for irrigation.
If groundwater is used in the piggery, there is ample allocation and supply that is of a suitable quality to meet requirements.
Groundwater is quite well protected (eg at least 30 m beneath the surface OR groundwater is at least 20 m beneath the surface and there is loam or clay-loam soil over the groundwater OR groundwater is at least 10 m beneath the surface and there is a significant clay band over the groundwater).
Nearby groundwater sources are only used for irrigation or stock.
If groundwater is used in the piggery, there is ample allocation and supply that is of a suitable quality to meet requirements.
Groundwater is fairly well protected (eg at least 20 m beneath the surface OR is at least 10 m beneath the surface and there is a loam or clay-loam soil over the groundwater OR groundwater is at least 5 m beneath the surface and there is a significant clay band over the groundwater).
Nearby groundwater sources are not used for human consumption.
If groundwater is used in the piggery, there is sufficient allocation and supply that is of a suitable quality to meet requirements.
Groundwater is quite vulnerable (eg less than 5 m below the surface and overlain by a clay layer OR is less than 10 m beneath the soil surface and overlain by a loam or lighter soil).
Nearby groundwater sources are used for human consumption.
If groundwater is used in the piggery, there is marginal or insufficient allocation or supply (and no other water source) or the water is of a marginal quality to meet requirements.
Comments:
Insert highest rating:
139
B1.3 Vulnerability rating — surface water quality and availability
Rating 1 Rating 2 Rating 3 Rating 4
Piggery is very well separated from watercourses.
Areas of by-product use, including outdoor rotational piggeries, are very well separated from watercourses and there are vegetative filter strips or terminal ponds between these areas and all watercourses.
Piggery is located above the 1-in-100-year flood line.
Areas of by-product use are located above the 1-in-5-year flood line.
If surface water is used in the piggery, there is ample allocation and supply that is of a suitable quality to meet requirements.
Piggery is well separated from watercourses.
Areas of by-product use, including outdoor rotational piggeries, are separated from all watercourses by vegetative filter strips or terminal ponds.
Piggery is located above the 1-in-100-year flood line.
Areas of by-product use are located above the 1-in-5-year flood line.
If surface water is used in the piggery, there is ample allocation and supply that is of a suitable quality to meet requirements.
Piggery is separated from watercourses.
Areas of by-product use, including outdoor rotational piggeries, are separated from all watercourses.
Piggery is located above the 1-in-50-year flood line.
Areas of by-product use may be located within the 1-in-5-year flood line.
If surface water is used in the piggery, there is sufficient allocation and supply that is of a suitable quality to meet requirements.
Piggery is adjacent to surface water bodies.
Areas of by-product use, including outdoor rotational piggeries, are adjacent to watercourses.
Piggery is located within a declared catchment area.
Piggery is located within the 1-in-50-year flood line.
Areas of by-product use are located within the 1-in-5-year flood line.
If surface water is used in the piggery, there is marginal or insufficient allocation (and no other water source) or supply or the water is of a marginal quality to meet requirements.
Comments:
Insert highest rating:
140
141
B1.4 Vulnerability rating — community amenity
Rating 1 Rating 2 Rating 3 Rating 4 Piggery meets Level 1 separation distance formula. All surrounding land is designated rural and is not marked for future development. The piggery is well concealed from roads and/or neighbours. Entrance point to farm has at least 300 m good visibility in both directions. Except under exceptional circumstances, vehicle movements and other noisy activities occur only during the day. All mechanical equipment used on-farm is fitted with manufacturer-specified exhaust devices. Dust from traffic movements is controlled or managed and feed dust is controlled through appropriate milling practices (if on-farm milling). There is a complaints management procedure in place that includes complaints recording, investigation and corrective action, along with consultation with the complainant. There are regular checks at the property boundary for unacceptable levels of odour, dust and noise. Mediation is used to settle unresolved disputes
Piggery meets Level 1 separation distance formula. All surrounding land is designated rural but may be planned for future development. The piggery is quite well concealed from roads and/or neighbours. Entrance point to farm has at least 200 m good visibility in both directions. Vehicle movements and other noisy activities are scheduled to occur only during the day. All mechanical equipment used on-farm is fitted with appropriate exhaust devices Dust from traffic movements is managed and feed dust is controlled through appropriate milling practices (if on-farm milling). There is a complaints management procedure in place that includes complaints recording, investigation and corrective action, along with consultation with the complainant. Some checks are made at the property boundary for unacceptable levels of odour, dust and noise. Mediation is sometimes used to settle unresolved disputes.
Piggery fails Level 1 separation distance formula by less than 20%. Surrounding land is designated rural but is planned for future development. The piggery is partially concealed from roads and/or neighbours. Entrance point to farm has at least 150 m good visibility in both directions. Vehicle movements and other noisy activities are mainly scheduled to occur both during the day and at night. Most of the mechanical equipment used on-farm is fitted with appropriate exhaust devices. There are no specific dust control practices. There is a complaints management procedure in place that includes complaints recording, investigation and corrective action. Irregular checks are made at the property boundary for unacceptable levels of odour, dust and noise. Rare participation in mediation to settle unresolved disputes.
Piggery fails Level 1 separation distance formula by more than 20%. Surrounding land is not designated rural. The piggery is clearly visible from roads and/or by neighbours. Entrance point to farm has less than 150 m good visibility in both directions. There is no specific scheduling of vehicle movements and other noisy activities, and these sometimes occur at night. Most of the mechanical equipment used on-farm is not fitted with exhaust devices. There are no specific dust-control practices. There is no complaints management procedure in place. No checks are made at the property boundary for unacceptable levels of odour, dust and noise. No dispute resolution is undertaken.
Comments:
Insert highest rating:
142
B2 Design and operation (risk assessment)
The second step of the environmental risk assessment is to rate the risk of each of the major design and operation features of the piggery, including:
pig accommodation
the nutrient content of manure
the effluent collection system
the solids separation system
the effluent treatment system
solid by-product storage/treatment
carcase management
design and management of areas of by-product use
chemical storage and use.
Not all of the factors will be applicable to all enterprises. For example, not all piggeries will have a solids separation system. Where factors are irrelevant for a given situation, they do not require evaluation.
To assist in deciding the risk, parameters applicable to each rating are supplied in the tables. Since it is not possible to represent all situations that will occur on all farms, some discretion should be used when evaluating the risk using these tables. Documenting the reasons for the risk ratings in the comments sections of the tables will enable identification of required environmental improvement or monitoring later in the risk assessment process.
B2.1 Risk assessment — pig accommodation
Rating 1 Rating 2 Rating 3 Rating 4 Shed bases are concreted and impermeable.
Feedlot piggery pen bases are low permeability (design permeability of less than 1 × 10⁻⁹ m/s for a depth of 300 mm).
Feedlot piggery pens are regularly cleaned.
Stocking densities comply with minimum recommended stocking densities for accommodation type.
Except for dunging areas, the bedding in deep litter shed is always kept dry and friable.
Controls are in place to prevent the ingress or outflow of water from sheds and feedlot pens.
Wash-down water from sheds is always controlled.
Shed bases are concreted and impermeable.
Feedlot piggery pen bases are low permeability (design permeability of less than 1 × 10⁻⁹ m/s for a depth of 300 mm).
Feedlot piggery pens are mostly cleaned.
Stocking densities comply with minimum recommended stocking densities for accommodation type.
Except for dunging areas, the bedding in deep litter sheds is mostly kept dry and friable.
Controls are in place to prevent the ingress or outflow of water from sheds and feedlot pens.
Wash-down water from sheds is always controlled.
Shed bases are concreted or well-compacted impermeable clay if deep litter shed.
Feedlot piggery pen bases are low permeability, having been well compacted with earthmoving equipment.
Feedlot piggery pens are sometimes cleaned.
Stocking densities comply with minimum recommended stocking densities for accommodation type.
There is always sufficient dry bedding in deep litter sheds for the pigs to lie down.
Controls are in place to mostly prevent the ingress or outflow of water from sheds and feedlot pens.
Wash-down water from sheds is mostly controlled.
Shed bases are either not compacted or not impermeable, or compaction standard unknown if deep litter shed.
Feedlot piggery pen bases are not compacted.
Feedlot piggery pens are never cleaned.
Stocking densities do not comply with minimum recommended stocking densities for accommodation type.
There is frequently either insufficient dry bedding for the pigs to lie down or there is free water in deep litter sheds.
No controls are in place to prevent the ingress or outflow of water from sheds or feedlot pens.
Wash-down water from sheds is not well controlled.
Comments:
Insert highest rating:
143
B2.2 Risk assessment — nutrient content of manure
Rating 1 Rating 2 Rating 3 Rating 4
The quantity of effluent and solids used in each application is measured and recorded.
Each by-product used is chemically analysed at least annually.
The quantity of nutrients in the piggery by-products, including for outdoor rotational piggeries, has been estimated using conservative figures from accepted nutrient mass balance models or publications.
The quantity of nutrients in by-products applied to land, including for outdoor rotational piggeries, is estimated using non-Australian data.
The quantity of nutrients applied, including for outdoor rotational piggeries, is never measured or estimated.
Comments:
Insert highest rating:
144
B2.3 Risk assessment — effluent collection system
Rating 1 Rating 2 Rating 3 Rating 4 Stormwater runoff is excluded from entering the effluent collection system.
Effluent collection systems for sheds are concreted and impervious.
Feedlot drains have a maximum design permeability of 1 × 10⁻⁹ m/s for a depth of 300 mm.
No manure solids are present in the effluent drains or pits after flushing or draining of the sheds.
Effluent pits, sumps and drains are sized so that they do not overtop.
There are appropriate contingency measures (eg back-up pumps) to prevent spills from the effluent collection system.
Flushing drains are flushed daily and static pits are emptied at least weekly.
Drains, pits and sumps are inspected daily for solids accumulation, leakage and deterioration.
Stormwater runoff is excluded from entering the effluent collection system.
Effluent collection systems for sheds are concreted and impervious.
Feedlot drains have a maximum design permeability of 1 × 10⁻⁹ m/s for a depth of 300 mm.
Minimal manure solids are present in the effluent drains or pits after flushing or draining of the sheds.
Effluent pits, sumps and drains are sized so that they do not overtop.
Flushing drains are flushed at least every second day and static pits are emptied at least fortnightly.
Drains, pits and sumps are inspected weekly for solids accumulation, leakage and deterioration.
Stormwater runoff can sometimes enter the effluent collection system.
Integrity of sealing of effluent collection systems or drains is unknown.
Some manure solids are in the effluent drains or pits after flushing or draining of the sheds.
Effluent sumps and drains occasionally overtop.
Flushing drains are flushed at least twice a week and static pits are emptied at least every three weeks.
Drains, pits and sumps are inspected fortnightly for solids accumulation, leakage and deterioration.
Stormwater runoff frequently enters the effluent collection system.
Effluent collection systems are not impervious (eg poorly compacted earthen drains).
Substantial manure solids are present in the effluent drains or pits after flushing or draining of the sheds.
Effluent sumps and drains are inadequately sized to prevent overtopping and regularly overtop.
There are no contingency measures (eg back-up pumps) to prevent spills from the effluent collection system.
Flushing drains and static pits are emptied infrequently.
Drains, pits and sumps are infrequently inspected for solids accumulation, leakage and deterioration.
Comments:
Insert highest rating:
145
B2.4 Risk assessment — solids separation system
Rating 1 Rating 2 Rating 3 Rating 4 The solids separation system is checked daily and regularly cleaned to ensure that it is performing to the design specification.
The out-loading bay, where present, is kept clean of excess solids. There is no significant spillage from transport vehicles.
The system and the solids storage areas are bunded to prevent ingress of stormwater and outflow of effluent.
The system and the solids storage areas are located on an impervious area to prevent groundwater contamination.
The solids separation system is checked at least weekly and regularly cleaned to ensure that it is performing to the design specification.
The out-loading bay, where present, is kept clean of excess solids. There is no significant spillage from transport vehicles.
The system and the solids storage areas are bunded to prevent ingress of stormwater and outflow of effluent.
The system and the solids storage areas are located on an impervious area to prevent groundwater contamination.
The solids separation system is checked at least fortnightly and regularly cleaned to ensure that it is performing to the design specification.
The out-loading bay, where present, is generally kept clean of excess solids. There is some spillage from transport vehicles.
The system and the solids storage areas are bunded to prevent ingress of stormwater and outflow of effluent.
The system and the solids storage areas are located on a compacted area.
The solids separation system is not regularly checked or cleaned to ensure that it is performing to the design specification.
The out-loading bay, where present, is not kept clean of excess solids. There may be significant spillage from transport vehicles.
The system and the solids storage areas are not bunded.
The system and the solids storage areas are not located on a compacted area, or extent of compaction is unknown.
Comments:
Insert highest rating:
146
B2.5 Risk assessment — effluent treatment system
Rating 1 Rating 2 Rating 3 Rating 4
The active capacity of any primary effluent treatment ponds is sized and maintained to treat the expected effluent stream, or the ponds are covered.
Inlets and outlets to effluent treatment ponds are positioned and designed to prevent short-circuiting.
Effluent treatment ponds are sealed to achieve a design permeability of less than 1 × 10⁻⁹ m/s for a depth of 300 mm or 450 mm for ponds deeper than 2 m.
The depth to the water table from the base of each effluent treatment pond is always at least 2 m.
All effluent treatment ponds are designed with at least 500 mm freeboard.
The pond system has sufficient storage for an average overtopping frequency of less than once every 10 years.
Effluent collection for feedlot piggeries meets all the above criteria.
There are regular daily effluent inflows to primary effluent treatment ponds for shed-based piggeries.
The active capacity of any primary effluent treatment ponds is sized and maintained to treat the expected effluent stream, or the ponds are covered.
Inlets and outlets to effluent treatment ponds are positioned and designed to minimise short-circuiting.
Effluent treatment ponds are sealed to achieve a design permeability of less than 1 × 10⁻⁹ m/s for a depth of 300 mm or 450 mm for ponds deeper than 2 m.
The depth to the water table from the base of each effluent treatment pond is always at least 2 m.
All effluent treatment ponds are designed with at least 500 mm freeboard.
The pond system has sufficient storage for an average overtopping frequency of less than once every 10 years.
Effluent collection for feedlot piggeries meets all the above criteria.
Effluent inflows to primary treatment ponds occur at least twice a week for shed-based piggeries.
The active capacity of any primary treatment ponds is inadequate to treat the expected effluent stream, or it is not known whether the ponds are adequately sized.
Inlets and outlets to effluent treatment ponds may allow some short-circuiting.
Effluent treatment ponds are unsealed, or the extent of sealing is unknown but the ponds are located on non rocky soil with a clay content exceeding 20%.
The depth to the water table from the base of each effluent treatment pond may be less than 2 m.
The effluent treatment ponds are designed with at least 300 mm freeboard.
The pond system probably has an average overtopping frequency of less than once every 10 years.
Effluent collection for feedlot piggeries meets all the above criteria.
Effluent inflows to primary treatment ponds occur less than twice per week for shed-based piggeries.
The active capacity of any primary treatment ponds is inadequate to treat the expected effluent stream, or it is not known whether the ponds are adequately sized.
Inlets and outlets to effluent treatment ponds allow significant short-circuiting.
Effluent treatment ponds are unsealed and located on soil with a clay content of less than 20%, or the extent of sealing is unknown and the ponds are located on a rocky soil with a clay content of less than 20%.
The depth to the water table from the base of each effluent treatment pond is likely to be less than 2 m at times.
The effluent treatment ponds are designed with less than 300 mm freeboard.
The pond system has insufficient storage for an average overtopping frequency of less than once every 10 years, or the design overtopping frequency is unknown.
Effluent collection for feedlot piggeries meets all the above criteria.
Effluent inflows to primary treatment ponds occur less than once per week for shed-based piggeries.
Solid by-product storage areas are bunded to exclude stormwater runoff and prevent effluent outflows.
Leachate from the solid by-product storage areas is directed to effluent treatment or storage ponds.
The bases of solid by-product storage areas are sealed for a design permeability of 1 × 10⁻⁹ m/s for a depth of 300 mm.
The depth to water tables beneath the base of solids storage areas exceeds 2 m at all times.
Solid stockpiles/windrows are always managed to maintain low odour emissions.
Solid by-product storage areas are bunded to exclude stormwater runoff and prevent effluent outflows.
Leachate from the solid by-product storage areas is mostly directed to effluent treatment or storage ponds.
The bases of solid by-product storage areas are sealed for a design permeability of 1 × 10⁻⁹ m/s for a depth of 300 mm.
The depth to water tables beneath the base of solids storage areas exceeds 2 m at all times.
Solid stockpiles/windrows are mostly managed to maintain low odour emissions.
Solid by-product storage areas are partly bunded to exclude stormwater runoff and prevent effluent outflows.
Leachate from the solid by-product storage areas may not be directed to effluent treatment or storage ponds.
The bases of solid by-product storage areas are compacted.
The depth to water tables beneath the base of solids storage areas may be less than 2 m at times.
Solid stockpiles/windrows sometimes produce significant odour emissions.
Solid by-product storage areas are not bunded.
Leachate from the solid by-product storage areas is not directed to effluent treatment or storage ponds.
The bases of solid by-product storage areas are unsealed.
The depth to water tables beneath the base of solids storage areas may be less than 2 m at times.
Solid stockpiles/windrows regularly produce significant odour emissions.
Comments:
Insert highest rating:
148
B2.7 Risk assessment — carcase management
Rating 1 Rating 2 Rating 3 Rating 4 Dead pigs are always removed from the sheds or pens daily.
There is always same-day management of carcases.
Carcase management is by rendering OR
Carcases are buried in properly designed and managed pits (ie sealed for a maximum design permeability of 1 × 10⁻⁹ m/s for a depth of 300 mm or with at least 300 mm of low permeability material, bases are always at least 2 m above groundwater, pits are bunded to exclude stormwater runoff, carcases are always immediately covered with at least 300 mm of soil) OR
Carcases are composted on a properly designed and managed base (ie sealed for a maximum design permeability of 1 × 10⁻⁹ m/s for a depth of 300 mm or with at least 300 mm of low-permeability material, bases are always at least 2 m above groundwater, with the carcases always kept covered with at least 300 mm of sawdust or alternative carbon source).
There is a contingency plan in place for mass mortalities.
Dead pigs are mostly removed from the sheds or pens daily.
Carcase management always occurs within 36 hours of death.
Carcase management is by rendering OR
Carcases are buried in well-designed and managed pits (ie constructed in compacted soil with a clay content of at least 20%, bases are always at least 2 m above groundwater, bunded to exclude stormwater runoff, carcases are always immediately covered with soil) OR
Carcases are composted on a well-designed and managed base (ie constructed on compacted soil with a clay content of at least 20%, bases are always at least 2 m above groundwater, bunded to exclude stormwater runoff, carcases are always immediately covered with sawdust or alternative carbon source).
There is a contingency plan in place for mass mortalities.
Dead pigs are usually removed from the sheds or pens daily.
Carcase management always occurs within 48 hours of death.
Carcase management is by rendering OR
Incineration in a properly designed and operated incinerator OR
Carcases are buried in fairly well-designed and managed pits (ie constructed in soil with a clay content of at least 20%, bases are always at least 2 m above groundwater, carcases are always immediately covered with soil) OR
Carcases are composted on a fairly well designed and managed base (ie constructed on soil with a clay content of at least 20%, bases are always at least 2 m above groundwater, carcases are always immediately covered with sawdust or alternative carbon source).
There is no contingency plan in place for mass mortalities.
Dead pigs are frequently left in the sheds or pens for over 24 hrs.
Carcase management does not always occur within 48 hours of death.
Carcase management is by burning OR
Carcase management is by dumping OR
Carcases are buried in poorly designed and managed pits (ie constructed in soil with a clay content of less than 20%, bases may sometimes be within 2 m of groundwater, pits are not bunded, carcases are not always covered with soil) OR
Carcases are composted on a poorly designed and managed base (ie constructed on soil with a clay content of less than 20%, bases may sometimes be within 2 m of groundwater, not bunded, carcases are not always covered).
There is no contingency plan in place for mass mortalities.
Comments:
Insert highest rating:
149
B2.8 Risk assessment — design and management of areas of by-product use
Rating 1 Rating 2 Rating 3 Rating 4 The nutrients in by-products are always budgeted to match nutrient removal by plant harvest (based on past property yields and tissue analysis data or book values for plant nutrient content), plus nitrogen volatilisation losses and safe phosphorus storage. Nutrient export from areas of by-product use is minimised through good management and physical barriers (appropriately designed vegetative filter strips, terminal ponds to catch the first 12 mm of runoff, contour banks or maintaining average ground cover over whole area of at least 70%) and good farming practices (eg conservation tillage). Effluent is only irrigated when the soil is dry enough to absorb the water and is applied in small, regular amounts. By-products are spread evenly. High-pressure spray guns are not used. Flood irrigation is only used on sites with an even grade and loam or heavier soils and with good flow control methods.
The nutrients in by-products are always budgeted to match nutrient removal by plant harvest (based on typical district harvested yields and tissue analysis or book values for nutrient content of plants), plus nitrogen volatilisation losses and safe phosphorus storage. Nutrient export from areas of by-product use is minimised through good management and physical barriers (vegetative filter strips 5 m wide, contour banks or maintaining average ground cover over whole area of at least 70%) and good farming practices (eg conservation tillage). Effluent is only irrigated when the soil is dry enough to absorb the applied water. By-products are spread fairly evenly. High-pressure spray guns are not used. Flood irrigation only used on sites with an even grade and loam or heavier soils and with adequate flow control methods.
The nutrients in by-products generally match (within 10%) nutrient removal by plant harvest (estimated using typical district harvested yields and book values for nutrient content of plants), plus nitrogen volatilisation losses and safe phosphorus storage. Nutrient export from areas of by-product use is minimised through good management and appropriate physical barriers (vegetative filter strips 5 m wide, contour banks or maintaining average ground cover over whole area of at least 70%) and good farming practices (eg conservation tillage). Effluent is mostly only irrigated when the soil is dry enough to absorb the applied water. Effluent and solid by-products are not spread evenly. Flood irrigation only used on sites with a fairly even grade and loam or heavier soils and with some flow control methods.
Nutrient additions in by-products are not budgeted to match nutrient removals by plant harvest plus nitrogen volatilisation losses and safe phosphorus storage. There are no specific measures in place to prevent nutrient export from areas of by-product use. Effluent is regularly irrigated when the soil is not dry enough to absorb the applied effluent. By-products are spread very unevenly. Flood irrigation is used on sites with uneven grades or soils that are sandy-loam or lighter or where there are inadequate flow control methods.
Comments: Insert highest rating:
150
151
B2.9 Risk assessment — chemical use and storage
Rating 1 Rating 2 Rating 3 Rating 4 Material Safety Data Sheets are provided for all chemicals used on-farm. There is minimal storage of chemicals on-farm. All storage and use is in accordance with workplace health and safety codes of practice. All staff trained in the correct handling and use of chemicals. All chemicals applied at concentrations that strictly adhere to the manufacturers’ instructions or to the state agricultural department’s specifications. Empty containers disposal is in accordance with manufacturers, instructions.
Material Safety Data Sheets are provided for all chemicals stored and used on-farm. All chemicals and fuels stored and used in accordance with workplace health and safety codes of practice. All chemicals applied at concentrations that strictly adhere to the manufacturers’ instructions or to the state agricultural department’s specifications. All staff trained in the correct handling and use of chemicals. Empty containers disposed of as per manufacturers, instructions.
Chemical applications do not always adhere to manufacturers’ instructions or to the state agricultural department’s specifications. Empty containers disposal not always immediate or not strictly in accordance with manufacturers’ instructions. Some Material Safety Data Sheets (MSDS) provided for chemicals stored and used on farm. Chemicals sometimes stored outside. Only manager trained in the correct handling and use of chemicals.
No Material Safety Data Sheets are provided. Chemicals stored or used on-farm not approved by the Australian Pesticides and Veterinary Medicines Authority. No staff trained in the correct handling and use of chemicals. Chemical application does not follow manufacturers’ instructions or the state agricultural department’s specifications. Empty chemical containers lying around farm. Chemicals stored outside.
Comments:
Insert highest rating:
B3 Overall risk assessment
The third step in evaluating the likelihood of an environmental impact is assessment of the combined effect of resource vulnerability and the design and operation risk. The two-dimensional matrix below is used for this step.
The overall risk can be used to help decide the action to be taken. A low overall rating would not trigger any action. A medium overall rating may trigger some action. A high overall rating would trigger some action. The design and/or operation of the piggery should be examined to decide the most appropriate action, which may take the form of environmental improvements or monitoring. Examining the reasons for vulnerability and risk ratings listed in the applicable tables can assist in deciding the action to be taken.
B3.1 Environmental risk assessment matrix
The environmental risk assessment matrix should be completed by multiplying the vulnerability rating designated for each natural resource and amenity category rating by the risk rating designated for each design and operation factor. The shaded cells in the table should not be filled in.
Design and operation risk ratings (1–4) (based on site assessment)
Natural resource vulnerability ratings (1–4) Soils of areas of
by-product use Groundwater quality and availability
Surface quality and availability
Community amenity
Pig accommodation
Nutrient content of manure
Effluent collection system
Solids separation system
Effluent treatment system
Solid by-product storage/treatment
Carcase management
Area of by-product use — design and management
Chemical storage
A combined rating of 1–4 means a low risk and would not trigger any action. A combined rating of 5–11 means a medium risk and may trigger explanation or action. A combined rating of 12–16 means a high risk and would trigger explanation or action.
152
For proposed piggeries, actions might involve choosing a better site for piggery facilities or raising the standard of design. For existing piggeries, actions would be to improve the environmental performance through better design, management or monitoring. Refer to the examples that follow.
B4 Example risk assessment
The examples below assess the impact of carcase management practices on groundwater both for a proposed piggery and for an existing piggery.
B4.1 Proposed piggery
Groundwater vulnerability
Groundwater is less than 10 m beneath the soil surface and loam or lighter soil overlies it (rating 4).
Nearby groundwater sources are only used for irrigation (rating 1).
Groundwater is not used in the piggery (not applicable).
Highest rating is 4, so rating 4 applies.
Mortality management
Dead pigs will always be removed from shed daily (rating 1).
There will always be same-day management of carcases (rating 1).
It is proposed to bury carcases in pits, which are fairly well designed and managed, in the loam soils that exist on the site (rating 3).
There is a contingency plan in place as part of the environmental management plan for mass mortalities (rating 1).
Highest rating is 3, so rating 3 applies.
Overall risk rating
Groundwater vulnerability rating is 4
Mortality management rating is 3
4 × 3 = 12
A combined rating of 1–4 = low risk, no action.
A combined rating of 5–11 = medium risk, may trigger explanation or action.
A combined rating of 12–16 = high risk, would trigger explanation or action.
Hence, the proposed mortality management practices would pose a high risk at this site, triggering the need for changes to the management of mortalities. In this case, the proposal could be to either bury the pigs in pits or compost them on a properly designed and managed base (ie sealed for a maximum design permeability of 1 × 10⁻⁹ m/s for a depth of 300 mm or with at least 300 mm of low-permeability material, bases at least 2 m above groundwater always, carcases always covered with at least 300 mm of sawdust or alternative carbon source if composted or always immediately covered with at least 300 mm of soil). This would reduce the mortality management rating to 1 and the overall rating to 4 (low risk).
Ap
pen
dix
B
153
B4.2 Existing piggery
Groundwater vulnerability
Groundwater is 12 m below soil and a significant heavy clay layer overlies it (rating 2).
Nearby groundwater sources are only used for irrigation (rating 1).
Groundwater is not used in the piggery (not applicable).
Highest rating is 2, so rating 2 applies.
Mortality management
Dead pigs are always removed from the shed daily (rating 1).
There is always same-day management of carcases (rating 1).
Carcase management is by burial in properly designed and managed pits (rating 1).
There is no contingency plan in place for mass mortalities (rating 3).
Highest rating is 3, so rating 3 applies.
Overall risk rating
Groundwater vulnerability rating = 2
Mortality management rating = 3
2 × 3 = 6
A combined rating of 1–4 = low risk, no action.
A combined rating of 5–11 = medium risk, may trigger explanation or action.
A combined rating of 12–16 = high risk, would trigger explanation or action.
Hence, the operation poses a medium risk, triggering further investigation or action. In this case, the development of a plan for mass carcase disposal would be appropriate. This would reduce the mortality management rating to 1 and the overall rating to 2 (low risk).
154
Appendix C Complaints register
The rate of complaints received can not be used as a sustainability indicator as it is an imprecise measure of community amenity impact. However, any complaint should be taken seriously by the piggery operator, and should be recorded and properly investigated. Full details of complaints received, results of investigations into complaints, and corrective actions should be recorded in a ‘complaints register’. An example of a complaints register form is below.
Complaints register Complaint details Date of complaint
Time of complaint
Nature of complaint (eg odour, dust, noise, surface water)
Name of person advising of complaint
Method of complaint
Name of complainant
Complainant contact details
Investigation details
Temperature at time of complaint Cold | Cool | Mild | Warm |Hot |Very hot
Wind strength at time of complaint Calm | Light | Moderate | Fresh | Strong | Gale
Wind direction at time of complaint
Person responsible for investigating complaint
Investigating method
Significant activities at time of complaint
Findings of investigation
Action taken
Corrective actions
Communications with complainant
Ap
pen
dix
C
155
156
Appendix D Sample analysis
This appendix details methods for collecting, storing, handling and treating samples of water, effluent, solid by-product, plants and soil in order to monitor quality and quantity.
D1 Qualitative analysis
Before any sampling, the following factors must be determined:
sampling locations and the sampling frequency or triggers
a suitable laboratory for sample analysis
couriers that can transport the samples to the laboratory (if needed)
sampling equipment
sampling procedures
monitoring parameters.
Many regulatory agencies have their own water quality monitoring guidelines. Advice should be sought from the relevant agency before planning sampling and monitoring procedures. In the absence of specific advice from the applicable agency, the following guidelines may be used.
D1.1 Sampling location
Surface water
If monitoring is a licence condition, the licence may specify sampling locations. If it does not, suitable sites that can be located and accessed each time monitoring is required must be identified. Selected sampling locations should be discussed with the licensing authorities before sampling, to ensure that the results will be acceptable.
For stream monitoring, samples should be taken immediately upstream and approximately 100 m downstream of an area of interest. The downstream sample should be taken some distance from the area of interest to allow for mixing of any effluent with the stream water. However, if the distance between sampling points is too great, inflows from other sources may affect the results. If another watercourse enters the relevant stream between the two sampling points, samples should also be taken from the secondary watercourse close to its junction with the watercourse of interest.
Contaminants within a terminal pond may disperse slowly. It is therefore appropriate to sample close to the entry point of runoff into the pond.
Groundwater
If monitoring is a licence condition, the licence may specify sampling bore or piezometer locations. A piezometer is a non-pumping well, generally of small diameter with a short screen through which groundwater can enter. If sampling locations are not detailed on the licence conditions, or if monitoring is voluntary, suitable monitoring bores or piezometers must be identified or installed. These must be installed correctly; depth and casing are particularly important. Monitoring bores or piezometers may also need to be registered before construction. The relevant piggery regulatory agency should be consulted.
Ap
pen
dix
D
157
As groundwater may move extremely slowly, bores or piezometers should be located in close proximity, and downstream, of the area for monitoring. It is also advisable to locate a bore or piezometer above the area of interest, for comparison. Both bores should tap into the same aquifer. A network of bores will provide better information than a single monitoring bore plus background bore. However, it may be too expensive to install several bores.
Effluent
Effluent should be sampled from the sampling stopcock, priming plug or main outlet of the effluent irrigation pump. If this is not possible, collect the sample from the pond from which irrigation water will be drawn.
Solid by-products
A separate sample is needed for each type of solid by-product (eg screenings, sludge, spent bedding and each type of compost). If screenings are spread fresh, then a fresh sample should be collected. If screenings are composted before spreading, then a composted sample should be collected.
Soil
For soils, each sampling location should represent a particular type of soil and general land use (including land use and effluent or solids spreading rates).
The following steps will help decide how many sampling locations are needed:
1. Divide each area used for effluent irrigation or solids spreading according to soil types. Dig some holes and compare the soils of each hole. (Recording information as you go is important!)
2. Divide each area on the basis of land use, as sustainable spreading rates vary widely depending on whether the land is grazed or used to grow a crop. Areas with different land uses should be monitored separately. However, it is not necessary to provide a monitoring plot in each separate paddock if there are similar land uses between paddocks with the same soil type.
3. Divide each area on the basis of by-product type (eg effluent, screenings, sludge, spent litter or compost) and application rate. For instance, there might be two major soil types on the farm. If both soil types are used for growing cereal crops and for effluent irrigation, but at two different rates, you have four different soil type/land use combinations (soil 1 low rate, soil 1 high rate, soil 2 low rate, soil 2 high rate). Similarly, if there is one soil type, but two different land uses (eg cereal crops and grazing), you will have two soil type/land use combinations (soil 1 land use 1, soil 1 land use 2).
4. Identify a 20 m diameter sampling plot for each soil type, by-product and land use combination. This area should be representative of the area most at risk. For instance, if you have two areas of land with similar soils and land uses but different effluent application rates, you may monitor only the area with the highest effluent application rate. This area should also be free from stumps, atypical rockiness, tracks, animal camps and other unusual features.
5. For each soil type to be monitored, you should also locate a 20 m diameter background monitoring plot on an area that has not been used for effluent irrigation, solids spreading or conventional fertiliser spreading. This will be used to compare with monitoring plot
158
data from the effluent and solids spreading areas. It is recognised that it is not always easy to find a suitable background plot.
6. Mark the location of the plots on the property map so that the same sites can be used in subsequent years.
Plants
Any plant samples taken should be representative of the material being harvested. For a grain crop, collect samples from the field bin (or similar). For a baled crop, collect samples of hay. For a silage crop, collect samples of freshly cut material from several bales or bins.
D1.2 Monitoring interval
Surface water
Surface water quality monitoring may be done at a set interval (eg quarterly, biannually or annually) or may be triggered by specific events (eg an overtopping effluent pond). Water quality varies with time of day, flow rate and recent weather conditions, so these factors should be noted at the time of sampling.
If a spill to a watercourse is the trigger for sampling, samples of effluent should be taken during the spill as well as samples from the watercourse.
Groundwater
Groundwater quality monitoring is also usually done at a set interval (eg quarterly, biannually or annually).
Effluent and solid by-products
The interval for monitoring effluent and solid by-products should be based on the level of environmental risk. If monitoring results for the quality of the effluent or solid by-products over several years indicates similar results, the level of monitoring should be reduced from every year to, say, every three years.
Soil
Again, the monitoring interval for sampling soils should be based on the level of environmental risk. Sampling should occur at the end of a cropping cycle or at a time when nutrients are most vulnerable to leaching (before the onset of the wet season).
Plants
For most enterprises, analysis of plant composition should not be required. As a maximum, this should be once per crop (at harvest).
D1.3 Laboratory
The National Association of Testing Authorities Australia accredits laboratories, and those with this (or equivalent) accreditation are preferred for sample analysis. Analysis methods vary between laboratories, which may affect results.
Ap
pen
dix
D
159
D1.4 Transport of samples
If samples cannot be taken directly to the laboratory, a courier should be used to take the samples to the laboratory within the required time frame between collection and analysis.
Samples should arrive at the laboratory within two days of sampling and must be kept on ice over this whole period. If this is not possible, the samples may need to be frozen, but the laboratory should be consulted to confirm this. Sampling should coincide with courier dispatch to minimise the amount of time between sampling and analysis. Ideally, sampling should occur on a Monday or Tuesday so that samples arrive at the laboratory and are promptly analysed, rather than having to sit over a weekend.
D1.5 Sampling equipment
The sampling equipment that may be required is listed below.
Surface water
Appropriate sample containers and preservatives. Most laboratories will supply suitable sample containers, as well as any necessary preservatives. Water quality sampling manuals can also be consulted to determine sample container sizes and required preservatives. Obtaining sample containers from the laboratory reduces the chance of sample contamination and ensures that the sample size is adequate.
A sampling rod. A rod with a large clamp for holding the sampling container allows greater reach when sampling. Otherwise, you can wade to collect the sample. The sample should be taken from upstream of the sampler’s feet, to ensure that disturbed sediment is not collected.
A bucket that has been washed several times with clean water and then rinsed several times with the water to be sampled.
Cheap, styrofoam eskies.
Plenty of crushed ice to pack around the samples in the eskies.
A waterproof pen to mark sample bottles.
Waterproof tape to seal eskies.
Personal protective clothing (eg waterproof boots if wading).
Analysis request forms. Most laboratories have their own analysis request forms and prefer these to accompany samples. Some of the details on the forms can be completed before sampling (eg name, sampling location and analysis parameters). However, some details can only be completed at sampling (eg time of sampling). If analysis request forms are not provided, you will need to make up your own.
An envelope that analysis request forms will fit in.
A pen to complete analysis request forms.
Groundwater
In addition to some of the items in the list above, equipment for groundwater sampling includes:
A sampling bailer or pump to draw water from the monitoring bores. If using a bailer, it should be washed thoroughly with water before use. Bailing is a time consuming method for sampling groundwater. It is also impractical for deep bores. A pump is convenient to use and allows for samples to be quickly collected.
A tape measure to determine depth to groundwater.
160
Effluent
See list for surface water.
Solid by-products
In addition to the equipment listed for surface water sampling, a shovel and small garden trowel are needed. For solid by-products, sampling containers should either be wide-mouthed sampling bottles or plastic bags. Bottles may better suit high-moisture sludge. It is recommended that you obtain these from the chosen laboratory. Bags will suit drier products.
Soil
In addition to some of the items in the list for surface water, equipment needed for soil samples includes:
A soil auger or hydraulic soil sampling rig (these can be hired).
Plastic sample bags. Most laboratories will supply suitable sample bags.
A ruler or tape measure.
A hand trowel.
A plastic sheet.
A bucket that has been washed several times with clean water.
Plants
The sampling equipment for plants may include:
Large paper sample bags. Most laboratories will supply suitable sample bags. Brown paper bags will do.
Disposable gloves.
A clean sampling cup.
A clean bucket.
A waterproof pen to mark sample bags.
Analysis request forms.
An envelope that the analysis request forms will fit in.
A pen to complete analysis request forms.
A box to put the samples in.
D1.6 Sampling procedures
Suggested sampling procedures are listed below.
Surface water
1. Assemble the sample containers and the sample preservatives.
2. With a waterproof pen, label the sample containers with the enterprise name and telephone number, a unique sample number (new numbers should be used at each sampling), the sampling location (eg Deep Creek upstream of effluent irrigation area) and
Ap
pen
dix
D
161
the date of sampling. Label the container instead of the lid, as lids can get mixed up in the laboratory.
3. Complete as many details of the analysis request forms as possible. This should include contact details, sample numbers (matching those recorded on the sample bottles), sampling location, sampling date and analysis parameters.
4. Fill eskies with ice.
5. Before wading into a watercourse (if necessary) first check that it is safe to enter. Hidden obstacles and rapid flowing water pose significant risks, particularly if the sampler is alone.
6. Collect samples directly into sample containers (either a grab sample or a composite sample). A grab sample is one taken by quickly filling sample containers. A composite sample comprises several grab samples collected over several minutes. Composite samples comprising five grab samples should be collected if there is little movement in the watercourse or for dam samples. Stream samples should be collected midstream, clear of bank edges and other potential contaminant sources. If sampling from a terminal pond, take the sample away from the edge of the dam.
7. Remove the sample bottle lid, taking care not to touch the inside of the lid or bottle. Face the mouth of the bottle downwards and plunge into the water. Turn the bottle to a horizontal position facing the current preferably 0.2 m below the water surface (this avoids sampling surface scum). If necessary, create a current by dragging the bottle away from yourself. Remove the bottle as soon as it completely fills. If you are taking a composite sample, you should collect five samples over a period of a few minutes and thoroughly mix these in a clean plastic bucket before pouring the mixed water into a sample bottle. Add any required preservative and replace the lid.
8. Immediately place the sample in an esky, pack crushed ice completely around it and replace the esky lid. Do not put effluent samples in the same esky as surface water samples. Store the esky in the shade.
9. If samples will take longer than 48 hours to get to the laboratory, they should be frozen. Do not completely fill the sample bottle if you intend to freeze the sample.
10. When all other surface water or groundwater samples have been added to the esky, seal it with the waterproof tape.
11. Thoroughly wash hands.
12. Complete the analysis request forms and photocopy for your own records (if you have access to a photocopier or fax machine). Place the original forms in an envelope. Clearly address the envelope to the laboratory and add their phone number. In smaller writing, put the sender’s address and phone number on the envelope. Firmly tape the envelope to the top of the esky. Store the esky in the shade.
13. Deliver the samples or arrange for courier delivery.
14. Contact the laboratory to confirm that the samples were received within 48 hours of sampling.
162
Groundwater
1–4. See steps 1–4 for surface water.
5. Measure the depth to groundwater. Pump several bore volumes from the casing to ensure that you are not sampling stagnant water. Sometimes this will take quite a while.
Collecting grab samples of standing water may provide misleading results since the groundwater may be stratified and this may influence water quality properties. If it is not possible to purge the bore before sampling, the sampling process should not disturb the water within the bore. For shallow piezometers, it may be appropriate to empty the piezometer 1–2 days before sampling and then to allow it to refill.
6. Allow bore to recharge with groundwater. Measure the depth to groundwater. Collect a grab sample using a bailer or pump.
7. Remove the sample bottle lid, taking care not to touch the inside of the lid or bottle. Fill the bottle directly from the bailer or pump. Remove the bottle from the flow as soon as it completely fills. Add any required preservative and replace the lid.
8.–14. See steps 8–14 for surface water.
Effluent
1–4 See steps 1–4 for surface water.
5. Put on disposable gloves if sampling effluent. Avoid splashing eyes with effluent or sample preservatives. Do not inhale aerosols from the effluent being sampled or the preservatives. Do not eat, drink or smoke; carry out standard hygiene practices.
6. If sampling from a pump, start the pump and allow it to run for at least 10 minutes before collecting samples. While you are waiting, rinse the bucket several times with the effluent from the pump. Remove the sample bottle lid, taking care not to touch the inside of the lid or bottle. Sample the effluent by collecting a cup of effluent in the sampling bottle every 3–4 minutes and adding each of these to the bucket until it is half full (10–15 samples). Thoroughly mix the effluent by swirling the bucket. Fill the sample bottle from the composite sample. Add any required preservative and replace the lid.
7. If sampling from a pond, rinse the bucket several times with pond effluent. Remove the sample bottle lid, taking care not to touch the inside of the lid or bottle. Collect effluent by facing the mouth of the bottle downwards and plunging it into the water. Turn the bottle to a horizontal position 0.2 m below the water surface (this avoids sampling surface scum). Create a current by dragging the bottle away from yourself. Remove the bottle as soon as you have filled the container and pour the effluent into the bucket. Repeat this procedure four times, sampling from a different spot in the pond each time. When you have collected five samples, thoroughly mix these before pouring the composite sample into a sample bottle. Add any required preservative and replace the lid.
8–14 See steps 8–14 for surface water.
Solid by-products quality
1–4 See steps 1–4 for surface water.
Ap
pen
dix
D
163
5. Put on disposable gloves and dust mask (if sampling dusty products). When sampling, do not eat, drink or smoke; carry out standard hygiene practices.
6. If sampling from a pump (eg sludge), start the pump and allow it to run for at least 10 minutes before collecting samples. Remove the sample bottle lid, taking care not to touch the inside of the lid or bottle. Sample the sludge by collecting a cup in the sampling bottle every 3–4 minutes and adding each of these to the bucket until it is half full (10–15 samples). Thoroughly mix the sludge by swirling the bucket. Fill the sample bottle from the composite sample. Add any required preservative and replace the lid.
7. If sampling from a stockpile (screenings, spent litter, compost), use a clean shovel to collect 25 samples of solids (sample size should be about a cup). As you collect each sample, place in the bucket and thoroughly mix with the garden trowel. Place about four cups of the mixed sample into a bottle or bag and seal. Put the bag or bottle inside another bag and seal well.
8–14 See steps 8–14 for surface water.
Soil
1–4 See steps 1–4 for surface water.
When labelling the sample bags, remember to include the sampling depth (eg 0–10 cm).
5. From random locations within each 20 m diameter sampling plot, collect 25 equal-sized samples of soil to a depth of 10 cm. As you go, record a description of the soil sampled. Combine all of the samples in the bucket and thoroughly mix using a hand trowel. Remove rock fragments with a diameter more than 2 cm and large roots. Break up large clods.
6. Pour the mixed composite sample into a cone on the plastic sheet. Divide the cone into four quarters. Discard three and thoroughly mix the remaining quarter. Repeat the procedure with the remaining quarter until the sample size is small enough to fill the sample bag (generally about 400–500 g or 1 lb). Fill the sample bag and immediately place it in an esky.
7. From random locations within each 20 m diameter sampling plot, drill at least five holes to collect subsoil samples. (Drilling more holes provides a more reliable sample. Eight holes are preferred.) As you go, record a description of the soil encountered.
Samples should be collected from the 20–30 cm and 50–60 cm depths. If the base of the root zone is below 60 cm, it is also useful to collect a deeper sample (1.5–2.0 m). Combine all of the samples from the same depth in the bucket and thoroughly mix using a hand trowel. Remove rock fragments with a diameter more than 2 cm and large roots. Break up large clods. Use the same mixing and sub sampling procedure as for the 0–10 cm sample to obtain a 400–500 g sample. Place the sample in the esky.
Sample and analyse either a bulked sample representative of the entire crop or pasture root depth, or a number of samples at different intervals, to determine the phosphorus sorption isotherm.
Never bulk (mix) soils of two different types.
Never mix soil layers (profiles) that are clearly different from each other.
164
Never bulk in depths greater than 30 cm.
8–14 See steps 8–14 for surface water.
It is useful to take note of any unusual changes in the soils and plants of the effluent irrigation areas. These include:
free water on the soil surface. This may indicate waterlogging. Other signs include reduced plant growth, growth of weeds (dock, nutgrass) and drooping foliage with pale leaves
invasion of an area with nettles or fat hen. This may indicate a surplus of nitrogen
yellow or browned off vegetation. This is indicative of toxic nutrient levels or nutrient deficiencies
bare patches in paddocks. These may indicate poor germination due to excess salinity. White crusting on soil surface in dry times may indicate evaporation from a shallow saline water table
areas in effluent-irrigated paddocks that are consistently bare of vegetation. This may indicate too much salinity.
Plants
1–3 See steps 1–3 for surface water.
4. Collect the sample. If possible, this should occur between 8 am and 11 am.
For grain, it is suggested that at least five samples be collected from the field bin (or similar). These should be placed in the bucket and thoroughly mixed with gloved hands. A sub-sample should then be used to fill the sample bag.
For hay or cut forage, collect five sub-samples, thoroughly mix together in a bucket using gloved hands and sub-sample to fill the sample bag.
5. Leave the tops of the paper bags open to allow excess moisture to escape.
6. Put the bags in a box and leave in the shade or a cool place. Do not seal plant or grain samples in plastic bags or leave samples in the sun, as they will sweat and degrade.
7. When the samples are ready for delivery, fold the tops of the bags over and fasten with staples or sticky tape. Place back in the box.
8–10. See steps 12–14 for surface water.
Ap
pen
dix
D
165
D1.7 Recording
Surface water
At each sampling, record:
the location and name of the sampling site (clearly identified location allows return to the same site for future sampling)
the date and time of day that each sampling occurs (water quality varies over time)
the flow rate (in watercourses) or approximate depth of water in terminal ponds (water quality varies with flow rate)
weather conditions at the time of each sampling, as these may influence water quality
the method of sampling (grab sample or composite sample)
the name of the sampler
the time between sampling and dispatch of sample to laboratory
the method of preserving samples (eg sample immediately put on ice in esky)
time samples dispatched to laboratory
analysis parameters requested (preferably keep a copy of the original analysis request forms).
Groundwater
For groundwater, in addition to the list above, add:
the name and location of bore or piezometer
the depth to groundwater.
Remember to keep the original copy of any laboratory analysis reports.
Effluent and solid by-products
It is suggested that original copies of effluent and solid by-product analyses be kept for at least five years or as required by the licensing conditions. The analysis results should be used to calculate appropriate irrigation or spreading rates depending on possible land uses.
If effluent or solid by-products are reused off-site, recipients should be provided with a copy of the analyses each time these products are analysed. The analyses can be used to calculate appropriate irrigation or spreading rates depending on preferred land uses. Recipients of by-product should be advised of the appropriate irrigation or spreading rates.
Soil
Original copies of soil analyses should be kept indefinitely, along with records of sampling locations and land use. This assists with long-term farm management.
Production from land area
Each time crops are harvested from effluent irrigation or solid by-product spreading areas, the yield harvested should be recorded, and the dry matter yield and the approximate nitrogen and phosphorus removal rates should be calculated.
166
D2 Quantitative analysis
D2.1 Effluent
Methods for measuring the quantity of irrigated effluent vary. A flow meter can accurately measure the effluent flow rate. In-line flow meters should be a non-corrosive type. Alternatively, non-contact ultra sonic, Doppler, and non-contact magnetic flow meters that clamp to the outside of the pipe are available, although they are expensive.
A depth gauge in the pond, used with a storage capacity curve, can provide an estimate of the irrigation rate when large volumes are irrigated at a time. The curve shows the volume of effluent in the pond when filled to any depth. The change in depth from the start to the finish of the irrigation should be measured.
For a single hand-shift sprinkler, the pumping rate can be estimated from the time taken to fill a container of known volume. The flow rate must be measured from the irrigation nozzle. It can be very difficult to measure effluent volumes this way. A plastic hose fitted over the nozzle and a 10 L bucket will help. For a sprayline, the outflow from at least three nozzles should be measured. Both sides of double-sided nozzles should be measured. As long as there are not too many pipe-join leaks, this method will give a good estimation.
If effluent is pumped from a tank or sump of known capacity, daily or weekly irrigation volumes may be estimated from the sump or tank volume and the emptying frequency.
If bulk tankers are used to spread effluent, tanker volume and emptying frequency provide a good estimate of the irrigation rate.
The quantity of effluent irrigated, and the paddock involved, should be recorded each time irrigation occurs.
D2.2 Solid by-products
If a tanker of a known volume (L or m3) is used to spread the wet solids, it should be quite easy to estimate the number of loads per hectare. If a manure or fertiliser spreader is used, the spreading rate can be calculated from the volume of the storage hopper, the area of land for spreading, and the bulk density of the solids (as per tanker method). Alternatively, the mass of the solids can be determined by weighing the truck or spreader filled with solids and then subtracting the net weight of the truck or spreader.
The quantity of solids spread, and the paddock involved, should be recorded each time spreading occurs.
Record keeping
Each time effluent is irrigated or solids are spread on-farm, the date, the paddock involved and the quantity of effluent (m3 or ML) or solids (m3, ML or t) involved should be recorded. The application rate (m3/ha, ML/ha or t/ha) should also be calculated.
If effluent or solids are removed off-site, the date, the volume of material involved, the type of material involved, the recipient’s name and the proposed use (eg where the material will be irrigated or spread, the land use of the area involved and the application rate) should be recorded.
Ap
pen
dix
D
167
D2.3 Yield of plants or liveweight gain
It is generally adequate to estimate the nutrients removed from an area by yields and textbook nutrient concentrations of plants.
Measure the yield of plants harvested by weighing or by estimating weight from the number of truck-loads removed. For a crop, the yield from an area should be recorded and a yield per hectare calculated (divide the total yield for the paddock (t) by the area of the paddock (ha)). The yield should then be converted to a dry matter yield. As a guide, grain crops have a dry matter content of about 88% and hay has a dry matter content of about 90%. Freshly harvested forage crops vary more.
As an example, if 4 t/ha of barley is harvested, the dry matter yield is about 3.5 t/ha (4 t/ha × 88/100). From Table 14.4, a 4 t/ha winter cereal crop removes about 80 kg N/ha and 12 kg P/ha. Hence, the 3.5 t/ha crop will remove about 70 kg N/ha and 10.5 kg P/ha (ie 80 kg N/ha × (3.5 t/4 t); 12 kg P/ha × (3.5 t/4 t)).
Laboratory determination of the dry matter and plant tissue analysis can give more accurate nitrogen and phosphorus concentrations of the harvested material.
1 gallon/hour (gph) 0.00125 litres per second (L/s) 1 L/s = 800 gph
E2 Other conversions
1 ML 1 000 000 L = 1000 m3
1 m3 1000 L = 0.001 ML
1 ML/ha 100 mm depth over 1 ha
ppm mg/kg, mg/L
1 mg/kg 1 g/t
1 mg/L 1 kg/ML
Ap
pen
dix
E
169
E3 Water quality conversions
TDS to EC multiply TDS in mg/L by 640 to convert EC to dS/m
Nitrate-nitrogen multiply nitrate-N (mg/L) by 4.427 to convert to nitrate
Nitrite-nitrogen multiply nitrite-N (mg/L) by 3.284 to convert to nitrite
Phosphate-phosphorus multiply phosphate-P (mg/L) by 3.066 to convert to phosphate
Sulphate-sulphur multiply sulphate-S (mg/L) by 2.996 to convert to sulphate
E4 Salinity conversions
From
To
S/m dS/m mS/m uS/m mS/cm uS/cm
TDS (mg/L)
meq/L
S/m × 1 × 10 × 103 × 106 × 10 × 1 04 × 100
dS/m × 0.1 × 1 × 100 × 105 × 1 × 10
mS/m × 10–3 × 0.01 × 1 × 103 × 0.01 × 0.1
uS/m × 10–6 × 10–5 × 10–3 × 1 × 10–5 × 10–4
mS/cm × 10–3 × 1 × 100 × 105 × 1 × 10
uS/cm × 10–4 × 10–3 × 0.1 × 100 × 10–3 × 0.01
TDS (mg/L) × 1.56 × 10–4
× 1.56 × 10–3
× 0.156 × 1.56 × 10–2 × 1.56 × 10–
3
× 1.56 × 1 × 1.56 × 10–2
meq/L × 0.01 × 0.1 × 10 × 104 × 1 × 0.1
170
Glossary
Aerobic pond or lagoon A dam that uses aerobic micro organisms to treat the effluent. These are micro organisms that require free oxygen from the air to function. Consequently, aerobic ponds/lagoons have a large surface area to volume ratio. They are usually less than 1.5 m deep.
Anaerobic pond or lagoon A dam that uses anaerobic micro organisms to treat the effluent. These are micro organisms that do not need free oxygen from the air to function. These lagoons/ponds are usually quite deep (typically 4 m or deeper).
AUSPLUME Environment Protection Authority — Victoria regulatory Gaussian dispersion model.
Available nutrient That portion of any element in the soil that can be readily absorbed and assimilated by growing plants.
Background site A site that is close to the area of interest. It should have a similar soil type and land use to the area of by-product use, but should not have received piggery effluent or solid by-products.
Breeder unit A unit where breeding stock are kept, along with sucker pigs.
Buffer zone An area of land set aside for uses that are compatible with the piggery and with receptors that are sensitive to piggery emissions (for example, residential, commercial and recreation areas). The buffer zone should protect sensitive receptors from being affected by the piggery, and it should protect an established piggery from the encroachment of potentially sensitive receptors. It is not to be used as a substitute for good design and management of the piggery.
Bulking Mixing of soil samples from a paddock or plot to reduce the number of samples for analysis.
Bund Watertight wall designed to prevent liquid escaping as a result of seepage or leaks.
By-product For the purpose of these guidelines, by-products include manure, effluent, waste feed, spent bedding and carcases.
Cation exchange capacity (CEC)
The total of exchangeable cations that a soil can adsorb.
Community amenity A fact or condition being agreeable to the community.
Composite sampling Sample comprising several grab samples collected over minutes, hours or days according to the sampling program.
171
Contamination The release of a contaminant into the environment in the form of gas, odour, liquid, solid, organism or energy.
Controlled drainage area An area that collects contaminated stormwater runoff and excludes clean rainfall runoff.
Dispersion modelling Computer-based software modelling used to mathematically simulate plume dispersion under varying atmospheric conditions; used to calculate spatial and temporal fields of concentrations and particle deposition due to emissions from various types of source.
Electrical conductivity See Salinity.
Erosion The wearing away of the land surface by rain or wind, removing soil from one point to another (for example, gully, rill or sheet erosion).
Exchangeable sodium percentage (ESP)
The percentage of a soil’s cation exchange capacity occupied by sodium.
Extensive piggery A piggery in which the animals rely primarily on foraging and grazing rather than on supplementary feed to meet most (more than 50%) of their nutritional requirements. This type of system is not covered by these guidelines.
Facultative pond A pond or lagoon that uses facultative micro organisms to treat the effluent stream. These are micro organisms that can function in the presence or absence of oxygen from the air. Facultative lagoons are typically 2–3 m deep.
Farrow-to-finish A production system incorporating a breeding herd plus progeny through to finished bacon weight (usually 100–110 kg).
Feedlot outdoor piggery A piggery where the pigs are continuously accommodated in permanent outdoor enclosures that are not rotated.
Freeboard The height of the pond embankment crest above the design’s full storage level. The freeboard protects the bank against wave action and construction inaccuracies.
Gilt A female pig that has reached adult maturity, but not yet been mated.
Grab sample A sample taken by quickly filling a sample container.
Groundwater All water below the land surface that is free to move under the influence of gravity.
Groundwater recharge Replenishing of groundwater naturally by rainfall or runoff.
Grower/grow-out unit A production system where pigs are grown from weaner or grower weight through to pork or bacon weight.
172
Hydraulic load The input of water via precipitation and irrigation applications into a pond or onto land.
Intensive piggery A piggery where pigs are confined within a structure and fed for the purpose of production, relying primarily on prepared or manufactured feedstuffs or rations to meet their nutritional requirements.
Katabatic drift Drainage of air in the absence of wind, whereby odour may drift with minimal dilution to lower areas, following the topography in the same way as watercourses.
Katabatic winds Winds that occur mainly on cloudless nights when the land surface loses heat by radiation. Air that is cooled by contact with the cold land becomes denser than the surrounding air. The force of gravity on it is relatively greater and the air begins to flow down the slopes of mountains and hills. This downward flow becomes particularly evident as the air moves down the bottom of river valleys that lead to lower levels. Generally, these are rather light winds.
Leaching Process whereby soluble nutrients (eg nitrogen) are carried by water down through the soil profile.
Leaching fraction The proportion of input water (rainfall and irrigations) that drains below the root zone.
Manure Faeces plus urine.
MEDLI A Windows®-based computer model for designing and analysing effluent treatment systems and utilisation by land irrigation. It was developed jointly by the CRC for Waste Management and Pollution Control, the Department of Primary Industries and Fisheries — Queensland, and the Department of Natural Resources, Mines and Energy — Queensland.
Multi-site production A production system where there is physical separation of the breeder, weaner and grower pigs. Typically piglets are weaned at 2–4 weeks of age and are transferred to a weaner unit. Weaner pigs are then transferred to a grower unit at 8–12 weeks of age for growing and finishing.
Nutrient A food essential for cell, organism or plant growth. Phosphorus, nitrogen and potassium are essential for plant growth. In excess they are potentially serious pollutants, encouraging unwanted growth of algae and aquatic plants in water. Nitrate-nitrogen poses a direct threat to human health. Phosphorus is considered the major element responsible for potential algal blooms.
173
Odour unit Unit for measuring the concentration of odorous mixtures. The number of odour units is the concentration of a sample divided by the odour threshold or the number of dilutions required for the sample to reach the threshold. This threshold is the numerical value at which 50% of a testing panel (see Olfactometry) correctly detect an odour.
Offensive odour An odour that by reason of its nature, character, components, quality or strength, or the time at which it is made, is likely to be harmful to, and/or to be offensive to, and/or to interfere unreasonably with the comfort or rest of people at or beyond the boundaries of the premises from which the odour originates.
Olfactometry A procedure in which a selected and controlled panel of up to eight respondents is exposed to precise variations in odour concentrations in a controlled sequence. The results are analysed using standard methods to determine the point at which half the panel can detect the odour.
Organic carbon A chemical compound making up organic matter. As organic matter is difficult to measure, it is estimated by multiplying the amount of organic carbon by 1.75.
Organic matter Living or dead plant and animal material.
Pathogens Micro organisms that can cause infections or disease.
pH A measure of the acidity or alkalinity of a product. The pH scale ranges from 1 to 14. A pH of 7 is neutral, a pH below 7 is acidic and a pH above 7 is alkaline.
Phase feeding The use of multiple diets that match the pig’s requirements for optimal growth.
PigBal A nutrient mass balance model for intensive piggeries developed by the Department of Primary Industries and Fisheries — Queensland (Casey et al 2000). It is a Microsoft Excel®-based spreadsheet model that was developed to estimate the waste production of intensive piggeries, and to assist in the design of effluent treatment facilities and in assessing the environmental sustainability of associated land reuse practices. At the time of publishing, the model had not been developed to a fully commercial standard. Copies are available from the department upon request, on the understanding that the model has not yet been finalised because not all the outputs have been thoroughly validated against measured data from operational piggeries.
Piggery complex This includes all buildings where pigs are housed, adjoining or nearby areas where pigs are yarded, tended, loaded and unloaded; areas where manure from the piggery accumulates or is treated pending use or removal; and facilities for preparing, handling and storing feed.
174
Piezometer A non-pumping well, generally of small diameter, that is used to measure the elevation of the water table and for collecting samples for water quality analysis. It generally has only a short well screen through which water can enter.
Pollution Direct or indirect alteration of the environment causing contamination or degradation.
Pond activity ratio (K) A calculated ratio of the rate of biological activity occurring within an anaerobic effluent pond under specific climatic conditions. The biological activity is responsive to seasonal temperature variation and this is used in the development of the pond activity ratio (K) for different geographic locations.
Receptor Person or site that receives and is sensitive to community amenity impacts, including a residential dwelling, school, hospital, office or public recreational area.
Recharge The replenishment of a groundwater body by gravity movement of surplus soil water that percolates through the soil profile.
Riparian land Any land that adjoins or directly influences a body of water. It includes the land immediately beside creeks and rivers (including the bank), gullies that sometimes run with water, areas surrounding lakes and wetlands, and river floodplains that interact with the river during flood.
Rotational outdoor piggery
An outdoor piggery where the pigs are kept in small paddocks that are used in rotation with a pasture or cropping phase. During the stocked phase, the pigs are supplied with prepared feed, but can also forage.
Run-down screen A run-down screen comprises finely spaced stainless steel bars held on an incline by a steel frame. When effluent is poured onto the screen, the liquid and fine solids pass through while the larger solids are retained on the screen.
Runoff Runoff consists of all surface water flow, both over the ground surface as overland flow and in streams as channel flow. It may originate from excess precipitation that cannot infiltrate the soil or as the outflow of groundwater along lines where the water table intersects the earth’s surface.
Salinity Electrical conductivity (EC) is the generally accepted measure of salinity (ie the concentration of salts in solution). The salts that occur in significant amounts are the chlorides, sulphates and bicarbonates of sodium, potassium, calcium and magnesium. In water these salts dissociate into charged ions, and the electrical conductivity of the solution is proportional to the concentration of these ions, providing a convenient means of measuring salinity. Usually expressed as decisiemens per metre (dS/m) or its equivalent, millisiemens per centimetre (mS/cm)
175
Screw press A cylindrical screen with a screw-conveyor in the centre. The conveyor presses solids against a screen to remove moisture. The conveyor also moves solids from one end of the press to the other, to a collection area.
Sedimentation systems These systems remove entrained settled solids from the effluent. A sedimentation system may be a pond, basin or terrace that discharges to a holding pond or evaporation system.
Separation distances The distances between the piggery complex and sensitive receptors (residences, recreational areas, watercourses, public roads etc).
Shandying Diluting effluent with cleaner water
Sludge The accumulated solids separated from effluent during treatment and storage.
Sodium absorption ratio (SAR)
A measure of the sodicity of water. It is the relative proportion of sodium ions to calcium plus magnesium ions. It is important because excess sodium in irrigation waters may adversely affect soil structure and permeability. A higher SAR value equates to a higher sodium content and higher potential for soil problems.
Sodicity An excess of exchangeable sodium causing dispersion to occur.
Standard pig unit (SPU) Pig equivalent to a grower pig (average weight 40 kg) based on volatile solids production in manure.
Surface waters These include dams, impoundments, rivers, creeks and all waterways where rainfall is likely to collect.
Temperature inversion A temperature inversion is said to occur when the air temperature increases with height. A surface inversion is commonly experienced in hollows and valleys, especially in winter on calm, clear nights when radiation has caused considerable cooling and the cold air has sunk; a pool of cold air thus lies there, while on the mountain slopes above the air is warmer. When the sky has been clear and the wind light for some time, it is also usual in fairly level areas in temperate latitudes for a temperature inversion to develop above the surface at night. In winter the inversion may reach a considerable height and may persist for several days, resulting in fog formation and often trapping pollution.
Topography The shape of the ground surface as depicted by the presence of hills, mountains or plains; that is, a detailed description or representation of the features, both natural and artificial, of an area, such as are required for a topographic map.
Total dissolved solids (TDS)
The inorganic salts (major ions) and organic matter/nutrients that are dissolved in water, used as a measure of salinity.
Total solids (TS) Dry matter content of a compound.
176
Volatile solids (VS) The quantity of total solids burned or driven off when a material is heated to 600°C for 1 hour. Volatile solids is a measure of the biodegradable organic solids content of a material. One standard pig unit (SPU) is equivalent to a grower pig based on volatile solids production in manure.
Wastload Developed in South Australia, Wastload is a Microsoft Excel®-based model designed to calculate sustainable by-product spreading rates. Inputs include soil properties, effluent and shandying water composition, land use and harvested yields. Outputs include potential loading rates for nitrogen, phosphorus and potassium, the sustainable rate of effluent and/or solids application and salt dynamics (Clarke 2003).
Watercourse A naturally occurring drainage channel that includes rivers, streams and creeks. It has a clearly defined bed and bank, with water flows at any time. Legal definitions can be found in relevant state or territory acts.
Weaner unit A production system including only weaner pigs. Pigs are transferred to the unit after weaning (usually 2–4 weeks) and are transferred from the unit when they reach the grower stage (usually about 8–12 weeks, typically up to 30 kg).