27
National Food Security Mission 12 th Executive Committee Meeting 03.06.2013 Department of Agriculture TamilNadu
| Date post: | 01-Jan-2016 |
| Category: |
Documents |
| Upload: | arron-henderson |
| View: | 215 times |
| Download: | 2 times |
National Food Security Mission
12th Executive Committee Meeting 03.06.2013
Department of Agriculture
TamilNadu
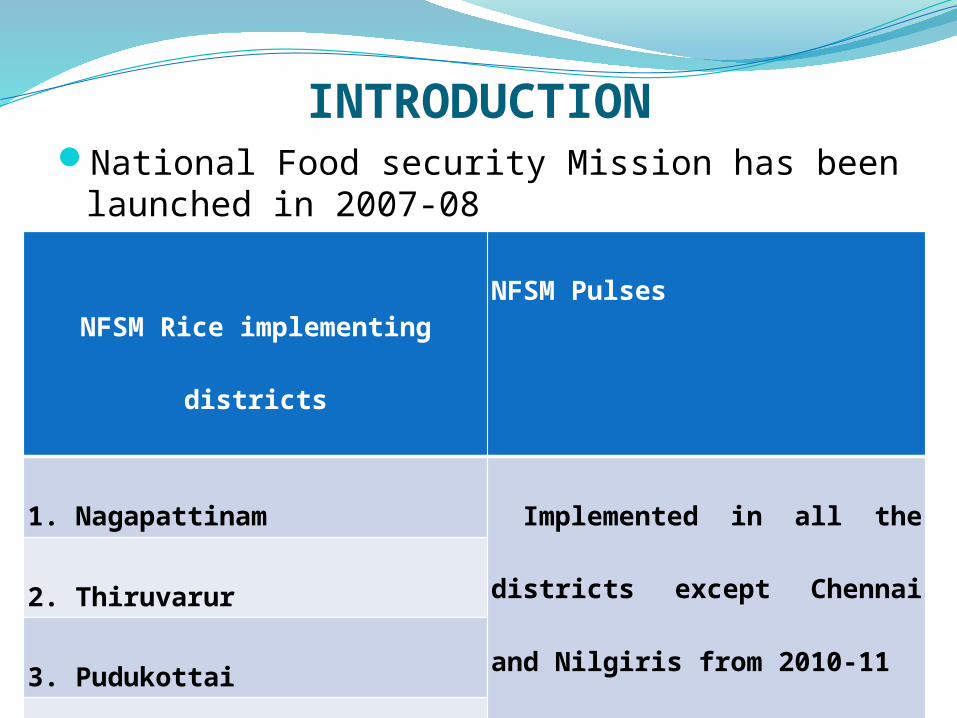
INTRODUCTIONNational Food security Mission has been launched
in 2007-08
NFSM Rice implementing districtsNFSM Pulses
1. Nagapattinam Implemented in all the districts
except Chennai and Nilgiris from
2010-11
(upto 2009-10 implementation
was in 12 districts)
2. Thiruvarur
3. Pudukottai
4. Ramanathapuram
5. Sivagangai
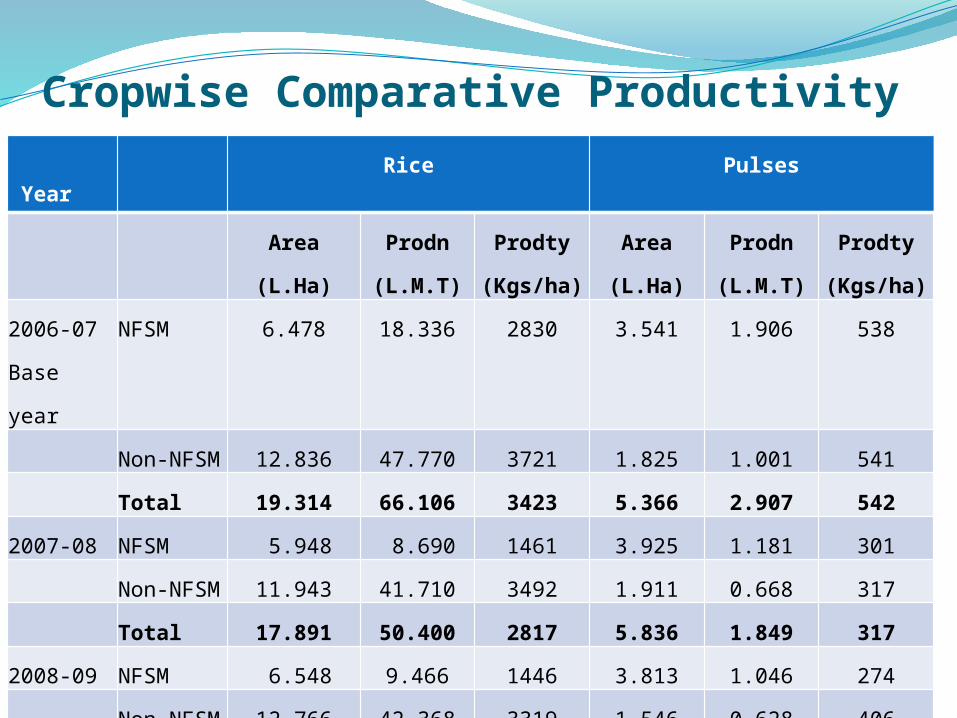
Cropwise Comparative Productivity Year
Rice Pulses
Area
(L.Ha)
Prodn
(L.M.T)
Prodty
(Kgs/ha)
Area
(L.Ha)
Prodn
(L.M.T)
Prodty
(Kgs/ha)
2006-07
Base year
NFSM 6.478 18.336 2830 3.541 1.906 538
Non-NFSM 12.836 47.770 3721 1.825 1.001 541
Total 19.314 66.106 3423 5.366 2.907 542
2007-08 NFSM 5.948 8.690 1461 3.925 1.181 301
Non-NFSM 11.943 41.710 3492 1.911 0.668 317
Total 17.891 50.400 2817 5.836 1.849 317
2008-09 NFSM 6.548 9.466 1446 3.813 1.046 274
Non-NFSM 12.766 42.368 3319 1.546 0.628 406
Total 19.314 51.834 2683 5.359 1.674 312
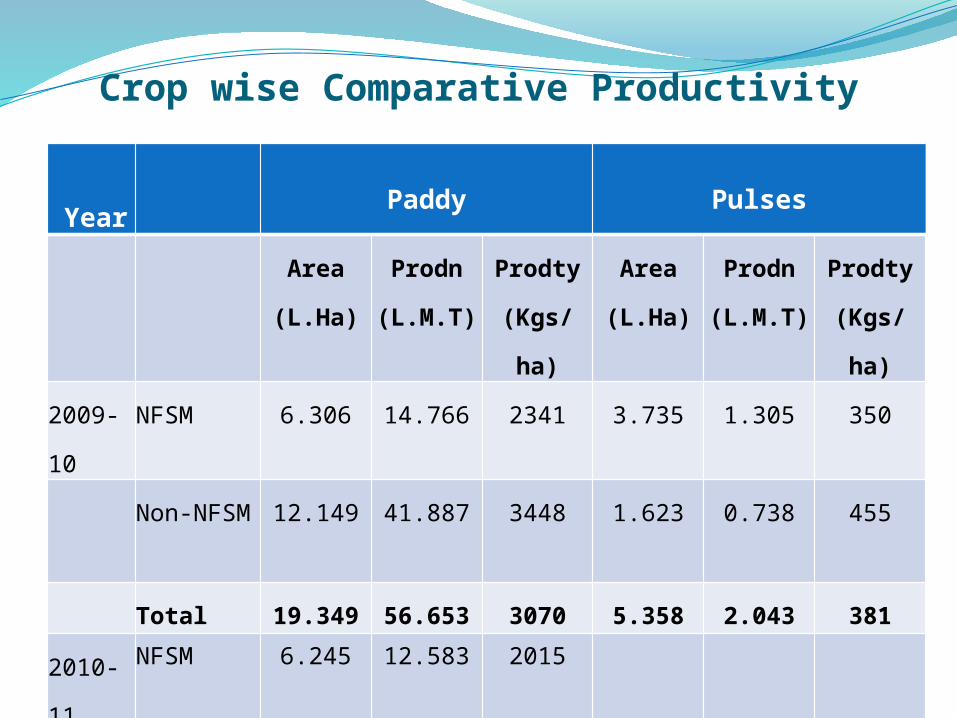
Crop wise Comparative Productivity
Year Paddy Pulses
Area
(L.Ha)
Prodn
(L.M.T)
Prodty
(Kgs/ha)
Area
(L.Ha)
Prodn
(L.M.T)
Prodty
(Kgs/ha)
2009-10 NFSM 6.306 14.766 2341 3.735 1.305 350
Non-NFSM 12.149 41.887 3448 1.623 0.738 455
Total 19.349 56.653 3070 5.358 2.043 381
2010-11 NFSM 6.245 12.583 2015
6.367 2.451 385Non NFSM 12.812 45.340 3538
Total 19.057 57.923 3039
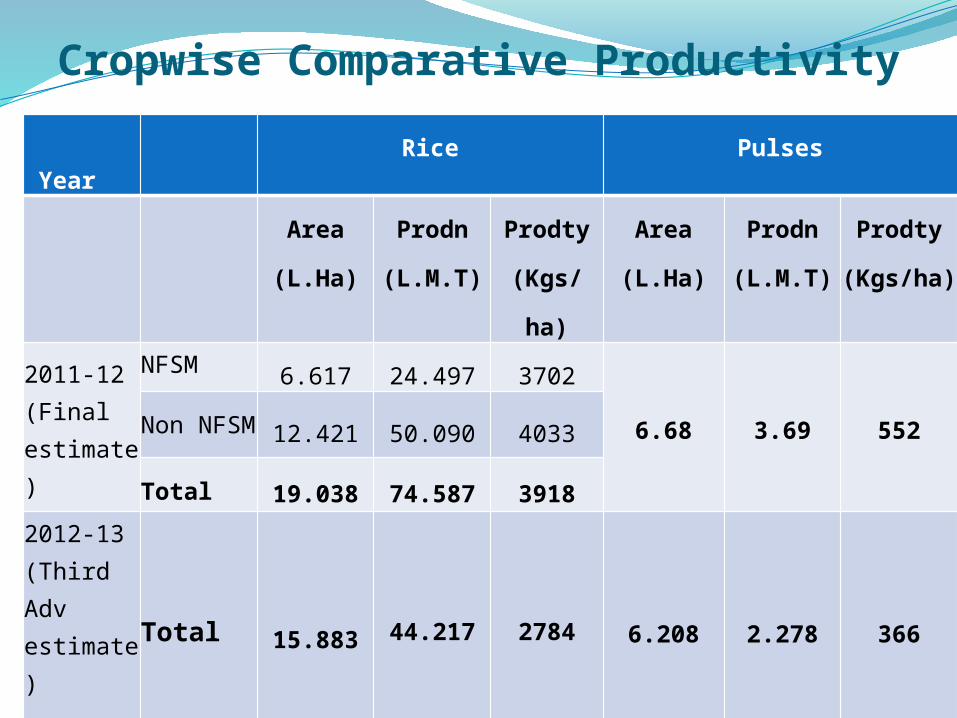
Cropwise Comparative Productivity
YearRice Pulses
Area
(L.Ha)
Prodn
(L.M.T)
Prodty
(Kgs/ha)
Area
(L.Ha)
Prodn
(L.M.T)
Prodty
(Kgs/ha)
2011-12 (Final estimate)
NFSM 6.617 24.497 3702
6.68 3.69 552Non
NFSM12.421 50.090 4033
Total 19.038 74.587 3918
2012-13 (Third Adv estimate) Total 15.883 44.217 2784 6.208 2.278 366
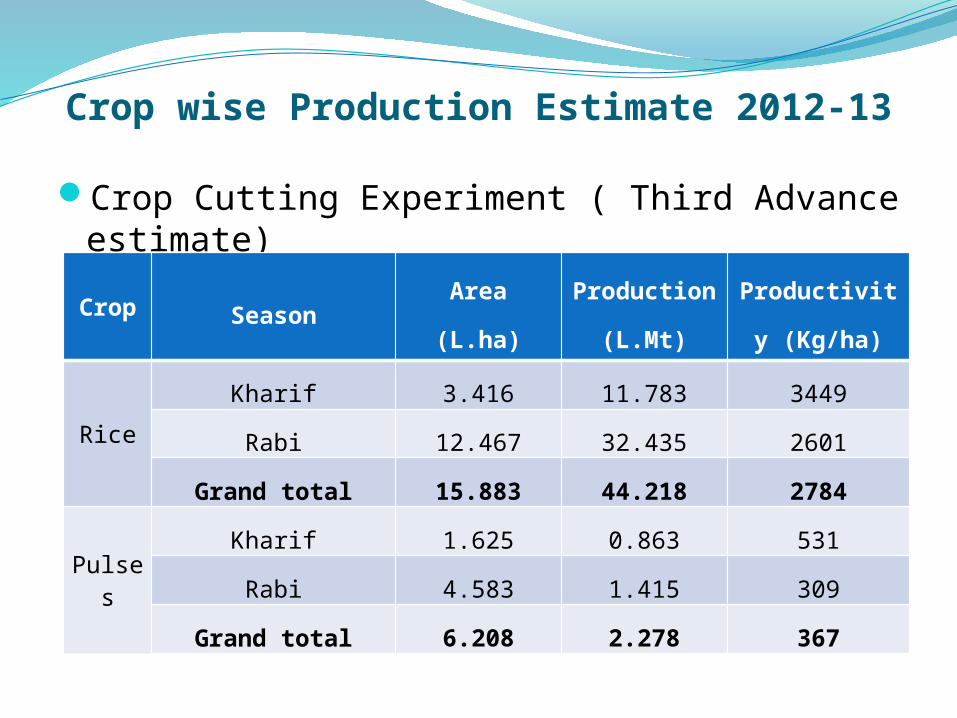
Crop wise Production Estimate 2012-13
Crop Cutting Experiment ( Third Advance estimate)
Crop Season Area (L.ha)Production
(L.Mt)
Productivity
(Kg/ha)
Rice
Kharif 3.416 11.783 3449
Rabi 12.467 32.435 2601
Grand total 15.883 44.218 2784
Pulses
Kharif 1.625 0.863 531
Rabi 4.583 1.415 309
Grand total 6.208 2.278 367
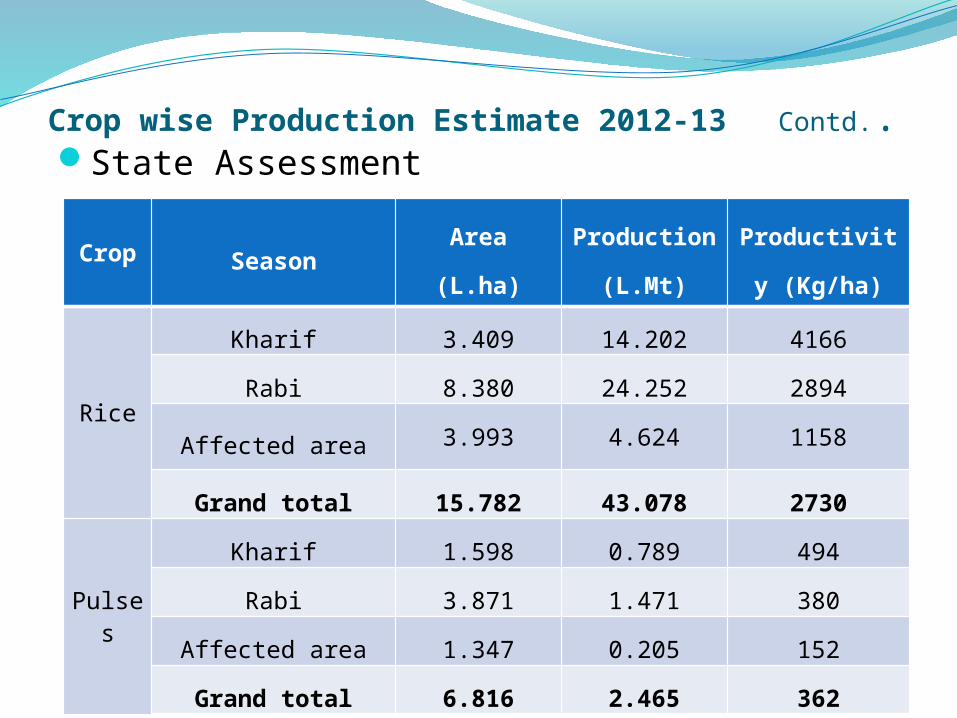
Crop wise Production Estimate 2012-13 Contd..State Assessment
Crop Season Area (L.ha)Production
(L.Mt)
Productivity
(Kg/ha)
Rice
Kharif 3.409 14.202 4166
Rabi 8.380 24.252 2894
Affected area 3.993 4.624 1158
Grand total 15.782 43.078 2730
Pulses
Kharif 1.598 0.789 494
Rabi 3.871 1.471 380
Affected area 1.347 0.205 152
Grand total 6.816 2.465 362
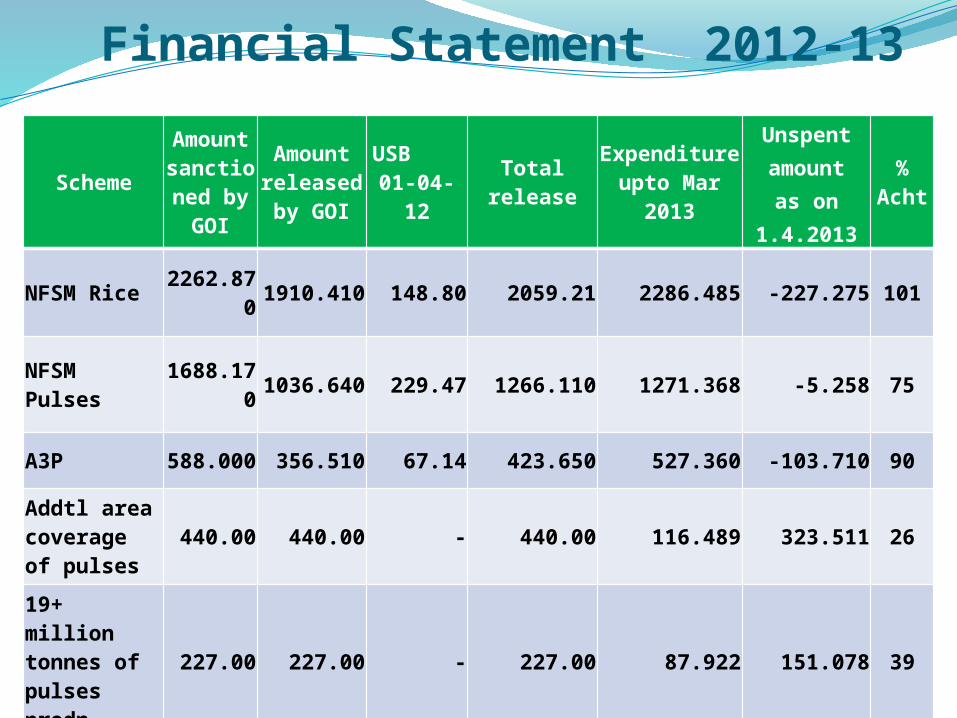
Financial Statement 2012-13
Scheme
Amount sanction
ed by GOI
Amount released by GOI
USB 01-04-12
Total release
Expenditure upto Mar 2013
Unspent amount as on 1.4.2013
% Acht
NFSM Rice 2262.870 1910.410 148.80 2059.21 2286.485 -227.275 101
NFSM Pulses 1688.170 1036.640 229.47 1266.110 1271.368 -5.258 75
A3P 588.000 356.510 67.14 423.650 527.360 -103.710 90
Addtl area coverage of pulses
440.00 440.00 - 440.00 116.489 323.511 26
19+ million tonnes of pulses prodn
227.00 227.00 - 227.00 87.922 151.078 39
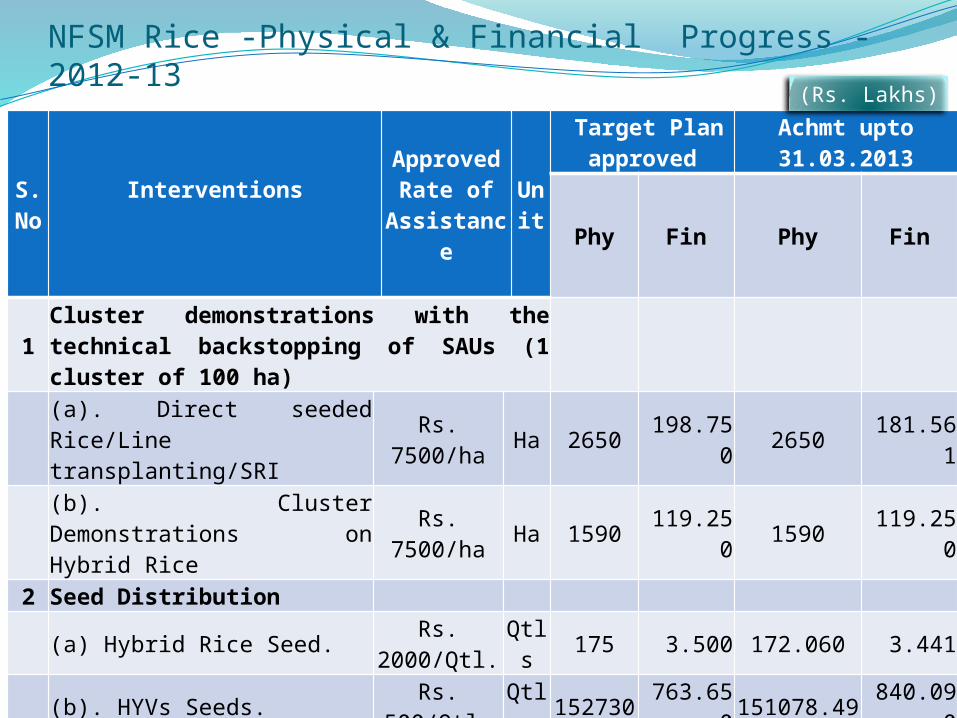
NFSM Rice -Physical & Financial Progress -2012-13
S. No
Interventions
Approved Rate of
Assistance
Unit
Target Plan approved
Achmt upto 31.03.2013
Phy Fin Phy Fin
1Cluster demonstrations with the technical backstopping of SAUs (1 cluster of 100 ha)
(a). Direct seeded Rice/Line transplanting/SRI
Rs. 7500/ha Ha 2650 198.750 2650 181.561
(b). Cluster Demonstrations on Hybrid Rice
Rs. 7500/ha Ha 1590 119.250 1590 119.250
2 Seed Distribution
(a) Hybrid Rice Seed.Rs.
2000/Qtl.Qtls 175 3.500 172.060 3.441
(b). HYVs Seeds. Rs. 500/Qtl. Qtls 152730 763.650 151078.49 840.090
3 Plant and Soil Protection Management
(a) Micronutrients Rs. 500/ha Ha 25500 127.500 25123 125.612
(b) Plant Protection Chemical and bio-agents.
Rs. 500/ ha.
Ha 25000 125.000 25350 126.699
(Rs. Lakhs)
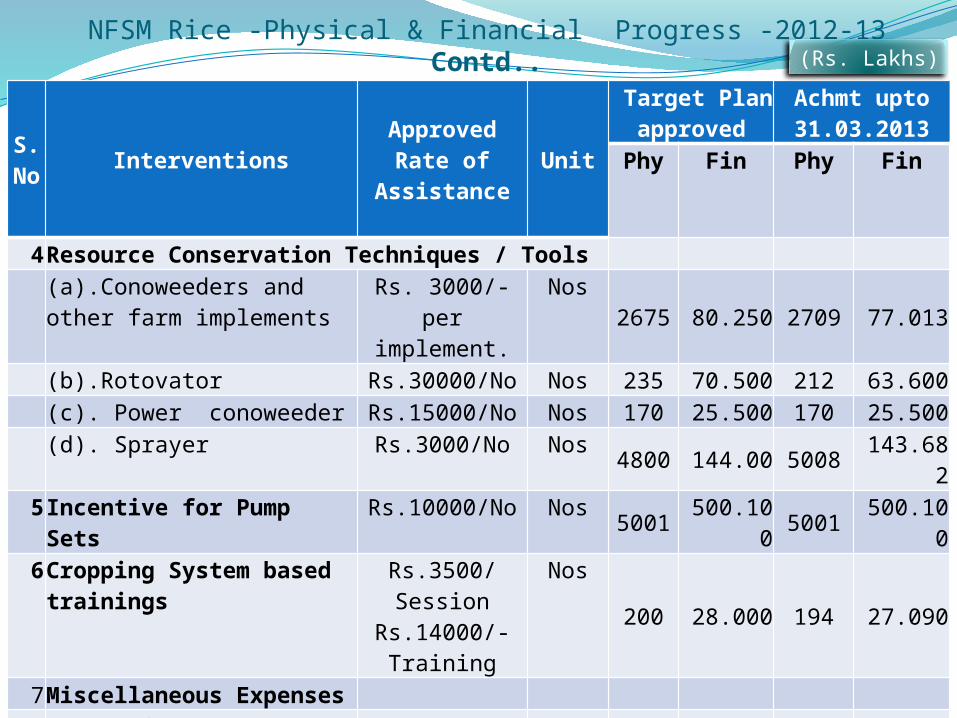
NFSM Rice -Physical & Financial Progress -2012-13 Contd..
S. No
InterventionsApproved Rate of Assistance
Unit
Target Plan approved
Achmt upto 31.03.2013
Phy Fin Phy Fin
4Resource Conservation Techniques / Tools (a).Conoweeders and other
farm implementsRs. 3000/-per
implement.Nos
2675 80.250 2709 77.013
(b).Rotovator Rs.30000/No Nos 235 70.500 212 63.600 (c). Power conoweeder Rs.15000/No Nos 170 25.500 170 25.500 (d). Sprayer Rs.3000/No Nos 4800 144.00 5008 143.682
5Incentive for Pump Sets Rs.10000/No Nos 5001 500.100 5001 500.1006Cropping System based
trainingsRs.3500/Session
Rs.14000/-Training
Nos
200 28.000 194 27.090
7Miscellaneous Expenses (a) Project Management Team
and other Miscellaneous expenses at district Level.
Rs. 6.36 lakh per district.
No. of dist. 5 31.800 5 28.677
(b) Project Management Team and other Miscellaneous expenses at State Level.
Rs. 13.87 lakh per State.
1 13.870
(Rs. Lakhs)
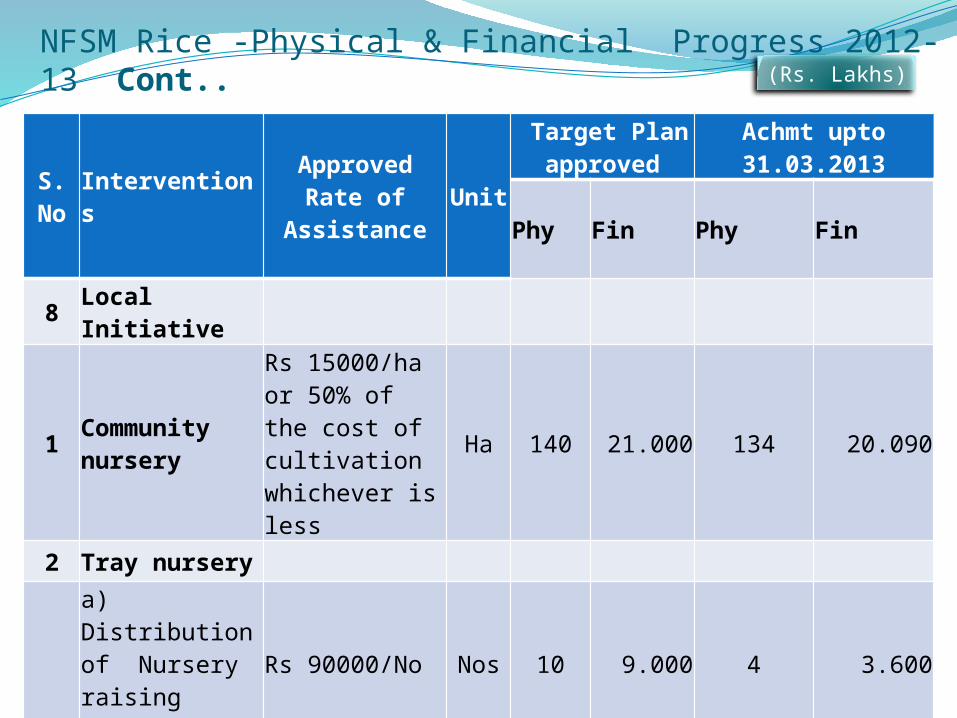
NFSM Rice -Physical & Financial Progress 2012-13 Cont..
S. No
InterventionsApproved Rate of Assistance
Unit
Target Plan approved
Achmt upto 31.03.2013
Phy Fin Phy Fin
8 Local Initiative
1Community nursery
Rs 15000/ha or 50% of the cost of cultivation whichever is less
Ha 140 21.000 134 20.090
2 Tray nursery
a) Distribution of Nursery raising machine
Rs 90000/No Nos 10 9.000 4 3.600
b) Distribution of Trays
Rs 60/No (200 trays for 1 machine)
Nos 2000 1.200 800 0.480
Grand Total 2262.870 2286.485
(Rs. Lakhs)
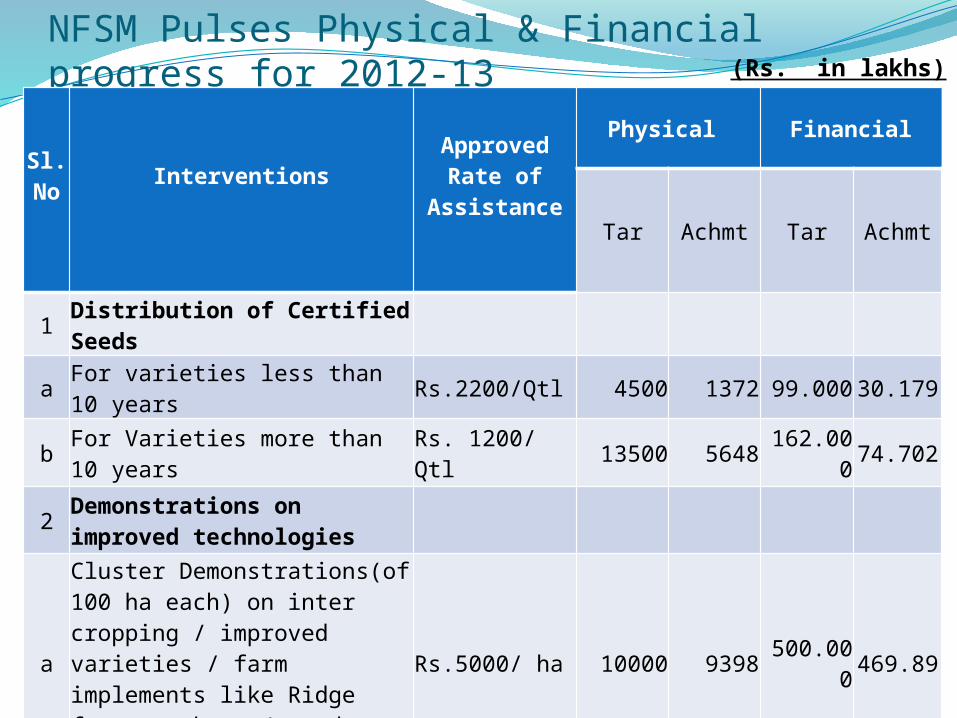
NFSM Pulses Physical & Financial progress for 2012-13
Sl.No
Interventions
Approved Rate of
Assistance
Physical Financial
Tar Achmt Tar Achmt
1 Distribution of Certified Seeds
a For varieties less than 10 years Rs.2200/Qtl 4500 1372 99.000 30.179
b For Varieties more than 10 years Rs. 1200/ Qtl 13500 5648 162.000 74.702
2Demonstrations on improved technologies
a
Cluster Demonstrations(of 100 ha each) on inter cropping / improved varieties / farm implements like Ridge furrow makers./ seed drills
Rs.5000/ ha 10000 9398 500.000 469.89
3Integrated Nutrient Management:
(a) Lime/Gypsum Rs.750/-Ha. 4000 3338 30.000 25.034
(b) Micro-nutrients Rs.500/- Ha. 6000 5441 30.000 27.206
Assistance for Rhizobium Culture Rs. 100/ Ha 30000 25951 30.000 25.951
(Rs. in lakhs)
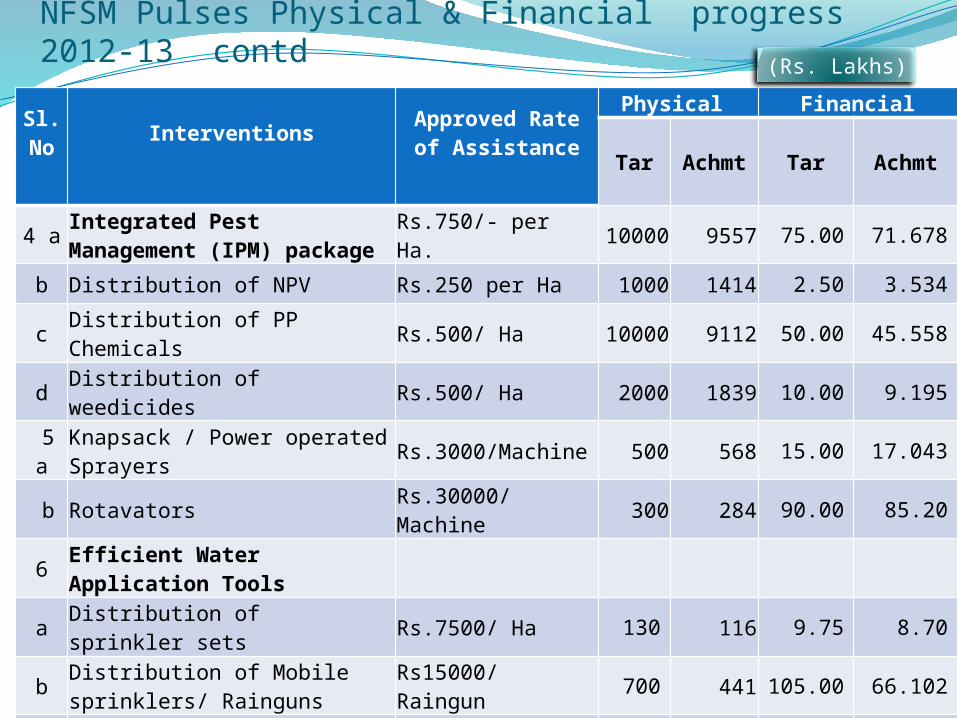
NFSM Pulses Physical & Financial progress 2012-13 contd
Sl.No
Interventions
Approved Rate of Assistance
Physical Financial
Tar Achmt Tar Achmt
4 a Integrated Pest Management (IPM) package Rs.750/- per Ha. 10000 9557 75.00 71.678
b Distribution of NPV Rs.250 per Ha 1000 1414 2.50 3.534
c Distribution of PP Chemicals Rs.500/ Ha 10000 9112 50.00 45.558
d Distribution of weedicides Rs.500/ Ha 2000 1839 10.00 9.195
5 a Knapsack / Power operated Sprayers Rs.3000/Machine 500 568 15.00 17.043
b Rotavators Rs.30000/ Machine 300 284 90.00 85.20
6 Efficient Water Application Tools
a Distribution of sprinkler sets Rs.7500/ Ha 130 116 9.75 8.70
b Distribution of Mobile sprinklers/ Rainguns Rs15000/ Raingun 700 441 105.00 66.102
c Incentive for pumpsets Rs.10000/Machine 300 219 30.00 21.858
d Pipes for carrying water from source to field Rs.15000per farmer 960 1044 144.00 156.672
(Rs. Lakhs)
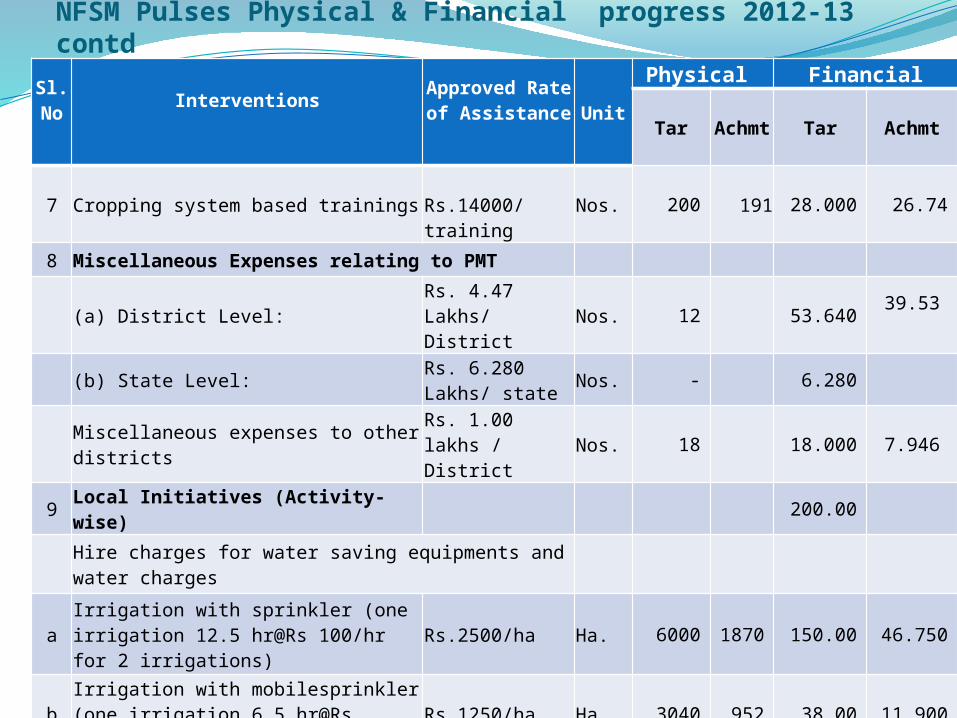
NFSM Pulses Physical & Financial progress 2012-13 contd
Sl.No
Interventions
Approved Rate of Assistance
Unit
Physical Financial
Tar Achmt Tar Achmt
7 Cropping system based trainings Rs.14000/ training
Nos. 200 191 28.000 26.74
8 Miscellaneous Expenses relating to PMT
(a) District Level:Rs. 4.47 Lakhs/ District
Nos. 12 53.64039.53
(b) State Level:Rs. 6.280 Lakhs/ state
Nos. - 6.280
Miscellaneous expenses to other districts Rs. 1.00 lakhs / District
Nos. 18 18.000 7.946
9 Local Initiatives (Activity-wise) 200.00
Hire charges for water saving equipments and water charges
aIrrigation with sprinkler (one irrigation 12.5 hr@Rs 100/hr for 2 irrigations)
Rs.2500/ha Ha. 6000 1870 150.00 46.750
bIrrigation with mobilesprinkler (one irrigation 6.5 hr@Rs 100/hr for 2 irrigations)
Rs.1250/ha Ha. 3040 952 38.00 11.900
Grand Total 1688.171271.36
8
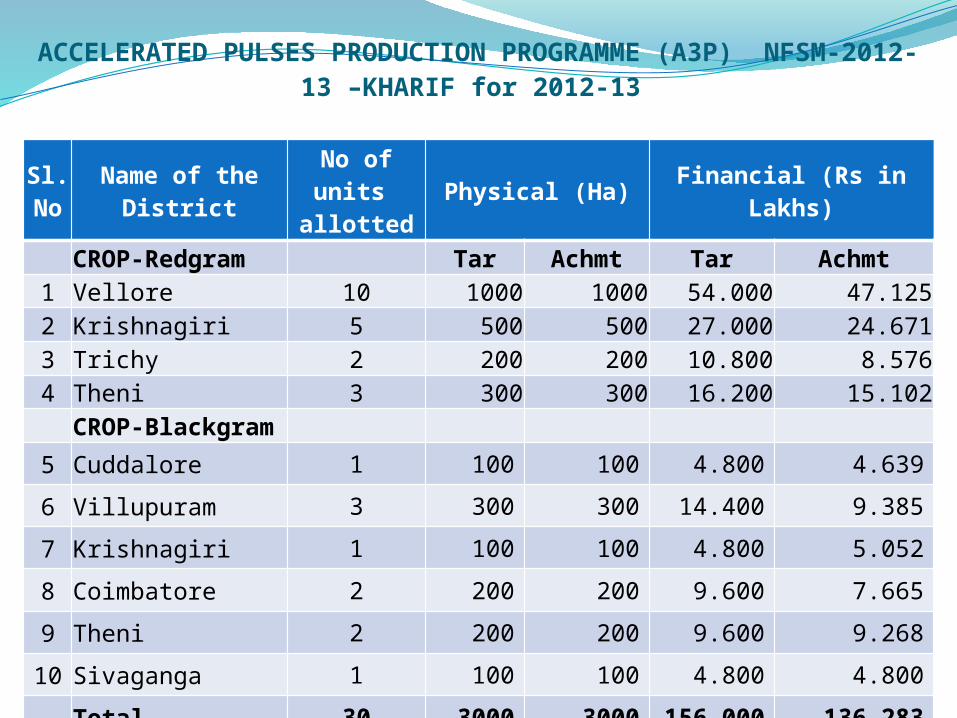
ACCELERATED PULSES PRODUCTION PROGRAMME (A3P) NFSM-2012-13 –KHARIF for 2012-13
Sl. No
Name of the District
No of units allotted
Physical (Ha) Financial (Rs in Lakhs)
CROP-Redgram Tar Achmt Tar Achmt1 Vellore 10 1000 1000 54.000 47.1252 Krishnagiri 5 500 500 27.000 24.6713 Trichy 2 200 200 10.800 8.5764 Theni 3 300 300 16.200 15.102 CROP-Blackgram
5 Cuddalore 1 100 100 4.800 4.639
6 Villupuram 3 300 300 14.400 9.385
7 Krishnagiri 1 100 100 4.800 5.052
8 Coimbatore 2 200 200 9.600 7.665
9 Theni 2 200 200 9.600 9.268
10 Sivaganga 1 100 100 4.800 4.800
Total 30 3000 3000 156.000 136.283
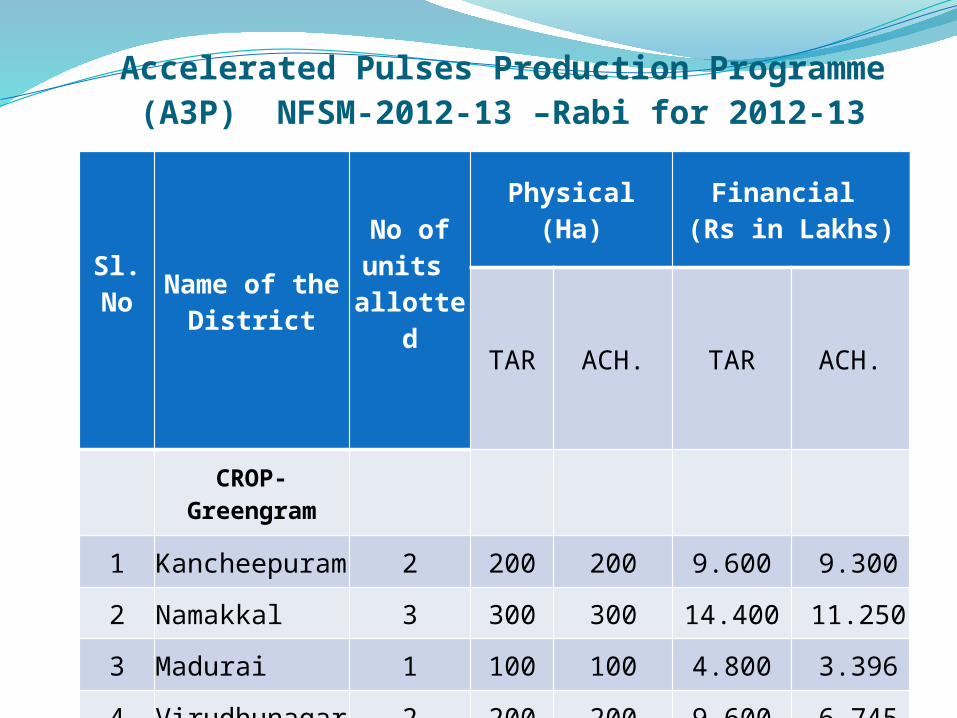
Accelerated Pulses Production Programme (A3P) NFSM-2012-13 –Rabi for 2012-13
Sl. No
Name of the District
No of units
allotted
Physical (Ha)Financial
(Rs in Lakhs)
TAR ACH. TAR ACH.
CROP-Greengram
1 Kancheepuram 2 200 200 9.600 9.300
2 Namakkal 3 300 300 14.400 11.250
3 Madurai 1 100 100 4.800 3.396
4 Virudhunagar 2 200 200 9.600 6.745
Total 8 800 800 38.400 30.691
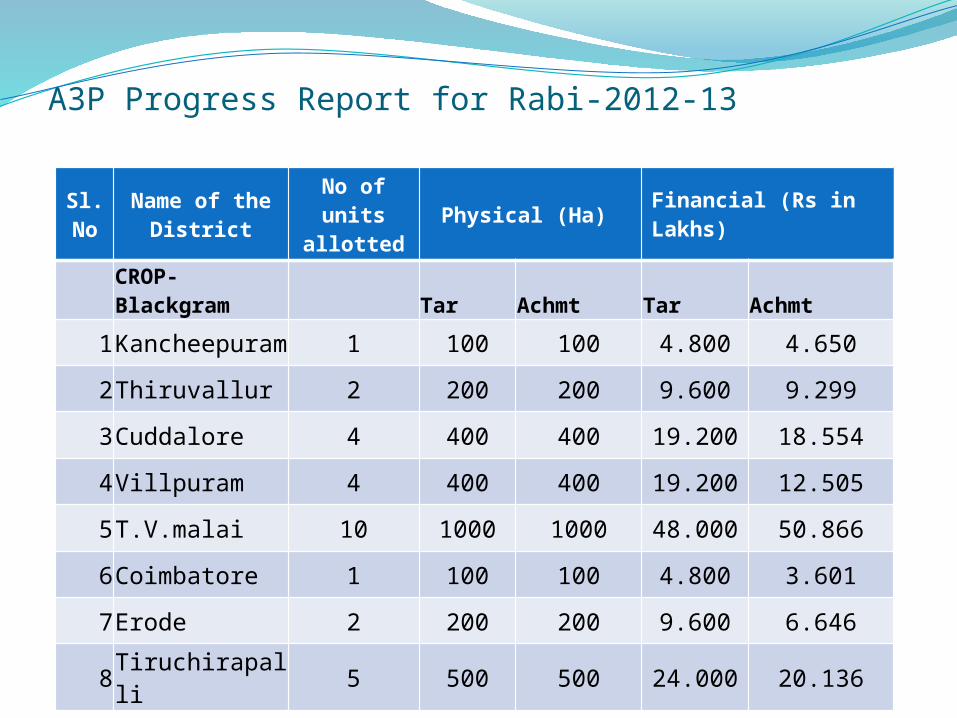
A3P Progress Report for Rabi-2012-13
Sl. No
Name of the District
No of units allotted Physical (Ha) Financial (Rs in Lakhs)
CROP-Blackgram Tar Achmt Tar Achmt
1Kancheepuram 1 100 100 4.800 4.650
2Thiruvallur 2 200 200 9.600 9.299
3Cuddalore 4 400 400 19.200 18.554
4Villpuram 4 400 400 19.200 12.505
5T.V.malai 10 1000 1000 48.000 50.866
6Coimbatore 1 100 100 4.800 3.601
7Erode 2 200 200 9.600 6.646
8Tiruchirapalli 5 500 500 24.000 20.136
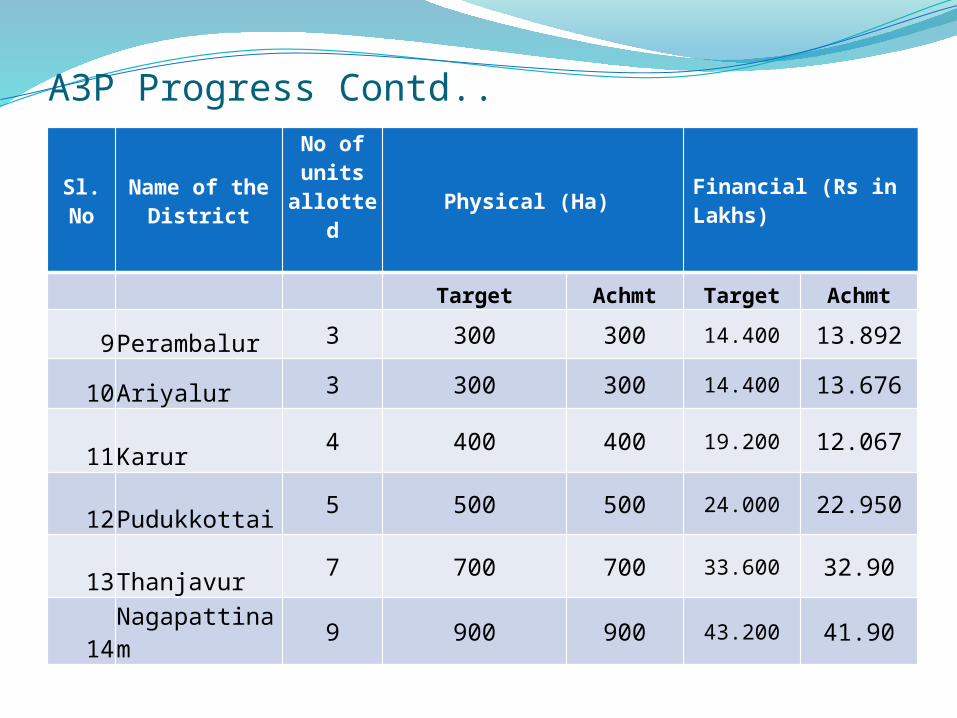
A3P Progress Contd..
Sl. No Name of the District
No of units
allotted Physical (Ha) Financial (Rs in Lakhs)
Target Achmt Target Achmt
9Perambalur 3 300 300 14.400 13.892
10Ariyalur 3 300 300 14.400 13.676
11Karur4 400 400 19.200 12.067
12Pudukkottai5 500 500 24.000 22.950
13Thanjavur7 700 700 33.600 32.90
14Nagapattinam9 900 900 43.200 41.90
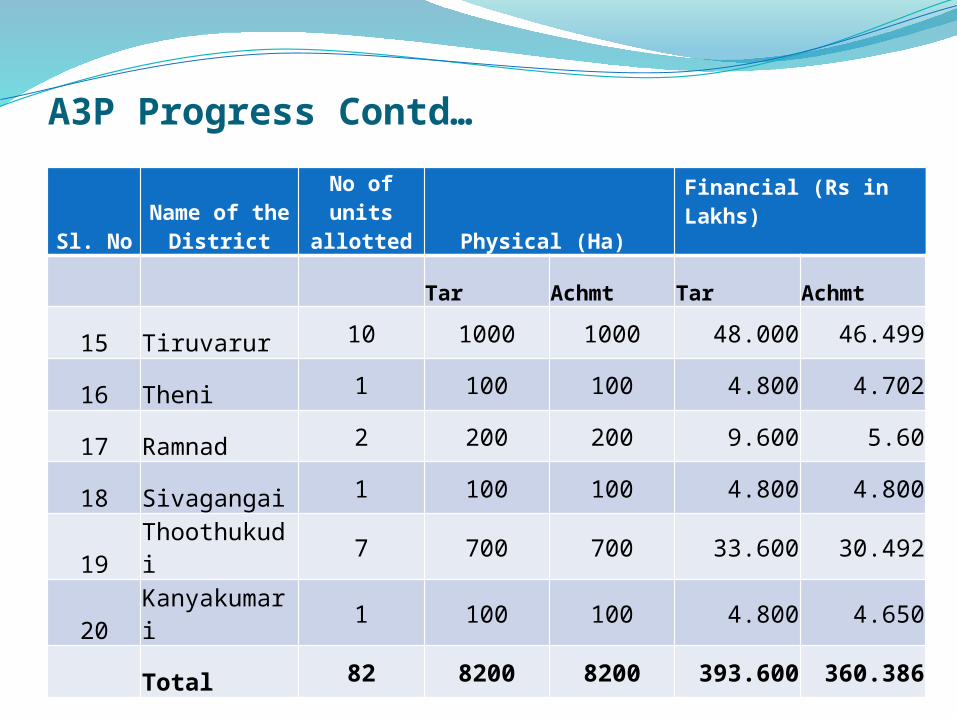
A3P Progress Contd…
Sl. NoName of the
DistrictNo of units
allotted Physical (Ha)
Financial (Rs in Lakhs)
Tar Achmt Tar Achmt
15 Tiruvarur 10 1000 1000 48.000 46.499
16 Theni 1 100 100 4.800 4.702
17 Ramnad 2 200 200 9.600 5.60
18 Sivagangai 1 100 100 4.800 4.800
19 Thoothukudi 7 700 700 33.600 30.492
20 Kanyakumari 1 100 100 4.800 4.650
Total 82 8200 8200 393.600 360.386
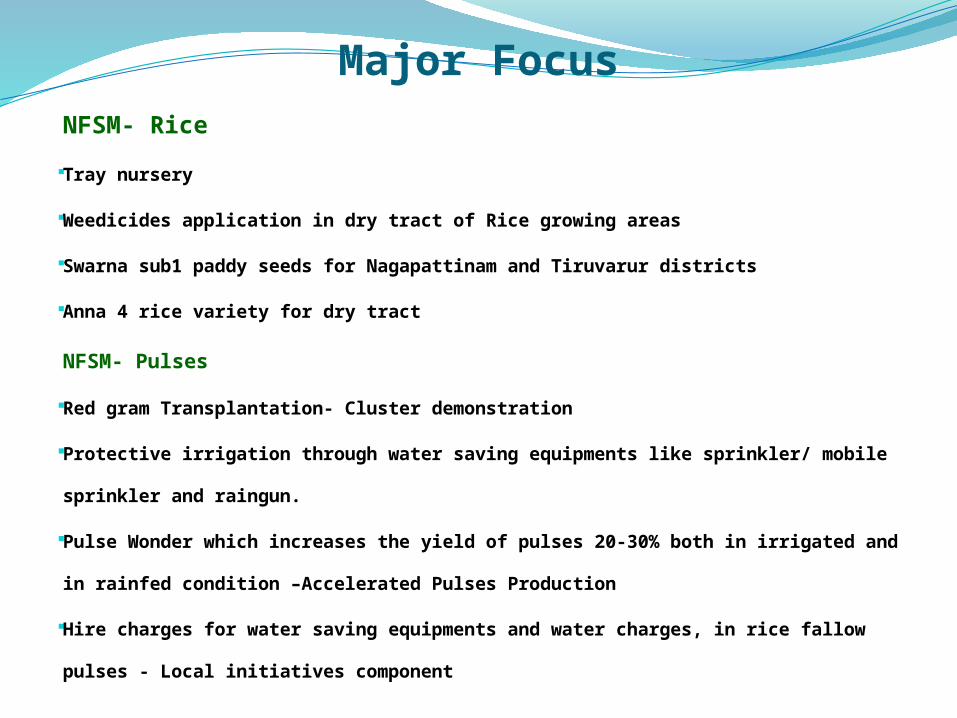
Major Focus
NFSM- Rice
Tray nursery
Weedicides application in dry tract of Rice growing areas
Swarna sub1 paddy seeds for Nagapattinam and Tiruvarur districts
Anna 4 rice variety for dry tract
NFSM- Pulses
Red gram Transplantation- Cluster demonstration
Protective irrigation through water saving equipments like sprinkler/ mobile
sprinkler and raingun.
Pulse Wonder which increases the yield of pulses 20-30% both in irrigated
and in rainfed condition –Accelerated Pulses Production
Hire charges for water saving equipments and water charges, in rice fallow
pulses - Local initiatives component
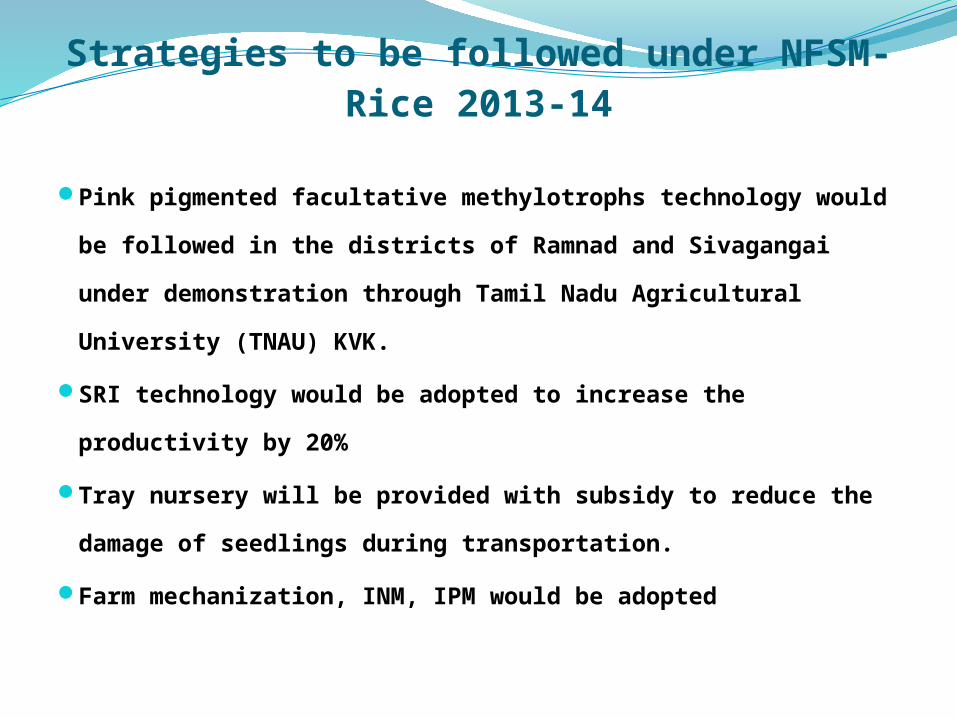
Strategies to be followed under NFSM-Rice 2013-14
Pink pigmented facultative methylotrophs technology would
be followed in the districts of Ramnad and Sivagangai under
demonstration through Tamil Nadu Agricultural University
(TNAU) KVK.
SRI technology would be adopted to increase the productivity
by 20%
Tray nursery will be provided with subsidy to reduce the
damage of seedlings during transportation.
Farm mechanization, INM, IPM would be adopted
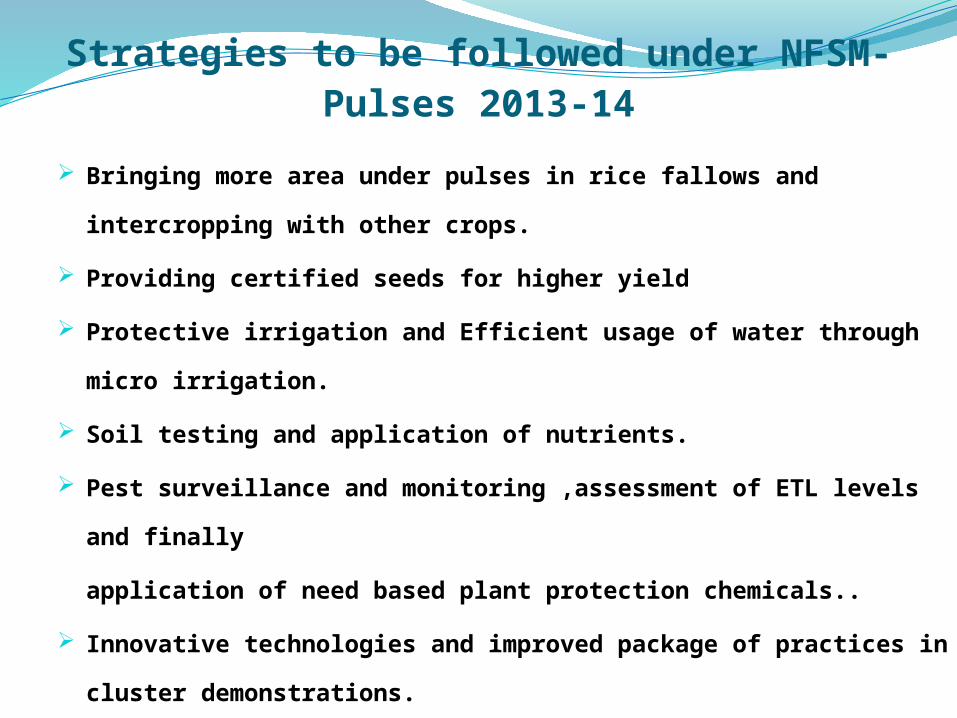
Strategies to be followed under NFSM-Pulses 2013-14
Bringing more area under pulses in rice fallows and intercropping with
other crops.
Providing certified seeds for higher yield
Protective irrigation and Efficient usage of water through micro irrigation.
Soil testing and application of nutrients.
Pest surveillance and monitoring ,assessment of ETL levels and finally
application of need based plant protection chemicals..
Innovative technologies and improved package of practices in cluster
demonstrations.
Cropping system based training to adopt best crop production/crop
protection technologies for high production and productivity.
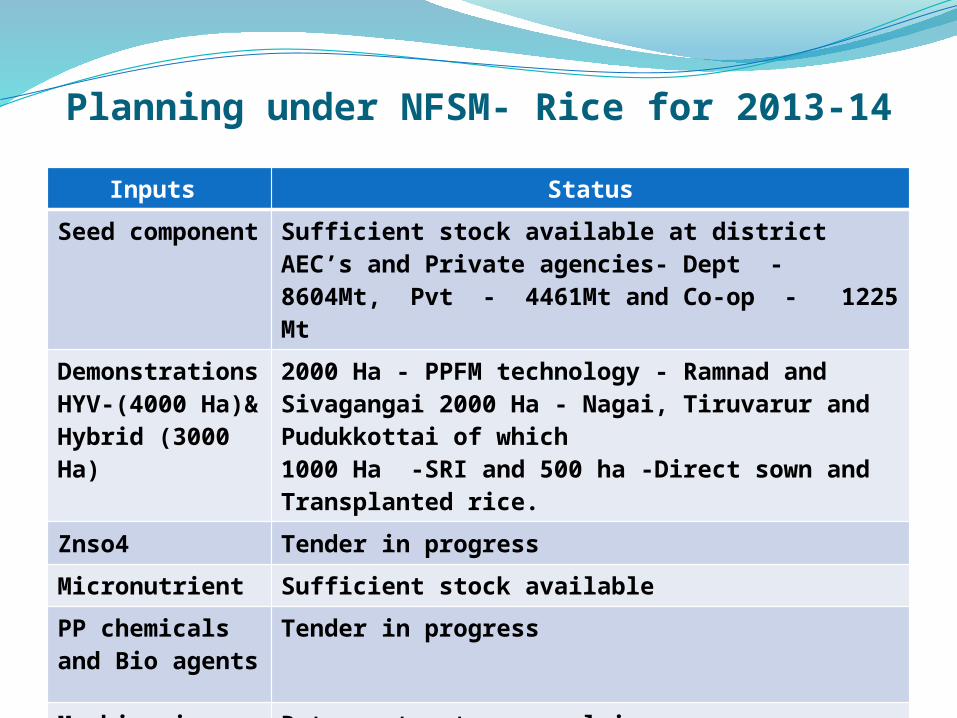
Planning under NFSM- Rice for 2013-14
Inputs Status
Seed component Sufficient stock available at district AEC’s and Private agencies- Dept - 8604Mt, Pvt - 4461Mt and Co-op - 1225 Mt
Demonstrations HYV-(4000 Ha)& Hybrid (3000 Ha)
2000 Ha - PPFM technology - Ramnad and Sivagangai 2000 Ha - Nagai, Tiruvarur and Pudukkottai of which1000 Ha -SRI and 500 ha -Direct sown and Transplanted rice.
Znso4 Tender in progress
Micronutrient Sufficient stock available
PP chemicals and Bio agents
Tender in progress
Machineries and PP equipments
Rate contract approval in progress
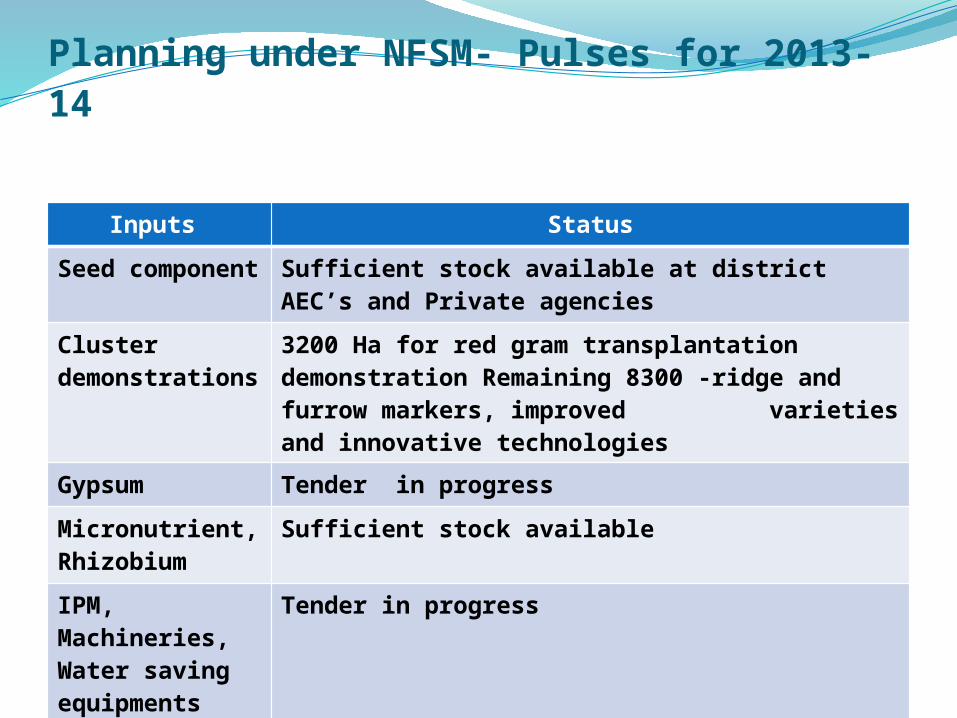
Planning under NFSM- Pulses for 2013-14
Inputs Status
Seed component Sufficient stock available at district AEC’s and Private agencies
Cluster demonstrations
3200 Ha for red gram transplantation demonstration Remaining 8300 -ridge and furrow markers, improved varieties and innovative technologies
Gypsum Tender in progress
Micronutrient, Rhizobium
Sufficient stock available
IPM, Machineries, Water saving equipments
Tender in progress
SPECIFIC ISSUES UNDER NFSM
Relaxation of qualification and experience for
appointing Consultants and Senior Technical
Assistants
Amount required for settlement of pending bills of
2012-13
Age relaxation for the distribution of HYV paddy.
Subsidy for the machineries may be increased to 50%
of the total cost
Relaxation of cost norms mentioned in guidelines
under demonstration to include PPFM @ Rs. 2558/ha

THANK YOU

Nursery Tray


