58
National Healthcare Quality and Disparities Report CHARTBOOK ON RURAL HEALTH CARE Agency for Healthcare Research and Quality Advancing Excellence in Health Care www.ahrq.gov

National Healthcare Quality and Disparities Report
CHARTBOOK ON RURAL HEALTH CARE
Agency for Healthcare Research and QualityAdvancing Excellence in Health Care www.ahrq.gov

This document is in the public domain and may be used and reprinted without permission.
Citation of the source is appreciated. Suggested citation: National Healthcare Quality and
Disparities Report chartbook on rural health care. Rockville, MD: Agency for Healthcare
Research and Quality; October 2017. AHRQ Pub. No. 17(18)-0001-2-EF.

NATIONAL HEALTHCARE QUALITY AND DISPARITIES REPORT CHARTBOOK ON RURAL HEALTH CARE
U.S. DEPARTMENT OF
HEALTH AND HUMAN SERVICES
Agency for Healthcare Research and Quality
540 Gaither Road
Rockville, MD 20850
AHRQ Publication No. 17(18)-0001-2-EF October 2017
www.ahrq.gov/research/findings/nhqrdr/index.html
ACKNOWLEDGMENTS The National Healthcare Quality and Disparities Report (QDR) is the product of collaboration among agencies across the U.S. Department of Health and Human Services (HHS). Many individuals guided and contributed to this effort. Without their magnanimous support, the report would not have been possible.
Specifically, we thank:
Authors: Barbara Barton (AHRQ), Irim Azam (AHRQ).
Primary AHRQ Staff: Gopal Khanna, Sharon Arnold, Jeff Brady, Erin Grace, Karen Chaves, Nancy Wilson, Darryl Gray, Barbara Barton, Doreen Bonnett, and Irim Azam.
HHS Interagency Workgroup for the QDR: Girma Alemu (HRSA), Nancy Breen (NIH-NIMHD), Victoria Cargill (NIH), Hazel Dean (CDC), Kirk Greenway (IHS), Chris Haffer (CMS-OMH), Edwin Huff (CMS), DeLoris Hunter (NIH-NIMHD), Sonja Hutchins (CDC), Ruth Katz (ASPE), Shari Ling (CMS), Darlene Marcoe (ACF), Tracy Matthews (HRSA), Ernest Moy (CDC-NCHS), Curt Mueller (HRSA), Ann Page (ASPE), Kathleen Palso (CDC-NCHS), D.E.B Potter (ASPE), Asel Ryskulova (CDC-NCHS), Adelle Simmons (ASPE), Marsha Smith (CMS), Caroline Taplin (ASPE), Emmanuel Taylor (NCI), Nadarajen Vydelingum (NIH-NCI), Barbara Wells (NIH-NHLBI), and Ying Zhang (IHS).
Data Support Contractors: Booz Allen Hamilton (BAH), Social & Scientific Systems (SSS), Truven Health Analytics, and Westat, Inc.
RURAL HEALTH CARE
This Rural Health Care Chartbook is part of a family of documents and tools that support the National Healthcare Quality and Disparities Reports (QDR). The QDR includes annual reports to Congress mandated in the Healthcare Research and Quality Act of 1999 (P.L. 106-129). These reports provide a comprehensive overview of the quality of health care received by the general U.S. population and disparities in care experienced by different racial, ethnic, and socioeconomic groups. The purpose of the reports is to assess the performance of our health system and to identify areas of strengths and weaknesses in the health care system along three main axes: access to health care, quality of health care, and priorities of the National Quality Strategy.
The reports are based on more than 250 measures of quality and disparities covering a broad array of health care services and settings. Data are generally available through 2013, although rates of uninsurance have been tracked through the first half of 2015. The reports are produced with the help of an Interagency Work Group led by the Agency for Healthcare Research and Quality (AHRQ) and submitted on behalf of the Secretary of Health and Human Services (HHS).
This chartbook contains:
• Overview of the QDR • Overview of residents of rural areas, one of the priority populations of the QDR • Summary of trends in health care quality and disparities for rural populations • Tracking of access and quality measures for rural populations.
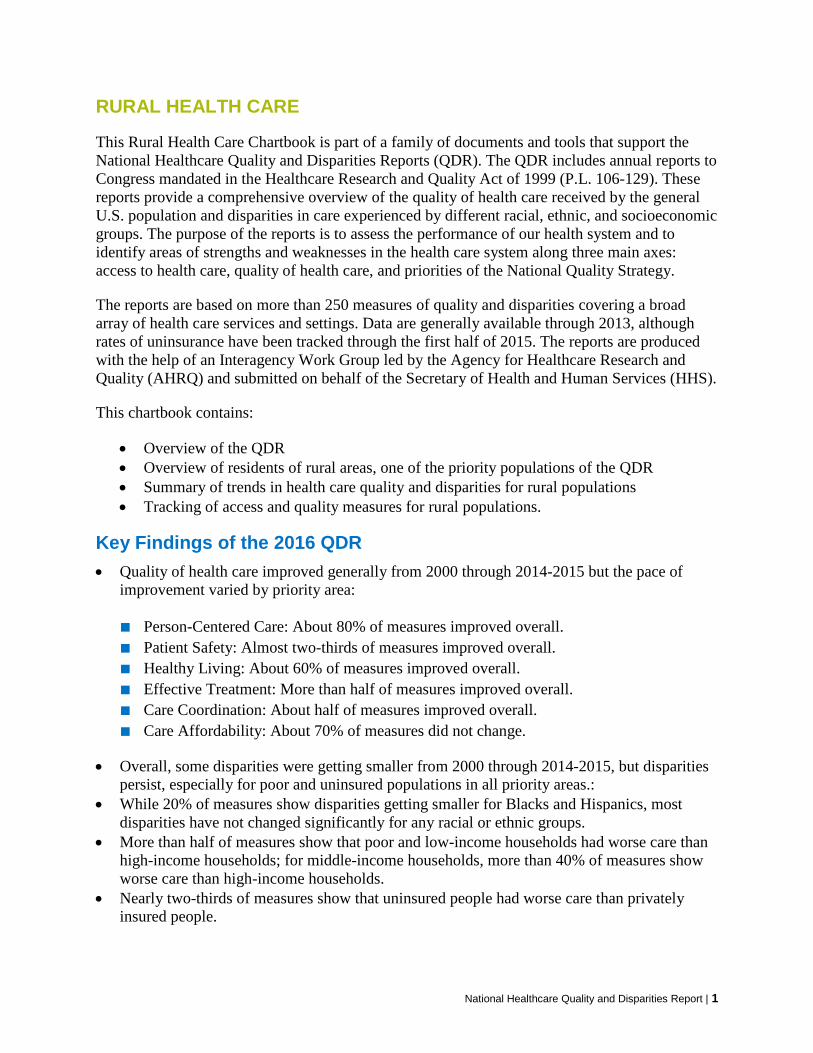
Key Findings of the 2016 QDR • Quality of health care improved generally from 2000 through 2014-2015 but the pace of
improvement varied by priority area:
■ Person-Centered Care: About 80% of measures improved overall. ■ Patient Safety: Almost two-thirds of measures improved overall. ■ Healthy Living: About 60% of measures improved overall. ■ Effective Treatment: More than half of measures improved overall. ■ Care Coordination: About half of measures improved overall. ■ Care Affordability: About 70% of measures did not change.
• Overall, some disparities were getting smaller from 2000 through 2014-2015, but disparities persist, especially for poor and uninsured populations in all priority areas.:
• While 20% of measures show disparities getting smaller for Blacks and Hispanics, most disparities have not changed significantly for any racial or ethnic groups.
• More than half of measures show that poor and low-income households had worse care than high-income households; for middle-income households, more than 40% of measures show worse care than high-income households.
• Nearly two-thirds of measures show that uninsured people had worse care than privately insured people.
National Healthcare Quality and Disparities Report | 1

Rural Health
Chartbook on Rural Health • This chartbook includes:
■ Summary of trends in health care quality and disparities for rural populations. ■ Figures illustrating select measures of Access to Health Care and 6 priority areas,
including Care Affordability, Care Coordination, Effective Treatment, Healthy Living, Patient Safety, and Person-Centered Care, for rural populations.
• Introduction and Methods contains information about methods used in the chartbook. • A Data Query tool (http://nhqrnet.ahrq.gov/inhqrdr/data/query) provides access to all data
tables.
2006 NCHS Urban-Rural Classification System
Metropolitan Large central metropolitan
Counties in a metropolitan statistical area of 1 million or more population: 1. That contain the entire population of the largest principal city of the
metropolitan statistical area, or 2. Whose entire population resides in the largest principal city of the
metropolitan statistical area, or 3. That contain at least 250,000 of the population of any principal city in
the metropolitan statistical area. Large fringe metropolitan
Counties in a metropolitan statistical area of 1 million or more population that do not qualify as large central.
Medium metropolitan
Counties in a metropolitan statistical area of 250,000 to 999,999 population.
Small metropolitan
Counties in a metropolitan statistical area of 50,000 to 249,999 population.
Nonmetropolitan Micropolitan Counties in a micropolitan statistical area. Noncore Counties not in a micropolitan statistical area.
2 | National Healthcare Quality and Disparities Report

Rural Health
Urban-Rural Classification Scheme Map
Map Applying NCHS Urban-Rural Classification Scheme
Source: Ingram D, Franco S. NCHS urban-rural classification scheme for counties. National Center for Health Statistics. Vital Health Stat 2(154).2012. https://www.cdc.gov/nchs/data/series/sr_02/sr02_154.pdf .
Map Applying NCHS Urban-Rural Classification Scheme
Source: Ingram D, Franco S. NCHS urban-rural classification scheme for counties. National Center for Health Statistics. Vital Health Stat 2(154).2012. https://www.cdc.gov/nchs/data/series/sr_02/sr02_154.pdf .
Use of NCHS Urban-Rural Classification Scheme in This Chartbook • This chartbook compares residents of nonmetropolitan (rural) areas with residents of large
fringe metropolitan (suburban) areas:
■ Residents of suburban areas tend to have higher quality health care and better outcomes.
• The National Center for Health Statistics (NCHS) Urban-Rural Classification Scheme is used to guide analyses involving geographic location.
• The 2013 NCHS classification system is derived from data gathered from three sources: the Office of Management and Budget metropolitan and nonmetropolitan designations, the Rural-Urban Continuum and Urban Influence coding systems, and the U.S. Census.
• The NCHS scheme includes six urbanization categories, including:
■ Four metropolitan county designations:
■ Large Central Metropolitan ■ Large Fringe Metropolitan ■ Medium Metropolitan ■ Small Metropolitan
National Healthcare Quality and Disparities Report | 3

Rural Health
■ Two nonmetropolitan county designations:
■ Micropolitan ■ Noncore
Residents of Rural Areas • According to the U.S. Census Bureau, in 2016, approximately 60 million Americans (19.3%)
lived in a nonmetropolitan, or rural, area.
■ This figure included about 13 million children under 18 and 47 million adults.
• Although rural residents make up less than one-fifth of the U.S. population, 65% of the 3,142 U.S. counties are classified as nonmetropolitan (Meit, et al., 2014).
■ This figure includes 445 “frontier” counties (U.S. Census Bureau, 2010) that have a population density of fewer than 7 people per square mile.
Health Issues in Rural Areas • Compared with their urban counterparts, residents of rural counties are:
■ Older, ■ Poorer, ■ More likely to be overweight or obese, and ■ Sicker (Meit, et al., 2014).
• Rural residents also have:
■ Higher injury rates (NCHS, 2017). ■ Higher smoking rates (NCHS, 2017). ■ Higher rates of uninsurance (NCHS, 2017) ■ Higher rates of suicide (Kegler, et al., 2017). ■ Higher rates of opioid misuse (Warshaw, 2017).
• More residents of nonmetropolitan areas live in poverty compared with residents of metropolitan areas.
• A higher percentage of residents in rural areas has activity limitations due to chronic health conditions.
• Nonmetropolitan areas have higher rates of cigarette smoking, hypertension, obesity, and physical inactivity during leisure time. One study found that 9 of 10 counties with highest smoking prevalence for males were nonmetropolitan counties and the counties with the top 10 highest prevalence of female smokers were all nonmetropolitan counties (Dwyer-Lindgren, et al., 2014).
4 | National Healthcare Quality and Disparities Report

Rural Health
Life Expectancy in Rural Areas • Life expectancy for U.S. residents decreases as level of rurality increases:
■ In 2005-2009, those living in large metropolitan areas had a life expectancy of 79.1 years compared with 76.7 years for those living in rural areas.
■ This disparity widened over time. ■ Causes of death contributing most to lower life expectancy in rural areas include:
■ Heart disease, ■ Unintentional injuries, ■ Chronic obstructive pulmonary disease, ■ Lung cancer, ■ Stroke, ■ Suicide, and ■ Diabetes (Singh & Siahpush, 2014).
■ During 1999-2014, annual age-adjusted death rates for heart disease, stroke, cancer, unintentional injury, and chronic lower respiratory disease (CLRD) were higher in nonmetropolitan areas than metropolitan areas. Age-adjusted death rates for unintentional injury were approximately 50% higher in nonmetropolitan areas than in metropolitan areas. Rates for heart disease and death rates for cancer decreased at a slower rate in nonmetropolitan areas compared with metropolitan areas. CLRD decreased in metropolitan areas but increased in nonmetropolitan areas (Moy, et al., 2017).
Life Expectancy in U.S. Counties
Life Expectancy Across U.S. Counties
Life Expectancy at Birth by County, 2014 Urban-Rural Classification
Source: Dwyer-Lindgren L, Bertozzi-Villa A, Stubbs RW, et al. Inequities in life expectancy among US counties, 1980 to 2014: temporal trends and key drivers. JAMA Intern Med 2017;177(7):1003-11.
Source: Ingram D, Franco S. NCHS urban-rural classification scheme for counties. National Center for Health Statistics. Vital Health Stat 2(154).2012. https://www.cdc.gov/nchs/data/series/sr_02/sr02_154.pdf .
National Healthcare Quality and Disparities Report | 5

Rural Health
• In 2014, life expectancy at birth for both sexes combined at the national level was 79.1 years but there was a 20.1 year gap between the lowest and highest life expectancy among all counties (Dwyer-Lindgren, et al., 2017). Several counties in North and South Dakota, eastern Kentucky, and southwestern West Virginia had lower life expectancy compared with the rest of the country (Dwyer-Lindgren, et al., 2017).
Health Care Providers in Rural Areas • Metropolitan, or urban, counties tend to have a greater supply of health care providers per
capita than nonmetropolitan counties.
■ This finding is especially true for specialists such as neurologists, anesthesiologists, and psychiatrists.
■ The same is true for the supply of dentists, which decreases per capita as the level of rurality increases.
• Rural residents often live farther away from health care resources, which can add to the burden of accessing care (Meit, et al., 2014).
• Nonphysician practitioners, such as nurse practitioners and physician assistants, are also an important part of the health care landscape in rural communities.
Hospitals in Rural Areas • Half of the nearly 5,000 hospitals in the United States are in rural areas. • Most rural hospitals have about 265 beds, have 7 inpatients daily, and are housed in facilities
that are about 10 years old. • Rural hospitals:
■ Are typically in counties with a median population of 27,980; ■ Serve many older patients (16.8% of the population is 65 years and over); and ■ Serve poorer people (average per capita income is $32,781 and 17.5% of the population
live below the Federal poverty level (Freeman, et al., 2015).
Services Provided by Hospitals in Rural Areas • Although rural hospitals vary widely, the typical rural hospital offers inpatient care that
includes:
■ Surgical services. ■ Obstetric services. ■ Swing bed services.
• Rural hospitals typically do not include:
■ Intensive care units. ■ Skilled nursing facilities. ■ Psychiatric units. ■ Rehabilitation units.
6 | National Healthcare Quality and Disparities Report

Rural Health
• The typical rural hospital also offers outpatient care. • The typical rural hospital also offers outpatient care that includes outpatient surgical services
and breast cancer screening/mammography but does not offer hospice services, home health services, chemotherapy services, dental services, or outpatient drug/alcohol abuse care (Freeman, et al., 2015).
Challenges Faced by Hospitals in Rural Areas • Rural hospitals face unique challenges due to their size and case mix.
■ During the 1980s, many were forced to close due to financial losses. ■ From January 2005 to July 2016, 118 rural hospitals closed permanently and 7 closed but
later reopened. The number of closures has increased each year since 2010; in the first half of 2016, the closure rate surpassed two closures per month (North Carolina Rural Health Research Program, 2016).
Summary of Trends Quality Measures: Micropolitan and Noncore vs. Large Fringe Metropolitan
Number and percentage of quality measures for which micropolitan and noncore areas experienced better, same, or worse quality of care compared with reference
group (large fringe metropolitan), 2014-2015
3 9
66 54
32 34
0%
20%
40%
60%
80%
100%
Micropolitan (n=101) Noncore (n=97)
Better Same Worse
Key: n = number of measures.Better = Population received better quality of care than reference group.Same = Population and reference group received about the same quality of care.Worse = Population received worse quality of care than reference group.Note: For each measure, the most recent data year available was analyzed. These data represent 2014-2015. Quality measures do not include Access to Care measures.
National Healthcare Quality and Disparities Report | 7
Rural Health
• Residents in micropolitan areas received:
■ Better quality of care for 3% (3 of 101) of the measures, compared with those living in large fringe metropolitan areas,
■ Worse quality of care for 32% (32 of 101) of the measures, compared with those living in large fringe metropolitan areas, and
■ The same quality of care for 65% (66 of 101) of the measures, compared with those living in large fringe metropolitan areas.
• Residents in noncore areas received:
■ Better quality of care for 9% (9 of 97) of the measures, compared with those living in large fringe metropolitan areas,
■ Worse quality of care for 35% (34 of 97) of the measures, compared with those living in large fringe metropolitan areas, and
■ The same quality of care for 56% (54 of 97) of the measures, compared with those living in large fringe metropolitan areas.
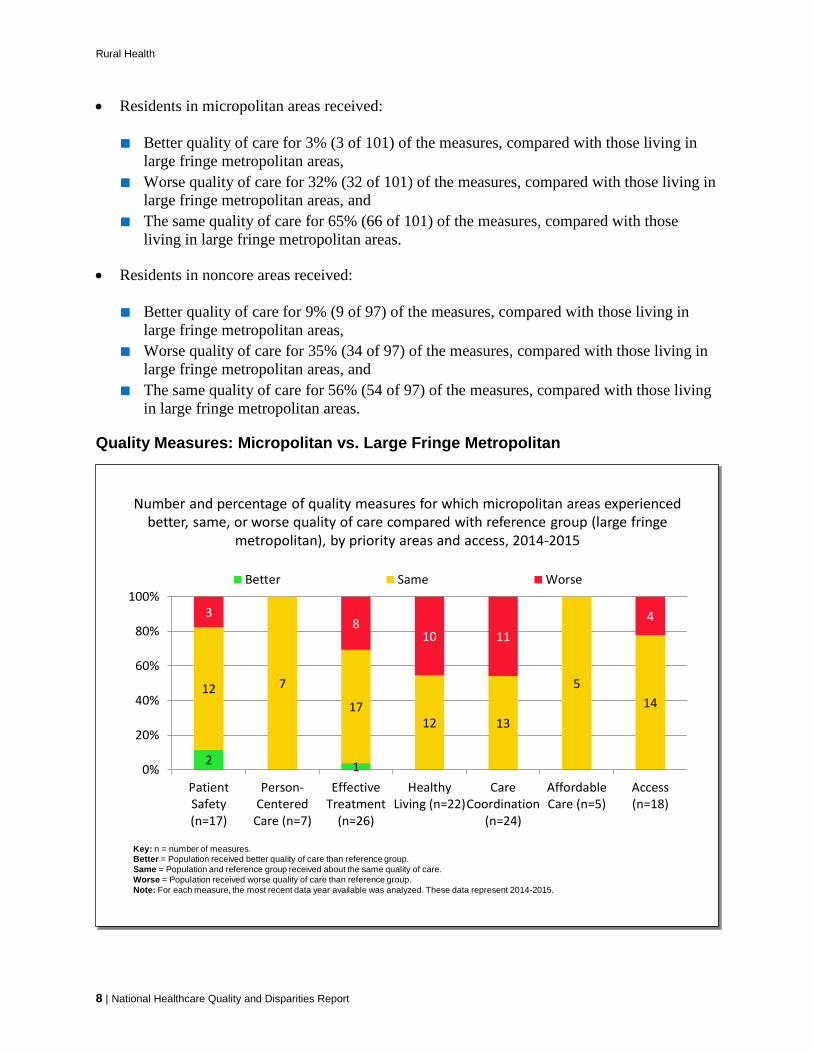
Quality Measures: Micropolitan vs. Large Fringe Metropolitan
Number and percentage of quality measures for which micropolitan areas experienced better, same, or worse quality of care compared with reference group (large fringe
metropolitan), by priority areas and access, 2014-2015
2 1
12 7
1712 13
514
38
10 114
0%
20%
40%
60%
80%
100%
PatientSafety(n=17)
Person-Centered
Care (n=7)
EffectiveTreatment
(n=26)
HealthyLiving (n=22)
CareCoordination
(n=24)
AffordableCare (n=5)
Access(n=18)
Better Same Worse
Key: n = number of measures.Better = Population received better quality of care than reference group.Same = Population and reference group received about the same quality of care.Worse = Population received worse quality of care than reference group.Note: For each measure, the most recent data year available was analyzed. These data represent 2014-2015.
8 | National Healthcare Quality and Disparities Report

Rural Health
• Overall: Residents of micropolitan areas are doing worse than residents of large fringe metropolitan areas on Effective Treatment, Healthy Living, and Care Coordination measures.
• Patient Safety: Residents of micropolitan areas received better care for 12%, same care for 70%, and worse care for 18% of the measures compared with residents of large fringe metropolitan areas.
• Person-Centered Care: Residents of micropolitan areas and residents of large fringe metropolitan areas received the same care for 100% of the measures.
• Effective Treatment: Residents of micropolitan areas received better care for 4%, same care for 65%, and worse care for 31% of the measures compared with residents of large fringe metropolitan areas.
• Healthy Living: Residents of micropolitan areas received the same care for 55% and worse care for 45% of the measures compared with residents of large fringe metropolitan areas.
• Care Coordination: Residents of micropolitan areas received the same care for 54% and worse care for 46% of the measures compared with residents of large fringe metropolitan areas.
• Affordable Care: Residents of micropolitan areas and residents of large fringe metropolitan areas received the same care for 100% of the measures.
• Access: Residents of micropolitan areas received the same care for 78% and worse care for 22% of the measures compared with residents of large fringe metropolitan areas.
Quality Measures: Noncore vs. Large Fringe Metropolitan
Number and percentage of quality measures for which noncore areas experienced better, same, or worse quality of care compared with reference group (large fringe
metropolitan), by priority areas and access, 2014-2015
41 3 1 1
11 7
13
10 11
2
10
29
11 126
0%
20%
40%
60%
80%
100%
PatientSafety(n=17)
Person-Centered
Care (n=8)
EffectiveTreatment
(n=25)
HealthyLiving (n=21)
CareCoordination
(n=24)
AffordableCare (n=2)
Access(n=17)
Better Same Worse
Key: n = number of measures.Better = Population received better quality of care than reference group.Same = Population and reference group received about the same quality of care.Worse = Population received worse quality of care than reference group.Note: For each measure, the most recent data year available was analyzed. These data represent 2014-2015.
National Healthcare Quality and Disparities Report | 9
Rural Health
• Overall: Residents of noncore areas are doing worse than residents of large fringe metropolitan areas on Effective Treatment, Healthy Living, Care Coordination, and Access measures.
• Patient Safety: Residents of noncore areas received better care for 23%, the same care for 65%, and worse care for 12% of the measures compared with residents of large fringe metropolitan areas.
• Person-Centered Care: Residents of noncore areas received the same care for 88% and worse care for 12% of the measures compared with residents of large fringe metropolitan areas.
• Effective Treatment: Residents of noncore areas received better care for 12%, the same care for 52%, and worse care for 36% of the measures compared with residents of large fringe metropolitan areas.
• Healthy Living: Residents of noncore areas received the same care for 48% and worse care for 52% of the measures compared with residents of large fringe metropolitan areas.
• Care Coordination: Residents of noncore areas received better care for 4%, the same care for 46%, and worse care for 50% of the measures compared with residents of large fringe metropolitan areas.
• Affordable Care: Residents of noncore areas received the same care for 100% of the measures compared with residents of large fringe metropolitan areas.
• Access: Residents of noncore areas received better care for 6%, the same care for 59%, and worse care for 35% of the measures compared with residents of large fringe metropolitan areas.
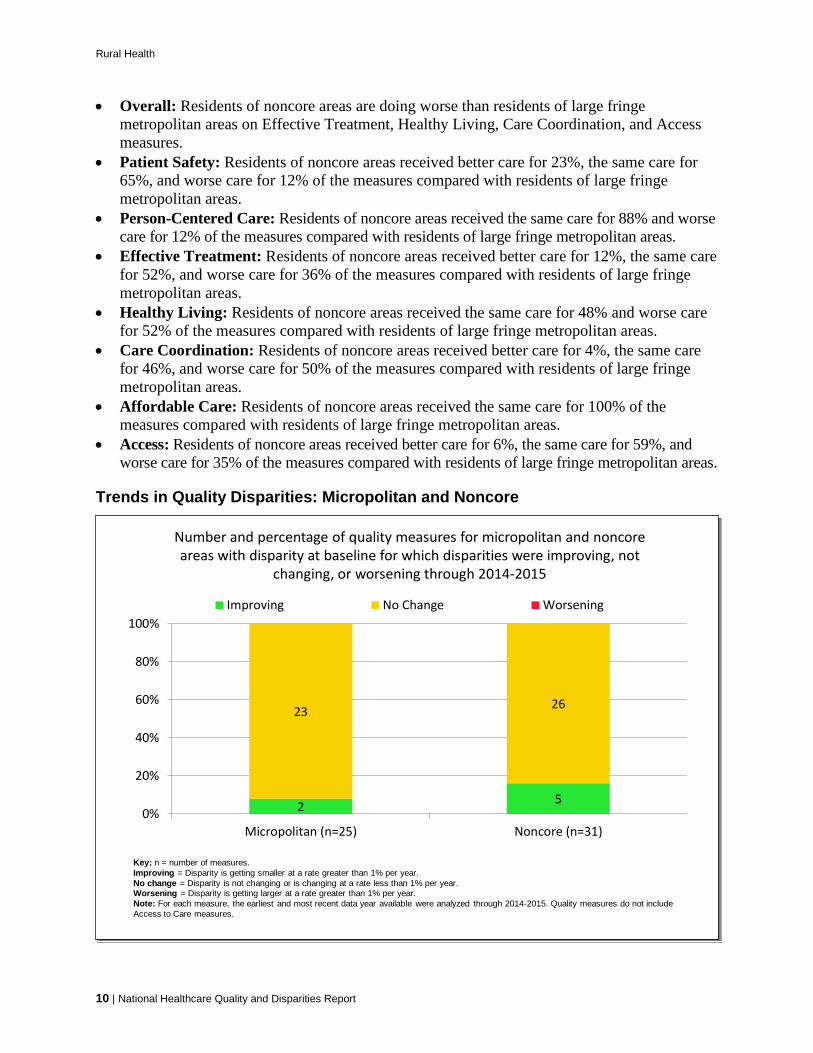
Trends in Quality Disparities: Micropolitan and Noncore
Number and percentage of quality measures for micropolitan and noncore areas with disparity at baseline for which disparities were improving, not
changing, or worsening through 2014-2015
2 5
23 26
0%
20%
40%
60%
80%
100%
Micropolitan (n=25) Noncore (n=31)
Improving No Change Worsening
Key: n = number of measures.Improving = Disparity is getting smaller at a rate greater than 1% per year.No change = Disparity is not changing or is changing at a rate less than 1% per year.Worsening = Disparity is getting larger at a rate greater than 1% per year.Note: For each measure, the earliest and most recent data year available were analyzed through 2014-2015. Quality measures do not include Access to Care measures.
10 | National Healthcare Quality and Disparities Report

Rural Health
• For residents of micropolitan areas:
■ Disparities were getting smaller for 8% (2 of 25) of the measures, compared with residents of large fringe metropolitan areas, and
■ Disparities did not change for 92% (23 of 25) of the measures, compared with residents of large fringe metropolitan areas.
• For residents of noncore areas:
■ Disparities were getting smaller for 16% (5 of 31) of the measures, compared with residents of large fringe metropolitan areas, and
■ Disparities did not change for 84% (26 of 31) of the measures, compared with residents of large fringe metropolitan areas.
Trends in Quality Disparities: Micropolitan
Number and percentage of quality measures for micropolitan areas with disparity at baseline for which disparities were improving, not changing, or worsening, by priority
areas and access through 2014-2015
11
4 6 93
6 1
0%
20%
40%
60%
80%
100%
Patient Safety(n=4)
EffectiveTreatment
(n=6)
Healthy Living(n=10)
CareCoordination
(n=4)
Access (n=6) AffordableCare (n=1)
Improving No Change Worsening
Key: n = number of measures.Improving = Disparity is getting smaller at a rate greater than 1% per year.No change = Disparity is not changing or is changing at a rate less than 1% per year.Worsening = Disparity is getting larger at a rate greater than 1% per year.Note: For each measure, the earliest and most recent data year available were analyzed through 2014-2015.
• Overall: There is no clear pattern in the reduction of disparities between people living in micropolitan areas and people living in large fringe metropolitan areas.
• Healthy Living: Disparities got smaller for only 10% of the measures and there was no change in 90% of the measures.
National Healthcare Quality and Disparities Report | 11
Rural Health
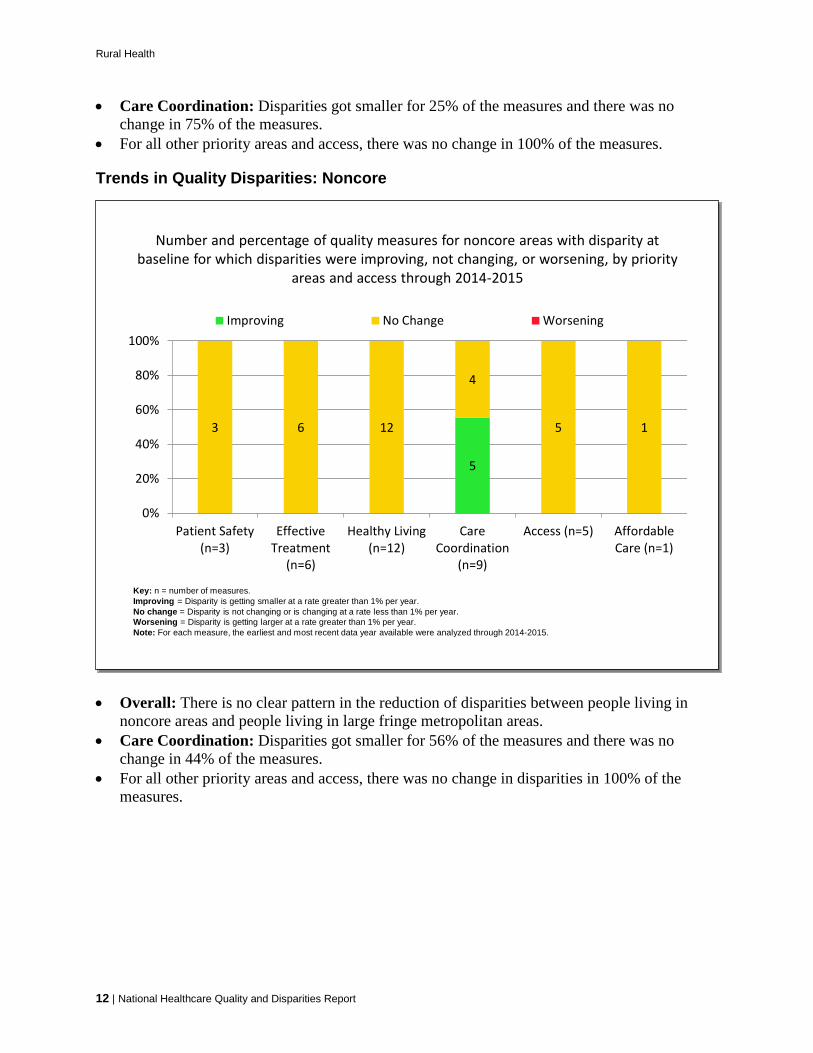
• Care Coordination: Disparities got smaller for 25% of the measures and there was no change in 75% of the measures.
• For all other priority areas and access, there was no change in 100% of the measures.
Trends in Quality Disparities: Noncore
Number and percentage of quality measures for noncore areas with disparity at baseline for which disparities were improving, not changing, or worsening, by priority
areas and access through 2014-2015
5
3 6 12
4
5 1
0%
20%
40%
60%
80%
100%
Patient Safety(n=3)
EffectiveTreatment
(n=6)
Healthy Living(n=12)
CareCoordination
(n=9)
Access (n=5) AffordableCare (n=1)
Improving No Change Worsening
Key: n = number of measures.Improving = Disparity is getting smaller at a rate greater than 1% per year.No change = Disparity is not changing or is changing at a rate less than 1% per year.Worsening = Disparity is getting larger at a rate greater than 1% per year.Note: For each measure, the earliest and most recent data year available were analyzed through 2014-2015.
• Overall: There is no clear pattern in the reduction of disparities between people living in noncore areas and people living in large fringe metropolitan areas.
• Care Coordination: Disparities got smaller for 56% of the measures and there was no change in 44% of the measures.
• For all other priority areas and access, there was no change in disparities in 100% of the measures.
12 | National Healthcare Quality and Disparities Report
Rural Health
Trends in Quality Measures: Micropolitan and Noncore
Number and percentage of all quality measures for micropolitan and noncore areas that were improving, not changing, or worsening, from 2000 through 2015
55 51
35 38
11 7
0%
20%
40%
60%
80%
100%
Micropolitan (n=101) Noncore (n=96)
Improving No Change Worsening
Key: n = number of measures.Improving = Quality is going in a positive direction at an average annual rate greater than 1% per year.No Change = Quality is not changing or is changing at a n average annual rate less than 1% per year.Worsening = Quality is going in a negative direction at an average annual rate greater than 1% per year.Note: For each measure, the earliest and most recent data year available were analyzed through 2014-2015.
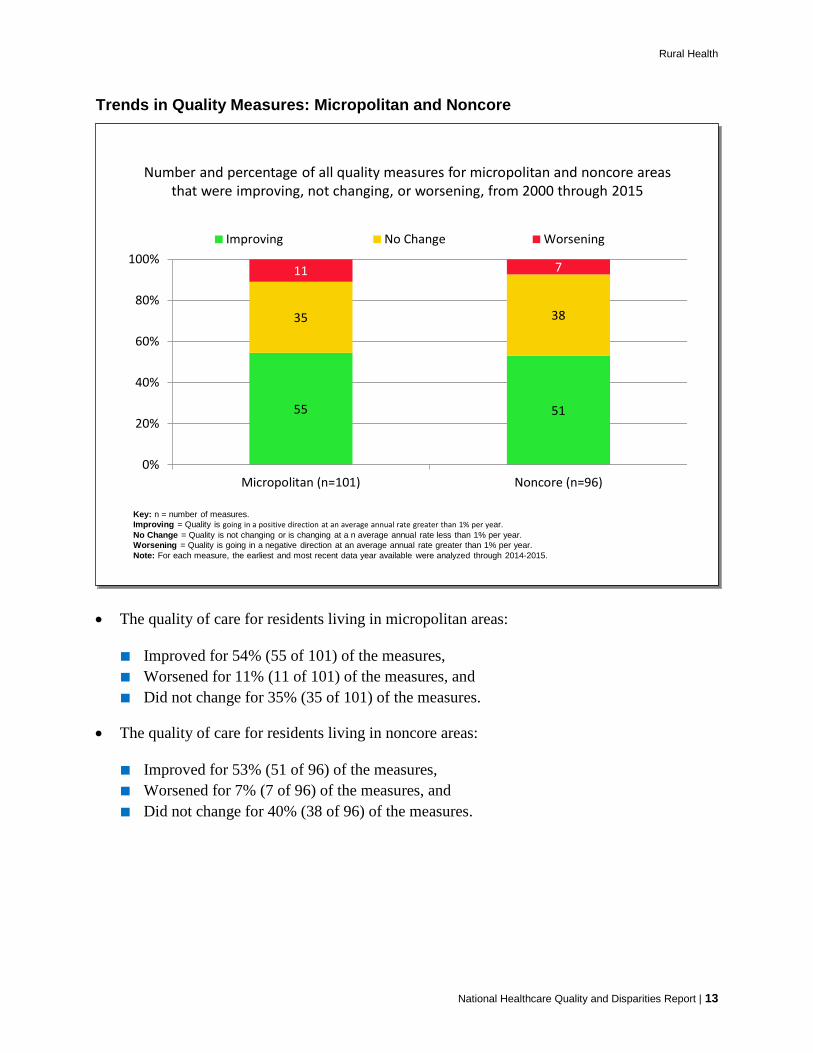
• The quality of care for residents living in micropolitan areas:
■ Improved for 54% (55 of 101) of the measures, ■ Worsened for 11% (11 of 101) of the measures, and ■ Did not change for 35% (35 of 101) of the measures.
• The quality of care for residents living in noncore areas:
■ Improved for 53% (51 of 96) of the measures, ■ Worsened for 7% (7 of 96) of the measures, and ■ Did not change for 40% (38 of 96) of the measures.
National Healthcare Quality and Disparities Report | 13
Rural Health
Access to Health Care Specific Source of Ongoing Care
People with a specific source of ongoing care, by residence location, 2009-2014
75
80
85
90
95
100
2009 2010 2011 2012 2013 2014
Perc
ent
Total Large Central Metro Large Fringe Metro Medium MetroSmall Metro Micropolitan Noncore
Source: Centers for Disease Control and Prevention, National Center for Health Statistics, National Health Interview Survey, 2009-2014.
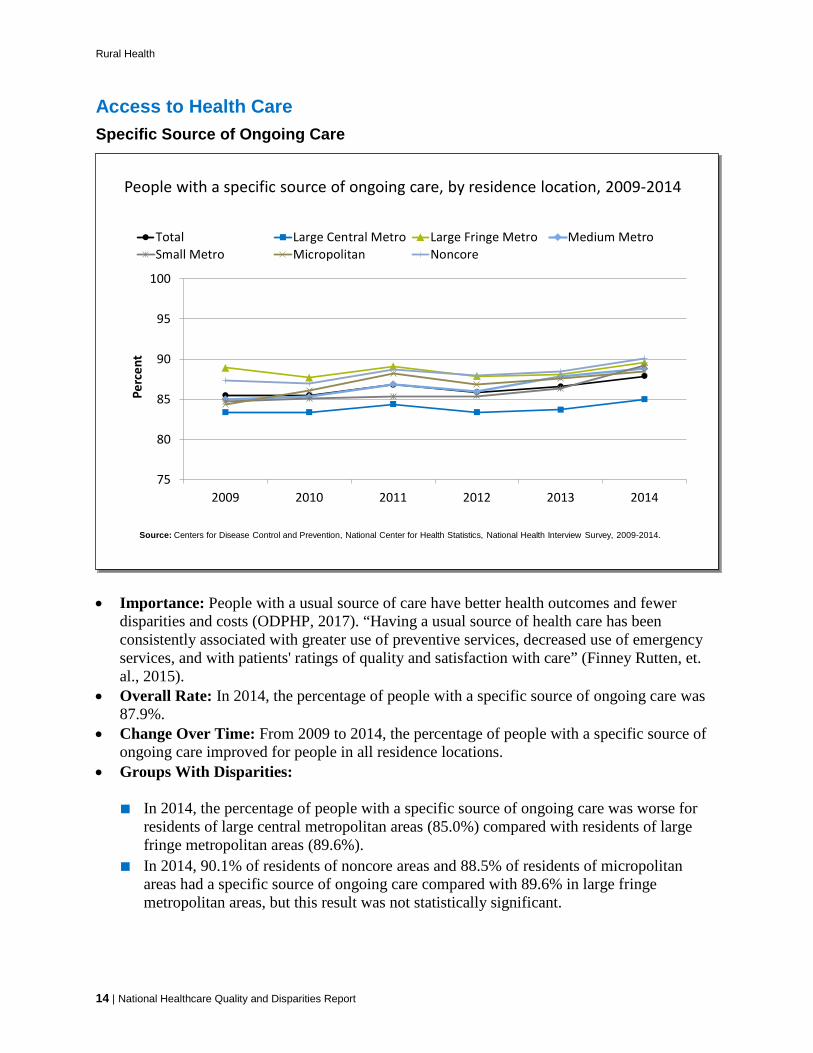
• Importance: People with a usual source of care have better health outcomes and fewer disparities and costs (ODPHP, 2017). “Having a usual source of health care has been consistently associated with greater use of preventive services, decreased use of emergency services, and with patients' ratings of quality and satisfaction with care” (Finney Rutten, et. al., 2015).
• Overall Rate: In 2014, the percentage of people with a specific source of ongoing care was 87.9%.
• Change Over Time: From 2009 to 2014, the percentage of people with a specific source of ongoing care improved for people in all residence locations.
• Groups With Disparities:
■ In 2014, the percentage of people with a specific source of ongoing care was worse for residents of large central metropolitan areas (85.0%) compared with residents of large fringe metropolitan areas (89.6%).
■ In 2014, 90.1% of residents of noncore areas and 88.5% of residents of micropolitan areas had a specific source of ongoing care compared with 89.6% in large fringe metropolitan areas, but this result was not statistically significant.
14 | National Healthcare Quality and Disparities Report

Rural Health
Hospital, Emergency Room, or Clinic as Source of Ongoing Care
People who identified a hospital, emergency room, or clinic as a source of ongoing care, by residence location, stratified by race/ethnicity, 2014
0102030405060708090
100
Total White Black Hispanic
Perc
ent
Large Central Metro Large Fringe Metro Medium MetroSmall Metro Micropolitan Noncore
Source: Centers for Disease Control and Prevention, National Center for Health Statistics, National Health Interview Survey, 2014.Note: For this measure, lower rates are better. White and Black are non-Hispanic. Hispanic includes all races.
• Overall Rate: In 2014, the percentage of people who identified a hospital, emergency room, or clinic as a source of ongoing care was higher for residents of noncore (36.5%), small metropolitan (28.4%), micropolitan (26.0%), large central metropolitan (23.2%), and medium metropolitan (20.8%) areas compared with residents of large fringe metropolitan areas (15.0%).
• Groups With Disparities:
■ In 2014, the percentage of people who identified a hospital, emergency room, or clinic as a source of ongoing care was higher for Blacks and Hispanics in all residence locations compared with Whites. Hispanics also had worse percentages in all locations compared with Blacks.
■ In 2014, more than half of Hispanics (58.6%) living in noncore areas and 36.9% of Hispanics living in micropolitan areas identified a hospital, emergency room, or clinic as a source of ongoing care.
■ Also in 2014, 36.9% of Blacks living in noncore areas and 27.8% of Blacks living in micropolitan areas identified a hospital, emergency room, or clinic as a source of ongoing care.
■ Whites had the lowest reported rates, with 33.1% of noncore residents and 23.7% of micropolitan residents identifying a hospital, emergency room, or clinic as a source of ongoing care.
National Healthcare Quality and Disparities Report | 15
Rural Health
Emergency Department Visits for Dental Conditions
Emergency department visits with a principal diagnosis related to dental conditions per 100,000 population, by residence location, 2010-2014
0
100
200
300
400
500
600
2010 2011 2012 2013 2014
Rate
per
100
,000
Pop
ulat
ion
Total Large Central Metro Large Fringe MetroMedium and Small Metro Micropolitan and Noncore
Source: Agency for Healthcare Research and Quality, Healthcare Cost and Utilization Project, National Emergency Department Sample, 2010-2014.Denominator: U.S. resident population.Note: For this measure, lower rates are better.
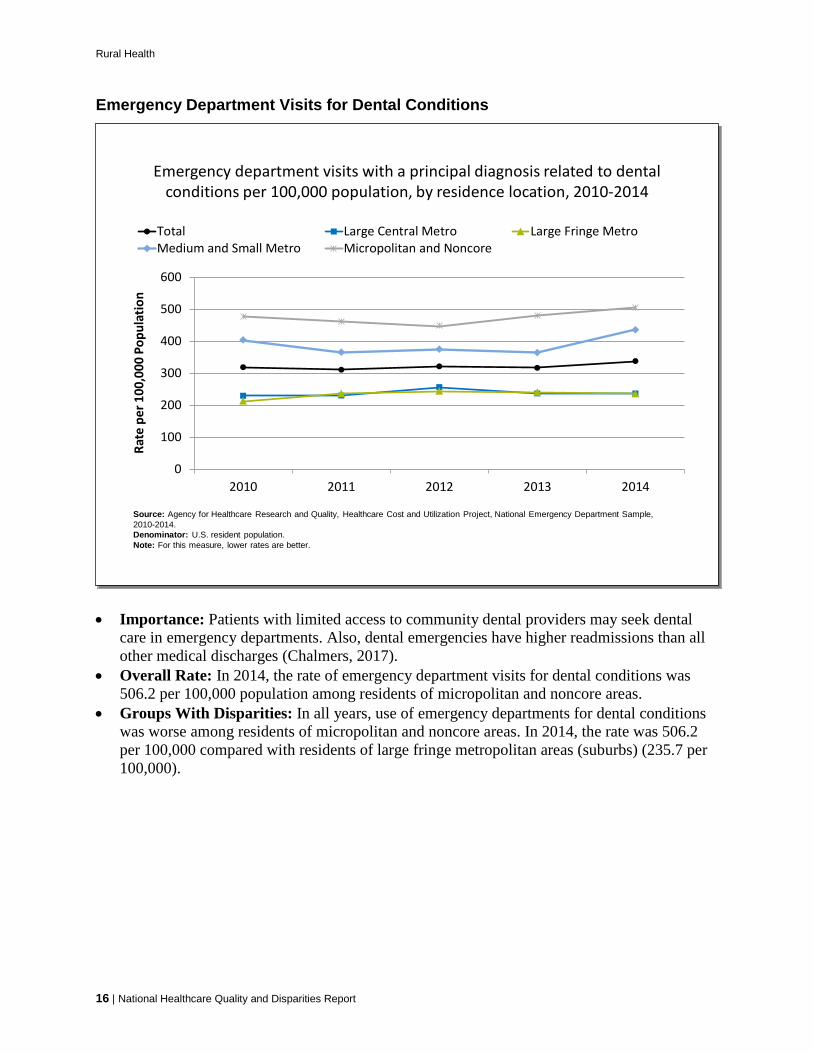
• Importance: Patients with limited access to community dental providers may seek dental care in emergency departments. Also, dental emergencies have higher readmissions than all other medical discharges (Chalmers, 2017).
• Overall Rate: In 2014, the rate of emergency department visits for dental conditions was 506.2 per 100,000 population among residents of micropolitan and noncore areas.
• Groups With Disparities: In all years, use of emergency departments for dental conditions was worse among residents of micropolitan and noncore areas. In 2014, the rate was 506.2 per 100,000 compared with residents of large fringe metropolitan areas (suburbs) (235.7 per 100,000).
16 | National Healthcare Quality and Disparities Report
Rural Health
Trauma Center Utilization
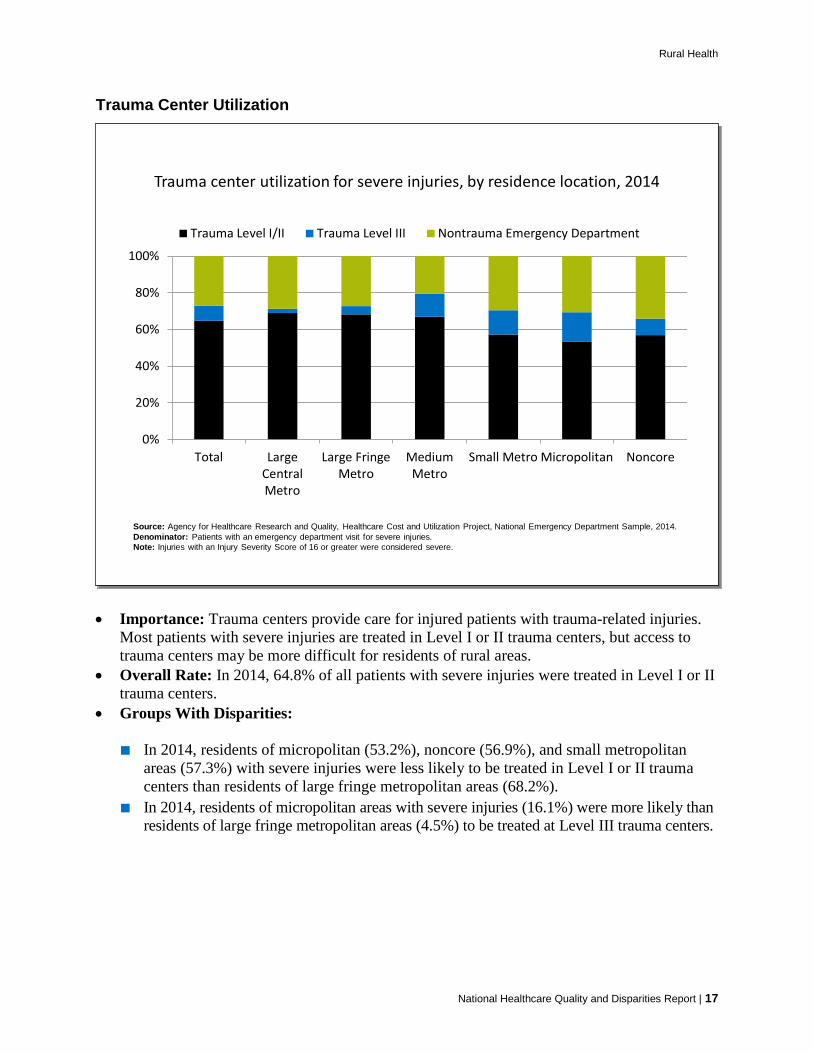
Trauma center utilization for severe injuries, by residence location, 2014
0%
20%
40%
60%
80%
100%
Total LargeCentralMetro
Large FringeMetro
MediumMetro
Small Metro Micropolitan Noncore
Trauma Level I/II Trauma Level III Nontrauma Emergency Department
Source: Agency for Healthcare Research and Quality, Healthcare Cost and Utilization Project, National Emergency Department Sample, 2014.Denominator: Patients with an emergency department visit for severe injuries.Note: Injuries with an Injury Severity Score of 16 or greater were considered severe.
National Healthcare Quality and Disparities Report | 17
• Importance: Trauma centers provide care for injured patients with trauma-related injuries. Most patients with severe injuries are treated in Level I or II trauma centers, but access to trauma centers may be more difficult for residents of rural areas.
• Overall Rate: In 2014, 64.8% of all patients with severe injuries were treated in Level I or II trauma centers.
• Groups With Disparities:
■ In 2014, residents of micropolitan (53.2%), noncore (56.9%), and small metropolitan areas (57.3%) with severe injuries were less likely to be treated in Level I or II trauma centers than residents of large fringe metropolitan areas (68.2%).
■ In 2014, residents of micropolitan areas with severe injuries (16.1%) were more likely than residents of large fringe metropolitan areas (4.5%) to be treated at Level III trauma centers.
Rural Health
Usual Source of Care With Office Hours at Night or on Weekends
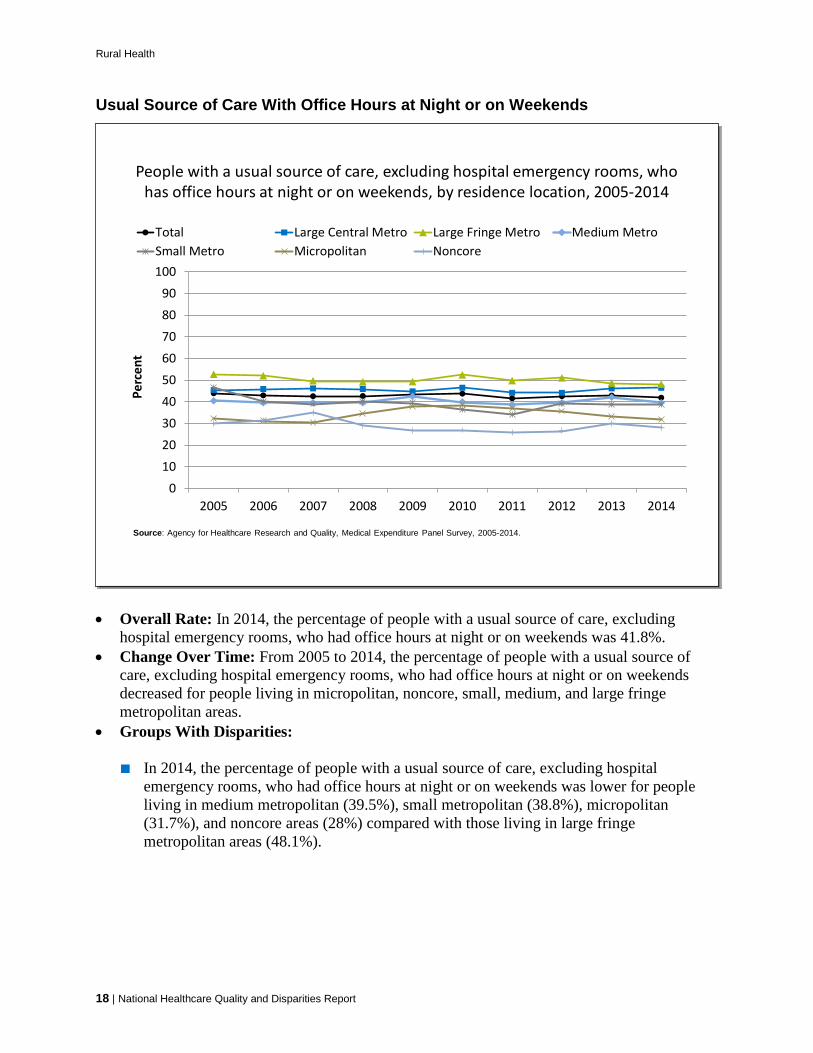
People with a usual source of care, excluding hospital emergency rooms, who has office hours at night or on weekends, by residence location, 2005-2014
0102030405060708090
100
2005 2006 2007 2008 2009 2010 2011 2012 2013 2014
Perc
ent
Total Large Central Metro Large Fringe Metro Medium MetroSmall Metro Micropolitan Noncore
Source: Agency for Healthcare Research and Quality, Medical Expenditure Panel Survey, 2005-2014.
18 | National Healthcare Quality and Disparities Report
• Overall Rate: In 2014, the percentage of people with a usual source of care, excluding hospital emergency rooms, who had office hours at night or on weekends was 41.8%.
• Change Over Time: From 2005 to 2014, the percentage of people with a usual source of care, excluding hospital emergency rooms, who had office hours at night or on weekends decreased for people living in micropolitan, noncore, small, medium, and large fringe metropolitan areas.
• Groups With Disparities:
■ In 2014, the percentage of people with a usual source of care, excluding hospital emergency rooms, who had office hours at night or on weekends was lower for people living in medium metropolitan (39.5%), small metropolitan (38.8%), micropolitan (31.7%), and noncore areas (28%) compared with those living in large fringe metropolitan areas (48.1%).

Rural Health
Usual Source of Care With Office Hours at Night or on Weekends, by Income
People with a usual source of care, excluding hospital emergency rooms, who has office hours at night or on weekends, by residence location, stratified by income, 2014
0102030405060708090
100
Total Poor Low Income Middle Income High Income
Perc
ent
Large Central Metro Large Fringe Metro Medium MetroSmall Metro Micropolitan Noncore
Source: Agency for Healthcare Research and Quality, Medical Expenditure Panel Survey, 2014.
National Healthcare Quality and Disparities Report | 19
• Overall Rate: In 2014, the percentage of people with a usual source of care, excluding hospital emergency rooms, who had office hours at night or on weekends was lower for residents of large central metropolitan (46.4%), medium metropolitan (39.5%), small metropolitan (38.8%), micropolitan (31.7%), and noncore areas (28%) compared with residents of large fringe metropolitan areas (48.1%).
• Groups With Disparities:
■ In 2014, among people with high income, the percentage of people with a usual source of care, excluding hospital emergency rooms, who had office hours at night or on weekends was worse for residents of micropolitan areas (30.5%) compared with residents of large fringe metropolitan areas (50.5%).
■ In 2014, among people with middle income, the percentage of people with a usual source of care, excluding hospital emergency rooms, who had office hours at night or on weekends was worse for residents of noncore areas (24.0%) compared with residents of large fringe metropolitan areas (46.8%).
■ In 2014, among people with low income, the percentage of people with a usual source of care, excluding hospital emergency rooms, who had office hours at night or on weekends was worse for residents of micropolitan areas (27.6%) and noncore areas (29.1%) compared with residents of large fringe metropolitan areas (44.6%).

Rural Health
■ In 2014, among poor people, the percentage of people with a usual source of care, excluding hospital emergency rooms, who had office hours at night or on weekends was lower for residents of micropolitan areas (26.2%) and noncore areas (21.8%) compared with residents of large fringe metropolitan areas (44.5%).
Patient Safety Postoperative Sepsis
Postoperative sepsis per 1,000 adult discharges with an elective operating room procedure, by hospital location, 2008-2014
0
5
10
15
20
25
2008 2009 2010 2011 2012 2013 2014
Rate
per
1,0
00 D
isch
arge
s
Total Large Central Metro Large Fringe Metro Medium MetroSmall Metro Micropolitan Noncore
Source: Agency for Healthcare Research and Quality (AHRQ), Healthcare Cost and Utilization Project, 2008-2014 Nationwide Inpatient Sample and 2014 State Inpatient Databases quality analysis file, and AHRQ Quality Indicators, modified version 4.4. Denominator: All elective surgical discharges from community hospitals for patients age 18 years and over with length of stay of 4 or moredays, excluding patients admitted for infection, those with cancer or immunocompromised states, those with obstetric conditions, and admissions specifically for sepsis. Discharges from critical access hospitals are typically included while discharges from rehabilitation and long-term acute care hospitals are excluded.Note: For this measure, lower rates are better. Rates are adjusted by age, sex, age-sex interactions, comorbidities, major diagnostic category, diagnosis-related group, and transfers into the hospital.
2014 Achievable Benchmark:
12.2 per 1,000 Discharges
20 | National Healthcare Quality and Disparities Report
• Importance: Infections acquired during hospital care—also known as nosocomial infections—are among the most common complications of hospital care. Patients are particularly vulnerable to healthcare-associated infections after surgery. Hospitals in more rural areas may refer patients to hospitals in urban areas for complex surgeries.
• Change Over Time: From 2008 to 2014, the total rate of postoperative sepsis increased from 15.6 per 1,000 discharges to 16.7.
• Groups With Disparities: In 2014, hospitals in noncore areas had a lower rate (14.9) and those in large central metropolitan areas had a higher rate (18.3) than hospitals in large fringe metropolitan areas (suburbs) (15.9).
Rural Health
• Achievable Benchmark:
■ The 2014 top 4 State achievable benchmark was 12.2 per 1,000 discharges. The top 4 States that contributed to the benchmark were Georgia, Iowa, Nebraska, and Wisconsin.
■ At current rates of improvement, the benchmark could be met in 7 years by hospitals in medium metropolitan areas. Large fringe metropolitan areas could not meet the benchmark for 21 years.
■ While having lower rates, hospitals in noncore and micropolitan areas show no movement toward the benchmark.
Person- and Family-Centered Care Provider-Patient Communication
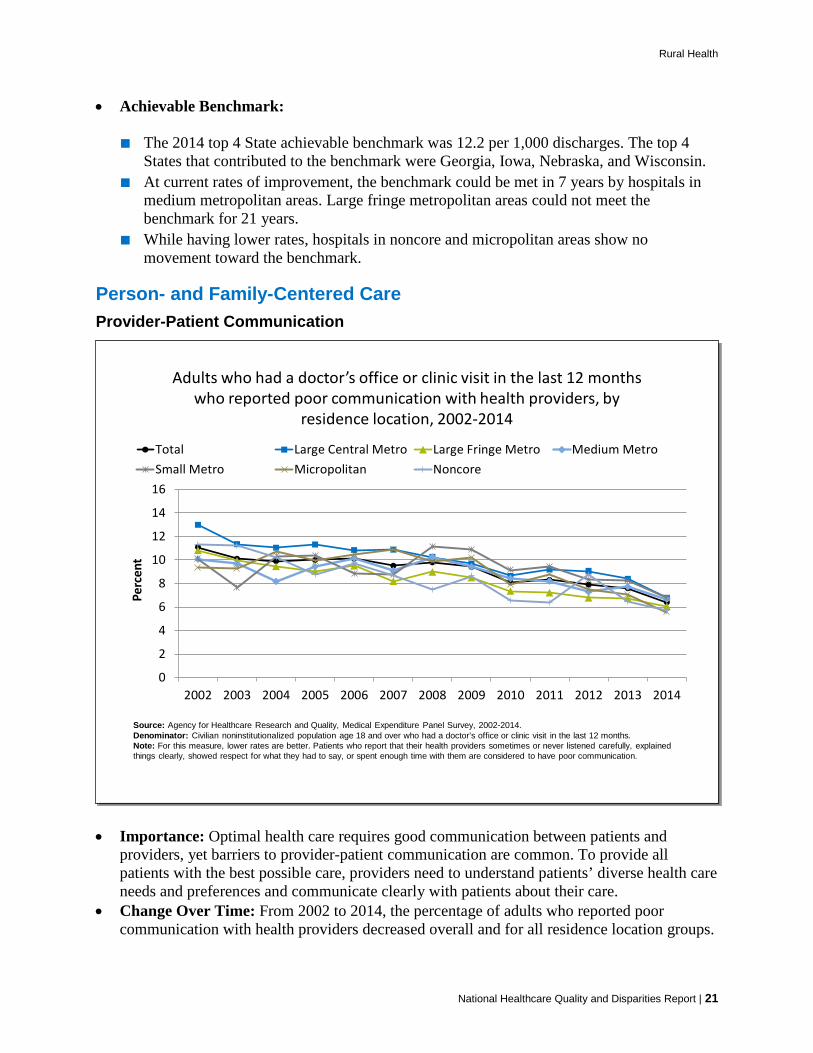
Adults who had a doctor’s office or clinic visit in the last 12 months who reported poor communication with health providers, by
residence location, 2002-2014
0
2
4
6
8
10
12
14
16
2002 2003 2004 2005 2006 2007 2008 2009 2010 2011 2012 2013 2014
Perc
ent
Total Large Central Metro Large Fringe Metro Medium MetroSmall Metro Micropolitan Noncore
Source: Agency for Healthcare Research and Quality, Medical Expenditure Panel Survey, 2002-2014.Denominator: Civilian noninstitutionalized population age 18 and over who had a doctor’s office or clinic visit in the last 12 months.Note: For this measure, lower rates are better. Patients who report that their health providers sometimes or never listened carefully, explained things clearly, showed respect for what they had to say, or spent enough time with them are considered to have poor communication.
National Healthcare Quality and Disparities Report | 21
• Importance: Optimal health care requires good communication between patients and providers, yet barriers to provider-patient communication are common. To provide all patients with the best possible care, providers need to understand patients’ diverse health care needs and preferences and communicate clearly with patients about their care.
• Change Over Time: From 2002 to 2014, the percentage of adults who reported poor communication with health providers decreased overall and for all residence location groups.
Rural Health
• Groups With Disparities: In 2014, the percentage of people reporting poor communication was higher for residents of large central metropolitan areas (6.8%) compared with those in large fringe metropolitan areas (6.1%).
Usual Source of Care Asking for Help With Treatment Decisions
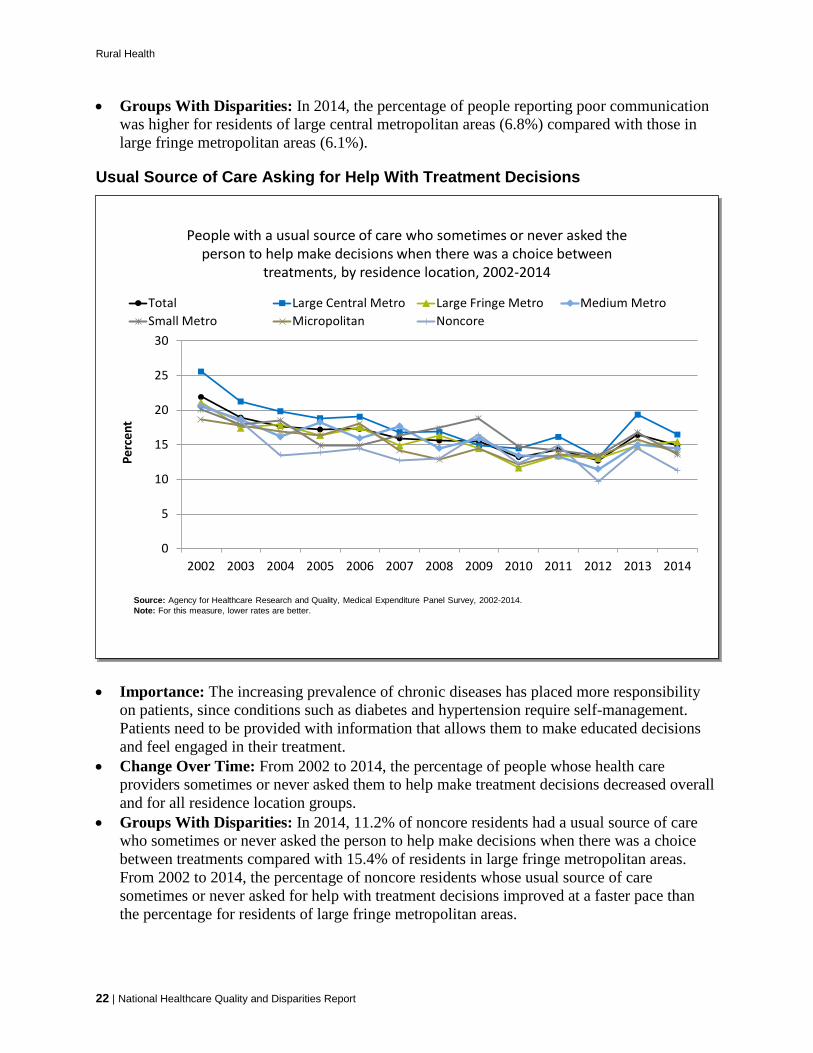
People with a usual source of care who sometimes or never asked the person to help make decisions when there was a choice between
treatments, by residence location, 2002-2014
0
5
10
15
20
25
30
2002 2003 2004 2005 2006 2007 2008 2009 2010 2011 2012 2013 2014
Perc
ent
Total Large Central Metro Large Fringe Metro Medium MetroSmall Metro Micropolitan Noncore
Source: Agency for Healthcare Research and Quality, Medical Expenditure Panel Survey, 2002-2014.Note: For this measure, lower rates are better.
22 | National Healthcare Quality and Disparities Report
• Importance: The increasing prevalence of chronic diseases has placed more responsibility on patients, since conditions such as diabetes and hypertension require self-management. Patients need to be provided with information that allows them to make educated decisions and feel engaged in their treatment.
• Change Over Time: From 2002 to 2014, the percentage of people whose health care providers sometimes or never asked them to help make treatment decisions decreased overall and for all residence location groups.
• Groups With Disparities: In 2014, 11.2% of noncore residents had a usual source of care who sometimes or never asked the person to help make decisions when there was a choice between treatments compared with 15.4% of residents in large fringe metropolitan areas. From 2002 to 2014, the percentage of noncore residents whose usual source of care sometimes or never asked for help with treatment decisions improved at a faster pace than the percentage for residents of large fringe metropolitan areas.

Rural Health
Care Coordination Potentially Avoidable Hospitalizations
Potentially avoidable hospitalizations for all conditions per 100,000 population, by residence location, 2005-2014
0
500
1,000
1,500
2,000
2,500
3,000
2005 2006 2007 2008 2009 2010 2011 2012 2013 2014
Rate
per
100
,000
Pop
ulat
ion
Total Large Central Metro Large Fringe Metro Medium MetroSmall Metro Micropolitan Noncore
2014 Achievable Benchmark: 872 per 100,000 Population
Source: Agency for Healthcare Research and Quality (AHRQ), Healthcare Cost and Utilization Project, 2005-2014, Nationwide Inpatient Sample and 2014 State Inpatient Databases quality analysis file, and AHRQ Quality Indicators, version 4.4. Note: For this measure, lower rates are better. Data for all residence locations had small sample sizes. Rates are adjusted by age and gender using the total U.S. resident population for 2010 as the standard population.
• Importance: Hospitalizations due to ambulatory care-sensitive conditions (ACSCs) such as hypertension and pneumonia should be largely prevented if ambulatory care is provided in a timely and effective manner. Evidence suggests that effective primary care is associated with lower rates of ACSC hospitalization (also referred to as avoidable hospitalizations) (Gao, et al., 2014).
• Overall Rate: In 2014, the overall rate of potentially avoidable hospitalizations for all conditions was 1,426 per 100,000 population.
• Trends:
■ From 2005 through 2014, the overall rate of potentially avoidable hospitalizations for all conditions declined from 1,941 per 100,000 population to 1,426 per 100,000 population.
■ The rate of potentially avoidable hospitalizations for all conditions decreased for all residence locations.
National Healthcare Quality and Disparities Report | 23
Rural Health
• Groups With Disparities:
■ From 2005 to 2014, the rate of potentially avoidable hospitalizations for all conditions was higher for people living in noncore areas compared with those living in large fringe metropolitan areas (2005: 2,583 vs. 1,842 per 100,000 population and 2014: 1,872 vs. 1,373 per 100,000 population).
■ In 2014, the rate of potentially avoidable hospitalizations for all conditions for people living in noncore areas (1,872 per 100,000 population) and micropolitan areas (1,744 per 100,000 population) was higher than for residents of large fringe metropolitan areas (1,373 per 100,000 population).
■ The rate for residents of medium metropolitan areas was decreasing (from 1,796 per 100,000 population in 2005 to 1,152 per 100,000 population in 2014).
• Achievable Benchmark:
■ The 2014 top 4 State achievable benchmark was 872. The top 4 States that contributed to the achievable benchmark are Colorado, Hawaii, Oregon, and Washington.
■ The benchmark for residents of the following areas could be reached in the following timeframes: micropolitan and noncore areas (13 years), large central metropolitan and large fringe metropolitan areas (11 years), and medium metropolitan (6 years). Residents of small metropolitan areas could take 19 years to reach the benchmark.
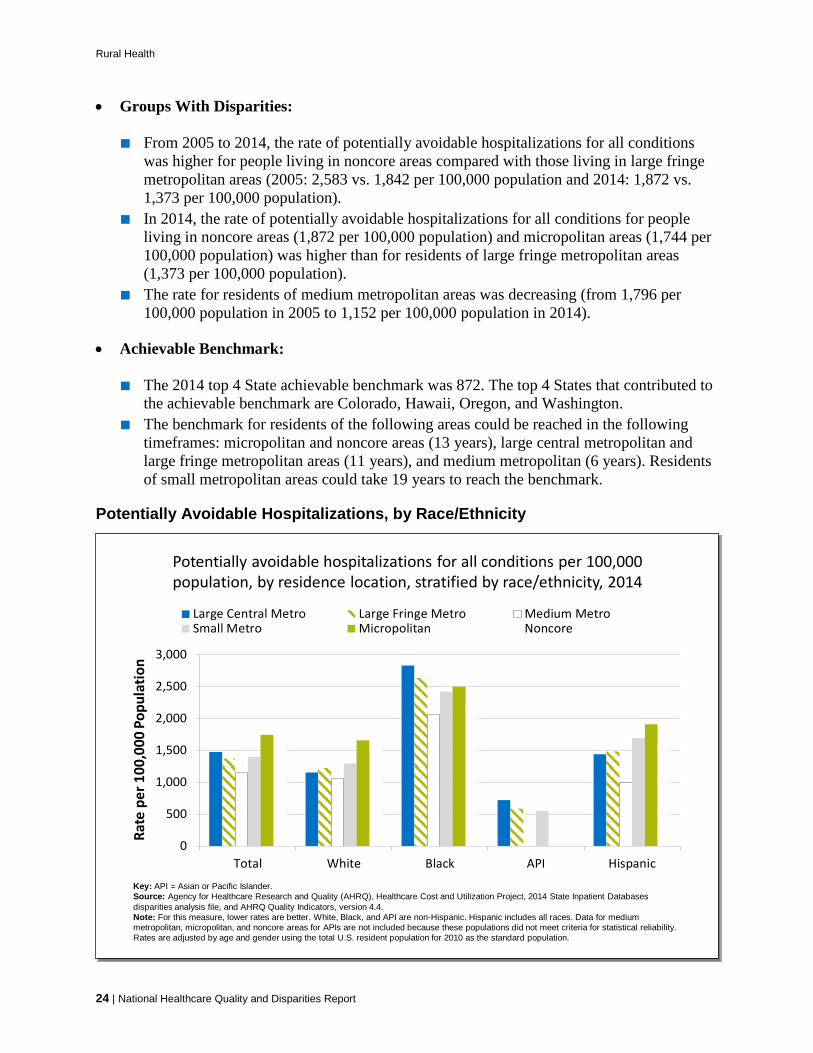
Potentially Avoidable Hospitalizations, by Race/Ethnicity
Potentially avoidable hospitalizations for all conditions per 100,000 population, by residence location, stratified by race/ethnicity, 2014
0
500
1,000
1,500
2,000
2,500
3,000
Total White Black API Hispanic
Rate
per
100
,000
Pop
ulat
ion
Large Central Metro Large Fringe Metro Medium MetroSmall Metro Micropolitan Noncore
Key: API = Asian or Pacific Islander.Source: Agency for Healthcare Research and Quality (AHRQ), Healthcare Cost and Utilization Project, 2014 State Inpatient Databases disparities analysis file, and AHRQ Quality Indicators, version 4.4. Note: For this measure, lower rates are better. White, Black, and API are non-Hispanic. Hispanic includes all races. Data for medium metropolitan, micropolitan, and noncore areas for APIs are not included because these populations did not meet criteria for statistical reliability. Rates are adjusted by age and gender using the total U.S. resident population for 2010 as the standard population.
24 | National Healthcare Quality and Disparities Report

Rural Health
• Overall Rate: In 2014, the rate of potentially avoidable hospitalizations for all conditions per 100,000 population was 1,474 for large central metropolitan, 1,373 for large fringe metropolitan, 1,152 for medium metropolitan, 1,396 for small metropolitan, 1,744 for micropolitan, and 1,872 for noncore areas.
• Groups With Disparities:
■ In 2014, the rate of potentially avoidable hospitalizations for all conditions was higher for Blacks living in noncore areas (2,208 per 100,000 population) compared with Whites living in noncore areas (1,848 per 100,000 population). The rate of potentially avoidable hospitalizations for all conditions was higher for Blacks in all other residence locations compared with Whites, Asians and Pacific Islanders, and Hispanics and was greater than the total rate.
■ In 2014, the rate of potentially avoidable hospitalizations for all conditions was worse (increasing) for Whites living in noncore areas and micropolitan areas (1,847 and 1,659 per 100,000 population) compared with those living in large fringe metropolitan areas (1,221 per 100,000 population).
■ In 2014, the rate of potentially avoidable hospitalizations for all conditions was lower for Hispanics living in medium metropolitan areas (993 per 100,000 population) compared with those living in large fringe metropolitan areas (1,481 per 100,000 population).
Admissions for Immunization-Preventable Influenza
Admissions for immunization-preventable influenza per 100,000 population, age 65 and over, by residence location, 2000-2014
020406080
100120140160180200
2000 2001 2002 2003 2004 2005 2006 2007 2008 2009 2010 2011 2012 2013 2014
Rate
per
100
,000
Pop
ulat
ion
Total Large Central Metro Large Fringe Metro Medium MetroSmall Metro Micropolitan Noncore
2014 Achievable Benchmark: 56.2
per 100,000 Population
Source: Agency for Healthcare Research and Quality (AHRQ), Healthcare Cost and Utilization Project, 2000-2014 Nationwide Inpatient Sample and 2014 State Inpatient Databases quality analysis file, and AHRQ Quality Indicators, version 4.4. Note: For this measure, lower rates are better. Rates are adjusted by age and gender using the total U.S. resident population for 2010 as the standard population.
National Healthcare Quality and Disparities Report | 25
Rural Health
• Importance: Immunization is a cost-effective strategy for reducing illness, death, and disparities associated with influenza.
• Overall Rate: In 2014, the rate of admissions for immunization-preventable influenza in patients age 65 and over was 146 per 100,000 population.
• Change Over Time: From 2000 to 2014, there was no clear geographic pattern in the rate of admissions for immunization-preventable influenza among people age 65 and over.
• Groups With Disparities: In 2014, admissions for immunization-preventable influenza per 100,000 population age 65 and over was lower for people living in medium metropolitan areas (116.1 per 100,000) compared with those living in large fringe metropolitan areas (168.9 per 100,000).
• Achievable Benchmark:
■ The 2014 top 4 State achievable benchmark was 56.2 per 100,000 population. The top 4 States that contributed to the achievable benchmark are California, Nevada, Oregon, and Wyoming.
■ Residents of noncore metropolitan areas are moving toward the benchmark but could not achieve the benchmark for more than 20 years.
■ Residents of large central metropolitan areas are moving away from the benchmark. Residents of large fringe metropolitan, medium metropolitan, small metropolitan, and micropolitan areas are not making progress toward the benchmark.
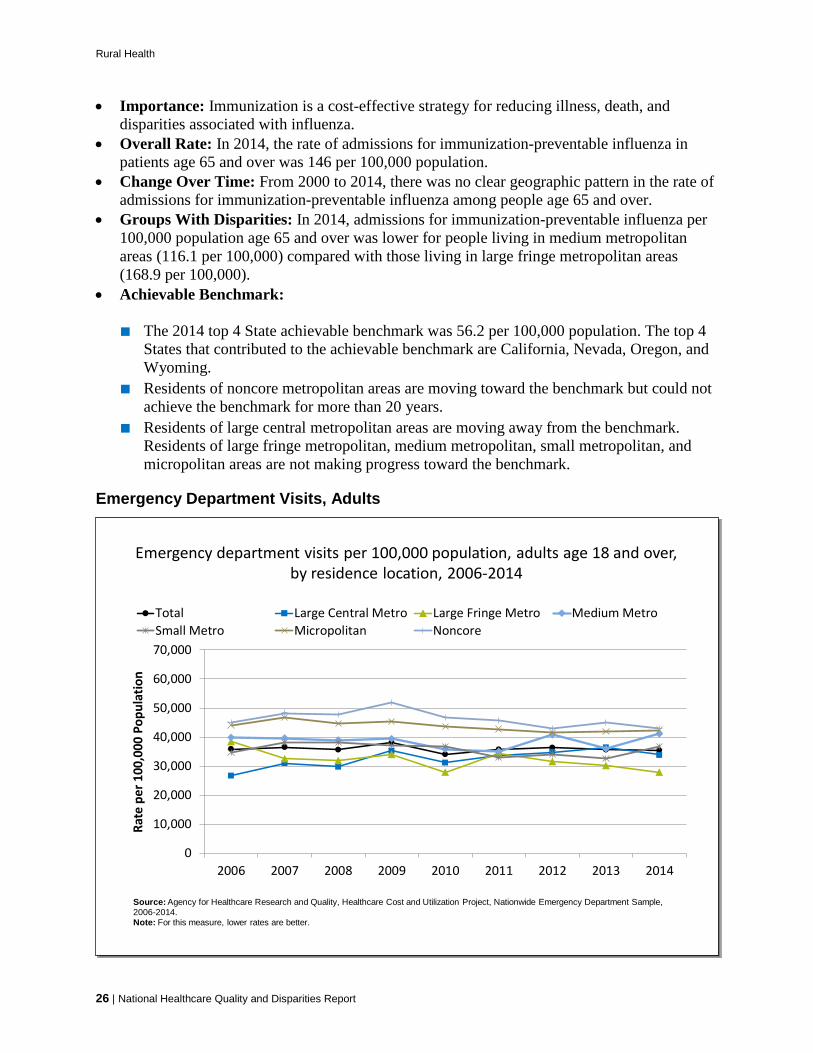
Emergency Department Visits, Adults
Emergency department visits per 100,000 population, adults age 18 and over, by residence location, 2006-2014
0
10,000
20,000
30,000
40,000
50,000
60,000
70,000
2006 2007 2008 2009 2010 2011 2012 2013 2014
Rate
per
100
,000
Pop
ulat
ion
Total Large Central Metro Large Fringe Metro Medium MetroSmall Metro Micropolitan Noncore
Source: Agency for Healthcare Research and Quality, Healthcare Cost and Utilization Project, Nationwide Emergency Department Sample, 2006-2014.Note: For this measure, lower rates are better.
26 | National Healthcare Quality and Disparities Report

Rural Health
• Importance: Emergency department (ED) visits are costly. An estimated 13% to 27% of ED visits in the United States could be managed in physician offices, clinics, and urgent care centers, saving $4.4 billion annually (Weinick, et al., 2010).
• Overall Rate: In 2014, the rate of ED visits for adults ages 18 and over was 35,472 per 100,000 population. From 2006 to 2014, there were no statistically significant changes in the overall rate.
• Change Over Time: The rate of ED visits per 100,000 population for adults age 18 and over was increasing in large central metropolitan areas (from 26,665 per 100,000 population in 2006 to 33,793 in 2014). There were no statistically significant changes in other residence locations.
• Groups With Disparities: In 2014, residents of noncore (42,829), micropolitan (42,373), small metropolitan (36,613), and medium metropolitan (41,105) areas had higher ED visit rates than residents of large fringe metropolitan areas (27,915 per 100,000 population).
Emergency Department Visits, Children
Emergency department visits per 100,000 population, children ages 0-17, by residence location, 2006-2014
0
10,000
20,000
30,000
40,000
50,000
60,000
70,000
2006 2007 2008 2009 2010 2011 2012 2013 2014
Rate
per
100
,000
Pop
ulat
ion
Total Large Central Metro Large Fringe Metro Medium MetroSmall Metro Micropolitan Noncore
Source: Agency for Healthcare Research and Quality, Healthcare Cost and Utilization Project, 2006-2014, Nationwide Emergency Department Sample.Note: For this measure, lower rates are better.
• Overall Rate: In 2014, the rate of all ED visits for children ages 0-17 was 45,872 per 100,000 population.
National Healthcare Quality and Disparities Report | 27

Rural Health
• Change Over Time: From 2006 to 2014, the rates of ED visits per 100,000 population for children ages 0-17 were increasing in large central metropolitan (from 33,676 to 41,036), medium metropolitan (from 47,453 to 54,132), micropolitan (from 48,399 to 54,814), and noncore (from 47,677 to 52,279) areas. Small metropolitan areas did not have any statistically significant changes.
• Groups With Disparities: In 2014, residents of noncore (52,279), micropolitan (54,814), small metropolitan (48,156), and medium metropolitan (54,132) areas had higher ED visit rates than residents of large fringe metropolitan areas (38,072 per 100,000 population).
Emergency Department Visits Related to Mental Health or Substance Use
Emergency department visits with a principal diagnosis related to mental health, alcohol, or substance abuse per 100,000 population, 2007-2014
0
500
1,000
1,500
2,000
2,500
2007 2008 2009 2010 2011 2012 2013 2014
Rate
per
100
,000
Pop
ulat
ion
Total Large Central Metro Large Fringe Metro Medium MetroSmall Metro Micropolitan Noncore
Source: Agency for Healthcare Research and Quality (AHRQ), Healthcare Cost and Utilization Project, 2007-2014 Nationwide Emergency Department Sample, and AHRQ Quality Indicators, version 4.4. Note: For this measure, lower rates are better.
• Importance: “Approximately 20.2 million adults age 18 or over had a substance use disorder in 2014. Of these adults, 16.3 million had an alcohol use disorder and 6.2 million had an illicit drug use disorder. An estimated 2.3 million adults had both an alcohol use disorder and an illicit drug use disorder in the past year” (Lipari & Van Horn, 2017). Inadequate management of substance use disorders can lead to costly ED visits.
• Overall Rate: In 2014, the rate of ED visits with a principal diagnosis related to mental health, alcohol, or substance abuse was 2,072 per 100,000 population.
28 | National Healthcare Quality and Disparities Report
Rural Health
• Change Over Time: The rate for ED visits with a principal diagnosis related to mental health, alcohol, or substance abuse in all residence locations except noncore areas worsened over time.
• Groups With Disparities: In 2014, the rate of ED visits per 100,000 population was worse for residents of medium metropolitan areas (2,353) compared with residents of large fringe metropolitan areas (1,771).
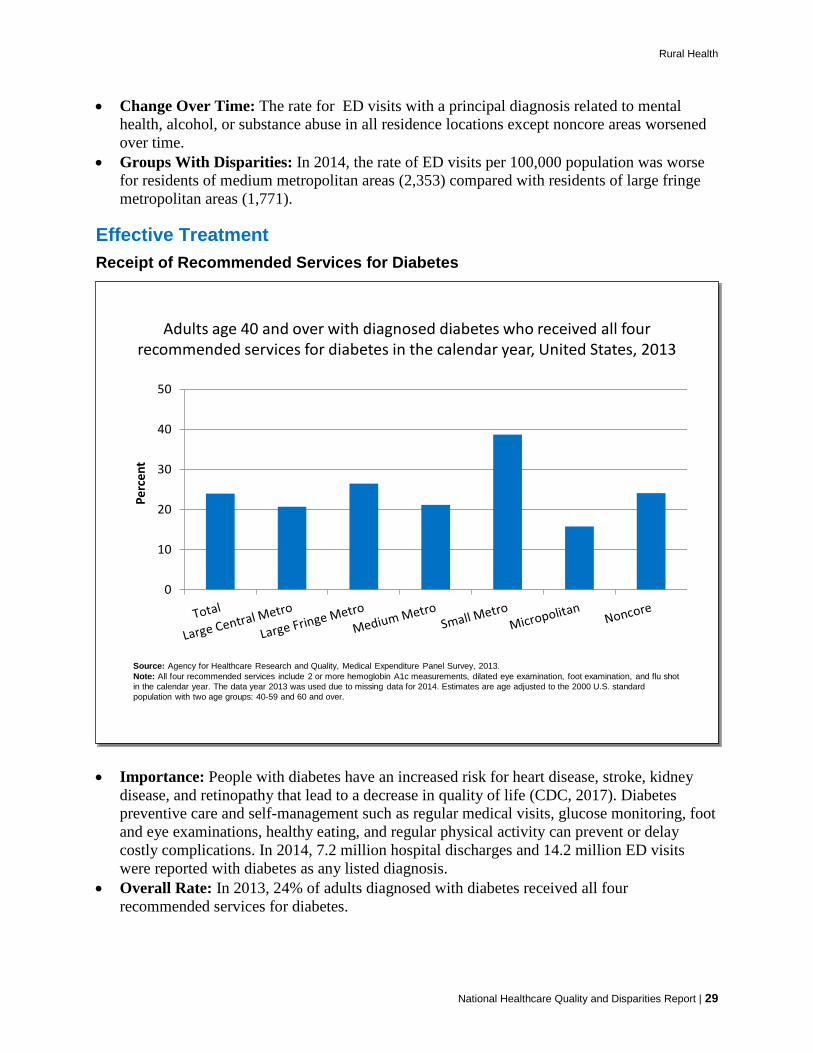
Effective Treatment Receipt of Recommended Services for Diabetes
Adults age 40 and over with diagnosed diabetes who received all four recommended services for diabetes in the calendar year, United States, 2013
0
10
20
30
40
50
Perc
ent
Source: Agency for Healthcare Research and Quality, Medical Expenditure Panel Survey, 2013.Note: All four recommended services include 2 or more hemoglobin A1c measurements, dilated eye examination, foot examination, and flu shot in the calendar year. The data year 2013 was used due to missing data for 2014. Estimates are age adjusted to the 2000 U.S. standard population with two age groups: 40-59 and 60 and over.
• Importance: People with diabetes have an increased risk for heart disease, stroke, kidney disease, and retinopathy that lead to a decrease in quality of life (CDC, 2017). Diabetes preventive care and self-management such as regular medical visits, glucose monitoring, foot and eye examinations, healthy eating, and regular physical activity can prevent or delay costly complications. In 2014, 7.2 million hospital discharges and 14.2 million ED visits were reported with diabetes as any listed diagnosis.
• Overall Rate: In 2013, 24% of adults diagnosed with diabetes received all four recommended services for diabetes.
National Healthcare Quality and Disparities Report | 29

Rural Health
• Groups With Disparities:
■ Adult residents of small metropolitan areas diagnosed with diabetes were more likely to receive all four recommended services than residents of large fringe metropolitan areas (38.7% vs. 26.5%). Residents of micropolitan areas were less likely to receive all four recommended services than residents of large fringe metropolitan areas (15.8% vs. 26.5%).
■ The percentage of adults diagnosed with diabetes who received all four recommended services was 20.7% in large central metropolitan areas, 26.5% in large fringe metropolitan areas, 21.2% in medium metropolitan areas, 38.7% in small metropolitan areas, 15.8 in micropolitan areas, and 24.1% in noncore areas.
Hospital Admissions for Uncontrolled Diabetes
Hospital admissions for uncontrolled diabetes without complications per 100,000 population, age 18 and over, by residence location, 2001-2014
Source: Agency for Healthcare Research and Quality, Healthcare Cost and Utilization Project, 2001-2014 Nationwide Inpatient Sample and 2014 State Inpatient Databases quality analysis file, and AHRQ Quality Indicators, version 4.4. Denominator: U.S. resident population age 18 and over.Note: For this measure, lower rates are better. Rates are adjusted by age and gender using the total U.S. resident population for 2010 as the standard population.
0
10
20
30
40
50
2001 2002 2003 2004 2005 2006 2007 2008 2009 2010 2011 2012 2013 2014
Rate
per
100
,000
Pop
ulat
ion
Total Large Central Metro Large Fringe Metro Medium MetroSmall Metro Micropolitan Noncore
2014 Achievable Benchmark: 4 per 100,000 Population
30 | National Healthcare Quality and Disparities Report
• Importance: Individuals who do not achieve good control of their diabetes may develop symptoms that require correction through hospitalization. Admission rates for uncontrolled diabetes may be reduced by better outpatient treatment and patients’ tighter adherence to diet and medication.
• Trends: From 2001 to 2014, the rate of hospital admissions for uncontrolled diabetes decreased overall and for all residence locations.
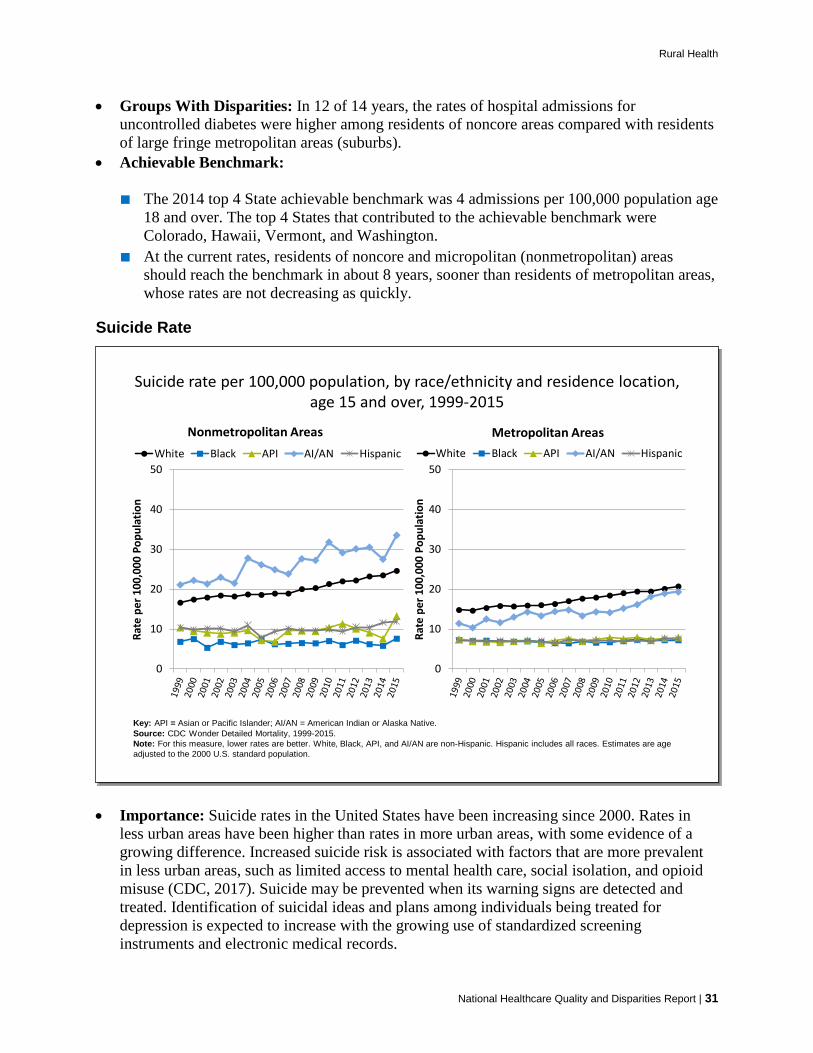
Rural Health
• Groups With Disparities: In 12 of 14 years, the rates of hospital admissions for uncontrolled diabetes were higher among residents of noncore areas compared with residents of large fringe metropolitan areas (suburbs).
• Achievable Benchmark:
■ The 2014 top 4 State achievable benchmark was 4 admissions per 100,000 population age 18 and over. The top 4 States that contributed to the achievable benchmark were Colorado, Hawaii, Vermont, and Washington.
■ At the current rates, residents of noncore and micropolitan (nonmetropolitan) areas should reach the benchmark in about 8 years, sooner than residents of metropolitan areas, whose rates are not decreasing as quickly.
Suicide Rate
Suicide rate per 100,000 population, by race/ethnicity and residence location, age 15 and over, 1999-2015
0
10
20
30
40
50
Rate
per
100
,000
Pop
ulat
ion
Nonmetropolitan AreasWhite Black API AI/AN Hispanic
0
10
20
30
40
50
Rate
per
100
,000
Pop
ulat
ion
Metropolitan AreasWhite Black API AI/AN Hispanic
Key: API = Asian or Pacific Islander; AI/AN = American Indian or Alaska Native.Source: CDC Wonder Detailed Mortality, 1999-2015.Note: For this measure, lower rates are better. White, Black, API, and AI/AN are non-Hispanic. Hispanic includes all races. Estimates are age adjusted to the 2000 U.S. standard population.
National Healthcare Quality and Disparities Report | 31
• Importance: Suicide rates in the United States have been increasing since 2000. Rates in less urban areas have been higher than rates in more urban areas, with some evidence of a growing difference. Increased suicide risk is associated with factors that are more prevalent in less urban areas, such as limited access to mental health care, social isolation, and opioid misuse (CDC, 2017). Suicide may be prevented when its warning signs are detected and treated. Identification of suicidal ideas and plans among individuals being treated for depression is expected to increase with the growing use of standardized screening instruments and electronic medical records.
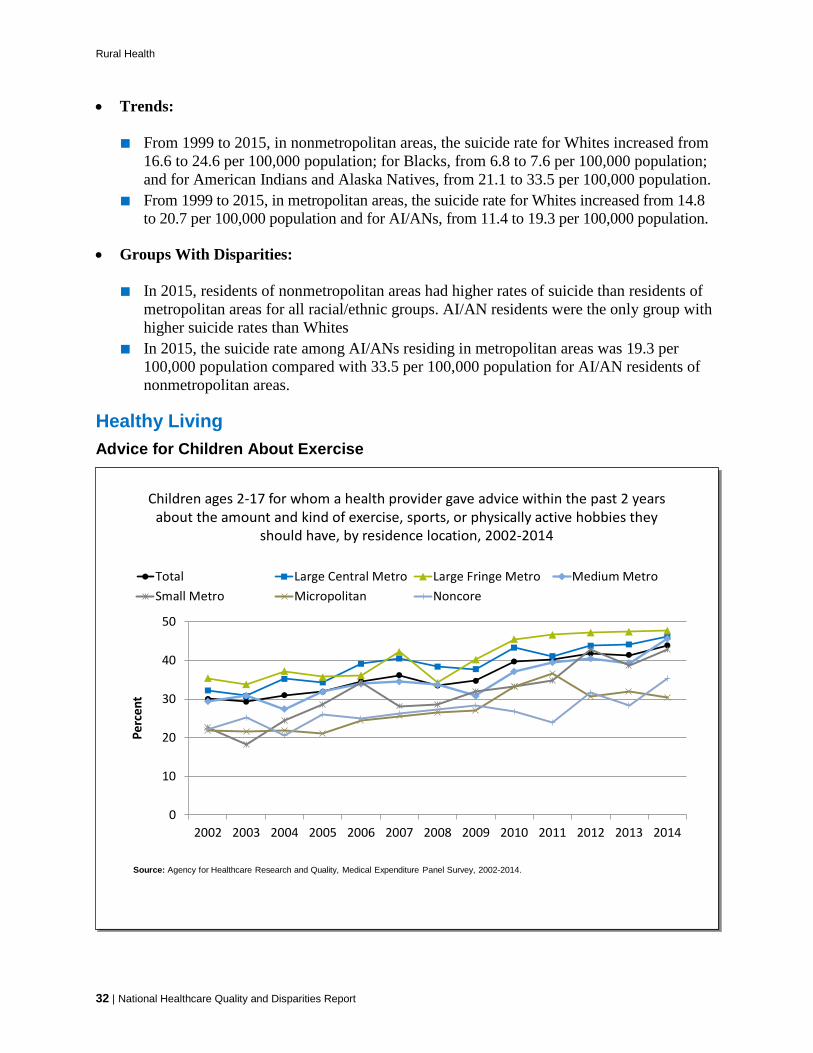
Rural Health
• Trends:
■ From 1999 to 2015, in nonmetropolitan areas, the suicide rate for Whites increased from 16.6 to 24.6 per 100,000 population; for Blacks, from 6.8 to 7.6 per 100,000 population; and for American Indians and Alaska Natives, from 21.1 to 33.5 per 100,000 population.
■ From 1999 to 2015, in metropolitan areas, the suicide rate for Whites increased from 14.8 to 20.7 per 100,000 population and for AI/ANs, from 11.4 to 19.3 per 100,000 population.
• Groups With Disparities:
■ In 2015, residents of nonmetropolitan areas had higher rates of suicide than residents of metropolitan areas for all racial/ethnic groups. AI/AN residents were the only group with higher suicide rates than Whites
■ In 2015, the suicide rate among AI/ANs residing in metropolitan areas was 19.3 per 100,000 population compared with 33.5 per 100,000 population for AI/AN residents of nonmetropolitan areas.
Healthy Living Advice for Children About Exercise
Children ages 2-17 for whom a health provider gave advice within the past 2 years about the amount and kind of exercise, sports, or physically active hobbies they
should have, by residence location, 2002-2014
0
10
20
30
40
50
2002 2003 2004 2005 2006 2007 2008 2009 2010 2011 2012 2013 2014
Perc
ent
Total Large Central Metro Large Fringe Metro Medium MetroSmall Metro Micropolitan Noncore
Source: Agency for Healthcare Research and Quality, Medical Expenditure Panel Survey, 2002-2014.
32 | National Healthcare Quality and Disparities Report
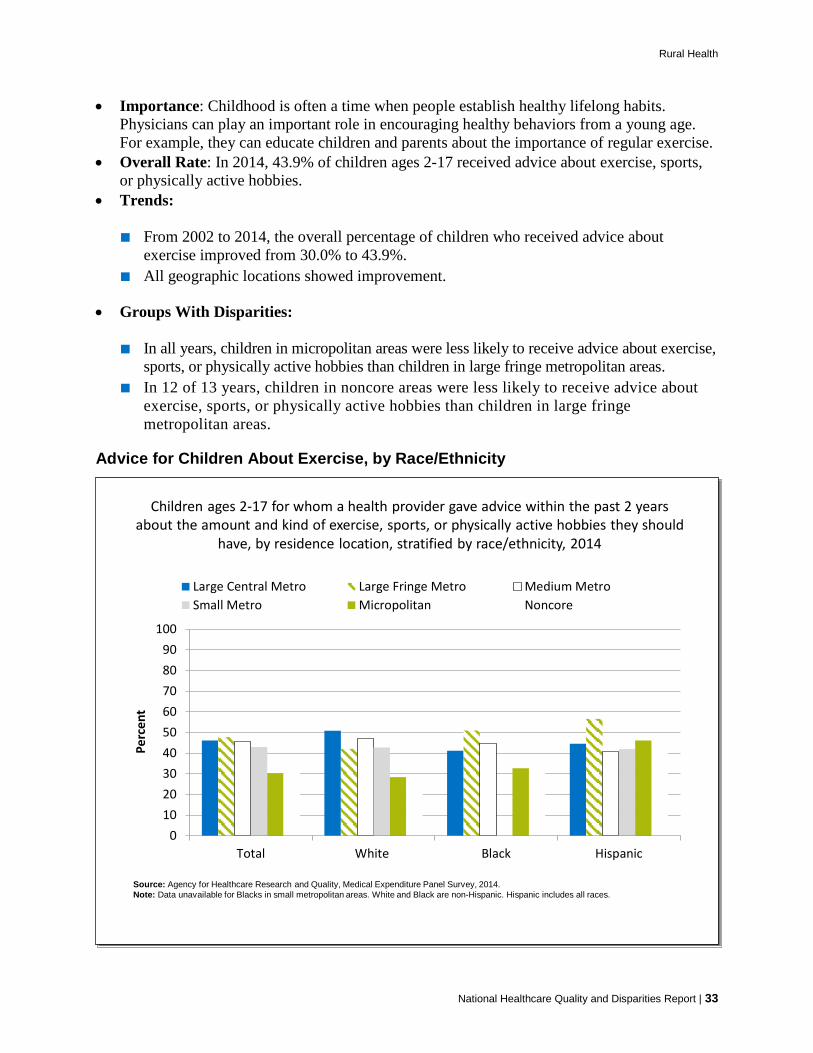
Rural Health
• Importance: Childhood is often a time when people establish healthy lifelong habits. Physicians can play an important role in encouraging healthy behaviors from a young age. For example, they can educate children and parents about the importance of regular exercise.
• Overall Rate: In 2014, 43.9% of children ages 2-17 received advice about exercise, sports, or physically active hobbies.
• Trends:
■ From 2002 to 2014, the overall percentage of children who received advice about exercise improved from 30.0% to 43.9%.
■ All geographic locations showed improvement.
• Groups With Disparities:
■ In all years, children in micropolitan areas were less likely to receive advice about exercise, sports, or physically active hobbies than children in large fringe metropolitan areas.
■ In 12 of 13 years, children in noncore areas were less likely to receive advice about exercise, sports, or physically active hobbies than children in large fringe metropolitan areas.
Advice for Children About Exercise, by Race/Ethnicity
Children ages 2-17 for whom a health provider gave advice within the past 2 years about the amount and kind of exercise, sports, or physically active hobbies they should
have, by residence location, stratified by race/ethnicity, 2014
0102030405060708090
100
Total White Black Hispanic
Perc
ent
Large Central Metro Large Fringe Metro Medium MetroSmall Metro Micropolitan Noncore
Source: Agency for Healthcare Research and Quality, Medical Expenditure Panel Survey, 2014.Note: Data unavailable for Blacks in small metropolitan areas. White and Black are non-Hispanic. Hispanic includes all races.
National Healthcare Quality and Disparities Report | 33

Rural Health
• Groups With Disparities:
■ Overall, children in micropolitan and noncore areas were less likely to receive advice about exercise, sports, or physically active hobbies than children in large fringe metropolitan areas.
■ Among Black children, residents of large central metropolitan, micropolitan, and noncore areas were less likely than residents of large fringe metropolitan areas to have a health care provider give advice about the amount and kind of exercise, sports, or physically active hobbies they should have.
■ Among Hispanic children, residents of large central metropolitan, medium metropolitan, and small metropolitan areas were less likely than residents of large fringe metropolitan areas to have a health care provider give advice about the amount and kind of exercise, sports, or physically active hobbies they should have.
■ Among White children, residents of micropolitan areas were less likely than residents of large fringe metropolitan areas to have a health care provider give advice about the amount and kind of exercise, sports, or physically active hobbies they should have.
Advice for Children About Healthy Eating
Children ages 2-17 for whom a health provider gave advice within the past 2 years about healthy eating, by residence location, 2002-2014
25
35
45
55
65
75
2002 2003 2004 2005 2006 2007 2008 2009 2010 2011 2012 2013 2014
Perc
ent
Total Large Central Metro Large Fringe Metro Medium MetroSmall Metro Micropolitan Noncore
Source: Agency for Healthcare Research and Quality, Medical Expenditure Panel Survey, 2002-2014.
34 | National Healthcare Quality and Disparities Report

Rural Health
• Importance: It is essential for physicians to emphasize to patients the importance of consuming foods from all food groups, including whole grains and fibers, lean proteins, complex carbohydrates, fruits, and vegetables, as well as providing education about balancing energy intake and energy expenditure.
• Overall Rate: In 2014, 60.5% of children ages 2-17 received advice about healthy eating. • Trends:
■ From 2002 to 2014, the overall percentage of children who received advice about healthy eating improved from 46.9% to 60.5%.
■ All geographic locations except noncore showed improvement.
• Groups With Disparities: In 2014, children in micropolitan and noncore areas were less likely to receive advice about healthy eating than children in large fringe metropolitan areas.
Advice for Children About Healthy Eating, by Race/Ethnicity
Children ages 2-17 for whom a health provider gave advice within the past 2 years about healthy eating, by residence location, stratified by race/ethnicity, 2014
0102030405060708090
100
Total White Black Hispanic
Perc
ent
Large Central Metro Large Fringe Metro Medium MetroSmall Metro Micropolitan Noncore
Source: Agency for Healthcare Research and Quality, Medical Expenditure Panel Survey, 2014.Note: Data not available for Black children in small metropolitan areas. White and Black are non-Hispanic. Hispanic includes all races.
• Importance: It is essential for physicians to emphasize to patients the importance of consuming foods from all food groups, including whole grains and fibers, lean proteins, complex carbohydrates, fruits, and vegetables, as well as providing education about balancing energy intake and energy expenditure.
National Healthcare Quality and Disparities Report | 35

Rural Health
• Overall Rate: In 2014, 60.5% of children ages 2-17 received advice about healthy eating (data not shown).
• Groups With Disparities:
■ Overall, in 2014, children residing in micropolitan and noncore areas were less likely to receive advice about healthy eating than children in large fringe metropolitan areas.
■ Among Black children, residents of noncore areas were less likely than residents of large fringe metropolitan areas to receive advice about healthy eating.
■ Among Hispanic children, residents of large central, medium metropolitan, and micropolitan areas were less likely than residents of large fringe metropolitan areas to receive advice about healthy eating.
■ Among White children, residents of micropolitan and noncore areas were less likely than residents of large fringe metropolitan areas to receive advice about healthy eating.
Children’s Dental Visits
Children ages 2-17 who had a dental visit in the calendar year, by residence location, stratified by race/ethnicity, 2014
0102030405060708090
100
Total White Black Hispanic
Perc
ent
Large Central Metro Large Fringe Metro Medium MetroSmall Metro Micropolitan Noncore
Source: Agency for Healthcare Research and Quality, Medical Expenditure Panel Survey, 2014.Note: White and Black are non-Hispanic. Hispanic includes all races.
36 | National Healthcare Quality and Disparities Report
• Importance: According to the National Institute of Dental and Craniofacial Research, presence of dental caries is the single most common chronic disease of childhood (NIDCR, 2014). Regular dental visits help to improve overall oral health and prevent dental caries.
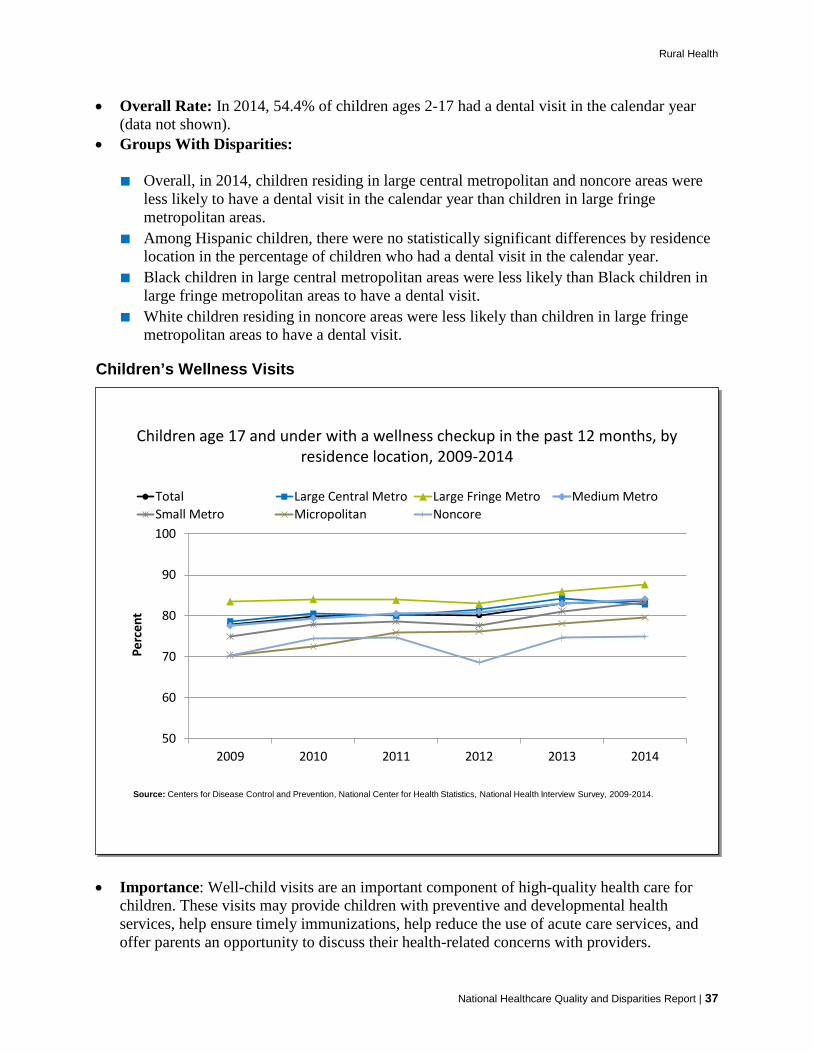
Rural Health
• Overall Rate: In 2014, 54.4% of children ages 2-17 had a dental visit in the calendar year (data not shown).
• Groups With Disparities:
■ Overall, in 2014, children residing in large central metropolitan and noncore areas were less likely to have a dental visit in the calendar year than children in large fringe metropolitan areas.
■ Among Hispanic children, there were no statistically significant differences by residence location in the percentage of children who had a dental visit in the calendar year.
■ Black children in large central metropolitan areas were less likely than Black children in large fringe metropolitan areas to have a dental visit.
■ White children residing in noncore areas were less likely than children in large fringe metropolitan areas to have a dental visit.
Children’s Wellness Visits
Children age 17 and under with a wellness checkup in the past 12 months, by residence location, 2009-2014
50
60
70
80
90
100
2009 2010 2011 2012 2013 2014
Perc
ent
Total Large Central Metro Large Fringe Metro Medium MetroSmall Metro Micropolitan Noncore
Source: Centers for Disease Control and Prevention, National Center for Health Statistics, National Health Interview Survey, 2009-2014.
National Healthcare Quality and Disparities Report | 37
• Importance: Well-child visits are an important component of high-quality health care for children. These visits may provide children with preventive and developmental health services, help ensure timely immunizations, help reduce the use of acute care services, and offer parents an opportunity to discuss their health-related concerns with providers.
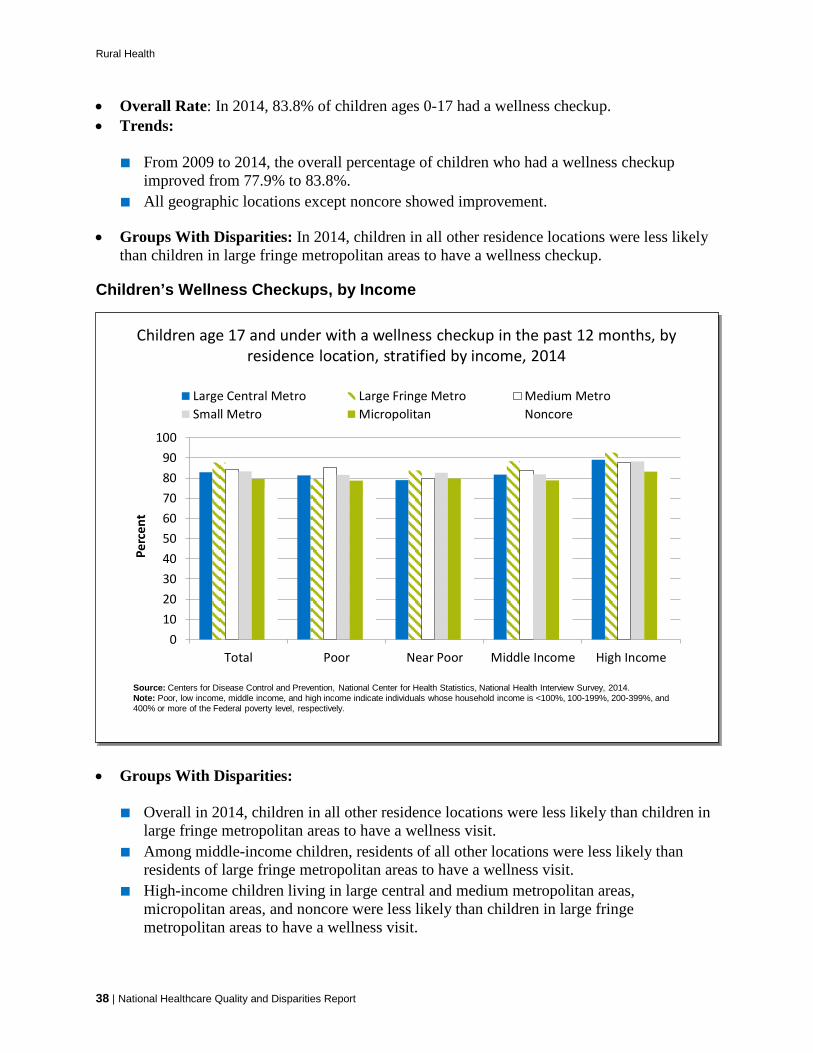
Rural Health
• Overall Rate: In 2014, 83.8% of children ages 0-17 had a wellness checkup. • Trends:
■ From 2009 to 2014, the overall percentage of children who had a wellness checkup improved from 77.9% to 83.8%.
■ All geographic locations except noncore showed improvement.
• Groups With Disparities: In 2014, children in all other residence locations were less likely than children in large fringe metropolitan areas to have a wellness checkup.
Children’s Wellness Checkups, by Income
Children age 17 and under with a wellness checkup in the past 12 months, by residence location, stratified by income, 2014
0102030405060708090
100
Total Poor Near Poor Middle Income High Income
Perc
ent
Large Central Metro Large Fringe Metro Medium MetroSmall Metro Micropolitan Noncore
Source: Centers for Disease Control and Prevention, National Center for Health Statistics, National Health Interview Survey, 2014.Note: Poor, low income, middle income, and high income indicate individuals whose household income is <100%, 100-199%, 200-399%, and 400% or more of the Federal poverty level, respectively.
38 | National Healthcare Quality and Disparities Report
• Groups With Disparities:
■ Overall in 2014, children in all other residence locations were less likely than children in large fringe metropolitan areas to have a wellness visit.
■ Among middle-income children, residents of all other locations were less likely than residents of large fringe metropolitan areas to have a wellness visit.
■ High-income children living in large central and medium metropolitan areas, micropolitan areas, and noncore were less likely than children in large fringe metropolitan areas to have a wellness visit.

Rural Health
Advice About Avoiding Smoking Around Children
Children for whom a health provider gave advice within the past 2 years about how smoking in the house can be bad for a child, by residence
location, stratified by race/ethnicity, 2014
0102030405060708090
100
Total White Black Hispanic
Perc
ent
Large Central Metro Large Fringe Metro Medium MetroSmall Metro Micropolitan Noncore
Source: Agency for Healthcare Research and Quality, Medical Expenditure Panel Survey, 2014.Note: White and Black are non-Hispanic. Hispanic includes all races.
National Healthcare Quality and Disparities Report | 39
• Importance: Secondhand smoke can cause serious health problems in children. Studies show that older children whose parents smoke get sick more often. Their lungs grow less than children who do not breathe secondhand smoke, and they get more bronchitis and pneumonia.
• Groups With Disparities:
■ Blacks residing in large central metropolitan, large fringe metropolitan, micropolitan, and noncore areas were more likely than Whites in the same areas to receive advice about how smoking in the home can be bad for a child.
■ Hispanics residing in large central metropolitan, large fringe metropolitan, small metropolitan, and micropolitan areas were more likely than Whites in the same areas to receive advice about how smoking in the home can be bad for a child.
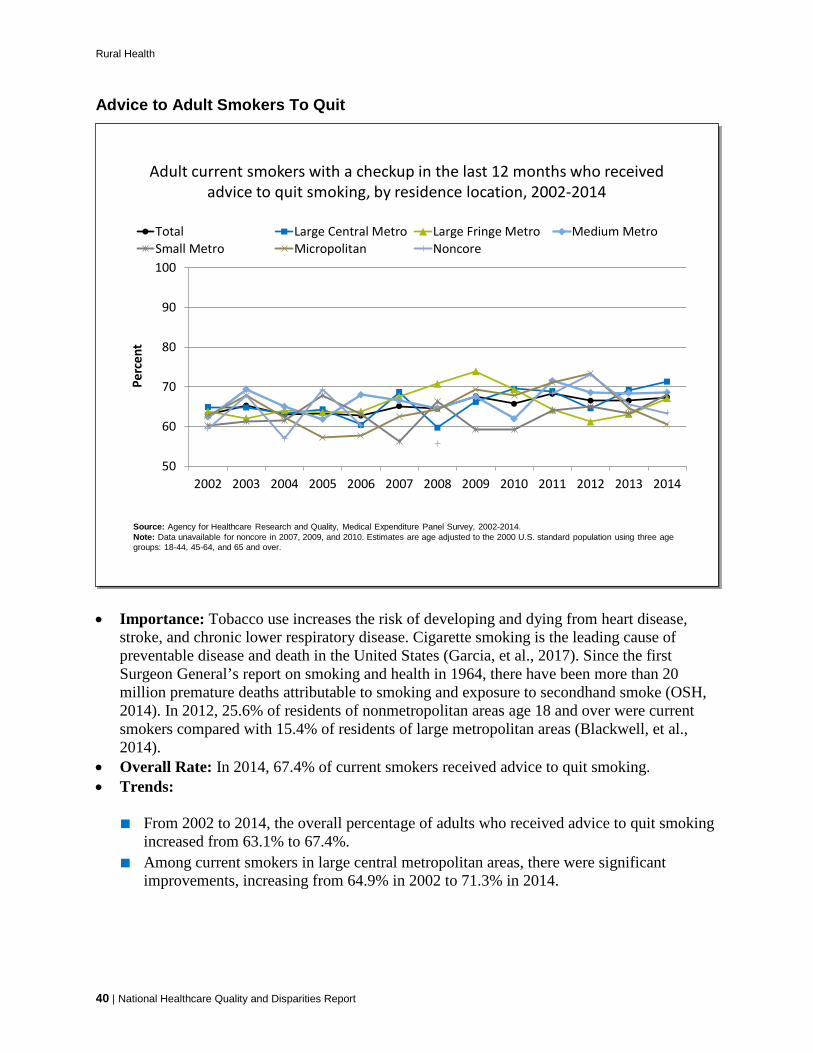
Rural Health
Advice to Adult Smokers To Quit
Adult current smokers with a checkup in the last 12 months who received advice to quit smoking, by residence location, 2002-2014
50
60
70
80
90
100
2002 2003 2004 2005 2006 2007 2008 2009 2010 2011 2012 2013 2014
Perc
ent
Total Large Central Metro Large Fringe Metro Medium MetroSmall Metro Micropolitan Noncore
Source: Agency for Healthcare Research and Quality, Medical Expenditure Panel Survey, 2002-2014.Note: Data unavailable for noncore in 2007, 2009, and 2010. Estimates are age adjusted to the 2000 U.S. standard population using three age groups: 18-44, 45-64, and 65 and over.
40 | National Healthcare Quality and Disparities Report
• Importance: Tobacco use increases the risk of developing and dying from heart disease, stroke, and chronic lower respiratory disease. Cigarette smoking is the leading cause of preventable disease and death in the United States (Garcia, et al., 2017). Since the first Surgeon General’s report on smoking and health in 1964, there have been more than 20 million premature deaths attributable to smoking and exposure to secondhand smoke (OSH, 2014). In 2012, 25.6% of residents of nonmetropolitan areas age 18 and over were current smokers compared with 15.4% of residents of large metropolitan areas (Blackwell, et al., 2014).
• Overall Rate: In 2014, 67.4% of current smokers received advice to quit smoking. • Trends:
■ From 2002 to 2014, the overall percentage of adults who received advice to quit smoking increased from 63.1% to 67.4%.
■ Among current smokers in large central metropolitan areas, there were significant improvements, increasing from 64.9% in 2002 to 71.3% in 2014.
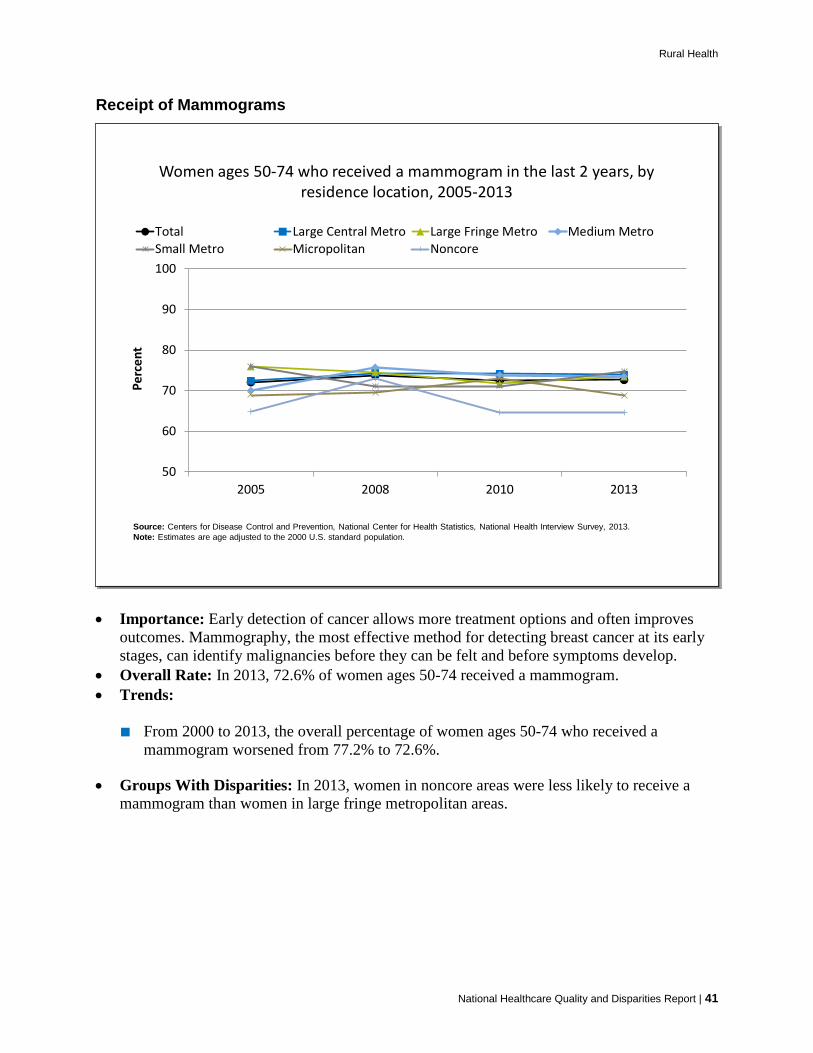
Rural Health
Receipt of Mammograms
Women ages 50-74 who received a mammogram in the last 2 years, by residence location, 2005-2013
50
60
70
80
90
100
2005 2008 2010 2013
Perc
ent
Total Large Central Metro Large Fringe Metro Medium MetroSmall Metro Micropolitan Noncore
Source: Centers for Disease Control and Prevention, National Center for Health Statistics, National Health Interview Survey, 2013.Note: Estimates are age adjusted to the 2000 U.S. standard population.
National Healthcare Quality and Disparities Report | 41
• Importance: Early detection of cancer allows more treatment options and often improves outcomes. Mammography, the most effective method for detecting breast cancer at its early stages, can identify malignancies before they can be felt and before symptoms develop.
• Overall Rate: In 2013, 72.6% of women ages 50-74 received a mammogram. • Trends:
■ From 2000 to 2013, the overall percentage of women ages 50-74 who received a mammogram worsened from 77.2% to 72.6%.
• Groups With Disparities: In 2013, women in noncore areas were less likely to receive a mammogram than women in large fringe metropolitan areas.

Rural Health
Receipt of Mammograms, by Income
Women ages 50-74 who received a mammogram in the last 2 years, by residence location, stratified by income, 2013
0102030405060708090
100
Total Poor Low Income Middle Income High Income
Perc
ent
Large Central Metro Large Fringe Metro Medium MetroSmall Metro Micropolitan Noncore
Source: Centers for Disease Control and Prevention, National Center for Health Statistics, National Health Interview Survey, 2013.Note: Estimates are age adjusted to the 2000 U.S. standard population.
42 | National Healthcare Quality and Disparities Report
• Importance: Early detection of cancer allows more treatment options and often improves outcomes. Mammography, the most effective method for detecting breast cancer at its early stages, can identify malignancies before they can be felt and before symptoms develop.
• Groups With Disparities:
■ In 2013, women in noncore areas were less likely to receive a mammogram than women in large fringe metropolitan areas.
■ Among poor women, those from noncore areas were less likely to receive a mammogram than those living in large fringe metropolitan areas.
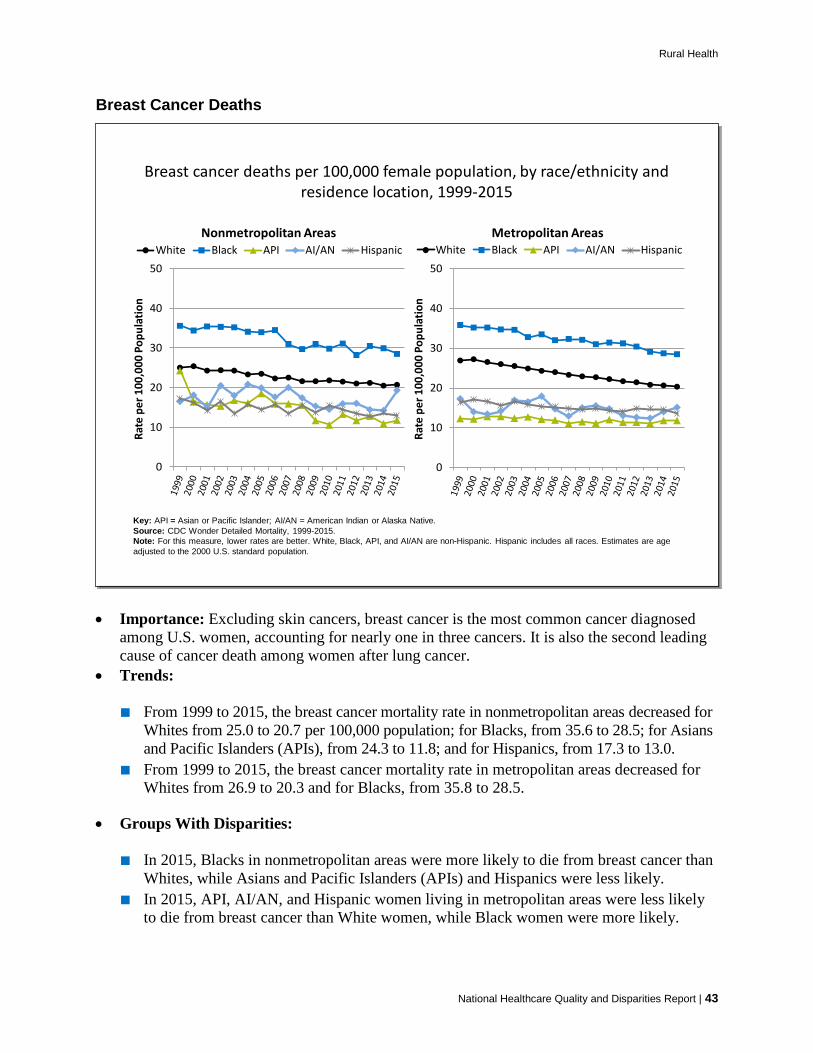
Rural Health
Breast Cancer Deaths
Breast cancer deaths per 100,000 female population, by race/ethnicity and residence location, 1999-2015
0
10
20
30
40
50
Rate
per
100
,000
Pop
ulat
ion
Nonmetropolitan AreasWhite Black API AI/AN Hispanic
0
10
20
30
40
50
Rate
per
100
,000
Pop
ulat
ion
Metropolitan AreasWhite Black API AI/AN Hispanic
Key: API = Asian or Pacific Islander; AI/AN = American Indian or Alaska Native.Source: CDC Wonder Detailed Mortality, 1999-2015.Note: For this measure, lower rates are better. White, Black, API, and AI/AN are non-Hispanic. Hispanic includes all races. Estimates are age adjusted to the 2000 U.S. standard population.
• Importance: Excluding skin cancers, breast cancer is the most common cancer diagnosed among U.S. women, accounting for nearly one in three cancers. It is also the second leading cause of cancer death among women after lung cancer.
• Trends:
■ From 1999 to 2015, the breast cancer mortality rate in nonmetropolitan areas decreased for Whites from 25.0 to 20.7 per 100,000 population; for Blacks, from 35.6 to 28.5; for Asians and Pacific Islanders (APIs), from 24.3 to 11.8; and for Hispanics, from 17.3 to 13.0.
■ From 1999 to 2015, the breast cancer mortality rate in metropolitan areas decreased for Whites from 26.9 to 20.3 and for Blacks, from 35.8 to 28.5.
• Groups With Disparities:
■ In 2015, Blacks in nonmetropolitan areas were more likely to die from breast cancer than Whites, while Asians and Pacific Islanders (APIs) and Hispanics were less likely.
■ In 2015, API, AI/AN, and Hispanic women living in metropolitan areas were less likely to die from breast cancer than White women, while Black women were more likely.
National Healthcare Quality and Disparities Report | 43
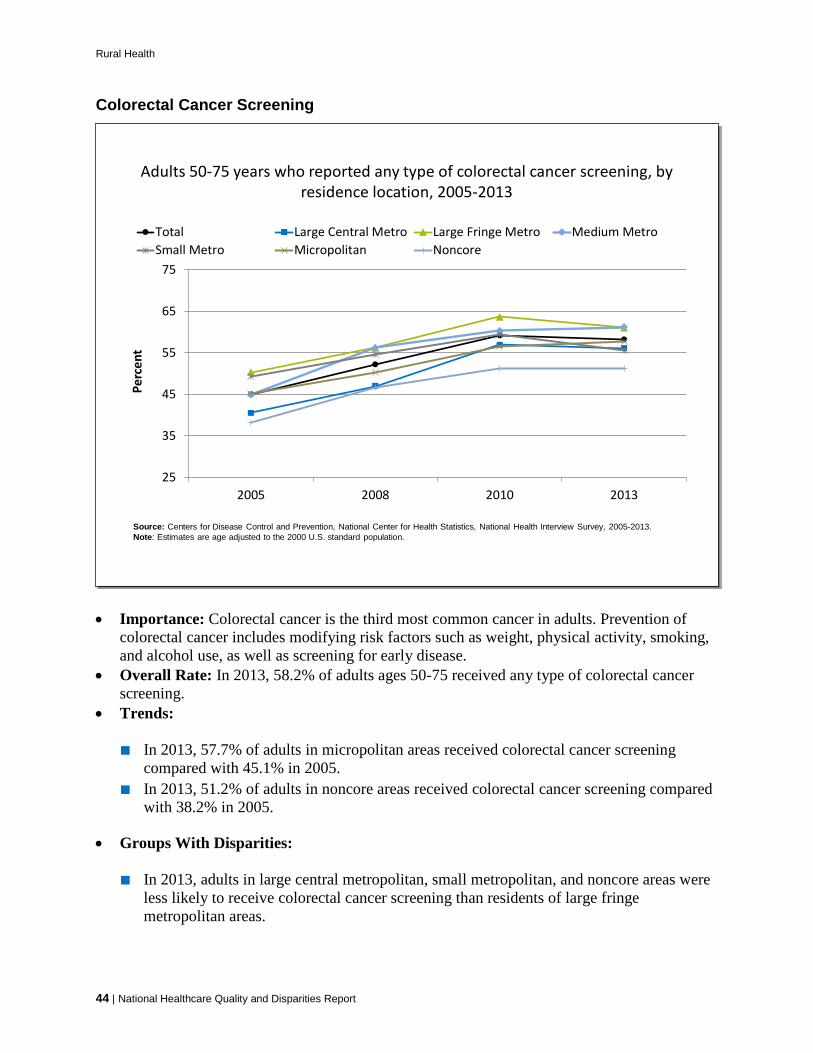
Rural Health
Colorectal Cancer Screening
Adults 50-75 years who reported any type of colorectal cancer screening, by residence location, 2005-2013
25
35
45
55
65
75
2005 2008 2010 2013
Perc
ent
Total Large Central Metro Large Fringe Metro Medium MetroSmall Metro Micropolitan Noncore
Source: Centers for Disease Control and Prevention, National Center for Health Statistics, National Health Interview Survey, 2005-2013.Note: Estimates are age adjusted to the 2000 U.S. standard population.
44 | National Healthcare Quality and Disparities Report
• Importance: Colorectal cancer is the third most common cancer in adults. Prevention of colorectal cancer includes modifying risk factors such as weight, physical activity, smoking, and alcohol use, as well as screening for early disease.
• Overall Rate: In 2013, 58.2% of adults ages 50-75 received any type of colorectal cancer screening.
• Trends:
■ In 2013, 57.7% of adults in micropolitan areas received colorectal cancer screening compared with 45.1% in 2005.
■ In 2013, 51.2% of adults in noncore areas received colorectal cancer screening compared with 38.2% in 2005.
• Groups With Disparities:
■ In 2013, adults in large central metropolitan, small metropolitan, and noncore areas were less likely to receive colorectal cancer screening than residents of large fringe metropolitan areas.

Rural Health
Colorectal Cancer Deaths
Colorectal cancer deaths per 100,000 population, by race/ethnicity, 1999-2015
0
10
20
30
40
50
Rate
per
100
,000
Pop
ulat
ion
Nonmetropolitan AreasWhite Black API AI/AN Hispanic
0
10
20
30
40
50
Rate
per
100
,000
Pop
ulat
ion
Metropolitan AreasWhite Black API AI/AN Hispanic
Key: API = Asian or Pacific Islander; AI/AN = American Indian or Alaska Native.Source: CDC Wonder Detailed Mortality, 1999-2015.Note: For this measure, lower rates are better. White, Black, API, and AI/AN are non-Hispanic. Hispanic includes all races. Estimates are age adjusted to the 2000 U.S. standard population
• Importance: Colorectal cancer is the third leading cause of cancer-related deaths in women in the United States and the second leading cause in men.
• Trends:
■ From 1999 to 2015, the colorectal cancer mortality rate in nonmetropolitan areas decreased for Whites from 21.6 to 16.5 per 100,000 population; for Blacks, from 29.2 to 23.0; for APIs, from 18.2 to 9.5; for AI/ANs, from 18.6 to 18.1; and for Hispanics, from 18.8 to 10.5.
■ From 1999 to 2015, the colorectal cancer mortality rate in metropolitan areas decreased for Whites from 20.7 to 13.7; for Blacks, from 28.8 to 19.0; for APIs, from 11.9 to 9.9; and for Hispanics, from 14.0 to 11.0.
• Groups With Disparities:
■ In 2015, Blacks in nonmetropolitan areas were more likely to die from colorectal cancer than Whites, and Hispanics and APIs were less likely.
■ In 2015, in metropolitan areas, APIs and Hispanics were less likely to die from colorectal cancer than Whites but Blacks were more likely.
National Healthcare Quality and Disparities Report | 45
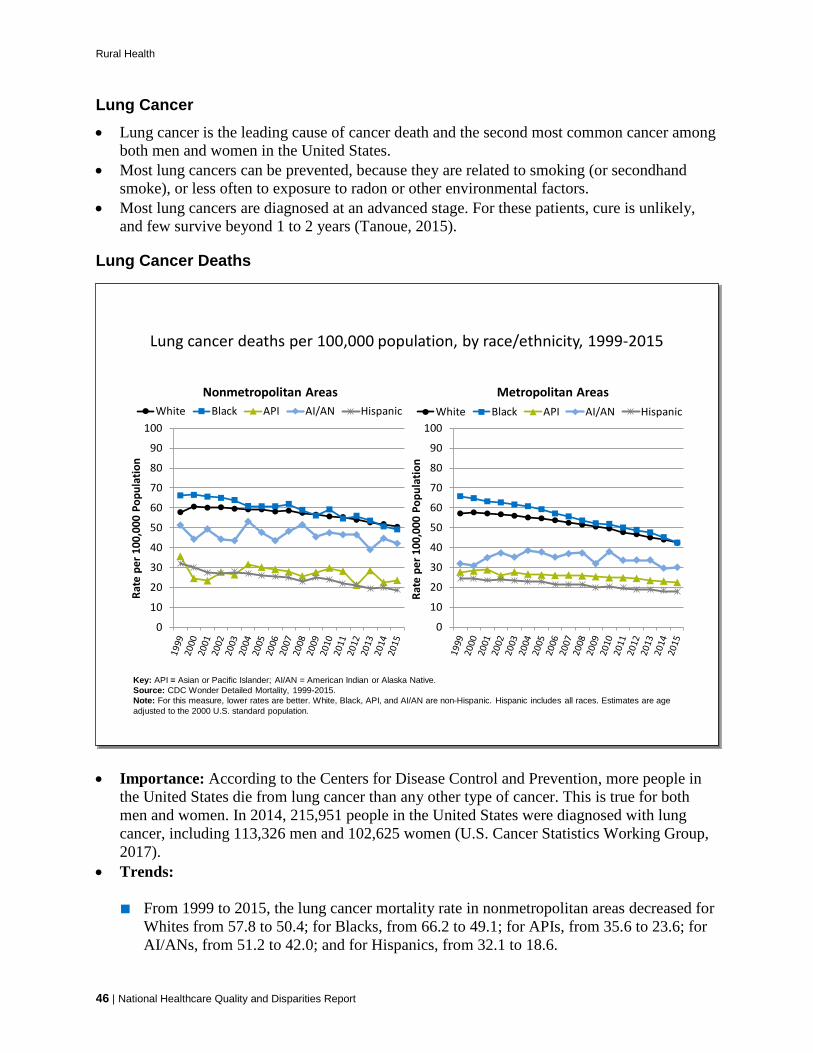
Rural Health
Lung Cancer • Lung cancer is the leading cause of cancer death and the second most common cancer among
both men and women in the United States. • Most lung cancers can be prevented, because they are related to smoking (or secondhand
smoke), or less often to exposure to radon or other environmental factors. • Most lung cancers are diagnosed at an advanced stage. For these patients, cure is unlikely,
and few survive beyond 1 to 2 years (Tanoue, 2015).
Lung Cancer Deaths
Lung cancer deaths per 100,000 population, by race/ethnicity, 1999-2015
0
10
20
30
40
50
60
70
80
90
100
Rate
per
100
,000
Pop
ulat
ion
Nonmetropolitan AreasWhite Black API AI/AN Hispanic
0
10
20
30
40
50
60
70
80
90
100Ra
te p
er 1
00,0
00 P
opul
atio
n
Metropolitan AreasWhite Black API AI/AN Hispanic
Key: API = Asian or Pacific Islander; AI/AN = American Indian or Alaska Native.Source: CDC Wonder Detailed Mortality, 1999-2015.Note: For this measure, lower rates are better. White, Black, API, and AI/AN are non-Hispanic. Hispanic includes all races. Estimates are age adjusted to the 2000 U.S. standard population.
46 | National Healthcare Quality and Disparities Report
• Importance: According to the Centers for Disease Control and Prevention, more people in the United States die from lung cancer than any other type of cancer. This is true for both men and women. In 2014, 215,951 people in the United States were diagnosed with lung cancer, including 113,326 men and 102,625 women (U.S. Cancer Statistics Working Group, 2017).
• Trends:
■ From 1999 to 2015, the lung cancer mortality rate in nonmetropolitan areas decreased for Whites from 57.8 to 50.4; for Blacks, from 66.2 to 49.1; for APIs, from 35.6 to 23.6; for AI/ANs, from 51.2 to 42.0; and for Hispanics, from 32.1 to 18.6.

Rural Health
■ From 1999 to 2015, the lung cancer mortality rate in metropolitan areas decreased for Whites from 57.1 to 42.4; for Blacks, from 65.7 to 42.4; for APIs, from 27.7 to 22.4; for AI/ANs, from 31.8 to 30.0; and for Hispanics, from 24.5 to 17.7.
• Groups With Disparities:
■ In 2015, APIs, AI/ANs, and Hispanics in nonmetropolitan areas were less likely to die from lung cancer than Whites.
■ In 2015, in metropolitan areas, APIs, AI/ANs, and Hispanics were also less likely to die from lung cancer than Whites.
Receipt of Pap Smears
• Importance: Pap testing has led to a significant reduction in cervical cancer mortality. About half of newly diagnosed cases of invasive cervical cancer are in women who have never had a Pap test.
• Overall Rate: In 2013, 80.7% of women ages 21-65 received a Pap smear.
Women ages 21-65 who received a Pap smear in the last 3 years, by residence location, 2005-2013
75
80
85
90
95
100
2005 2008 2010 2013
Perc
ent
Total Large Central Metro Large Fringe Metro Medium MetroSmall Metro Micropolitan Noncore
Source: Centers for Disease Control and Prevention, National Center for Health Statistics, National Health Interview Survey, 2005-2013.Note: Estimates are age adjusted to the 2000 U.S. standard population.
National Healthcare Quality and Disparities Report | 47
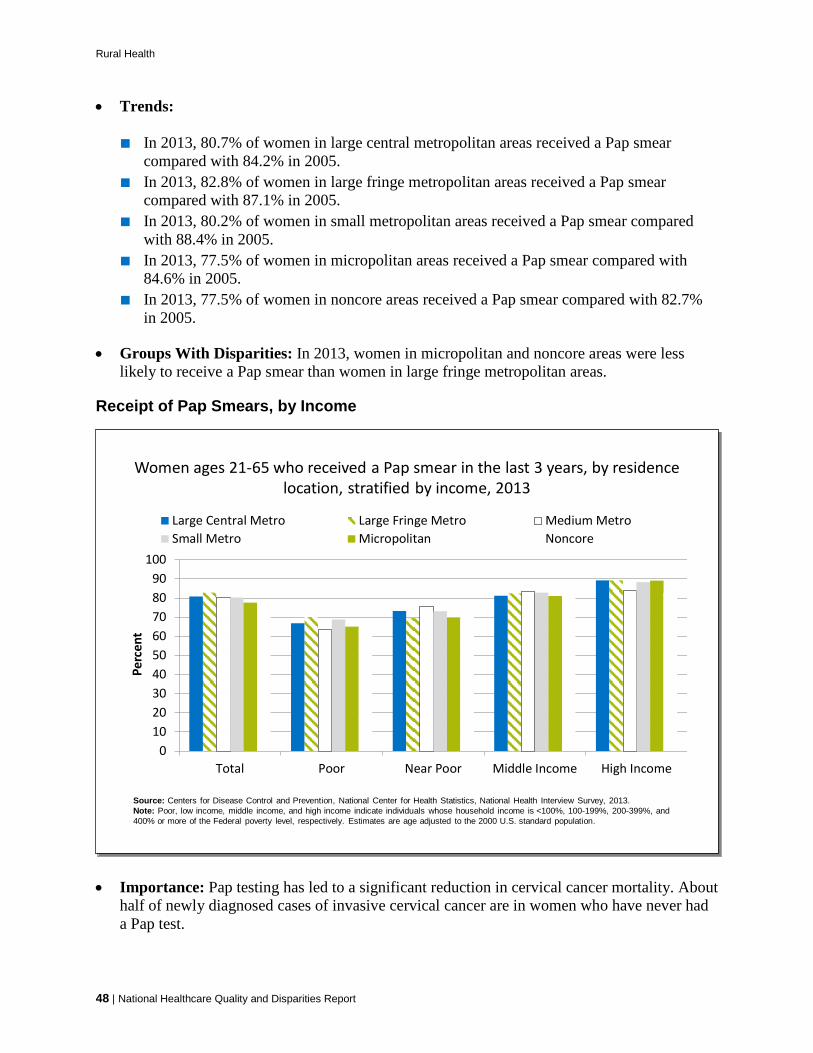
Rural Health
• Trends:
■ In 2013, 80.7% of women in large central metropolitan areas received a Pap smear compared with 84.2% in 2005.
■ In 2013, 82.8% of women in large fringe metropolitan areas received a Pap smear compared with 87.1% in 2005.
■ In 2013, 80.2% of women in small metropolitan areas received a Pap smear compared with 88.4% in 2005.
■ In 2013, 77.5% of women in micropolitan areas received a Pap smear compared with 84.6% in 2005.
■ In 2013, 77.5% of women in noncore areas received a Pap smear compared with 82.7% in 2005.
• Groups With Disparities: In 2013, women in micropolitan and noncore areas were less likely to receive a Pap smear than women in large fringe metropolitan areas.
Receipt of Pap Smears, by Income
Women ages 21-65 who received a Pap smear in the last 3 years, by residence location, stratified by income, 2013
0102030405060708090
100
Total Poor Near Poor Middle Income High Income
Perc
ent
Large Central Metro Large Fringe Metro Medium MetroSmall Metro Micropolitan Noncore
Source: Centers for Disease Control and Prevention, National Center for Health Statistics, National Health Interview Survey, 2013.Note: Poor, low income, middle income, and high income indicate individuals whose household income is <100%, 100-199%, 200-399%, and 400% or more of the Federal poverty level, respectively. Estimates are age adjusted to the 2000 U.S. standard population.
48 | National Healthcare Quality and Disparities Report
• Importance: Pap testing has led to a significant reduction in cervical cancer mortality. About half of newly diagnosed cases of invasive cervical cancer are in women who have never had a Pap test.
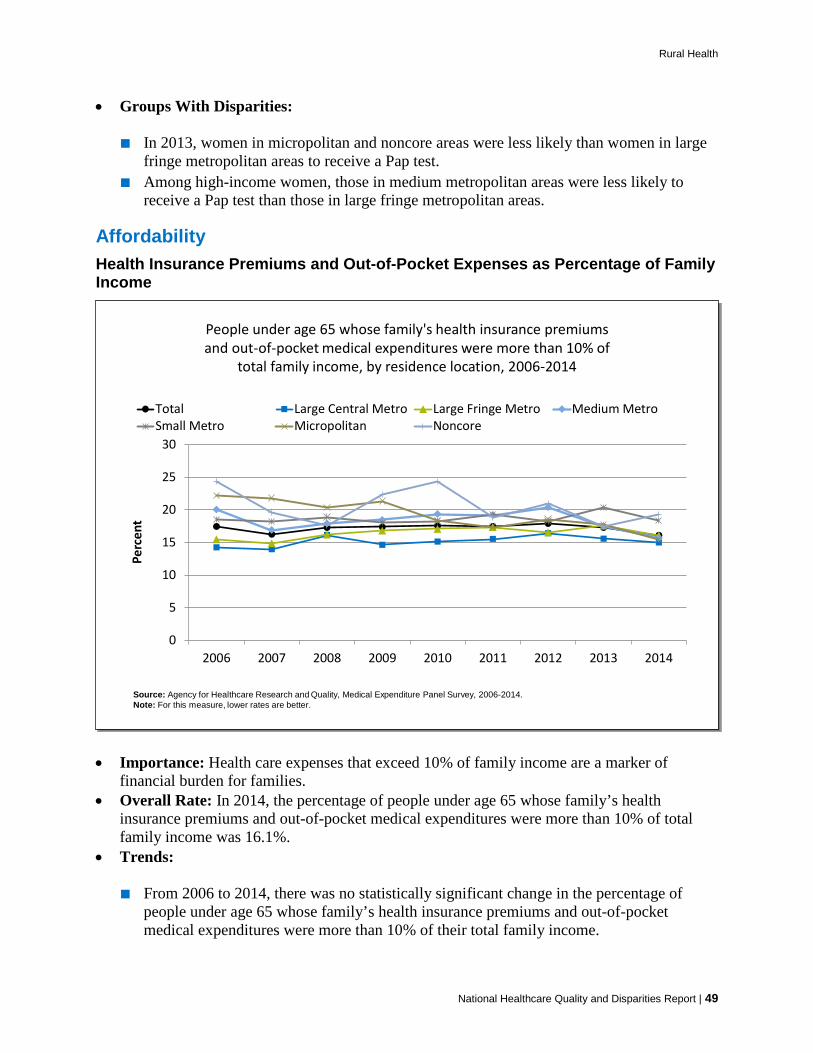
Rural Health
• Groups With Disparities:
■ In 2013, women in micropolitan and noncore areas were less likely than women in large fringe metropolitan areas to receive a Pap test.
■ Among high-income women, those in medium metropolitan areas were less likely to receive a Pap test than those in large fringe metropolitan areas.
Affordability Health Insurance Premiums and Out-of-Pocket Expenses as Percentage of Family Income
People under age 65 whose family's health insurance premiums and out-of-pocket medical expenditures were more than 10% of
total family income, by residence location, 2006-2014
0
5
10
15
20
25
30
2006 2007 2008 2009 2010 2011 2012 2013 2014
Perc
ent
Total Large Central Metro Large Fringe Metro Medium MetroSmall Metro Micropolitan Noncore
Source: Agency for Healthcare Research and Quality, Medical Expenditure Panel Survey, 2006-2014.Note: For this measure, lower rates are better.
National Healthcare Quality and Disparities Report | 49
• Importance: Health care expenses that exceed 10% of family income are a marker of financial burden for families.
• Overall Rate: In 2014, the percentage of people under age 65 whose family’s health insurance premiums and out-of-pocket medical expenditures were more than 10% of total family income was 16.1%.
• Trends:
■ From 2006 to 2014, there was no statistically significant change in the percentage of people under age 65 whose family’s health insurance premiums and out-of-pocket medical expenditures were more than 10% of their total family income.
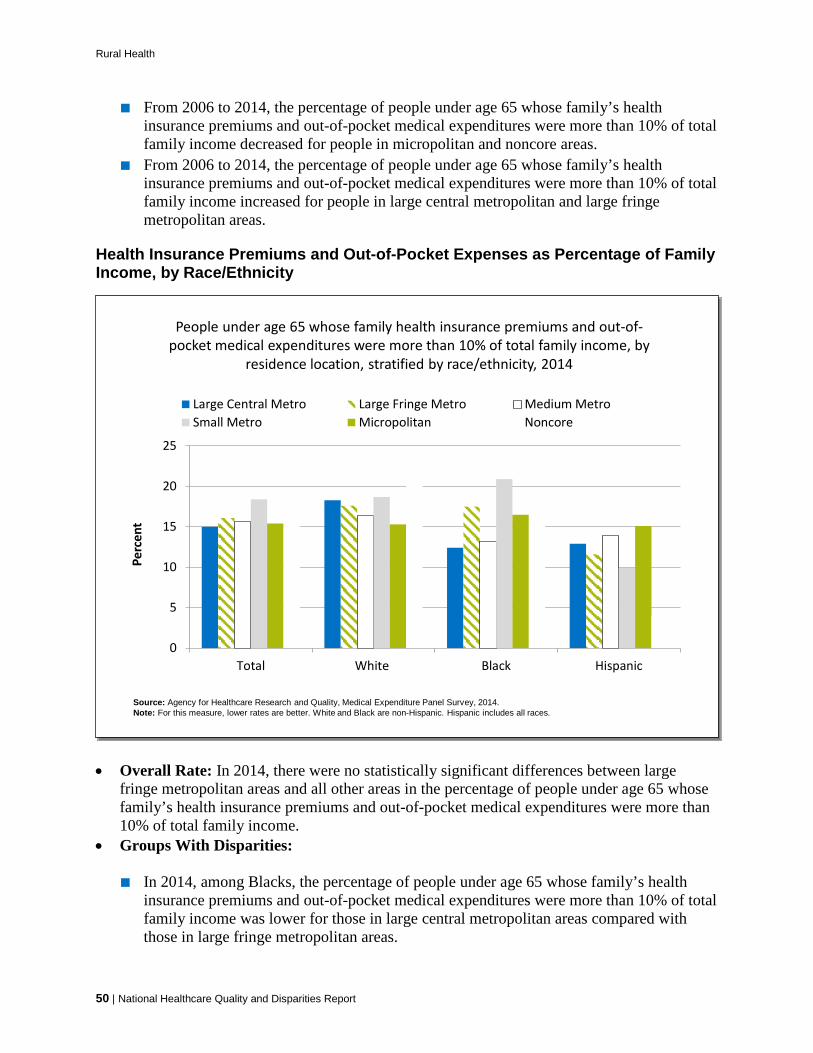
Rural Health
■ From 2006 to 2014, the percentage of people under age 65 whose family’s health insurance premiums and out-of-pocket medical expenditures were more than 10% of total family income decreased for people in micropolitan and noncore areas.
■ From 2006 to 2014, the percentage of people under age 65 whose family’s health insurance premiums and out-of-pocket medical expenditures were more than 10% of total family income increased for people in large central metropolitan and large fringe metropolitan areas.
Health Insurance Premiums and Out-of-Pocket Expenses as Percentage of Family Income, by Race/Ethnicity
People under age 65 whose family health insurance premiums and out-of-pocket medical expenditures were more than 10% of total family income, by
residence location, stratified by race/ethnicity, 2014
0
5
10
15
20
25
Total White Black Hispanic
Perc
ent
Large Central Metro Large Fringe Metro Medium MetroSmall Metro Micropolitan Noncore
Source: Agency for Healthcare Research and Quality, Medical Expenditure Panel Survey, 2014.Note: For this measure, lower rates are better. White and Black are non-Hispanic. Hispanic includes all races.
50 | National Healthcare Quality and Disparities Report
• Overall Rate: In 2014, there were no statistically significant differences between large fringe metropolitan areas and all other areas in the percentage of people under age 65 whose family’s health insurance premiums and out-of-pocket medical expenditures were more than 10% of total family income.
• Groups With Disparities:
■ In 2014, among Blacks, the percentage of people under age 65 whose family’s health insurance premiums and out-of-pocket medical expenditures were more than 10% of total family income was lower for those in large central metropolitan areas compared with those in large fringe metropolitan areas.
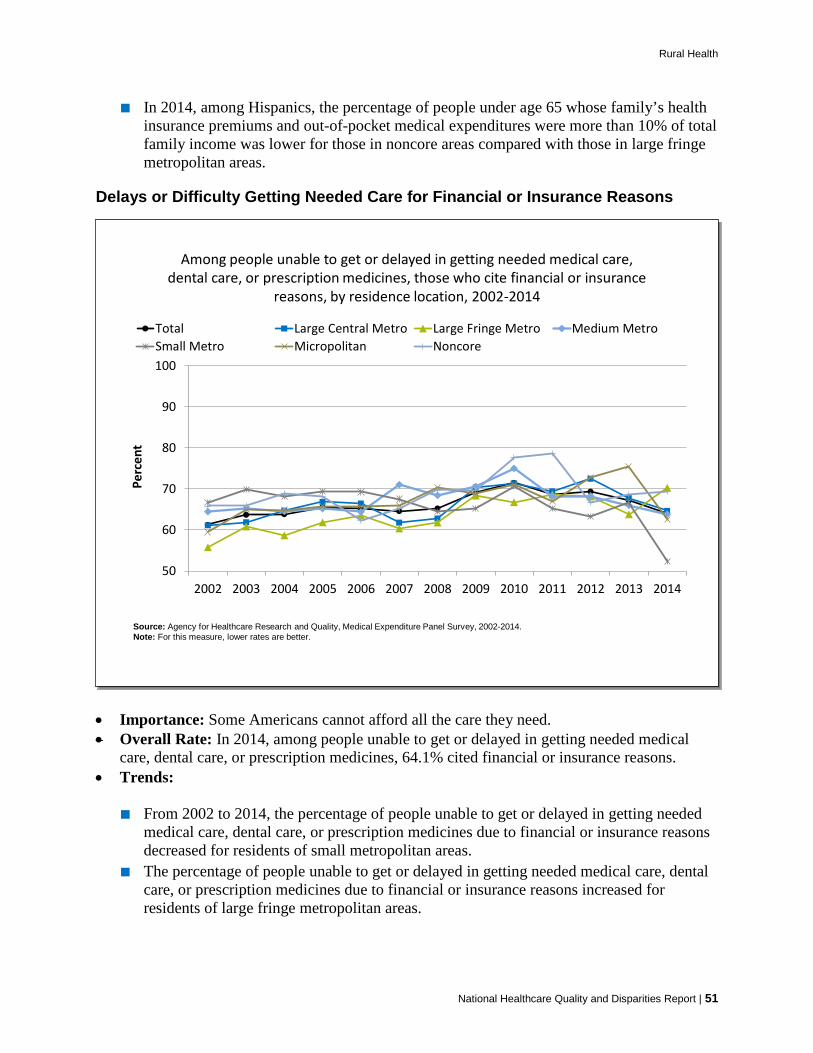
Rural Health
■ In 2014, among Hispanics, the percentage of people under age 65 whose family’s health insurance premiums and out-of-pocket medical expenditures were more than 10% of total family income was lower for those in noncore areas compared with those in large fringe metropolitan areas.
Delays or Difficulty Getting Needed Care for Financial or Insurance Reasons
Among people unable to get or delayed in getting needed medical care, dental care, or prescription medicines, those who cite financial or insurance
reasons, by residence location, 2002-2014
50
60
70
80
90
100
2002 2003 2004 2005 2006 2007 2008 2009 2010 2011 2012 2013 2014
Perc
ent
Total Large Central Metro Large Fringe Metro Medium MetroSmall Metro Micropolitan Noncore
Source: Agency for Healthcare Research and Quality, Medical Expenditure Panel Survey, 2002-2014.Note: For this measure, lower rates are better.
National Healthcare Quality and Disparities Report | 51
• Importance: Some Americans cannot afford all the care they need. • Overall Rate: In 2014, among people unable to get or delayed in getting needed medical
care, dental care, or prescription medicines, 64.1% cited financial or insurance reasons. • Trends:
■ From 2002 to 2014, the percentage of people unable to get or delayed in getting needed medical care, dental care, or prescription medicines due to financial or insurance reasons decreased for residents of small metropolitan areas.
■ The percentage of people unable to get or delayed in getting needed medical care, dental care, or prescription medicines due to financial or insurance reasons increased for residents of large fringe metropolitan areas.

Rural Health
Financial or Insurance Reason for Lacking a Usual Source of Care
People without a usual source of care who indicate a financial or insurance reason for not having a source of care, 2007-2014
0
10
20
30
40
50
2002 2003 2004 2005 2006 2007 2008 2009 2010 2011 2012 2013 2014
Perc
ent
Total Large Central Metro Large Fringe Metro Medium MetroSmall Metro Micropolitan Noncore
Source: Agency for Healthcare Research and Quality, Medical Expenditure Panel Survey, 2007-2014.Note: For this measure, lower rates are better. Data unavailable for noncore in 2004, 2006 and 2012.
52 | National Healthcare Quality and Disparities Report
• Importance: Having a usual source of health care has been consistently associated with greater use of preventive services, decreased use of emergency services, and patients’ ratings of quality and satisfaction with care (Rutton, 2015).
• Overall Rate: In 2014, 20% of people without a usual source of care indicated a financial or insurance reason for not having a source of care.
• Trends:
■ From 2002 to 2014, the percentage of people without a usual source of care who indicated a financial or insurance reason for not having a source of care increased for residents of large central, large fringe, medium metropolitan, and micropolitan areas.
• Groups With Disparities:
■ In 2014, the percentage of people without a usual source of care who indicated a financial or insurance reason for not having a source of care was higher for residents of large central metropolitan areas compared with residents of large fringe metropolitan areas.

Rural Health
References Blackwell DL, Lucas JW, Clarke TC. Summary health statistics for U.S. adults: National Health Interview Survey, 2012. Vital Health Stat 2014;10(260). http://www.cdc.gov/nchs/data/series/sr_10/sr10_260.pdf. Accessed September 28, 2017.
Centers for Disease Control and Prevention. National Diabetes Statistics Report, 2017. https://www.cdc.gov/diabetes/data/statistics/statistics-report.html. Accessed September 28, 2017.
Centers for Disease Control and Prevention. Diabetes Self-Management Education Programs in Nonmetropolitan Counties --- United States, 2016. Surveillance Summaries 66(10);1-6. https://www.cdc.gov/mmwr/volumes/66/ss/ss6610a1.htm?s_cid=ss6610
Centers for Disease Control and Prevention. Morbidity and Mortality Weekly Report 66(10);270-273. https://www.cdc.gov/mmwr/volumes/66/wr/mm6610a2.htm
Chalmers N. The Burden of Return Visits to the Emergency Department for Dental Conditions in Florida, Maryland, and Massachusetts in 2013. Presentation at Disparities Interest Group Meeting, 2017 AcademyHealth Annual Research Meeting; New Orleans, LA; 2017 Jun 24-25. https://academyhealth.confex.com/academyhealth/2017arm/meetingapp.cgi/Paper/18814. Accessed September 28, 2017.
Dwyer-Lindgren L, Mokdad AH, Srebotnjak T, et al. Cigarette smoking prevalence in US counties: 1996-2012. Popul Health Metr 2014 Mar 24;12(1):5. https://www.ncbi.nlm.nih.gov/pmc/articles/PMC3987818/. Accessed September 28, 2017.
Finney Rutten LJ, Agunwamba AA, Beckjord, E, et al. The relation between having a usual source of care and ratings of care quality: does patient-centered communication play a role? J Health Comm un 2015;20(7):759-65.
Freeman VA, Thompson K, Howard HA, et al. The 21st century rural hospital: a chartbook; 2015. Chapel Hill: North Carolina Rural Health Research Program. http://www.shepscenter.unc.edu/wp-content/uploads/2015/02/21stCenturyRuralHospitalsChartBook.pdf. Accessed September 28, 2017.
Gao J, Moran E, Li YF, et al. Predicting potentially avoidable hospitalizations. Med Care 2014 Feb;52(2):164-71. PMID: 24374413.
Garcia MC, Faul M, Massetti G, et al. Reducing potentially excess deaths from the five leading causes of death in the rural United States. MMWR Surveill Summ 2017;66(No. SS-2):1–7. https://www.cdc.gov/mmwr/volumes/66/ss/ss6602a1.htm. Accessed September 28, 2017.
Kegler SR, Stone DM, Holland KM. Trends in suicide by level of urbanization — United States, 1999–2015. MMWR Morb Mortal Wkly Rep 2017;66:270-3. https://www.cdc.gov/mmwr/volumes/66/wr/mm6610a2.htm. Accessed September 28, 2017.
Lipari RN, Van Horn SL. The CBHSQ report: trends in substance use disorders among adults aged 18 or older. Rockville, MD: Substance Abuse and Mental Health Services Administration; June 2017. https://www.ncbi.nlm.nih.gov/books/NBK447253/. Accessed September 28, 2017.
Meit M, Knudson A, Gilbert T, et al. The 2014 update of the rural-urban chartbook; 2014. https://ruralhealth.und.edu/projects/health-reform-policy-research-center/pdf/2014-rural-urban-chartbook-update.pdf. Accessed September 28, 2017.
Moy E, Garcia MC, Bastian B, et al. Leading causes of death in nonmetropolitan and metropolitan areas- United States, 1999-2014. MMWR Surveill Summ 2017 Jan 13;66(1):1-8. https://www.cdc.gov/mmwr/volumes/66/ss/ss6601a1.htm?s_cid=ss6601a1_w. Accessed September 28, 2017.
National Healthcare Quality and Disparities Report | 53

Rural Health
National Center for Health Statistics. Health, United States, 2016: with chartbook on long-term trends in health. Hyattsville, MD; NCHS; 2017. https://www.cdc.gov/nchs/hus/index.htm. Accessed September 28, 2017.
National Institute of Dental and Craniofacial Research. Dental Caries (Tooth Decay). https://www.nidcr.nih.gov/DataStatistics/FindDataByTopic/DentalCaries/. Accessed September 28, 2017.
North Carolina Rural Health Research Program. Rural hospital closures: January 2010-present. https://www.shepscenter.unc.edu/programs-projects/rural-health/rural-hospital-closures. Accessed September 28, 2017.
Office of Disease Prevention and Health Promotion, U.S. Department of Health and Human Services. Healthy People 2020. Access to Health Services. http://www.healthypeople.gov/2020/topics-objectives/topic/Access-to-Health-Services. Accessed September 28, 2017.
Office on Smoking and Health. The health consequences of smoking: 50 years of progress. A report of the Surgeon General. Atlanta, GA: Centers for Disease Control and Prevention; 2014. http://www.surgeongeneral.gov/library/reports/50-years-of-progress/50-years-of-progress-by-section.html. Accessed September 28, 2017.
Singh GK, Siahpush M. Widening rural-urban disparities in life expectancy, U.S., 1969-2009. Am J Prev Med 2014 Feb;46(2):e19-29. PMID: 24439358.
U.S. Bureau of the Census; 2010. http://www.census.gov/2010census/data/. Accessed September 28, 2017.
U.S. Cancer Statistics Working Group. United States Cancer Statistics: 1999-2014 Incidence and Mortality. Atlanta, GA: Centers for Disease Control and Prevention and National Cancer Institute; 2017. https://nccd.cdc.gov/uscs/. Accessed October 5, 2017.
Warshaw R. Bringing medical help to rural areas overwhelmed by opioid abuse. AAMC News 2017 Jul 27. https://news.aamc.org/patient-care/article/bringing-help-rural-overwhelmed-opiods/. Accessed September 28, 2017.
Weinick RM, Burns RM, Mehrotra A. How many emergency department visits could be managed at urgent care centers and retail clinics? Health Aff 2010;29(9):1630-6. http://www.ncbi.nlm.nih.gov/pmc/articles/PMC3412873/. Accessed September 28, 2017.
54 | National Healthcare Quality and Disparities Report


