National Institutes of Health (NIH) National Heart, Lung, and Blood Institute (NHLBI) Healthy Communities Study (HCS): How Communities Shape Children’s Health Public Use Dataset Documentation Prepared for the: Biologic Specimen and Data Repository Information Coordinating Center (BioLINCC) August 12, 2016
Transcript
National Institutes of Health (NIH)
National Heart, Lung, and Blood Institute (NHLBI)
Healthy Communities Study (HCS):
How Communities Shape Children’s Health
Public Use Dataset Documentation
Prepared for the:
Biologic Specimen and Data Repository Information Coordinating Center (BioLINCC)
August 12, 2016
HCS Public Use Documentation August 1, 2016
Healthy Communities Study (HCS) Public Use Dataset Documentation
1.3. Community Selection.................................................................................................................... 5
2. Data Collection...................................................................................................................................... 6
2.1. Information Management System (IMS) and Electronic Data Storage......................................... 6
2.2. Household Data Collection ........................................................................................................... 7
Tables Table 1. Community characteristics based on sampled census tract. ......................................................... 5 Table 2. Household Instrument sections and storage format ....................................................................16 Table 3. Operational definitions of physical activity and sedentary behavior variables derived from
accelerometry. ...............................................................................................................................20 Table 4. School Observation sections and storage format .........................................................................22 Table 5. Additional variables created for SFE questionnaire based on open-text responses. ...................24 Table 6. Key Informant sections and storage format .................................................................................25 Table 7. Variables that were dropped or recoded from their original values due to low cell counts........30 Table 8. HCS public use datasets and supplemental files. ..........................................................................32
Figures Figure 1. HCS Primary Data Collection Activities .......................................................................................... 6 Figure 2. Example codebook entry for categorical variable. ......................................................................14 Figure 3. Example codebook entry for continuous response variable. ......................................................14 Figure 4. Calculating the Intensity Score for Documented Community Programs and Policies Using Three
Factors (from Pate et al., 2015; based on Collie-Akers et al, 2013)...............................................27
iii
HCS Public Use Documentation August 1, 2016
1. Introduction The Healthy Communities Study (HCS) is an observational study of communities conducted over six years to assess the relationships between programs and policies targeting childhood obesity and children’s body mass index (BMI), diet, and physical activity (Arteaga et al., 2015; John et al., 2015; Strauss et al., 2015). This study is not designed to evaluate any one specific program, policy, or community, but will instead systematically assess if components or characteristics of representative programs/policies in communities across the country are related to BMI, diet, and physical activity in children. A total of 130 communities and 5,138 children and their parent(s)/caregiver(s) are included in the HCS. An HCS community is defined as the reach of a high-school catchment area, and children in kindergarten through 8th grade (K-8) participated in the study. The HCS study design combines current/cross-sectional and retrospective quantitative and qualitative data. Cross-sectional data include in-person assessment of height and weight, diet, and physical activity for all children. The retrospective data include the history of childhood obesity community programs and policies (CPPs) and how they unfolded over the previous 10 years in each community, and child BMI trajectories over that same time period, which combine BMI measured at the time of the household visit with BMI calculated from height and weight data abstracted from participant medical records. Data analysis therefore reflects cross-sectional data collected on childhood experiences regarding physical activity, diet, and BMI, and retrospective data collected of the children’s BMI and medical histories covering a 10-year period.
1.1. HCS Study Aims The HCS study has three specific aims (Arteaga et al., 2015):
a) To determine the associations between community programs/policies and BMI, diet, and physical activity for children;
b) To identify the community, family, and child factors that modify or mediate the associations between community programs/policies and BMI, diet, and physical activity in children; and
c) To assess the associations between programs/policies and BMI, diet, and physical activity in children in communities that have a high proportion of African American, Latino, and/or low-income residents.
1.2. Operational Implementation The Research Coordinating Center leading the development and implementation of the HCS was Battelle Memorial Institute (Battelle). Battelle formed a research team with key partners for each of the interrelated domains of the study. Investigators at the University of California, Agriculture and Natural Resources (UC-ANR; previously under University of California, Berkeley) were responsible for developing the assessment tools and protocols for assessing dietary behaviors among child participants; investigators at the University of South Carolina (USC) were responsible for developing the tools and protocol for assessing physical activity and sedentary behavior among child participants; and investigators at the University of Kansas (KU) were responsible for designing the tools and protocols for the characterization of community programs and policies. Coordination of methods, instruments, training, data collection, data analysis, and dissemination took place at Battelle. A detailed description of the planning, recruitment, and implementation of the HCS can be found in John et al. (2015).
The study was funded by several National Institutes of Health (NIH) institutes and centers including the National Heart, Lung, and Blood Institute (NHLBI), the National Cancer Institute (NCI), the Eunice
4
HCS Public Use Documentation August 1, 2016
Kennedy Shriver National Institute of Child Health and Human Development (NICHD), the National Institute of Diabetes and Digestive and Kidney Disorders (NIDDK), and the Office of Behavioral and Social Sciences Research (OBSSR). In addition to the NIH scientific partners, the Centers for Disease Control and Prevention (CDC) and the Robert Wood Johnson Foundation (RWJF) were also non-funding partners in this study.
1.3. Community Selection The HCS communities were selected using a hybrid approach that included a diverse, national probability-based sample (NPBS) and a sample of communities selected with “certainty” that are known to have promising programs and policies targeting childhood obesity. The probability-based sample used a stratified sampling approach with probability proportional to the number of resident children aged 3-15 years to select census tracts across the continental US. The strata were based on various factors including geographic region, income, race/ethnicity, urbanicity, and child population size. Also, communities in the 15 largest counties throughout the U.S. were included in the NPBS with certainty due to population size (based on 2010 U.S. Census data). A certainty community selection committee independently identified generalized geographic areas to ensure the inclusion of communities with promising programs and policies aimed at reducing childhood obesity. Within each of the geographic areas selected by the certainty committee, a census tract was selected probabilistically based on the population of children aged 3-15 years.
The combined sampled census tracts were then used to determine communities for the HCS through identification of the closest public high school to the centroid of each selected tract. There were several instances in which multiple census tracts in the sample were in closest proximity to the same public high school. This overlap was experienced both within the NPBS (selected census tracts from different strata were in proximity to the same public high school), and between the NPBS and the certainty community sample. After accounting for this overlap, a total of 264 communities were identified to form the pool from which communities would be recruited for the study. The approximate catchment area of the selected high school represents the community area.
The key community-level demographic characteristics considered in the sampling of census tracts are included in Table 1. A pre-selection policy score was also calculated for each census tract that hierarchically integrated program and policy information across different levels of geographic specificity (e.g., state, county, municipality, etc.), with higher scores assigned to census tracts that contained multiple programs and policies, higher funding, longer duration, and recommendations from program/policy funders, sponsors, or HCS steering committee members for their promising approaches.
Table 1. Community characteristics based on sampled census tract.
Geographic Region Northeast CT, MA, ME, NH, NJ, NY, PA, RI, VT Midwest IA, IL, IN, KS, MI, MO, MN, ND, NE, OH, SD, WI South AR, DE, DC, AL, FL, GA, KY, LA, MD, MS, NC, OK, TN, TX, SC, VA, WV West AK, CO, AZ, CA, HI, ID, MT, NM, NV, OR, UT, WA, WY Urbanicity
Urban contiguous, built-up areas containing 50,000+ people based on USDA Rural-Urban Commuting Area
Suburban areas in which 30-49% of the population commutes to Urban Core areas for work
5
HCS Public Use Documentation August 1, 2016
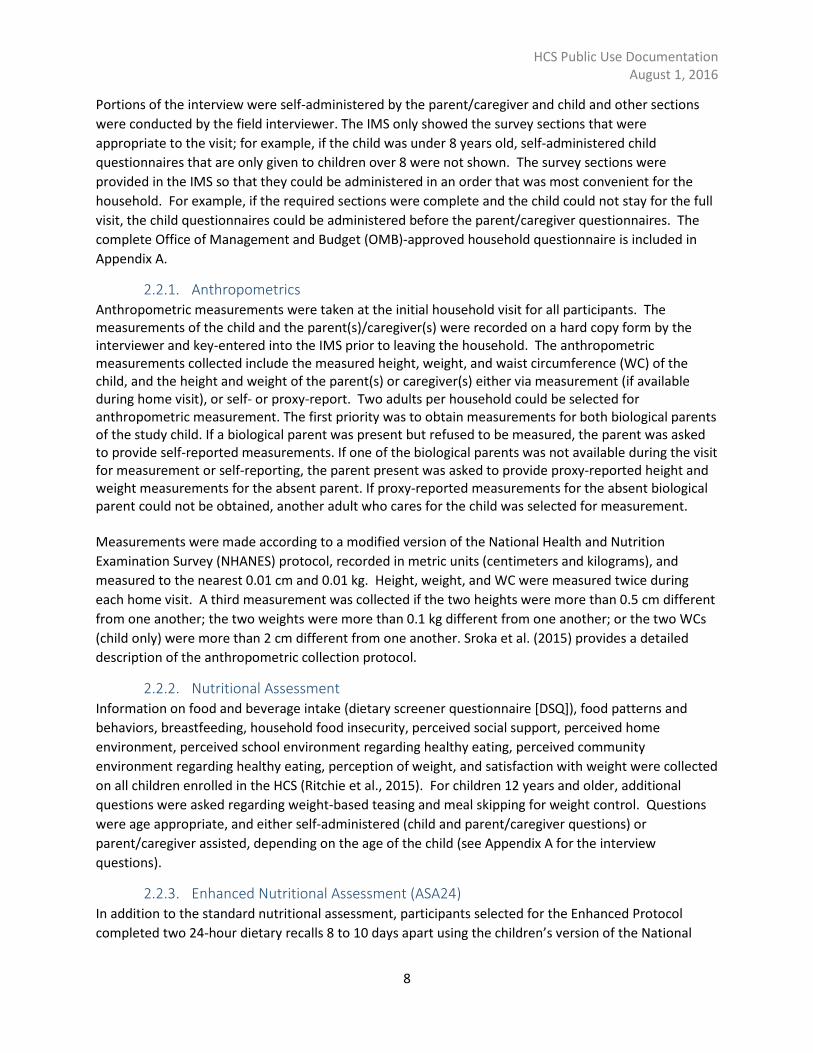
Rural population less than 49,999 people and limited commute to Urban Core areas Race/Ethnicity African American
30% or more of the total population is African American and percent African American is greater than percent Hispanic/Latino
Hispanic 30% or more of the total population is Hispanic/Latino and percent Hispanic is greater than percent African American
Other less than 30% African American and less than 30% Hispanic/Latino Income
Low tract qualifies for HUD’s Low-Income Housing Tax Credit (LIHTC); i.e., a poverty rate of at least 25 percent or 50 percent or more of its householders have incomes below 60 percent of the area median household income
High tract does not qualify for LIHTC
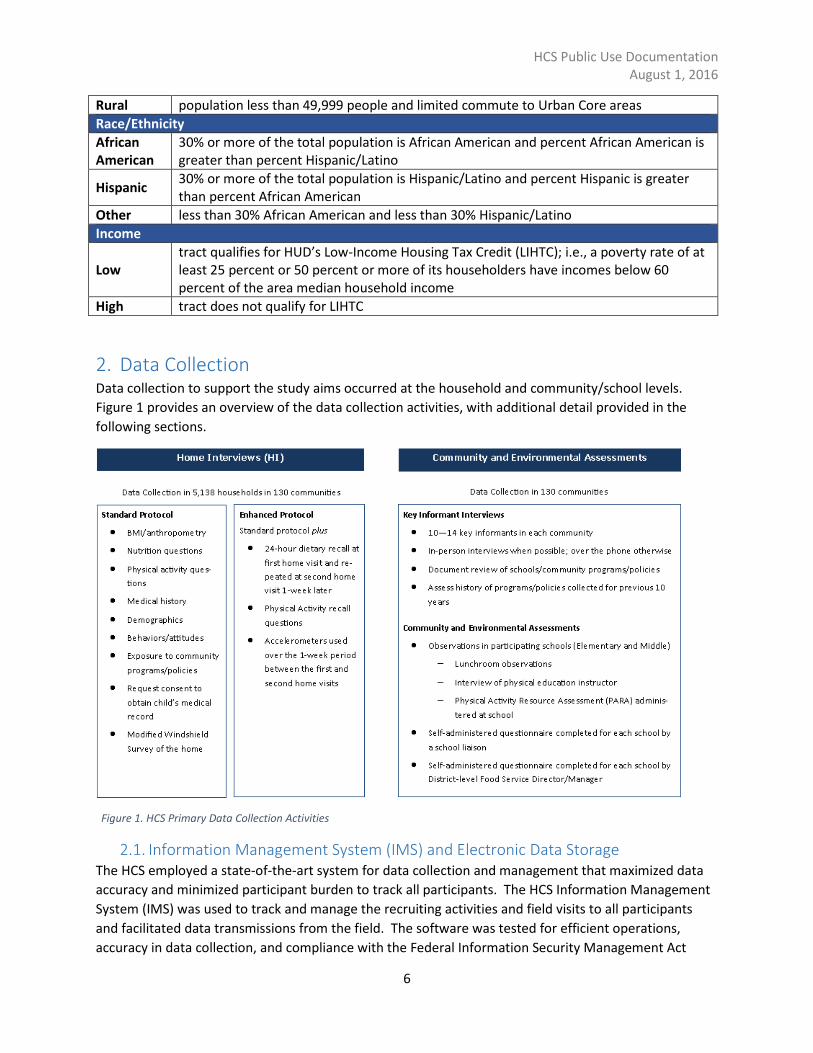
2. Data Collection Data collection to support the study aims occurred at the household and community/school levels. Figure 1 provides an overview of the data collection activities, with additional detail provided in the following sections.
Figure 1. HCS Primary Data Collection Activities
2.1. Information Management System (IMS) and Electronic Data Storage The HCS employed a state-of-the-art system for data collection and management that maximized data accuracy and minimized participant burden to track all participants. The HCS Information Management System (IMS) was used to track and manage the recruiting activities and field visits to all participants and facilitated data transmissions from the field. The software was tested for efficient operations, accuracy in data collection, and compliance with the Federal Information Security Management Act
6
HCS Public Use Documentation August 1, 2016
(FISMA) of 2002. It was also found to work well with the data collection software, DatStat Illume, which was used for collecting most of the data from the field. The field interviewers used the field tracking system to view and record information about the household and prior household visits, which allowed the visit to be conducted more efficiently.
The field interviewers arrived at the household visits equipped with laptop PCs that had Internet access via broadband cards to allow online access to the Enhanced Nutritional Assessment (Automated Self-Administered 24-hour Recall, or ASA24, described below). The IMS was accessible to the laptops locally using a remote data collection (RDC) component. The universal serial bus (USB) on all PCs was disabled so that data were not able to be copied. Data collected at field visits were either entered locally in a SQL Server database located on the laptop or directly in the web-based management system. Field interviewers were encouraged to synchronize the local database on their laptop with the central database so that survey and accelerometer data could be transmitted to the central server, allowing timely reporting and case management. All data transfers used https protocol with 128-bit SSL certificate. Completed records were removed from field laptops when successful data transmission was confirmed and all records were removed from field laptops prior to delivery to new communities.
The central SQL Server database and data files were stored in the Battelle Information and Security Compliance (BISC) environment, which was built to be FISMA compliant to the Moderate level on an isolated segment of the Battelle network. All data collected electronically by the field interviewers were transmitted to this central server.
2.2. Household Data Collection Household data collection consisted of a two-stage sampling approach, with all study children receiving less detailed Standard Protocol measures (e.g., brief questionnaires). The Standard Protocol visit was designed to take an average of 75 minutes to complete.
The Standard Protocol visit included: height, weight, and girth measurements of the child; height and weight measurements or reported measurements of the parent(s) or caregiver(s), when available; completion of general socio-demographic and background questions; brief diet and physical activity behaviors questionnaires; and a modified windshield survey of the street segment immediately outside the participant’s home. Upon consent from the parent/guardian, the children’s medical records were retrieved and abstracted to develop longitudinal BMI trajectories.
In addition to the Standard Protocol, a randomly selected subset of children (approximately 14% of the children in the 130 communities) also received an Enhanced Protocol that collected more detailed measures of diet and physical activity. The Enhanced Protocol was designed to take on average 180 minutes to complete over two home visits, and included the use of an accelerometer for a one-week period, the administration of dietary recalls at each visit, and a previous day physical activity assessment questionnaire at the second visit.
During the household visit, the questionnaires were completed on a Battelle-managed laptop. The questionnaires were not made available until the field interviewer checked that the correct consent(s)/assent were signed by all participants. The individual who signed the consent and medical record release authorization form was required to be the child’s parent or legal guardian.
7
HCS Public Use Documentation August 1, 2016
Portions of the interview were self-administered by the parent/caregiver and child and other sections were conducted by the field interviewer. The IMS only showed the survey sections that were appropriate to the visit; for example, if the child was under 8 years old, self-administered child questionnaires that are only given to children over 8 were not shown. The survey sections were provided in the IMS so that they could be administered in an order that was most convenient for the household. For example, if the required sections were complete and the child could not stay for the full visit, the child questionnaires could be administered before the parent/caregiver questionnaires. The complete Office of Management and Budget (OMB)-approved household questionnaire is included in Appendix A.
2.2.1. Anthropometrics Anthropometric measurements were taken at the initial household visit for all participants. The measurements of the child and the parent(s)/caregiver(s) were recorded on a hard copy form by the interviewer and key-entered into the IMS prior to leaving the household. The anthropometric measurements collected include the measured height, weight, and waist circumference (WC) of the child, and the height and weight of the parent(s) or caregiver(s) either via measurement (if available during home visit), or self- or proxy-report. Two adults per household could be selected for anthropometric measurement. The first priority was to obtain measurements for both biological parents of the study child. If a biological parent was present but refused to be measured, the parent was asked to provide self-reported measurements. If one of the biological parents was not available during the visit for measurement or self-reporting, the parent present was asked to provide proxy-reported height and weight measurements for the absent parent. If proxy-reported measurements for the absent biological parent could not be obtained, another adult who cares for the child was selected for measurement.
Measurements were made according to a modified version of the National Health and Nutrition Examination Survey (NHANES) protocol, recorded in metric units (centimeters and kilograms), and measured to the nearest 0.01 cm and 0.01 kg. Height, weight, and WC were measured twice during each home visit. A third measurement was collected if the two heights were more than 0.5 cm different from one another; the two weights were more than 0.1 kg different from one another; or the two WCs (child only) were more than 2 cm different from one another. Sroka et al. (2015) provides a detailed description of the anthropometric collection protocol.
2.2.2. Nutritional Assessment Information on food and beverage intake (dietary screener questionnaire [DSQ]), food patterns and behaviors, breastfeeding, household food insecurity, perceived social support, perceived home environment, perceived school environment regarding healthy eating, perceived community environment regarding healthy eating, perception of weight, and satisfaction with weight were collected on all children enrolled in the HCS (Ritchie et al., 2015). For children 12 years and older, additional questions were asked regarding weight-based teasing and meal skipping for weight control. Questions were age appropriate, and either self-administered (child and parent/caregiver questions) or parent/caregiver assisted, depending on the age of the child (see Appendix A for the interview questions).
2.2.3. Enhanced Nutritional Assessment (ASA24) In addition to the standard nutritional assessment, participants selected for the Enhanced Protocol completed two 24-hour dietary recalls 8 to 10 days apart using the children’s version of the National
8
HCS Public Use Documentation August 1, 2016
Cancer Institute’s (NCI) Automated Self-Administered 24-hour Recall (ASA24TM) – ASA24-Kids. (http://epi.grants.cancer.gov/asa24/). This online web-based 24-hour dietary recall is based upon NCI’s ASA24 and has been adapted for use with children, containing considerably fewer probes. The ASA24-Kids has been developed for self-administration, and was completed at the first and second home visits for Enhanced Protocol participants (Ritchie et al., 2015). The ASA24 was updated from the 2011 version to the 2014 version during the course of the study. An indicator for the version is included in the dataset.
The purpose of collecting two recalls on each child was to enable adjustment of the distribution based on within-person variability, and to improve measurement error adjustment on the dietary variables from the DSQ used with children in the entire sample. The field interviewer was trained to give a neutral introduction and clear instructions to the parent/caregiver and child regarding who was to complete the dietary recall and to encourage interchange to obtain the most accurate information about the child's food intake on the previous day.
Data were downloaded weekly by Battelle from the ASA24 web interface as a set of CSV files and stored in the BISC environment.
2.2.4. Physical Activity Assessment All participants answered questions related to their physical activity (e.g., types of activities, intensity, frequency, and duration) at home, at school, and in the community, during the previous week, and their parent(s)/caregiver(s) were asked questions related to the child’s activities as well as physical activity resources available at home and in their community (Pate et al., 2015). Questions were gender specific and age appropriate, and either self-administered (child and parent/caregiver questions) or parent/caregiver assisted, depending on the age of the child (see Appendix A for the interview questions).
2.2.5. Enhanced Physical Activity Assessment Using a similar structured instrument, the Enhanced Protocol child participants were also asked, at the second home visit, to recall and describe the activities they participated in at home, at school, and in the community, during the previous day based on their gender and age. Additionally, participants were given an ActiGraph GT3X+ accelerometer at their first home visit, which they returned at the second home visit. The device was to be worn by the child at all times, except during bathing, swimming, or sleep, for the week in between home visits. Accelerometers provide an objective measure of physical activity by detecting movement and intensity of activity (Pate et al., 2015).
2.2.6. Demographics The following demographic characteristics were requested related to the child and parent/caregiver: age, race, ethnicity, marital status, country of origin, education, language, employment, and family income. Additionally, questions were asked to obtain length of time in the community and at the current address. A series of questions were also asked aimed at assessing the medical history of the child participant, including: issues related to the participant child’s access to healthcare; medical conditions that may alter diet for the participant child (diabetes, celiac disease, anorexia, bulimia, etc.); medical conditions that may alter physical activity for the participant child [disabilities, recent accidents (e.g., broken ankle), etc.]; medical conditions that may alter ability for the participant to self-complete aspects of protocol (e.g., cognitive deficits, Down syndrome, dyslexia, etc.).
2.2.7. Modified Windshield Survey In all communities, direct observations of the child’s street were completed by study staff prior to beginning the first household visit. The field interviewers completed a five-item modified windshield survey (MWS) to rate features of the social and physical environment on the street segment associated with each child’s home address. A street segment is defined as the street in front of the home, from intersection to intersection, not to exceed 0.5 miles. In the instances where the street segment exceeded 0.5 miles, the field interviewers were instructed to consider the street segment that is contained within 0.25 miles from the home in either direction or to the nearest intersection, whichever is closer. The information was captured on hard copy forms, and was entered into the IMS after the visit had been completed.
The following were the instructions provided to the field data collectors on the collection of information for the MWS:
• Upon approaching the street segment, be aware of any dangerous or suspicious activity. If anything or anyone looks unsafe, do not continue with the assessment. Write a note and report to the Field Manager.
• MWS are completed on single street segments, from intersection/cross-street to intersection/cross-street, of the street containing the participant’s home address. The street segment should not exceed 0.5 miles (<0.25 miles from the participant’s home in either direction).
• If the segment will exceed 0.5 miles between intersections, the rater should determine the length of the street from the intersection closest to the home up to 0.5 miles (from the intersection).
• Prior to beginning any assessment, staff will drive the street to (1) identify the location of the house, (2) identify the even and odd sides of the street for house numbering purposes and (3) identify the cross streets, thus indicating the street segment of interest.
• Drive between 3 and 5 mph. • Once house is identified, proceed to end of street segment and turn around to begin the audit
of the segment. • Assess both sides of the street, noting important features related to the assessment form. • Prior to entering the participant’s home, complete the modified windshield survey based on the
code descriptions provided on the MWS collection form.
2.3. Community and School Data Collection 2.3.1. Key Informant Interviews
In each community, a Battelle researcher (community liaison) identified and conducted interviews with key informants (KIs) associated with and/or knowledgeable of relevant CPPs that were implemented in or affected the defined community over a 10-year period (please refer to Appendix B for the key informant interview). A standardized data collection instrument was used to gather characteristics for each program and policy operating in the selected communities, such as: target population, including age, sex, location; target focus area; who delivered the program/services; level of funding and how it was funded; date initiated and ended, when applicable; number reached, and who was reached (i.e., providers trained and recipients of service); nature of collaborations; and any outcomes examined.
10
HCS Public Use Documentation August 1, 2016
The focus was on obtaining information on the complete set of CPPs implemented in each community and their full characterization, especially of attributes needed for calculating the intensity score (i.e., strategy, duration, reach) and other information needed for the primary study hypotheses. Initial open-ended questions probed for CPPs [e.g., “What specific programs (policies) were implemented by your organization to …”] and information about people and organizations involved. This information was used by researchers to help characterize CPPs after the KI interview.
Follow-on questions probed for more specific information, and these were followed by response options. After capturing CPPs, the KI interview also sought information to help characterize the factors that facilitated and restrained community efforts.
Document abstraction was also used to capture other instances of CPPs and to help clarify or confirm information reported in KI interviews. Research staff obtained and reviewed documents (e.g., annual program reports, reports to funders) and searched for web-based information about community activities. The information was used to capture additional candidate CPPs.
Furthermore, KIs who were particularly knowledgeable about parks and recreation and other physical activity resources in the community answered additional questions. The community liaison asked a few supplemental interview questions to these KIs to gather information about community resource availability and accessibility, physical activity related community collaborations, park and trail use and general features, and other information related to physical activity resources in the community.
2.3.2. Nutritional Environment Observational assessments of the nutritional environment were conducted in the recruited elementary/middle schools in each community (Ritchie et al., 2015). The Battelle community liaison observed the school’s lunch period and completed an observation form during the school visit; additionally, an individual at the district level was requested to complete a brief self-administered online questionnaire for the schools within his or her district to capture information on the school lunch program. A brief, self-administered questionnaire that requested information about overall wellness policy implementation at the school was provided to the school liaison during the school recruitment process to complete online. See Appendix C for these school-level questionnaires. Separate lunch room questionnaires were completed for schools that had both elementary and middle school aged children recruited; however, only one district-level food service program and one school liaison online questionnaire were completed.
The questionnaires and observations provided information regarding:
• School characteristics – student enrollment, meal program participation, free and reduced price meal eligibility, open campus status (i.e., whether children can leave the school campus for lunch) , participation in key federal school nutrition and food programs, degree and extent of scratch food preparation, extent of wellness policy implementation and how long in place, if and when changes have been made to the school meals, meal facilities, and competitive foods;
• Characteristics of reimbursable lunch options – number and type of entrees, beverages, whole grain vs. refined grain products, fruits, vegetables, dessert, and snack foods;
• Characteristics of dining facilities – availability, ambiance, size; • Cafeteria staff interactions with students; • Length of the lunch period and average length of time to obtain lunch;
11
HCS Public Use Documentation August 1, 2016
• Recess during lunch time; • Water availability; and • Competitive foods – what, where, and how much is offered.
These data were used to characterize the school food environment and validate and add detail to KI reports of school-based efforts. Furthermore, the data were used for cross-sectional and retrospective analyses of associations with anthropometric and behavioral measures.
2.3.3. Physical Activity Environment Observational assessments of the physical activity environment were conducted in the recruited elementary/middle schools in each community (Pate et al., 2015). The Battelle community liaison interviewed a member of the physical education staff at each school and observed the school’s outdoor physical activity resources using the Physical Activity Resource Assessment (School PARA) form. A brief, self-administered questionnaire that inquired about physical activity policies and practices within the school including physical activity and punishment practices, collaborations with community partners, and walk-to-school practices was provided to the school liaison during the school recruitment process to complete online. See Appendix C for these questionnaires. Separate physical education interviews were completed for schools that had both elementary and middle school aged children recruited; however, only one School PARA and one school liaison questionnaire were completed.
The physical education interview sought to gather data about physical activity resources and facilities on school campuses, the provision of physical education, recess, and other physical activity opportunities at schools, the community partnerships established for providing physical activity opportunities, and the norms and culture for physical activity at the schools.
The School PARA was conducted for outdoor features of the environment related to physical activity. This form characterized the features, amenities, and incivilities (evidence of unsocial behavior; e.g., evidence of drug use, broken glass) of the physical activity environment(s) in the school, the hours, availability, and capacity of the facilities, and size and cost of use of these environments.
2.4. Medical Record Abstracted Information (MRAI) Medical records were obtained for approximately 65% of the child participants where height and weight data were available to be abstracted to develop longitudinal BMI trajectories for up to the previous 10 years. Any indication of nutritional, physical activity, or sedentary activity counseling and the presence of other chronic conditions and prescribed medications for those conditions (e.g., asthma, diabetes) were also abstracted from medical records. At the conclusion of each community assessment, Examination Management Services Inc. (EMSI) contacted one medical provider for each participant whose parent/guardian provided consent to access medical records. A single provider for each participant was chosen; if multiple providers were listed on the medical record release form, the provider most likely to give the best information was determined by calculating the expected number of height/weight measurements taken by each provider while the participant has lived in the community and comparing these among the providers. The EMSI data abstractors key entered the information into an electronic form for transfer to the secure study data repository at the conclusion of the abstraction process.
12
HCS Public Use Documentation August 1, 2016
3. Data Preparation and Cleaning Data from each questionnaire and section were individually managed, and preparation generally followed the following six step process:
1. Read in and Duplicate Checks: Data were read from the central SQL database (or from text/Excel files, where applicable) into SAS. Each section was evaluated for duplicate records based on a unique household, school, or KI identifier. If the questionnaire responses were identical, one version of the record was retained. If responses were different, but had the same level of completeness, the earliest (or first) record was retained. However, if the responses were different and the records had varying levels of completeness, the survey operations team was consulted to work with the field interviewer to determine the correct record to retain.
2. Programming Specification Checks: Data were checked for consistency with the questionnaire programming specifications. Responses were validated based on specific value range and skip pattern specifications. If a value fell outside of range, was answered when it should have been skipped, skipped when it should have been answered, or contradicted a previous answer, the survey operations team was consulted to work with the field interviewer to determine the correct response. When available, these edits were applied to the data.
3. Recoding: Data were recoded according to the questionnaire programming specifications. Numeric placeholders for missing data (e.g., “Appropriate Skip,” “Don’t Know,” “Refused,” etc.) were replaced with SAS special missing values (.S, .D, .R, etc., respectively). See below for a more detailed description of the special missing values.
4. Labeling and Formatting: Each variable was renamed and labeled to match the questionnaire programming specifications. SAS formats were applied to each variable, where applicable.
5. Codebook Generated: For each dataset, a codebook was created to describe and summarize the variables. The codebooks are html documents that include the variable name, label, type, and length, as well as summary counts and/or statistics for each response category. Figure 2 and Figure 3 show examples of the codebook for categorical and continuous response variables, respectively.
6. Public Use Dataset: Data from household-, school-, and KI-level questionnaires were merged, respectively. Open text variables were dropped, new unique identifiers were randomly created to de-identify data, and certain variables that were potentially identifying were standardized, recoded, or dropped.
13
HCS Public Use Documentation August 1, 2016
Figure 2. Example codebook entry for categorical variable.
Figure 3. Example codebook entry for continuous response variable.
14
HCS Public Use Documentation August 1, 2016
SAS formats allow for the assignment of special missing values to facilitate the provision of context around missing responses. For example, most interview questions allowed respondents to refuse to answer the question or indicate that they did not know the answer; these responses were labeled as .R (“Refused”) and .D (“Don’t Know”), respectively. In addition, questions that should be skipped based on a response to a previous question were changed from missing to .S or “Appropriate Skip” to indicate that the response was not intended to be answered (e.g., if the response for whether the child was born prematurely was “No,” then the survey did not prompt for how many weeks premature the child was born). Questions that were outside of the protocol for the respondent (i.e., male respondents did not answer questions regarding menstruation; children under 12 were not asked to provide estimates for coffee intake in the DSQ and did not answer specific questions about getting teased about weight or meal-skipping weight control; children assigned the Standard Protocol did not respond to the second physical activity recall) were changed from missing to .O or “Outside of Protocol”. These assignments help in assessing the level of missingness in each of the response variables.
3.1. Community-Level Data The community dataset contains information regarding the census tract selected during the study design phase (either through the NPBS or through the certainty selection process) that led to the assignment of the respective community and for the community catchment area. Each community was assigned a unique identifier (variable COMMUNITYID).
The design-level census tract variables have a prefix of “NPBS_” and include the minority, income, urbanicity, region, and pre-selection score characterizations. They also include indicators for whether the community was selected through the NPBS or through the certainty community selection process, whether the community is located in one of the 15 largest US counties, and the recruitment strategy for Enhanced Protocol participants (i.e., gender/grade combinations targeted for Enhanced Protocol).
Socio-demographic variables for the community catchment areas were calculated using estimates from the 2009-2013 5-year American Community Survey (ACS 5-yr). The ACS variables were area-weighted based on the percent of each census tract that fell within the community catchment area. These variables have a prefix of “COMM_” and include:
• Percent of population aged 5 to 14 that is Hispanic • Percent of population aged 5 to 14 that is African American • Percent of population aged 5 to 14 that is Other (Non-Hispanic and not African American) • Percent of population with poverty status • Percent of population with an educational attainment of high school graduate or higher • Unemployment rate for population in labor force 16 years and over • Percent renter-occupied housing units • Percent vacant housing units • Percent of population with health insurance
An estimate of urban sprawl for the community catchment area is derived from the NCI Sprawl Indices 2010 (https://gis.cancer.gov/tools/urban-sprawl/).
A complete list of community-level variables can be found in Appendix D. The community data codebook, which contains format information and summary statistics for all variables, can be found in the Codebook supplement.
3.2. Household Data Each household that contained a child participant was assigned an 8-digit unique identifier (variable HOUSEHOLDID), where the first 3 digits of the identifier correspond to the unique identifier for the community (variable COMMUNITYID). Each child was also assigned a Standard or Enhanced Protocol visit type during the recruitment phase. The child’s gender, grade, and reported school were added to the household dataset from the IMS. Data processing for each of the household sections followed the six-step process defined above.
A description of the household questionnaire sections and data storage format for each section is shown in Table 2. The full list of variables can be found in Appendix D. The household data codebook, which contains format information and summary statistics for all variables, can be found in the Codebook supplement.
Table 2. Household Instrument sections and storage format
Section Description Data Storage
Section A Community Exposure SQL Section B Demographic and socio-economic information SQL Section C Details of child’s birth SQL Section D Health insurance SQL Section E Child self-reported behaviors SQL Section G Physical activity behaviors SQL Section H Physical activity child survey SQL Section I Physical activity parent survey SQL Section J (01-09) Nutrition SQL Section L Physical activity behaviors recall (Enhanced Protocol only) SQL MWS Modified Windshield Survey SQL BMI Anthropometric Measurements SQL
In addition to the variables that were directly elicited through the household questionnaire, a set of summary variables were derived or calculated to assist with analysis of the data and/or to facilitate inclusion of the information in the public release dataset. These, along with the key identifying and descriptive variables (e.g., Household Identifier, child age, gender, grade, etc.) are found at the beginning of the household dataset. These summary variables are followed by the questionnaire responses collected for each individual household section.
3.2.1. Child Age and Date of Birth The birthdate of the participating child was collected during telephone recruitment, as well as during the household visit in Section C of the questionnaire and on the medical record release form. In addition, the medical record abstraction information contained child date of birth (DOB). In the cases where any of these DOBs were different from the others, or inconsistent with the age and/or grade indicated for
16
HCS Public Use Documentation August 1, 2016
the child, the case was thoroughly reviewed by data management and survey operations to determine the most consistent DOB. Where necessary, the age of the child (which was automatically calculated in the IMS based on the DOB provided during recruitment) was adjusted to reflect the change in DOB.
3.2.2. Household-Level Summary Variables As mentioned above, a set of summary variables were derived or calculated to assist with analysis of the data and/or to facilitate inclusion of this information in the public release dataset. These include child/family socio-demographic and anthropometric information, as well as specific nutrition and physical activity measures that were created to aid in the analysis of study findings to be incorporated in manuscripts for submission to peer-reviewed journals.
3.2.2.1 Socio-Demographic Factors Household questionnaire Section B sought to gather information regarding the race, ethnicity, educational attainment, and income level of the child and the parent(s)/caregiver(s). Child race and ethnicity were re-classified from the variables collected in Section B based on OMB categories with two additional categories: Multi-Racial not including African American and Multi-Racial including African American.
A single, categorical variable for the family income level was derived based on the assimilation of responses to groups of questions related to income. When an actual income value was not provided, the respondents were probed for income ranges (e.g., “Was your total family income from all sources less than $50,000 or $50,000 or more?”). In some cases, the respondent answered one of the range questions, but not any of the others used to narrow the range. In order to ensure that the most comprehensive information related to household poverty is available for analysis, two additional income summary variables were added: Family income is less than $35,000 and Family income is less than $50,000.
The questionnaire contained multiple levels of responses based on the adult respondent’s relationship to the child and whether or not the biological parent(s) lived in the household. In order to ensure that consistent data for the biological parents were being applied across different analysis objectives, variables for the biological mother’s and biological father’s educational attainment and employment status, where applicable, were derived. Also calculated was the maximum educational attainment and employment status for either biological parent.
3.2.2.2 Chronic Medical Conditions Questions regarding any chronic medical condition, or impairment/health problem lasting longer than 12 months were asked in Section D of the household questionnaire. The specific conditions were collected as open-text responses, allowing for multiple conditions to be listed. As such, there exists the potential for identifying information to be contained in the response (e.g., “John has Down syndrome”). These responses were manually reviewed and classified into the following categories:
3.2.2.3 Anthropometrics (BMI) Multiple height, weight, and WC (child only) measurements were collected from the child and parent(s)/caregiver(s) during the first household visit. In order to calculate a single estimate of BMI for each participant, a final height and weight was calculated by taking a mean of the two (or three) observations that were not deemed as an inconsistent measurement through the quality control (QC) process. In addition, flags were created to indicate if the height, weight, or WC had any issues (e.g., measurements significantly different, third measurement was requested but refused, measurement outside the bounds of reasonable ranges). BMI was then calculated as the participant’s weight in kilograms divided by square of height (in meters) [kg/m2]. For the children, BMI z-scores were calculated based on CDC age and gender-specific growth charts (CDC, 2002). The z-score is a quantitative measure of the standard deviation of a child’s BMI to the distribution of BMI for a population of children of the same age and gender. A positive z-score indicates that the child has a higher BMI than the mean of that population and a negative z-score indicates that the child has a lower BMI.
The data collection instrument did not directly record the relationship of “Adult 1” or “Adult 2” to the child; thus, relationship variables for these adults were generated by merging the unique person identifier with data in the IMS. Similar to the demographic variables, variables specific to the anthropometric information for the biological mother and father, where applicable, were generated.
3.2.2.4 Child Diet and Influence on Diet Behavior Household questionnaire Section J included a DSQ for assessment of dietary intake, questions about dietary patterns and family meals, and questions about other behaviors associated with obesity-related outcomes. The public use dataset includes up to two cereal codes representing the cereal(s) that the child usually ate during the previous month. A full listing of the cereal codes and the corresponding cereal names is included in Appendix E.
Publicly available NCI-generated scoring algorithms were used by the research team to convert respondent frequencies of intake from the DSQ to estimated quantities of select food groups and nutrients, based on age- and gender-specific 24-hour dietary recall portion size data from NHANES (NCI 2015). Outcomes included quantitative estimates of amounts consumed daily for fruits/vegetables/ legumes with and without fried potatoes, dairy, total added sugar, sugar from sugar-sweetened beverages, whole grains, dietary fiber, frequency of consumption of energy-dense foods of minimal nutritional value, and usual intake of lower-fat milk (≤1%). The estimated quantities were calculated using two versions of the NCI scoring algorithms: one published in 2014 (all variables labeled with “2014x”) and an updated version of the algorithms, which is pending publication (all variables labeled with “2016x”). Note that values for the DSQ included in the public use data set were not adjusted to improve measurement error based upon the two recalls completed under the Enhanced Protocol.
Also included are a suite of summary variables that use the data collected in the household questionnaire Section J to simplify and/or group responses to facilitate easier or more logical analysis of the associations with HCS outcome variables (Appendix E).
18
HCS Public Use Documentation August 1, 2016
3.2.2.5 Child Physical Activity Behavior and Community Physical Activity Characteristics Similar to the child nutrition, a suite of summary variables was generated for child physical activity behaviors (household questionnaire Section G), influences on child physical activity behaviors (household questionnaire Sections H and I) and community physical activity characteristics (Modified Windshield Survey). Appendix F contains the summary variables generated, a description of each of the variables, and contributing variables used to create the summary variable.
3.2.3. Anthropometrics (BMI) The IMS stored the anthropometric data collected for the child, and for parent(s)/caregiver(s), as separate records in the database. The records for all persons in a household were merged to create a single record for the household. The variables were assigned a prefix of “H_CHILD_,” “H_ADULT1_,” and “H_ADULT2_,” where applicable. As mentioned in the household-level summary variables section, the relationship of the adults to the child was not explicitly included in the BMI collection instrument; this information is found in the ADULT1_Relationship and ADULT2_Relationship variables. ADULT1 for the BMI data does not necessarily correspond to the adult respondent for the household questionnaire.
The BMI and BMI z-scores (for children only) were calculated as described in the household-level summary variables section above.
3.2.3.1 Quality Control Data from completed in-home visits were monitored on a weekly basis. The data collected by each field data collector were reviewed to assess the number of third measurements and out-of-range measures. Out-of-range measures for children were defined as those below the 1st or above the 99th percentile for that child’s age/gender group; for adults, the out-of-range limits were the 1st and 99th percentiles of all adults based on NHANES (CDC, 2013). Data were also reviewed to determine if the field data collectors’ recordings exhibited end-digit preferences (e.g., always rounding to the nearest zero or 0.5 in the measurements). Supervisors reviewed the protocol with data collectors whose recordings exhibited abnormal patterns or end-digit preferences, and provided refresher training, as needed.
3.2.3.2 Conversion to Standard Units The preferred method of obtaining the anthropometric measurements for all study participants and parent(s)/caregiver(s) was through actual measurement following the HCS measurement protocol (Sroka et al., 2015). This was not always possible and, in some cases, the participant or parent(s)/caregiver(s) refused measurement and a self-reported measurement was accepted in these cases. Similarly, if a second parent/caregiver was not present, the parent/caregiver was given the option to provide a proxy measurement. Information regarding how the measurement was obtained (height and weight “TYPE”) is included in the dataset for each person. For consistency across all observations, the height was converted to cm and the weight to kg for all measurements.
3.2.3.3 Inconsistent Measurements The height, weight, and WC (where applicable) data were checked for consistency among the multiple measurements collected. In the cases where three measurements were obtained for a given metric, the difference between each pair of measurements was calculated. For height, if two of the measurements were within 0.5 cm of each other and a third was more than 0.5 cm from both, the one that was more than 0.5 cm from the other two was marked as an “Inconsistent Measurement.” If all three measurements were more than 0.5 cm apart, the one that was furthest away was marked as
19
HCS Public Use Documentation August 1, 2016
“Inconsistent Measurement.” A similar evaluation was made for the weight measurements with a threshold of 0.1 kg and WC with a threshold of 2 cm.
3.2.3.4 Measurement Issue Flags In cases where there were multiple measurements for the child or parent/caregiver and two of those measurements were more than 0.5 cm apart for height or 0.1 kg apart for weight or 2 cm apart for WC, a flag was included in the dataset indicating that there is a potential measurement issue. In addition, observations that may have had measurement issues were flagged if any of the heights were less than 75 cm or greater than 250 cm or any weights were less than 10 kg or greater than 200 kg. These are different than the NHANES percentiles and are meant to flag implausible measurements.
3.3. ASA24 Analytic output files generated by ASA24-Kids included daily total nutrient intakes; food group intakes in grams; “MyPyramid” cup equivalents for fruits, vegetables, and dairy; “MyPyramid” ounce equivalents for whole grains; and “MyPyramid” teaspoons for added sugars (MPED 2.0) (NCI, 2016). Teaspoons of added sugar from sugar sweetened beverages (SSBs) was calculated separately (not an output of the MPED program), using the same Food and Nutrient Database for Dietary Studies (FNDDS) codes for SSBs that were used to generate the DSQ estimate of teaspoons of sugar from SSBs (collected in household questionnaire Section J). The variables retained from the ASA24 output files, with the addition of added sugar from SSBs, matched those of interest in the DSQ. One exception was that calories from solid fats and added sugars from the ASA24 were retained, as well, for matching with foods of minimal nutritional value from the DSQ.
3.4. Accelerometry Accelerometry data were reduced from high temporal resolution observations (i.e., 80-Hz sampling rate) to daily minutes of light and moderate-to-vigorous intensity physical activity, as well as daily minutes of sedentary behavior. Operational definitions of physical activity and sedentary behavior variables are presented in Table 3 (Pate et al., 2015). Times spent in selected physical activity intensity categories were determined by applying the age-specific accelerometry count cut-points used in NHANES (ranges presented in Table 3; based on Troiano et al., 2008).
Table 3. Operational definitions of physical activity and sedentary behavior variables derived from accelerometry.
Variable Definition Total physical activity (minutes/day) Sum of all wear minutes with Actigraph count values >100 Sedentary behavior (minutes/day) Accumulated daily minutes with Actigraph count values ≤100 Light-intensity physical activity (minutes/day)
Accumulated daily minutes with Actigraph count range ≥ 101 to age-adjusted cut-off (1,400-2,780)
Each record in the dataset represents a day of data for a household. Sixty minutes of consecutive zeroes for activity were considered non-wear. To be included in the final dataset, a child had to have 3 or more days of wear with at least 8 hours of wear on each day. Up to 7 days of valid accelerometry data were retained. Days are identified by number, where Monday equals 1, Tuesday equals 2, etc. Where there was a need to use more than one of any day of the week within a participant’s data (i.e., to get up to 7 days), the second occurrence of the day was renumbered by adding seven (i.e., Monday = 1 and 8, Tuesday = 2 and 9, etc.).
3.5. Medical Record Abstraction Information (MRAI) The abstracted medical information was stored in Excel sheets and securely transmitted to Battelle weekly by EMSI. Each weekly Excel file was imported into SAS, saved as a SAS dataset, and appended together to create a complete SAS dataset containing all abstracted information. An estimate of the child’s age in months at the time of the medical provider visit was calculated (variable CHILDAGE_MONTHS), since birthdate and medical visit dates are protected information.
Due to the sensitive nature of the responses to occurrences of specific medical conditions, diagnosis dates, and medications, those variables are not included in the public release dataset.
The variable DUPLICATE_MR_DATE was added to the dataset to indicate whether more than one medical record abstraction observation was recorded for a household with the same medical provider visit date. Duplicate entries for the same household and visit date will have a value of one for DUPLICATE_MR_DATE. This flag can be used to identify duplicate entries in the public use dataset since age is only provided in months (i.e., there may be two records for the same age in months with the same height and weight values, but they were recorded at different medical provider visits; in those cases, the variable DUPLICATE_MR_DATE will be equal to zero).
3.5.1. Quality Control and Re-abstraction The abstracted medical records were reviewed for inconsistencies in the household identifier, medical record dates and birthdates. Identifiers that had one or two digits inaccurately entered but that clearly matched other records in the abstraction dataset were corrected. Medical record dates and birthdates that were nonsensical by 1 digit in the month, day, or year variables (e.g., a year of 1012) that matched child records from a similar existing date (e.g., 2012) were assumed to have that date (2012). Birthdates that were not consistent within a child's records were also examined. If more than one birthdate was identified within one child's medical records and it could not be reconciled using the above logic, those observations were dropped from the dataset and it was requested that EMSI re-abstract the data for that participant.
The medical record data collection instrument at the onset of the study did not include an option for the abstractor to enter height in inches only; the options were feet and inches (with inches limited to values between 0 and 11) and centimeters only. Errors were identified in the conversion from inches to feet and inches. All records with at least one height measurement that contained a fraction of an inch (i.e., less than 1, but greater than 0) were re-abstracted (heights and weights only). The re-abstracted heights and weights replaced the original heights and weights when the medical provider visit date matched. Otherwise, the re-abstracted records were appended to the children's original records.
21
HCS Public Use Documentation August 1, 2016
3.5.2. Conversion to Standard Units Similar to BMI, all heights and weights were converted to standard metric units of cm and kg, respectively.
3.5.3. Calculating BMI After converting to standard units, BMI was calculated as the participant’s weight in kilograms divided by square of height (in meters) [kg/m2].
3.6. School Observations School observations were collected for each school that agreed to participate in the study. Each school was designated a unique number (variable SCHOOLNUMBER) that, when combined with the community identifier (variable COMMUNITYID), is used to uniquely identify a school. The GRADEGROUP variable indicates which grade groups (elementary, middle, or both elementary and middle) were targeted at the school. The SCHOOLTYPE variable is an indicator of the grade group for that particular observation. That is, a school that was targeted for elementary and middle school participants will have two records in the dataset – one for elementary and one for middle. A flag was added to the school observations dataset for whether the school had any children participants included in the final household-level dataset.
A description of the school observation questionnaire sections and data storage format for each section is shown in Table 4. The full list of variables can be found in Appendix D. The school observations data codebook, which contains format information and summary statistics for all variables, can be found in the Codebook supplement. Data processing for each of these sections followed the six-step process defined above.
Table 4. School Observation sections and storage format
Section Description Data Storage
SPARA School physical activity resource assessment SQL
FSP/SFE Food Service Personnel/School food environment questionnaire for district food service director/manager TXT
LRO Lunch room observation form SQL
LIAISON School policies and practices related to nutrition and physical activity TXT
3.6.1. School-Level Summary Variables Summary variables were also generated at the school level to facilitate analyses associated with the major HCS outcomes. These included school physical activity characteristics.
3.6.1.1 School Physical Activity Characteristics A list of the school-level summary variables for Physical Activity that sought to aggregate and/or summarize groups of like information into a single measure or index is included in Appendix G.
22
HCS Public Use Documentation August 1, 2016
3.6.2. Lunch Room Observations (LRO) Cleaning Lunch room observations variable LRO_DIFF_ENTREES was programmed in the Illume data collection instrument to sum the number of different entrée options available. Two of the entrée options were inadvertently left out of this calculation; as a result, this variable was recalculated as the sum of:
3.6.3. Combining School Observations As mentioned previously, the LRO and physical education instructor (PEI) interview questionnaires were designed to have distinct observations for elementary and middle school grade groups within a school where the school was targeted for both grade groups. The school food environment (SFE) and school policies and practices related to nutrition and physical activity questionnaires, completed by district-level food service personnel and school liaisons respectively, and the school PARA, however, had only a single observation per school. Care was taken to merge all of the data by community identifier, school number, and the type of observation (elementary or middle) for the LRO and PEI questionnaires. The SFE and school liaison questionnaires and the school PARA are repeated for both elementary and middle school grades, where applicable. There are cases where a school was targeted for elementary and middle school grades, but there are LRO or PEI interview responses for only one of the grade groups.
3.6.4. Open Text Recoding The LRO and SFE questionnaires had a variety of questions that were only captured as open-text responses. As these responses potentially contain identifying information, they were excluded from the public use dataset. Certain variables, however, were deemed important for analysis, and thus they were recoded or characterized into new indicator or categorical variables and included in the public use dataset. These variables are described below.
3.6.4.1 Lunch Room Observations (LRO) The LRO allowed the community liaison to use open text fields to specify entrées and other lunch room items that did not match to an existing food group. Open text responses were renamed, labeled, and formatted to match existing food and beverage items in the LRO, where applicable. If an item matched into an existing category, the new variable (with suffix “_U”) includes the values of the existing variable plus the corresponding values from the open text variables. If an item did not fit into an existing category, a new food or beverage variable was created (also with suffix “_U”). For example, a community liaison may have noted that there are “Enchiladas” available as a write-in for “Other Entrée.” While there is no existing enchilada category in the LRO, there is a category for the number of Burrito
23
HCS Public Use Documentation August 1, 2016
items available. The updated Burrito variable would then contain the number of burrito options plus the number of enchilada options. A full list of the types of foods and beverages, brands, and product names that were re-categorized are included in Appendix H.
3.6.4.2 School Food Environment The SFE responses for the position of the person who completed the SFE questionnaire, other state or federal food or nutrition programs that the school participates in, and additional comments were recoded into separate indicator variables (with suffix “_U”) as described in Table 5.
Table 5. Additional variables created for SFE questionnaire based on open-text responses.
Position of individual completing form
FSP_ADMIN_U Administrative assistant, data technician, supervisor of accountability, supervisor of training,
FSP_CHILDNUTDIRECTOR_U Child nutrition director, administrator school nutrition services, nutrition services director
FSP_DIETITIAN_U Dietitian, Registered Dietitian
FSP_DIRECTOR_U Executive director, department manager, assistant director, manager
FSP_FINANCE_U Budget analyst, financial analyst, assistant director of finance
FSP_FOODSERVICEDIRECTOR_U Food service director, supervisor of menu planning & special diets, food service coordinator
FSP_WELLNESSCOORD_U Nutrition outreach coordinator, district wellness coordinator, nutrition initiatives coordinators
Other state or federal food or nutrition program FSP_FPO_CACFPSUPPER_U CACFP, Seamless Summer Program, At-risk Supper Program FSP_FPO_COMMELIG_U Community Eligibility Provision FSP_FPO_COMMOD_U USDA Commodity Program, state distribution commodities, FSP_FPO_HEALTHYCERT_U CSDE Healthy Food Certification FSP_FPO_NSBP_U School Breakfast Program FSP_FPO_NSLP_U National School Lunch Program FSP_FPO_SNACK_U After School Snack Program
FSP_FPO_STELLARBESTNUTPRACT_U Stellar Award for Best Nutrition Practices
PARTICIPATE_OTHER_U Stellar Award for Best Nutrition Practices, CSDE Healthy Food Certification
Additional comments or explanations FSP_COMMENTS_6GRADE_U Includes grades K-6
FSP_COMMENTS_HHFKADIFFICULT_U Meal offerings worse because of sodium and whole grain restrictions, competitive food participation dropped
FSP_COMMENTS_HHFKAGOOD_U Competitive foods not issue at school, already doing nutrition standards
FSP_COMMENTS_NOALACARTE_U No a la carte at these schools FSP_COMMENTS_SCRATCHMINCOOK_U Minimal prep due to high labor costs, scratch cooking
FSP_COMMENTS_SURVEYDIFFICULT_U Difficulty with estimating years of programs because newer to district, survey not clear
24
HCS Public Use Documentation August 1, 2016
FSP_COMMENTS_712GRADE_U Includes grades 7-12
FSP_COMMENTS_SATELLITE_U Receives prepackaged meals from vendor, all product made at central kitchen, no onsite preparation
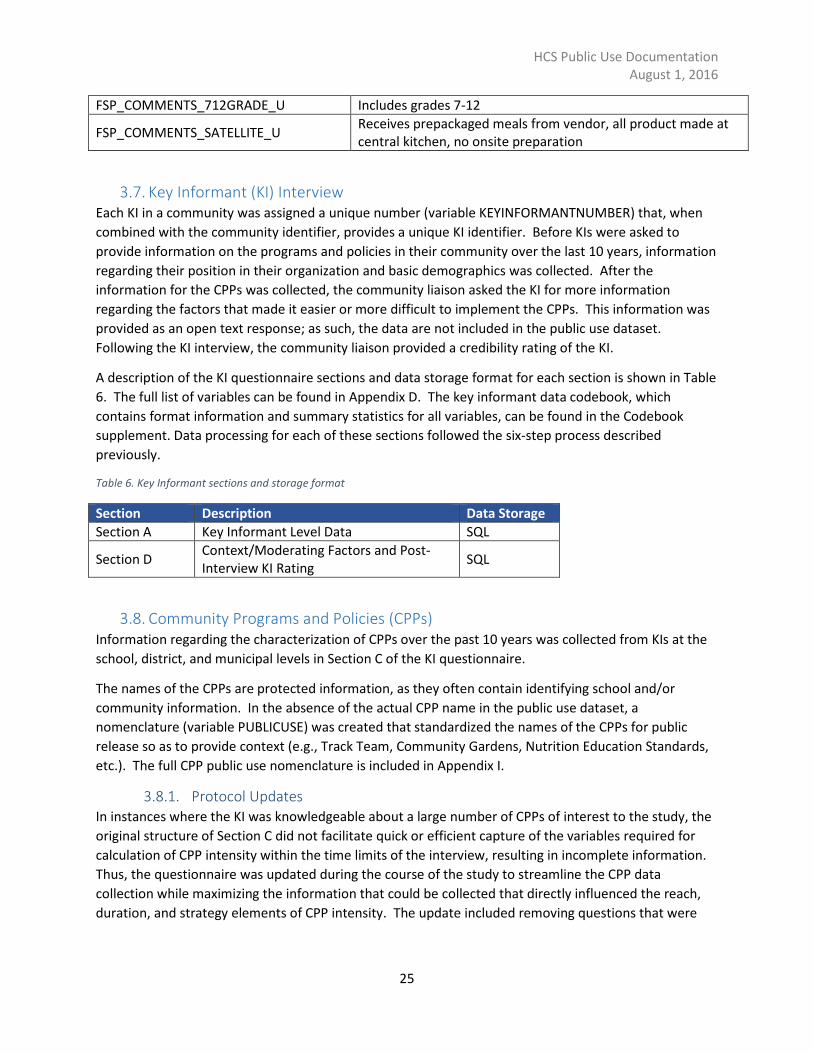
3.7. Key Informant (KI) Interview Each KI in a community was assigned a unique number (variable KEYINFORMANTNUMBER) that, when combined with the community identifier, provides a unique KI identifier. Before KIs were asked to provide information on the programs and policies in their community over the last 10 years, information regarding their position in their organization and basic demographics was collected. After the information for the CPPs was collected, the community liaison asked the KI for more information regarding the factors that made it easier or more difficult to implement the CPPs. This information was provided as an open text response; as such, the data are not included in the public use dataset. Following the KI interview, the community liaison provided a credibility rating of the KI.
A description of the KI questionnaire sections and data storage format for each section is shown in Table 6. The full list of variables can be found in Appendix D. The key informant data codebook, which contains format information and summary statistics for all variables, can be found in the Codebook supplement. Data processing for each of these sections followed the six-step process described previously.
Table 6. Key Informant sections and storage format
Section Description Data Storage Section A Key Informant Level Data SQL
Section D Context/Moderating Factors and Post-Interview KI Rating SQL
3.8. Community Programs and Policies (CPPs) Information regarding the characterization of CPPs over the past 10 years was collected from KIs at the school, district, and municipal levels in Section C of the KI questionnaire.
The names of the CPPs are protected information, as they often contain identifying school and/or community information. In the absence of the actual CPP name in the public use dataset, a nomenclature (variable PUBLICUSE) was created that standardized the names of the CPPs for public release so as to provide context (e.g., Track Team, Community Gardens, Nutrition Education Standards, etc.). The full CPP public use nomenclature is included in Appendix I.
3.8.1. Protocol Updates In instances where the KI was knowledgeable about a large number of CPPs of interest to the study, the original structure of Section C did not facilitate quick or efficient capture of the variables required for calculation of CPP intensity within the time limits of the interview, resulting in incomplete information. Thus, the questionnaire was updated during the course of the study to streamline the CPP data collection while maximizing the information that could be collected that directly influenced the reach, duration, and strategy elements of CPP intensity. The update included removing questions that were
25
HCS Public Use Documentation August 1, 2016
non-essential to CPP intensity calculation; all variables included in the public use dataset are comparable and consistent in the original and the updated versions.
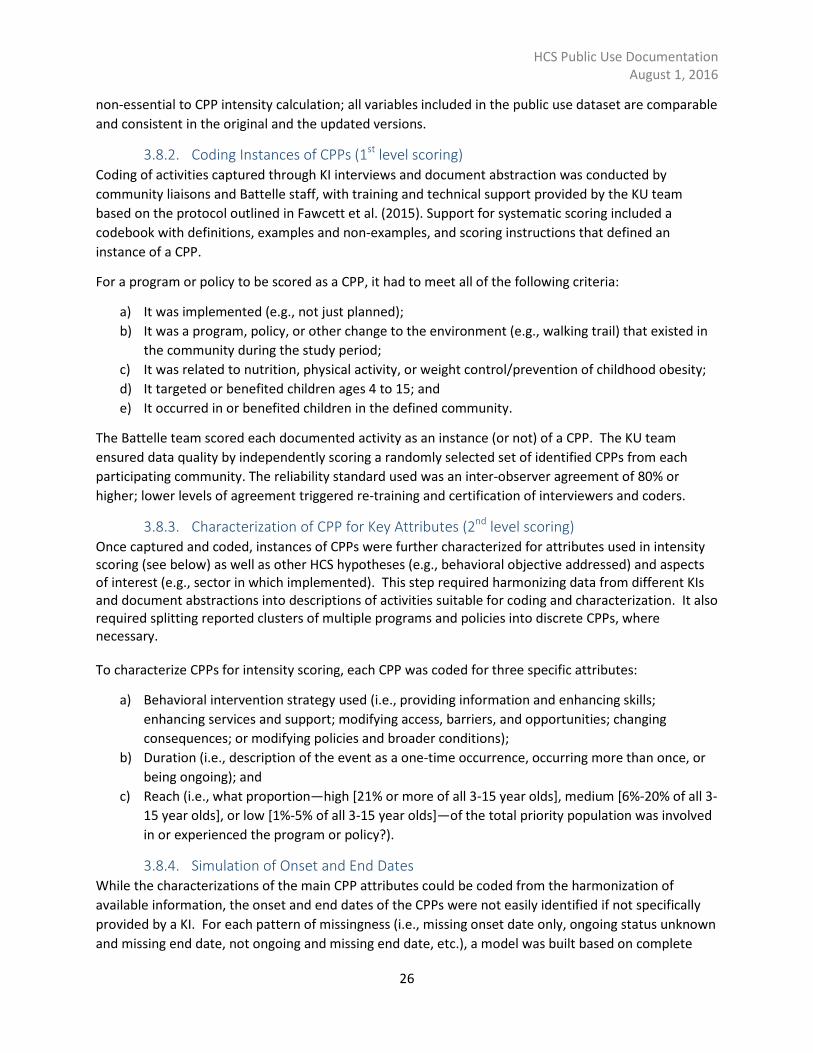
3.8.2. Coding Instances of CPPs (1st level scoring) Coding of activities captured through KI interviews and document abstraction was conducted by community liaisons and Battelle staff, with training and technical support provided by the KU team based on the protocol outlined in Fawcett et al. (2015). Support for systematic scoring included a codebook with definitions, examples and non-examples, and scoring instructions that defined an instance of a CPP.
For a program or policy to be scored as a CPP, it had to meet all of the following criteria:
a) It was implemented (e.g., not just planned); b) It was a program, policy, or other change to the environment (e.g., walking trail) that existed in
the community during the study period; c) It was related to nutrition, physical activity, or weight control/prevention of childhood obesity; d) It targeted or benefited children ages 4 to 15; and e) It occurred in or benefited children in the defined community.
The Battelle team scored each documented activity as an instance (or not) of a CPP. The KU team ensured data quality by independently scoring a randomly selected set of identified CPPs from each participating community. The reliability standard used was an inter-observer agreement of 80% or higher; lower levels of agreement triggered re-training and certification of interviewers and coders.
3.8.3. Characterization of CPP for Key Attributes (2nd level scoring) Once captured and coded, instances of CPPs were further characterized for attributes used in intensity scoring (see below) as well as other HCS hypotheses (e.g., behavioral objective addressed) and aspects of interest (e.g., sector in which implemented). This step required harmonizing data from different KIs and document abstractions into descriptions of activities suitable for coding and characterization. It also required splitting reported clusters of multiple programs and policies into discrete CPPs, where necessary.
To characterize CPPs for intensity scoring, each CPP was coded for three specific attributes:
a) Behavioral intervention strategy used (i.e., providing information and enhancing skills; enhancing services and support; modifying access, barriers, and opportunities; changing consequences; or modifying policies and broader conditions);
b) Duration (i.e., description of the event as a one-time occurrence, occurring more than once, or being ongoing); and
c) Reach (i.e., what proportion—high [21% or more of all 3-15 year olds], medium [6%-20% of all 3-15 year olds], or low [1%-5% of all 3-15 year olds]—of the total priority population was involved in or experienced the program or policy?).
3.8.4. Simulation of Onset and End Dates While the characterizations of the main CPP attributes could be coded from the harmonization of available information, the onset and end dates of the CPPs were not easily identified if not specifically provided by a KI. For each pattern of missingness (i.e., missing onset date only, ongoing status unknown and missing end date, not ongoing and missing end date, etc.), a model was built based on complete
26
HCS Public Use Documentation August 1, 2016
CPP records to estimate the probability that a CPP was active in any given year. The years of CPP onset and end were then simulated consistent with the probabilities of being active in each year. The final dataset used to calculate CPP intensity was based on 20 simulations of missing onset and end years.
3.8.5. Calculate Intensity Scores for CPPs Intensity scoring provides a way to estimate the potential influence of each CPP (i.e., the “dose” of intervention) actually delivered in each community. This scoring approach also allows for an examination of the association between different quantities and types of CPPs with key outcome variables (i.e., dietary intake, physical activity, and BMI) at different times during the study period. In a complex system, an intensity score for a given CPP should take into account multiple attributes, such as reach or change strategy, as well as real-world circumstances that influence associations between programs and policies and changes in childhood obesity. Table 1 describes the categories and assigned values for weighting the potential impact of a particular CPP based on the three attributes listed in the previous section.
Figure 4. Calculating the Intensity Score for Documented Community Programs and Policies Using Three Factors (from Pate et al., 2015; based on Collie-Akers et al, 2013).
The CPP intensity score, �̂�, for community i in year t is calculated as follows:
𝑛𝑖
�̂�𝑖𝑖 = �(𝐷𝑖𝑖 + 𝑅𝑖𝑖 + 𝐵𝑖𝑖 )𝐼𝑖𝑖𝑖 𝑖=1
where 𝐷𝑖𝑖 is the duration of CPP j in community i, 𝑅𝑖𝑖 is the reach of CPP j in community i, and 𝐵𝑖𝑖 is the type of behavioral intervention strategy used for CPP j in community i. The variable 𝐼𝑖𝑖𝑖 is an indicator of whether CPP j was in place in community i in year t (1 = yes, 0 = no), and 𝑛𝑖 is the total number of CPPs in community i. Community CPP intensity scores were also calculated for the subset of CPPs that were aimed at improving nutrition and the subset of CPPs that were aimed at increasing physical activity
27
HCS Public Use Documentation August 1, 2016
(variable KC_ACT_GOAL). CPPs that had a goal of both improving nutrition and increasing physical activity were included in both sub-scores. As described in the previous section, there were 20 simulations of onset and end dates for CPPs with missing date information. As a result, the annual CPP intensity scores were calculated for each of the 20 simulations.
Community CPP intensity scores were calculated for all years starting with the current (or base) year for the community, which was calculated as the median year of all KI interviews conducted in a community, and ending 10 years prior to the base year. In order to evaluate the changes in CPP intensity over the 10 year study period, aggregate measures of CPP intensity were calculated by summing the scores over 1-, 3-, 6- and 10-year timeframes. For example, the 3-year total intensity score is the sum of the annual CPP intensity scores for the base year and the two previous years.
The total community CPP intensity scores were standardized to a 0-to-1 score. To translate the quantitative scores to a 0-to-1 scale, the potential response space across all 130 communities was analyzed to identify the minimum and maximum response for each community CPP intensity score. The following transformation was then used to standardize to the 0-to-1 scale:
To summarize, the variables included in the public use dataset are the community-level total and standardized CPP intensity score for all CPPs, the total and standardized CPP intensity score for CPPs that had a goal of improving nutrition, and the total and standardized CPP intensity score for CPPs that had a goal of increasing physical activity for the current year and for 3, 6 and 10 prior year aggregates. All CPP intensity scores included in the public use dataset represent the average score and average standardized score across the 20 simulations.
4. Public Use Dataset 4.1. Community, Participant, School and Medical Record Inclusion
The public use dataset contains data for the 130 communities that agreed to full participation and where school and child recruitment were successful. Furthermore, data for children in the 130 communities where consent is explicitly recorded in the IMS and where the IMS indicated that a visit occurred (it is not required that a visit be marked as complete) are included. Children who were recruited into the study as 8th graders, but who had interviews occur after they had entered 9th grade were excluded.
All schools that agreed to full participation in the 130 communities and that had at least one piece of data (i.e., school liaison questionnaire, SFE questionnaire, PEI interview, school PARA or LRO) are included in the school observations dataset. A flag was added for whether the school had any child participants included in the final household-level dataset. This allowed for retention of school data collected that might not directly relate to a particular set of participants, but was collected prior to unsuccessful recruitment of child participants.
Similarly, statistical methods were applied to remove potentially erroneous and outlier data from the medical record observations for the longitudinal data analysis. A flag is included in the data (INCLUDED_LONGITUDINAL) that indicates whether the BMI measurement from that observation was included in the longitudinal analysis. See Appendix J for a detailed description of this process.
28
HCS Public Use Documentation August 1, 2016
4.2. De-identification The datasets were formulated to comply with the NHLBI Policy for Data Sharing from Clinical Trials and Epidemiological Studies (http://www.nhlbi.nih.gov/research/funding/human-subjects/data-sharing); including removal of sensitive variables, such as dates of birth, removal of dates, and removal and/or recoding of other variables that may lead to participant, community, or school identification.
All unique identifiers were randomly regenerated from the original identifier for public release. These include the community identifier, household identifier, program number, school number, and KI number.
4.2.1. Recoding/Regrouping Sensitive variables with low frequency counts (i.e., less than 20) were dropped or recoded to reduce the risk of participant identification, where applicable. Table 7 shows the variables that were dropped or recoded from their original values due to low frequencies in the dataset. The questions regarding race, employment, and education were asked for various adults (e.g., biological mother, biological father) in household questionnaire Section B based on the relationship of the responding adult to the child. For consistency, the regroupings were based on the cell counts that refer to the child and the responding adult; low cell counts may remain in the responses for other adults related to the child.
Table 7. Variables that were dropped or recoded from their original values due to low cell counts.
Questionnaire Variable Description Change
Key Informant Race Reclassified Native Hawaiian/Pacific Islander, American Indian/Alaskan Native and Asian as Other
Native Hawaiian/Pacific Islander Sub-Groups Dropped from dataset
Asian Sub-Groups Reclassified Japanese, Korean, and Vietnamese as Other
Chronic Conditions
Reclassified the following conditions as Other: Cardiovascular Disorder, Epilepsy, Genetic Disorder, Hematological Disorder, Pre-Diabetes and Sensory Disorder
Chronic Conditions Reclassified Asthma (recovered) as Asthma Adult Employment Reclassified Retired and Student as Other Household Composition – Adults
Regrouped such that 2 or more adults in a category are grouped together
Household Composition – Siblings
Regrouped such that 6 or more siblings are grouped together
Household Household Composition – Other Children
Regrouped such that 4 or more other children are grouped together
Year Came to the US Regrouped year to: Before 1990, 1990-1999, 2000-2004, 2005-2009, After 2010
Child Smoked in Last 30 Days Dropped
Child is Pregnant Dropped
Income Dropped income value, if specified; added flag for whether income value was provided or if range questions answered
Highest Education
Regrouped to: Less than HS; Some HS, no degree; HS diploma, GED or equivalent; Some college, no degree; Associate Degree; Bachelor’s Degree; Master’s Degree; Professional Degree; and Doctoral Degree
4.2.2. Visit Dates Household, school observation, and KI interview dates were changed to only contain the year of the interview. For the Enhanced Protocol, the number of days between the first and second visit is provided. If no second visit occurred, this value is 0.
4.2.3. Open Text Variables As specified in the NHLBI Policy for Data Sharing from Clinical Trials and Epidemiological Studies, all unedited, verbatim responses that are stored as text data (e.g., specified in "other" category) were deleted. Instances where open text responses were recoded are provided above in the respective Data Preparation section.
30
HCS Public Use Documentation August 1, 2016
4.3. Datasets and Supplemental Files Included All HCS public use datasets are provided as SAS datasets with supplemental SAS format libraries, where applicable, and HTML codebooks containing variable names, labels, and a summary of the values for each of the variables. Table 8 presents the names and descriptions of the files provided by level of the data (e.g., community, household, KI, school observation).
The SAS format libraries are provided in both 64- and 32-bit formats to accommodate use on various operating systems and versions of SAS. The 32-bit versions contain the suffix “_32,” while the 64-bit versions are the default with no suffix. Users should note what version of SAS is being used prior to applying the formats and use the appropriate format library.
31
HCS Public Use Documentation August 1, 2016
Table 8. HCS public use datasets and supplemental files.
File Name File Type Description # Records # Variables
Community Level Data
hcs_community_publicuse.sas7bdat SAS Dataset
Contains community-level information related to the study protocol, demographics and geographic location 130 20
hcs_comm_fmt.sas7bcat SAS Format Library
SAS format library for Community Data (64-bit): hcs_community_publicuse.sas7bdat - -
hcs_comm_fmt_32.sas7bcat SAS Format Library
SAS format library for Community Data (32-bit): hcs_community_publicuse.sas7bdat - -
HCS_Community_PublicUse_Codebook.html HTML Codebook
Codebook file for data found in: hcs_community_publicuse.sas7bdat - -
Household Level Data
hcs_hh_publicuse.sas7bdat SAS Dataset
Contains data collected based on household questionnaire Sections A, B, C, D, E, G, H, I, J and L, as well as BMI and Modified Windshield Survey
5,138 1,248
hcs_hh_fmt.sas7bcat SAS Format Library
SAS format library for HH data (64-bit): hcs_hh_publicuse.sas7bdat - -
hcs_hh_fmt_32.sas7bcat SAS Format Library
SAS format library for HH data (32-bit): hcs_hh_publicuse.sas7bdat - -
HCS_HH_PublicUse_Codebook.html HTML Codebook
Codebook file for data found in: hcs_hh_publicuse.sas7bdat - -
Household Level Data (Enhanced Protocol)
hcs_asa24_publicuse.sas7bdat SAS Dataset
Contains data collected from the Automated Self-administered 24-hour Recall (ASA24) system for Enhanced Protocol households. 1-2 records per enhanced household.
1,220 43
HCS_ASA24_PublicUse_Codebook.sas7bdat HTML Codebook
Codebook file for data found in hcs_asa24_publicuse.sas7bdat - -
hcs_accelerometer_publicuse.sas7bdat SAS Dataset
Contains data collected from accelerometers. 1-7 daily records per enhanced household. 3,355 16
32
HCS Public Use Documentation August 1, 2016
File Name File Type Description # Records # Variables
HCS_Accelerometer_PublicUse_Codebook.html HTML Codebook
Codebook file for data found in: hcs_accelerometer_publicuse.sas7bdat - -
Medical Record Abstraction Information
hcs_mrai_publicuse.sas7bdat SAS Dataset
Contains data collected from the medical record abstraction instrument. 1 record per household medical record entry.
50,728 9
Hcs_mrai_fmt.sas7bcat SAS Format Library
SAS format library for MRAI data (64-bit): hcs_mrai_publicuse.sas7bdat - -
Hcs_mrai_fmt_32.sas7bcat SAS Format Library
SAS format library for MRAI data (32-bit): hcs_mrai_publicuse.sas7bdat - -
HCS_MRAI_PublicUse_Codebook.html HTML Codebook
Codebook file for data found in: hcs_mrai_publicuse.sas7bdat - -
School Observation Level
hcs_schobs_publicuse.sas7bdat SAS Dataset
Contains data collected based on school observation questionnaires for lunch room observations, physical education interviews, school PARA, school liaison questionnaire and SFE questionnaire. 1-2 records per school based on targeted grade groups.
491 968
hcs_schobs_fmt.sas7bcat SAS Format Library
SAS format library for School Observations data (64-bit): hcs_schobs_publicuse.sas7bdat - -
hcs_schobs_fmt_32.sas7bcat SAS Format Library
SAS format library for School Observations data (32-bit): hcs_schobs_publicuse.sas7bdat - -
HCS_SchObs_PublicUse_Codebook.html HTML Codebook
Codebook file for data found in: hcs_schobs_publicuse.sas7bdat - -
Key Informant Level
hcs_ki_publicuse.sas7bdat SAS Dataset
Contains data collected based on the Key Informant interview protocol section A and section D. 1 record per key informant.
1,420 31
hcs_ki_fmt.sas7bcat SAS Format Library
SAS format library for Key Informant data (64-bit): hcs_ki_publicuse.sas7bdat - -
hcs_ki_fmt_32.sas7bcat SAS Format SAS format library for Key Informant data (32-bit): - -
33
HCS Public Use Documentation August 1, 2016
File Name File Type Description # Records # Variables
Library hcs_ki_publicuse.sas7bdat
HCS_KI_PublicUse_Codebook.html HTML Codebook
Codebook file for data found in: hcs_ki_publicuse.sas7bdat - -
Community Programs and Policies
hcs_cpp_publicuse.sas7bdat SAS Dataset
Contains full characterization (2nd level scoring) of all community programs and policies used in calculating intensity scores. 1 record per CPP.
9,689 127
hcs_cpp_fmt.sas7bcat SAS Format Library
SAS format library for Community Program and Policy Data (64-bit): hcs_cpp_publicuse.sas7bdat - -
hcs_cpp_fmt_32.sas7bcat SAS Format Library
SAS format library for Community Program and Policy Data (32-bit): hcs_cpp_publicuse.sas7bdat - -
HCS_CPP_PublicUse_Codebook.html HTML Codebook
Codebook file for data found in: hcs_cpp_publicuse.sas7bdat - -
CPP Intensity Scores
hcs_cppintensityscore_publicuse.sas7bdat SAS Dataset
Contains total community intensity scores (sum of annual intensity scores) for all programs and policies provided by community key informants for 1, 3, 6 and 10 year periods. Intensity scores also provided for nutrition and physical activity programs and policies, individually.
130 25
HCS_cppintensityscore_PublicUse_Codebook.html HTML Codebook
Codebook file for data found in: hcs_cppintensityscore_publicuse.sas7bdat - -
34
HCS Public Use Documentation August 1, 2016
4.4. Linking Datasets All levels of data can be linked through common unique identifiers such as the community identifier, the household identifier, and school number, etc. All datasets contain the variable COMMUNITYID. Care should be taken to ensure that the merges are applied appropriately based on the level of the data and intended purpose (e.g., one-to-one, one-to-many, etc.).
4.4.1. Household and School Observations The school observations dataset contains records for a school based on targeted grade group, where applicable, resulting in cases where there are two records for a given school. The grade breakdown for elementary and middle school children is not consistent across all of the school districts in the study; this is particularly seen in the placement of 6th graders in either an elementary (e.g., K-6) or a middle school (e.g., 6-8). The following logic should be applied when merging household and school level data:
• If school is only targeting a single grade group [i.e., variable GRADEGROUP equals 1 (Elementary School) or 3 (Middle School)], merge the datasets on community identifier and school number.
• If school is targeting both elementary and middle school grades [i.e., variable GRADEGROUP equals 2 (Elementary/Middle School)]:
o If child grade is K-5, merge datasets on community identifier and school number, where the type of school for the observation is elementary school [i.e., variable SCHOOLTYPE equals 1 (Elementary School)]
o If child grade is 6-8, merge datasets on community identifier and school number, where the type of school for the observation is middle school [i.e., variable SCHOOLTYPE equals 3 (Middle School)].
4.5. Contact Information All questions regarding the Healthy Communities Study and/or the public release dataset should be directed to Sonia Arteaga, Program Director, Clinical Applications and Prevention Branch, NHLBI at [email protected].
References Arteaga SS, Loria CM, Crawford PB et al. The Healthy Communities Study: Its rationale, aims, and approach. Am J Prev Med. 2015 Oct; 49(4): 615-623.
CDC. 2000 CDC Growth Charts for the United States: Methods and Development. Washington, DC: DHHS; 2002.
CDC. National Health and Nutrition Examination Survey (NHANES): NHANES 2011-2012 Examination Data. Washington, DC: DHHS; 2013.
Collie-Akers VL, Fawcett SB, Schultz JA. Measuring progress of collaborative action in a community health effort. Rev Panam Salud Publica. 2013;34(6):422–428.
Fawcett SB, Collie-Akers VL, Schultz JA, Kelley M. Measuring community programs and policies in the Healthy Communities Study. Am J Prev Med. 2015 Oct; 49(4): 636-641.
John LV, Gregoriou M, Pate RR, et al. Operational implementation of the Healthy Communities Study: How communities shape children’s health. Am J Prev Med. 2015 Oct; 49(4): 631-635.
National Cancer Institute (NCI). Dietary screener questionnaire in the NHANES 2009-10: data processing & scoring procedures. http://appliedresearch.cancer.gov/nhanes/dietscreen/scoring/. Updated October 2015.
National Cancer Institute (NCI). Instructions for the Researcher Web site for: ASA24TM-2014, ASA24Tm-Kids-2014, and ASA24TM-Canada-2014. Updated March 2016.
Pate RR, McIver KL, Colabianchi N. Physical activity measures in the Healthy Communities Study. Am J Prev Med. 2015 Oct; 49(4): 653-659.
Ritchie LD, Wakimoto P, Woodward-Lopez G. The Healthy Communities Study nutrition assessments: Child diet and the school nutrition environment. Am J Prev Med. 2015 Oct; 49(4): 647-652.
Sroka CJ, McIver KL, Sagatov RDF, Arteaga SS, Frongillo EA. Weight status measures collected in the Healthy Communities Study: Protocols and analyses. Am J Prev Med. 2015 Oct; 49(4): 642-646.
Strauss WJ, Sroka CJ, Frongillo EA, et al. Statistical design features of the Healthy Communities Study. Am J Prev Med. 2015 Oct; 49(4): 624-630.
Troiano RP, Berrigan D, Dodd KW, Masse LC, Tilert T, McDowell M. Physical activity in the United States measured by accelerometer. Med Sci Sports Exerc. 2008; 40(1):181– 188. http://dx.doi.org/10.1249/mss.0b013e31815a51b3.
Form Approved OMB No. 0925-0649 Exp. Date: 8/31/2016
ADULT CONSENT FORM
Public reporting burden of this collection of information is estimated at 10 minutes per response, including the time for reviewing instructions, searching existing data sources, gathering and maintaining data needed, and completing and reviewing the collection of information. An agency may not conduct or sponsor, and a person is not required to respond to a collection of information unless it displays a currently valid OMB control number. Send comments regarding this burden estimate or any other aspect of this collection of information, including suggestions for reducing this burden to S. Sonia Arteaga, Ph.D., project director at [email protected]
PURPOSE The purpose of the Healthy Communities Study is to see what programs and policies in communities across the United States help children lead healthy lives. This study is being conducted by a research company, Battelle Memorial Institute. It is funded by the National Institutes of Health (NIH).
PROCEDURES If you agree to have you and your child participate in this study, a trained interviewer will come to your home one time. He or she will ask you and your child questions about nutrition and physical activity. The interviewer will also ask questions about your home and your community and will record the precise location of your home. This information will allow researchers to look at the specific resources and environment around the homes of study participants to understand where community programs have an impact.
Your answers will be recorded on a computer and some answers will be entered into the computer directly by you and your child. If your child is aged 12 or older when we come to your home, we will ask him or her to answer many of the questions without your help.
The interviewer will take measurements of your child including your child’s height, weight, and waist circumference. A cosmetic pencil will be used to place a small mark on your child’s hip in order to accurately place the tape measure for the waist measurement.The interviewer will also record current height and weight measurements for the child’s parents/caregivers. If you are a parent/caregiver, the interviewer will measure your height and weight today, and measure the height and weight of the other parent/caregiver, if he or she lives here, is available today, and consents to being measured. If you are not the parent/caregiver, the interviewer will measure the height and weight of the parents/caregivers if either/both live here, are available today, and consent to being measured. If any parent/caregiver is not available or willing to be measured, we will ask you to report their latest known height and weight, if you know that information. All measurements will be repeated for accuracy. Finally, the interviewer will ask you to sign a form to let us look at your child’s past medical records on file at your child’s doctor’s office to collect information on how your child has been growing. The entire visit today by the interviewer should take about 75 minutes.
We may also contact you again in the future when similar studies take place in your community. At that time you will be given the choice to participate in that new study or not.
HOW YOU WERE SELECTED You are eligible to be in the study because you have a child in kindergarten through eighth grade living in your household and your household is located within one of the over 200 communities we are studying. Almost 20,000 children and their parents will eventually participate in this study.
Form Approved OMB No. 0925-0649 Exp. Date: 8/31/2016
DATA SECURITY The study team will do everything they can to make sure your information stays private and secure. All study staff members are required to complete trainings on keeping your information safe. Study laptops and equipment are password protected. They also have programs to protect your information. Your information will be stored in a locked building with access limited to authorized study team members only.
Any forms with your name (or your child’s name) will be kept separate from any papers that might be used to collect information about your child. Study data forms will only have your study identification number on it.
The only reasons we would have to reveal your study participation, as required by law, are: 1) if a case of child abuse is discovered during the study, or 2) if the Institutional Review Board (IRB), the body which oversees the protection of study
participants, needs to review records.
If you let us look at your child’s medical records, your doctor will know that you are in the study, but he or she will not have access to the information we collect during this study.
Final study results will be published on groups only. No individual information will be included. No individual in this study will be able to be identified.
RISKS/DISCOMFORTS There are few known risks to participation in this study. Some of the questions we ask may be sensitive. Because the study is voluntary, you do not need to answer any question you do not feel comfortable answering. There is also a risk of your data being revealed. Every effort will be made to keep your information safe and secure.
BENEFITS
This study has no known individual benefits for participation. However, it is important for you and your child to participate because it will help researchers understand what programs and policies in the community help children to stay healthy. The results of this study could help improve existing and future programs/policies for children across the United States.
COSTS AND COMPENSATION
There is no cost to you for being in this study. In appreciation of your participation, after the home visit if your child is in kindergarten through fifth grade, you will get a gift worth $25 and a small age-appropriate toy for your child. If your child is in sixth through eighth grade and helps answer more of the study questions directly, you will each get a gift worth $15.
As an additional thank you for your participation in this study, at the end of the study, you will get a summary report of the study results for all participants as a group.
VOLUNTARY Participation by you, your child, and any other parents/caregivers in this study is voluntary. You may ask questions at any time. You may refuse to answer any survey question. You may also drop out at any time without penalty to you or your child. If your child is aged 8 or older today, we will also ask your child to sign a form indicating his or her agreement to be in the study before we begin any data collection.
Form Approved OMB No. 0925-0649 Exp. Date: 8/31/2016
ADULT CONSENT FORM
Public reporting burden of this collection of information is estimated at 10 minutes per response, including the time for reviewing instructions, searching existing data sources, gathering and maintaining data needed, and completing and reviewing the collection of information. An agency may not conduct or sponsor, and a person is not required to respond to a collection of information unless it displays a currently valid OMB control number. Send comments regarding this burden estimate or any other aspect of this collection of information, including suggestions for reducing this burden to S. Sonia Arteaga, Ph.D., project director at [email protected]
PURPOSE The purpose of the Healthy Communities Study is to see what programs and policies in communities across the United States help children lead healthy lives. This study is being conducted by a research company, Battelle Memorial Institute. It is funded by the National Institutes of Health (NIH).
PROCEDURES If you agree to have you and your child participate in this study, a trained interviewer will come to your home two times. During the first visit, he or she will ask you and your child questions about nutrition and physical activity. The interviewer will also ask questions about your home and your community and will record the precise location of your home. This information will allow researchers to look at the specific resources and environment around the homes of study participants to understand where community programs have an impact.
Your answers will be recorded on a computer and some answers will be entered into the computer directly by you and your child. If your child is aged 12 or older when we come to your home, we will ask him or her to answer many of the questions without your help.
The interviewer will take measurements of your child including your child’s height, weight, and waist circumference. A cosmetic pencil will be used to place a small mark on your child’s hip in order to accurately place the tape measure for the waist measurement.The interviewer will also record current height and weight measurements for the child’s parents/caregivers. If you are a parent/caregiver, the interviewer will measure your height and weight today, and measure the height and weight of the other parent/caregiver, if he or she lives here, is available today, and consents to being measured. If you are not the parent/caregiver, the interviewer will measure the height and weight of the parents/caregivers if either/both live here, are available today, and consent to being measured. If any parent/caregiver is not available or willing to be measured, we will ask you to report their latest known height and weight, if you know that information. All measurements will be repeated for accuracy.
Your child will be asked to wear an activity monitor for the next week. The monitor measures movement. It should be worn at all times except while sleeping or when in water, such as while bathing or swimming. The interviewer will show you how to put the monitor on (and take it off) your child.
You and your child will also be asked to recall what your child ate yesterday. Finally, the interviewer will ask you to sign a form to let us look at your child’s past medical records on file at your child’s doctor’s office to collect information on how your child has been growing. The entire first visit by the interviewer should take about 95 minutes.
One week after the first visit, the interviewer will come back to your house to collect the activity monitor and repeat the food recall and the measurements. At this time, they will also ask you questions about what activities your child did yesterday. This second visit will take approximately 50 minutes.
We may also contact you again in the future when similar studies take place in your community. At that time you will be given the choice to participate in that new study or not.
Form Approved OMB No. 0925-0649 Exp. Date: 8/31/2016
HOW YOU WERE SELECTED You are eligible to be in the study because you have a child in kindergarten through eighth grade living in your household and your household is located within one of the over 200 communities we are studying. Almost 20,000 children and their parents will eventually participate in this study.
DATA SECURITY The study team will do everything they can to make sure your information stays private and secure. All study staff members are required to complete trainings on keeping your information safe. Study laptops and equipment are password protected. They also have programs to protect your information. Your information will be stored in a locked building with access limited to authorized study team members only.
Any forms with your name (or your child’s name) will be kept separate from any papers that might be used to collect information about your child. Study data forms will only have your study identification number on it.
The only reasons we would have to reveal your study participation, as required by law, are: 1) if a case of child abuse is discovered during the study, or 2) if the Institutional Review Board (IRB), the body which oversees the protection of study participants,
needs to review records.
If you let us look at your child’s medical records, your doctor will know that you are in the study, but he or she will not have access to the information we collect during this study.
Final study results will be published on groups only. No individual information will be included. No individual in this study will be able to be identified.
RISKS/DISCOMFORTS There are few known risks to participation in this study. Some of the questions we ask may be sensitive. Because the study is voluntary, you do not need to answer any question you do not feel comfortable answering. There is also a risk of your data being revealed. Every effort will be made to keep your information safe and secure.
BENEFITS
This study has no known individual benefits for participation. However, it is important for you and your child to participate because it will help researchers understand what programs and policies in the community help children to stay healthy. The results of this study could help improve existing and future programs/policies for children across the United States.
COSTS AND COMPENSATION There is no cost to you for being in this study. In appreciation of your participation, after the first home visit if your child is in kindergarten through fifth grade, you will get a gift worth $25 and a small age-appropriate toy for your child. If your child is in sixth through eighth grade and helps answer more of the study questions directly, you will each get a gift worth $15.
At the end of your second home visit, when the interviewer collects the activity monitor, your family will get an additional $50 gift.
Form Approved OMB No. 0925-0649 Exp. Date: 8/31/2016
As an additional thank you for your participation in this study, at the end of the study, you will get a summary report of the study results for all participants as a group.
VOLUNTARY Participation by you, your child, and any other parents/caregivers in this study is voluntary. You may ask questions at any time. You may refuse to answer any survey question. You may also drop out at any time without penalty to you or your child. If your child is aged 8 or older today, we will also ask your child to sign a form indicating his or her agreement to be in the study before we begin any data collection.
CONTACT INFORMATION For questions about your rights as a study participant, contact:
Form Approved OMB No. 0925-0649 Exp. Date: 8/31/2016
CHILD ASSENT FORM
Public reporting burden of this collection of information is estimated at 10 minutes per response, including the time for reviewing instructions, searching existing data sources, gathering and maintaining data needed, and completing and reviewing the collection of information. An agency may not conduct or sponsor, and a person is not required to respond to a collection of information unless it displays a currently valid OMB control number. Send comments regarding this burden estimate or any other aspect of this collection of information, including suggestions for reducing this burden to S. Sonia Arteaga, Ph.D., project director at [email protected]
WHY? We are doing a study to see what activities in your neighborhood help children lead healthy lives.
WHAT? If you agree to be in this study, a person from the study called an interviewer will come to your home one time. He or she will ask you and your parent questions about what you eat, what things you do in school and for play, and where you go in your neighborhood. The interviewer will put some answers into a computer and you and your parent may put some answers in the computer. The interviewer will also measure your height and waist and see how much you weigh.
The interviewer will ask your parent to sign a form to let us look at your medical records at your doctor’s office to see how you are growing. The visit to your home today by the interviewer should take about 75 minutes.
WHO? You can be in this study because you are in kindergarten through eighth grade and you live in one of the over 200 neighborhoods we are studying.
IS THIS SAFE? We will never use your name in any reports so what you tell us will not appear with your name. We will keep everything you tell us locked up and protected by passwords.
WILL ANYTHING HURT? Nothing should hurt and if you do not like any of the questions we ask, you do not have to answer.
WHO WILL THIS HELP? This study will help researchers understand how communities can help children stay healthy.
WILL I GET ANYTHING? Yes, after the home visit if you are in kindergarten through fifth grade, you will get a small toy. If you are in sixth through eighth grade, you will get a gift worth $15. Your parent will also get a gift.
DO I HAVE TO DO THIS? No, you can choose to join or not. You may ask questions at any time. You may refuse to answer any survey question. You may also drop out at any time.
I have read this form and the study staff have answered my questions.
I, _________________________________, agree to be in the “HEALTHY COMMUNITIES STUDY.” Printed Child Full Name
Form Approved OMB No. 0925-0649 Exp. Date: 8/31/2016
CHILD ASSENT FORM
Public reporting burden of this collection of information is estimated at 10 minutes per response, including the time for reviewing instructions, searching existing data sources, gathering and maintaining data needed, and completing and reviewing the collection of information. An agency may not conduct or sponsor, and a person is not required to respond to a collection of information unless it displays a currently valid OMB control number. Send comments regarding this burden estimate or any other aspect of this collection of information, including suggestions for reducing this burden to S. Sonia Arteaga, Ph.D., project director at [email protected]
WHY? We are doing a study to see what activities in your neighborhood help children lead healthy lives.
WHAT? If you agree to be in this study, a person from the study called an interviewer will come to your home two times. During the first visit he or she will ask you and your parent questions about what you eat, what things you do in school and for play, and where you go in your neighborhood. The interviewer will put some answers into a computer and you and your parent may put some answers in the computer. The interviewer will also measure your height and waist and see how much you weigh.
You will be asked to wear an activity monitor for the next week. The monitor is a small machine that can tell when you are moving. It should be worn at all times except while sleeping or when in water like while in the bath or while swimming. The interviewer will show you how to put the monitor on and take it off. We will also ask you to tell us what you ate yesterday. Finally, the interviewer will ask your parent to sign a form to let us look at your medical records at your doctor’s office to see how you are growing. The entire first visit by the interviewer should take about 95 minutes.
One week after the first visit, the interviewer will come back to your house to collect the activity monitor, ask you again what you ate yesterday, and may measure you again. At this time, they will also ask you about what you did yesterday. This second visit will take approximately 50 minutes.
WHO? You can be in this study because you are in kindergarten through eighth grade and you live in one of the over 200 neighborhoods we are studying.
IS THIS SAFE? We will never use your name in any reports so what you tell us will not appear with your name. We will keep everything you tell us locked up and protected by passwords.
WILL ANYTHING HURT? Nothing should hurt and if you do not like any of the questions we ask, you do not have to answer.
WHO WILL THIS HELP? This study will help researchers understand how communities can help children stay healthy.
WILL I GET ANYTHING? Yes, after the first home visit if you are in kindergarten through fifth grade, you will get a small toy. If you are in sixth through eighth grade, you will get a gift worth $15. Your parent will also get a gift.
At the end of your second home visit, when the interviewer collects the activity monitor, your family will get an additional gift.
Form Approved OMB No. 0925-0649 Exp. Date: 8/31/2016
DO I HAVE TO DO THIS? No, you can choose to join or not. You may ask questions at any time. You may refuse to answer any survey question. You may also drop out at any time.
I have read this form and the study staff have answered my questions.
I, _________________________________, agree to be in the “HEALTHY COMMUNITIES STUDY.” Printed Child Full Name