LC280360-1 National Instrument 43-101 Technical Report: Geology and Exploration at the Gold Basin Project Mohave County, Arizona USA Report Date: February 25, 2021 Effective Date: February 5, 2021 Prepared for: Gold Basin Resources Corporation 1170 – 1040 West Georgia Street Vancouver, BC, V6E 4H1 Canada Prepared by: Hard Rock Consulting, LLC 7114 W. Jefferson Avenue Suite 308 Lakewood, CO 80235 Endorsed by QP(s): Jeff Choquette, P.E., State of Montana (No. 12265) J. J. Brown, P.G., SME-RM (No. 4168244RM) Richard Schwering, P.G., SME-RM (No. 4223152RM)
Transcript
LC280360-1
National Instrument 43-101 Technical Report: Geology and Exploration at the
Gold Basin Project Mohave County, Arizona USA
Report Date: February 25, 2021
Effective Date: February 5, 2021
Prepared for:
Gold Basin Resources Corporation 1170 – 1040 West Georgia Street
Vancouver, BC, V6E 4H1
Canada
Prepared by:
Hard Rock Consulting, LLC 7114 W. Jefferson Avenue Suite 308
Lakewood, CO 80235
Endorsed by QP(s):
Jeff Choquette, P.E., State of Montana (No. 12265)
J. J. Brown, P.G., SME-RM (No. 4168244RM)
Richard Schwering, P.G., SME-RM (No. 4223152RM)
LC280360-1
IMPORTANT NOTICE
This report was prepared as a National Instrument 43-101 Technical Report for Gold Basin Resources Corporation (“GBR”) (CSE:GXX) by Hard Rock Consulting, LLC (“HRC”). The quality of information, conclusions, and estimates contained herein is consistent with the scope of HRC’s services based on: i)
information available at the time of preparation, ii) data supplied by outside sources, and iii) the assumptions, conditions, and qualifications set forth in this report. This report is intended for use by GBR subject to the terms and conditions of their contract with HRC, which permits GBR to file this report with Canadian Securities Regulatory Authorities pursuant to National Instrument 43-101, Standards of Disclosure for
Mineral Projects. Except for the purposes legislated under provincial securities law, any other use of this
report by any third party is at that party’s sole risk.
Gold Basin Resources Corporation NI 43-101 Technical Report
Gold Basin Project Certificates of Author
LC280360-1
February 25, 2021 i
CERTIFICATE OF QUALIFIED PERSONS
I, Richard A. Schwering, P.G., SME-RM, do hereby certify that:
1. I am currently employed as Principal Resource Geologist by:
Hard Rock Consulting, LLC 7114 W. Jefferson Ave., Ste. 313 Lakewood, Colorado 80235 U.S.A.
2. I am a graduate of the University of Colorado, Boulder with a Bachelor of Arts in Geology, in 2009 and have practiced my profession continuously since 2013.
3. I am a:
3.1 Registered member of the Society of Mining and Metallurgy and Exploration (No. 4223152RM)
3.2 Licensed Professional Geologist in the State of Wyoming (PG-4086)
4. I have worked as a Geologist for 11 years and as a Resource Geologist for a total of 7 years since my graduation from university; as an employee of a junior exploration company, as an independent consultant, and as an employee of various consulting firms with experience in structurally controlled precious and base metal deposits.
5. I have read the definition of “qualified person” set out in National Instrument 43-101 (“NI 43-101”) and certify that by reason of my education, affiliation with a professional association (as defined in NI 43-101) and past relevant work experience, I fulfill the requirements to be a “qualified person” for the purposes of NI 43-101.
6. I am responsible for the preparation of the report titled “National Instrument 43-101 Technical Report, Geology and Exploration at the Gold Basin Project, Mohave County, Arizona, USA”, dated February 25, 2021 with an effective date of February 5, 2021, with specific responsibility for Sections 1, 10, through 12, and 14 of this report.
7. I have had no prior involvement with the property that is the subject of this Technical Report.
8. As of the date of this certificate and as of the effective date of the Technical Report, to the best of my knowledge, information and belief, the Technical Report contains all scientific and technical information required to be disclosed to make the report not misleading.
9. I am independent of the issuer and property applying all of the tests in section 1.5 of NI 43-101.
10. I have read NI 43-101 and Form 43-101F1, and the Technical Report has been prepared in compliance with that instrument and form.
Dated this 25th day of February 2021 Richard A. Schwering Signature of Qualified Person Richard A. Schwering; SME-RM Printed name of Qualified Person
Gold Basin Resources Corporation NI 43-101 Technical Report
Gold Basin Project Certificates of Author
LC280360-1
February 25, 2021 ii
CERTIFICATE OF QUALIFIED PERSONS
I, Jennifer J. Brown, P.G., do hereby certify that:
1. I am currently employed as Principal Geologist by:
Hard Rock Consulting, LLC 7114 W. Jefferson Ave., Ste. 313 Lakewood, Colorado 80235 U.S.A.
2. I am a graduate of the University of Montana and received a Bachelor of Arts degree in Geology in 1996.
3. I am a:
• Licensed Professional Geologist in the State of Wyoming (PG-3719)
• Registered Professional Geologist in the State of Idaho (PGL-1414)
• Registered Member in good standing of the Society for Mining, Metallurgy, and Exploration, Inc. (4168244RM)
4. I have worked as a geologist for over 20 years since graduation from the University of Montana, as an employee of various engineering and consulting firms and the U.S.D.A. Forest Service. I have more than 10 collective years of experience directly related to mining and or economic and saleable minerals exploration and resource development, including geotechnical exploration, geologic analysis and interpretation, resource evaluation, and technical reporting.
5. I have read the definition of “qualified person” set out in National Instrument 43-101 (“NI 43-101”) and certify that by reason of my education, affiliation with a professional association (as defined in NI 43-101) and past relevant work experience, I fulfill the requirements to be a “qualified person” for the purposes of NI 43-101.
6. I am responsible for the preparation of the report titled “National Instrument 43-101 Technical Report, Geology and Exploration at the Gold Basin Project, Mohave County, Arizona, USA”, dated February 25, 2021 with an effective date of February 5, 2021, with specific responsibility for Sections 1 through 9 and 15 through 19 of this report.
7. I have had no prior involvement with the property that is the subject of this Technical Report.
8. As of the date of this certificate and as of the effective date of the Technical Report, to the best of my knowledge, information and belief, the Technical Report contains all scientific and technical information required to be disclosed to make the report not misleading.
9. I am independent of the issuer and property applying all of the tests in section 1.5 of NI 43-101.
10. I have read NI 43-101 and Form 43-101F1, and the Technical Report has been prepared in compliance with that instrument and form.
Dated this 25th day of February 2021
Jennifer J. (J.J.) Brown
Jennifer J. (J.J.) Brown, SME-RM Printed name of Qualified Person
Gold Basin Resources Corporation NI 43-101 Technical Report
Gold Basin Project Certificates of Author
LC280360-1
February 25, 2021 iii
CERTIFICATE OF QUALIFIED PERSONS
I, Jeffery W. Choquette, P.E., do hereby certify that:
1. I am currently employed as Principal Engineer by:
Hard Rock Consulting, LLC 7114 W. Jefferson Ave., Ste. 313 Lakewood, Colorado 80235 U.S.A.
2. I am a graduate of Montana College of Mineral Science and Technology and received a Bachelor of Science degree in Mining Engineering in 1995
3. I am a:
• Registered Professional Engineer in the State of Montana (No. 12265)
• QP Member in Mining and Ore Reserves in good standing of the Mining and Metallurgical Society of America (No. 01425QP)
4. I have 22-plus years of domestic and international experience in project development, resource and reserve modeling, mine operations, mine engineering, project evaluation, and financial analysis. I have worked for mining and exploration companies for fifteen years and as a consulting engineer for seven years. I have been involved in industrial minerals, base metals and precious metal mining projects in the United States, Canada, Mexico and South America.
5. I have read the definition of “qualified person” set out in National Instrument 43-101 (“NI 43-101”) and certify that by reason of my education, affiliation with a professional association (as defined in NI 43-101) and past relevant work experience, I fulfill the requirements to be a “qualified person” for the purposes of NI 43-101.
6. I am responsible for the preparation of the report titled “National Instrument 43-101 Technical Report, Geology and Exploration at the Gold Basin Project, Mohave County, Arizona, USA”, dated February 25, 2021 with an effective date of February 5, 2021, with specific responsibility for Section 13 of this report.
7. I have had no prior involvement with the property that is the subject of this Technical Report.
8. As of the date of this certificate and as of the effective date of the Technical Report, to the best of my knowledge, information and belief, the Technical Report contains all scientific and technical information required to be disclosed to make the report not misleading.
9. I am independent of the issuer and property applying all of the tests in section 1.5 of NI 43-101.
10. I have read NI 43-101 and Form 43-101F1, and the Technical Report has been prepared in compliance with that instrument and form.
Dated this 25th day of February 2021
Jeffery W. Choquette
Jeffery W. Choquette, P.E. Printed name of Qualified Person
Gold Basin Resources Corporation NI 43-101 Technical Report
PROPERTY DESCRIPTION AND OWNERSHIP ............................................................................................................. 1
GEOLOGY AND MINERALIZATION .......................................................................................................................... 1
STATUS OF EXPLORATION.................................................................................................................................... 2
MINERAL RESOURCE ESTIMATE ............................................................................................................................ 2
CONCLUSIONS AND RECOMMENDATIONS ............................................................................................................... 3
1.6.1 Recommended Work Plan and Budget .................................................................................................... 4
ISSUER AND TERMS OF REFERENCE ....................................................................................................................... 6
SOURCES OF INFORMATION ................................................................................................................................. 6
QUALIFIED PERSONS AND PERSONAL INSPECTION .................................................................................................... 7
UNITS OF MEASURE........................................................................................................................................... 7
3. RELIANCE ON OTHER EXPERTS ................................................................................................... 8
4. PROPERTY DESCRIPTION AND LOCATION ................................................................................... 9
PROJECT LOCATION AND OWNERSHIP ................................................................................................................... 9
MINERAL TENURE, AGREEMENTS AND ENCUMBRANCES ......................................................................................... 10
PERMITTING AND ENVIRONMENTAL LIABILITIES ..................................................................................................... 11
5. ACCESSIBILITY, CLIMATE, LOCAL RESOURCES, INFRASTRUCTURE AND PHYSIOGRAPHY .... 13
ACCESS AND CLIMATE ...................................................................................................................................... 13
LOCAL RESOURCES AND INFRASTRUCTURE ............................................................................................................ 13
HISTORICAL PRODUCTION ................................................................................................................................. 17
7. GEOLOGICAL SETTING AND MINERALIZATION ......................................................................... 18
OPINION ON ADEQUACY ................................................................................................................................... 80
12. DATA VERIFICATION ................................................................................................................... 82
SITE VISIT ...................................................................................................................................................... 82
ASSAY DATA .................................................................................................................................................. 83
OPINION ON ADEQUACY ................................................................................................................................... 85
13. MINERAL PROCESSING AND METALLURGICAL TESTING ......................................................... 87
14. MINERAL RESOURCE ESTIMATE ................................................................................................ 90
16. OTHER RELEVANT DATA AND INFORMATION .......................................................................... 92
17. INTERPRETATIONS AND CONCLUSIONS .................................................................................... 93
GEOLOGY AND DEPOSIT TYPE ............................................................................................................................ 93
EXPLORATION, DRILLING, AND ANALYTICAL .......................................................................................................... 93
Gold Basin Resources Corporation NI 43-101 Technical Report
Gold Basin Project Table of Contents
LC280360-1
February 25, 2021 vi
DATA VERIFICATION ........................................................................................................................................ 93
FIGURE 9-13 PLM SE TARGET .............................................................................................................................. 37
FIGURE 9-14 SENATOR SE TARGET ....................................................................................................................... 38
GBR owns 100% of the Project through its wholly-owned subsidiary Gold Basin Resources (Arizona) Inc.,
(“GBR (US)”) pursuant to a Purchase and Sale Agreement made as of September 3, 2020 among GBR (then
Fiorentina Minerals Inc.), GBR (US), and Aurum Exploration Inc. (“Aurum”). All of Aurum's right, title and
interest in the 290 unpatented federal mining claims which comprise the bulk of the Project area was
transferred to GBR (US) by Quitclaim Deed on September 14, 2020.
Geology and Mineralization
Bedrock in the Project area is primarily comprised of Precambrian gneiss and rapakivi-like granite, and a
Cretaceous two-mica granite. The Precambrian ‘gneiss’ includes well-foliated, quartzo-feldspathic gneiss,
muscovite biotite schist, and amphibolite. Intruding the gneiss is a rapakivi-like granite that contains large
(up to 5 cm) pink alkali feldspar phenocrysts in a matrix of quartz, hornblende, and biotite. The Precambrian
and Cretaceous rocks are both cut by the Cyclopic detachment fault, the southernmost extension of the
regional South Virgin-White River detachment. The Cyclopic detachment consists of at least two low-angle
normal faults that strike northwest and dip generally less than 20° southwest. The fault contains
Precambrian crystalline rocks in both its hanging wall and footwall and locally cuts the Cretaceous two-mica
granite.
Gold Basin Resources Corporation NI 43-101 Technical Report
Gold Basin Project Executive Summary
LC280360-1
February 25, 2021 2
The Cyclopic detachment fault is the most dominant structural feature in the Gold Basin district, and it is
presently thought to be the primary district-scale control over gold mineralization. Gold grade and
distribution at Gold Basin are primarily controlled by structure, specifically the series of near-horizontal
detachment fault planes cutting the Precambrian gneissic basement. Gold mineralization is localized within
brecciated, gouged, and shattered zones which range in thickness from 1m to 30m. Based on the drill data,
at least four separate detachment planes occur within a package of stacked shears with an aggregate
thickness of about 200m, though at present only two of these planes are known to be important with respect
to gold occurrence.
Gold mineralization is the result of a low sulfidation and shallow epithermal depositional system. Sulfide is
recorded in several holes but is typically not present above depths of 100 to 200m. Alteration products consist
of hematitic clay and silica, although carbonate veining/alteration in several holes at Stealth and Red Cloud
is associated with the highest-grade drill intervals and may be indicative of boiling. The mineralized zones
have fairly well-defined tops and bottoms, which is typical of shallow, hydrostatically open, epithermal
systems.
Status of Exploration
Over the past four decades, roughly fifteen different operators have completed approximately 40,312m of
drilling in a total of 587 drillholes throughout the Gold Basin Project area. During that same time frame, the
Project has been subject to a variety of other exploration activities, including soil, rock, and trench sampling,
geologic mapping, and ground and air magnetic surveys.
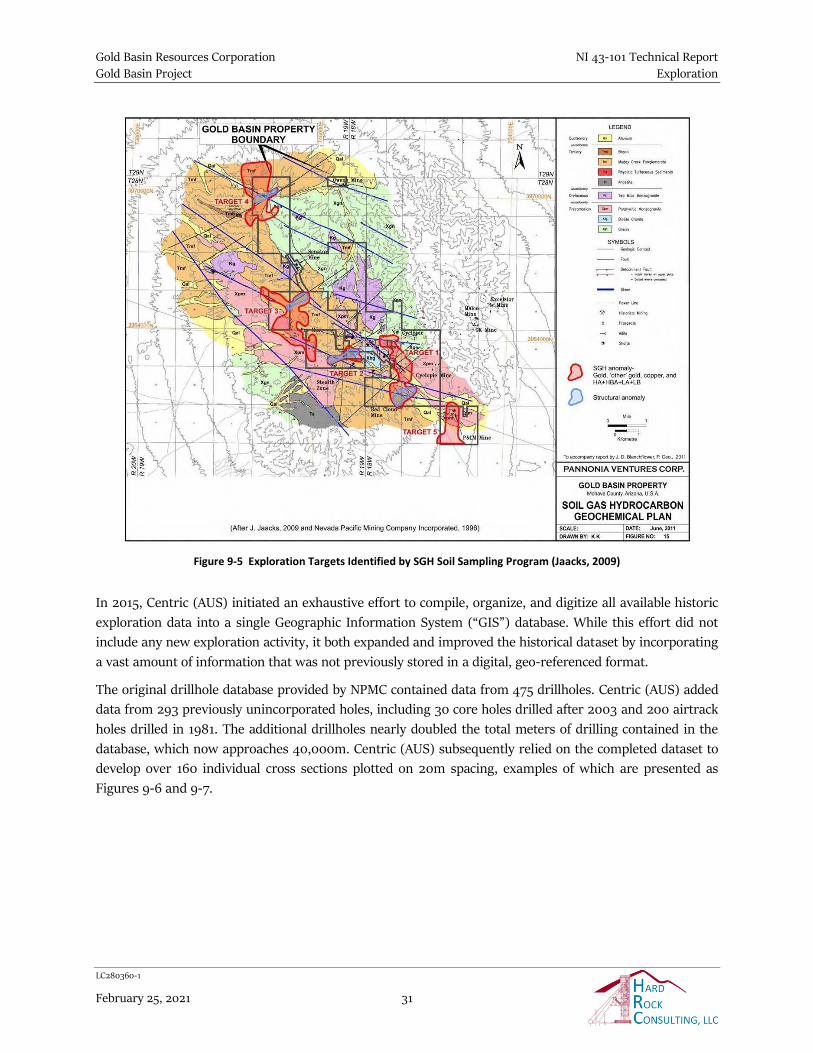
In 2015, Centric Mineral Management Pty. Inc.( “Centric (AUS)” initiated an exhaustive effort to compile,
organize, and digitize all available historic exploration data into a single Geographic Information System
(“GIS”) database. While this effort did not include any new exploration activity, it both expanded and
improved the historical dataset by incorporating a vast amount of information that was not previously stored
in a digital, geo-referenced format.
Based in part on the results of Centric (AUS)’s work, GBR initiated an 88-hole (subsequently expanded to
120-hole), reverse circulation drilling program in the fall of 2020. That drilling is currently underway and is
intended to increase the density of drilling and quality of data in the Cyclopic and Cyclopic NW target areas
to a degree sufficient to support estimation of mineral resources in accordance with the definitions and
Standards of Disclosure prescribed by NI 43-101.
Mineral Resource Estimate
GBR is not reporting a current mineral resource estimate for the Gold Basin Project at this time. A historical
mineral resource estimate was prepared in October 2019, prior to GBR’s acquisition of the Project, by Robin
A. Rankin, MSc DIC MAusIMM (CPGeo) of GeoRes. While the 2019 mineral resource estimate was publicly
disclosed in JORC format, it relied largely on historic data which at present lacks sufficient supporting
documentation and detail for proper validation as required of NI 43-101. GBR intends to prepare and report
a mineral resource estimate in accordance with NI 43-101 for the Gold Basin Project following an on-going,
comprehensive data validation effort, and following completion of the drilling exploration in progress at the
time of this report.
Gold Basin Resources Corporation NI 43-101 Technical Report
Gold Basin Project Executive Summary
LC280360-1
February 25, 2021 3
A qualified person has not done sufficient work to classify the 2019 estimate as current mineral resources or
mineral reserves, and GBR is not treating the historical estimate as current mineral resources or mineral
reserves.
Conclusions and Recommendations
HRC concludes that GBR has thorough understanding of the geology of the Gold Basin Project, and that the
appropriate deposit model is being applied for exploration. The conceptual geologic model is sound, and in
conjunction with drilling results, indicates that potential exists to increase the extent of known mineralized
areas with additional drilling.
During the on-site inspection in January 2021, HRC’s (QP) representative conducted general geologic field
reconnaissance, including inspection of bedrock exposures and other surficial geologic features, ground-
truthing of reported drill collar and trench sample locations, and superficial examination of historic mine
workings. Field observations during the site visit generally confirm previous reports on the geology of the
Project area. Bedrock lithologies, alteration types, and significant structural features are all consistent with
descriptions provided in existing Project reports, and the author did not see any evidence in the field that
might significantly alter or refute the current interpretation of the local geologic setting or the conceptual
geologic model on which exploration is based.
GBR’s routine RC sample collection, preparation, analytical procedures, and security measures are, in
general, considered reasonable and adequate to ensure the validity and integrity of the data derived from
GBR’s sampling programs. Samples prepared for transport to the laboratory are bagged and labelled in a
manner which inhibits tampering, and all samples remain in GBR control until released to commercial
transport in Kingman. GBR’s current internal QA/QC program incorporates standard, blank, and field
duplicate samples as well as occasional check (lab) sampling. HRC is of the opinion that drillhole data
gathered during GBR’s on-going drilling program will, together with historic drilling data, result in a total
dataset of sufficient quality and quantity to support estimation of mineral resources according to NI 43-101
mineral resource classification definitions.
During the course of this study, HRC made a number of observations regarding data handling, document
management, and general drilling and sampling procedures and protocols for which modifications and/or
improvements could positively affect the level of confidence in the drillhole data and subsequent mineral
resource estimations. Based on these observations, HRC recommends that GBR carry out the following:
• An in-house effort to compile, organize, prioritize, digitize, and validate presently unavailable hard-copy historic data and documents.
• Production and implementation of formal and specific written protocols with regard to both wet and dry reverse circulation drilling, diamond core drilling, sampling methods and sample handling procedures, and geologic logging.
• Production and implementation of formal data management and document handling procedures with regard to exploration; specifically, written guidelines and prepared templates for the collection and organization of exploration data in order to ensure that all pertinent information is captured and catalogued in a practical and efficient manner for ease of future use.
Gold Basin Resources Corporation NI 43-101 Technical Report
Gold Basin Project Executive Summary
LC280360-1
February 25, 2021 4
• Standardization of quality assurance-quality control procedures including collection of field duplicate, blank, and standard samples, comparison checks between different drill contractors and types of drilling, comparison checks between lithology logs recorded by different exploration staff, review of core recoveries versus grade, review of RC data for potential downhole
contamination, and selection and review of downhole survey methods and measurements, etc.
• HRC recommends that QA/QC analysis be conducted on an on-going basis, including consistent acceptance/rejection tests. Each round of QA/QC analysis should be documented, and reports should include a discussion of the results and any corrective actions taken. HRC further recommends that retained samples presently stored on-site be transported to a secure, local
storage facility, both as an added security measure and in order to comply with BLM permit regulations.
• HRC recommends, where possible, the professional survey of historic and future collar locations in the Cyclopic, Cyclopic NW, and Stealth areas and any other areas under consideration for
mineral resource estimation.
• Drillholes with depths greater than 120 meters should be surveyed down-hole.
• Core drilling is recommended in the Cyclopic and Cyclopic NW target areas to confirm grade and thickness of the detachment faults and to better define lithologic units.
1.6.1 Recommended Work Plan and Budget
Following completion of the on-going drill program, HRC recommends that GBR complete additional RC in-
fill and definition drilling in both the Cyclopic and Cyclopic NW target areas. The number and distribution of
future RC drill holes will depend in part on the results of the on-going drill program, but HRC anticipates
that roughly 6,000 ft of additional RC drilling will be sufficient, in conjunction with existing drillhole data,
to define the limits and distribution of mineralization and to potentially support upgrade of future mineral
resource classifications. HRC also recommends approximately 1,800 ft of PQ diamond core drilling, both to
confirm the thickness and grades of the detachment fault zones at Cyclopic and Cyclopic NW, and to provide
sample material necessary for preliminary metallurgical testing. Metallurgical samples should be collected
from both the Cyclopic and Cyclopic NW resource to obtain information representative of the overall deposit.
HRC anticipates that metallurgical testwork will include both bottle roll and column testing in order to gather
recovery data for a heap leach scenario. HRC’s recommended work plan also includes a detailed topographic
survey of the full Project area as well as preparation of a mineral resource estimate classified according to
CIM definition standards and suitable for public disclosure. The anticipated costs for the recommended scope
of work are presented in Table 1-1.
Table 1-1 Estimated Cost for Recommended Scope of Work
Recommended Scope of Work Expected Cost (US$) Expected Cost (CD$)
RC Definition and In-fill Drilling $135,000 $171,435
Diamond Core Drilling $80,000 $101,590
Metallurgical Testwork $80,000 $101,590
Detailed Topographic Survey $10,000 $12,700
Mineral Resource Estimate $40,000 $50,795
Gold Basin Resources Corporation NI 43-101 Technical Report
Gold Basin Project Executive Summary
LC280360-1
February 25, 2021 5
Subtotal $345,000 $438,110
15% Contingency $51,750 $65,717
Total Budget $396,750 $503,827
Gold Basin Resources Corporation NI 43-101 Technical Report
Gold Basin Project Introduction
LC280360-1
February 25, 2021 6
2. INTRODUCTION
Issuer and Terms of Reference
Gold Basin Resources Corporation (“GBR”, CSE:GXX) is a precious and base metals exploration company
engaged in the acquisition, exploration, and development of North American mineral properties. Gold Basin
has retained Hard Rock Consulting LLC (“HRC”) to prepare a technical report on geology and exploration for
the Gold Basin Project (“Gold Basin Project” or the “Project”), a historically productive oxide gold property
located within the Gold Basin mining district of Mohave County, Arizona.
This report presents the results of HRC’s efforts and is intended to fulfill the reporting Standards of
Disclosure for Mineral Projects according to Canadian National Instrument 43-101 (“NI 43-101”). This report
was prepared in accordance with the requirements and guidelines set forth in Companion Policy 43-101CP
and Form 43-101F1. The conclusions and interpretations presented herein are based on all available technical
data and information as of February 5, 2021, the effective date of this report.
Items 15 through 22 of Form 43-101F1 (Mineral Reserve Estimates, Mining Methods, Recovery Methods,
Project Infrastructure, Market Studies and Contracts, Environmental Studies, Permitting and Social or
Community Impact, Capital and Operating Costs, and Economic Analysis, respectively) are not required of a
technical report for a property that is not an “advanced property” as that term is defined in NI 43-101, and
as such are not considered in this report.
Sources of Information
A portion of the background and technical information presented in this report was obtained from the
following documents:
• Blanchflower, J.D., 2011. Amended Technical Report on the Gold Basin Property, Gold Basin Mining District, Mojave County, Arizona; NI 43-101 Technical Report prepared for Pannonia Ventures Corp., October 2011.
• Straw, C., Herron, C., 2015. Technical Interpretation and Exploration Targets Report, Gold Basin Project, Arizona, U.S.A.; Internal report prepared for Centric Minerals Management Pty Ltd., October 2015.
The information contained in current report Sections 4 through 8 was largely presented in, and in some
cases is excerpted directly from, the reports listed above. HRC has reviewed this material in detail, and finds
the information contained herein to be factual and appropriate with respect to guidance provided by NI 43-
101 and associated Form NI 43-101F1.
Gold Basin Resources Corporation NI 43-101 Technical Report
Gold Basin Project Introduction
LC280360-1
February 25, 2021 7
Additional information was requested from and provided by GBR. In preparing Sections 9 through 13 of this
report, the authors have sourced information from historical documents including exploration reports,
technical papers, sample descriptions, assay results, computer data, maps and drill logs generated by
previous operators and associated third party consultants. Historical documents and data sources used
during the preparation of this report are cited in the text, as appropriate, and are summarized in Section 19.
Qualified Persons and Personal Inspection
This report is endorsed by the following Qualified Persons (QP), as defined by NI 43-101: Ms. J.J. Brown, P.G.,
Mr. Jeffrey Choquette, P.E., and Mr. Richard Schwering, P.G., all of HRC.
Mr. Schwering, P.G., SME-RM, has nearly 10 years of combined experience in mineral exploration and
geologic consulting, including a variety of project work specifically related to structurally controlled gold and
silver resources and reserves. Mr. Schwering is specifically responsible for report Sections 1, 10 through 12
and 14.
Ms. Brown, P.G., SME-RM, has more than 20 years of professional experience as a consulting geologist,
including 10 years of geologic and geotechnical exploration, analysis, and reporting associated with mineral
resource development. Ms. Brown is a licensed Professional Geologist in the states of Idaho and Wyoming
and is recognized as a QP with regard to geology and mineral resources according to United States, Canadian
(NI 43-101), Australian (JORC), and South African (SAMREC) standards. She has conducted site inspection,
geologic field reconnaissance, and data verification as an independent QP for a variety of gold, silver, and
multiple commodity projects throughout the western U.S., Mexico, Europe, and South America. Ms. Brown
is specifically responsible for report Sections 1 through 9 and 15 through 19.
Mr. Choquette, P.E., is a professional mining engineer with more than 20 years of domestic and international
experience in mine operations, mine engineering, project evaluation and financial analysis, and has
contributed to industrial minerals, base metals, and precious metals mining projects around the world. Mr.
Choquette is responsible for current report Section 13.
HRC representative and QP J.J. Brown conducted an on-site inspection of the Gold Basin Project on January 5
and 6, 2021. While on site, Ms. Brown conducted general site and geologic field reconnaissance including
observation of the on-going drilling program, examination of surface bedrock exposures, and ground-
truthing of reported drill collar locations. Ms. Brown also reviewed with Gold Basin geology staff the
conceptual geologic model, data entry and document management protocols, and drilling and sampling
procedures and associated quality assurance and quality control (“QA/QC”) methods presently employed.
Units of Measure
Unless otherwise stated, all measurements reported herein are Imperial units and currencies are expressed
in constant 2021 US dollars (“US$”). Gold and silver values are reported in parts per million (“ppm”) or in
Troy ounces per ton (“oz/T”). Tonnage is reported as metric tonnes (“t”), unless otherwise specified.
Gold Basin Resources Corporation NI 43-101 Technical Report
Gold Basin Project Reliance on Other Experts
LC280360-1
February 25, 2021 8
3. RELIANCE ON OTHER EXPERTS
HRC has fully relied upon and disclaims responsibility for non-technical information provided by Gold Basin
regarding property ownership, mineral tenure, and permitting and environmental aspects of the Gold Basin
Project. Such information is presented in Section 4 of this report. Property title and mineral tenure details
were provided by Mr. Charles Straw, Gold Basin Executive Director and V.P. Exploration, through personal
communication on December 15, 2020, and in written format via the following documents:
• Purchase and Sale Agreement (among Fiorentina Minerals Inc. (now Gold Basin Resources
Corporation), Aurum Exploration Inc. and Gold Basin Resources (Arizona) Inc.), September 3, 2020.
• Certificate of Change of Name (name change of Fiorentina Minerals Inc. to Gold Basin Resources Corporation), September 11, 2020.
• Notice of Transfer of Interest (from Aurum Exploration Inc. to Gold Basin Resources (Arizona) Inc.), September 14, 2020.
A portion of the environmental and permitting information presented Section 4 is taken from the following
documents:
• Gold Basin Arizona, Cyclopic and Stealth Prospects, Order of Magnitude Estimate; Internal report
prepared by Nevada Pacific Mining Company, Incorporated, August 1997.
• Arizona Department of Mines and Mineral Resources Mining Collection, AZMILS Data File,
including Public Notice No. 14-96AZAP (Notice of Preliminary Decision to Issue an Individual Aquifer Protection Permit, Aquifer Protection Permit No. P-I02956); Arizona Department of Mines and Mineral Resources file data, printed February 2003.
Additional information regarding environmental and permitting aspects of the Gold Basin Project was
obtained through personal communication with Mr. Cal Herron, Gold Basin Project Geologist, on January 6,
2021.
Gold Basin Resources Corporation NI 43-101 Technical Report
Gold Basin Project Property Description and Location
LC280360-1
February 25, 2021 9
4. PROPERTY DESCRIPTION AND LOCATION
Project Location and Ownership
The Gold Basin Project is located approximately 70 miles southeast of Las Vegas, Nevada, and 50 miles
northwest of Kingman, Arizona, in the Gold Basin mining district of Mohave County, Arizona, U.S.A. (Figure
4-1). The Project area is situated among the southeastern White Hills, south of Lake Mead and west of the
Grand Wash Cliffs, which mark the southwestern boundary of the Colorado Plateau. The approximate
geographic center of the Project area is located at 35˚48’N latitude and 114˚14’W longitude (N3,963,278m,
E748,824m; WGS84, UTM Zone 11S). Map coverage of the Project area is provided by the 1:24,000-scale Gold
Basin and Senator Mountain 7.5-minute U.S.G.S. Topographic Quadrangles.
Figure 4-1 Gold Basin Project Location
GBR owns 100% of the Project through its wholly-owned subsidiary Gold Basin Resources (Arizona) Inc.,
(“GBR (US)”) pursuant to a Purchase and Sale Agreement made as of September 3, 2020 among GBR (then
Fiorentina Minerals Inc.), GBR (US), and Aurum Exploration Inc. (“Aurum”). All of Aurum's right, title and
interest in the 290 unpatented federal mining claims which comprise the bulk of the Project area was
transferred to GBR (US) by Quitclaim Deed on September 14, 2020.
Gold Basin Resources Corporation NI 43-101 Technical Report
Gold Basin Project Property Description and Location
LC280360-1
February 25, 2021 10
Mineral Tenure, Agreements and Encumbrances
The Project area is comprised of 5 split estate mineral rights (2,389 acres) and 290 unpatented federal mining
claims (5,280 acres), which together total approximately 7,669 acres (roughly 12 mi2) of land surface. The
mineral holdings occupy all or portions of: T27NR18W, Section 3; T28NR18W, Sections 19, 29, 30, 31 and 32;
and T28NR19W, Sections 1, 3, 10, 12, 15, 16, 17, 22, 24, 25 and 26 (Figure 4-2).
An annual assessment fee of $140 is required for each of the unpatented mining claims (currently paid in full
for the 2021 calendar year).
The 290 unpatented federal mining claims are also subject to a 1% Gross Returns Royalty (the “Centric
Royalty”) held by Centric Minerals Management Pty. Ltd. (“Centric (AUS)”) pursuant to a Gross Returns
Royalty Agreement dated as of January 1, 2020 between Aurum and Centric (AUS) (the “Royalty
Agreement”). The Royalty Agreement was assigned to GBR (US) by Aurum pursuant to an assignment and
assumption agreement made effective as of September 14, 2020 among Aurum, GBR ( US) and Centric (AUS),
whereby Aurum assigned all of its right, title, benefit and interest in the Royalty Agreement to GBR (US) and
GBR (US) assumed all of Aurum's obligations thereunder, including the payment of the Centric Royalty
thereunder.
The split estate mineral rights are subject to a perpetual production royalty held by Newmont Corporation
of 3.5% gross returns from the sale or other disposition of all metals and minerals produced from those
portions of the Project area previously owned by Sante Fe Pacific Railroad Company (Gold Basin Private
Lands and Minerals, Figure 4-2) pursuant to the terms of an Option Agreement entered into by Sante Fe
Pacific Railroad Company and Aurumbank Incorporated as of February 9, 2004.
HRC is not aware of any other royalties, back-in rights, payments, or other agreements or encumbrances
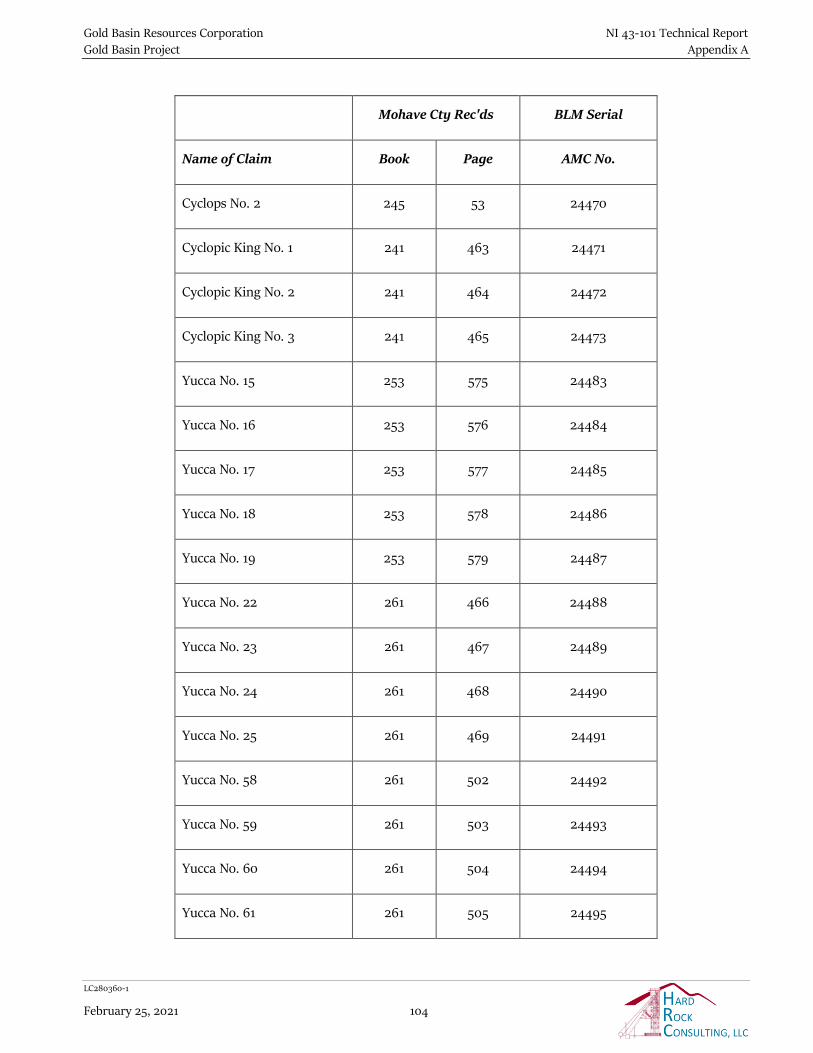
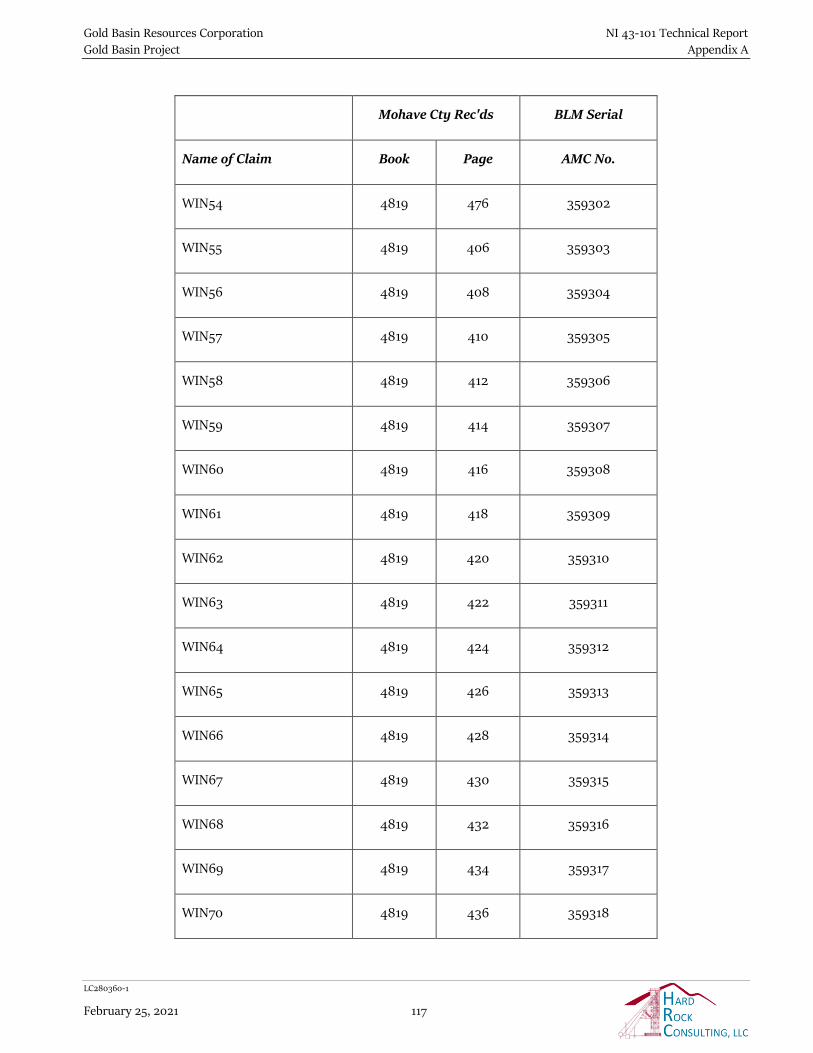
that the Project is subject to. Pertinent mining claim details, including names and serial numbers, are
tabulated in Appendix A.
Gold Basin Resources Corporation NI 43-101 Technical Report
Gold Basin Project Property Description and Location
LC280360-1
February 25, 2021 11
Figure 4-2 GBR Mineral Holdings, Gold Basin Project
Permitting and Environmental Liabilities
4.3.1 Permitting
Mining activities on private lands within the State of Arizona are regulated by both the Arizona Department
of Environmental Quality (“ADEQ”) and the Arizona State Mine Inspector (“ASMI”). Mining activities carried
out on federal lands typically fall under the primary regulatory authority of the Bureau of Land Management
(“BLM”). Drilling operations are presently underway at the Gold Basin Project in accordance with a Notice
of Intent to Explore (43 CFR 3809.309 Notice) approved by the BLM Kingman Field Office, in August of 2020.
All on-going exploration activity is being carried out on federal land surface, and no other federal, state, or
local permits are required or are active or in progress on behalf of GBR at this time. Permit requirements for
future exploration programs and development work will depend largely on the scope and location of the
proposed activities.
In 1994, Nevada Pacific Mining Company (“NPMC”) initiated plans to develop an open pit mine and heap
leach recovery operation at the site of the old Cyclopic mine, which is centrally located within the Gold Basin
Project area. In support of that effort, NPMC carried out several baseline environmental studies and
subsequently completed and filed associated permit applications with appropriate federal, state, and county
Gold Basin Resources Corporation NI 43-101 Technical Report
Gold Basin Project Property Description and Location
LC280360-1
February 25, 2021 12
authorizing agencies. NPMC (1997) reported no opposition to the applications from either the public or the
regulatory agencies, and no extraordinary environmental mitigation measures were imposed by the
permitting agencies at that time. The following list of permits held by NPMC in 1997 is presented as an
example of the type and number of permits that future development of the Gold Basin Project might require:
• Bureau of Land Management (BLM) - Mine Plan of Operations • U. S Army Corps of Engineers - (COE) 404 Dredge and Fill Permit • Department of Treasury Bureau of Alcohol, Tobacco, and Firearms - Explosives Permit • Department of Labor, Mine Safety, and Health Administration - Operational Health and Safety
Permit • ADEQ Water Quality - 401 Storm Water Permit • ADEQ Air Quality - Air Quality Control Permit • ADEQ Aquifer Protection - Aquifer Protection Permit • Arizona Department of Water Resources - Water Well Drill Registration
• Local Mohave County - Mining Zoning
While all of these permits are long expired, some of the baseline environmental work completed to support
them might still be applicable to the Project today. Reports completed (and reportedly available at the
operations office of NPMC as of August 6, 1997) in support of NPMC’s permitting effort include:
• Base Line Hydrology Study • Base Line Wildlife Study
• Base Line Vegetation Study • Cultural Resource Inventory
• Cultural Resource Recovery Plan
Given the length of time that has passed, future permitting at Gold Basin will likely require re-completion of
one or more of the studies listed above. Regardless, HRC recommends that GBR make every effort to locate
and digitize these documents, as they surely contain pertinent historical information and should provide a
valuable reference if and when additional studies are undertaken.
4.3.2 Environmental Liabilities
There are numerous historic excavations, prospect pits, and shafts within the Project area, as well as a
number of associated waste rock dumps, access roads, and tailings dumps. It is not clear at present if the
historic workings pose a potential environmental liability to the Project, nor if or to what extent GBR might
be responsible for their reclamation. HRC recommends that GBR initiate a discussion with ADEQ on this
subject within the reasonably near future, and certainly prior to any significant future development work on
the property.
The Gold Basin Project is not subject to any other known existing or potential environmental liabilities, and
HRC knows of no other significant factors or risks which might impact GBR’s access, title to, or right or
ability to perform work on the property.
Gold Basin Resources Corporation NI 43-101 Technical Report
Gold Basin Project Accessibility, Climate, Local Resources, Infrastructure and Physiography
LC280360-1
February 25, 2021 13
5. ACCESSIBILITY, CLIMATE, LOCAL RESOURCES, INFRASTRUCTURE AND PHYSIOGRAPHY
Access and Climate
The Gold Basin Project is readily accessible from both Las Vegas, Nevada and Kingman, Arizona via Interstate
Highway 93 to Pierce Ferry Road. The primary Project access road, BLM Road 9748, extends to the west from
Pierce Ferry Road immediately past mile marker 17 (northeast of Highway 93). BLM Road 9748 is a well-
used but largely unimproved gravel road that turns into BLM Road 9761 within about a mile of the Project
area. Local access throughout the Project area, including to old workings and drill pads, is provided by an
assortment of secondary gravel roads and jeep trails, most of which are suitable for two-wheel drive vehicles.
The local climate is semi-arid to arid, characterized by low precipitation, high evaporation, and wide daily
temperature fluctuations. Annual precipitation averages 12 inches and annual pan evaporation averages
108.59 inches. Surface water is limited to ephemeral lakes and occasional significant, storm-related runoff.
The 100-year, 24-hour storm event is estimated at 4.0 inches of rain (NPMC, 1997). Exploration work can be
carried out year-round, though local flooding during heavy rains in the late summer months can occasionally
limit access to and throughout the Project site for short periods of time.
Local Resources and Infrastructure
The community nearest to the Project area is the town of Dolan Springs, which hosts a population of about
2,000. Dolan Springs offers standard municipal amenities including lodging and services, and a limited
supply of foodstuffs and hardware. The nearest major supply centers are Kingman, Arizona, roughly 50 miles
to the southeast of the Project area, and Las Vegas, Nevada, 70 miles to the northwest. Domestic air and rail
service are both available in Kingman, which is served by the Kingman Airport and the BNSF Railway.
International air service is available from the McCarran International Airport in Las Vegas. Ample skilled and
unskilled labor can be found in both Kingman and Las Vegas, as well as numerous smaller communities
throughout the region.
Surface rights are presently sufficient to support all presently proposed exploration and mining activities,
including future tailings and waste storage areas and processing facilities. Existing infrastructure in the
immediate vicinity of the Project area is limited to the local network of roads and trails, a single 2,500-gallon
water tank, and the 345-kV Mead-Peacock transmission line that transects the far southern portion of the
property. Local, low-usage electrical power is available from a Citizens Utility Company three-phase line
along the Pierce Ferry Road. Approximately 6 miles of new power line construction would be required to
bring electrical power to the Project site.
There is currently no ready source of fresh water within the Project area. Any fresh water required for future
exploration or development will either need to be purchased from a local, private or municipal water source,
or to be drawn from a successful well yet to be drilled on-site. Any future mine development would require
a water well(s) capable of providing a minimum of 200 gallons per minute of water to a sizeable on-site
water storage facility.
Gold Basin Resources Corporation NI 43-101 Technical Report
Gold Basin Project Accessibility, Climate, Local Resources, Infrastructure and Physiography
LC280360-1
February 25, 2021 14
Physiography
The Project area is located along the northern edge of the Southern Basin and Range geo-physiographic
province, roughly 10 miles west of the western edge of the Colorado Plateau. Regional relief is about 4,500
feet, varying from about 5,500 feet (amsl) on the Colorado Plateau to approximately 1,000 feet in the lowest
valley bottoms. The Project area is bounded to the west by the White Hills, which rise to an elevation of 5,127
feet at Senator Mountain, and to the east by the Hualapai Basin. Local terrain consists of rolling, rounded
hills to flat or gently sloping, alluvial-filled valleys. The valley floors generally are covered with sparse desert
vegetation, owing to the hot temperatures and limited precipitation. Hillslopes and higher elevations, where
temperatures are cooler and precipitation is greater, are variously covered by shrubs, Joshua trees, mesquite,
and grasses. Bedrock exposures represent between five to ten percent of the Project surface area, and are
generally restricted to ridge tops, incised drainages, road cuts and other excavations.
Gold Basin Resources Corporation NI 43-101 Technical Report
Gold Basin Project History
LC280360-1
February 25, 2021 15
6. HISTORY
Historical Ownership, Exploration and Development
A number of public reports describe the early history of the Gold Basin Project and greater Gold Basin mining
district in more detail than is presented here. The reader is directed to Theodore, et. al (1987) and Myers and
Smith (1986) for a more thorough discussion of the early (late 1800’s – 1980) history of the Project and
surrounding area. The following paragraphs provide a summary of the salient aspects of the historical
ownership, exploration, and development of the Gold Basin Project. Unless otherwise noted, the exploration
and development activities described below were carried out within the modern-day Project boundary:
• The Cyclopic Gold Mining Company purchased the Cyclopic mine in 1904, and in 1905 constructed a 40 ton-per-day cyanide mill along a wash just below the mine site. Mining was carried out over the next several years, though apparently had ceased by about 1917. Intermittent production began again at the Cyclopic in 1919. The old mill was remodeled in 1923, after the mine was taken over by the Gold Basin Exploration Company.
• In 1926, a new ore body was discovered, and the daily capacity of the mill was increased to 100 tons. The mine was inactive in the late 1920’s, but productive again between 1932 and 1934, when the shallow underground workings were abandoned in favor of a large-volume open cut operation. By late 1933, the cyanide mill operated at a daily capacity of 125 tons, and a total of about 40 men were employed at the mine and mill. Much of the ore mined in 1934 reportedly
averaged 0.2 oz gold per ton (Wilson and others, 1934, p. 77).
• The Cyclopic property was acquired by Manta de Oro Mines, Inc. in 1936, and the mine produced somewhat steadily from that time through 1940. Mining activity had waned by 1941, and the mine became dormant shortly after. By the 1980’s, the mine site was completely abandoned, and all mine buildings gone.
• In 1983 U.S. Borax acquired the Cyclopic mine property and carried out a program of geological mapping, geochemical sampling, and drilling of 16 widely spaced holes. The U.S. Borax
exploration program was directed at the possible occurrence of a large, laterally extensive, bulk tonnage gold deposit in the detachment fault zone of the Cyclopic mine.
• In the mid-1980’s both Amoco and Molycorp carried out drilling programs on their respective
properties between the Cyclopic and Owens mines. Their efforts were directed at gold-bearing vein mineralization hosted in the basement metamorphic and plutonic country rocks.
• Mr. Alan Brown and his associates investigated the Cyclopic mine and surrounding area in 1986 and formed a joint venture soon after with the then owner of the Cyclopic mine. Brown’s company carried out geological mapping, sampling, and trenching in and around the Cyclopic mine workings. The property was returned to the owner in late 1989.
• The mining claims covering the Cyclopic and Stealth mine sites were leased by Cambior Inc. in
1990. According to NPMC (2008), Cambior conducted soil and rock geochemical surveys and later drilled at least four RC drillholes, one hole at the Stealth mine site and three holes at the Cyclopic
mine site.
Gold Basin Resources Corporation NI 43-101 Technical Report
Gold Basin Project History
LC280360-1
February 25, 2021 16
• Toltec Resources Ltd. (‘Toltec’) leased the unpatented mining claims immediately west of the Cyclopic mine site in 1988. Through 1990, Toltec carried out detailed geologic mapping, sampling, and drilling programs resulting in delineation of two primary exploration targets.
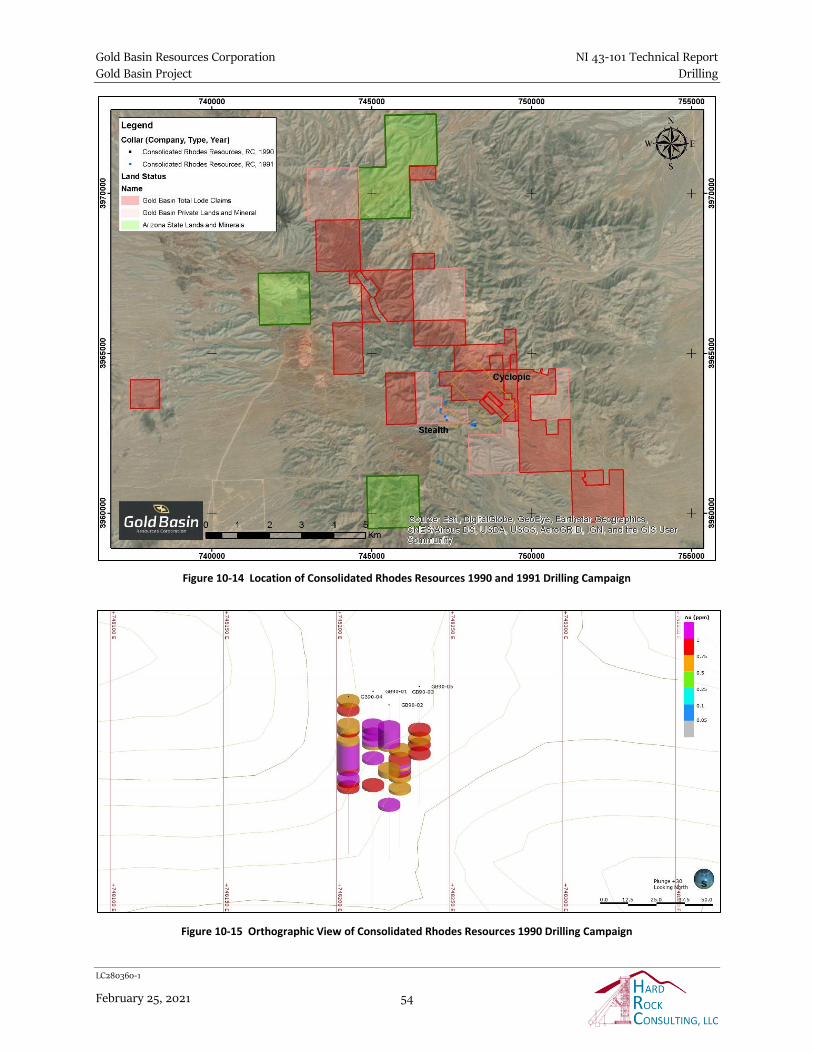
• Consolidated Rhodes acquired the Toltec’s mineral interests in October 1990 (Ahern et al., 1992). In late 1990 and early 1991, Prime Explorations, the exploration arm of Prime Equities, owner of Consolidated Rhodes, conducted magnetic and VLF surveys in addition to trenching, sampling, and drilling 25 RC drillholes throughout the claim area.
• Western States Minerals Corporation (‘WSMC’) leased the mineral rights covering the Stealth
mine in 1994, and by late 1995 had drilled 71 reverse circulation holes totaling 19,605 feet in the Stealth resource area.
• NPMC optioned the Stealth mineral holdings from WSMC in late 1995, and between 1995 and 1997 carried out several RC drilling and trenching programs to better define the occurrence and orientation of structurally-controlled gold mineralization in the Cyclopic mine resource area. In
conjunction with drilling, NPMC commissioned a number of baseline environmental studies to
support federal, state, and county permit applications. In 1997, with all necessary permits in hand, NPMC completed an Order of Magnitude study detailing the preliminary economic factors required to develop an open pit, heap leach operation near the old Cyclopic mine site.
• Aurumbank Incorporated (“Aurumbank”) acquired NPMC’s land holdings in 1999, and in 2003,
through its wholly-owned subsidiary Watering Hole Productions (“WHP”), re-staked unpatented
mining claims on 5,200 acres of surrounding BLM land surface. Aurumbank further increased their land position with the purchase of five privately owned parcels, previously held by Santa Fe Pacific Gold. These parcels range in size from 320 to 640 acres, and together with the unpatented
claims controlled by Aurumbank at that time, complete the modern-day Project area.
• Aurumbank conducted soil sampling, trenching and later diamond drilling in the northern portion of the Project area in 2007, and in 2008 initiated an extensive soil geochemical sampling
program over a variety of exploration targets throughout the property.
• Pannonia Ventures Corporation (“Pannonia”) entered an Option Agreement with Aurumbank, NPMC, and WHP in June 2011, and shortly after retained Minorex Consulting Ltd to complete a
“comprehensive review of the exploration activities on the property”, the results of which are presented in a NI 43-101 Technical Report (Blanchflower, 2011). It is not clear if Pannonia conducted any exploration during their involvement with the Project, as no associated records are known to exist. Pannonia apparently failed to fulfill the terms of the Option Agreement and ceased involvement in the Project as of 2013.
• Centric (AUS) entered a Memorandum of Understanding (MOU) with Aurumbank, NPMC, and WHP in 2014, the terms of which granted Centric (AUS) the opportunity to earn 50% ownership of the Project by spending $2 million over a 3-year period. Over the following three years, Centric (AUS) conducted field exploration and mapping and developed a comprehensive GIS database incorporating all available historical sample data. Subsequent to the MOU, Aurumbank, NPMC
and WHP assigned and transferred all of their rights, title and interest in and to the Project to Aurum Exploration Inc. ("Aurum").
Gold Basin Resources Corporation NI 43-101 Technical Report
Gold Basin Project History
LC280360-1
February 25, 2021 17
• In 2018, Centric (AUS) and Aurum entered into a farm-in agreement, as amended (“Farm-in Agreement”), whereby Centric (AUS) was granted an option to earn a 50.1% in the Project.
• In 2018, Greenvale Energy Limited (“GRV”) spent $550,000 to earn effectively half of Centric (AUS)'s earn-in, resulting in a Project ownership split of approximately Centric (AUS) 25.04%, GRV 25.06%, and Aurum 49.90%. In 2019, Centric (AUS) completed a 33-hole RC drilling program and commissioned preparation of a JORC mineral resource estimate (Rankin, 2019).
• In 2020, GBR negotiated the consolidation of Project ownership and acquisition by GBR of a 100%
interest in and to the Project. As a result of these negotiations, Centric (AUS) and GRV relinquished all of their right, title and interest in the Project in favor of Aurum, the underlying Project owner.
• Pursuant to the Purchase and Sale Agreement dated September 3, 2020, GBR, through its wholly-owned subsidiary, became the sole owner of the Gold Basin Project subject to the royalties
discussed elsewhere in this report.
Historical Estimates
Mineral resource and reserve estimates produced prior to GBR’s acquisition of the Gold Basin Project are not
discussed in this report as they are historical in nature, were not completed according to current NI 43-101
reporting requirements and are not considered reliable or relevant to the Project at present.
Historical Production
Historically, the Cyclopic mine is one of the oldest and most productive in the Gold Basin district, reportedly
producing over 4,000 oz of gold from the 1890s through 1938 (Theodore et al., 1982). Original work at the
mine was in shallow underground workings, but the last episode of mining, from 1938 to 1942, is associated
with two shallow open pits. Other historic mines and prospects within the Project area are known to have
produced some amount of gold, but no associated production records are presently available.
Gold Basin Resources Corporation NI 43-101 Technical Report
Gold Basin Project Geological Setting and Mineralization
LC280360-1
February 25, 2021 18
7. GEOLOGICAL SETTING AND MINERALIZATION
Regional Geologic Setting
The Gold Basin mining district is regionally located in the northernmost portion of the Sonoran Desert sub-
province of the greater Basin and Range geo-physiographic province of western North America (Bedinger et.
al, 1985). The Basin and Range is characterized by generally north-south trending, block faulted mountain
ranges separated by alluvium-filled valleys. Topographic relief varies from 1,500 feet to in excess of 5,000
vertical feet, and structural relief commonly exceeds topographic relief. The Sonoran Desert sub-province
includes basins in California, Nevada, and Arizona, many of which have surface drainage to the Colorado
River. The surrounding mountain ranges are faulted blocks of Precambrian intrusive and metamorphic rocks,
Mesozoic and Tertiary granitic intrusions, and volcanic rocks. Basin fill, as thick as 3,000 meters (10,000
feet) and perhaps averaging 900 meters (3,000 feet) thick, ranges in age from middle Tertiary to Quaternary.
The regional geologic setting of the Gold Basin Project is depicted in Figure 7-1.
Gold Basin Resources Corporation NI 43-101 Technical Report
Gold Basin Project Geological Setting and Mineralization
LC280360-1
February 25, 2021 19
Figure 7-1 Regional Geologic Setting of the Gold Basin Project (Bedinger, 1985)
The Gold Basin district occupies a portion of the Kingman Uplift, a structural high produced by Cretaceous
orogenic uplift and within which Tertiary rocks lie directly on Proterozoic rocks due to erosional stripping of
Paleozoic and Mesozoic strata. This portion of the Kingman Uplift is transected by the South Virgin–White
Hills detachment fault (Figure 7-2), which trends north-south in a somewhat sinuous manner from well
north of Lake Mead to the southern White Hills. The South Virgin-White Hills detachment records
considerable tectonic extension that decreases from north to south. Within the Project area, the low-angle,
west-dipping Cyclopic Mine fault (herein referred to as the “Cyclopic detachment”) forms the southernmost
extent of the South Virgin–White Hills detachment (Duebendorfer et. al, 2010). The Cyclopic detachment
places intermediate-age volcanic rocks and sediments to the west against Proterozoic rocks to the east (Faulds
et. al, 2010).
Gold Basin Resources Corporation NI 43-101 Technical Report
Gold Basin Project Geological Setting and Mineralization
LC280360-1
February 25, 2021 20
Figure 7-2 South Virgin-White Hills Detachment (Deubendorfer, 2010)
Local and Property Geology
7.2.1 Bedrock Lithology
The following description of bedrock lithology local to the Gold Basin Project area is largely modified from
Meyers et al. (1986).
Bedrock in the immediate vicinity of the Project area is primarily comprised of Precambrian gneiss and
rapakivi-like granite, and a Cretaceous two-mica granite (Blacet, 1975; Theodore et al., 1982). The
Precambrian basement is composed of well-foliated, quartzo-feldspathic gneiss, muscovite biotite schist, and
amphibolite. Greenschist facies metamorphism of the basement rocks is dated at 1.77 b.y. (Theodore et al.,
1982). Intruding the gneiss is a rapakivi-like granite that contains large (up to 5 cm) pink alkali feldspar
phenocrysts in a matrix of quartz, hornblende, and biotite. Wasserburg and Lanphere (1965) dated a
texturally similar granite 2.5 km to the east of the Gold Basin district at 1.66 b.y. A peraluminous two-mica
granite of Cretaceous age (72 m.y.; Theodore et al., 1982) is characterized by the presence of both biotite and
muscovite. This two-mica granite is associated with gold-bearing quartz veins and dikes of leucogranite and
episyenite that were emplaced along high-angle structures coplanar with foliation in the Precambrian
basement. The veins and dikes occur in two sets, one trending N10◦E to N20◦E, and the other N10◦W to
N15◦W.
Gold Basin Resources Corporation NI 43-101 Technical Report
Gold Basin Project Geological Setting and Mineralization
LC280360-1
February 25, 2021 21
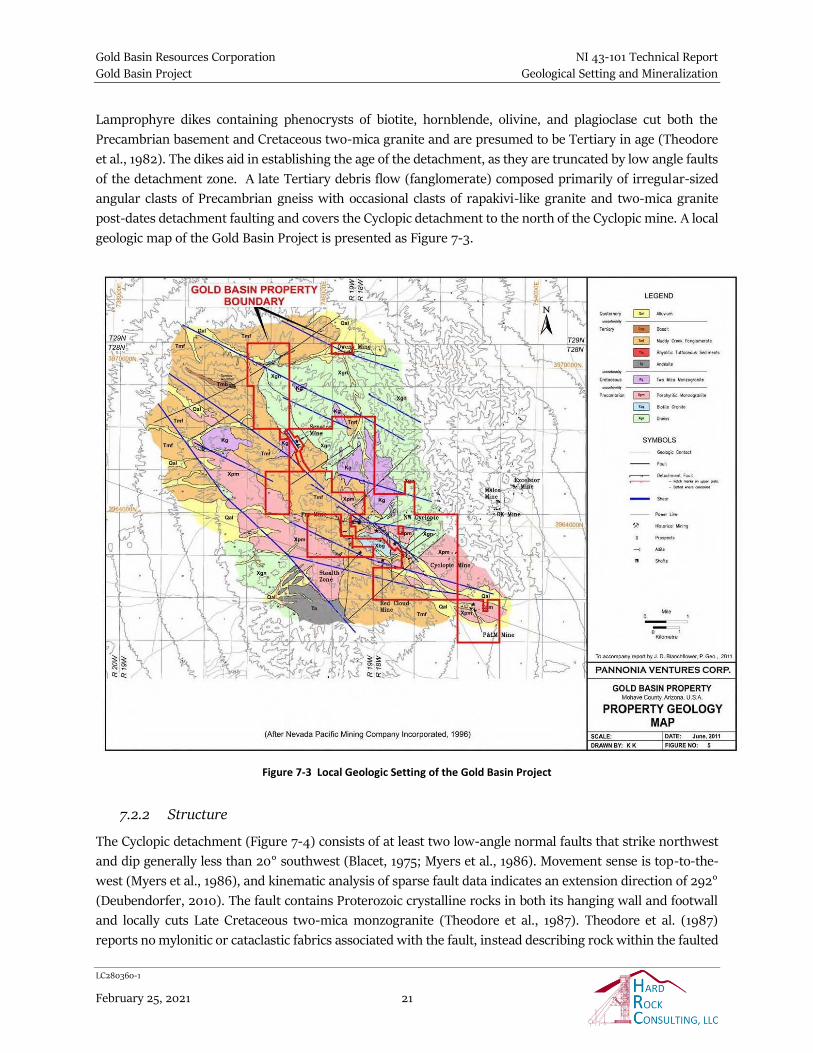
Lamprophyre dikes containing phenocrysts of biotite, hornblende, olivine, and plagioclase cut both the
Precambrian basement and Cretaceous two-mica granite and are presumed to be Tertiary in age (Theodore
et al., 1982). The dikes aid in establishing the age of the detachment, as they are truncated by low angle faults
of the detachment zone. A late Tertiary debris flow (fanglomerate) composed primarily of irregular-sized
angular clasts of Precambrian gneiss with occasional clasts of rapakivi-like granite and two-mica granite
post-dates detachment faulting and covers the Cyclopic detachment to the north of the Cyclopic mine. A local
geologic map of the Gold Basin Project is presented as Figure 7-3.
Figure 7-3 Local Geologic Setting of the Gold Basin Project
7.2.2 Structure
The Cyclopic detachment (Figure 7-4) consists of at least two low-angle normal faults that strike northwest
and dip generally less than 20° southwest (Blacet, 1975; Myers et al., 1986). Movement sense is top-to-the-
west (Myers et al., 1986), and kinematic analysis of sparse fault data indicates an extension direction of 292°
(Deubendorfer, 2010). The fault contains Proterozoic crystalline rocks in both its hanging wall and footwall
and locally cuts Late Cretaceous two-mica monzogranite (Theodore et al., 1987). Theodore et al. (1987)
reports no mylonitic or cataclastic fabrics associated with the fault, instead describing rock within the faulted
Gold Basin Resources Corporation NI 43-101 Technical Report
Gold Basin Project Geological Setting and Mineralization
LC280360-1
February 25, 2021 22
zones as unconsolidated gouge. Myers et al. (1986) describes the faulted rock as a breccia with fracture
fillings of quartz and iron oxide, characteristic of faulted rock formed under low temperature, near-surface
conditions. Based on the distribution of Proterozoic and Miocene rocks, Price and Faulds (1999) conclude
that the fault accommodates roughly 5 to 6 km of displacement. This is compatible with the map of Theodore
et al. (1987), which indicates approximately 5 km of displacement of the Late Cretaceous two-mica granite
along the fault.
Gold grade and distribution are primarily controlled by structure, specifically the series of near-horizontal
detachment fault planes cutting the Precambrian gneissic basement. Gold mineralization is localized within
brecciated, gouged, and shattered zones which range in thickness from 1m to 30m. Based on the drill data,
at least four separate detachment planes occur within a package of stacked shears with an aggregate
thickness of about 200m, though at present only two of these planes are known to be important with respect
to gold occurrence. The Cyclopic detachment fault is the most dominant structural feature in the Gold Basin
district, and it is presently thought to be the primary district-scale control over gold mineralization. The
Cyclopic detachment fault is a major host of mineralization in the Stealth, Cyclopic, Cyclopic NW, and Red
Cloud, and Arizona Section 2 prospect areas (Figure 7-4). The Minus 45 detachment is variably encountered
roughly 35m to 75m below the Cyclopic detachment (Figure 7-5), and is another important gold host in the
Stealth, PLM, Owens mine, and Arizona Section 2 prospect areas. To date, significant gold mineralization has
been encountered in both the Cyclopic and Minus 45 detachments in the Stealth and Arizona Section 2
prospect areas only.
Figure 7-4 Major Structural Features and Relative Location of Prospect Areas
Gold Basin Resources Corporation NI 43-101 Technical Report
Gold Basin Project Geological Setting and Mineralization
LC280360-1
February 25, 2021 23
Figure 7-5 Minus 45 Detachment, Structural Contour Plot
High-angle faults (Figure 7-6) appear to host only minor amounts of gold mineralization, but they may have
played a vital role as conduits for tapping hydrothermal solutions (as at Stealth) and in providing better
ground preparation within the mineralized detachment structure (as at Cyclopic). The main potential ‘feeder’
faults at Stealth and Cyclopic strike northwest and are either vertical or dip steeply west. Where the
northwest trending structures are cut by northeast to east-west trending cross faults, higher gold grades and
greater grade-thicknesses are encountered. High angle faults that appear to have some association with the
distribution of mineralization within the Project area include:
Gold Basin Resources Corporation NI 43-101 Technical Report
Gold Basin Project Geological Setting and Mineralization
LC280360-1
February 25, 2021 24
• The E-W trending Gold Basin shear fault drill-identified gold targets at the Bug Claims (far western portion of the Project area) and at Cyclopic NW with the old workings at the Fry, Ring Bear, Malco, and Excelcior mines to the east. The Gold Basin shear is a deep-seated fault that has cracked across all of the detachment planes within the 200m-thick detachment package. A parallel E-W structure running through the Senator Mine looks to control many old workings in the northern part of the district.
• The Stealth fault is a NW-trending, steeply SW dipping fault that may have that acted as a feeder structure for mineralization at Stealth and Red Cloud, and possibly the PLM mine as well. Like the Gold Basin Fault, the Stealth Fault is deep-seated and has broken across multiple detachment planes.
The NW and SE extensions of this fault are inferred from rock/soil anomalies and topographic expression.
• The NW trending Cyclopic fault is another potential feeder-type structure which bounds the Cyclopic resource area to the northeast and localizes higher grade mineralization in the NW Cyclopic area.
The northwest extension of the Cyclopic fault is marked by a line of soil and rock anomalies, while the southeastern extension is inferred from soil/rock anomalies and workings.
• The far eastern margin of the Cyclopic resource area is bounded by what is presently interpreted as a N-S trending reverse fault whose eastern block was upthrown, displacing the Cyclopic detachment to a higher elevation to the east. Gold mineralization has not been encountered in drilling along this fault, though it bisects the district and is spatially proximal to several known mineralized areas.
Gold Basin Resources Corporation NI 43-101 Technical Report
Gold Basin Project Geological Setting and Mineralization
LC280360-1
February 25, 2021 25
Figure 7-6 High Angle Faults in Relation to Detachment Contours
7.2.3 Mineralization and Alteration
Based largely on the mineralization observed in the Stealth and Cyclopic resource areas, gold mineralization
at Gold Basin can be generally classified as low sulfidation and shallow epithermal. Sulfide is recorded in
several holes but is typically not present above depths of 100 to 200m. Alteration products consist of hematitic
clay and silica, although carbonate veining/alteration in several holes at Stealth and Red Cloud is associated
with the highest-grade drill intervals and may be indicative of boiling. The mineralized zones have fairly well-
defined tops and bottoms, which is typical of shallow, hydrostatically open, epithermal systems.
Gold Basin Resources Corporation NI 43-101 Technical Report
Gold Basin Project Deposit Types
LC280360-1
February 25, 2021 26
8. DEPOSIT TYPES
While a variety of specific deposit types have been described within the Gold Basin Project area (i.e.
mineralization; and Miocene-age low sulphidation epithermal mineralization), in general, the Project is
presently best categorized as a detachment-fault-related gold deposit. Detachment faulting and other
structural features at Gold Basin have been the subject of a number of modern studies, such as those by
Myers and Smith (1986), Theodore et al. (1987), Mosher (1991), Ahern et al. (1992), Corbett (1997a and
1997b), Kerrich (1997), and Snyder (2004-2007). Most of these studies focus on the low-angle detachment
fault zone exposed at the Cyclopic mine, but others (Corbett, 1997a and 1997b; and Kerrich, 1997) have
studied the series of intersecting northwesterly and northeasterly fault sets for evidence of a ‘pull-apart’
graben setting paralleling the general trend of the detachment fault.
Detachment faults are low-angle (up to 30°) normal faults of regional extent that have accommodated
significant regional extension by upward movement of the footwall (lower-plate) producing horizontal
displacements on the order of tens of kilometers. Common features of these faults are supracrustal rocks in
the upper-plate on top of lower-plate rocks that were once at middle and lower crustal depths, mylonitization
in lower-plate rocks that are cut by the brittle detachment fault, and listric and planar normal faults bounding
half-graben basins in the upper plate (Davis and Lister, 1988).
The term ‘detachment-fault-related’ intentionally implies that mineralization is strongly controlled by
detachment-fault structures, but also that it is apparently related to the formation of detachment faults
themselves (Roddy et al., 1988). Early chloritic alteration and associated sulfide mineralization appears to
result from retrograde metamorphism as hot lower-plate rocks are brought up to shallower depths.
Potassium feldspar alteration and oxide mineralization appear to be related to the upward circulation of
saline brines derived from syntectonic basins along the detachment fault into more steeply dipping upper-
plate normal fault (Long, 1992). This fluid movement may have been driven by heat derived either from
lower-plate rocks or from syntectonic intrusives (Reynolds and Lister, 1987).
Features of detachment-fault-related mineralization that distinguish it from other deposit types, as first
presented by Long (1992), are listed below. Further details are available in Spencer and Welty (1986), Roddy
et al. (1988), and Spencer and Reynolds (1989).
• Deposits are controlled by structures formed during detachment faulting. These include the low-angle detachment-fault system, high-angle faults in the lower-plate just below the detachment fault, and low- to high-angle normal faults in the upper-plate.
• Deposits are often brecciated or deformed by movement along or above the detachment fault.
• Chlorite-epidote-calcite alteration occurs along and below the detachment fault. These altered
zones sometimes contain base-metal sulfides and barite.
• There is often massive potassium feldspar replacement of upper-plate rocks. This alteration appears to generally precede ore formation and is not always spatially associated with mineralization.
Gold Basin Resources Corporation NI 43-101 Technical Report
Gold Basin Project Deposit Types
LC280360-1
February 25, 2021 27
• Weak sericite-silica alteration of wall rock is sometimes present around barite-fluorite veins.
• Most mineralization consists of iron and copper oxides, principally specular to earthy hematite and chrysocolla. Common gangue minerals are chalcedonic to amethystine quartz, ferrous to manganiferous calcite, barite, fluorite and manganese oxides. Distal barite-fluorite veins consist of variable proportions of barite, fluorite, and manganese oxides. Common gangue minerals are quartz and manganiferous calcite.
• Fluid inclusions have moderate homogenization temperatures (150 to 350 °C) and salinities (10 to 23 equivalent weight percent NaCl), compatible with precipitation from connate brines. Fluid
inclusions from barite-fluorite veins have lower homogenization temperatures (90 to 200 °C) and are somewhat less saline (6 to 20 equivalent weight percent NaCl), compatible with precipitation from variably cooled and diluted connate brines.
• Host rocks are enriched in Cu, Pb, Zn, Au, Ag, and Ba and are depleted in Mn, Sr, Ni, and Rb. Elements characteristic of epithermal environments, such as As, Sb, Hg, and Tl, occur in very
low, background-level concentrations.
Other well documented characteristics of detachment fault zones include progressive tectonization, from
cataclastic fabric to mylonitization, within several hundred feet of the fault; chloritization of the footwall
within tens of feet of the fault; and a zone of crushing and milling over tens of feet in thickness within the
fault itself. While cataclastic features are generally lacking in the footwall gneisses in the immediate vicinity
of the detachment structures at Gold Basin, some degree of mylonitization is reported (Mosher, 1991).
Chloritization of the footwall immediately below the detachment fault is weak, which Mosher (1991)
attributes to the paucity of mafic minerals in the underlying quartz-feldspar gneisses and leucogranites.
Based in part on personal communication with Gold Basin Project Geologist Cal Herron (January 6, 2021),
this author suggests that mineralization at Gold Basin might be further classified as a sub-set of low-
sulphidation, epithermal precious-metal deposits, wherein deposition of gold mineralization occurred during
a late stage of detachment faulting, and localization of gold deposition was controlled by boiling. This
interpretation proposes that gold deposition was related to the circulation of brine fluids driven by hot, mid-
Tertiary intrusive lower plate rocks to the south and west of the present-day Project area, which may have
also contributed water and or metals, causing ascending brines to move along the SW- to W- dipping, stacked
series of detachment faults that together comprise the greater southern portion of the South Virgin–White
Hills detachment fault. The fluids would have continued to ascend along the detachment and the series of
high angle NE to EW trending faults that cross-cut the Cyclopic and associated detachment faults, with these
structures acting as a conduit kept open by ongoing faulting without deposition until the fluids reached the
boiling stage, perhaps as a result of decompression. Precipitation of gold as open space-fillings and
replacement mineralization along the brecciated hanging and footwalls of the detachments would then have
resulted when the boiling fluid mixed with another, less saline fluid within the mineralized horizon.
Gold Basin Resources Corporation NI 43-101 Technical Report
Gold Basin Project Exploration
LC280360-1
February 25, 2021 28
9. EXPLORATION
Exploration by Previous Operators
Modern exploration activities (other than drilling) have been carried out within the Project area by at least
12 previous owners and operators. Detailed information regarding exploration procedures and parameters
and sampling methods, quality, and representativeness for exploration programs carried out prior to 2007
is quite limited, and in many cases nonexistent. The following discussion summarizes exploration by previous
operators for which at least some supporting documentation exists.
From 1994 through 2003, NPMC carried out a variety of exploration activities in the Cyclopic mine area,
including geological mapping, soil and rock geochemical sampling, and trenching. Sample locations and
associated assay data have since been compiled in the Project database, though information regarding
sampling protocols, strategy, and spacing, etc., for the individual programs is presently unavailable. Results
of the sampling were used to guide subsequent drilling exploration carried out by NPMC. Soil and rock chip
sample distributions are shown in Figures 9-1 and 9-2, and trench locations are shown in Figure 9-3.
Figure 9-1 NPMC Soil Samples, 1994-2003
Gold Basin Resources Corporation NI 43-101 Technical Report
Gold Basin Project Exploration
LC280360-1
February 25, 2021 29
Figure 9-2 NPMC Rock Chip Samples, 1994-2003
Figure 9-3 NPMC Trench Locations, 1994-1997
Gold Basin Resources Corporation NI 43-101 Technical Report
Gold Basin Project Exploration
LC280360-1
February 25, 2021 30
In 1997, NPMC commissioned an aerial photogrammetric study to identify potential mineralization-
controlling structural features within the Project area (Corbett, 1997). Results of that study defined NW-
WNW linear features, including the detachment fault and associated, steeply-dipping subsidiary fractures,
NW trending shears, and NE trending transfer structures (Figure 9-4). Corbett (1997) concluded that
“although much of the gold mineralization occurs within the detachment structures, individual ore centers
are localized by the NE transfer structures”, and further postulated that “magmatic fluids have migrated from
fluid upflow within the NE fractures laterally to the WNW fracture systems, where ore deposition has been
promoted by mixing with groundwaters”.
Figure 9-4 Structural Map Based on Corbett (1997) Air Photo Study
In 2008, Aurumbank carried out a Soil Gas Hydrocarbon (‘SGH’) soil geochemical sampling program over
many prospective but poorly exposed areas within the Project boundary. Approximately 1,600 soil samples
were collected from the ‘B’ soil horizon every 100m along grid lines spaced 400m apart. A total of 87 line-
miles (140 km) of survey control grid, covering 11.6 square miles (30 km2), were established and surveyed
using hand-held GPS units. Samples were shipped directly to Activation Laboratories Ltd. in Ancaster,
Ontario, Canada for analysis using their proprietary SGH method for a suite of 165 hydrocarbon compounds
in the C5-C17 carbon series range. The analytical results were interpreted by Dr. Jeff Jaacks, Ph. D., a qualified
geochemist experienced with SGH geochemical surveying. He identified five significant targets (Figure 9-5)
which were later resampled using conventional soil sampling methods, and the results reportedly showed a
good correlation between the SGH and conventional soil geochemical results and the geological and structural
settings within the surveyed areas (Blanchflower, 2011).
Gold Basin Resources Corporation NI 43-101 Technical Report
Gold Basin Project Exploration
LC280360-1
February 25, 2021 31
Figure 9-5 Exploration Targets Identified by SGH Soil Sampling Program (Jaacks, 2009)
In 2015, Centric (AUS) initiated an exhaustive effort to compile, organize, and digitize all available historic
exploration data into a single Geographic Information System (“GIS”) database. While this effort did not
include any new exploration activity, it both expanded and improved the historical dataset by incorporating
a vast amount of information that was not previously stored in a digital, geo-referenced format.
The original drillhole database provided by NPMC contained data from 475 drillholes. Centric (AUS) added
data from 293 previously unincorporated holes, including 30 core holes drilled after 2003 and 200 airtrack
holes drilled in 1981. The additional drillholes nearly doubled the total meters of drilling contained in the
database, which now approaches 40,000m. Centric (AUS) subsequently relied on the completed dataset to
develop over 160 individual cross sections plotted on 20m spacing, examples of which are presented as
Figures 9-6 and 9-7.
Gold Basin Resources Corporation NI 43-101 Technical Report
Gold Basin Project Exploration
LC280360-1
February 25, 2021 32
Figure 9-6 Drillhole Cross Section, Cyclopic
Figure 9-7 Drillhole Cross Section, Stealth
Gold Basin Resources Corporation NI 43-101 Technical Report
Gold Basin Project Exploration
LC280360-1
February 25, 2021 33
Centric (AUS) added data from 6,530 soil samples to the database, bringing the total number of soil samples
to 11,087. Most of the additional samples were collected after 2003 but were not compiled in any useable
format. The additional soil samples greatly expand the distribution of sample data throughout the Project
area, and further define the distribution of gold mineralization along the northern and southern extensions
of the historical open pit trend. The soils data also indicates potential gold targets in the northern portion of
the Project area, with good continuity for more than 10km along strike (Figure 9-8).
Figure 9-8 Soil Sample Locations and Grades
Starting with 3,403 rock samples in the 1997 data set, Centric (AUS) effectively doubled the number of rock
and trench samples by including data gleaned from numerous paper maps and data from samples collected
during 2004-2008. The additional rock samples are important for tracing mineralization along the western
shear zone and along numerous faults north and west of the old open pit area. The completed dataset also
indicates gold mineralization well outside the bounds of the existing drill data (Figure 9-9).
Gold Basin Resources Corporation NI 43-101 Technical Report
Gold Basin Project Exploration
LC280360-1
February 25, 2021 34
Figure 9-9 Rock Chip Sample Locations and Grades
Centric (AUS) imported and geo-referenced the results of a 1991 ground magnetics survey completed by
Quantech Geophysics (Figure 9-10).
Gold Basin Resources Corporation NI 43-101 Technical Report
Gold Basin Project Exploration
LC280360-1
February 25, 2021 35
Figure 9-10 Quantech Ground Magnetics
In 2017, Centric (AUS) received the results of a “200-ft heli-mag” geophysics program conducted by
Newmont in 2016. The magnetic survey covered a significant portion of the Project claim area, and
Centric (AUS) used the results of the survey in conjunction with the historic exploration data to identify
several new exploration targets. Figure 9-11 shows aerial magnetic anomalies (second vertical derivative) in
relation to the historical gold mineralization and major structural elements. The upper plate Stealth SE
targets occur along the southeastern extension of the Stealth Fault. The lower plate Cyclopic SW targets occur
along NE-trending faults and are bounded by the Cyclopic fault on the south and Gap fault on the north – in
a structural environment similar to that seen at the Cyclopic NW target. The PLM SE target occurs at the
intersection of the Stealth Fault with a NE-trending structure zone, while the Senator SE target occurs along
the NW extension of the Cyclopic fault at the intersection with a NE-trending structure.
Gold Basin Resources Corporation NI 43-101 Technical Report
Gold Basin Project Exploration
LC280360-1
February 25, 2021 36
Figure 9-11 Air Magnetic Anomalies (bright green) Relative to Structure and Deposits
A very pronounced, NE-trending air-mag low occurs immediately east of the Cyclopic Mine in lower plate
rocks (Figure 9-12). Within this 800m wide zone, several parallel breaks are seen, the strongest of which
bounds the southeastern margin of the low zone (bold double-barbed black line). The two elongate mag-lows
are bounded by the Cyclopic fault on the south and by the Gap fault on the north, and at least one NE-trending
mineralized fault within the target area was identified by previous geological mapping. Historical rock and
soil samples picked up anomalous gold values along narrow structures, similar to the NW Cyclopic target,
which Centric (AUS) interprets as an indication of “leakage up into the lower plate sequence from the Minus
45 detachment below”. Centric (AUS) further suggests that the dipole nature of the NE-trending magnetic
breaks indicates substantial displacement across the faults, which in turn points to the tensional structural
regime (graben or half-graben).
Gold Basin Resources Corporation NI 43-101 Technical Report
Gold Basin Project Exploration
LC280360-1
February 25, 2021 37
Figure 9-12 Cyclopic SW Targets
Another NE-trending, elongate air-mag low occurs about 1km southeast of the PLM mine (Figure 9-13) on a
flat pediment surface strongly obscured by alluvium. The closest drill hole is located about 600m to the NW,
and only two rock samples were collected within the target area back in the mid-1980s – and both are
anomalous. The PLM mine fault coincides nicely with an air-mag lineament, and the south-eastern extension
of the Stealth fault also follows a magnetic break. The target area itself occurs at the intersection of NW-
trending (Stealth fault) and NE-trending magnetic breaks, and Centric (AUS) considers the dipole nature of
the NE break to suggest the presence of a tensional half-graben.
Figure 9-13 PLM SE Target
Gold Basin Resources Corporation NI 43-101 Technical Report
Gold Basin Project Exploration
LC280360-1
February 25, 2021 38
The Senator SE target is located about 2km northwest of the NW Cyclopic target, where the intersection of
two air-mag breaks coincide with a cluster of anomalous soils samples collected by NPMC in lower plate
rocks (Figure 9-14). The strong NW-trending magnetic break closely coincides with the northwest projection
of the Cyclopic mine fault.
Figure 9-14 Senator SE Target
Exploration by Gold Basin Resources Corporation
GBR has not yet carried out any exploration within the Project area other than the drilling program, which
is discussed in detail in Section 10 of this report. HRC is not aware of any other exploration activities with
sufficient supporting documentation or detail to warrant presentation in this report.
Gold Basin Resources Corporation NI 43-101 Technical Report
Gold Basin Project Drilling
LC280360-1
February 25, 2021 39
10. DRILLING
Drilling Carried Out by Previous Operators
Over a period of approximately four decades, fifteen different operators completed 587 drillholes totaling
40,311.73m across the Gold Basin Project area (Table 10-1). Detailed reports on drilling contractors,
equipment used, recovery, and methodology prior to Centric (AUS)’s 2019 drilling program are not currently
available to HRC. Some of this information is recorded in the drillhole logs and is presented where
appropriate. Collar locations, drilling orientations, and assay information is largely collected through
historical information contained in drillhole logs and other historical reports. Centric (AUS) compiled the
drillhole database in the winter of 2014/2015 under the direction of Charles Straw and Cal Herron, GBR Vice
President Exploration and Project Geologist, respectively. HRC considers the drillhole data reliable enough
to present significant gold intercepts from the drilling programs. The adequacy of the drillhole database is
discussed in greater detail in Section 12 of this report.
Gold mineralization at Gold Basin is structurally controlled by sub horizontal detachment faults, and for this
reason the interval lengths are considered to approximate true thickness of mineralization. Typical thickness
of mineralization is between 5m and 10m and interval lengths greater than 15m may be the result of
intersecting vertical structures dilating the detachment fault structures. Drilling exploration was largely
designed with open pit operations in mind, and as a result, there are no records of down-hole surveys for
drillholes prior to 2007. The majority of drilling is shallow and vertically oriented, and any down-hole
deviation is presumed to be minimal. HRC cautions that drillholes with depths greater than 120 m,
particularly if angled, can deviate significantly from the designed orientation. The following discussion
summarizes the drilling on the Project by operator and by year based on information currently available to
HRC.
Gold Basin Resources Corporation NI 43-101 Technical Report
Gold Basin Project Drilling
LC280360-1
February 25, 2021 40
Table 10-1 Summary of Historical Drilling Exploration, Gold Basin Project
10.1.1 Inspiration Drilling Exploration, 1978
Inspiration completed 15 vertical RC drillholes totaling 228.60 meters in 1978 between August 31st and
September 2nd. The drilling is located in the central portion of the Project area and within the Cyclopic
detachment fault system (Figure 10-1). The total depth for all drillholes was 15.24m. Figure 10-2 shows an
orthographic view of Inspirations drilling with gold assays filtered to values above 0.50 ppm. Significant
gold intervals are reported in Table 10-2 and demonstrate the initial presence of mineralized shallow angle
detachment faults near surface.
Company Year Type Count Total Depth (m)
Inspiration 1978 RC 15 228.60
SFP Minerals 1981 RC 20 1,063.75
U.S. Borax 1983 RC 16 1,720.60
SL 1984 RC 6 274.32
Amoco Minerals 1985 RC 17 1,304.54
Toltec Resources 1988 RC 9 686.71
1990 RC 20 2,100.07
Molycorp/US Borax 1989 RC 32 1,524.00
Consolidated Rhodes Resources 1990 RC 5 409.96
1991 RC 20 1,952.24
Kennecott 1990 RC 6 801.62
Reynolds Metals 1990 RC 14 1,981.20
1991 RC 12 1,234.44
Cambior Incorporated 1993 RC 8 1,132.33
Western States Minerals 1994 RC 12 1,280.16
1995 RC 73 5,944.82
Nevada Pacific Mining Company 1994 RC 36 1,341.12
1995 RC 97 6,169.15
1996 RC 93 3,413.46
1997 RC 13 1,653.54
2007 DDH 21 1,444.90
Arumbank Incorporated 2004 DDH 9 202.69
Centric Minerals Management 2019 RC 33 2,447.49
Grand Total 587 40,311.73
Gold Basin Resources Corporation NI 43-101 Technical Report
Gold Basin Project Drilling
LC280360-1
February 25, 2021 41
Figure 10-1 Inspiration Drillhole Locations, 1978
Gold Basin Resources Corporation NI 43-101 Technical Report
Gold Basin Project Drilling
LC280360-1
February 25, 2021 42
Figure 10-2 Orthographic View of Inspiration’s 1978 Drilling Campaign
Gold Basin Resources Corporation NI 43-101 Technical Report
Gold Basin Project Drilling
LC280360-1
February 25, 2021 71
Table 10-18 Significant Intervals from NPMC’s 1997 Drilling
10.1.13.5 2007 Diamond Core Drilling Campaign
After nearly a decade long hiatus, NMPC conducted a diamond core drillhole campaign in 2007 consisting of
21 drillholes totaling 1,444.90m in the northern extent of the Project. The drilling was variably oriented in
multiple directions with an average depth of 68.80m and a maximum depth of 137.46m. The drilling was
surveyed at the bottom of the drillhole. Table 10-19 summarizes significant gold intercepts from the drilling
campaign. The drilling confirms the presence of gold mineralization indicated by rock chip samples collected
nearby.
Table 10-19 Significant Intervals from NPMC’s 2007 Drilling
10.1.14 Aurumbank Drilling Exploration, 2004
Aurumbank Incorporated completed nine HQ size diamond core drillholes totaling 202.69m within the
Cyclopic detachment fault system between October 11th and October 20th of 2004 (Figure 10-29). The drilling
was contracted through Longyear Drilling. Most of the drilling was vertically oriented. Table 10-20
summarizes significant intercepts and Figure 10-30 shows an orthographic view of the drilling with gold
assays filtered to greater than 0.50 ppm. The results of the drilling confirm the grades and thicknesses
intersected by RC drilling in the Cyclopic detachment fault system.
Hole ID Azi. Dip From (m) To (m) Length (m) Au (ppm) Year
NP97-01 90 -60 33.5 41.1 7.6 0.86 1997
42.7 56.4 13.7 1.02 1997
NP97-01 90 -60 62.5 67.1 4.6 0.56 1997
NP97-02 90 -50 128.0 132.6 4.6 0.53 1997
NP97-04 90 -45 12.2 15.2 3.0 0.50 1997
NP97-05 90 -45 29.0 36.6 7.6 1.99 1997
59.4 64.0 4.6 0.79 1997
NP97-07 90 -60 15.2 22.9 7.6 0.92 1997
35.1 38.1 3.0 0.50 1997
62.5 68.6 6.1 6.30 1997
NP97-08 0 -60 19.8 24.4 4.6 1.12 1997
33.5 36.6 3.0 1.02 1997
NP97-11 90 -60 114.3 121.9 7.6 0.56 1997
131.1 135.6 4.6 0.55 1997
NP97-12 70 -60 0.0 7.6 7.6 1.33 1997
NP97-13 90 -45 0.0 3.0 3.0 0.55 1997
Hole ID Azi. Dip From (m) To (m) Length (m) Au (ppm) Year
DDH-6 0 -90 21.0 27.1 6.1 0.80 2007
DDH-11 210 -70 4.6 9.1 4.6 0.85 2007
DDH-16 40 -70 0.9 7.3 6.4 2.80 2007
DDH-20 0 -90 15.5 19.2 3.7 0.79 2007
Gold Basin Resources Corporation NI 43-101 Technical Report
Gold Basin Project Drilling
LC280360-1
February 25, 2021 72
Figure 10-29 Location of the Aurumbank Incorporated 2004 Drilling
Table 10-20 Significant Intervals from the Aurumbank Incorporated 2004 Drilling
Hole ID Azi. Dip From (m) To (m) Length (m) Au (ppm) Year
DDH-04-01 0 -90 1.5 10.4 8.8 2.16 2004
DDH-04-01A 0 -90 1.5 10.1 8.5 1.62 2004
DDH-04-03 0 -90 1.2 7.5 6.2 2.35 2004
DDH-04-06 0 -90 8.7 12.6 4.0 1.02 2004
Gold Basin Resources Corporation NI 43-101 Technical Report
Gold Basin Project Drilling
LC280360-1
February 25, 2021 73
Figure 10-30 Orthographic View of the Aurumbank Incorporated 2004 Drilling
10.1.15 Centric Drilling Exploration, 2019
Centric Minerals Management Pty. Ltd. completed 33 RC drillholes totaling 2,447.49m within the northwest
extension of the Cyclopic detachment fault system between March and April of 2019 (Figure 10-30). The
program was conducted by Harris Exploration Drilling using a buggy-mounted, Foremost RC drill rig. The
drilling reported no problems with recovery. Chip samples were split using a riffle splitter. Collar locations
were measured using a handheld GPS unit. The drilling was oriented vertically and drillholes were surveyed
at hole bottom. The average depth of drilling was 73.28m with a maximum depth of 94.49m. Figure 10-31
shows an orthographic view of the drilling with gold grades filtered to greater than 0.50 ppm. Significant
intercepts are shown in Table 10-21. The results of the drilling confirm the presence of mineralization,
particularly in the southwest portion of the drilling, within the northwest extent of the Cyclopic detachment
fault zone.
Gold Basin Resources Corporation NI 43-101 Technical Report
Gold Basin Project Drilling
LC280360-1
February 25, 2021 74
Figure 10-31 Location of the Centric Minerals Management Pty. Ltd. 2019 Drilling
Figure 10-32 Orthographic View of the Centric Minerals Management Pty. Ltd. 2019 Drilling
Gold Basin Resources Corporation NI 43-101 Technical Report
Gold Basin Project Drilling
LC280360-1
February 25, 2021 75
Table 10-21 Significant Intercepts from the Centric Minerals Management Pty. Ltd. 2019 Drilling
Drilling Carried Out by Gold Basin Resources Corporation
In August of 2020, GBR initiated an 88-hole (subsequently expanded to 102-hole) RC drilling campaign
largely focused on the Cyclopic and Cyclopic NW target areas (Figure 10-33). Drilling is still in progress at
the time of this report and is being carried out by Harris Drilling Exploration under the direction of Mr. Cal
Herron, GBR Project Geologist. Drillholes are advanced using a truck-mounted, Foremost percussion RC drill
rig, and drilling is completed dry. The drillholes are oriented vertically with depths ranging from 67m to
110m. No issues with recovery have been reported.
The current drilling program was designed based on work completed by Cal Herron and Charles Straw for
Centric (AUS) in 2016. The overall goal of the program is to merge the Cyclopic NW and the Cyclopic Mine
target areas. In addition, the GBR drilling is designed to define the lower detachment fault since much of the
historic drilling concentrated on the upper “Cyclopic Detachment”. Initial results from 47 drillholes totaling
4,175m are presented in Table 10-22. The assay results confirm the GBR’s understanding of the
mineralization, including the presence of gold mineralization within and between the upper and lower
detachment zones along strike of the Cyclopic detachment faults. The current extent of mineralization along
the Cyclopic fault is approximately 100m wide and 1,400m long with mineralization. The near surface
horizontal upper detachment zone demonstrates a true thickness up to 25m. Mineralization along the lower
detachment generally starts 30m to 40m below the Cyclopic detachment zone and ranges up to 18m in true
thickness.
Hole ID Azi. Dip From (m) To (m) Length (m) Au (ppm) Year
CNW-16-6 0 -45 12.2 24.4 12.2 1.47 2019
CNW-16-6A 80 -90 16.8 22.9 6.1 1.20 2019
39.6 45.7 6.1 0.57 2019
CNW-16-7 0 -90 10.7 19.8 9.1 0.89 2019
21.3 29.0 7.6 1.29 2019
30.5 33.5 3.0 0.58 2019
CNW-16-8 0 -90 0.0 4.6 4.6 0.63 2019
19.8 24.4 4.6 0.64 2019
70.1 73.2 3.0 0.58 2019
CNW-16-19 0 -90 48.8 51.8 3.0 0.65 2019
CNW-16-24 0 -90 41.1 45.7 4.6 0.65 2019
CNW-16-25 0 -90 33.5 36.6 3.0 0.60 2019
48.8 51.8 3.0 0.90 2019
53.3 57.9 4.6 1.46 2019
CNW-16-26 0 -90 36.6 39.6 3.0 0.87 2019
CNW-16-31 0 -90 27.4 38.1 10.7 1.05 2019
CNW-16-32 0 -90 3.0 7.6 4.6 2.03 2019
16.8 22.9 6.1 0.55 2019
33.5 36.6 3.0 0.50 2019
39.6 42.7 3.0 0.85 2019
48.8 51.8 3.0 0.72 2019
Gold Basin Resources Corporation NI 43-101 Technical Report
Gold Basin Project Drilling
LC280360-1
February 25, 2021 76
Figure 10-33 Location of GBR’s Completed and Planned Drillholes
Gold Basin Resources Corporation NI 43-101 Technical Report
Gold Basin Project Drilling
LC280360-1
February 25, 2021 77
Table 10-22 Initial Significant Intercepts from GBR’s 2020/2021 Drilling
HOLE ID From (m) To (m) Intersection (m) Gold Grade g/t
CM‐20‐01 19.8 33.5 13.7 0.43
CM‐20‐02 0 24.4 24.4 1.38
incl. 0 4.8 4.8 3.23
and 12.2 21.3 9.1 2.2
CM‐20‐04 16.8 33.5 16.7 0.34
CM‐20‐11 16.8 35.1 18.3 1.34
incl. 24.4 33.5 9.1 2.40
CM‐20‐16 21.3 51.8 30.5 0.59
incl. 21.3 36.6 15.3 1.01
CM‐20‐21 19.8 67.1 47.3 0.31
CM‐20‐26 85.3 91.4 6.1 0.71
CM‐20‐27 33.5 41.2 7.7 0.68
CM‐20‐32 7.6 13.7 6.1 0.83
CM‐20‐32 24.4 41.1 16.7 0.30
incl. 24.4 27.4 3.0 1.08
CM‐20‐36 38.1 53.3 15.2 0.57
CM‐20‐37 3.1 21.3 18.2 1.62
incl. 4.6 13.7 9.1 2.70
CM‐20‐37 30.1 48.8 18.7 0.31
CM‐20‐38 1.5 19.8 18.3 0.51
CM‐20‐39 24.4 42.7 18.3 0.35
CM‐20‐42 16.8 19.8 3.0 1.00
CM‐20‐42 39.6 48.8 9.2 0.49
CM‐20‐46 0 27.4 27.4 0.3
CM‐20‐49 0 4.6 4.6 1.29
CM‐20‐51 0 3.05 3.05 2.06
CM‐20‐51 36.6 41.1 4.5 1.04
CM‐20‐62 22.9 38.1 15.2 0.62
incl. 29 35.1 6.1 1.06
CM‐20‐64 0 12.2 12.2 0.31
Gold Basin Resources Corporation NI 43-101 Technical Report
Gold Basin Project Sample Preparation, Analyses and Security
LC280360-1
February 25, 2021 78
11. SAMPLE PREPARATION, ANALYSES AND SECURITY
Sampling by Previous Operators, Pre-2003
Very little information is presently available regarding sampling procedures, QA/QC protocols, and sample
security for operations prior to 2003. The following paragraphs summarize known sampling and associated
analytical work completed at the Project prior to 2003, but HRC cautions that the lack of supporting
documentation presents a significant limitation to the data validation effort:
• Inspiration analyzed 151 RC chip samples and 85 surface rock chip samples for gold and silver by fire assay. The laboratory used is not known.
• SFP Minerals analyzed 349 RC chip samples for gold and silver by fire assay. The laboratory used is not known.
• U.S. Borax analyzed 907 RC chip samples for gold only. The laboratory and methods used are
unknown. In 1992, 287 surface rock chip samples were analyzed for gold and occasionally silver, copper, mercury, molybdenum, lead, and zinc at U.S. borax labs. Methods used are unknown.
• Santa Fe Minerals analyzed surface rock chip samples in 1983 for gold and silver at Hunter Lab, and Santa Fe Lab. Methods used are unknown. In 1987, surface rock chip samples were analyzed at Iron King Assay for gold, silver, mercury, and lead. Methods used are unknown.
• J. Robinson analyzed 137 surface rock chip samples for gold and silver. The laboratory and
methods used are unknown.
• SL analyzed 180 RC chip samples for gold only by fire assay. The laboratory used is not known.
• Amoco Minerals analyzed 491 RC chip samples for gold only by fire assay. The laboratory used is not known.
• Lessman analyzed 150 surface rock chips, 66 surface channel samples, and 80 surface trench samples for gold in all cases at Berringer Labs. Some rock chip samples were analyzed for silver,
mercury, and lead. In all cases methods are not known.
• Toltec Resources analyzed 1,604 RC chip samples for gold only by fire assay. The laboratory used
is not known.
• Molycorp/U.S. Borax analyzed 1,000 RC chip samples for gold only. The laboratory and method used is not known. A soil survey consisting of 80 samples was analyzed for gold, silver, copper, molybdenum, lead, zinc, arsenic, and mercury was also conducted. Soil samples were analyzed at rocky Mountain Geochemical.
• Consolidated Rhodes Resources analyzed 1,577 RC chip samples and 1,916 surface rock chip samples for gold only by fire assay. The laboratory used is not known. Twenty-seven channel samples were also analyzed for gold at an unknown laboratory using unknown methods. 2,027 soil samples were analyzed at AL labs for gold, silver, copper, molybdenum, lead, zinc, and
arsenic.
• Kennecott analyzed 526 RC chip samples and 91 soil samples for gold only by fire assay. Soil samples were likely assayed at Rocky Mountain Geochemical. Thirty-eight surface rock chip
samples were also analyzed for gold, silver, arsenic, mercury, molybdenum, lead and zinc at Bondar Clegg.
Gold Basin Resources Corporation NI 43-101 Technical Report
Gold Basin Project Sample Preparation, Analyses and Security
LC280360-1
February 25, 2021 79
• Reynolds Metals analyzed 1,300 RC chip samples for gold and silver by fire assay, and mercury by unknown method in 1990. 229 surface rock chip samples in were also analyzed in 1990 for gold, and occasionally silver, copper, arsenic, mercury, lead, antimony, molybdenum, and zinc. In 1991, 810 RC chips were analyzed for gold only by fire assay with atomic absorption. In both
years, the laboratory used is not known.
• Homestake Mining analyzed 39 surface rock chip samples at both Legend and Geochem Services
labs for gold and silver. Methods used are unknown.
• Cambrior Incorporated analyzed 743 RC chip samples for gold only by fire assay. The laboratory
used is not known. 1,484 surface rock chip samples were analyzed at IPL for gold, silver, arsenic,
copper, mercury, molybdenum, lead, and zinc using an unknown method.
• Nevada Pacific analyzed 880 RC chip samples for gold and silver by fire assay at an unknown laboratory in 1994. In 1995, 4,015 RC chip samples were analyzed for gold only at Chemex Labs, located in Sparks, NV by fire assay and at Barrenger Laboratories in Reno, NV by fire assay.
2,240 RC chip samples and 371 soil samples were analyzed at American Assay Labs in 1996 for
gold only by fire assay. 1,084 RC chip samples were sent to Rocky Mountain Geochemical of Nevada, located in Sparks NV, gold analysis by fire assay in 1997. Certificates are available for RC assays between 1995 through 1997.
• Nevada Pacific analyzed a total of 358 surface rock chip samples for gold, silver, arsenic, copper, mercury, molybdenum, lead and zinc at Chemex Labs in 1995, American Assay Labs in 1996, Rocky Mountain Geochemical of Nevada in 1997, and at an unknown lab for years up to 2003.
• Western States Minerals analyzed 4,729 RC chip samples for gold only by fire assay, and occasionally silver. The laboratory used is not known. 147 surface rock chip samples were analyzed for gold only in 1995.
Sampling by Previous Operators, Post-2003
11.2.1 NPMC 2003
In 2003, Nevada Pacific Mining Company collected 1,096 rock chip samples. The samples were analyzed for
gold, and many were analyzed using a multi-element suite. Twenty-one core holes were drilled in 2007
resulting 1,538 core samples and analyzed for gold at an unknown laboratory.
11.2.2 Aurumbank 2004-2009
Aurumbank completed nine core drillholes in 2004, submitting 229 core samples to be analyzed for gold at
an unknown laboratory.
Soil sampling completed by Aurumbank in 2008 and 2009 is described in some detail by Blanchflower (2011).
The 2008 Soil Gas Hydrocarbon (‘SGH’) samples were all collected from the ‘B’ soil horizon, properly
described and placed in tightly woven, ‘Hubco’ polyester soil sample bags. These bags were securely stored
by the field supervisor until a sufficient number of samples had been collected to comprise a shipment, and
then they were packed in sealed containers and shipped directly to the assay laboratory via United Parcel
Service (‘UPS’). The SGH soil geochemical samples were sent to Activation Laboratories Ltd. (‘Actlabs’) in
Ancaster, Ontario, Canada for analysis using their proprietary SGH method for a suite of 165 hydrocarbon
compounds in the C5-C17 carbon series range. Upon delivery, the samples were air-dried at 40◦C. and then
Gold Basin Resources Corporation NI 43-101 Technical Report
Gold Basin Project Sample Preparation, Analyses and Security
LC280360-1
February 25, 2021 80
sieved to -60 mesh. The SGH extraction method uses a very weak leach that extracts hydrocarbons bound to
the surface of the soil grains. These hydrocarbons are then separated by high-resolution, capillary column
gas-chromatography combined with mass spectrometry to isolate selected hydrocarbons. All compounds are
reported in parts per trillion. There are no descriptions of any quality control procedures employed or quality
assurance actions taken during the collection and analyses of the SGH soil geochemical samples. The B-
horizon soil samples were collected according to Activation Laboratories’ instructions, but there are no
reports of any specific QA/QC procedures being employed during the collection process. According to
personal communication from the geologist on site at the time, all of the SGH soil geochemical samples were
securely stored prior to their direct shipment by bonded UPS courier to Activation Laboratories Ltd. in
Ancaster, Ontario.
11.2.3 Centric Minerals Management Pty. Ltd. 2019
Centric (AUS) completed 33 vertically oriented RC drillholes in 2019. The samples were analyzed for gold by
fire assay at ALS Labs in Reno, NV. Out of 1,772 samples, 167 (approximately 10%) were for the purpose of
QA/QC. The QA/QC samples include standards, blanks, and duplicate samples. The types of QA/QC samples
are not currently documented in the database, so no statistical analysis or other validation procedures could
be carried out by HRC at this time.
Gold Basin Resources Corporation Sampling
RC samples obtained during GBR’s ongoing drill program are collected directly from the cyclone into a 5-
gallon bucket on 5-foot sample intervals. The contents of the bucket are run through a 3-tier, Gilson-style
splitter, and one half of the resulting split is further reduced using a single-tier, Johnson-style splitter. One
half of the final split is placed in a pre-labelled, cloth sample bag for delivery to the lab, and the remaining
split is retained in a labelled, plastic bag on-site pending laboratory results.
Laboratory samples are placed in large rice sacks and transported from the drill site to Kingman by GBR staff
roughly every 4 days. From Kingman, the samples are shipped via commercial shipping service (FedEx) to
American Assay Laboratories in Reno. HRC understands that GBR intends to transport retained samples to
a secure storage facility (yet to be established) in Kingman following the completion of the drilling program.
On-site sample security is ensured by the 24-hour presence of a GBR geologist (either Mr. Heron or contract
staff) during all drilling operations.
QA/QC samples include low, medium, and high-grade certified reference material (standards), field duplicate
samples, and blank samples. Certified reference material is acquired from Legends Mining Supply in Sparks,
Nevada, and consists of CRM Oxide standards at grades of 2.58, 0.778, and 0.154 ppm Au. Blank material
consists of commercially available (Home Depot) decorative marble aggregate. QA/QC samples are inserted
into the sample stream at a rate of 1 each (standard, duplicate, and blank) for every 20 RC samples. The
samples are submitted to the laboratory for assay by fire with an ICP finish.
Opinion on Adequacy
Given the general lack of supporting documentation regarding sampling methods, parameters, distribution,
analysis, security, etc., and the specific lack of original assay certificates, for sample data collected prior to
Gold Basin Resources Corporation NI 43-101 Technical Report
Gold Basin Project Sample Preparation, Analyses and Security
LC280360-1
February 25, 2021 81
1994, HRC is unable to validate the accuracy or reliability of that information. Any future mineral resource
estimates that rely heavily on the historical drillhole data should be limited in classification to Inferred
mineral resources only. HRC does find the historic (pre-1994) data suitable for use in guiding exploration, at
least as far as identifying potential targets for future or additional exploration. Drillhole, soil, rock, and
trench samples collected post-1994 generally do have sufficient associated supporting documentation for a
meaningful evaluation of accuracy and reliability, and HRC finds this data to be suitable for use exploration
planning (surface samples) and mineral resource estimation (drillhole data).
HRC finds GBR’s sample preparation, analytical procedures, and security measures to be reasonable and
adequate to ensure the validity and integrity of the data derived from GBR’s sampling programs, with some
room for improvement. Based on observations and conversation with GBR personnel during the QP site visit,
in conjunction with the results of HRC’s review and evaluation of GBR’s QA/QC program, the QP makes the
following recommendations:
• A concerted effort should be made to locate, compile, organize, prioritize, digitize, and validate
presently unavailable hard-copy historic data and documents.
• HRC recommends that QA/QC analysis be conducted on an on-going basis, including consistent acceptance/rejection tests. Each round of QA/QC analysis should be documented, and reports
should include a discussion of the results and any corrective actions taken.
• HRC recommends that retained samples presently stored on-site be transported to a secure, local
storage facility, both as an added security measure and in order to comply with BLM permit regulations.
Gold Basin Resources Corporation NI 43-101 Technical Report
Gold Basin Project Data Verification
LC280360-1
February 25, 2021 82
12. DATA VERIFICATION
Data verification efforts carried out by HRC include:
• Discussions with GBR personnel;
• Personal investigation of the Project area and observation of drilling in progress;
• Mechanical audit of the exploration drillhole database received from GBR;
• Detailed review of additional information obtained from historical reports and internal
company reports;
• Partial validation of the database geologic information as compared to the (limited) paper logs;
and
• Partial validation of the assay values contained in the exploration database as compared to (limited) assay certificates provided by GBR.
Site Visit
HRC representative and QP J.J. Brown conducted an on-site inspection of the Gold Basin Project on January
5th and 6th, 2021. While on site, Ms. Brown conducted general site and geologic field reconnaissance including
observation of the on-going drilling program, examination of surface bedrock exposures, and ground-
truthing of reported drill collar locations. With the assistance of Mr. Cal Herron, GBR Project Geologist, Ms.
Brown also reviewed the conceptual geologic model, data entry and document management protocols, and
drilling and sampling procedures and associated QA/QC methods presently employed.
Field observations during the site visit generally confirm previous reports on the geology of the Project area.
Bedrock lithologies, alteration types, and significant structural features are all consistent with descriptions
provided in existing Project reports, and the author did not see any evidence in the field that might
significantly alter or refute the current interpretation of the local geologic setting or conceptual geologic
model on which current exploration plans are based.
Topography
The current topographic surface was created from the Shuttle Range Tomography Mission (“SRTM”). SRTM
data is publicly available elevation data of a quality that can be useful for exploration planning but is not
recommended for detailed near surface mine planning and mineral resource estimation. Deviations between
collar elevation and topographic surface elevation could impact the accuracy of geologic modeling. HRC
recommends detailed topographic surveys for the Cyclopic and any other areas under consideration for
mineral resource estimation.
Database Audit
The drillhole database was downloaded from the GBR SharePoint server on December 14, 2020 by HRC as a
series of excel spreadsheets containing Collar, Survey, and Assay intervals. Collar locations, drilling
orientations, and assay information is largely collected through historical information contained in drillhole
Gold Basin Resources Corporation NI 43-101 Technical Report
Gold Basin Project Data Verification
LC280360-1
February 25, 2021 83
logs and other historical reports. Centric (AUS) compiled the existing drillhole database in the winter of
2014/2015 under the direction of Mr. Cal Herron, who is now the principal geologist of GBR.
The drillhole database was loaded into Leapfrog Geo® software version 6.0 to check for overlapping
intervals, duplicate intervals, intervals exceeding collar maximum depth, and other issues relating to the
database construction. The software did not identify any issues with the drillhole database during the
mechanical audit.
Collar Locations
Drillhole collar locations are stored in the database using a WGS 1984 UTM Zone 11N projection, and the
elevation is in meters. Review of historic drilling logs show collar locations intermittently recorded as
Latitude and Longitude coordinates and it is unclear if these locations were where the collar was planned or
actually drilled. The 2019 collar locations drilled by Centric (AUS) were surveyed using a handheld GPS unit.
Due to the relative uncertainty in both the drillhole collar elevation and the SRTM topography, collar
elevations were not checked against the SRTM topography. HRC recommends, where possible, the
professional survey of historic and future collar locations for the Cyclopic and any other areas under
consideration for mineral resource estimation.
Down-hole Surveys
The majority of drilling is shallow and vertically oriented, and significant down-hole deviation is considered
unlikely. HRC cautions that drillholes with depths greater than 120m, particularly if angled, can deviate
significantly from the designed orientation. Initial orientations of drilling are generally recorded in the
historic drillhole logs. Drilling conducted by Aurumbank in 2004 and Centric (AUS) in 2019 have bottom of
hole surveys stored in the database. HRC has not independently verified the records of the surveys.
Assay Data
The opinion of HRC is that the assay database is as reliable as currently possible given the lack of primary
source information. Much of the assays in the database rely on handwritten grade results on drillhole logs.
HRC spot checked these secondary records against the values in the database and found no errors in grades,
intervals, or unit conversions. Assay certificates are available for NPMC’s 1995, 1996, and 1997 RC drilling
campaigns. HRC again spot-checked assay results against the assay certificates and found no errors is grades,
intervals, or unit conversions present in the database. Certificates were also available for the 2019 RC drilling
by Centric (AUS). HRC checked all of the assays in the database against the certificate values and found no
grade or interval errors.
In addition to validating the assay database against the available records, HRC compared raw assay statistics
by operator for the Cyclopic and Stealth detachment fault systems. Box plots for the Cyclopic detachment
fault system presented in Figure 12-1 show a general agreement of average gold grades between 0.10 and
0.20 ppm. The exception being Cambior Incorporated on the low end with an average gold grade 0.07ppm.
Cambior Incorporated drilling plan was on the margins of the deposit resulting in lower average grades. On
the high end with an average gold grade of 0.28 ppm, Inspirations drilling was limited in extent and in the
heart of the mineralization. Table 12-1 shows the descriptive statistics by operator and shows the drilling by
Gold Basin Resources Corporation NI 43-101 Technical Report
Gold Basin Project Data Verification
LC280360-1
February 25, 2021 84
NPMC likely represents the true mean of the deposit due to its overwhelming distribution and sampled
length. Similar results are noted for the Stealth system. Average gold grades by operator tend to lie between
0.20 and 0.22ppm (Figure 12-2 and Table 12-2). Low average grades exhibited by U.S. Borax and Cambior
are the result of drilling location on the margins of the mineralization. Toltec drilling was located within the
heart of the system, resulting in a high average gold grade of 0.42 ppm. The drilling conducted by Western
States Resources likely represents the true mean of the deposit.
Table 12-1 Descriptive Gold Grade (ppm) Statistics by Operator for the Cyclopic Detachment Fault System
Figure 12-1 Box Plot of Cyclopic Gold Grades by Operator
Nevada Pacific Mining Company 1,394 2,124.46 0.213 0.010 9.487
Toltec Resources 536 939.70 0.422 0.015 72.686
U.S. Borax 141 292.61 0.040 0.001 0.900
Western States Resources 3,474 5,294.38 0.226 0.017 13.904
Gold Basin Resources Corporation NI 43-101 Technical Report
Gold Basin Project Data Verification
LC280360-1
February 25, 2021 86
lost, or damaged. The uncertainties in the historical drilling where the lack of assay certificates, QA/QC, collar
surveys, and down-hole surveys do not fit neatly into modern requirements and reporting standards.
Certainly, the 2019 Centric (AUS) data is sufficient in quality to be used in mineral resource estimation, and
the assay certificates from NPMC’s tenure allow for proper validation of the bulk of the NPMC assay data.
HRC is of the opinion that the historic data currently contained in the Project database is suitable for use in
mineral resource estimation, provided that the mineral resource classification is limited to Inferred mineral
resources only.
Gold Basin Resources Corporation NI 43-101 Technical Report
Gold Basin Project Mineral Processing and Metallurgical Testing
LC280360-1
February 25, 2021 87
13. MINERAL PROCESSING AND METALLURGICAL TESTING
Metallurgical testing on material from the Gold Basin Project is presently limited to three separate studies
carried out by and on behalf of previous operators of the Project. The results of these studies are addressed
in Leonard (1996) and Blanchflower (2011), as summarized in the following paragraphs, though the original
analytical results/reports were not available for review at the time this report was prepared. HRC
understands that the original documents are likely to exist and that GBR plans to locate and digitize them in
as timely a manner as possible. HRC has reviewed the information provided by Leonard (1996) and
Blanchflower (2011) in detail, and finds the descriptions and interpretations presented below to be reasonably
accurate and suitable for use in this report.
In January 1995, Western States Minerals Corporation delivered five samples from the Stealth resource area
(RC holes GBR-7, 13, 14 and 15) to Kappes Cassiday & Associates (“KCA”) in Reno, Nevada. The type or style
of the mineralization submitted for metallurgical testing is unknown, as is the sample material’s
representativeness of the overall Stealth deposit. Cyanide bottle tests were conducted on 1,000-gram sample
splits from two individual holes, and a variety of cyanide bottle roll and cyanide extraction tests were
performed at various size fractions on 500- to 3000-gram sub-samples of a composite sample created by
combining 2,000-gram splits from each of the five drill hole samples.
Results of the bottle roll testing reportedly demonstrated that the composites yielded an average of 91.4%
gold extraction when crushed to minus 28 mesh. The same composites averaged 42.7% gold extraction when
run ‘as received’ and 78.7% gold extraction when crushed to minus 10 mesh. ‘As received’ particle size for
this test work typically had 40% greater than 10 mesh, 40% less than 10 mesh and greater than 100 mesh,
and 20% less than 100 mesh. Head screen analysis showed concentration of gold in the coarse fraction on
composites from GBR-7, 13 and 14 and concentration of gold in the fines on the composite from GBR-15.
Cyanide soluble assays on the +10 mesh fraction in all composites demonstrated cyanide soluble gold
remaining upon further size reduction. That is, after leaching, the screen fraction that was greater than 10
mesh was ground to minus 10 mesh, then leached, yielding essentially all remaining contained gold as defined
by fire assay.
KCA further reported that the gold assays reproduced well, although some ‘spottiness’ was observed above
0.100 oz/ton Au. Cyanide soluble assays were essentially equal to fire assay, indicating this would be excellent
milling ore. Chemical consumption was low. Cyanide consumption averaged only 0.21 lb/ton ore and lime
consumption was1.87 lb/ton ore for the composites. Profile II analysis of leach solution demonstrated no
constituent concentrations of specific environmental concern.
In April 1995, NPMC delivered three crushed samples from the Cyclopic mine area, together totaling 400
pounds, to KCA. Neither the type or style of the mineralization nor the representativeness of the material
submitted is reported. The samples were individually crushed at Thunderbird Industries in Salem, Oregon
to minus ½-inch, minus 3/8-inch and minus ¼-inch size fractions. Three separate cyanide bottle roll leach
tests were conducted on a pulverized portion (minus 0.15-mm) of each individual sample. Results of these
tests were reported as follows:
Gold Basin Resources Corporation NI 43-101 Technical Report
Gold Basin Project Mineral Processing and Metallurgical Testing
LC280360-1
February 25, 2021 88
• Gold recovery for the minus ½-inch sample (KCA Test No. 22050) was 80.0% after 72 hours of leaching based upon a calculated head grade of 0.155 oz/t Au. Sodium cyanide consumption in the test was 0.64 pounds NaCN per short ton of ore. Hydrated lime consumption was 4.00 pounds Ca(OH)2 per short ton of ore.
• Gold recovery for the minus 3/8-inch sample (KCA Test No. 22049) was 65.3% after 72 hours of leaching based upon a calculated head grade of 0.176 oz/t Au. Sodium cyanide consumption in the test was 0.42 pounds NaCN per short ton of are. Hydrated lime consumption was 400 pounds Ca(OH)2 per short ton of ore.
• Gold recovery for the minus ¼-inch sample (KCA Test No. 22051) was 80.6% after 72 hours of
leaching based upon a calculated head grade of 0.160 oz/t Au. Sodium cyanide consumption in the test was 0.22 pounds NaCN per short ton of ore. Hydrated lime consumption was 4.00 pounds Ca(OH)2 per short ton of ore.
Gold recovery was increasing at the end of the 72-hour leach period for each test, which may indicate the
presence of coarse gold in the samples tested.
Three separate cyanide bottle roll leach tests were conducted on an as-received portion of each individual
sample. Results of these tests were reported as follows:
• Gold recovery for the minus ½-inch sample (KCA Test No. 22050) was 57.7% after 96 hours of
leaching based upon a calculated head grade of 0.142 oz/t Au. Sodium cyanide consumption in the test was 0.56 pounds NaCN per short ton of ore. Hydrated lime consumption was 1.60 pounds Ca(OH)2 per short ton of ore.
• Gold recovery for the minus 3/8-inch sample (KCA Test No. 22049) was 54.4% after 96 hours of leaching based upon a calculated head grade of 0.160 oz/t Au. Sodium cyanide consumption
in the test was 0.55 pounds NaCN per short ton of ore. Hydrated lime consumption was 1.60 pounds Ca(OH)2 per short ton of ore.
• Gold recovery for the minus ¼-inch sample (KCA Test No. 22051) was 72.8% after 96 hours of leaching based upon a calculated head grade of 0.151 oz/t Au. Sodium cyanide consumption in
the test was 0.53 pounds NaCN per short ton of ore. Hydrated lime consumption was 1.33 pounds
Ca(OH)2 per short ton of ore.
Gold recovery was increasing at the end of the 96-hour leach period for each test, which may indicate the
presence of coarse gold or may be a result of the short leach period in combination with the coarse particle
size.
Three separate cyanide column leach tests were conducted on an as-received portion of each individual
sample. Results of these tests were reported as follows:
• Gold recovery for the minus ½-inch sample (KCA Sample No. 22050) was 67.1% after 91 days of leaching based upon a calculated head grade of 0.146 oz/t Au. Sodium cyanide consumption
in the test was 1.74 pounds NaCN per short ton of ore. Cement addition to the column material was 100 pounds cement per short ton of ore. No hydrated lime was added during the column leach test.
Gold Basin Resources Corporation NI 43-101 Technical Report
Gold Basin Project Mineral Processing and Metallurgical Testing
LC280360-1
February 25, 2021 89
• Gold recovery for the minus 3/8-inch sample (KCA Sample No. 22049) was 60.7% after 91 days of leaching based upon a calculated head grade of 0.194 oz/t Au. Sodium cyanide consumption in the test was 1.63 pounds NaCN per short ton of ore. Cement addition to the column material was 10.0 pounds cement per short ton of ore. No hydrated lime was added during the column
leach test.
• Gold recovery for the minus ¼-inch sample (KCA Sample No. 22051) was 72.2% after 91 days of leaching based upon a calculated head grade of 0.169 oz/t Au. Sodium cyanide consumption in the test was 1.64 pounds NaCN per short ton of ore. Cement addition to the column material was 10.0 pounds cement per short ton of ore. No hydrated lime was added during the column
leach test.
The calculated head assays of the column leach tests for the three samples submitted ranged from 0.146 to
0.194 oz/t Au and averaged 0.170 oz/t Au. Gold recovery from the three tests ranged from 60.7% to 72.2%
and averaged 69.7% with the 3/8-inch sample having the lowest gold recovery. Several of the individual
assays for the Cyclopic Project samples varied by more than 50% and several of the individual assays (from
the column leach tests) varied by more than 30%. From the assay data as well as the recovery data it can be
concluded that coarse gold was contained in the Cyclopic samples.
Screen analyses of the three column leach tailings indicated a higher amount of fines (minus 48 mesh) in
both the ½ inch test material as well as the 3/8-inch test material (approximately 19% of the sample passing
48 mesh) samples in relation to the ¼-inch test material (approx. 13% passing 48 mesh). The ½-inch and
3/8-inch tail samples were similar in size.
Based upon the results of the head and tail screen analyses, the 3% discounted gold recovery versus grain
size for the column leach test were 62% for minus 1/2-inch mesh material, 65% for minus 3/8-inch material,
and 71% for minus 1/4-inch material.
In July 1996, NPMC delivered five bags of crushed material, together totaling 455.2 pounds, to KCA. This
material was reportedly representative of mineralization in the Stealth resource area, though no description
of the type or style of the mineralization was given. The five bags of material were composited into a single
composite sample and a cyanide bottle roll leach test was completed on a pulverized portion of the composite.
Based on the results of the analyses, KCA reported the following (Table 13-1) 3% discounted gold recoveries
versus grain sizes for the column leach test.
Table 13-1 NPMC Metallurgical Test Results (from Blanchflower, 2011)
Crush Size Actual % Extracted
Au Theoretical % Extracted Au
Anticipated Field % Extracted Au
-1/2 inch 62.5 59.6 59
-3/8 inch 58.9 59
-1/4 inch 60.4 60
-6 mesh 72.3 72
-10 mesh 75.3 75
-28 mesh 87.3 87
-65 mesh 90.9 90
Gold Basin Resources Corporation NI 43-101 Technical Report
Gold Basin Project Mineral Resource Estimate
LC280360-1
February 25, 2021 90
14. MINERAL RESOURCE ESTIMATE
GBR is not reporting a current mineral resource estimate for the Gold Basin Project at this time. A historical
mineral resource estimate was prepared in October 2019, prior to GBR’s acquisition of the Project, by Robin
A. Rankin, MSc DIC MAusIMM (CPGeo) of GeoRes. While the 2019 mineral resource estimate was publicly
disclosed in JORC format, it relied largely on historic data which at present lacks sufficient supporting
documentation and detail for proper validation as required of NI 43-101. GBR intends to prepare and report
a mineral resource estimate for the Gold Basin Project following an on-going, comprehensive data validation
effort, and following completion of the drilling exploration in progress at the time of this report.
A qualified person has not done sufficient work to classify the historical estimate as current mineral resources
or mineral reserves, and GBR is not treating the historical estimate as current mineral resources or mineral
reserves.
Gold Basin Resources Corporation NI 43-101 Technical Report
Gold Basin Project Adjacent Properties
LC280360-1
February 25, 2021 91
15. ADJACENT PROPERTIES
The Gold Basin Project is located within the historic Gold Basin mining district, which hosts a number of
historically productive mines. While many of the deposits and past producing mines in the surrounding area
are similar to those within the Project area, there are no immediately adjacent properties which might
materially affect the understanding of mineralization or evaluation of exploration targets specific to the Gold
Basin Project.
Gold Basin Resources Corporation NI 43-101 Technical Report
Gold Basin Project Other Relevant Data and Information
LC280360-1
February 25, 2021 92
16. OTHER RELEVANT DATA AND INFORMATION
This report summarizes all available data and information material to the Gold Basin Project as of February
25, 2021. The authors are not aware of any other relevant technical or other data or information that might
materially impact the interpretations and conclusions presented herein, nor of any additional information
necessary to make the report more understandable or not misleading.
Gold Basin Resources Corporation NI 43-101 Technical Report
Gold Basin Project Interpretation and Conclusions
LC280360-1
February 25, 2021 93
17. INTERPRETATIONS AND CONCLUSIONS
Geology and Deposit Type
HRC concludes that GBR has thorough understanding of the geology of the Gold Basin Project, and that the
appropriate deposit model is being applied for exploration. The conceptual geologic model is sound, and in
conjunction with drilling results, indicates that potential exists to increase the extent of known mineralized
areas with additional drilling.
During the on-site inspection in January 2021, HRC’s (QP) representative conducted general geologic field
reconnaissance, including inspection of bedrock exposures and other surficial geologic features, ground-
truthing of reported drill collar and trench sample locations, and superficial examination of historic mine
workings. Field observations during the site visit generally confirm previous reports on the geology of the
Project area. Bedrock lithologies, alteration types, and significant structural features are all consistent with
descriptions provided in existing Project reports, and the author did not see any evidence in the field that
might significantly alter or refute the current interpretation of the local geologic setting or the conceptual
geologic model on which exploration is based.
Exploration, Drilling, and Analytical
Drilling throughout the history of the Project has largely confirmed the interpretations of the geology and
mineralization. The ongoing GBR drilling campaign is confirming the link between the Cyclopic Mine and
the Cyclopic NW targets along strike of the Cyclopic fault. The GBR campaign is also confirming the continuity
of the lower detachment zone.
GBR’s routine RC sample collection, preparation, analytical procedures, and security measures are, in
general, considered reasonable and adequate to ensure the validity and integrity of the data derived from
GBR’s sampling programs. Samples prepared for transport to the laboratory are bagged and labelled in a
manner which inhibits tampering, and all samples remain in GBR control until released to commercial
transport in Kingman. GBR’s current internal QA/QC program incorporates standard, blank, and field
duplicate samples as well as occasional check (lab) sampling. HRC is of the opinion that drillhole data
gathered during GBR’s on-going drilling program will, together with historic drilling data, result in a total
dataset of sufficient quality and quantity to support estimation of mineral resources according to NI 43-101
mineral resource classification definitions.
Data Verification
HRC finds the GBR drillhole database to be as accurate as presently possible given the existing, significant
limitations to the data verification effort. The database is prone to inadequacies that are common to projects
with long exploration histories. Companies that operated prior to the adoption of international reporting
standards, such as NI 43-101, used internal best practices which could vary from operator to operator.
Additionally, before records could be easily digitized and stored, reports and records could often be misplaced,
lost, or damaged. The uncertainties in the historical drilling where the lack of assay certificates, QA/QC, collar
surveys, and down-hole surveys do not fit neatly into modern requirements and reporting standards.
Gold Basin Resources Corporation NI 43-101 Technical Report
Gold Basin Project Interpretation and Conclusions
LC280360-1
February 25, 2021 94
Certainly, the 2019 Centric (AUS) data is sufficient in quality to be used in mineral resource estimation, and
the assay certificates from NPMC’s tenure allow for proper validation of the bulk of the NPMC assay data.
HRC is of the opinion that the historic data currently contained in the Project database is suitable for use in
mineral resource estimation, provided that the mineral resource classification is limited to Inferred mineral
resources only.
Gold Basin Resources Corporation NI 43-101 Technical Report
Gold Basin Project Recommendations
LC280360-1
February 25, 2021 95
18. RECOMMENDATIONS
General Recommendations
During the course of this study, HRC made a number of observations regarding data handling, document
management, and general drilling and sampling procedures and protocols for which modifications and/or
improvements could positively affect the level of confidence in the drillhole data and subsequent mineral
resource estimations. Based on these observations, HRC recommends that GBR carry out the following:
• An in-house effort to locate, compile, organize, prioritize, digitize, and validate presently unavailable hard-copy historic data and documents.
• Production and implementation of formal and specific written protocols with regard to both wet
and dry reverse circulation drilling, diamond core drilling, sampling methods and sample handling procedures, and geologic logging.
• Production and implementation of formal data management and document handling procedures with regard to exploration; specifically, written guidelines and prepared templates for the collection and organization of exploration data in order to ensure that all pertinent information is captured and catalogued in a practical and efficient manner for ease of future use.
• Standardization and formalization of quality assurance-quality control procedures including collection of field duplicate, blank, and standard samples, comparison checks between different drill contractors and types of drilling, comparison checks between lithology logs recorded by different exploration staff, review of core recoveries versus grade, review of RC data for potential downhole contamination, and selection and review of downhole survey methods and measurements, etc.
• HRC recommends that QA/QC analysis be conducted on an on-going basis, including consistent acceptance/rejection tests. Each round of QA/QC analysis should be documented, and reports should include a discussion of the results and any corrective actions taken. HRC further
recommends that retained samples presently stored on-site be transported to a secure, local
storage facility, both as an added security measure and in order to comply with BLM permit
regulations.
• HRC recommends, where possible, the professional survey of historic and future collar locations in the Cyclopic, Cyclopic NW, and Stealth areas and any other areas under consideration for mineral resource estimation.
Recommended Work Plan and Budget
Following completion of the on-going drill program, HRC recommends that GBR complete additional RC in-
fill and definition drilling in both the Cyclopic and Cyclopic NW target areas. The number and distribution of
future RC drill holes will depend in part on the results of the on-going drill program, but HRC anticipates
that roughly 6,000 ft of additional RC drilling will be sufficient, in conjunction with existing drillhole data,
to define the limits and distribution of mineralization and to potentially support upgrade of future mineral
resource classifications. HRC also recommends approximately 1,800 ft of PQ diamond core drilling, both to
confirm the thickness and grades of the detachment fault zones at Cyclopic and Cyclopic NW, and to provide
Gold Basin Resources Corporation NI 43-101 Technical Report
Gold Basin Project Recommendations
LC280360-1
February 25, 2021 96
sample material necessary for preliminary metallurgical testing. Metallurgical samples should be collected
from both the Cyclopic and Cyclopic NW areas to obtain information representative of the overall deposit.
HRC anticipates that metallurgical testwork will include both bottle roll and column testing in order to gather
recovery data for a heap leach scenario. HRC’s recommended work plan also includes a detailed topographic
survey of the full Project area as well as preparation of a mineral resource estimate classified according to
CIM definition standards and suitable for public disclosure. The anticipated costs for the recommended scope
of work are presented in Table 18-1.
Table 18-1 Estimated Cost of Recommended Scope of Work
Recommended Scope of Work Expected Cost (US$) Expected Cost (CD$)
RC Definition and In-fill Drilling $135,000 $171,435
Diamond Core Drilling $80,000 $101,590
Metallurgical Testwork $80,000 $101,590
Detailed Topographic Survey $10,000 $12,700
Mineral Resource Estimate $40,000 $50,795
Subtotal $345,000 $438,110
15% Contingency $51,750 $65,717
Total Budget $396,750 $503,827
Gold Basin Resources Corporation NI 43-101 Technical Report
Gold Basin Project References
LC280360-1
February 25, 2021 97
19. REFERENCES
Ahern, R., Com, R. M., and Loghry, J. D., 1992, Exploration Results and Potential of the Gold Basin District, Mohave County, Arizona; Private report prepared for Prime Exploration, 27 p.
Arizona Department of Mines and Mineral Resources Mining Collection, 2003, AZMILS Data File, including Public Notice No. 14-96AZAP (Notice of Preliminary Decision to Issue an Individual Aquifer Protection Permit, Aquifer Protection Permit No. P-I02956); Arizona Department of Mines and Mineral Resources file data, printed February 2003.
Beard, L.S., J. Kennedy, M. Truini, and T. Felger, 2011, Geologic map of Detrital, Hualapai, and Sacramento Valleys and surrounding areas, northwest Arizona; U.S. Geological Survey Open-File Report 2011-1225, pamphlet 43 p.
Bedinger, M.S., Sargent, K.A., and Brady, B.T., 1985, Geologic and hydrologic characterization and evaluation of the Basin and Range Province relative to the disposal of high-level radioactive waste, Part III, Geologic and hydrologic evaluation; U.S. Geological Survey Circular 904C.
Blacet, P.M., 1975, Preliminary geologic map of the Garnet Mountain Quadrangle, Mohave County, Arizona; U.S.
Blanchflower, J.D., 2011. Amended Technical Report on the Gold Basin Property, Gold Basin Mining District,
Mojave County, Arizona; NI 43-101 Technical Report prepared for Pannonia Ventures Corp., October 2011.
Corbett, G. J., 1997, Comments on the Geology and Exploration of the Gold Basin and Nelson Projects, Las Vegas;
Unpublished report to Nevada Pacific Mining Company Inc., March, 1997, 16 p.
Davis, G.A., and Lister, G.S., 1988. Detachment faulting in continental extension; Perspectives from the southwestern U.S. Cordillera; in Clark, S.P., Jr., and others. eds., processes in continental lithospheric
deformation: Geological Society of America Special Paper 218, p. 133-160.
Duebendorfer, E.M., Faulds, J.E., and Fryxell, J.E., 2010, The South Virgin–White Hills detachment fault, southeastern Nevada and northwestern Arizona: Significance, displacement gradient, and corrugation formation; in Umhoefer, P.J., Beard, L.S., and Lamb, M.A., eds., Miocene Tectonics of the Lake Mead
Region, Central Basin and Range: Geological Society of America Special Paper 463, p. 275–287.
Faulds, J.E., Duebendorfer, E.M., Murphy, R.T., Fitzgerald, P.G., Peters, L., and McIntosh, W.C., 2004, Implications of paleomagnetic data on displacement gradient accommodation along a major detachment fault, White Hills, northwest Arizona; Geological Society of America Abstracts with Programs, v. 36, no. 4, p. 34.
Jaacks, J., 2009, Updated Interpretation of the Gold Basin SGH Soil Gas Survey; Private report prepared for Aurumbank Inc., November 6, 2009, 9 p.
Kerrich, R., and Rehrig, W., 1987, Fluid motion associated with Tertiary mylonization and detachment faulting: 18O/16O evidence from the Picacho metamorphic core complex, Arizona; Geology, v. 15, p. 58-62.
Kerrich, R., 2007, Gold Basin, Arizona; Private report prepared by OreGeodynamics Inc. on the association of lamprophyre dykes with the known gold mineralization on the Gold Basin property owned by Aurumbank Inc., October 31, 2007, 13 p.
Gold Basin Resources Corporation NI 43-101 Technical Report
Gold Basin Project References
LC280360-1
February 25, 2021 98
Long, Keith R., 1992, Preliminary descriptive deposit model for detachment-faultrelated mineralization; in Bliss, James D., ed., Developments in deposit modeling; U.S. Geological Survey Bulletin 2004, p. 52-56.
Mosher, G. Z., 1991, Project Report, Phase 1, Cyclopic Property, Mohave County, Arizona, U.S.A.; Private report prepared for Consolidated Rhodes Resources Ltd. and Toltec Resources Ltd., 22 p.
Mosher, G. Z., 1991, Project Report, Phase 2, Cyclopic Property, Mohave County, Arizona, U.S.A.; Private report prepared for Consolidated Rhodes Resources Ltd. and Toltec Resources Ltd.
Myers, I. A., Smith, E. I., and Wyman, R. Y., 1986, Control of Gold Mineralization at the Cyclopic Mine, Gold Basin District, Mohave County, Arizona; Economic Geology Vol. 81, p. 1553 - 1557.
NPMC, 1997, Gold Basin Arizona, Cyclopic and Stealth Prospects, Order of Magnitude Estimate; Internal report prepared by Nevada Pacific Mining Company, Incorporated, August 1997.
NPMC, 2008, Exploration Summary, Gold Basin Project; Private report prepared by Nevada Pacific Mining Company Inc. summarizing the exploration results from various targets within the Gold Basin property,
36 p.
Price, L. M., and J. E. Faulds, 1999, Structural development of a major segment of the Colorado Plateau-Basin
and Range boundary, southern White Hills, Arizona; Nev. Pet. Soc. Guideb., 14, p. 139 – 170.
Reynolds, S.J., and Lister, G.S., 1987, Structural aspects of fluid-rock interactions in detachments zones; Geology, v. 15, p. 362-366.
Roddy, Micheal S., Reynolds, Stephen J., Smith, Brian M., and Ruiz, Joaquin, 1988, K-metasomatism and detachment-related mineralization, Harcuvar Mountians, Arizona; Geological Society of America Bulletin, v. 100, p.1627-1639.
Schrader, F.C., 1909, Mineral deposits of the Cerbat Range, Black Mountains, and Grand Wash Cliffs, Mohave County, Arizona: U.S. Geological Survey Bulletin 397, 226 p.
Snyder, K., 2004 to 2007, Various memoranda on geological controls of mineralization and exploration
techniques for the Gold Basin Property prepared by K. Snyder, Ph.d for Aurumbank Incorporated.
Spencer, J.E. and Reynolds, S.J., 1989, Geology and Mineral Resources of the Buckskin and Rawhide Mountains, West-Central Arizona, US National Report to IUGG, 1991-1994, Rev. Geophysics, vol. 33 supplement, American Geophysical Union.
Spencer, J.E., and Welty, J.W., 1986, Possible controls of base- and precious-metal mineralization associated with Tertiary detachment faults in the lower Colorado River trough, Arizona and California; Geology, v. 14, p. 195-198.
Straw, C., Herron, C., 2015, Technical Interpretation and Exploration Targets Report, Gold Basin Project, Arizona, U.S.A.; Internal report prepared for Centric Minerals Management Pty Ltd., October 2015.
Gold Basin Resources Corporation NI 43-101 Technical Report
Gold Basin Project References
LC280360-1
February 25, 2021 99
Theodore, T. G., Blair, W. N., and Nash, J. T., 1982, Base metals, precious metals, and molybdenum: New occurrence types in the western United States; U.S. Geol. Survey Open-File Rept. 82-1052, 322 p.
Theodore, T.G., Blair, W.N., and Thomas, J.T., 1987, Geology and gold mineralization of the Gold basin-Lost basin mining districts, Mohave County, Arizona; U.S. Geological Survey Professional Paper 1361, 167 p.
Truini, M., Beard, L.S., Kennedy, J., Anning, D.W., 2013, Hydrogeologic framework and estimates of groundwater storage for the Hualapai Valley, Detrital Valley, and Sacramento Valley basins, Mohave County, Arizona; U.S. Geological Survey Scientific Investigations Report 2012–5275, 47 p.
Wasserburg, G. J., and Lanphere, M. A., 1965, Age determinations in the Precambrian of Arizona and Nevada;
Geological Society of America Bulletin, v. 76, no. 7, p. 735 - 758.
Gold Basin Resources Corporation NI 43-101 Technical Report
Gold Basin Project Appendix A
LC280360-1
February 25, 2021 100
Appendix A
Gold Basin Project Mining Claims
Gold Basin Resources Corporation NI 43-101 Technical Report
Gold Basin Project Appendix A
LC280360-1
February 25, 2021 101
Property Description
I. Gold Basis Unpatented Mining Claims
The following unpatented lode mining claims, covering approximately 5,280 acres and comprising the Gold Basin
Unpatented Claims, are situated in the Gold Basin Mining District, Mohave County, Arizona, in those indicated
portions of the public land survey system, the names of which, the place of recording of the location notice thereof,
and the serial number assigned by the Arizona State Office of the Bureau of Land Management.
• Section 4, Township 27 North, Range 18 West, G&SR Meridian, Gold Basin Mining District, Mohave County, Arizona:
Mohave Cty Rec'ds BLM Serial
Name of Claim Book Page AMC No.
Arden 1 4938 505 361381
Arden 2 4938 507 361382
Arden 3 4938 509 361383
Arden 4 4938 511 361384
Arden 5 4938 513 361385
Arden 6 4938 515 361386
Arden 7 4938 517 361387
Arden 8 4938 519 361388
Arden 9 4938 521 361389
Arden 10 4938 523 361390
Arden 11 4938 525 361391
Gold Basin Resources Corporation NI 43-101 Technical Report
Gold Basin Project Appendix A
LC280360-1
February 25, 2021 102
Mohave Cty Rec'ds BLM Serial
Name of Claim Book Page AMC No.
Arden 12 4938 527 361392
Arden 13 4938 529 361393
Arden 14 4938 531 361394
Arden 15 4938 533 361395
Arden 16 4938 535 361396
Arden 17 4938 537 361397
Arden 18 4938 539 361398
Arden 19 4938 541 361399
Arden 20 4938 543 361400
Arden 21 4938 545 361401
Arden 22 4938 547 361402
Arden 23 4938 549 361403
Arden 24 4938 551 361404
Arden 25 4938 553 361405
Arden 26 4938 555 361406
Arden 27 4938 557 361407
Arden 28 4938 559 361408
Gold Basin Resources Corporation NI 43-101 Technical Report
Gold Basin Project Appendix A
LC280360-1
February 25, 2021 103
Mohave Cty Rec'ds BLM Serial
Name of Claim Book Page AMC No.
Arden 29 4938 561 361409
Arden 30 4938 563 361410
Arden 31 4938 565 361411
Arden 32 4938 567 361412
P. and L.M. 225 31972
Lee No. 5 261 524 34317
Lee No. 7 261 526 34318
Lee No. 9 261 528 34319
• Section 19, 29, 30 31, and 32 Township 28 North, Range 18 West, and Sections 1, 3, 10, 12, 13, 14, 15, 22, 24, 25, and 26 Township 28 North, Range 19 West, G&SR Meridian, Mohave County, Arizona:
Mohave Cty Rec'ds BLM Serial
Name of Claim Book Page AMC No.
Ring Bear 234 838 24466
Ring Bear No. 4 255 790 24468
Ring Bear No. 5 255 791 24467
Cyclops No. 1 245 51 24469
Gold Basin Resources Corporation NI 43-101 Technical Report
Gold Basin Project Appendix A
LC280360-1
February 25, 2021 104
Mohave Cty Rec'ds BLM Serial
Name of Claim Book Page AMC No.
Cyclops No. 2 245 53 24470
Cyclopic King No. 1 241 463 24471
Cyclopic King No. 2 241 464 24472
Cyclopic King No. 3 241 465 24473
Yucca No. 15 253 575 24483
Yucca No. 16 253 576 24484
Yucca No. 17 253 577 24485
Yucca No. 18 253 578 24486
Yucca No. 19 253 579 24487
Yucca No. 22 261 466 24488
Yucca No. 23 261 467 24489
Yucca No. 24 261 468 24490
Yucca No. 25 261 469 24491
Yucca No. 58 261 502 24492
Yucca No. 59 261 503 24493
Yucca No. 60 261 504 24494
Yucca No. 61 261 505 24495
Gold Basin Resources Corporation NI 43-101 Technical Report
Gold Basin Project Appendix A
LC280360-1
February 25, 2021 105
Mohave Cty Rec'ds BLM Serial
Name of Claim Book Page AMC No.
Joshua No. 1 457 580 24496
Joshua No. 2 457 581 24497
Yucca No. 26 1028 934 225655
Yucca No. 57 2013 429 320083
Gold King No. 1 1994 470 319322
Yucca No. 5 253 565 24475
Yucca No. 7 253 567 24476
Yucca No. 9 253 569 24477
Yucca No. 10 253 570 24478
Yucca No. 11 253 571 24479
Yucca No. 12 253 572 24480
Yucca No. 13 253 573 24481
Yucca No. 14 253 574 24482
Yucca #8 1994 472 319323
Gap 1 4938 493 361413
Gap 2 4938 495 361414
Gap 3 4938 497 361415
Gold Basin Resources Corporation NI 43-101 Technical Report
Gold Basin Project Appendix A
LC280360-1
February 25, 2021 106
Mohave Cty Rec'ds BLM Serial
Name of Claim Book Page AMC No.
Gap 4 4938 499 361416
Gap 5 4938 501 361417
Gap 6 4938 503 361418
Gap 7 4938 439 360635
Gap 8 4938 441 360636
Gap 9 4938 443 360637
Gap 10 4938 445 360638
Gap 11 4938 447 360639
Kiwi 1 4938 449 360642
Kiwi 2 4938 451 360643
Kiwi 3 4938 453 360644
Kiwi 4 4938 455 360645
Kiwi 5 4938 457 360646
Kiwi 6 4938 459 360647
Kiwi 7 4938 461 360648
Kiwi 8 4938 463 360649
Kiwi 9 4938 465 360650
Gold Basin Resources Corporation NI 43-101 Technical Report
Gold Basin Project Appendix A
LC280360-1
February 25, 2021 107
Mohave Cty Rec'ds BLM Serial
Name of Claim Book Page AMC No.
Kiwi 10 4938 467 360651
Kiwi 11 4938 469 360652
Kiwi 12 4938 471 360653
Kiwi 13 4938 473 360654
Kiwi 14 4938 475 360655
Kiwi 15 4938 477 360656
Kiwi 16 4938 479 360657
Kiwi 17 4938 481 360658
Kiwi 18 4938 483 360659
Kiwi 19 4938 485 360660
Kiwi 20 4938 487 360661
Kiwi 21 4938 489 360662
Kiwi 22 4938 491 360663
WIN72A 4843 307 359707
WIN73 4843 309 359708
WIN74 4843 311 359709
WIN75 4843 313 359710
Gold Basin Resources Corporation NI 43-101 Technical Report
Gold Basin Project Appendix A
LC280360-1
February 25, 2021 108
Mohave Cty Rec'ds BLM Serial
Name of Claim Book Page AMC No.
WIN76 4843 315 359711
WIN77 4843 317 359712
WIN78 4843 319 359713
WIN79 4843 321 359714
WIN80 4843 323 359715
WIN81 4843 325 359716
WIN82 4843 327 359717
WIN83 4843 329 359718
WIN84 4843 331 359719
WIN85 4843 333 359720
WIN86 4843 335 359721
WIN87 4843 337 359722
WIN88 4843 339 359723
WIN89 4843 341 359724
BF1 4815 181 359151
BF2 4815 183 359152
BF3 4815 185 359153
Gold Basin Resources Corporation NI 43-101 Technical Report
Gold Basin Project Appendix A
LC280360-1
February 25, 2021 109
Mohave Cty Rec'ds BLM Serial
Name of Claim Book Page AMC No.
BF4 4815 187 359154
BF5 4815 189 359155
BF6 4815 191 359156
BF7 4815 193 359157
BF8 4815 195 359158
BF9 4815 197 359159
BF10 4815 199 359160
BF11 4815 201 359161
BF12 4815 203 359162
BF13 4815 205 359163
BF14 4815 207 359164
BF15 4815 209 359165
BF16 4815 211 359166
BF17 4815 213 359167
BF18 4815 215 359168
BF19 4815 217 359169
BF20 4815 219 359170
Gold Basin Resources Corporation NI 43-101 Technical Report
Gold Basin Project Appendix A
LC280360-1
February 25, 2021 110
Mohave Cty Rec'ds BLM Serial
Name of Claim Book Page AMC No.
BF21 4815 221 359171
BF22 4815 223 359172
BF23 4815 225 359173
BF24 4815 227 359174
BF25 4815 229 359175
BF26 4815 231 359176
BF27 4815 233 359177
FUNT20 4819 302 359179
FUNT22 4819 306 359181
FUNT24 4819 310 359183
FUNT26 4819 314 359185
SEN1 4819 336 359196
SEN2 4819 338 359197
SEN3 4819 340 359198
SEN4 4819 342 359199
SEN5 4819 344 359200
SEN6 4819 346 359201
Gold Basin Resources Corporation NI 43-101 Technical Report
Gold Basin Project Appendix A
LC280360-1
February 25, 2021 111
Mohave Cty Rec'ds BLM Serial
Name of Claim Book Page AMC No.
SEN7 4819 348 359202
SEN8 4819 350 359203
SEN9 4819 352 359204
SEN10 4819 354 359205
SEN11 4819 356 359206
SEN12 4819 358 359207
SEN13 4819 360 359208
SEN14 4819 362 359209
SEN15 4819 364 359210
SEN16 4819 366 359211
SEN17 4819 368 359212
SEN18 4819 370 359213
SEN19 4819 372 359214
SEN20 4819 374 359215
SEN21 4819 376 359216
SEN22 4819 378 359217
SEN23 4819 380 359218
Gold Basin Resources Corporation NI 43-101 Technical Report
Gold Basin Project Appendix A
LC280360-1
February 25, 2021 112
Mohave Cty Rec'ds BLM Serial
Name of Claim Book Page AMC No.
SEN24 4819 382 359219
SEN25 4819 384 359220
SEN26 4819 386 359221
SEN27 4819 388 359222
SEN28 4819 390 359223
SEN29 4819 392 359224
SEN30 4819 394 359225
SEN32 4819 396 359226
SEN33 4819 398 359227
SEN34 4819 400 359228
SEN35 4819 402 359229
SEN36 4819 404 359230
SEN 37 4938 435 360664
SEN 38 4938 437 360664
TAP1 4819 264 359231
TAP2 4819 266 359232
TAP3 4819 268 359233
Gold Basin Resources Corporation NI 43-101 Technical Report
Gold Basin Project Appendix A
LC280360-1
February 25, 2021 113
Mohave Cty Rec'ds BLM Serial
Name of Claim Book Page AMC No.
TAP4 4819 270 359234
TAP5 4819 272 359235
TAP6 4819 274 359236
TAP7 4819 276 359237
TAP8 4819 278 359238
TAP9 4819 280 359239
TAP10 4819 282 359240
TAP11 4819 284 359241
TAP12 4819 286 359242
TAP13 4819 288 359243
TAP14 4819 290 359244
TAP15 4819 292 359245
TAP16 4819 294 359246
TAP17 4819 296 359247
TAP18 4819 298 359248
WIN1 4815 109 359249
WIN2 4815 111 359250
Gold Basin Resources Corporation NI 43-101 Technical Report
Gold Basin Project Appendix A
LC280360-1
February 25, 2021 114
Mohave Cty Rec'ds BLM Serial
Name of Claim Book Page AMC No.
WIN3 4815 113 359251
WIN4 4815 115 359252
WIN5 4815 117 359253
WIN6 4815 119 359254
WIN7 4815 121 359255
WIN8 4815 123 359256
WIN9 4815 125 359257
WIN10 4815 127 359258
WIN11 4815 129 359259
WIN12 4815 131 359260
WIN13 4815 133 359261
WIN14 4815 135 359262
WIN15 4815 137 359263
WIN16 4815 139 359264
WIN17 4815 141 359265
WIN18 4815 143 359266
WIN19 4815 145 359267
Gold Basin Resources Corporation NI 43-101 Technical Report
Gold Basin Project Appendix A
LC280360-1
February 25, 2021 115
Mohave Cty Rec'ds BLM Serial
Name of Claim Book Page AMC No.
WIN20 4815 147 359268
WIN21 4815 149 359269
WIN22 4815 151 359270
WIN23 4815 153 359271
WIN24 4815 155 359272
WIN25 4815 157 359273
WIN26 4815 159 359274
WIN27 4815 161 359275
WIN28 4815 163 359276
WIN29 4815 165 359277
WIN30 4815 167 359278
WIN31 4815 169 359279
WIN32 4815 171 359280
WIN33 4815 173 359281
WIN34 4815 175 359282
WIN35 4815 177 359283
WIN36 4815 179 359284
Gold Basin Resources Corporation NI 43-101 Technical Report
Gold Basin Project Appendix A
LC280360-1
February 25, 2021 116
Mohave Cty Rec'ds BLM Serial
Name of Claim Book Page AMC No.
WIN37 4819 442 359285
WIN38 4819 444 359286
WIN39 4819 446 359287
WIN40 4819 448 359288
WIN41 4819 450 359289
WIN42 4819 452 359290
WIN43 4819 454 359291
WIN44 4819 456 359292
WIN45 4819 458 359293
WIN46 4819 460 359294
WIN47 4819 462 359295
WIN48 4819 464 359296
WIN49 4819 466 359297
WIN50 4819 468 359298
WIN51 4819 470 395299
WIN52 4819 472 359300
WIN53 4819 474 359301
Gold Basin Resources Corporation NI 43-101 Technical Report
Gold Basin Project Appendix A
LC280360-1
February 25, 2021 117
Mohave Cty Rec'ds BLM Serial
Name of Claim Book Page AMC No.
WIN54 4819 476 359302
WIN55 4819 406 359303
WIN56 4819 408 359304
WIN57 4819 410 359305
WIN58 4819 412 359306
WIN59 4819 414 359307
WIN60 4819 416 359308
WIN61 4819 418 359309
WIN62 4819 420 359310
WIN63 4819 422 359311
WIN64 4819 424 359312
WIN65 4819 426 359313
WIN66 4819 428 359314
WIN67 4819 430 359315
WIN68 4819 432 359316
WIN69 4819 434 359317
WIN70 4819 436 359318
Gold Basin Resources Corporation NI 43-101 Technical Report
Gold Basin Project Appendix A
LC280360-1
February 25, 2021 118
Mohave Cty Rec'ds BLM Serial
Name of Claim Book Page AMC No.
WIN71 4819 438 359319
WIN72 4819 440 359320
• Section 26 Township 28 North, Range 20 West, G&SR Meridian, Mohave County, Arizona:
Mohave Cty Rec'ds BLM Serial
Name of Claim Book Page AMC No.
Bug 1 5313 364 363477
Bug 2 5313 366 363478
Bug 3 5313 368 363479
Bug 4 5313 370 363480
Bug 5 5313 372 363481
Bug 6 5313 374 363482
Bug 7 5313 376 363483
Bug 8 5313 378 363484
Bug 9 5313 380 363485
Bug 10 5313 382 363486
Gold Basin Resources Corporation NI 43-101 Technical Report
Gold Basin Project Appendix A
LC280360-1
February 25, 2021 119
II. Severed Mineral Interests
The following interests in the mineral estate, covering approximately 2,389.34 acres and comprising the Santa Fe
Property, were reserved by Santa Fe Pacific Railroad Company under that certain warranty deed to J. M. Smith
and Winnie E. Smith, dated August 10, 1956, and subsequently conveyed to the Vendor's predecessor in interest:
• In Section 29, Township 28 North, Range 18 West, G&SR Mer., Arizona: The East Half of the Northeast Quarter (E½NE¼), the North Half of the Southeast Quarter (N½SE¼), the Southwest Quarter of the Southeast Quarter (SW¼SE¼ ) and the East Half of the Southwest Quarter (E½SW ¼), consisting of 280 acres.
• In Section 31, Township 28 North, Range 18 West, G&SR Mer., Arizona: Lots 2, 3 and 4, the South Half of the Northeast Quarter (S½NE¼), the Southeast Quarter of the Northwest Quarter (SE¼NW¼), the Southeast Quarter (SE¼), the East Half of the Southwest Quarter (E½SW¼), and the Northeast Quarter of the Northeast Quarter (NE¼NE¼), consisting of 507.18 acres.
In Section 3, Township 28 North, Range 19 West, G&SR Mer., Arizona: Lots 1-4, South Half of the North
Half (S½N½) and the South Half (S½), consisting of 642.16 acres.
• In Section 13, Township 28 North, Range 19 West, G&SR Mer., Arizona: All, consisting of 640 acres.
• In Section 25, Township 28 North, Range 19 West, G&SR Mer., Arizona: The South Half of the Southeast
Quarter (S½SE¼), the West Half of the Northwest Quarter (W½NW¼) and the Southwest Quarter (SW¼), consisting of 320 acres.