NATIONAL IRRIGATED LAND SPATIAL DATASET Summary of methodology, assumptions and results. PREPARED FOR Ministry for the Environment C17042 28/07/2017 PREPARED BY Andrew Dark Birendra K.C. Ayaka Kashima
Transcript
NATIONAL IRRIGATED LAND SPATIAL DATASET Summary of methodology, assumptions and results.
PREPARED FOR
Ministry for the Environment
C17042
28/07/2017
PREPARED BY
Andrew Dark
Birendra K.C.
Ayaka Kashima
Disclaimer
This document has been prepared solely for the benefit of Ministry for the Environment. No liability is accepted by Aqualinc Research
Ltd or any employee or sub-consultant of this Company with respect to its use by any other person.
This disclaimer shall apply notwithstanding that the document may be made available to other persons for an application for permission
or approval or to fulfil a legal requirement.
Quality Control
Client Ministry for the Environment
Document Title National Irrigated Land Spatial Dataset: Summary of methodology, assumptions and results.
Document Number C17042-1
Authors Andrew Dark, Birendra K.C., Ayaka Kashima
Reviewed By Helen Rutter
Approved By Helen Rutter
Date Issued 28/07/2017
Project Number C17042
Document Status FINAL
File Name C17042_NZ_irr_area_report_28Jul17_FINAL.docx
For more information regarding this document please contact
Dark A, K.C. B, Kashima A, 2017. National Irrigated Land Spatial Dataset: Summary of methodology, assumptions and results.. Ministry for the Environment, C17042-1. Aqualinc Research Limited.
Figure 1: Total mapped irrigated area for each region, with error estimates, compared to APS 2012 estimates .......... 10
Figure 2: Spatial distribution of mapped irrigated area in Canterbury ........................................................................... 13
Figure 3: Spatial distribution of mapped irrigated area in Marlborough ......................................................................... 15
Figure 4: Spatial distribution of mapped irrigated area in Otago ................................................................................... 17
Figure 5: Spatial distribution of mapped irrigated area in Gisborne .............................................................................. 19
Water Management Report / National Irrigated Land Spatial Dataset
Ministry for the Environment / C17042-1 / 28/07/2017
Figure 6: Spatial distribution of mapped irrigated area in Hawke’s Bay ......................................................................... 21
Figure 7: Spatial distribution of mapped irrigated area in Manawatu-Wanganui ............................................................ 23
Figure 8: Spatial distribution of mapped irrigated area in Southland ............................................................................. 25
Figure 9: Spatial distribution of mapped irrigated area in Greater Wellington ................................................................ 27
Figure 10: Spatial distribution of mapped irrigated area in the Auckland Region ........................................................... 29
Figure 11: Spatial distribution of mapped irrigated area in Bay of Plenty ...................................................................... 31
Figure 12: Spatial distribution of mapped irrigated area in Northland ............................................................................ 33
Figure 13: Spatial distribution of mapped irrigated area in Taranaki .............................................................................. 35
Figure 14: Spatial distribution of mapped irrigated area in Tasman ............................................................................... 37
Figure 15: Spatial distribution of mapped irrigated area in the West Coast Region ....................................................... 39
Figure 16: Spatial distribution of mapped irrigated area in Waikato ............................................................................... 41
Table 1: Summary of irrigated area in different regions with estimated range and error estimates in 2017 ..................... 3
Table 2: NDVI contrast categories by region ................................................................................................................... 6
Table 3: Estimated uncertainty levels based on system type and NDVI contrast ............................................................ 8
Table 4: Summary of mapped irrigated area by region ................................................................................................... 9
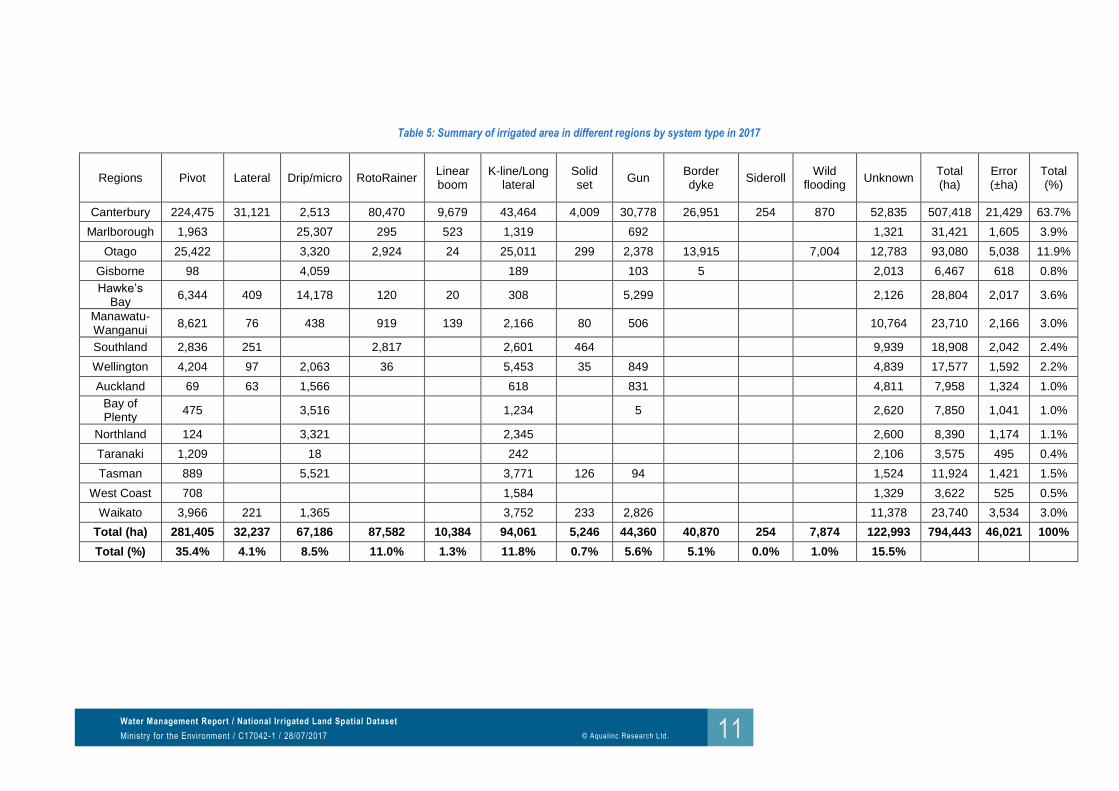
Table 5: Summary of irrigated area in different regions by system type in 2017 ........................................................... 11
Table 6: Canterbury: mapped irrigated area by system type, with estimated error ........................................................ 14
Table 7: Marlborough: mapped irrigated area by system type, with estimated error ...................................................... 16
Table 8: Otago: mapped irrigated area by system type, with estimated error ................................................................ 18
Table 9: Gisborne: mapped irrigated area by system type, with estimated error ........................................................... 20
Table 10: Hawke’s Bay: mapped irrigated area by system type, with estimated error ................................................... 20
Table 11: Manawatu-Wanganui: mapped irrigated area by system type, with estimated error ...................................... 22
Table 12: Southland: mapped irrigated area by system type, with estimated error........................................................ 24
Table 13: Greater Wellington: mapped irrigated area by system type, with estimated error .......................................... 26
Table 14: Auckland: mapped irrigated area by system type, with estimated error ......................................................... 30
Table 15: Bay of Plenty: mapped irrigated area by system type, with estimated error ................................................... 32
Table 16: Northland: mapped irrigated area by system type, with estimated error ........................................................ 32
Table 17: Taranaki: mapped irrigated area by system type, with estimated error .......................................................... 34
Table 18: Tasman: mapped irrigated area by system type, with estimated error ........................................................... 36
Table 19: West Coast: mapped irrigated area by system type, with estimated error ..................................................... 38
Table 20: Waikato: mapped irrigated area by system type, with estimated error ........................................................... 40
Table 21: GIS data fields............................................................................................................................................... 42
Table 22: Irrigation system types .................................................................................................................................. 42
Water Management Report / National Irrigated Land Spatial Dataset
This report documents a spatial dataset of irrigated area for all mainland regions of New Zealand, except for Nelson1. Wherever possible, the irrigated area has been classified by system type. Mapping the spatial distribution of irrigated areas and irrigation system types represents a substantial improvement on previous estimates of irrigated area, which only provided a total area for the region or district.
The spatial dataset is a snapshot of irrigated area in 2017, based on the most up-to-date datasets available, predominantly from 2015 – 2017.
A combination of recent high resolution aerial photographs, Normalised Difference Vegetation Index (NDVI) imagery from dry summer conditions, resource consent database information, and property boundaries were used to create the spatial dataset.
The irrigated area spatial dataset for the Canterbury Region was created in 2016 in a previous project for Environment Canterbury. The approach was fully documented for this (Aqualinc, 2016) and users of the national dataset should refer to the documentation for the Canterbury dataset. The mapped irrigated areas have been compared to estimates from the June 2012 Agricultural Production Statistics (StatsNZ, 2013). Although some of the difference between the 2012 and 2017 total areas can be accounted for by new irrigation development, the absolute difference cannot be relied on with a high level of confidence due to the different methodologies used to create the two totals.
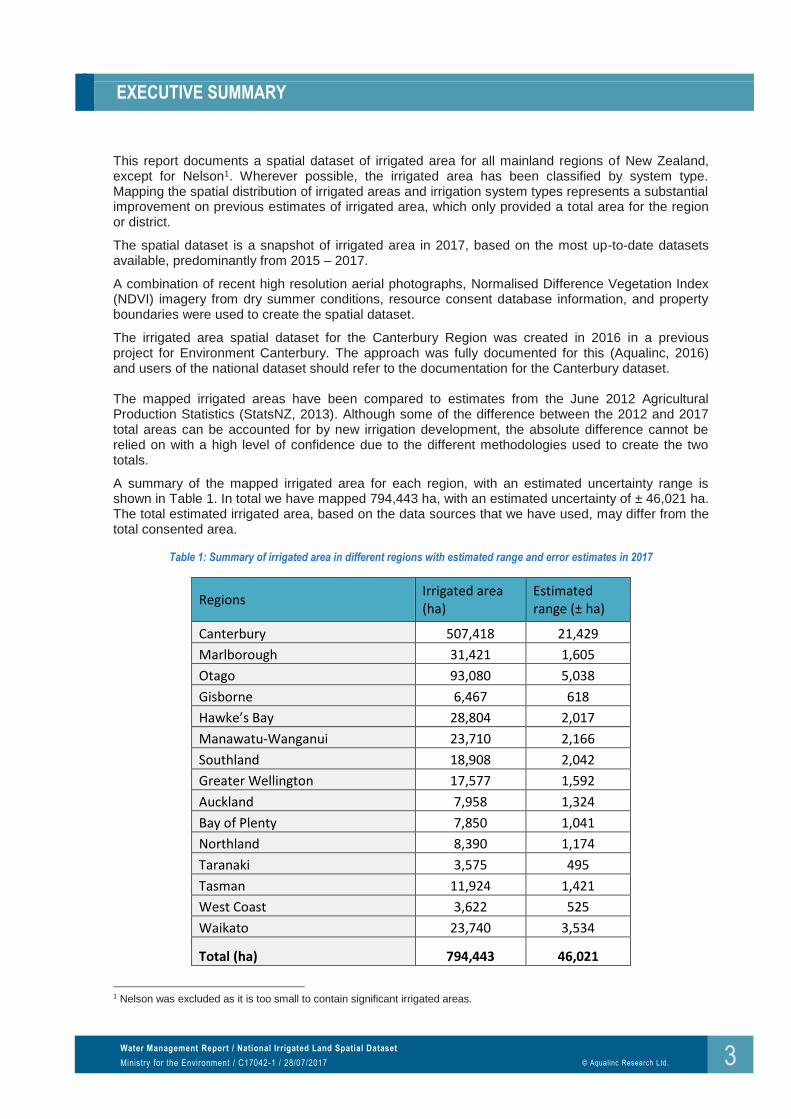
A summary of the mapped irrigated area for each region, with an estimated uncertainty range is shown in Table 1. In total we have mapped 794,443 ha, with an estimated uncertainty of ± 46,021 ha. The total estimated irrigated area, based on the data sources that we have used, may differ from the total consented area.
Table 1: Summary of irrigated area in different regions with estimated range and error estimates in 2017
Regions Irrigated area (ha)
Estimated range (± ha)
Canterbury 507,418 21,429
Marlborough 31,421 1,605
Otago 93,080 5,038
Gisborne 6,467 618
Hawke’s Bay 28,804 2,017
Manawatu-Wanganui 23,710 2,166
Southland 18,908 2,042
Greater Wellington 17,577 1,592
Auckland 7,958 1,324
Bay of Plenty 7,850 1,041
Northland 8,390 1,174
Taranaki 3,575 495
Tasman 11,924 1,421
West Coast 3,622 525
Waikato 23,740 3,534
Total (ha) 794,443 46,021
1 Nelson was excluded as it is too small to contain significant irrigated areas.
Water Management Report / National Irrigated Land Spatial Dataset
Ministry for the Environment / C17042-1 / 28/07/2017
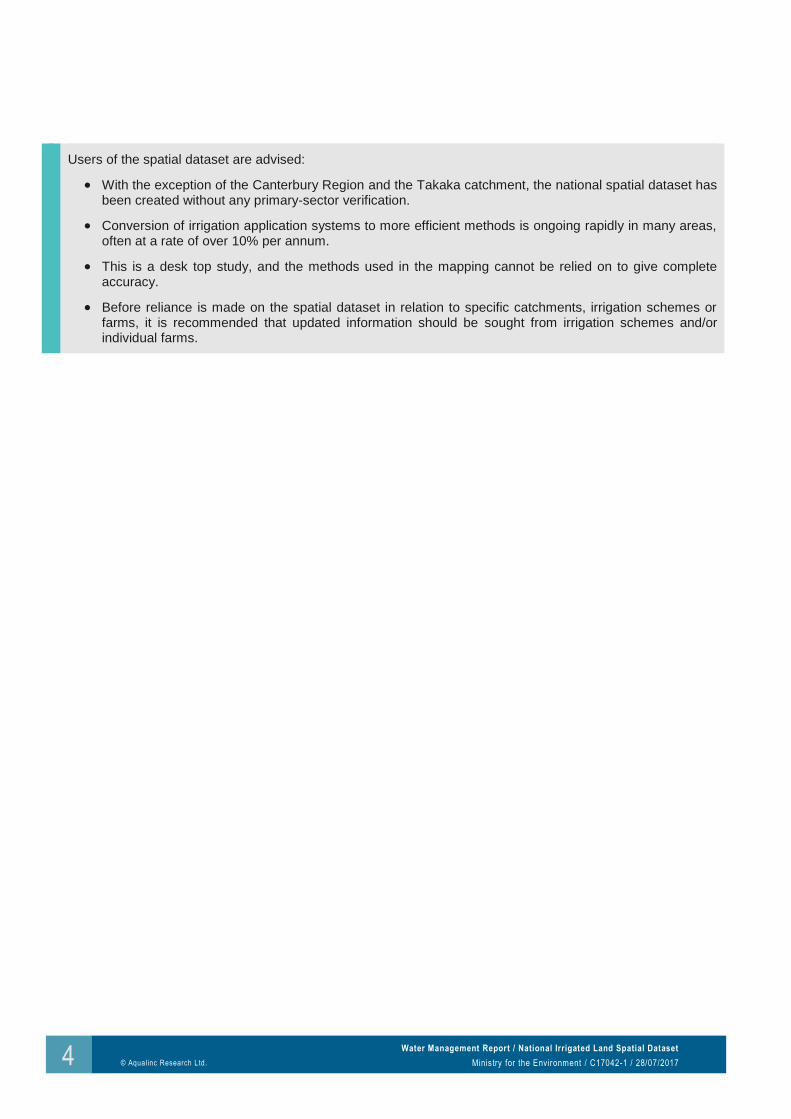
Users of the spatial dataset are advised:
With the exception of the Canterbury Region and the Takaka catchment, the national spatial dataset has been created without any primary-sector verification.
Conversion of irrigation application systems to more efficient methods is ongoing rapidly in many areas, often at a rate of over 10% per annum.
This is a desk top study, and the methods used in the mapping cannot be relied on to give complete accuracy.
Before reliance is made on the spatial dataset in relation to specific catchments, irrigation schemes or farms, it is recommended that updated information should be sought from irrigation schemes and/or individual farms.
Water Management Report / National Irrigated Land Spatial Dataset
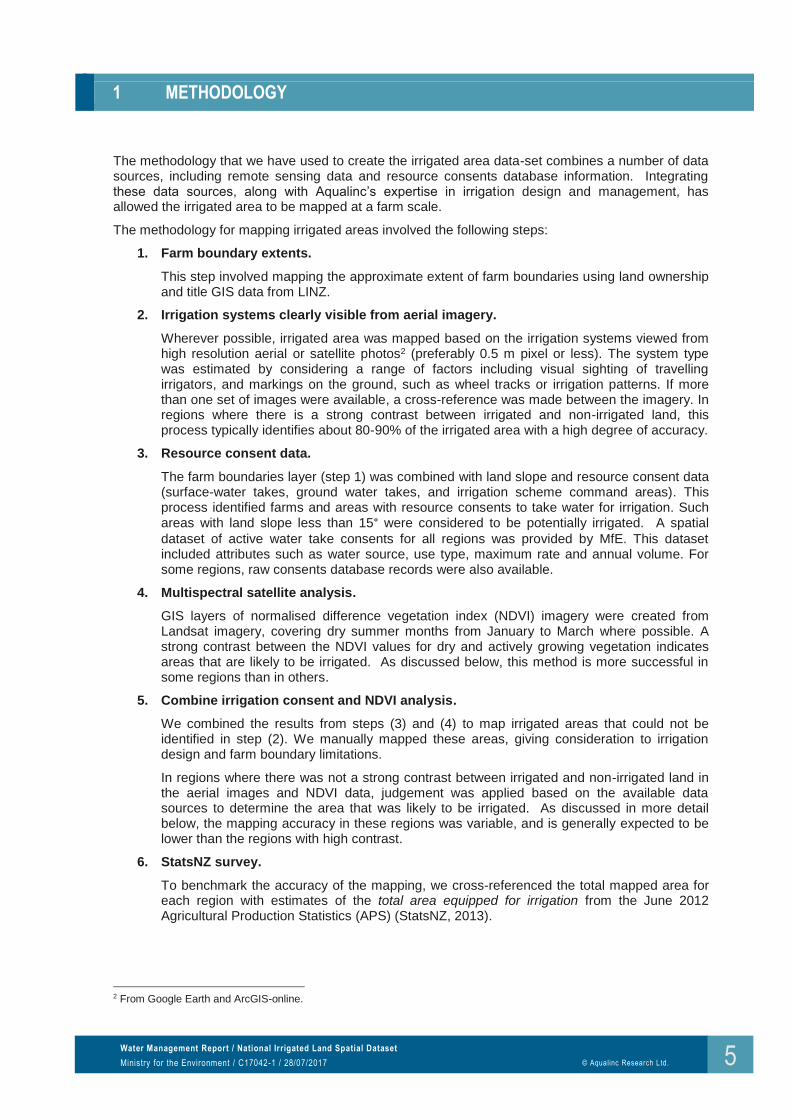
The methodology that we have used to create the irrigated area data-set combines a number of data sources, including remote sensing data and resource consents database information. Integrating these data sources, along with Aqualinc’s expertise in irrigation design and management, has allowed the irrigated area to be mapped at a farm scale.
The methodology for mapping irrigated areas involved the following steps:
1. Farm boundary extents.
This step involved mapping the approximate extent of farm boundaries using land ownership and title GIS data from LINZ.
2. Irrigation systems clearly visible from aerial imagery.
Wherever possible, irrigated area was mapped based on the irrigation systems viewed from high resolution aerial or satellite photos2 (preferably 0.5 m pixel or less). The system type was estimated by considering a range of factors including visual sighting of travelling irrigators, and markings on the ground, such as wheel tracks or irrigation patterns. If more than one set of images were available, a cross-reference was made between the imagery. In regions where there is a strong contrast between irrigated and non-irrigated land, this process typically identifies about 80-90% of the irrigated area with a high degree of accuracy.
3. Resource consent data.
The farm boundaries layer (step 1) was combined with land slope and resource consent data (surface-water takes, ground water takes, and irrigation scheme command areas). This process identified farms and areas with resource consents to take water for irrigation. Such areas with land slope less than 15° were considered to be potentially irrigated. A spatial
dataset of active water take consents for all regions was provided by MfE. This dataset included attributes such as water source, use type, maximum rate and annual volume. For some regions, raw consents database records were also available.
4. Multispectral satellite analysis.
GIS layers of normalised difference vegetation index (NDVI) imagery were created from Landsat imagery, covering dry summer months from January to March where possible. A strong contrast between the NDVI values for dry and actively growing vegetation indicates areas that are likely to be irrigated. As discussed below, this method is more successful in some regions than in others.
5. Combine irrigation consent and NDVI analysis.
We combined the results from steps (3) and (4) to map irrigated areas that could not be identified in step (2). We manually mapped these areas, giving consideration to irrigation design and farm boundary limitations.
In regions where there was not a strong contrast between irrigated and non-irrigated land in the aerial images and NDVI data, judgement was applied based on the available data sources to determine the area that was likely to be irrigated. As discussed in more detail below, the mapping accuracy in these regions was variable, and is generally expected to be lower than the regions with high contrast.
6. StatsNZ survey.
To benchmark the accuracy of the mapping, we cross-referenced the total mapped area for each region with estimates of the total area equipped for irrigation from the June 2012 Agricultural Production Statistics (APS) (StatsNZ, 2013).
Water Management Report / National Irrigated Land Spatial Dataset
Ministry for the Environment / C17042-1 / 28/07/2017
We did not necessarily follow a linear progression through all of the above steps. Depending on the availability and quality of data for each region, more weight was put on some steps than others to draw a conclusion on whether an area was is likely to be irrigated. For example, in regions where there was little contrast between irrigated and non-irrigated land in the aerial photos and NDVI imagery, areas within a farm boundary extent were assumed in most cases to be irrigated if an active consent existed within the property boundary.
Where irrigation systems were clearly visible it was usually not necessary to refer to resource consent data or NDVI imagery. Centre-pivots in particular can often be identified visually, from their wheel tracks or by sighting the pivot itself, even where there is little contrast between irrigated and unirrigated land.
The APS data includes only agricultural activity. The areas that we have mapped include some non-agricultural irrigation, such as golf courses.
1.1 NDVI contrast
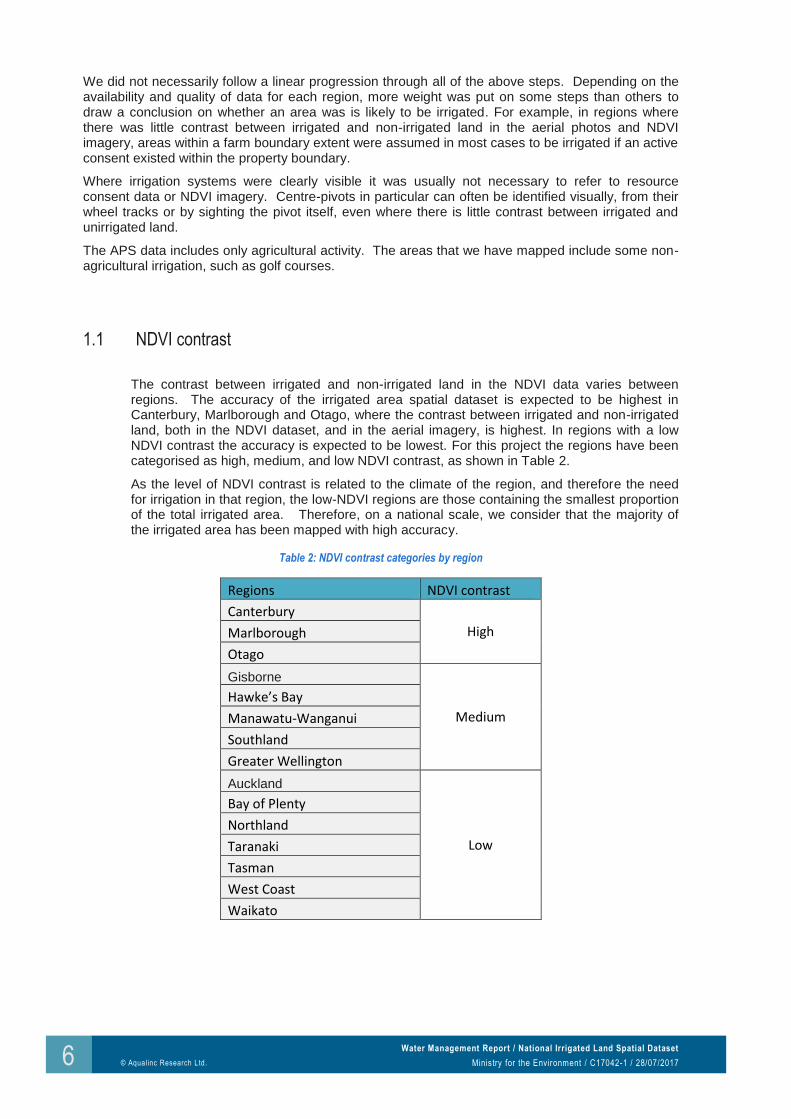
The contrast between irrigated and non-irrigated land in the NDVI data varies between regions. The accuracy of the irrigated area spatial dataset is expected to be highest in Canterbury, Marlborough and Otago, where the contrast between irrigated and non-irrigated land, both in the NDVI dataset, and in the aerial imagery, is highest. In regions with a low NDVI contrast the accuracy is expected to be lowest. For this project the regions have been categorised as high, medium, and low NDVI contrast, as shown in Table 2.
As the level of NDVI contrast is related to the climate of the region, and therefore the need for irrigation in that region, the low-NDVI regions are those containing the smallest proportion of the total irrigated area. Therefore, on a national scale, we consider that the majority of the irrigated area has been mapped with high accuracy.
Table 2: NDVI contrast categories by region
Regions NDVI contrast
Canterbury
High Marlborough
Otago
Gisborne
Medium
Hawke’s Bay
Manawatu-Wanganui
Southland
Greater Wellington
Auckland
Low
Bay of Plenty
Northland
Taranaki
Tasman
West Coast
Waikato
Water Management Report / National Irrigated Land Spatial Dataset
Uncertainty estimates have been provided for each region. Qualitatively, the factors contributing to uncertainty in the mapped area include:
Consent database errors
Land under development
Short-rotation crops that may not show up in aerial / satellite photos or NDVI imagery. This,
combined with uncertainty about a property’s irrigation system capacity (l/s/ha) can result in a
whole property being mapped as irrigated, when in fact only part of the property can be
irrigated at any one time
Difficulty in assigning individually-held surface water consents to properties when the
irrigation system is not clearly visible.
Recent conversions of previously irrigated urban-fringe land to housing
In the 2012 APS data it is noted that irrigable area may be irrigated by more than one system. We believe that this situation is rare, and will not have resulted in significant double-counting. We have not mapped multiple irrigation systems in any areas. Issues that particularly affect the low-NDVI regions are discussed further in Section 3.3.
1.2.1 Quantitative uncertainty estimates
For each feature that was mapped, a qualitative confidence level (high, medium, low) was assigned3. Generally there was a high degree of correlation between the irrigation system type and the degree of confidence in the mapping, for example centre-pivots can typically be mapped with a high degree of confidence, and if the irrigation system type cannot be determined the level of confidence in the mapped area is also likely to be low. Therefore the system type has been used to estimate the quantitative uncertainty of the mapping. The error percentages for each system type are based on our judgement of the degree of accuracy with which each system type can generally be mapped. This is consistent with the approach that was used in Canterbury.
In the Canterbury mapping, slightly different error percentages were assumed for each water management zone. Because the current project reports total areas on a broader scale (i.e. regions rather than water management zones), for this project, a set of average uncertainties for each system type was adopted for Canterbury. This has resulted in the estimated uncertainty reported here for Canterbury being slightly different to the overall value reported in Aqualinc (2016). The same percentages for each system type were applied to the other regions with high NDVI contrast.
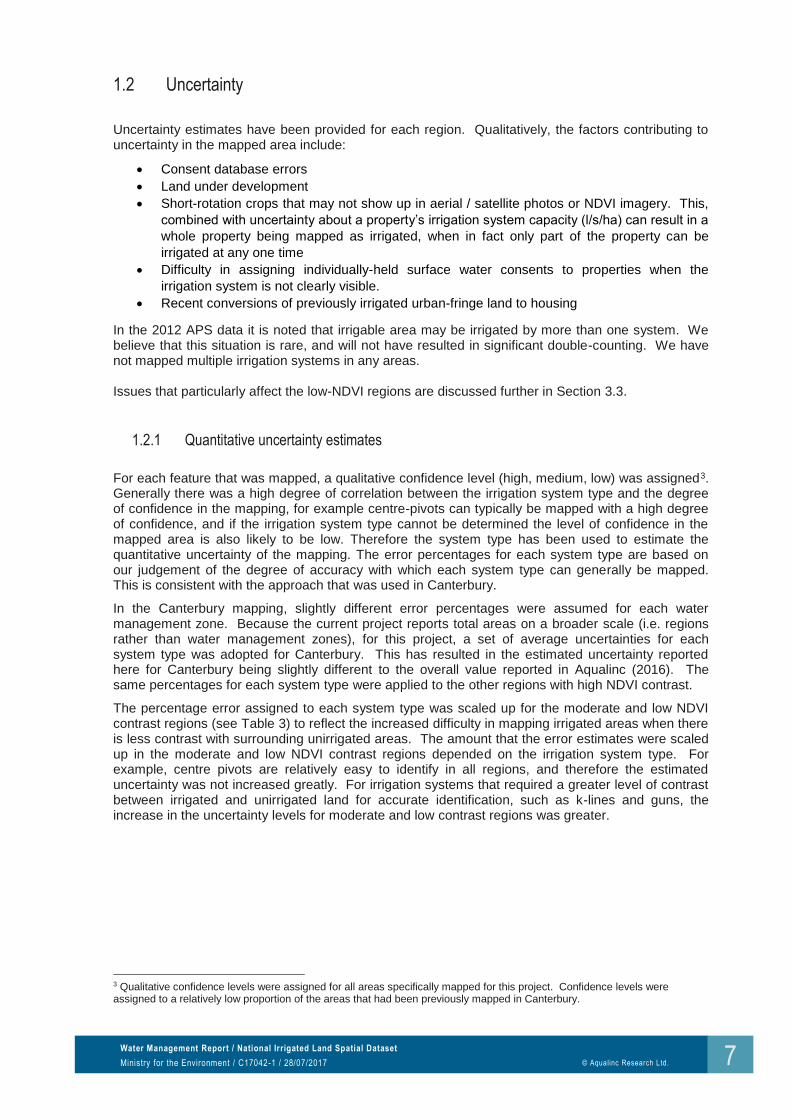
The percentage error assigned to each system type was scaled up for the moderate and low NDVI contrast regions (see Table 3) to reflect the increased difficulty in mapping irrigated areas when there is less contrast with surrounding unirrigated areas. The amount that the error estimates were scaled up in the moderate and low NDVI contrast regions depended on the irrigation system type. For example, centre pivots are relatively easy to identify in all regions, and therefore the estimated uncertainty was not increased greatly. For irrigation systems that required a greater level of contrast between irrigated and unirrigated land for accurate identification, such as k-lines and guns, the increase in the uncertainty levels for moderate and low contrast regions was greater.
3 Qualitative confidence levels were assigned for all areas specifically mapped for this project. Confidence levels were assigned to a relatively low proportion of the areas that had been previously mapped in Canterbury.
Water Management Report / National Irrigated Land Spatial Dataset
Ministry for the Environment / C17042-1 / 28/07/2017
Table 3: Estimated uncertainty levels based on system type and NDVI contrast
1.3 Limitations
The accuracy of the mapping varies between regions, depending on climate. In some areas, identification of irrigated land and irrigation system type is difficult due to the lack of visual contrast between irrigated and non-irrigated land.
Land used for short-rotation cropping may not be identifiable as irrigated if no crop was actively growing when the aerial photo or imagery was taken.
Apart from Canterbury (which had been mapped previously for Environment Canterbury and included with this dataset for completeness), and the Takaka catchment, the scope of this project has not allowed for primary-sector validation to be undertaken.
Overall, the mapping accuracy for this project is not expected to be as high as was achieved in Canterbury, due to the greater resourcing available for the Canterbury mapping, the high visual contrast between irrigated and non-irrigated land, and the fact that primary sector validation was carried out. Furthermore a higher proportion of the irrigated area outside of Canterbury was mapped as “unknown” system type, reducing our confidence in the results.
Any errors in the Councils’ consent data that was provided for the project may also result in errors in the mapping.
This dataset provides a national overview, and is not appropriate for use at farm or irrigation-scheme scale without validation. Before reliance is made on the spatial dataset in relation to specific catchments, irrigation schemes or farms, it is recommended that updated information should be sought from irrigation schemes and/or individual farms.
Irrigation system type
Estimated uncertainty
High NDVI-contrast
Moderate NDVI-
contrast
Low NDVI-contrast
Pivot 2% 2% 3%
Lateral 2% 2% 3%
Drip/micro 5% 7% 9%
Roto-Rainer 5% 7% 12%
Linear boom 5% 7% 10%
K-line/Long lateral 6% 10% 15%
Solid set 5% 7% 10%
Gun 7% 10% 15%
Border dyke 5% 10% 15%
Side-roll 8% 12% 15%
Wild flooding 8% 12% 15%
Unknown 10% 15% 20%
Water Management Report / National Irrigated Land Spatial Dataset
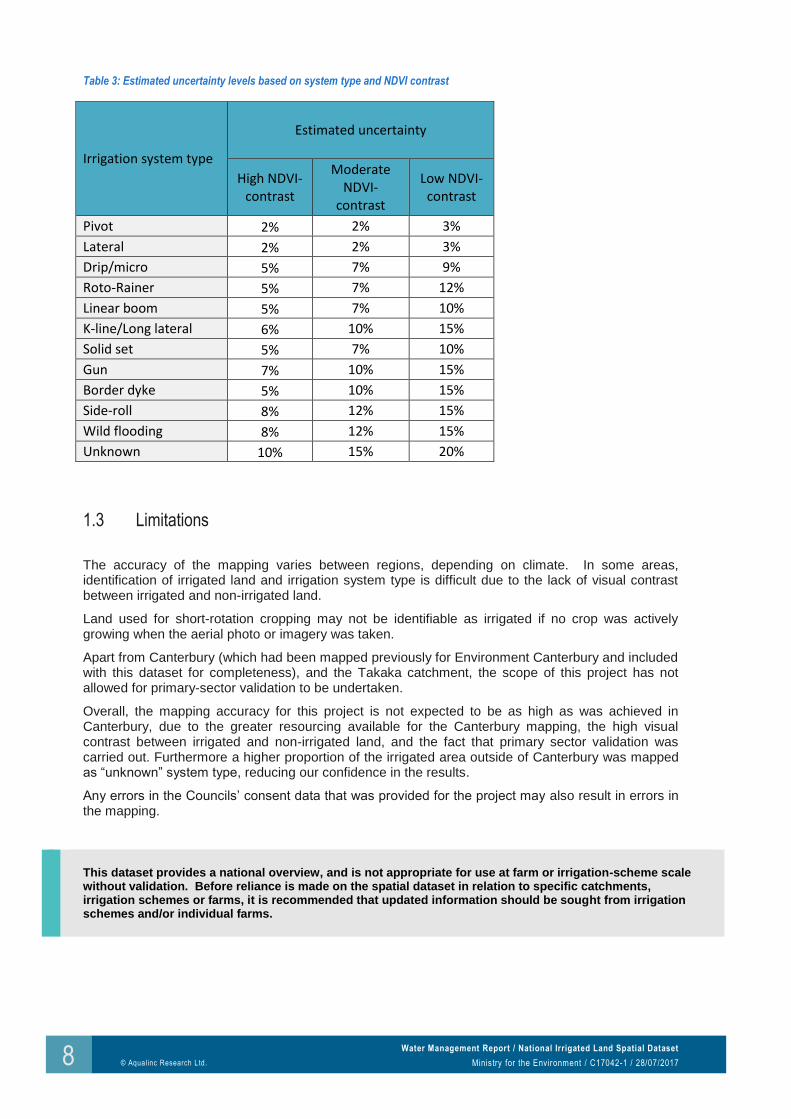
In total we have mapped estimated 794,443 ha of irrigated area in 2017. Although this is 10% greater than the 2012 APS (StatsNZ, 2013), the two totals are derived from different methodologies, and the difference between them does not necessarily indicate a 10% increase in total irrigated area. The areas that we have mapped for each region are summarised in Table 4.
Canterbury alone represents nearly two thirds of the country’s total irrigated area.
Table 4: Summary of mapped irrigated area by region
Region Irrigated area (ha)
% of total irrigated area
Canterbury 507,418 64%
Marlborough 31,421 4%
Otago 93,080 12%
Gisborne 6,467 1%
Hawke’s Bay 28,804 4%
Manawatu-Wanganui 23,710 3%
Southland 18,908 2%
Wellington 17,577 2%
Auckland 7,958 1%
Bay of Plenty 7,850 1%
Northland 8,390 1%
Taranaki 3,575 <1%
Tasman 11,924 2%
West Coast 3,622 <1%
Waikato 23,740 3%
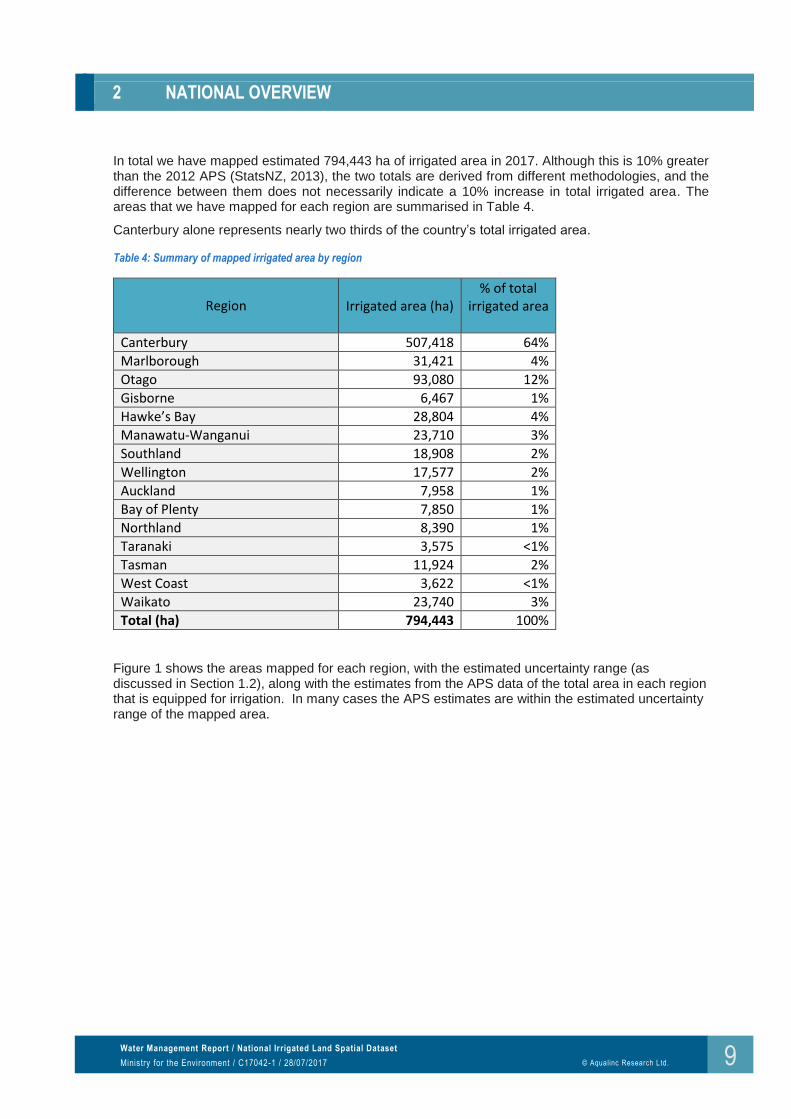
Total (ha) 794,443 100% Figure 1 shows the areas mapped for each region, with the estimated uncertainty range (as discussed in Section 1.2), along with the estimates from the APS data of the total area in each region that is equipped for irrigation. In many cases the APS estimates are within the estimated uncertainty range of the mapped area.
Water Management Report / National Irrigated Land Spatial Dataset
Ministry for the Environment / C17042-1 / 28/07/2017
Figure 1: Total mapped irrigated area for each region, with error estimates, compared to APS 2012 estimates
Table 5 summarises total irrigated area by regions and system types, with error estimates and percentages by region and system type.
Nationally, centre pivot irrigation covers the largest proportion of the irrigated area (35%).
Approximately 16% of the national dataset has been mapped as “unknown” irrigation system type. This was largely in the moderate and low-NDVI regions, where it was more difficult to identify the actual irrigated areas.
Water Management Report / National Irrigated Land Spatial Dataset
Water Management Report / National Irrigated Land Spatial Dataset
Ministry for the Environment / C17042-1 / 28/07/2017
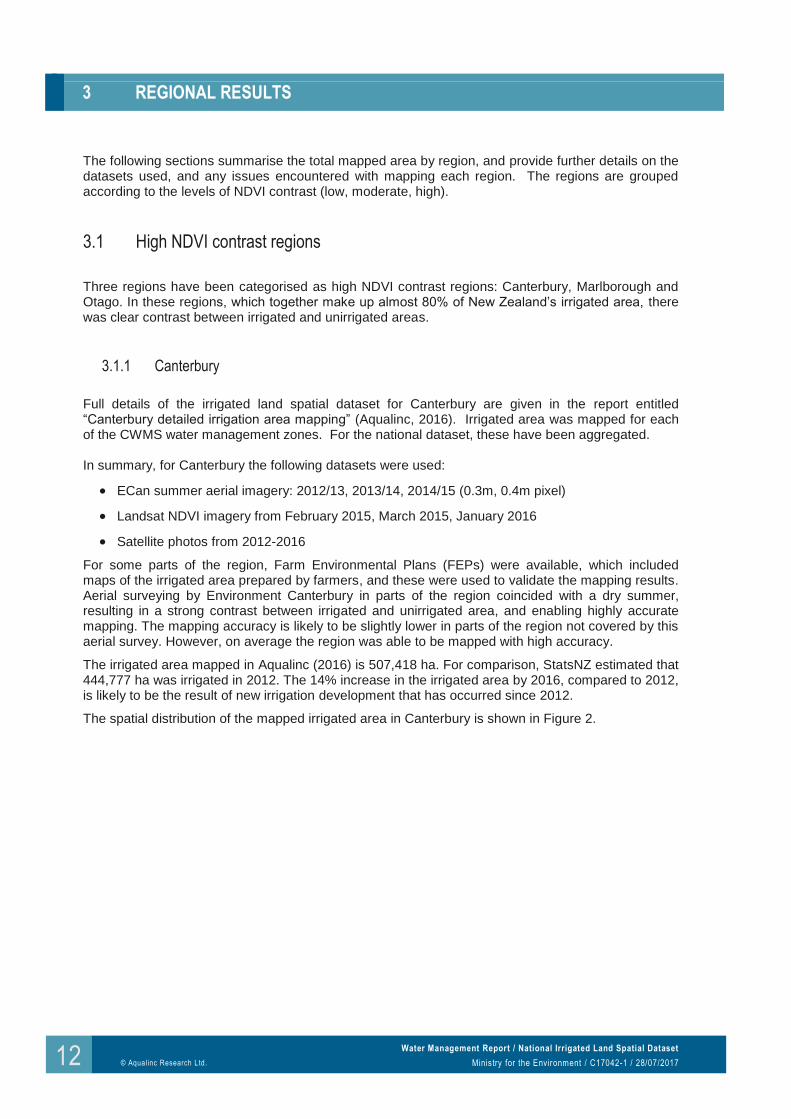
3 REGIONAL RESULTS
The following sections summarise the total mapped area by region, and provide further details on the datasets used, and any issues encountered with mapping each region. The regions are grouped according to the levels of NDVI contrast (low, moderate, high).
3.1 High NDVI contrast regions
Three regions have been categorised as high NDVI contrast regions: Canterbury, Marlborough and Otago. In these regions, which together make up almost 80% of New Zealand’s irrigated area, there was clear contrast between irrigated and unirrigated areas.
3.1.1 Canterbury
Full details of the irrigated land spatial dataset for Canterbury are given in the report entitled “Canterbury detailed irrigation area mapping” (Aqualinc, 2016). Irrigated area was mapped for each of the CWMS water management zones. For the national dataset, these have been aggregated. In summary, for Canterbury the following datasets were used:
Landsat NDVI imagery from February 2015, March 2015, January 2016
Satellite photos from 2012-2016
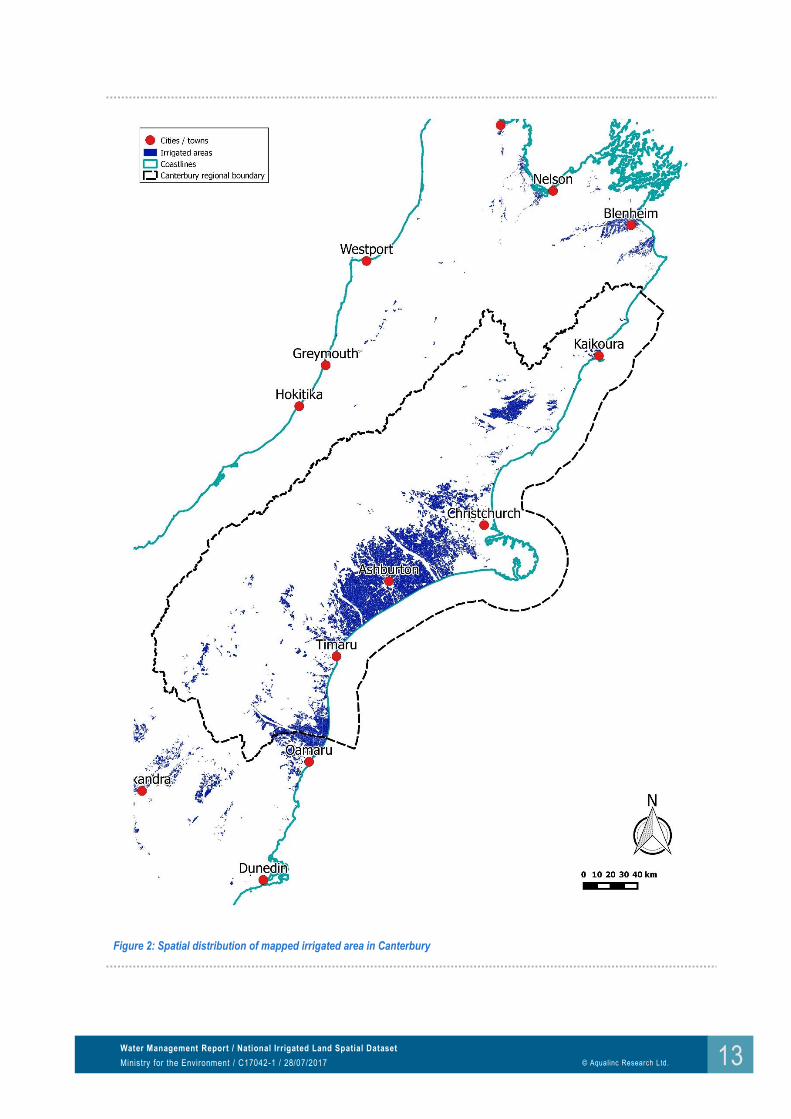
For some parts of the region, Farm Environmental Plans (FEPs) were available, which included maps of the irrigated area prepared by farmers, and these were used to validate the mapping results. Aerial surveying by Environment Canterbury in parts of the region coincided with a dry summer, resulting in a strong contrast between irrigated and unirrigated area, and enabling highly accurate mapping. The mapping accuracy is likely to be slightly lower in parts of the region not covered by this aerial survey. However, on average the region was able to be mapped with high accuracy.
The irrigated area mapped in Aqualinc (2016) is 507,418 ha. For comparison, StatsNZ estimated that 444,777 ha was irrigated in 2012. The 14% increase in the irrigated area by 2016, compared to 2012, is likely to be the result of new irrigation development that has occurred since 2012.
The spatial distribution of the mapped irrigated area in Canterbury is shown in Figure 2.
Water Management Report / National Irrigated Land Spatial Dataset
Water Management Report / National Irrigated Land Spatial Dataset
Ministry for the Environment / C17042-1 / 28/07/2017
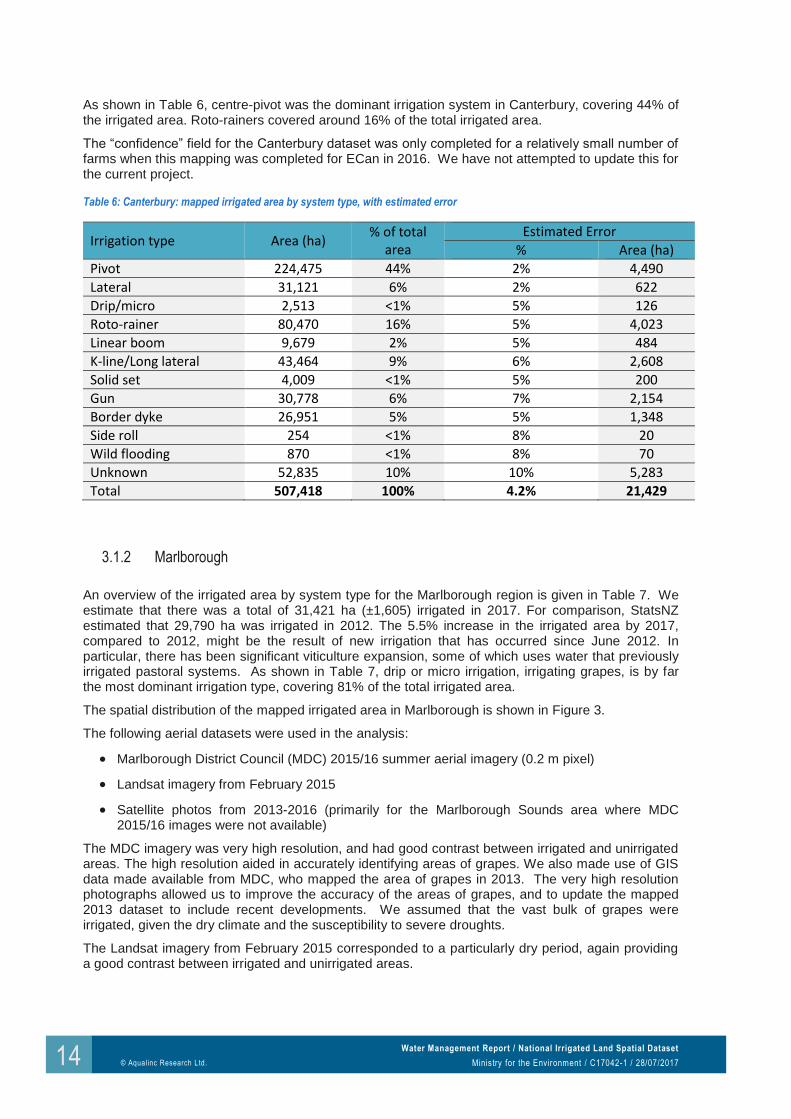
As shown in Table 6, centre-pivot was the dominant irrigation system in Canterbury, covering 44% of the irrigated area. Roto-rainers covered around 16% of the total irrigated area.
The “confidence” field for the Canterbury dataset was only completed for a relatively small number of farms when this mapping was completed for ECan in 2016. We have not attempted to update this for the current project.
Table 6: Canterbury: mapped irrigated area by system type, with estimated error
Irrigation type Area (ha) % of total
area Estimated Error
% Area (ha)
Pivot 224,475 44% 2% 4,490
Lateral 31,121 6% 2% 622
Drip/micro 2,513 <1% 5% 126
Roto-rainer 80,470 16% 5% 4,023
Linear boom 9,679 2% 5% 484
K-line/Long lateral 43,464 9% 6% 2,608
Solid set 4,009 <1% 5% 200
Gun 30,778 6% 7% 2,154
Border dyke 26,951 5% 5% 1,348
Side roll 254 <1% 8% 20
Wild flooding 870 <1% 8% 70
Unknown 52,835 10% 10% 5,283
Total 507,418 100% 4.2% 21,429
3.1.2 Marlborough
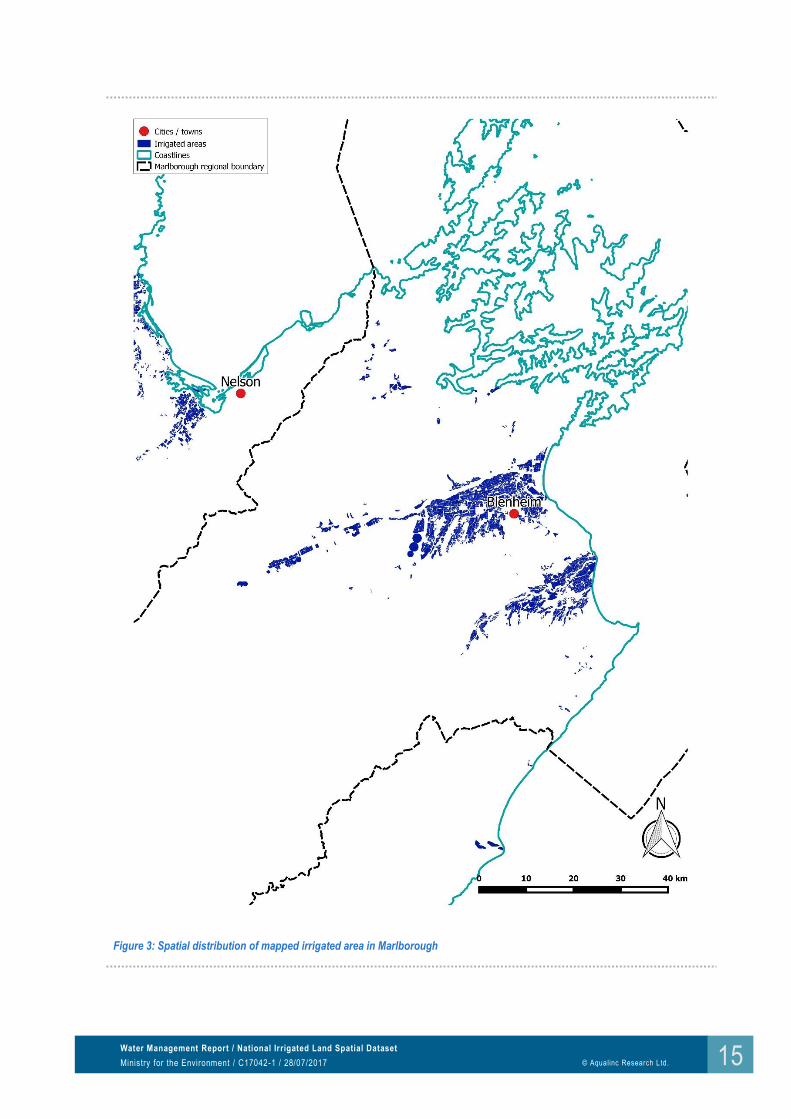
An overview of the irrigated area by system type for the Marlborough region is given in Table 7. We estimate that there was a total of 31,421 ha (±1,605) irrigated in 2017. For comparison, StatsNZ estimated that 29,790 ha was irrigated in 2012. The 5.5% increase in the irrigated area by 2017, compared to 2012, might be the result of new irrigation that has occurred since June 2012. In particular, there has been significant viticulture expansion, some of which uses water that previously irrigated pastoral systems. As shown in Table 7, drip or micro irrigation, irrigating grapes, is by far the most dominant irrigation type, covering 81% of the total irrigated area.
The spatial distribution of the mapped irrigated area in Marlborough is shown in Figure 3.
The following aerial datasets were used in the analysis:
Marlborough District Council (MDC) 2015/16 summer aerial imagery (0.2 m pixel)
Landsat imagery from February 2015
Satellite photos from 2013-2016 (primarily for the Marlborough Sounds area where MDC 2015/16 images were not available)
The MDC imagery was very high resolution, and had good contrast between irrigated and unirrigated areas. The high resolution aided in accurately identifying areas of grapes. We also made use of GIS data made available from MDC, who mapped the area of grapes in 2013. The very high resolution photographs allowed us to improve the accuracy of the areas of grapes, and to update the mapped 2013 dataset to include recent developments. We assumed that the vast bulk of grapes were irrigated, given the dry climate and the susceptibility to severe droughts.
The Landsat imagery from February 2015 corresponded to a particularly dry period, again providing a good contrast between irrigated and unirrigated areas.
Water Management Report / National Irrigated Land Spatial Dataset
Water Management Report / National Irrigated Land Spatial Dataset
Ministry for the Environment / C17042-1 / 28/07/2017
We also made use of irrigation consent data provided by MfE. A significant number of the properties irrigated did not have a water permit on the property, presumably because the water was sourced from either a community supply, or where private consents took water that was then conveyed a reasonable distance from the point of take to the irrigated area.
The combination of good aerial photographs, and the dry climate, meant that for this region irrigated area mapping is particularly accurate.
Table 7: Marlborough: mapped irrigated area by system type, with estimated error
Irrigation type Area (ha) % of total
area Estimated Error
% Area (ha)
Pivot 1,963 6% 2% 39
Drip/micro 25,307 81% 5% 1,265
Roto-rainer 295 <1% 5% 15
Linear boom 523 2% 5% 26
K-line/Long lateral 1,319 4% 6% 79
Gun 692 2% 7% 48
Unknown 1,321 4% 10% 132
Total 31,421 100% 5.1% 1,605
3.1.3 Otago
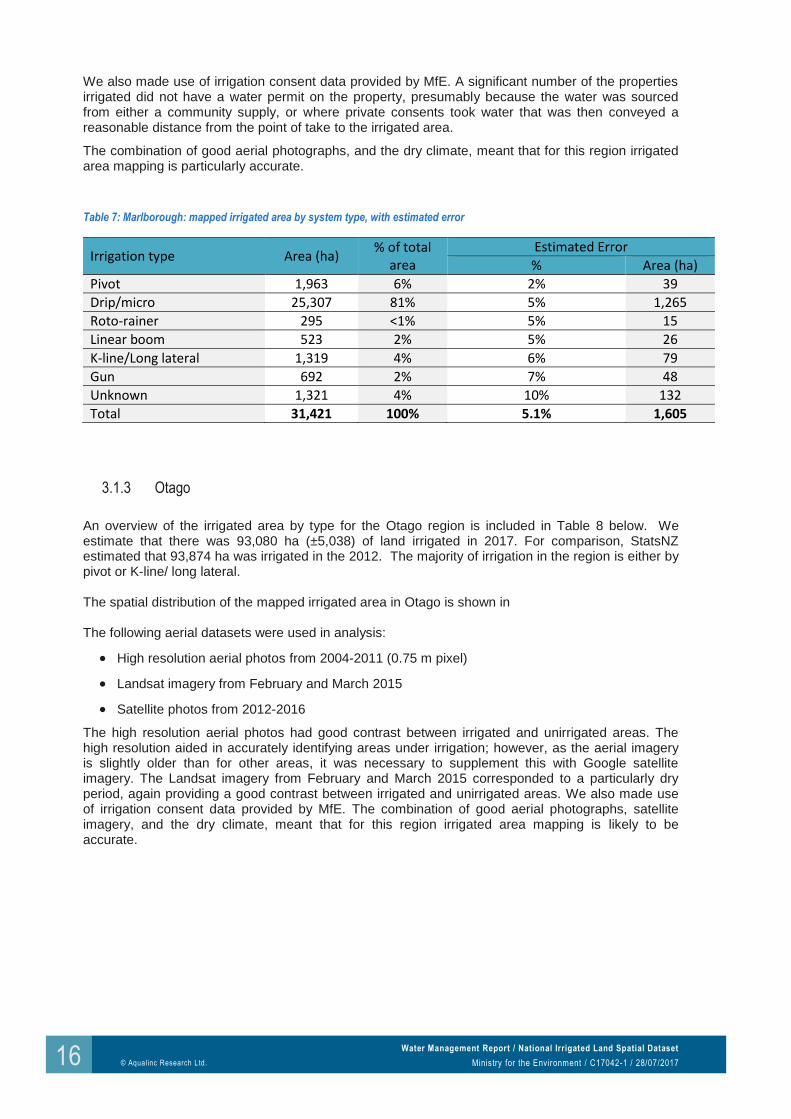
An overview of the irrigated area by type for the Otago region is included in Table 8 below. We estimate that there was 93,080 ha (±5,038) of land irrigated in 2017. For comparison, StatsNZ estimated that 93,874 ha was irrigated in the 2012. The majority of irrigation in the region is either by pivot or K-line/ long lateral. The spatial distribution of the mapped irrigated area in Otago is shown in The following aerial datasets were used in analysis:
High resolution aerial photos from 2004-2011 (0.75 m pixel)
Landsat imagery from February and March 2015
Satellite photos from 2012-2016
The high resolution aerial photos had good contrast between irrigated and unirrigated areas. The high resolution aided in accurately identifying areas under irrigation; however, as the aerial imagery is slightly older than for other areas, it was necessary to supplement this with Google satellite imagery. The Landsat imagery from February and March 2015 corresponded to a particularly dry period, again providing a good contrast between irrigated and unirrigated areas. We also made use of irrigation consent data provided by MfE. The combination of good aerial photographs, satellite imagery, and the dry climate, meant that for this region irrigated area mapping is likely to be accurate.
Water Management Report / National Irrigated Land Spatial Dataset
Water Management Report / National Irrigated Land Spatial Dataset
Ministry for the Environment / C17042-1 / 28/07/2017
Table 8: Otago: mapped irrigated area by system type, with estimated error
Irrigation type Area (ha) % of total area Estimated Error
% Area (ha)
Pivot 25,422 27% 2% 508
Drip/micro 3,320 4% 5% 166
Roto-rainer 2,924 3% 5% 146
Linear boom 24 <1% 5% 1
K-line/Long lateral 25,011 27% 6% 1,501
Solid set 299 <1% 5% 15
Gun 2,378 3% 7% 166
Border dyke 13,915 15% 5% 696
Wild flooding 7,004 8% 8% 560
Unknown 12,783 14% 10% 1,278
Total 93,080 100% 5.4% 5,038
3.2 Moderate NDVI contrast regions
Five regions have been categorised as having moderate NDVI contrast: Gisborne, Hawke’s Bay, Manawatu-Wanganui, Southland and Greater Wellington. In these regions there was reasonably good contrast between irrigated and unirrigated area, however this varied between different regions, and within individual regions.
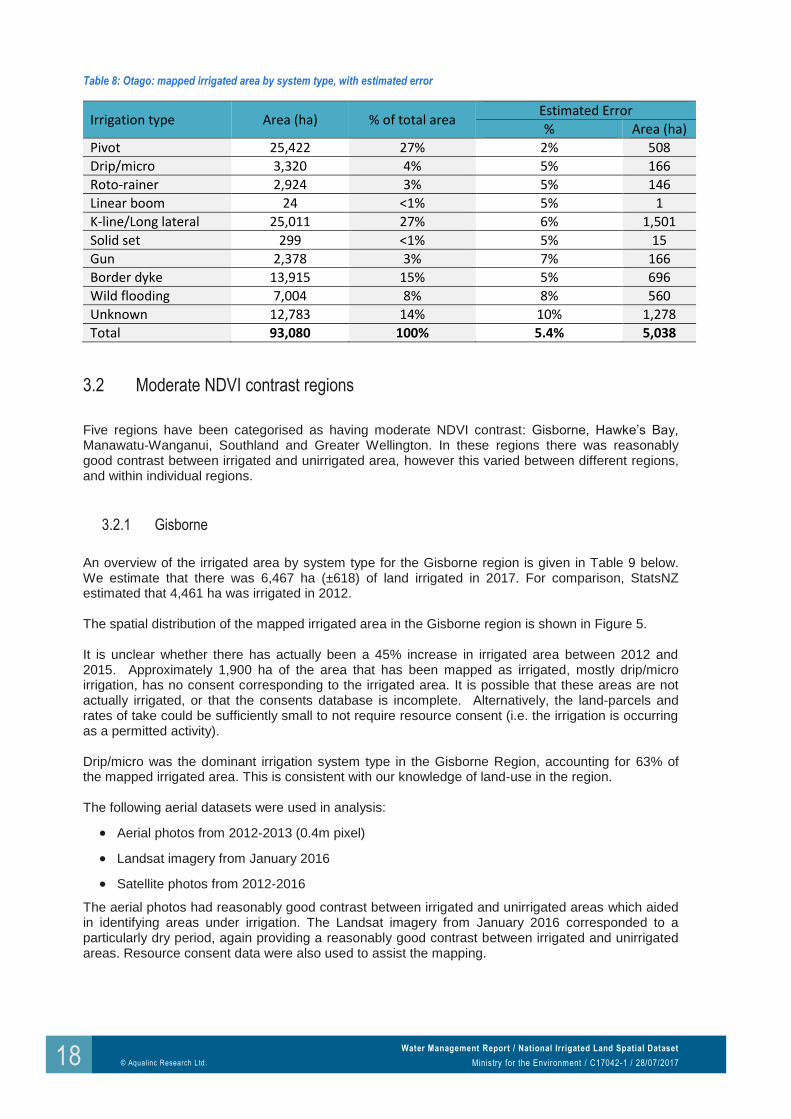
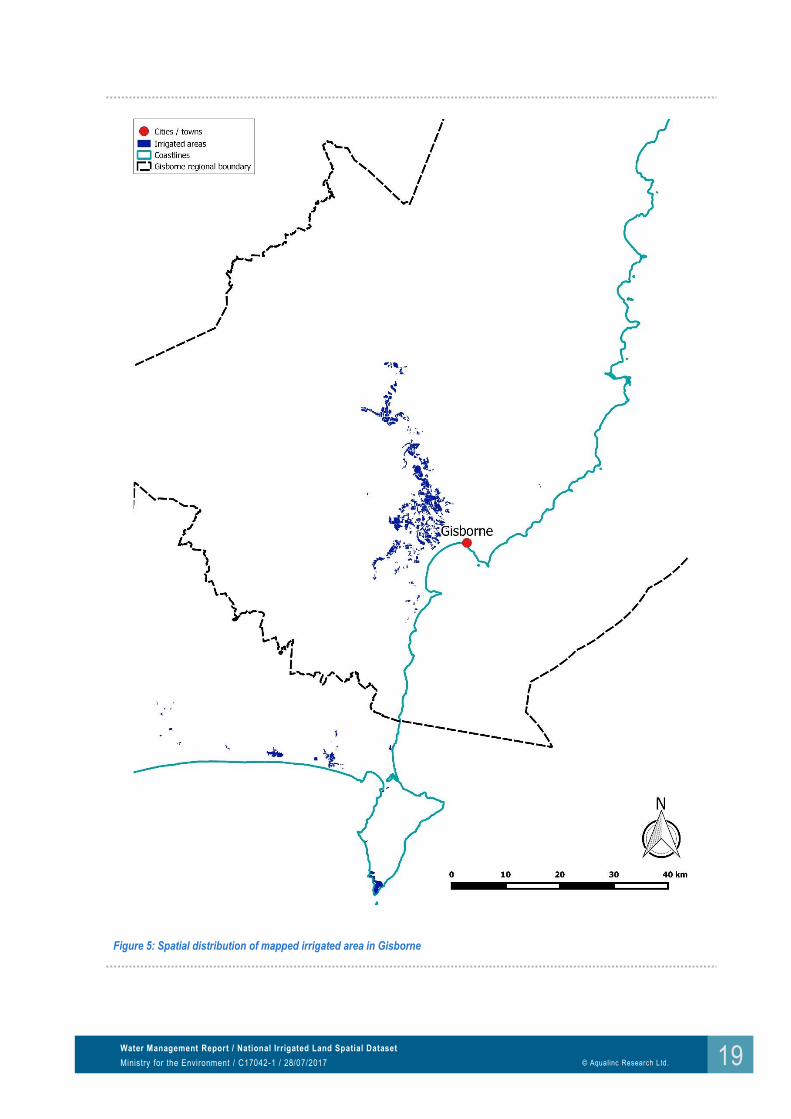
3.2.1 Gisborne
An overview of the irrigated area by system type for the Gisborne region is given in Table 9 below. We estimate that there was 6,467 ha (±618) of land irrigated in 2017. For comparison, StatsNZ estimated that 4,461 ha was irrigated in 2012. The spatial distribution of the mapped irrigated area in the Gisborne region is shown in Figure 5. It is unclear whether there has actually been a 45% increase in irrigated area between 2012 and 2015. Approximately 1,900 ha of the area that has been mapped as irrigated, mostly drip/micro irrigation, has no consent corresponding to the irrigated area. It is possible that these areas are not actually irrigated, or that the consents database is incomplete. Alternatively, the land-parcels and rates of take could be sufficiently small to not require resource consent (i.e. the irrigation is occurring as a permitted activity). Drip/micro was the dominant irrigation system type in the Gisborne Region, accounting for 63% of the mapped irrigated area. This is consistent with our knowledge of land-use in the region. The following aerial datasets were used in analysis:
Aerial photos from 2012-2013 (0.4m pixel)
Landsat imagery from January 2016
Satellite photos from 2012-2016
The aerial photos had reasonably good contrast between irrigated and unirrigated areas which aided in identifying areas under irrigation. The Landsat imagery from January 2016 corresponded to a particularly dry period, again providing a reasonably good contrast between irrigated and unirrigated areas. Resource consent data were also used to assist the mapping.
Water Management Report / National Irrigated Land Spatial Dataset
Water Management Report / National Irrigated Land Spatial Dataset
Ministry for the Environment / C17042-1 / 28/07/2017
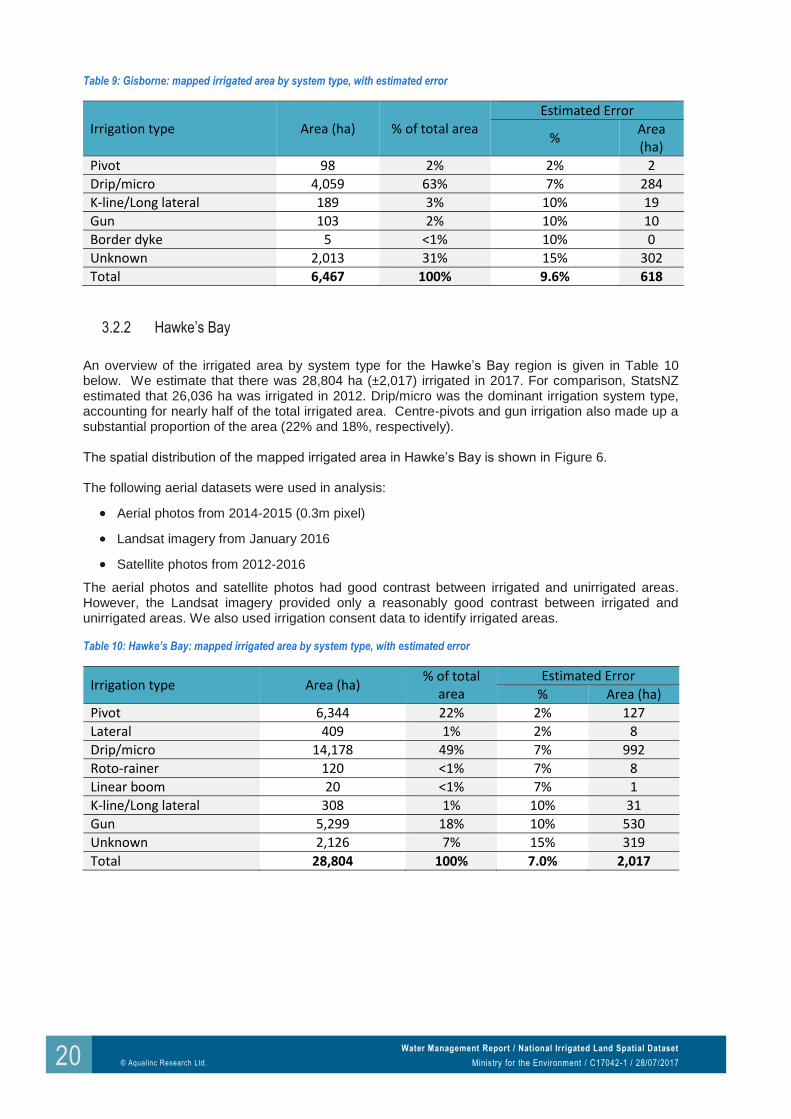
Table 9: Gisborne: mapped irrigated area by system type, with estimated error
Irrigation type Area (ha) % of total area Estimated Error
% Area (ha)
Pivot 98 2% 2% 2
Drip/micro 4,059 63% 7% 284
K-line/Long lateral 189 3% 10% 19
Gun 103 2% 10% 10
Border dyke 5 <1% 10% 0
Unknown 2,013 31% 15% 302
Total 6,467 100% 9.6% 618
3.2.2 Hawke’s Bay
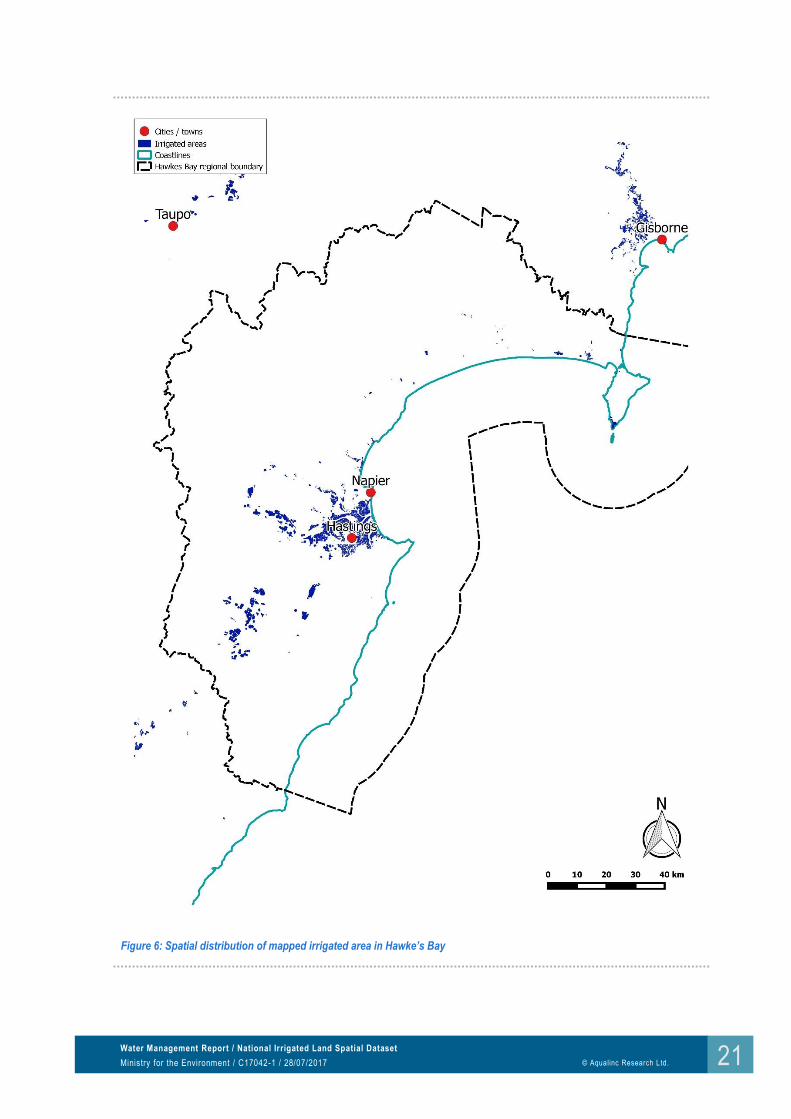
An overview of the irrigated area by system type for the Hawke’s Bay region is given in Table 10 below. We estimate that there was 28,804 ha (±2,017) irrigated in 2017. For comparison, StatsNZ estimated that 26,036 ha was irrigated in 2012. Drip/micro was the dominant irrigation system type, accounting for nearly half of the total irrigated area. Centre-pivots and gun irrigation also made up a substantial proportion of the area (22% and 18%, respectively). The spatial distribution of the mapped irrigated area in Hawke’s Bay is shown in Figure 6. The following aerial datasets were used in analysis:
Aerial photos from 2014-2015 (0.3m pixel)
Landsat imagery from January 2016
Satellite photos from 2012-2016
The aerial photos and satellite photos had good contrast between irrigated and unirrigated areas. However, the Landsat imagery provided only a reasonably good contrast between irrigated and unirrigated areas. We also used irrigation consent data to identify irrigated areas.
Table 10: Hawke’s Bay: mapped irrigated area by system type, with estimated error
Irrigation type Area (ha) % of total
area Estimated Error
% Area (ha)
Pivot 6,344 22% 2% 127
Lateral 409 1% 2% 8
Drip/micro 14,178 49% 7% 992
Roto-rainer 120 <1% 7% 8
Linear boom 20 <1% 7% 1
K-line/Long lateral 308 1% 10% 31
Gun 5,299 18% 10% 530
Unknown 2,126 7% 15% 319
Total 28,804 100% 7.0% 2,017
Water Management Report / National Irrigated Land Spatial Dataset
Water Management Report / National Irrigated Land Spatial Dataset
Ministry for the Environment / C17042-1 / 28/07/2017
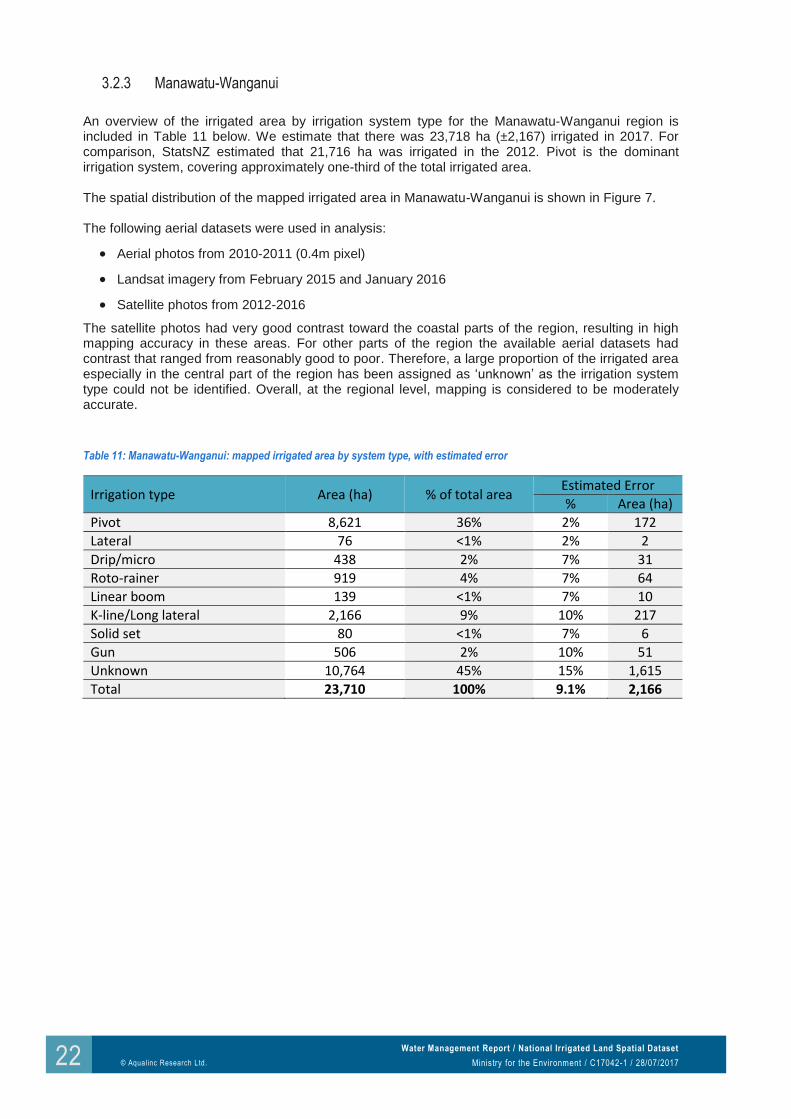
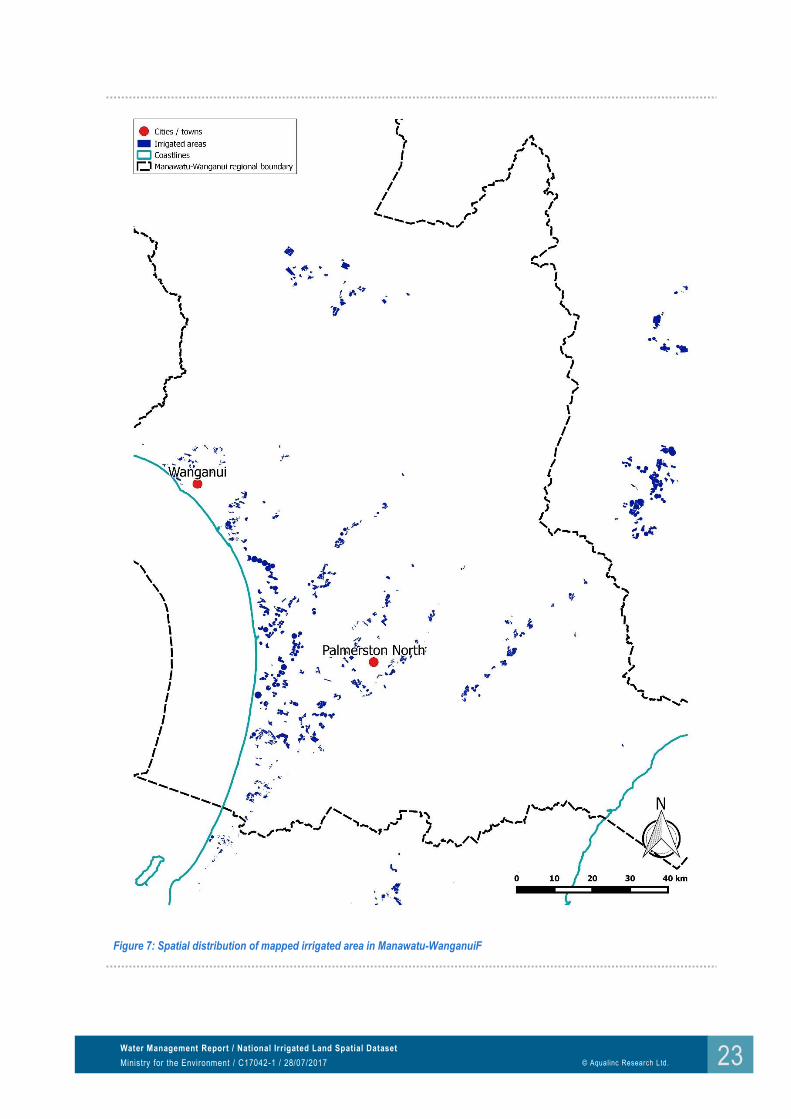
3.2.3 Manawatu-Wanganui
An overview of the irrigated area by irrigation system type for the Manawatu-Wanganui region is included in Table 11 below. We estimate that there was 23,718 ha (±2,167) irrigated in 2017. For comparison, StatsNZ estimated that 21,716 ha was irrigated in the 2012. Pivot is the dominant irrigation system, covering approximately one-third of the total irrigated area. The spatial distribution of the mapped irrigated area in Manawatu-Wanganui is shown in Figure 7. The following aerial datasets were used in analysis:
Aerial photos from 2010-2011 (0.4m pixel)
Landsat imagery from February 2015 and January 2016
Satellite photos from 2012-2016
The satellite photos had very good contrast toward the coastal parts of the region, resulting in high mapping accuracy in these areas. For other parts of the region the available aerial datasets had contrast that ranged from reasonably good to poor. Therefore, a large proportion of the irrigated area especially in the central part of the region has been assigned as ‘unknown’ as the irrigation system type could not be identified. Overall, at the regional level, mapping is considered to be moderately accurate.
Table 11: Manawatu-Wanganui: mapped irrigated area by system type, with estimated error
Irrigation type Area (ha) % of total area Estimated Error
% Area (ha)
Pivot 8,621 36% 2% 172
Lateral 76 <1% 2% 2
Drip/micro 438 2% 7% 31
Roto-rainer 919 4% 7% 64
Linear boom 139 <1% 7% 10
K-line/Long lateral 2,166 9% 10% 217
Solid set 80 <1% 7% 6
Gun 506 2% 10% 51
Unknown 10,764 45% 15% 1,615
Total 23,710 100% 9.1% 2,166
Water Management Report / National Irrigated Land Spatial Dataset
Water Management Report / National Irrigated Land Spatial Dataset
Ministry for the Environment / C17042-1 / 28/07/2017
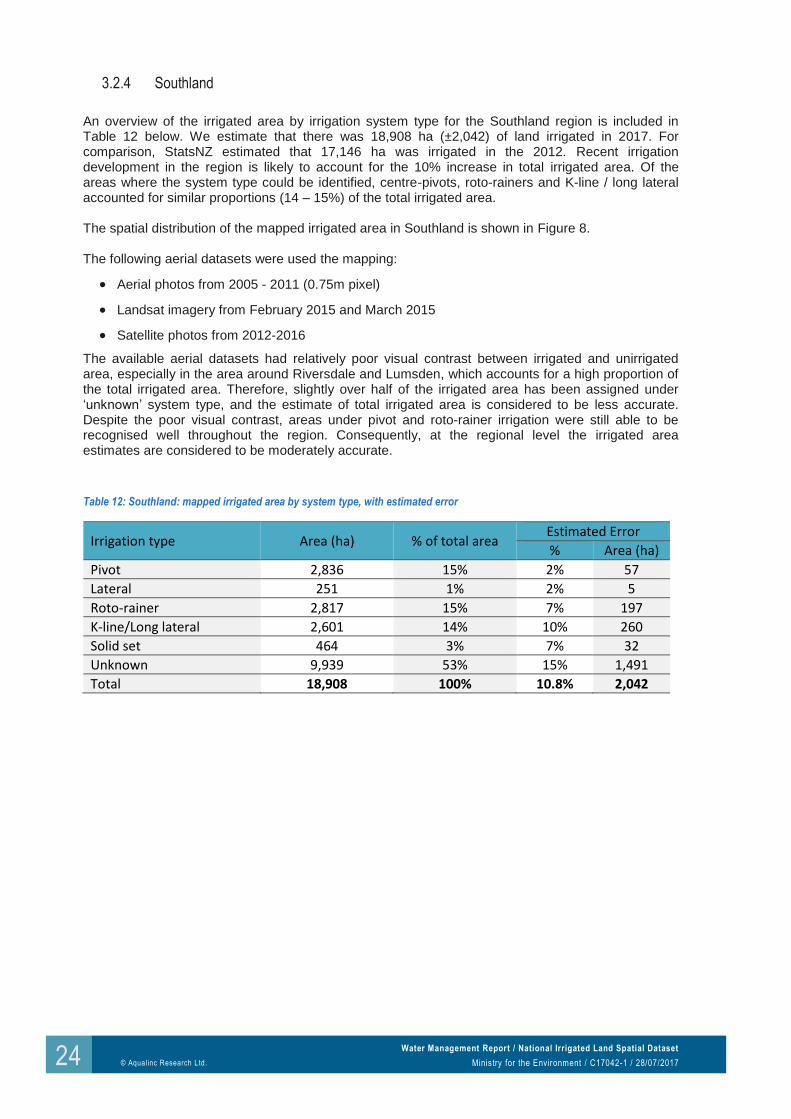
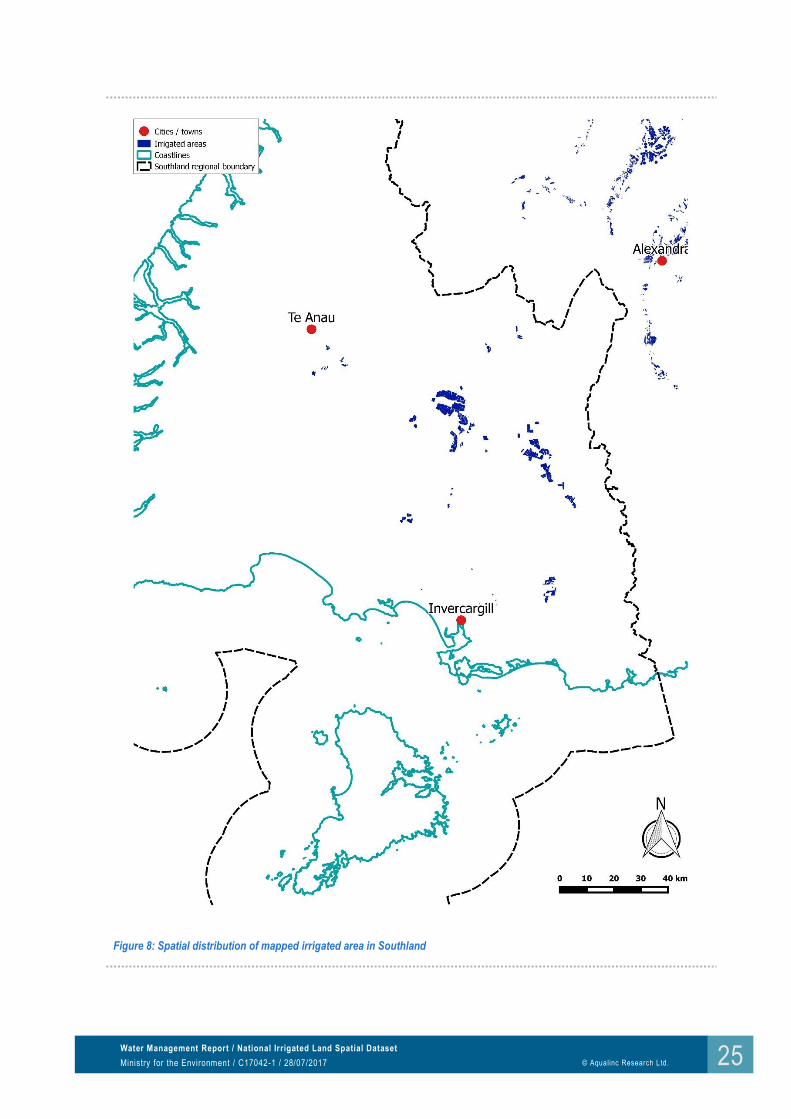
3.2.4 Southland
An overview of the irrigated area by irrigation system type for the Southland region is included in Table 12 below. We estimate that there was 18,908 ha (±2,042) of land irrigated in 2017. For comparison, StatsNZ estimated that 17,146 ha was irrigated in the 2012. Recent irrigation development in the region is likely to account for the 10% increase in total irrigated area. Of the areas where the system type could be identified, centre-pivots, roto-rainers and K-line / long lateral accounted for similar proportions (14 – 15%) of the total irrigated area. The spatial distribution of the mapped irrigated area in Southland is shown in Figure 8. The following aerial datasets were used the mapping:
Aerial photos from 2005 - 2011 (0.75m pixel)
Landsat imagery from February 2015 and March 2015
Satellite photos from 2012-2016
The available aerial datasets had relatively poor visual contrast between irrigated and unirrigated area, especially in the area around Riversdale and Lumsden, which accounts for a high proportion of the total irrigated area. Therefore, slightly over half of the irrigated area has been assigned under ‘unknown’ system type, and the estimate of total irrigated area is considered to be less accurate. Despite the poor visual contrast, areas under pivot and roto-rainer irrigation were still able to be recognised well throughout the region. Consequently, at the regional level the irrigated area estimates are considered to be moderately accurate.
Table 12: Southland: mapped irrigated area by system type, with estimated error
Irrigation type Area (ha) % of total area Estimated Error
% Area (ha)
Pivot 2,836 15% 2% 57
Lateral 251 1% 2% 5
Roto-rainer 2,817 15% 7% 197
K-line/Long lateral 2,601 14% 10% 260
Solid set 464 3% 7% 32
Unknown 9,939 53% 15% 1,491
Total 18,908 100% 10.8% 2,042
Water Management Report / National Irrigated Land Spatial Dataset
Water Management Report / National Irrigated Land Spatial Dataset
Ministry for the Environment / C17042-1 / 28/07/2017
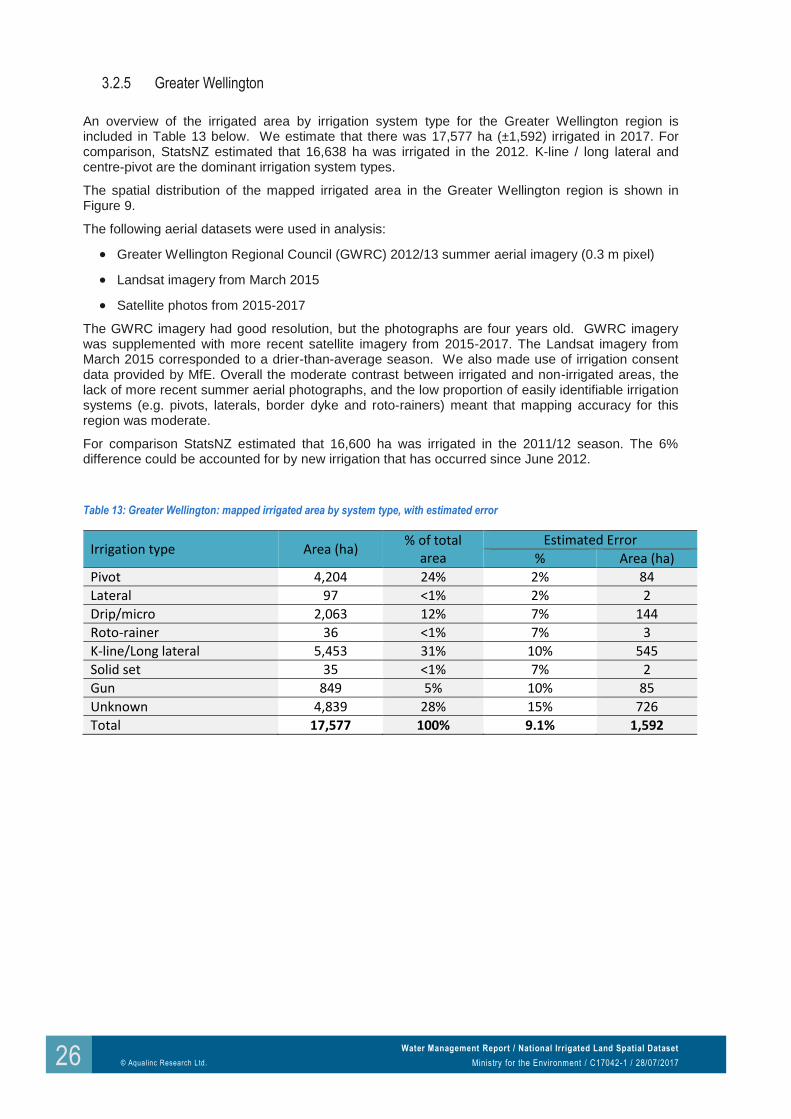
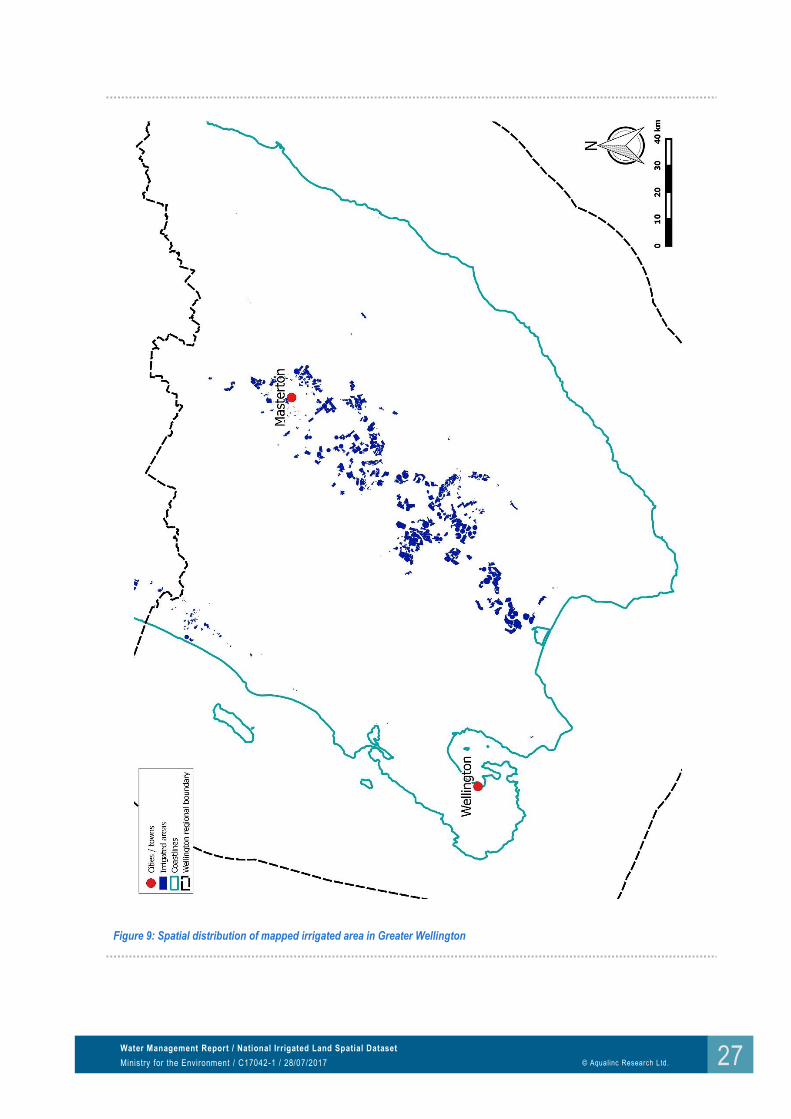
3.2.5 Greater Wellington
An overview of the irrigated area by irrigation system type for the Greater Wellington region is included in Table 13 below. We estimate that there was 17,577 ha (±1,592) irrigated in 2017. For comparison, StatsNZ estimated that 16,638 ha was irrigated in the 2012. K-line / long lateral and centre-pivot are the dominant irrigation system types.
The spatial distribution of the mapped irrigated area in the Greater Wellington region is shown in Figure 9.
The following aerial datasets were used in analysis:
Greater Wellington Regional Council (GWRC) 2012/13 summer aerial imagery (0.3 m pixel)
Landsat imagery from March 2015
Satellite photos from 2015-2017
The GWRC imagery had good resolution, but the photographs are four years old. GWRC imagery was supplemented with more recent satellite imagery from 2015-2017. The Landsat imagery from March 2015 corresponded to a drier-than-average season. We also made use of irrigation consent data provided by MfE. Overall the moderate contrast between irrigated and non-irrigated areas, the lack of more recent summer aerial photographs, and the low proportion of easily identifiable irrigation systems (e.g. pivots, laterals, border dyke and roto-rainers) meant that mapping accuracy for this region was moderate.
For comparison StatsNZ estimated that 16,600 ha was irrigated in the 2011/12 season. The 6% difference could be accounted for by new irrigation that has occurred since June 2012.
Table 13: Greater Wellington: mapped irrigated area by system type, with estimated error
Irrigation type Area (ha) % of total
area Estimated Error
% Area (ha)
Pivot 4,204 24% 2% 84
Lateral 97 <1% 2% 2
Drip/micro 2,063 12% 7% 144
Roto-rainer 36 <1% 7% 3
K-line/Long lateral 5,453 31% 10% 545
Solid set 35 <1% 7% 2
Gun 849 5% 10% 85
Unknown 4,839 28% 15% 726
Total 17,577 100% 9.1% 1,592
Water Management Report / National Irrigated Land Spatial Dataset
Water Management Report / National Irrigated Land Spatial Dataset
Ministry for the Environment / C17042-1 / 28/07/2017
3.3 Low NDVI contrast regions
Seven regions have been categorised as having low NDVI contrast: Auckland, Bay of Plenty, Northland, Taranaki, Tasman, West Coast and Waikato. The aerial datasets that were available for these regions had poor contrast between irrigated and unirrigated area. The level of visible contrast varied with regions, and different parts within a region.
Wherever possible, the actual irrigated area was mapped (for example if centre-pivots or other irrigation equipment could be seen in aerial photos). Where irrigators could not be seen in the aerial imagery, the land parcel relating to a resource consent was assumed to be irrigated (or partially irrigated, depending on the consented rate). Where neighbouring land-parcels had the same owner and the consented rate was sufficiently high, it was generally assumed that both parcels were irrigated. While this approach is not as accurate as the methodology used in high-NDVI areas, the irrigated area will generally be assigned to the correct property, but not necessarily the correct paddocks within the property.
Some common challenges faced in the low-NDVI regions included:
On some properties the actual extent of the irrigated area is unclear and is difficult to infer from the consented rate of take.
Maximum consented rates (particularly for surface water takes) do not always correspond well to the irrigated areas. In some cases the irrigation system capacity (l/s/ha) may be much lower than would be expected in drier regions; in others the consented rate may account for a peak diversion rate or storage refill, rather than the average rate that water is applied to land.
Smaller horticultural properties may be irrigated under permitted activity rules.
3.3.1 Auckland
An overview of the irrigated area by system type for the Auckland region is given in Table 14 below. We estimate that there was 7,958 ha (±1,324) of land irrigated in 2017. For comparison, StatsNZ estimated that 5,734 ha was irrigated in the 2012. The 39% difference from the 2012 StatsNZ estimate may be due to following reasons:
Approximately 640 hectares of golf-courses have been mapped, on the basis that they have irrigation consents. These were not included in the 2012 estimate. Compared to other regions, golf-courses make up a relatively high proportion of the total irrigated area for Auckland.
In some horticultural and short-rotation cropping properties it is difficult to determine the exact extent of the irrigated area, and it is also difficult to infer this from the consented rate without knowing all details of the land-use. Therefore in many cases it has been assumed that the whole property is irrigated, which may result in an over-estimate of the total area.
A number of consents have “storage” noted in one of the water source database fields. If the maximum rate on the database is intended to include storage re-fill, it may not be an accurate reflection of the irrigated area.
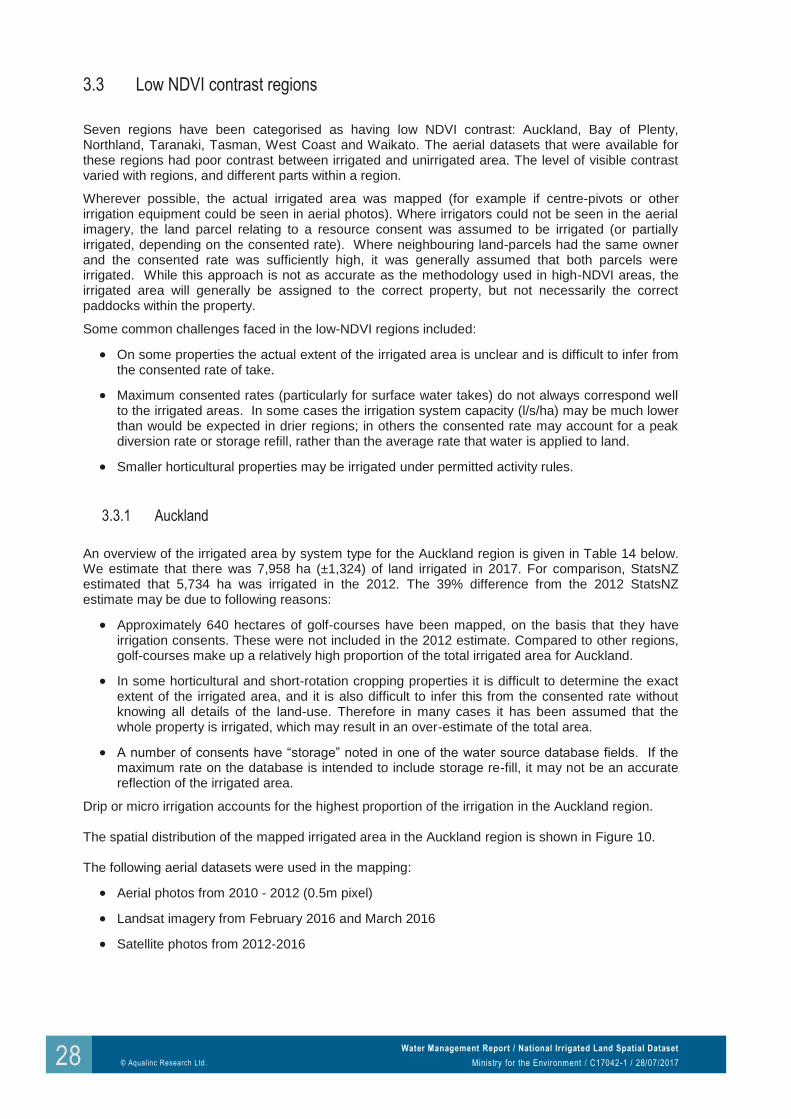
Drip or micro irrigation accounts for the highest proportion of the irrigation in the Auckland region. The spatial distribution of the mapped irrigated area in the Auckland region is shown in Figure 10. The following aerial datasets were used in the mapping:
Aerial photos from 2010 - 2012 (0.5m pixel)
Landsat imagery from February 2016 and March 2016
Satellite photos from 2012-2016
Water Management Report / National Irrigated Land Spatial Dataset
Water Management Report / National Irrigated Land Spatial Dataset
Ministry for the Environment / C17042-1 / 28/07/2017
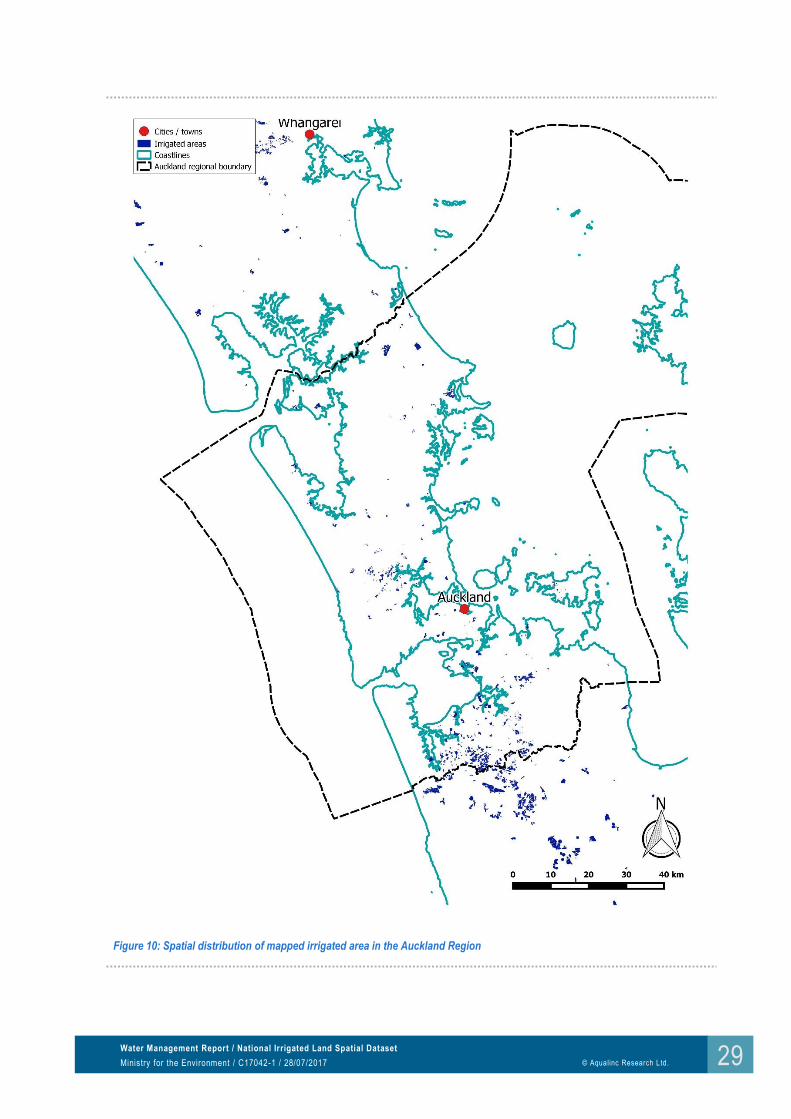
The available aerial datasets had poor visual contrast between irrigated and unirrigated areas. Therefore, a significant proportion of the area has been mapped as ‘unknown’ irrigation system type. However, despite the poor visual contrast, areas under pivot, K-line and gun irrigation were able to be recognised in many cases.
Table 14: Auckland: mapped irrigated area by system type, with estimated error
Irrigation type Area (ha) % of total area Estimated Error
% Area (ha)
Pivot 69 <1% 3% 2
Lateral 63 <1% 3% 2
Drip/micro 1,566 20% 9% 141
K-line/Long lateral 618 8% 15% 93
Gun 831 10% 15% 125
Unknown 4,811 61% 20% 962
Total 7,958 100% 16.6% 1,324
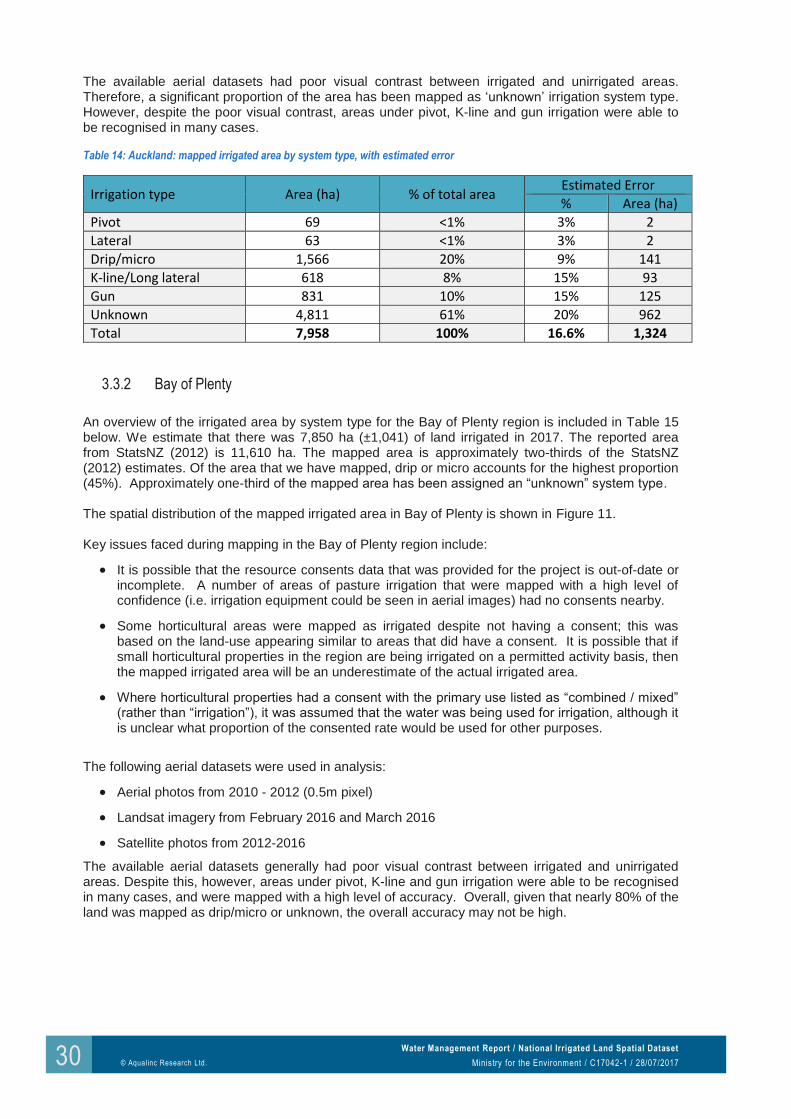
3.3.2 Bay of Plenty
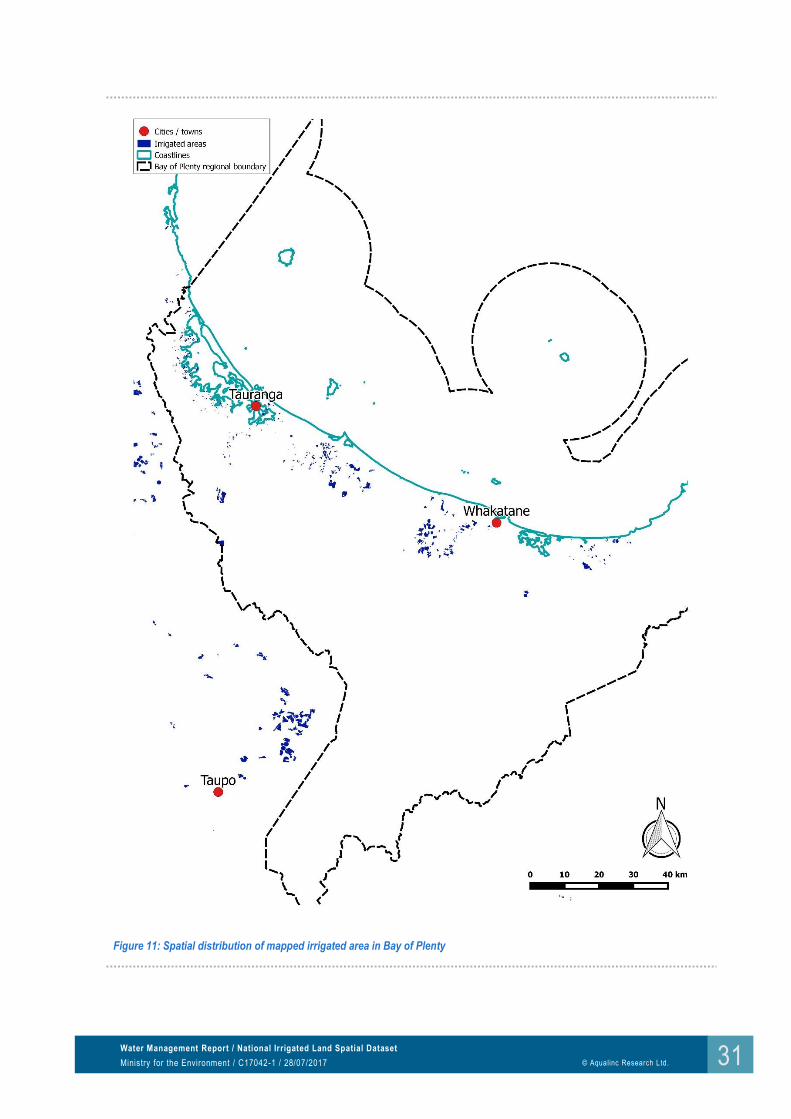
An overview of the irrigated area by system type for the Bay of Plenty region is included in Table 15 below. We estimate that there was 7,850 ha (±1,041) of land irrigated in 2017. The reported area from StatsNZ (2012) is 11,610 ha. The mapped area is approximately two-thirds of the StatsNZ (2012) estimates. Of the area that we have mapped, drip or micro accounts for the highest proportion (45%). Approximately one-third of the mapped area has been assigned an “unknown” system type. The spatial distribution of the mapped irrigated area in Bay of Plenty is shown in Figure 11. Key issues faced during mapping in the Bay of Plenty region include:
It is possible that the resource consents data that was provided for the project is out-of-date or incomplete. A number of areas of pasture irrigation that were mapped with a high level of confidence (i.e. irrigation equipment could be seen in aerial images) had no consents nearby.
Some horticultural areas were mapped as irrigated despite not having a consent; this was based on the land-use appearing similar to areas that did have a consent. It is possible that if small horticultural properties in the region are being irrigated on a permitted activity basis, then the mapped irrigated area will be an underestimate of the actual irrigated area.
Where horticultural properties had a consent with the primary use listed as “combined / mixed” (rather than “irrigation”), it was assumed that the water was being used for irrigation, although it is unclear what proportion of the consented rate would be used for other purposes.
The following aerial datasets were used in analysis:
Aerial photos from 2010 - 2012 (0.5m pixel)
Landsat imagery from February 2016 and March 2016
Satellite photos from 2012-2016
The available aerial datasets generally had poor visual contrast between irrigated and unirrigated areas. Despite this, however, areas under pivot, K-line and gun irrigation were able to be recognised in many cases, and were mapped with a high level of accuracy. Overall, given that nearly 80% of the land was mapped as drip/micro or unknown, the overall accuracy may not be high.
Water Management Report / National Irrigated Land Spatial Dataset
Water Management Report / National Irrigated Land Spatial Dataset
Ministry for the Environment / C17042-1 / 28/07/2017
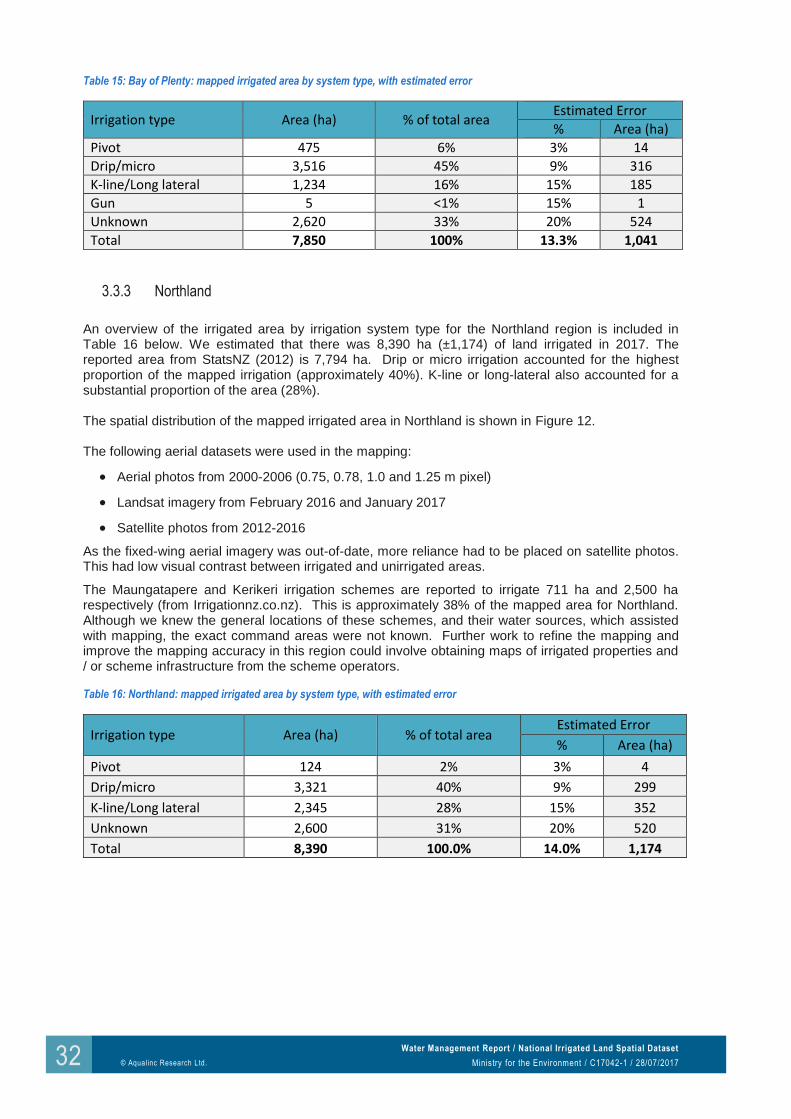
Table 15: Bay of Plenty: mapped irrigated area by system type, with estimated error
Irrigation type Area (ha) % of total area Estimated Error
% Area (ha)
Pivot 475 6% 3% 14
Drip/micro 3,516 45% 9% 316
K-line/Long lateral 1,234 16% 15% 185
Gun 5 <1% 15% 1
Unknown 2,620 33% 20% 524
Total 7,850 100% 13.3% 1,041
3.3.3 Northland
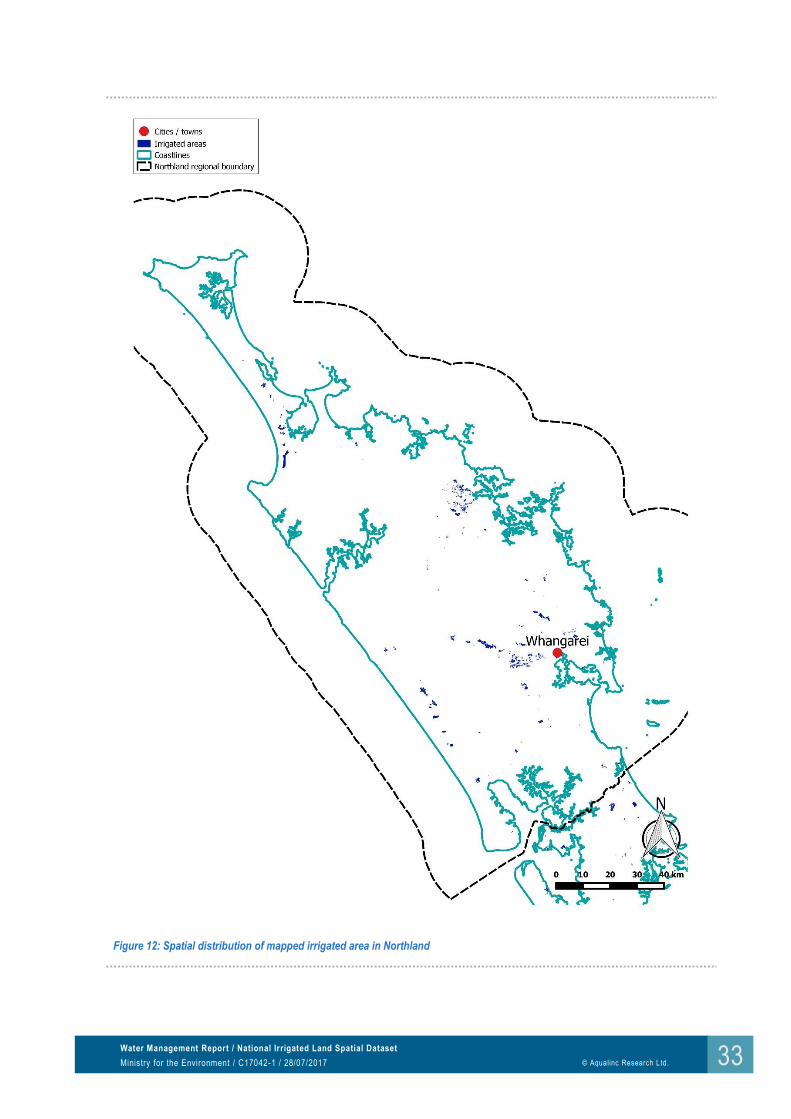
An overview of the irrigated area by irrigation system type for the Northland region is included in Table 16 below. We estimated that there was 8,390 ha (±1,174) of land irrigated in 2017. The reported area from StatsNZ (2012) is 7,794 ha. Drip or micro irrigation accounted for the highest proportion of the mapped irrigation (approximately 40%). K-line or long-lateral also accounted for a substantial proportion of the area (28%). The spatial distribution of the mapped irrigated area in Northland is shown in Figure 12. The following aerial datasets were used in the mapping:
Aerial photos from 2000-2006 (0.75, 0.78, 1.0 and 1.25 m pixel)
Landsat imagery from February 2016 and January 2017
Satellite photos from 2012-2016
As the fixed-wing aerial imagery was out-of-date, more reliance had to be placed on satellite photos. This had low visual contrast between irrigated and unirrigated areas.
The Maungatapere and Kerikeri irrigation schemes are reported to irrigate 711 ha and 2,500 ha respectively (from Irrigationnz.co.nz). This is approximately 38% of the mapped area for Northland. Although we knew the general locations of these schemes, and their water sources, which assisted with mapping, the exact command areas were not known. Further work to refine the mapping and improve the mapping accuracy in this region could involve obtaining maps of irrigated properties and / or scheme infrastructure from the scheme operators.
Table 16: Northland: mapped irrigated area by system type, with estimated error
Irrigation type Area (ha) % of total area Estimated Error
% Area (ha)
Pivot 124 2% 3% 4
Drip/micro 3,321 40% 9% 299
K-line/Long lateral 2,345 28% 15% 352
Unknown 2,600 31% 20% 520
Total 8,390 100.0% 14.0% 1,174
Water Management Report / National Irrigated Land Spatial Dataset
Water Management Report / National Irrigated Land Spatial Dataset
Ministry for the Environment / C17042-1 / 28/07/2017
3.3.4 Taranaki
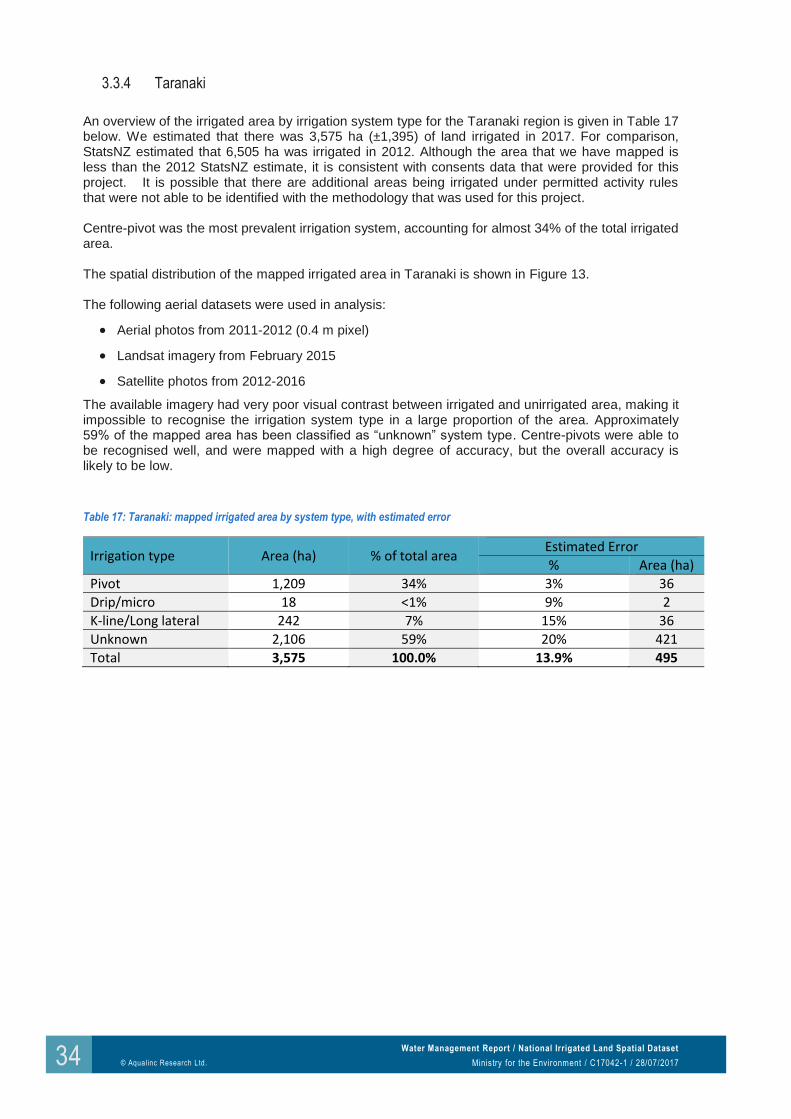
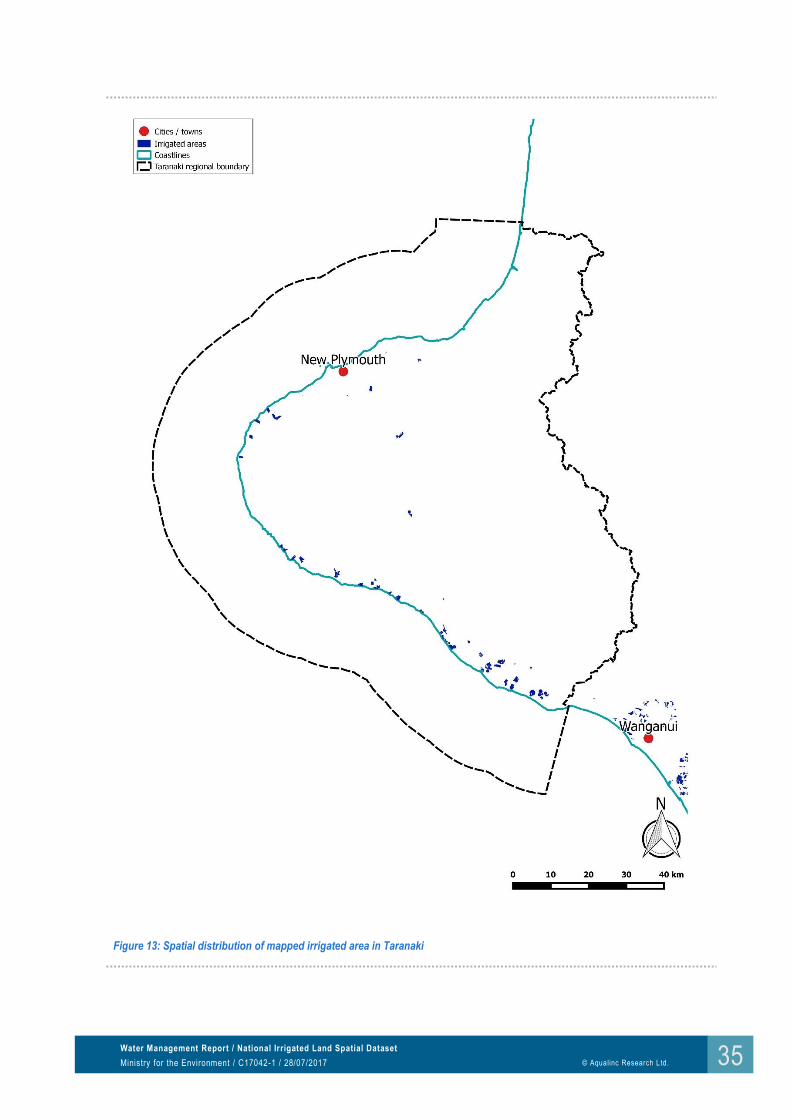
An overview of the irrigated area by irrigation system type for the Taranaki region is given in Table 17 below. We estimated that there was 3,575 ha (±1,395) of land irrigated in 2017. For comparison, StatsNZ estimated that 6,505 ha was irrigated in 2012. Although the area that we have mapped is less than the 2012 StatsNZ estimate, it is consistent with consents data that were provided for this project. It is possible that there are additional areas being irrigated under permitted activity rules that were not able to be identified with the methodology that was used for this project. Centre-pivot was the most prevalent irrigation system, accounting for almost 34% of the total irrigated area. The spatial distribution of the mapped irrigated area in Taranaki is shown in Figure 13. The following aerial datasets were used in analysis:
Aerial photos from 2011-2012 (0.4 m pixel)
Landsat imagery from February 2015
Satellite photos from 2012-2016
The available imagery had very poor visual contrast between irrigated and unirrigated area, making it impossible to recognise the irrigation system type in a large proportion of the area. Approximately 59% of the mapped area has been classified as “unknown” system type. Centre-pivots were able to be recognised well, and were mapped with a high degree of accuracy, but the overall accuracy is likely to be low.
Table 17: Taranaki: mapped irrigated area by system type, with estimated error
Irrigation type Area (ha) % of total area Estimated Error
% Area (ha)
Pivot 1,209 34% 3% 36
Drip/micro 18 <1% 9% 2
K-line/Long lateral 242 7% 15% 36
Unknown 2,106 59% 20% 421
Total 3,575 100.0% 13.9% 495
Water Management Report / National Irrigated Land Spatial Dataset
Water Management Report / National Irrigated Land Spatial Dataset
Ministry for the Environment / C17042-1 / 28/07/2017
3.3.5 Tasman
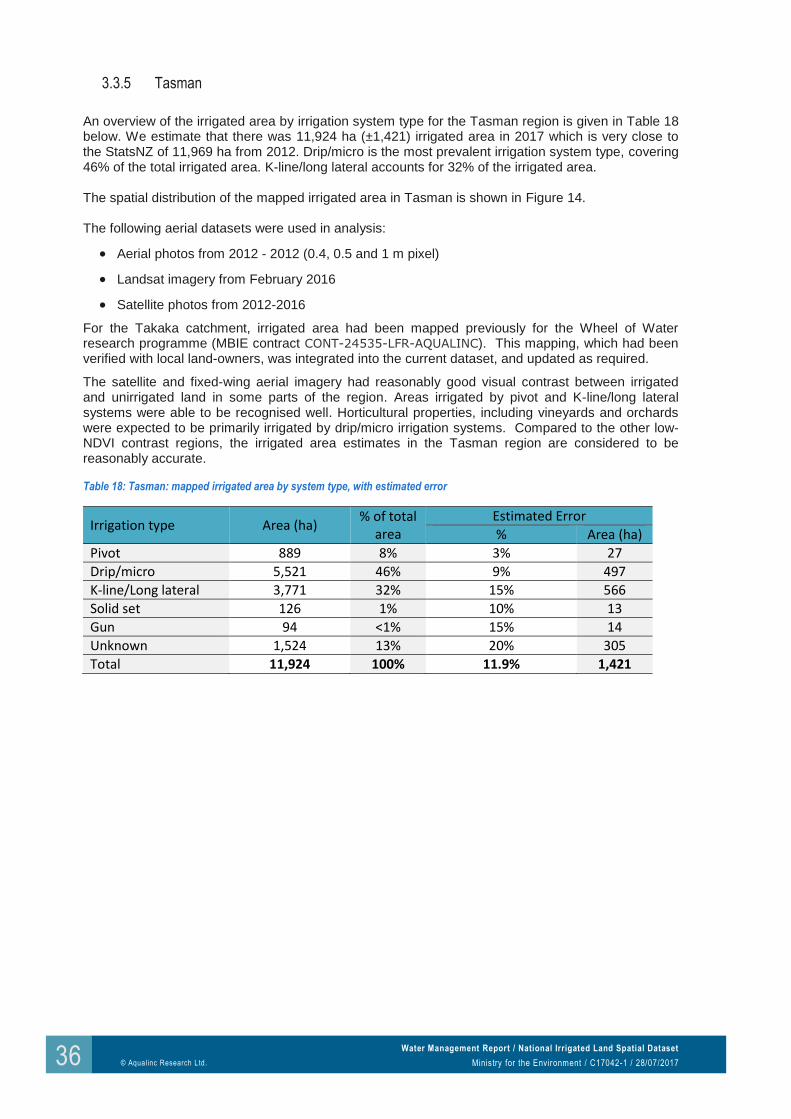
An overview of the irrigated area by irrigation system type for the Tasman region is given in Table 18 below. We estimate that there was 11,924 ha (±1,421) irrigated area in 2017 which is very close to the StatsNZ of 11,969 ha from 2012. Drip/micro is the most prevalent irrigation system type, covering 46% of the total irrigated area. K-line/long lateral accounts for 32% of the irrigated area. The spatial distribution of the mapped irrigated area in Tasman is shown in Figure 14. The following aerial datasets were used in analysis:
Aerial photos from 2012 - 2012 (0.4, 0.5 and 1 m pixel)
Landsat imagery from February 2016
Satellite photos from 2012-2016
For the Takaka catchment, irrigated area had been mapped previously for the Wheel of Water research programme (MBIE contract CONT-24535-LFR-AQUALINC). This mapping, which had been verified with local land-owners, was integrated into the current dataset, and updated as required.
The satellite and fixed-wing aerial imagery had reasonably good visual contrast between irrigated and unirrigated land in some parts of the region. Areas irrigated by pivot and K-line/long lateral systems were able to be recognised well. Horticultural properties, including vineyards and orchards were expected to be primarily irrigated by drip/micro irrigation systems. Compared to the other low-NDVI contrast regions, the irrigated area estimates in the Tasman region are considered to be reasonably accurate.
Table 18: Tasman: mapped irrigated area by system type, with estimated error
Irrigation type Area (ha) % of total
area Estimated Error
% Area (ha)
Pivot 889 8% 3% 27
Drip/micro 5,521 46% 9% 497
K-line/Long lateral 3,771 32% 15% 566
Solid set 126 1% 10% 13
Gun 94 <1% 15% 14
Unknown 1,524 13% 20% 305
Total 11,924 100% 11.9% 1,421
Water Management Report / National Irrigated Land Spatial Dataset
Water Management Report / National Irrigated Land Spatial Dataset
Ministry for the Environment / C17042-1 / 28/07/2017
3.3.6 West Coast
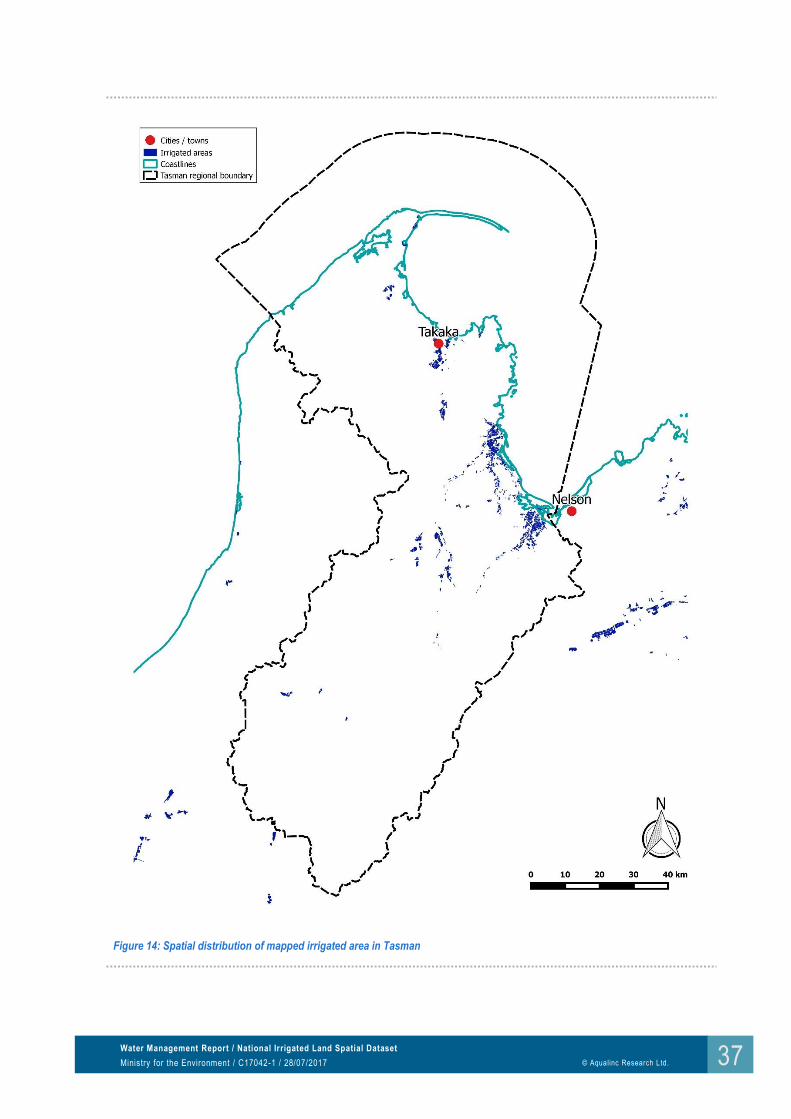
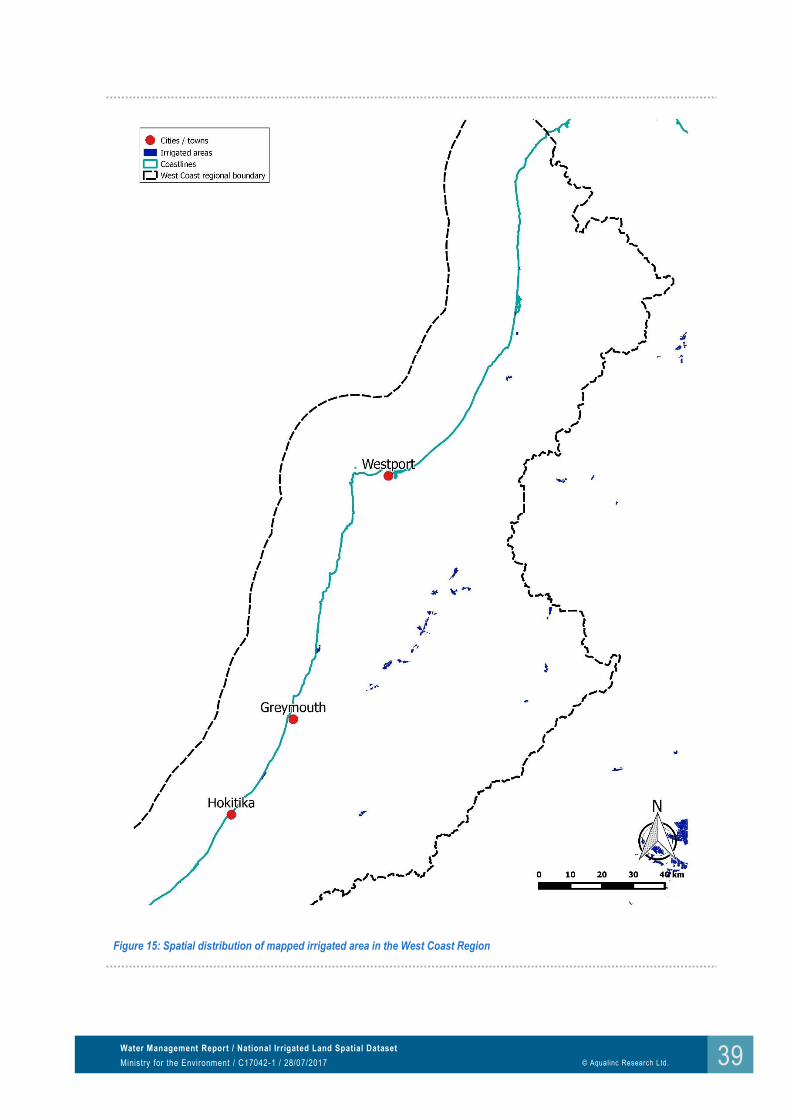
An overview of the irrigated area by irrigation system type for the West Coast region is given in Table 19 below. We estimate that there was 3,622 ha (±525) of irrigated area in 2017. For comparison, StatsNZ estimated that 2,333 ha was irrigated in 2012. The 55% difference between the two estimates does not necessarily correspond to an increase in the actual irrigated area. The spatial distribution of the mapped irrigated area in the West Coast region is shown in Figure 15. Issues encountered with this region included:
Some double-counting in the consents data (possibly separate database entries to take and divert)
Some very high instantaneous rates on resource consents, suggesting that these are diversion rates, rather than the net take
System capacities are likely to be lower than in drier regions (i.e. water is being spread more thinly), making it difficult to infer a total irrigated area from the consented rate
The following aerial datasets were used in the mapping:
Aerial photos from 2009-2011 (0.4 m pixel)
Landsat imagery from February 2015 and March 2015
Satellite photos from 2012-2016
The aerial imagery that was available had very low visible contrast between irrigated and unirrigated area. As the fixed-wing aerial photos are relatively old, we relied on Google satellite imagery for visual identification of irrigation systems. About 20% of the total irrigated area was mapped as centre-pivots, and 44% was mapped as K-line / long lateral. The remaining third of the irrigated area was mapped as “unknown” system type.
Table 19: West Coast: mapped irrigated area by system type, with estimated error
Irrigation type Area (ha) % of total
area Estimated Error
% Area (ha)
Pivot 708 20% 3% 21
K-line/Long lateral 1,584 44% 15% 238
Unknown 1,329 37% 20% 266
Total 3,622 100% 14.5% 525
Water Management Report / National Irrigated Land Spatial Dataset
Water Management Report / National Irrigated Land Spatial Dataset
Ministry for the Environment / C17042-1 / 28/07/2017
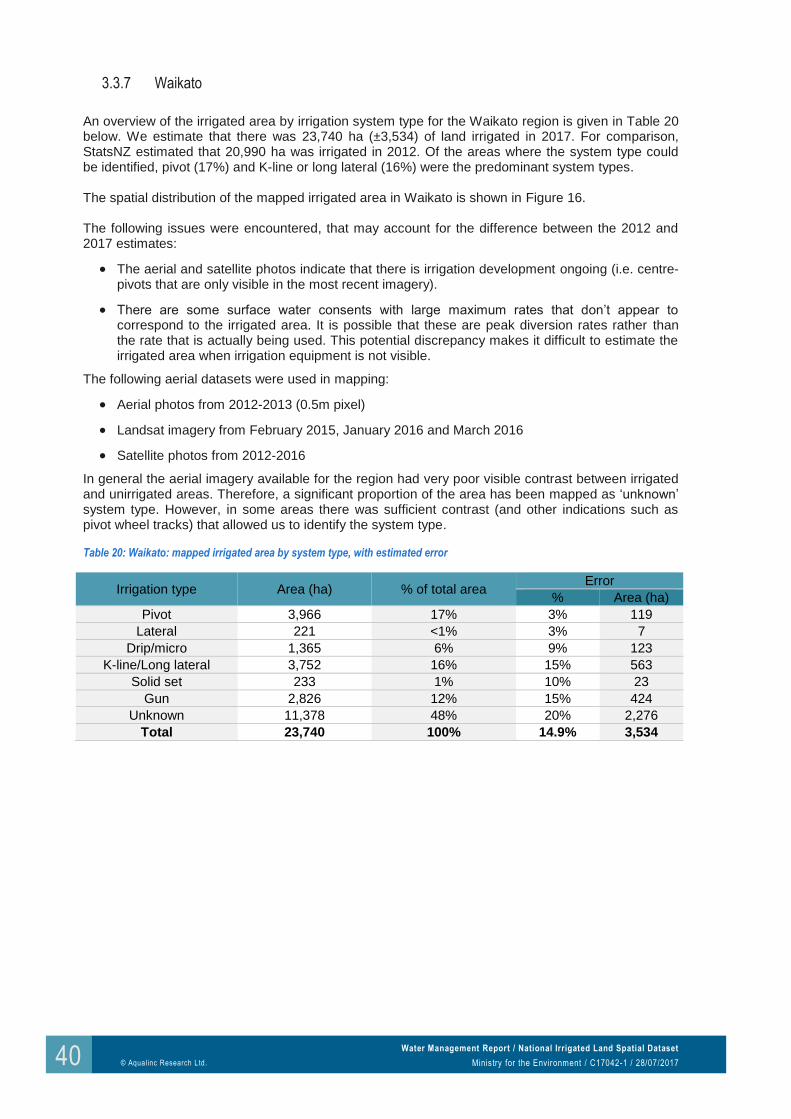
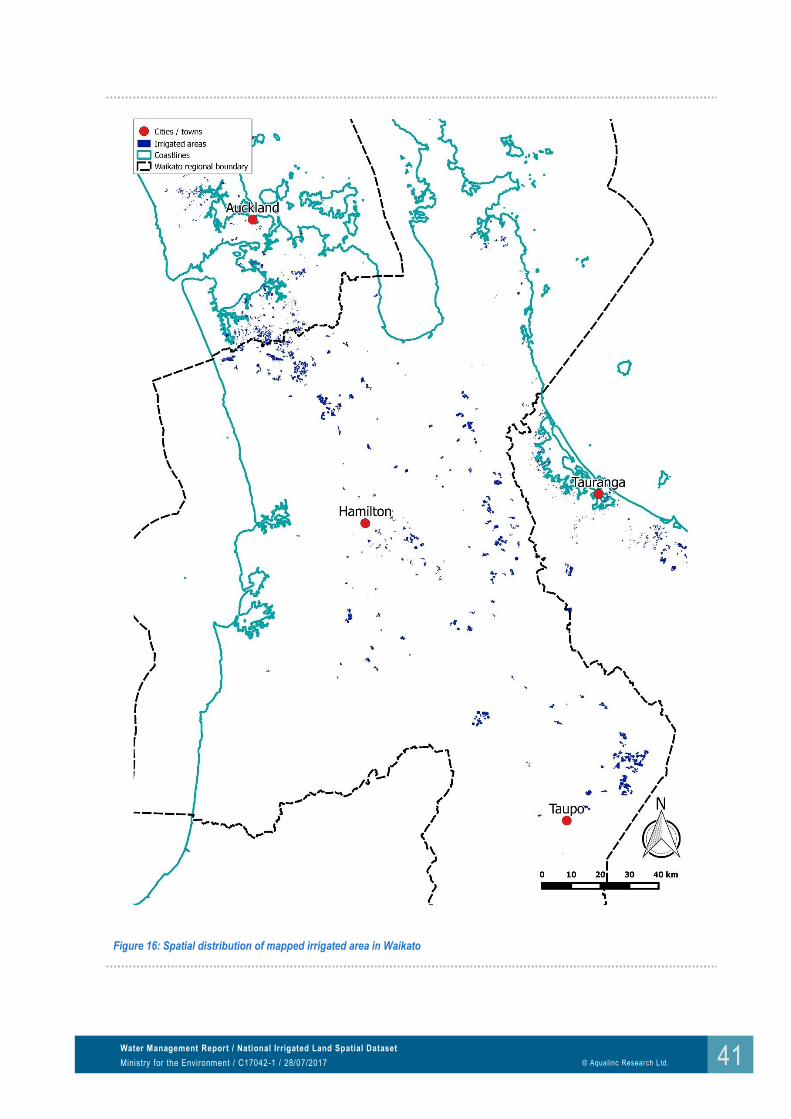
3.3.7 Waikato
An overview of the irrigated area by irrigation system type for the Waikato region is given in Table 20 below. We estimate that there was 23,740 ha (±3,534) of land irrigated in 2017. For comparison, StatsNZ estimated that 20,990 ha was irrigated in 2012. Of the areas where the system type could be identified, pivot (17%) and K-line or long lateral (16%) were the predominant system types. The spatial distribution of the mapped irrigated area in Waikato is shown in Figure 16. The following issues were encountered, that may account for the difference between the 2012 and 2017 estimates:
The aerial and satellite photos indicate that there is irrigation development ongoing (i.e. centre-pivots that are only visible in the most recent imagery).
There are some surface water consents with large maximum rates that don’t appear to correspond to the irrigated area. It is possible that these are peak diversion rates rather than the rate that is actually being used. This potential discrepancy makes it difficult to estimate the irrigated area when irrigation equipment is not visible.
The following aerial datasets were used in mapping:
Aerial photos from 2012-2013 (0.5m pixel)
Landsat imagery from February 2015, January 2016 and March 2016
Satellite photos from 2012-2016
In general the aerial imagery available for the region had very poor visible contrast between irrigated and unirrigated areas. Therefore, a significant proportion of the area has been mapped as ‘unknown’ system type. However, in some areas there was sufficient contrast (and other indications such as pivot wheel tracks) that allowed us to identify the system type.
Table 20: Waikato: mapped irrigated area by system type, with estimated error
Irrigation type Area (ha) % of total area Error
% Area (ha)
Pivot 3,966 17% 3% 119
Lateral 221 <1% 3% 7
Drip/micro 1,365 6% 9% 123
K-line/Long lateral 3,752 16% 15% 563
Solid set 233 1% 10% 23
Gun 2,826 12% 15% 424
Unknown 11,378 48% 20% 2,276
Total 23,740 100% 14.9% 3,534
Water Management Report / National Irrigated Land Spatial Dataset
Water Management Report / National Irrigated Land Spatial Dataset
Ministry for the Environment / C17042-1 / 28/07/2017
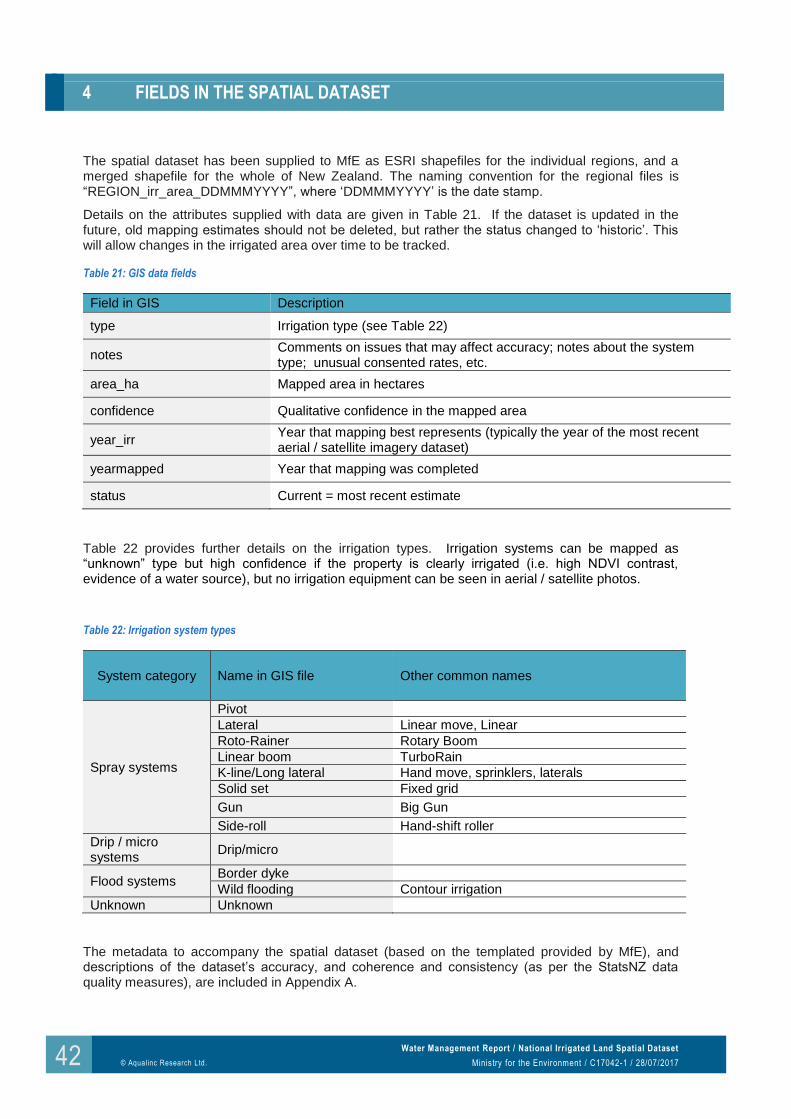
4 FIELDS IN THE SPATIAL DATASET
The spatial dataset has been supplied to MfE as ESRI shapefiles for the individual regions, and a merged shapefile for the whole of New Zealand. The naming convention for the regional files is “REGION_irr_area_DDMMMYYYY”, where ‘DDMMMYYYY’ is the date stamp.
Details on the attributes supplied with data are given in Table 21. If the dataset is updated in the future, old mapping estimates should not be deleted, but rather the status changed to ‘historic’. This will allow changes in the irrigated area over time to be tracked.
Table 21: GIS data fields
Field in GIS Description
type Irrigation type (see Table 22)
notes Comments on issues that may affect accuracy; notes about the system type; unusual consented rates, etc.
area_ha Mapped area in hectares
confidence Qualitative confidence in the mapped area
year_irr Year that mapping best represents (typically the year of the most recent aerial / satellite imagery dataset)
yearmapped Year that mapping was completed
status Current = most recent estimate
Table 22 provides further details on the irrigation types. Irrigation systems can be mapped as “unknown” type but high confidence if the property is clearly irrigated (i.e. high NDVI contrast, evidence of a water source), but no irrigation equipment can be seen in aerial / satellite photos.
Table 22: Irrigation system types
System category Name in GIS file Other common names
Spray systems
Pivot
Lateral Linear move, Linear
Roto-Rainer Rotary Boom
Linear boom TurboRain
K-line/Long lateral Hand move, sprinklers, laterals
Solid set Fixed grid
Gun Big Gun
Side-roll Hand-shift roller
Drip / micro systems
Drip/micro
Flood systems Border dyke
Wild flooding Contour irrigation
Unknown Unknown
The metadata to accompany the spatial dataset (based on the templated provided by MfE), and descriptions of the dataset’s accuracy, and coherence and consistency (as per the StatsNZ data quality measures), are included in Appendix A.
Water Management Report / National Irrigated Land Spatial Dataset
In its current form the national dataset is a snapshot in time, which provides a baseline for assessing future changes in total irrigated area and the distribution of system types. It is recommended that a methodology is developed for efficiently assessing changes over time, without completely re-mapping the entire irrigated area. Any validation/ground truth data should be used, when it becomes available, to assess the mapping accuracy. If such datasets are produced by Regional Councils or other organisations for particular catchments or sub-areas, then these should also be integrated into the national dataset (with the source noted) if they represent an improvement on the current dataset. The methodology used to create and verify the data should be assessed to determine whether the accuracy is greater than that of the current national dataset. The existence of this national spatial dataset of irrigated area presents opportunities for further investigations into issues relating to irrigation, including irrigation demand, land-surface recharge and nutrients, on a regional or national scale.