National Library of Canada - Bibliothwue nationale du Canada CaRadian Theses Service Services des theses canadiennes Ottawa, Canada K1 A ON4 CANADIAN THESES e THESES CANADIENNES NQTICE 1 AVlS The quality of this microfiche is heavily dependent upon the La qcl&t6 de cette microfiche depend grandement de la qualit6 quality of the original thesis submitted for microfilming. Every de la these soumise au microfilmage. Nous-avonstout fait pour effort has been made to ensure the highest quality of reproduc; , assurer une qualite sup6rieure de reproduction. tion possible. -k. If pages are missing, contact the un~v@ty which granted the S'il rrdnque des pages, veuillez communiquer avec I'univer- degree. siti, qui a confkr6 le grade. Some pages m & i have indistinct print especially if the original ' '-a qualit6 d9impression de certaines pages peut laisser A pages were typed with a poor typewriier rtbbon or if the univer- dksirer, surtout si les pages originales ont kt6 dactylographi6es sity sent us an inferior photocopy. a I'aide d'un ruban us6 ou si I'universit6 nous a fait parvenir une photocopie de qualit6 inf6rieure. Previously copyrighted, materials (journal articles, published Les documents qui font d6jA I'objet d'un droit d'auteur (articles tests, etc.) are not filmed. cie revue, examens publihs, etc.) ne sont pas microfilm6s. Reproduction in full or in part of this film is governed by the La I ?production, meme partielle, de ce microfilm est soumise, Canadian Copyright Act, R.S.C. 1970, c. C-30. a la , .oi canadienne sur le droit d'auteur, SRC 1970, c. C-SO. THIS' DISSERTATION HAS BEEN MICROFILMED EXACTLY AS RECEIVED . . LA THESE r\ ETE MICROFILMEE TELLE QUE NOUS L'AVONS REGLIE
Transcript
National Library of Canada -
Bibliothwue nationale du Canada
CaRadian Theses Service Services des theses canadiennes
Ottawa, Canada K1 A ON4
CANADIAN THESES e
THESES CANADIENNES
NQTICE 1 AVlS The quality of this microfiche is heavily dependent upon the La qcl&t6 de cette microfiche depend grandement de la qualit6 quality of the original thesis submitted for microfilming. Every de la these soumise au microfilmage. Nous-avons tout fait pour effort has been made to ensure the highest quality of reproduc; , assurer une qualite sup6rieure de reproduction. tion possible.
-k. If pages are missing, contact the un~v@ty which granted the S'il rrdnque des pages, veuillez communiquer avec I'univer- degree. siti, qui a confkr6 le grade.
Some pages m & i have indistinct print especially if the original ' '-a qualit6 d9impression de certaines pages peut laisser A pages were typed with a poor typewriier rtbbon or if the univer- dksirer, surtout si les pages originales ont kt6 dactylographi6es sity sent us an inferior photocopy. a I'aide d'un ruban us6 ou si I'universit6 nous a fait parvenir
une photocopie de qualit6 inf6rieure.
Previously copyrighted, materials (journal articles, published Les documents qui font d6jA I'objet d'un droit d'auteur (articles tests, etc.) are not filmed. cie revue, examens publihs, etc.) ne sont pas microfilm6s.
Reproduction in full or in part of this film is governed by the La I ?production, meme partielle, de ce microfilm est soumise, Canadian Copyright Act, R.S.C. 1970, c. C-30. a la , .oi canadienne sur le droit d'auteur, SRC 1970, c. C-SO.
THIS' DISSERTATION HAS BEEN MICROFILMED EXACTLY AS RECEIVED
. . LA THESE r\ ETE MICROFILMEE TELLE QUE
NOUS L'AVONS REGLIE
srucms OF ELECTRIC CONDUCTION AND CONVECTION fl
IN ORGANIC SOLUTIONS OF LOW DIELECTRIC CONSTANT
~ n i t a Margari t McBri de
BSc. (Hons.), Simon ~ r a s e r ~ n i v e r s i t y 1980
A THESIS SUBMITTED IN PARTIAL FULFILLMENT
OF THE REQUIREMENTS FOR THE DEGREE OF
MASTER OF SCIENCE
i n Chemical Physics
under Special Arrangements
h
$'I Anita Margari t McBride 1985
v SlflON FRASER UNIVERSITY
July 1985
-= - -- A l l r ights reserved. This thesis may not be
reproduced i n whole o r in part, bg photocopy
or other means, without permission of the author.
P e r m i s s i o n h a s . b e e n g r a n t e d t o t h e N a t i o n a l L i b r a r y of C a n a d a t o m i c r o f i l ~ t h i s t h e s i s and t o l e n d o r s e l l c o p ' e s o f t h e f i l m . b
T h e a u t h o r ( c o p y r i g h t o w n e r ) h a s r e s e r v e d o t h e r p u b l i c a t i o n r i g h t s , a n d n e i t h e r t h e t h e s i s n o r e x t e n s i v e e x t r a c t s f r o m i't may b e p r i n t e d o r ' o t h e r w i s e r e p r o d u c e d w i t h o u t h i s / h e r w r i t t e n p e r m i s s i o n .
L ' a u t o r i s a t i o n a ete a c c o r d g e 3 l a B i b l i o t h G . q u e n a t i o n a l e d u C a n a d a d e m i c r o f i l m e r c e t t e t h P s e e t d e p r G t e r ou d e v e n d r e d e s e x e m p l a i r e s du f i l m .
L ' a u t e u r ( , C i t u l a i r e du clroit d 1 a u t e * r ) . ' s e r e s e r v e l e s a u t r e s d r o i t s d e p u b l i c a t i o n ; n i l a t h G ~ e n i d e l o n g s e x t r a i t s d e c e l l e - c l n e d o i v e n t S t r e i m p r i m g s o u a u t r e m e n t r e p r o d u i t s s a n s s o n a u t o r i s a ' t i o n "ecr i te .
ISBN 0 - 3 1 5 - 3 0 8 5 7 - 5 . .
I *
Degm: Master of Science
Title of Thesis: Studies of Electric Conduction and Convection " in Organic Solutions of L o r Dielectric Constant
\
Exbmining Commit tee:
Chairman: J.M. Webster
K.E. Rieckhoff / Senior Supervisor -a%3
'E.H. Voigt 9
Seni w Supervisor
I I I / 1 . - I / \
/ L I - - Y - \
6.8. Porter External Examiner Honway Professor Univeni ty of British Columbia, Vancouver, B.C.
PART I AL COPYR l GHT L I CENSE
I hereby g raq t to,Slmon Fraser Un l ve rs l t y the r i g h t t o lend
my thes is , p r o j e c t o r extended essay ' ( the t l t l e o f wh'ich i s shown below)
t o users o f the Simon Fraser Univers l t y L l brary, and t o make p a r t i a l o;
s i n g l e cop ies on ly f o r such users or i n response t o a request from the
l i b r a r y o f any o the r u n i v e r d * y , o r o ther educational I n s t i t u t i o n , on
i t s own behal f o r f o r one o f i t s users. I f u r t h e r agree t h a t permission
f o r m u l t i p l e copying o f t h i s work f o r scho la r l y purposes may be granted
by me o r t h e Dean o f Graduate ~ t u - It i s understood t h a t copying '
o r publication o f t h i s work f o r f i nanc ia l ga in sha l l not be a l l o w e d
w i thou t my w r i t t e n permission.
Author:
( s i gna tu re ) %
iii
ABSTRACT
Studies 'of conduct ion, phot oconduct ion and convect ion processes i n organic -
-6 -1 solutions of intermediate conductivity ( K = 10 0 m-') are reported.
Specifically, solutions of tetracyanoethylene (TCNE) i n dichloroethane
(DCE) and tetraethyl ammonium 1,1,2,3,3 pentacyanopropenide (TEA'PCP-) i n
C DC were investigated. The dielectric constant of DCE i s about ten ( e ~ 1 0 ) .
Current characteristics of solutions w i t h ion concentrations of lo-? -lod M. are qualitatively interpreted by considering the ef fects of electrical *'aed~
P bounday layers, e l ectrohydrodynami c behaviour, and ion concentration "-
variation (temporal y d spatial). A variety of cel l geometries (electrode
spucing, d = 1 to 9 mm.) and electrode materials (platinum, indium and
aluminum) were used i n the experiments.
.S 1B
The dominant negative charge c t i r i e rs i n solutions of TCNE i n DCE are the
l,l,2,3,3 pentacyanopropeni de anion (PCP-) and tricyanovinylalcoholste
anion (TCV-1. The measured effect ive mobi l i ty of ions i n TCNE/DCE and
TEA'PCP-/DCE solutions i s (3-4) x 10% tr?vl s-I. The v is i ble/ul traviolet
spectra of these anions are used t o interpret the current characteristics of
TCNE/DCE solutions. Some information i s presented on the chemical
generation of charge carriers in TCNE/DCE. In'pqrticular, the equilibria
involving water, TCNE and pentacyanopropenide in DCE and in acetoni t n l e
are considered. a
Concentration gradients i n solution accompany transient current behaviour -
and are related to t@drodynamic instabilities i n the liquid. Concentration
gradients of 6x 1 ~'~f l / rnrn are sufficient to generate turbulence i n DCE. Ion
density gradients of this magnitude are not sufficient to bring about
gravitational 1 y driven convection. Diffusion drag forces on the 1 iqui d are
proposed as a mechanism for the generation of f luid f low in electrolyte
solutions with concentration gradients.
A model i s presented which considers thJe contributions of Bif fusion and h
space charge to convective f low i n electrolyte solutions wi th an applied
electric f ield (E). The ratio between space charge and diffusive dFeg forces
i s shown to vary as E ~ / C where c i s the ion concentration i n the solution.
- solutions of low and high conductivity i s discussed. ."
Many people contributed their help in the course of my r&&rch and the
preparation of this dissertation. I am grateful to Dr. Rieckhoff and Dr. Voigt
for their assistance in completing this project (particularly i n the
preparation of the thesis). Vem Moen helped with the experimental work
and contributed many ideas to the research. Dr. Wen Chen gave me
assistance with laser work. Dr. Pomeroy, Dr. Pinto and Joyce Schachter
prhided inf onnation on chemical preparation. The glass and machine shops
assisted with the construction and design of conductivity cells.
The diagrams in this thesis were prepared with the help of the Instructional
Media Centre. Vem Moen and Brian Cherlesworth sacrificed one night of
sleep to photocopy and put page numbers on the thesis.
A special word of thanks goes to my husband, Randy, who always encouraged
me and believed that things would work out for the best. I acknowledge the
help of God w_hg provided me with the strength and purpose to finish this
>
- *- \ '
TABLE OF CONTENTS * -
Approval '
Abstract
Acknowledgements v
L is t of Tables *
L is t of Figures
Chapter 1. * INTRODUCTION
REFERENCES
I
Chapter 2. PHOTOCURRENT MEASUREMENTS IN TCNE
CHARGE TRANSFER COMPLEXES 9
2.0 Experimental
2.1 Discussion
REFERENCES
Chapter 3. RElNTERPREilNG THE PHOTOSIGNAL 29
3.1.1 Photocurrent, Dependence on Light Exposure Time 29 - - I
3.1.2 Photosignal, Geomety DeNndence 38
3.2.1 Evidence f o r Convectioa as a Charge Transport --
Process in Charge Trdnsf e r Solutions 41
3.2.2 Evidence fo r Convection in aR Analagous System:
Indi go(dye)/DCE 42
REFERENCES 52
vii
Page
X
Chapter 4. CURRENT CHARACTERISTICS OF TCNEIDCE 53
4.0 Materials and Methods f o r
Sect ions 4.1, 4.2, and 4.3 53 % - -
4.1 concentration Dependence of Conductivity 59
4.2 C u r e n t n i m e Response: Electr ical Bound
Layen and Resist ivity Changes 70
4.2.L';- Current Response t o Square Wa
Voltage over many Cycles 88
4.3 Temperature and Mechanical Vibration 88 -
4.4 Current Voltage Characteristics 92
4.4.0 Experimental 93
4.4.1 I /V Response (Volt age Steps) 96
4.4.2 I /V Response
(Continuous Voltage Scanning) 104
REFERENCES 126
Chapter 5. ION CONCENTRATION BEHAVIOUR
WITH APPLIED VOLTAGE
5.0 Experimental
5.1.1 Concentrat ion vs. Time Behaviour
5.1.2 Ion D r i f t Velocity Estimates in TCNE/DCE 1 43
5.1 -3 Electric and Optical Response o f TEA'PCP-/DCE 1 48
5.1 -4 PCP- and TCV- Contributions t o Conduction 155
viii
Chapter 7.
7.1
7.2
Relaxation of Concentration w i t h V=O
in TCNEIDCE 158
Concentration Gradients i n Solution 161
Spati a1 concentration Behaviour in Time -
6 6
Concentration Gradients and 7
Hydrodynamic Instabil i t ies 183
Electrohydrodynamic lnstabil i t ies in
Low Conductivity Electrolyte Solutions 100
REFERENCES v 202
SOME CYANOCARBON CHEMISTRY
Experimental
Results and Discussion
6.1.1 Reactions of Water and TCNE i n Solution 2 14
6.1 -2 TCNE- Infection in TCNE/CH&N B
225
6.l.3 Ions i n Conductivity Studies 234
REFERENCES :\
CONCLUSIONS 238
Summay of Thesis Research Z
238
Suggesti~ns fo r Further Work 240
REFERENCES 24 1
LIST OF TABLES Page
.) 2.1 Efficiencies for Photocurrent Generation 25
3.1 DC Current Photoresponse 39
3.2 Geomety Dependence of Photocurrent Signal 4 0
IndigoIDCE Electroconvective Patterns - SO
4.1 DEE Current Response w i t h different Cleaning Methods 58
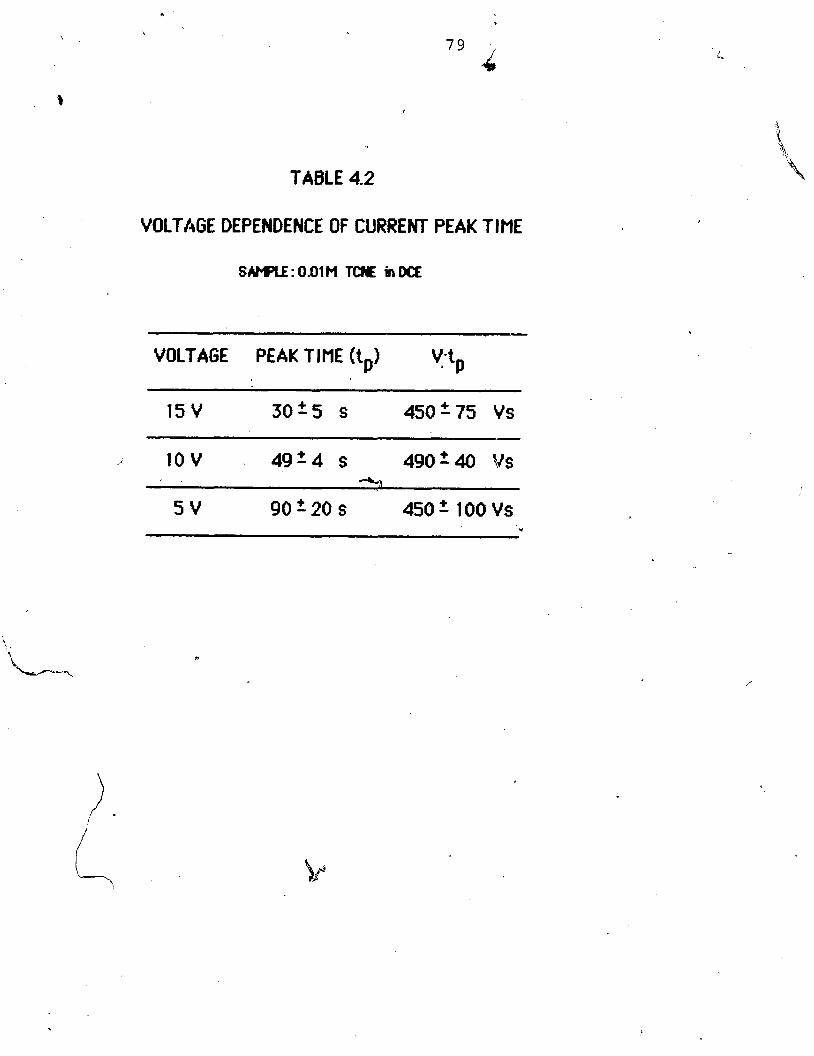
4.2 Voltage Dependence of Current Peak Time 79
4.3 Temperature Dependence of Conductivity 90
5.1 Dr i f t Velocity Estimates from Changes in Current and Concentration (TCNE/DCE) 1 42
5.2 DriftVelocityEstimatesfromCurrent and Concentration Data (TEA'PCP-IDCE) 153
5.3 Dr i f t Velocity Estimates from Curfent and Concentration Changes (TEA'PCP~DCE) 154
Concentration Gradients and Diffusion- Induced Drag Forces 7
f - Typical F,IFD Values
for Experimental Conditions
Conditions for F,/FD = 1
Page
187
*
19g
20 1 F
I d
6.1 6j?CP- Peaks in Different Solvents ( 209
6.2 Spectrum of 21 1
6.3 Formation of PCP- from TCNE and $0 i n ,
DCE and CYCN. 22 1
6.4 Slow formation of PCP in TCNEiSolvent CJ
(independent of water concentration) 221 '
6.5 [TCNE-1 injected into CYCN 229
3
LIST OF FlljURES Page
2.1 Structure of Tetracyanoethyle.ne 10 .z
2.2 Charge Transfer Complex of TCNEIHesi tylene @-I0
2.3 CT Complex Absorption Spectrum TCNEIMesi tylene i n DCE
2.4 Simplif ied Potential Energy Curves fo r the limund and Excited Charge Transfer Statds 15
2.5 Calculated Absorption, Fluorescence and Raman Resonance Excitation Profi les fo r Charge Transfer Complexes 15
- 2.6 Experimental Apparatus fo r Photoconductivity Measurements 1 7
f
2.7 Photosignal vs. Incident Laser Power 20
2.8 Photosignal vs. Incident Laser Power 2 1
2.9 Photosignal vs. Voltage 23
3.1 Photosignal vs. Chopper Frequency
3.2 Photosignal vs. Half Cycle Time
3.3 Signal Averaging Apparatus
3.4 photosignal Shape
'I Page
\
6 3.5 Photosignal shape
3.6 CC Photocurrent reponse
3.7 DC current Acoustic Effect
3 Signal Averaging Apparatus, Acoustic Effect
3.9 DC Current Response of TCNEIDCE I
3.10 DC Current Response of IndigoIDCE
3.1 1 Photocurrent Response of I ncfi go/DCE at Different Voltages .
3.12 Dye Particle Pat terns in Indi go/DCE at Different Voltages
4.1 Plat i n u T d e Cell 5 4
4.2 Current Measurement 56
4.3 Steady State Current vs. [TCNE] (Single Step Applied Voltage) 6 1
4.4 Peak and Steady State Current vs. RCNEl (Square Wave Voltage, f =0.0005 Hz.) 62
'9
-- a
4.5 Current vs. Hesi tylene Content '$
63
4.6 Current Response to a*Step Voltage 65 I
4.7 Square Wave Current Response
xiii
Page
4.8 Peak and Stebdy State Currents vs. - Number of Square Wave Cycles
i
4.9 Current vs. Time Following Voltage Reversal
4.10 Current Response for AOT/Xylene 72
4.1 1 Electrical Boundary Layers - 74
4.12 Electrical boundary Laye~s and Associated Potentials 75 '%
4.1 3 Current vs. Time (Square Wave Vbl tage, f = 0.005 Hz.) 82 d
4.1% Current ~espoxse t o Voltage Reversal a f te r H i x i ng 4
4.16 Current vs. Time for Voltage Steps 97
4.1 7 Peak Current (after discharge) vs. Voltage
f 4.18 Discharge urrent vs. Time \
4.19 (Q ~lscharged i n 150 seconds) vs. Voltage 102
4.20 Current vs. Voltage, Above and Below the Cri t ical Frequency (Triangular Wave Voltage) 1 05
4.2 1 Current vs. Voltage, Above and Below the Cri t ical Frequency (Sine Wave Voltage)
4.22 Current vs. Voltage Response a t Different Frequencies (Triangular Wave Voltage) 107
xiv
Page
4.23.1 Current vs. Voltage (f~0.002 Hz < f,, Triangular Wave Voltage)
Current vs. Voltage (f =O.OO7 Hz ( f,, Tr ian u lp r Wave Voltage) Ci Current vs. Voltage, w i t h Nix ing (f =O.OO7 Hz < f,, Triangular Wave Voltage)
r
I /V Response w i t h Changing Frequency (Sine Wave Vo l t age)
I /V Response w i t h Changing Frequency Ur iangular Wave Voltage)
I
C r i t i ca l Frequency vs. Vo l t age Amp1 i t ude (Piangular Wave Voltage)
Cr i t i ca l T ime vs. Voltage Amplitude (Triangular Wave Voltage)
Cr i t i ca l Frequency vs. Voltage Amplitude (Triangular Wave Vol t age)
Cr i t i ca l T ime vs. Voltage Amplitude (Triangular Wave Voltage)
~ i s c h a r ~ e e s . Vpl tege
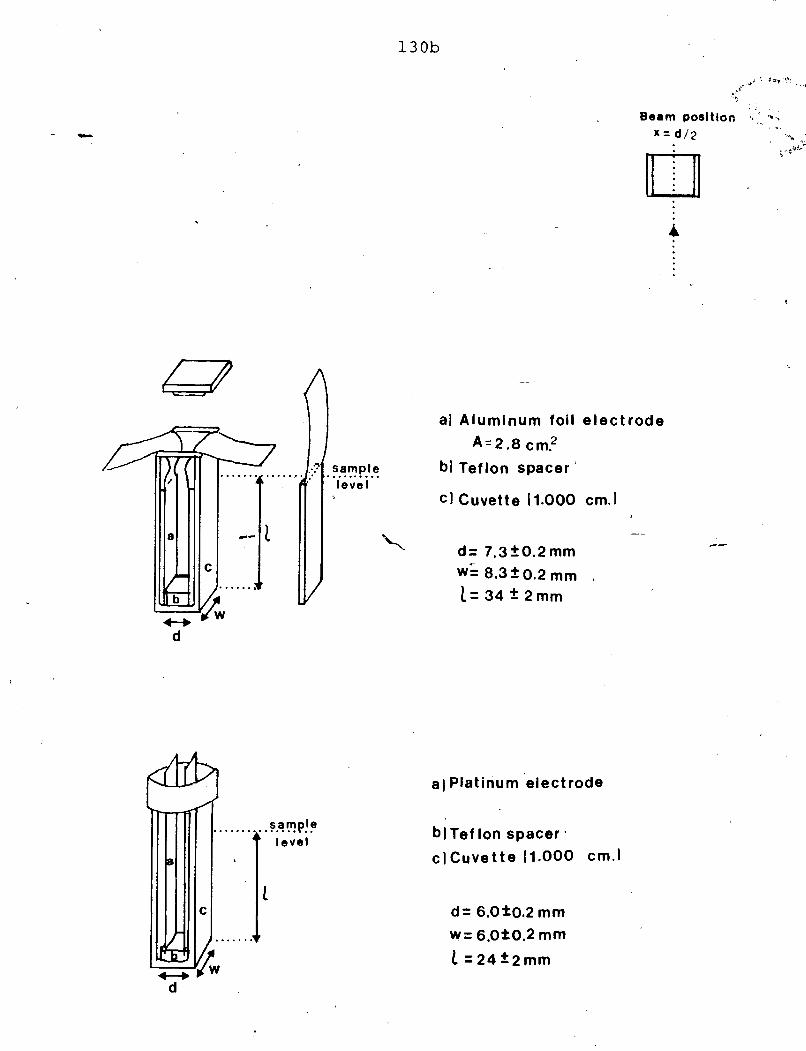
Sample Cells and Electrodes
Apparatus, Spatial l y Asymmetric Concentration Response 1 33
- -
5.3 Apparatus, Transmission prof ilk
5.4 Log l0/1 vs. Time, Current vs. Time ( 1 a, 1 b) 1 37
5.5 ,Log !,/I vs. Time, Current vs. Time (28)
5.6 Log 1,/1 vs. Time, Current vs. Time ( 1 d) 139
\ 5.7 Absorption Spectrum of TCNE/DCE a t Different Times
after Voltage Application 140
5.8 Cumnt (i,) vs. [TEA'PCP -1 in DCE 1 49
5.9 Log 1,/1 vs. Time, Current vs. Time for TEA+PCP - . 150
5.10 Log 1,/1 vs. Time, Current vs. Time for TEA'PCP - 15 1
r' 5.1 1 Spectrum of TCNE-ttzO/DCE 156
5.12 log I,/ I) vs Time,
Voltage set to zero after 20V treatment
5.1 3 (Log l0/1) vs. Time,
Voltage set to zero before steady state 160
5.15 (Log1 O /I)vs.Time,
beam positioned closer to one electrode 167
5.16 Absorption vs. Time 168
Transmission Profile (Al)
T;-ansmission Profile ( A l l
~ ransmks i on Profile (A1 )
xvi
Page
Trsnsmi ssi on Prof i 1 e (A4 ) 173 .
Transmission Prof i 1 e (A1 ) 174
Transmission Profile ( I n)
Transmission Prof i 1 e (In)
Transmission Profile (Pt) 179 t
Transmission Profile (Pt) 180
Transmission Profile (Pt) 18 1
Log l,/l Fluctuations at different Voltages 182
Space Charge Associated with lon'~oncentr8tion Grdgients t o maintain a Constant Current Flux 194
Formation of a Space Charge Layer on a Concentration Gradient
Cell for Preparation of TCNE- from TCNE/CH3CN 205 ,
xvii
\ -d=
6.2 Absorption Spectrum of TCNE, TCNE- in Methyltetrahydrofuran
6.3 PCP-,TCV' Absorption Spectra i n Water
6.4 PCP- Absorption Spectrum i n DCE ,
6.5 . PCP', TCV' Structures
6.6 Protonated forms O ~ T C V - and PCP-
6.7 TCNE/CH3CN Spectra after addition of water - - -
Page
6.9 [PCP-] vs. [H20j 219' 6-
6.10 [PCP-] vs. [Hz01
6.1 1 Log 1,/1 vs. Time 1332 nm)
6.13 Log 1,/1 (420 nm) vs. CTCNE Sublimations +& 226
6.14 TCNE/CH&N before and after vol tege treatment 228
6.1 5 Conversion of TCNE- t o PCP- 'I 230
-P
6.16 i n ((TCNE; 4/01) vs. Time
6.17 Cqnversion of TCNE- t o PCP- * and another species wi th k320nm'
xviii
6.1 8 Spectrum of #~+(TcNE-) in M H F at 77 K
Page
235
- 7
CHAPTER 1 - INTRODUCTION:
The present thesis i s concerned w i th the problem of DC conduction in k
organic solutions of low dielectric constant w i th conductivities i n the
neighbourhood of 1 O * V 1 m-I . Samples are prepared w i th the cysnocerbon
anions pen tacyanopropeni de (PCP-) and tri c yanovi nyal a1 coho1 ate (TCV-)
present i n dichloroethane (DCE) (e a 10) at concentrations of about 1 O-~M.
The contribution of convection to i k transport and the source of
hydrodynamic instabi 1 i t i es i n these systems are considered i n detai 1.
A model i s presented for the generation of f lu id f low in the systems
investigated here. This model applies to electrolyte solutions of a wide
range 'of conductivities. Concentration gradients i n solution are related to
unbalanced drag forces generating f luid flow. This i s demonstrated
experimentally and concentration gradients of the order of ( 1 o - ~ Mn/mm) are
found to be sufficient to ini t iate hydrodynamic instabilities. To my
knowle'dge, this i s the f i rs t study of convection driven'by concentration
gradients too small to result i n mess density gradients. Y
Conduction processes in dielectric liquids have been studied by a number of
workers and have been reviewed by ~al lagher' . Elec trohydrodynamic
phenomena are charac t eri s t i c of 1 ow conductivity 1 i qui ds and have been
extensively studied for the cases of unipolar or bipolar injection 2b,4. The
more general problem of elec trohgdrodynami c behaviour in weak1 y
conducting electrolyte solutions w i th dissociated ions i s not wel l
understood and this thesis makes a significant contribution in that area.
A-
Unipolar and bipolar injection studies cannot be easily extended to Oescri be.
the properties of industrial liquids of interest (i.e. fuel, mineral oil) which '
have more i n common wi th weakly conducting electrolyte solutions. The P
electrostatic hazards associated w i th the transfer of fuels are related to
their relatively low conductivity 6. A better knowledge of conduction
processes i n low conductivity liquids i s considered a key issue i n reducing
the considerable hazards associated w i th the fuel industry. Charge
separation that occurs during fuel f low through pipes may result i n voltages .
of sufficient magnitude to generate sparks and in i t iate an explosion of the
fuel.
The results of this study are applicable to electrolyte solutions over a wide
range of conductivities a1 though measurements were performed on solutions
of intennediate conductivity. Conduction studies have been carried out i n
very low conductivity solutions ( K< 10??-' mol ) by physicists interested i n
the intrinsic conductivity of dielectric liquids. However. the chemical
identity and mobility of charge carriers i s general1 y unknown ? Electrochemical measurements are rout inel y carried out by chemists i n
solutions of relatively high conductivity ( ~ ~ 1 O - ~ Q ~ rn-l). In electrochemical
studies the applied electric potential i s dropped largely at the
el ectrode/soluti on interface and the current response i s governed by
electrode processes. In this study. a signlficarbt portion of the electric >
potential i s dropped across the bulk of the sample. Therefore ion conduction
throw the bulk of the liquid plays a much more important role in the
interpretation of sample current characteristics. For the samples h
considered i n this study it i s possible to observe some c f the
el ec trohydrodynami c phenomena c h a m tens t i c of 1 ow conducti v i t y 1 i qui ds,
yet ion concentrations are sufficiently high to be monitored directlg via
absorption spectroscopy. The ion concentration behaviour $2 qace and ti me
i s used to interpret conduct ion processes i n the samples.
t
The role of electmde/liquid interface properties i n the observsd conduction
of dielectric liquids i s also of interest. Many of the data i n the literature
on solvent conduction are poorly reproducible and extremely sensitive to
electrode material and preparation? In this thesis the effect of different
electrode materials on ion concentration behaviour near the metal /l iquid
interface i s i s shown t o be related to
hydrodynamic phen a i n the liquids.
This study arose out of an at tempdo obtain evidence substantiating a * model proposed by Hichaelian et.alg on the spectroscopic and * J - photoconduction properties of charge transfer KT) solutions of
tetracyanoethylene (TCNE). CT interactions are of general interest i n m a y
chemical and biologieal systems, The proposed model expl ains qualitatively
the observed red shif ts i n the Resonance Raman spectra of CT complexes
w i th respect to the absorption pkfileslO. The existence o d g h l y damped
vibrational levels i s an important assumption in the model. Photoionic
dissociation of CT complexes was one of the suggested relaxation *
mechanisms for CT complexes i n their excited state. In conjuction w i th the
spectroscopic studies, MichaeJan et. al, observed that the conductivity of
CT solutions was photodependent '. The photoconducti on effect was
interpreted in terms of photoionic d i s s F n of the TCNE CT complexes
and according to the model this process was expected t o be dependent on the
excitation wavelength. 6
The starting point for this research were the data of Michaelian et. al. on
photocon'duction i n CT solutions1 The results were repeated for .
,. J TCNEImesi tylene/dichloroethane solutions and extended to include the
wave] ength dependence of photoconduction. These data and a br i ef
introduction to TCNE CT complexes are included i n Chapter 1. 1
In order to obtain unambiguous, reproducible data, further experl mental '
work was carried out investigation i n detail the variables affecting the
-'j system. The results of these experiments are discussed i n Chapter 2. They 5
showed that the photoconductivity of CT solutions could no longer be
interpreted in te rns of the original model.
By considering convection as a possible charge transport process i n TCNE CT
solutions, the photoconductivity could be interpreted qualitatively. In
Chapter 3 photodependent current response of a system di spl aying
convection visibly (Indigo/DCE) w i l l be compared w i th the behaviour of CT
solutions.
,J
Further experimental work on conduction i n CT solutions and TCNEIDCE
solutions i s discussed i n Chapter 4. An interpretation of the c u m n t
response in terms of electrical bounday layer space chsrge and ion
concentration i s suggested. Both cument versus t ime and current vs.
voltage behavi our are considered. The current versus voltage behavi wr
provides evidence for transitions i n convective f low in the sample as
vol tag8 i s increased.
L
Conduction i n TCNEIDCE solutions issnalyzed i n terms of the temporal and
spatial behaviour of ion concentration i n Chapter 5. This chapter i s divid&
into three sections. In the f i r s t section (5 .1~comla t ions of the current and
concentration response 1 n ti me are discussed. Current and mobi 1 i t y
measurements i n TCNEIDCE are compared to those i n pen tacyanopropeni de
salt solutions and pentacyanopmpenide i s shown t o be the dominant
negative charge comer i n TCNEIDCE. In Section 5.2, measurements of the
spatial behaviour of ion concentration in TCNEIDCE solutions demonstrate
the presence of hydrodynamic i nstabi 1 i ti es fo r concentration gradients
greater than about 1 W77n/rnrn. A drag force exerted on the liquid by
diffusion of ions i's suggested as a mechanism for generating f lu id flow. In
Section 5.3 a model explaining the origin of f lu id f low in electrolyte
sol u t ibns i s presented. The con tri but ions of space charge and concentration
gradients to unbalanced forces i n a liquid are considered. A
Chemistnj related to the study of conduction i n solutions with TCNE and t r
TCV- and PCP- respectively, as well as electrochemical generation of TCNE-
in solution are discussed in Chapter 6. Some of the properties of TCNE/DCE i
solutions are compared with acetoni t r i l e solutions of TCNE.
1 I
A final summary of the thesis includes a dk-ssion of the implications of
this work and suggestions for further work.
. REFERENCES:
T J. Gal 1 agher, 'Simple .Die1 ectri c Liquids'; C l aredon Press: Oxford 1975.
R.W.L. Snaddon, R. Poulter, 'Mass transfer and Dissipation in Unipolar Electrophoretic Flows', Journal of Phusics. D: Applied Phusics 1 980, u, 2263-2274.
8. Malraison, P! At ten, 'Chaotic Behaviour of lnstabili t y Due to Unipolar Ion Injection i n a Dielectric Liquid', Ph sical Review Letters 1 982,a ,
723-726.
Y. Aikawa, H. Shimoda, K. Kobayashi, A. ~akahbshi, S. Takeda, T. Sakata, M. Suki gara, ' ~ l ect roh ydrodynamic Di ssipat ive ~ t r u c ture i n Unipolar and Bipolar lnjection Cases', The Bulletin of the Chemital Societu of Japan
d 1 9 8 2 , z 654-65g.
P. Atten, 0. Halreison, S. Al i Keni, 'Electrohydrodynamic Stability of .
DielectricLiquidsSubjectedtoA.C.Fields',JournalofElectrostatics - 1 9 8 2 , u 477-488. b J. Lowell, Electrostatics 1979. Institute of Phusics conference Series ''
No.40; J. Lswell, Editor; v (preface).
T J. Gal lagher, 'Simple Dielectric Liquids'; lar red$ Press: 0%; ord 1975, Chapter 1.
J.C.Gi bbings, 'Interaction of Electrostatics and Fluid Motion', Electrostatics 1 979. lnst i tute of Phusics Conference Series No.48; J. Lowell, Editor; 145.
K.H. Hichaeli an, K.E. Rieckhof f, E.H.Voigt, 'Hodel ?heoY of Resonance Raman Excitation' Profiles i n Electron Donor/Acceptor Complexes', Chemical Phusics ~ e t ten 1977. q5,250-254.
K.H. Hichaelian, K.E. Rieckhof f, E.M.Voigt, 'Raman Resonance of Electron
Donor/Accep tor Complexes', Sciences 1 975,72.4 1 96-4 199.
K.E. Rieckhof f, E.fl.Voigt, 'Photoionic Dissociation of ~ o m ~ l e x e s of Tetracyanoet hylene in ~olu.tion=,
Chemical Phusics Letters 1 9 7 6 , s 482-483.
CHAPTER 2 - PHOTOCURRENT MEASUREMENTS IN
TCNE CHARGE TRANSFER COMPLEXES I
This chapter covers the in i t ia l experiments that were carried out to
corroborate and invest :;ate further K.H. Hichaelian et. a13 work on the
photoconduction ef f act observed i n solutions of tetracyanoethylene (TCNE)
charge- transf er (CT) complexes1. The observations include the dependence
of the photoinduced current change on incident laser power, applied voltage,
and excitation wavelength. Before discussing these results, a brief
introduction to the stucture and spectra of CT complexes or electron
' . donor/acceptor (EDA) complexes w i 11 be given.
TCNE i s a strbng electron acceptor and i t s structure i s shown i n Figure 2.1.
The four cyano groups decrease the electron density i n the n cloud of the
ethene bond. TCNE forms n-n* complexes w i th a number of electron
donating molecules. Complexes of TCNE wi th aromatic compounds have a'
sandwich-like structure allowing maximum interaction between the empty
n* orb1 ta l of TCNE and the f i l led n orbital of the donor nrolecule
(Fi r e 2.2). . According to Mulliken's valence band model of weak CT
co i? $1 exes 2, wave functions of the ground and excited states of the complex
canbe wr i t ten as follows:
.3;, (DA) = 8 *o (D ... A) + b t, (0' ... A-) 8 >> b
QL Y , (W = a* +, (D+...A-) + b* .k0 (D...A) a* >> b*
FIGURE 2.1 - STRUCTURE OF TETRACYAMETHYLENE
FIGURE 2.2 - CHARGE TRANSFER COMPLEX OF TCNE/MESITYLENE
Tetracyanoethylene
Acceptor (-q) I * * * *
where D = donor
A = acceptor
*,, (DA) = ground state wave function of CT complex L
'k, (DA) = excited state wave function.of CT complex I !
(orthogonal to *,,, (DA)) < -
.k (D ...# = 'no bond' wave function (dipole-dipole and London Q,
dispersion forces on1 y) . +, (D' ... A-) = dative or charge transfer wave function
i s responsible for t h k ~ ~ absorption band. On excitation within the
absorption band, an electron i s partially t ransfemd from the donor to the
acceptor molecule and the excited state has predominantly ionic chahcter.
The optical absorption spectrum i s typical 1 y a broad structureless band i n
the visible region as i s shown in Figure 1.3 for the TCNE/mesitylene
complex i n e solvent (but this also applies to the gas phase).
- The characteristic absence of vibronic structure in CT spectra i s an
indication that the excited state of the complex i s short-lived because o f .
relaxation pathways available to it. One of the radiationless relaxation
processes proposed by Michaelian et. a1 .' was the dissociatioh of the excited
state into ions which i s referred to as photoionic dissociatio Ytiine
- FIGURE 2:3 - CT COMPLEX ABSORPTION SBECTRUM
&
TCNE/mesi tulene dn DZE
Sample: [TCNE] = 0.005 M.
[mesitylene] = 0.025 H.
[Complex] = 7 x 1 O* f t 1
Excitation wavelengths are marked.
of the excitation and relaxation processes for donor/acceptor
shown below.
DA + hv- ----, DA* (excited state)
DA* ---, ( 1 ) D+ + A- (photoionic dissociation)
---, (4) other radiationless deexcltation pathways
The scheme outlined above does not include the effects of solvent
interactions on the complex or the dissociated ions. The dissociation of the
complex into ions in step ( 1 ) i s favoured i n solvents w i th a hlgh dielectric
constant. Thus, i t i s logical to study photoionic dissociation of CT
complexes i n a solvent wi th sufficiently high dielectric constant to
stabilize f n e i.onsgener~t$d . wi th ght absorption. 'i The in i t ia l observations of ~hotoconduction i n CT ~ l f i i o n s can be
interpreted leg1 timatel y bg a model of photoionic dissociation of charge
transfer complexes. These observations included the dependence of the
photoi nduced current change on incident 1 oser power, appli ed voltage and
excitation wavelength. The dependence of photocurrent on the excitation
energlj was of particular interest since thls would shed l ight on a model of J
the resonance Raman, absorption, and fluorescence profiles of elect m n
donor-acceptor complexes proposed by Michaelian et. elm3
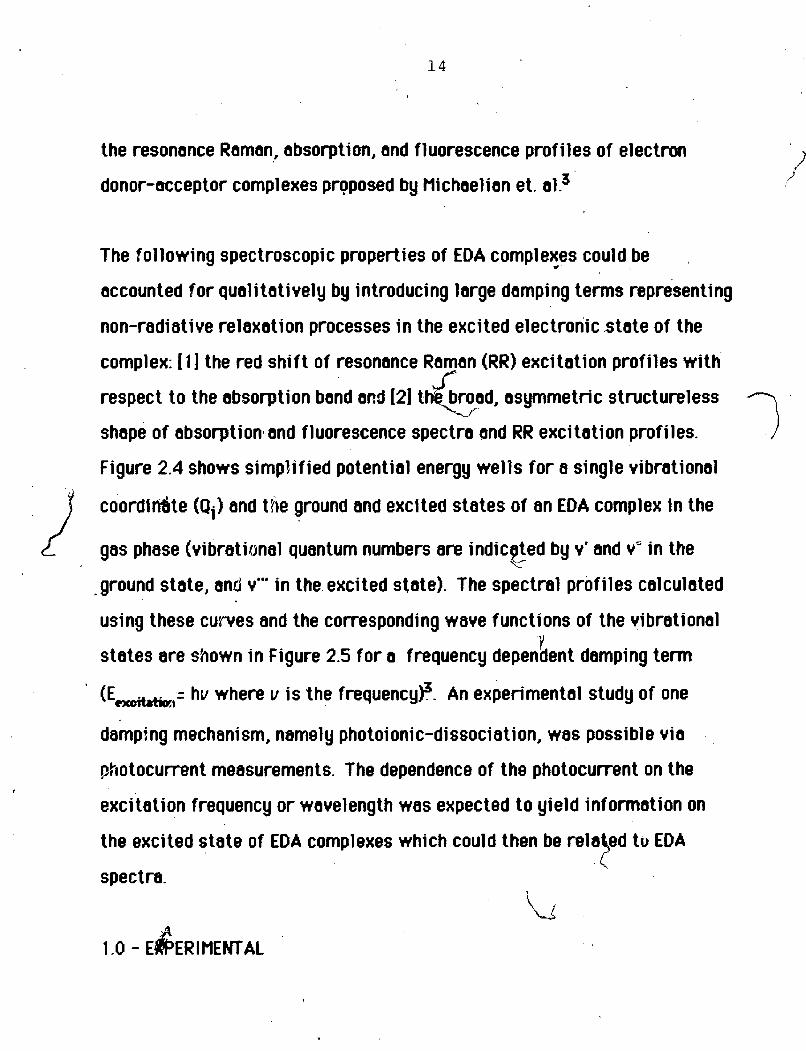
The following spectroscopic properties of EDA complexes could be , 1
accounted for qua1 i tativel y by introducing large damping terms representing
non-radi at i ve relaxation processes i n the excited electronic s t ate of the
complex: [ 1 ] the red shi f t of resonance Raman (RR) excitation profiles wi th
respect to the absorption bend a d 121 t broad, asymmetric structureless c shape of absorption1 and fluorescence spectra ond RR excitation profiles. 3 Figure 2.4 shows simplified potential energy wells for a single vibrational
coordirdte (ai) and the ground and excited states of an EDA complex in the
gas phase (vibrational quantum numbers are indic ted b v' and v' in the & ground state, and v"' i n the excited state). The spectral profiles calculated
using these cufmes and the corresponding wave functions of the vibrational Y
states are shown i n Figure 2.5 for a frequency dependent damping term
' ( E A = hv where v i s the frequencyP. An experimental study of one
damp', ng mechanism, namely photoi oni c-di ssociation, was possible via
photocuwnt measurements. The dependence of the photocurrent on the t
excitation frequency or wavelength was expected to yield information on
the excited state of EDA complexes which could then be
spectra.
FIGURE 2.4 - SIMPLIFIED POTENTIAL ENERGY CURVES FOR THE GROUND AND EXCITED CHARGE TRANSFER STATES
was monitored using a lock-in ampli f ier (PAR Model 124 or HR-8). A 8ignal
of about 0.05 rianoamperas was observed fo r one m i l l iwa t t of incident light.
This was equivalent t o generating one chdrge a t the electrodes. fo r e v e y 1 o7 incident photons. The resulting A C photocurrent signal was superimposedpn
a relat ively large DC current offset f rom the sample's intr insic
conductivity. The transformer mode of the lock-in ampl i f ier was used to
measure the current photosignal despite the large o f f set, and even though
phase i n f o n a t i o n was lost i n the process. The signal t o noise ra t io was
optimized using a chopping frequency of 375 Hz. Photocurrents were
measured one t o two hours of ter voltage application t o ensure sample
stabil ization
DCE was chosen as solvent because it had a suff ic ient ly high dielectric __--. - ,
constant ( e 40) t o support ions and did not interact appreciably w i t h t he
electron acceptor TCNE. Mesitylene was chosen as a donor since i t s W r g e
transfer b ind w i t h TCNE was i n a wavelength region suf f ic ient lg C wel l P
cqvered by the ion lasers available. The laser l ines used are indicated on
the CT band of TCNE/Hesitylene i n Figure 2.3. Mesitylene mixes readily w i t h
DCE for a l l concentrations.
A CARY 17 spectrophotometer weS used to measure the absorbances of CT
solutions. The concentration of CT complexes could then be determined, as - wel l as the fraction of l ight abswbed at di f ferent wavelengths.
\
1.1 - DISCUSSION 4
The ini t ial data on the photo-current response of solutions with CT
complexes were consistent with a model of wavelength dependent
photo-ionic dissociation of the complex es suggested by Hichaelian et. a1 .y
Three properties of the photosignal were expected from this model:
1. Photocurrent == incident laser power
(*ion pairs produced s *CT complexes excited)
2. Photosignal = voltage applied
(current :: dri f t velocity)
note: It was assumed that the
much shorter than the chopper
h
l ifetimes of ions i n solulion were
cycle time (1. 4 t-)
3. Quantum efficiency (*e-/*photons absorbed) increases with -.
excitation energy.
(non-rsdiative relaxation via dissociation i s a function of the
exci tstion energy)
The photosignal was found t o increase linearly wi th incident laser power
{Figure 2.7). A saturation effect was observed i n a few samples at lower
'vol t a p s (i .s 1 5th' v s 1 8OV) (Figure 2.8).
FIGURE 2.7 - PHOTOSIGNAL VS. INCIDENT LASER POWER
Ssmpl e: RCNEI = 0.005 H.
[Mesi t ylene] = 0.025 M. in DCE r 6 -
A = 457.9 nm. I
V-= 180 Volts
slope = 0.055 nA/mW
Trial 1 and'~r ia1 2 were carried out on two consecutive days. S
trial 1
trial 2
*
Intensity (mW)
FIGURE 2.8 - PHOTOSIGNAL VS. INCIDENT LASER POWER
Sample: [TCNE] = 0.005 M.
[Mesitglenel = 0.025 N. in DCE
f t i
5 10 Intensity (mW)
1 j5
The l inear dependence of the photosignal on the applied v ~ l toge is.shbi;n in / '
"--A'
Figure 2.9. Two sets of measurements are shown which were performed on
consecutive days. The results were reproducible within the error l imi ts . -
Such l inear dppendence of photosignal on voltage and incident laser power -w
had been d e r h s t r a t e d previously .
In order t o assess the ef fect of excitation frequericy on the phc(kurrent, k *,
the measurements of l a 'er power were corrected t o give the a m o b t of l ight t actually absorbed i n the region between the electrodes.
Z
where - 'A = l ight absorbed between electrodes
= l ight incidenton cel l ' 0 1
T = X transmittance up to electrodes
A = X absorbance between electrodes
The effect ive transmittance through the aii-glass interlace changes by only
0.1 X over the green to violet wavelength range.
The photosignal (V, = i, R where i, = photocurrent) was measured as 8
function of incident laser power (I,) fo r a number of different wavelengths
FIGURE 2.9 - PHOTOSIGNAL VS. VOLTAGE
Sample: [TCNE] = 0.005 M. h
[Mesi tyl ene] = 0.025 M. in DCE
A = 480 nm.
I =46mW. 0
Tr ia l 1 and Tria l 2 were carried out on two consecutive days.
Trial 1 Trial 2
Voltags (V)
(Figure2.6). 180 volts were applied across the cell. A typical graph of
photosignal versus incident laser power i s shown i n Figure 2.7 . The amount
of photocurrent (nA) genemted per mil l iwatt of incident power was
calculated from the slope of 1, vs. I,. This measurement was then corrected -
to give the photocurrent genemted per mil l iwatt of absorbed light.
where *
L = photocurrent signal
lo = incident laser power 4
I A = absorbed lasqr - pqwer
T= X transmittance up to electrodes
A = % absorbance between electrodes -
Values for i,$, are shown in Table 2.1 along with values for the quantum
efficiency at different excitation wavelengths. The quantum efficiency iR)
was calculated as shown below and r e s the number df electronic
chwges produced a t the electrode per a
EFFICIENCIES FOR
' Z TABLE 2.1 PHOTOCURRENT GENERAT ION
R = *e-/*photons absorbed
N = *e- per FA: ?
N = *photons per mW. P
.J'
The graph of R vs. wavelength (Figure 2:10) i s consistent wi th an increase i n
the probablli ty of dlsSociation w l th excl tation energy. The error l lmi t s
were estimated from the uncertainty i n each of the graphs of photosignal vs.
L laser intensity.
Because o t the consistency of these data with the original data and model,
the problems associated with obtaining reproducible photosignals were not
immedia\el y apparent. However, further photocurrenf measurements
demonstrated that the results were not consistent1 y reproducible. A better
control of the variables affecting the system seemed neccesay. Thus, by
improving the optics, the electronics, sample preparation, electrode t
preparation and temperature control, a slgni f lcant improvement in /
reproduci b i l l t y and more a~curste data on quantum efficiencies at di ff erent \
A wavelengths were antlcipated. /"--',
FIGURE 2.10 - "
QUANTUM EFFICIENCY VS. EXCITATION WAVELENGTH
Qua
ntum
E
ffic
iency
I
(1 0-= un
it el
ectr
onic
ch
arg
eW
photo
n)
REFERENCES: I
1. K.H. Hichaelian, K.E. Rieckhof f, E.H. Voigt, 'Photoionic Dissociation of Electron Donor/Acceptor Complexes of Tetracyanoethylene in Solution', Chemical Phusics Letters l 976 ,a 482-483.
2. R.S. Hul l i ken, W.B. Person, 'Molecular Complexes, A lecture and Reprint Volume'; Wi'ley Interscience: New York, 1 969.
3. K.H. Hichaelian, K.E. Rieckhoff and E.H. Voigt, 'Hodel Thebry of Resonance Raman Excitation Profi les in Elegtron DonodAcceptor Complexes', Chemical Phusics Letters 1977,45-250-254.
3
CHAPTEP 3 - REINTERPRETING THE PHOTOSIGNAL
The hvestigation of the effects of different variables on the photosignals
measured i n charge transfer solutions led t o a major reinterpretation of the
earlier experimental resu7ts. In section 3.1 the shape and magni tude of the
photosignal as well as i t s dependence on l ight exposure time, beam
geomety and b e y position w i l l be discussed and compared w i th the
original model. Following this, i n section 3.2, another interpretation of the
photosignal w i l l be con side red^ which includes convective effects i n
solution. This model accounts qualitatively fo r the observed photoresponse.
3.1.1 - PHOTOCURRENT, DEPENDENCE ON LIGHT EXPOSURE T lflE
The chopping frequency of incident laser l ight on CT solutions, was varied in
order to study the effect of l ight exposure t ime per cycle on the measured
photosignal. The experimental set-up i s identical to that used previously
and i s shown i n Figure 2.6. Figure 3.1 shows the photosignal as a function of
chopping frequency. The photosignal increases a.s the chopping frequency i s
decreased. A graph of photosignal versus half cycle t ime (1-12 = 4
1 12f- 1, or l ight exposure time per cycle, shows that the signal rises * -
mo'si rapidly i n the f i r s t 10 ms. (Figure 3.2). As the half-cycle t ime i s i
increased, the signal continues to rise. The previous measurements at 375
Hz. (t- 125 1 -33 ms.) did not corresporid to steady state conditions.
FIGURE 3.1 - PHOTOSIGNAL VS. CHOPPER FREQUENCY
Sample : 4 ml. of 0.00 1 M. TCNE/DCE J
2 ml. of mesi tylene I
V = 200 Volts
A = 476.5 nm
frequency increased frequency decreased
10 20 30 4 0 50 60 70 80 9 0
CHOPPER FREQUENCY (Hz)
FIGURE 3.2 - PHOVOSIGNAL VS. HALF CYCLE TINE
Sam'ple : 4 ml. of 0.00 1 H. TCNEIDCE
2 ml. of mesi t y l ene -=,
V = 200 Volts
1
h =
47
6.5
nm
h
alf
cycl
e ti
me
dec
reas
ed
hal
f cy
cle
tim
e in
crea
sed
HA
LF
CY
CL
E T
IME
(m
s)
In theoriginal model the fractionof thephotoinducedchargereaching the .
electrodes per second should have been independent of the light-on time.
Only the voltage dependent dr i f t velocity and the ionic lifetimes were
expected to change the rate of photocurrent generation at a given excitation
wavelength. a
Tf;e shape of the current response in time was invegtigated more closely
using signal averaging techniques (Figure 3.3). The duration of the light
7 exposure was varied using a chopper or camera shutter with a manual
control. The overall DC current-time response was also measured directly
(without averaging).
>
In Figure 3.4, the shape of the photosignal i s shown for different chopping
frequencies. Following illumina?ion, a rapid change i n current i s observed.
This i s consistent with the observed dependence of the photosignal on
half -cycle time (Figure 3.2). The increase i n the signalqagni tude with
decreasing chopping f rquenci i s also consist kt with the bata i n Figures
3.1 and 3.2. Figur6 3.5 shows the photocurrent reponse w th longer light 1 exposure times (1 - 20 sec). The current response lev& out around 300 ms.
(Figure 3-58). This was beyond the range previously investigated in a-
Figure 3.2.
A Superimposed on the photosignalms sawtooth shape i s the fluctuating DC
current background. A t higher frequencies (i.e. 375 Hz.) the magnitude of
the noise could easily have overshadowed the photosignal. This explains
FIGURE 3.3 - SIGNAL AVERAGING APPARATUS
I Sample
Gain -10 DC offset
( Home built )
TEKTRONIX 468
Digital Storage Oscilloscope
FIGURE 3.4 - PHOTOSIGNAL SHAPE I
Sample : 4 ml. of 0.00 1 M. TCNEIDCE
t
2 ml. of mesi tylene
/ V = 200 Volts
't' The current decreases following light exposure.
X
Time (50 msldiv)
Time (2-ldiv)
L
FIGURE 3.5,-
Sample : 4 ml. of 0.60 1 H. TCNEIDCE
2 ml. of mesi tylene % ? - V = 200 Volts L.
' + X = 476.5 nm.
The current decreases following light exposure.
Time ( 0 . 1 s e d d i v )
Time ( 1 s e c / d i v )
Time (2 s e c / d i v )
ave
O V t
ave
over 2
why the initial attehpts t o monitor the photosignal shape with an $\ oscilloscope without signal averaging capability were unsuccessful.
The main features of the cuhent response to light are summarized below
for TCNE/Hesity?ene/DCE samples. These features are demonstrated in
Figures 3.5 and 3.6.
1. A sharp drop in current fol!ows light exposure:The drop in
DC background currerit i s generally preceded by a delay time as
shown in Figure 3.6 (9 = 10 volts). One measurement with a
chopping frequency of 35 Hz (V = 200V) did not show a delay time #
-lay time < 250 psec.).
2. The rate of current drop declines and approaches zero, after
which random fluctuations and noise are observed in
the current response. (Figures 3.5b, 3.5~).
3. A sharp increase in current follows when light exposure i s
discontinued. (Figure 3.6 - DC response not averaged). This
increase in current levels off, after which random
flustuetions in the cumnt are observed again (Figure 3-61.
The drop i n currant with incident light was not consistent with the previolrs
assumption that photoionic dissociation would increase the number of
t charge carriers in solution. ,
' FIGURE 3.6 - DC PHOTOCURRENT RESPONSE ( no averg@q) P
p~ -. - - - ~
Sample : RCNE] = 0.003 M.
[mesitylene] = 0.028 M. \
v- = 10 Volts
X = 482 nm.
The current recovey time with no incident light was approximately 4 minutes.
Table 3.1 shows the photoinduced change in the DC turrent a t different
voltages. In the range from 5 t o 20 volts there i s no longer a linear
dependence of the photoresponse t a the applied voltage. Such behaviour
was not consjstent w i t h the expected contribution of d r i f t velocity to the
photocurrent. The photosignal magnitude and t ime response were also found
t o be sensitive to electrode preparation and voltage history.
3.1.2 - PHOTOSIGNAL GEOMETRY DEPENDENCE
Another group o h e r v a t i o n s that went beyond the previous work was the
dependence of the photosignal on the geomety of the cell. Both the shape f --\
and position of the incident l ight beam were considered. T q d i f f e r e n t i, '----,ylj
chopping frequencies (9.5 and 95 Hz.) were used with higoal averaging. ,'
/'
The magnitude of the photosignal i s larger w i t h the l igh t beam near the
posit ive electrode (anode) than w i t c t h e beam near the negative electrode
(cathode). The decrease i n photosignal i s continuous as the beam i s moved
.from the anode through the center of the cel l t o the cathode. Table 3.2
summarizes these obbervations, as wel l as the ef fects of beam shape: n
-- - - Jhree beam prof i les were considered: circular (0.5mm. diameter), vertical
(=3 x 0.5 mm), and horizontal ( 1 x 2 mm). The vert ical ly oriented beam
- prof i le results i n larger photosignals fo r the same incident laser pow&r+The
-- number of photoinduced charge carriers should have been independent of i
TABLE 3.1 I *
DC CURRENTPHOTORESPONSE
V ADC/DC ADC LASER POWER PHOTO RESPONSE
,
TABLE 3.2
GEOMETRY DEPENDENCE OF PHOTO-CURRENT SIGNAL
BEAM GEOMETRY SIGNAL (across 1 M8)
middle of cel l 9.5 Hz 0.1 16 p A - 0.140 JAA near -ve plate 9.5 Hz 0.080 p A - 0.100 PA near +ve plate 9.5 Hz 0.180 p A - 0.1 00 PA glancing +ve plate 9.5 Hz 0.190 PA glancing -ve plate 9.5 Hz h 0.080 yA
glancing -ve plate 95 Hz 0.138 nA - 0.152 nA -ve o f f center 95 Hz 0.15 nA center 95 Hz 0.195 nA +ve o f f center 95 Hz 0.23 nA glancing +ve plate 95 Hz 0.30 nA
vertical beam: I 1-1
center 95 Hz +ve o f f center 95 Hz -ve o f f center 95 Hz
-* - horizontal beam: I - I 1
beam location or shape according to the original model and so the preceding ' observations (Table 3.2) could not be reconciled with that model.
4
As a result of these observations and those in the previous section the
originally proposed mbdel for the mechanism of the photocurrent response
in CT solutions had to be abandoned-in favour of possible alternative
explanations.
3.2.1 - EVIDENCE FOR CONVECTION AS A CHARGE TRANSPORT PROCESS
IN CHARGE - TRANSFER SOLUTIONS B
YI In an attempt to explain the photocurrent behaviour described in the
previous chapter a convection mechanism for current transport was 4
---'
considered. Then the decrease in sample current under illumination could be
explained by intemptions in the convection patterns i n the cell induced by * -
=i the absorption of light.
A lenslng effect i s observed In CT solutlons fo r hlgher beam lntensltles (I,>> *
10 mw, beam diameter lmm.) and clearly demonstrates that incident light
can generate moving liquid density gradients i n the sample. As a result of
lensing, the size and shape of a transmitted light beam pulsate irregularly
in time. A qualitative comelation can be made between the pulse time of
the tnrnsmi tted beam and the time required for the initial decrease i n DC
current after illumination. The characteristic decrease i n cumnt with
illumination i s s t i l l observable at higher light intensities. Although no
lensing Gas observed i n samples during the photocurrent measurements
discussed i n the prevRi6-~hapters, the pob ib i l i t y of l ight interfering w i th
charge transport processes needed further investigation.
It was found that acoustic noise could also result i n the disturbance of
convection patterns and thus a decrease in the DC current. Figure 3.7 shows
this using the periodic sound pulse (30 Hz.) from a strobe l ight (without
sample illumination). The apparatus i s shown in Figure 3.8. Each sound \
pulse results i n a sudden decrease i n sample current followed by smaller
oscillations. Also it had been observed previously that the current response
was very sensitive t o mechanical vibrations (i-e-tapping the lab bench). Both
vibration and laight absorption could introduce l iquid motion in a direction t
perpendicular to the applied f ie ld (cross-f ield) and thereby interfere w i th
charge transport i n the sample. These observations were consistent with,
but did not prove in and of themselves, the existence of electroconvection i p
the charge transfer solutions. Further evidence was needed to establish the
importance of convection i n CT solutions and the role that it played i n the
photoresponse. t
3.2.2 - EVIDENCE FOR CONVECTION IN AN ANALOGOUS SYSTEM - INDIGO (DYE)/DCE
One method of observing convection in solutions i s to introduce small
* n d q particles which w i l l indicate the f low pattern. Unfortunately, the
particle*duced w i l l tend to pick up charges and change the current
FIGURE 3.7 - DC CURRENT ACOUSTIC EFFECT
Sample : 4 ml. of 0.00 1 V TCNEIDCE
6 ml. Of mesi t ylene
V = 200 Volts
The current decreases following each sound pulse (f = 30 Hz.) and oscillbtes before returning to i ts initial value.
EDUCTOR OUTPUT
Time (msec)
FIGURE 3.8 - SIGNAL AVERAGING' APPARATUS. ACOUST lC EFFECT
* Signal input to eductor is offset by oscilloscope
HVPS b 0 Stroboscope ( ~ l u k e ) r 1'
Phototransis tor
Averaged ' Trigger
Y signal + OUT i N IN I
* " . Y
El EDUCTOR , * - *
C
Oscilloscope
characteristics of a solution1. Nevertheless, a useful analogous system was
found for making qualitative comparisons with the TCNE/Mesi tylene/DCE
system: I'ndigo synthetic (Vat Blue 1) suspended in DCE. lndigo dye
particles are electropositive (as demonstrated by the flow of particles
under an applied-electric field - Figure 3.12) and can easily be prepared as a
suspension in DCE using an ultrasonic bath. The DC current responses of DCE -i
solutions with TCNE or lndigo particles were qua1 i tativel y similar (see
Figures 3.9 and 3.10Mlk0, both the lndigo/DCE and CT solutions absorbed f ' .
incident light over a broad region of wavelengths ( TCNE/mesitylene AM=
458 nm, lndigo dye Xm=605 nm 2). Presumably, i f convection was
observed in the indigo dye solution, and i f the observed convection could be
shown t o be related to the photocurrent, then this would be a promising
indicationthatthesamemechanismisop tiveintheCTsolutions. "", To measure the dark DC current response for samples, a cell with platinum
electrodes (the same cell that was used for photosignal measurements
previously) was connected in series with a load resistor (q = 1 0KO). The - -
current ifas then measured over time by monl torlng the signal across the
load resistor af ter a step voltage was applied.
The application of voltage t o DCE solutions without prior voltage exposure
i s followed by an immedidte-&chase i n the current. A steady,state current,
i s approached as the rate of current change decreases i n time. On voltage
- reversal the current peak i s displaced i n tlme (Figures 3.9 bnd 3.10). The
FIGURE 3.9 - DC CURRENT RESPONSE OF TCNE/DCE
Sample: UCNE] = 0.002 M.
platinum electrodes
/ FIGURE 3.10 - DC CURRENT RESPONSE OF INDIGO/DCE
( P t electrodes)
peak
state
4 6 Time ( m i d
I -
1 0 - 0 2 4 0 - 2 .,c
4 ' 6
Time (mini Time lminl
measured steady state conductivities for the IndigoIDCE sattiples -7 1 [(2-4)x 10 Q- m-l] are larger than those measured for DCE alone'
( 1 W9- 1 O * k l ), and of the same order of magnitude as conductivities for a 1 1 TCNE/DCE samples (- 1 0 Q- m- for RGNEI = 0.002H).
The effect of illumination on the Indigo Blue DCE suspension with applied h
voltages from 1 t o 40 volts i s presented in Figure 3.1 1. A He-Ne laser was
used to illuminate the system (wavelength = 632.0 nm.). Both the direction
and magnitude of the DC photocumn? response varu Y with voltage. Above 5
volts the DC cukeat decreases with sample exposure t o light after a delay. -
time (Figure 3.1 1). just as had been previously observed in CT solutions.
Below 5 volts the sample current actually increases with incident light.'
This increase in photocurrent with illumination had not been previously
observed in cT solutions. i The fundamental difference in photor6sponse a t different voltages could
only be interpreted by considering the FJe particle patterns in the
IndigoIDCE system. The patterns were dhserved with light scattered from
t the suspended particles.- Only one view was recorded, namely the one
*: looking down a t the top of the platinum electrode cell. ~ i ~ u r e 3.12 and - d Table 3.3 summarize the70 observations. Below 5 volts, no evid nce of
turbulence i s observed in the indigo/DCE solution. The dye particles move -- . away from the anode with voltage application. This results in a well
defined front beyond which nothing appears to be in suspension. In this
voltage region the current increases ti th incident light. This increase can
FIGURE 3.1 1 - PHOTOCURRENT REPONSE OF INDIGO/DCE AT Dl FFERENT VOLXAGES
I
0 light on
lightoff
4 n c \ I olts
I 1 I 1 I I I I
0 2 4 6 b 10 12 14 16 I
Time (min)
Time (min) 118
40.0 Volts
Time ( m i d
FIGURE 3.12 - DYE PARTICLE PAl lERNS IN INDIGO/DCE AT DIFFERENT VOLTAGES
TABLE 3.3 I NDIGWDCE ELECTROCONVECT WE PATTERNS
VOLTAGE COMHENTS
1 .O5 V No turbulence; dye particles form a clean front; positive photoresponse.
2.0 V NO turbulence; dye particles form a cledn front; posi tlve photoresponse.
5.0 V There are some irregularities in the dye front
10.0 V Some mixing of dye particles; negative phot~fe~ponse 2
' 1 5.0 V Lots of mixing of dye particles ,
Y
40.0 V Turbulence; 'zig zag motion of partides; negative photoreponse. s . .
be accounted far by the reduction in solvent viscosity with temperature and
the resulting increase i n particle mobilities. A t 5 volts some irregularites
are observed in the line dividing the regions of high and low dye particle
density, however there i s s t i l l no significant mixing of the solution.
In the region above 5 volts, the dye particle patterns give definite
indications of turbulence and mixing : the dye front develops point
irregularities and bands of high and low particle densities form fairly
stable patterns over the time of observation. Within the overall pattern,
particles execute a zig-zagging motion back and forth across the cell. The
voltage range above 5 volts results in a decrease i n the current with
incident light (Figure 3.1 1). The observation of a critical voltage, above'
which turbulence ensues, is characteristic of electrohydrodynamic
phenomena observed in low conductivity liquid^^,^ and i s further discussed
in Chapters 4 and 5.
A l l of these observations are consistent with the picture that inqident light-
interrupts convective charge transport and theref ore results in a decrease
in the current carried through the IndigoIDCE solution. It i s thus reasonable
to propose that the same mechanism i s responsible for the photocurrent
response observed in CT solutions. In order to establish the role of
convection as a charge transport process, the basic nature of conduction in
DCE solutions had to be addressed.
- JI
5 2 'S .
C
REFERENCES:
A. Rich, J.L. Sproston, 6. Walker, 'Some Observations on Bulk Electroconvection i n Electrically Stressed Liquid Dielectrics', Journal gf Electrostatics 1982, 50340 . .
J. Fabian, H. Hartmann, 'Light Absorption of Organic Colorants'; Spri nger-Verl ag: Berlin, Heidel berg, 1 980, pp 1 1 6- 1 23.
P.K. Watson, J.H. Schneider, H.R. Till, 'Electrohydrodynamic Stabil i ty of sPace-charge-~i;ni ted Currents i n Dielectric Liquids', The !- Ihusics of Fluids 1970, fi 1955- 1 96 1.
R.W.L. Snaddon, R.Pou1 ter, 'Mass Transfer an 4 Dissipation i n nipolar Electrophoretic Flows', Journal of Phusics 0 - Amlied +'
9 Physics 1980,& 2263-2274.
Chapter 4 ,
To assess the influence of convection in TCNE charge transfer solutions, the
variables contributing to conduction were investigated. Only a few
sentative experiments perf .J onned on dichloroethane solutions with a
and mesi tylene w i l l be discussed in order t u identify some important
aspects of the conduction process. This chapter w i l l summarize the I
features of the current response of -TCNE/DCE and TCNEImesi tylene/DCE
samples in three sections: 1 ; ! the dependence of conductivity on the
concentration of TCNE and mesi tylene 121 1 shape of p e current-time
Jesponse, and I31 a description of tage chsracteristics. I
I
40 - MATERIALS AND METHODS for SECTIONS 4.1.4.2.4.3
I
The preparation of TCNE, mesitylene and DCE has already been discussed in
the 'materials and methodsa section of Chapter 1. A diagram of the sample
cell with platinum (Pt) electrodes i s given i n Figure 4.1 . This electrode
configuration was identical t q the one previously used for photoconductlvi t y
measurements. Two square Pt electrodes (A = 1 cm2) were separated by
2mm in aglasscell. Thecelts weresealed with a tight f i t t ingtef lonl
covered with aluminum foil and wrapped with Teflon tape. Some
measurements were carried out in fluorescent room light rather than in
dark but this had no observable effect on the current characteristics.
the
The DC current response of the sample was monitored by measuring the
FIGURE 4.1 - PJ,ATINUfl ELJCTRODE CELL
rods
f l signal across a load resistor in series with the sample cell (Figwe 4.2).
O
Typical&, for 0.0 1 M TCNE/DCE samples, measured resistances were of the
order of 10 NO. A 10 kO load reslstok would therefore only affect the
'current by about 0.1 X. A 1 NO resistor was used for some of the ini,fial
measurements on current peak times. he 1 HO load resistor would not have
changed the times at which maximum current readings were recorded d
a1 though i t would have affected the current readings by about 1 0%. The
method of current measurement shown in Figure 4.2 was sufficiently
accurate for our purposes since many of the experiments involved
quali tatrvg compdrisons of signal shape, and since the results were liable to + ,chbnge significantly as a result of other variables. *
The other variables affecting TCNE/DCE current response measurements
included voltage histoy, sample-cell cbntact time and electrode ,
prepamtion. Most 'steady state measurements involved times of yo1 tage ' 8.
application anywhere from 15 minutes to 8 hours. An bxperiment involving
the measurement of current as a function of mesitylene concentratton . ,
(Figure 4.5) was an excepti&ince 'steady state' measurements were, taken
after about 6 minutes. Attempts to correlate current-with TCNE <
concentration using - the shorter runs were not fruitful. As a result of
increasing the sample-cell contact time (at zero applied voltage) from 15, ,
minutes to one hot , the steady state signal observed foe a 0.004 H TCNE
sample increased about two-f old. t . ,
I The s m e two Pt cells (Figure 4. I ) were used repeatedly for the
FIGURE 4.2' - CURRENT MEASUREMEHT
, Square wave current reponse
f , Step VoJ tage cu&t response
square Wave Current Response
Function Genera tor
F 51
Step Voltage Current Response
Anatek Power
Supply
( 0 - 5 0 V )
Voltage
Smtch
'3 Open
Polar ~t y
Switch
( 4 +-
u L
mdasure!ments described i n this chapter. Cell cleaning was theref ore an
important aspect of the experimental work since electrode aging and
degradation needed to be avoided i n order to compare sets of data.
Occasio~~ally chemical deposits appeared on the electrodes af ter voltage '
treatments. It was di f f ichl t to ascertain any specific conditions that would
generate] deposits. Hinute crystals of TCNE were sometimes observed s n the
Pt electrodes after a voltage treatment (< 50V). A drop of mesi tylene .. .
turned tl'e electrode a bright orange color characteristic of the
TCNE/Mesitylene charge-transfer complex. In other instances, an
orange-lBl5ivn coating was observed. On the basis of information obtained
later on the chemisty of TCNE, the orange deposit t a s probabfl a
pentacyanopropenide salt A purple coatinq on the anode w a b s e r v e d , -
twice during photoslgnal measurements (200 v' applied) but was not
observed wi th the current measurements at lower voltages. The purple -
coating was probably a TCNE- salt. Thin f i lms of H+ TC:iE- salts are
reddish-blue or purple 2. In order to maintaia the Pt electrode surf ares,
various cleaning methods were investigated to remove these deposits.
a Cleaning methods were evaluated by comparing the currents measured .
through dist i l led DCE i n the cell after different chemical treatments. This --
- seerrim3 a reasonable approach since, at the time, details of the electrode
chemistry were not known: Table 4.1 shows the effect of different cell
-a, - cleaniog methods on the DCE current measurements. Chromerge cleaning
was used for the runs shown i n Figures 4.3.4.4. The
mesi tylene-methanol-DCE treatment was used fo r the measurements shown
TABLE 4.1 DCECURRENTRESPONSE
WITH DIFFERENT CLEANING METHODS
CLEANING METHOD
.T
i n Figure 4.5.
The conductivity of DCE was used as astandard tdcT iee cel l cleanliness
before each set of runs. The criterion fo r includng data on TCNEIDCE
solutions was that the DCE standard had a conductivity less than one-tenth
that of the sample. Thus the charge carriers in solution could be assumed to
be largely the result of additives to the solvent (i-e. TCNE and mesi tylene). 7 The trace impurity charge camers i n highly purif ied dielectric solvents are
L
d i f f icu l t t o identify!
Efforts were made to keep water out of the samples. Part of the ptkpose of
solvent and TCNE purifications was to remove water that might effect the
measuf-ements. The Pt cells were carefullb sealed to prevent evaporation as
wel l as water exposure. The contribution of water t o th6 conductivity i n
TCNE/DCE solutions was in i t ia l ly thought to be m a l l since the addition of a
few drops of water to a 5 ml. TCNE/DCE sample had no immediate
significant effect on the current. The important ro le of water i n the
conduction measurements was much better understood la ter when the
charge carriers i n our samples had been identified. (Refer to Chapter 6 for
information on how l i t t l e water was neccesay t o affect the system
significantly). A
Y
4.1 - CONCENJRAT 113N DEPENDENCE OF CONDUCTIVITY
One of the major issues t o be addressed i n interpreting conduction i n TCNE
charge tranfer solutions was the nature and generation of charge carriers in *
solution. The effects of both mesi tylene and tetracyanoethylene on tbte DC - currents have been consideredmd some results arb shown i n Figures 4.3,
4.4 and 4.5. Since the current response of the samples depended on a variety
of uariables $such as vol t a p history, electrode preporat+,
electrode-samplecontacttime,tonameafew,it wd s d i f f i c u l t t i ~ o b t a i n $
reproducible conductivities at given concentrations. However, some basic
trends appeared and these w i l l be summarized.
The majori ty of the charge carriers in TCNEIDCE samples (0.0002 Pl < iTCNEl
) are the result of'the presence of TCNE, since addition of TCNE to
dichloroethane increases the measured conductivity. In Fjgure 4.3 the
'steady state' current is plotted vs. TCNE fo r three concentrations w i t h the
current measured in the following way: A single step voltage was applied to
the sample and the current was assumed t o be at steady state i f i t
f l u c t ua taby less than 15% over an extended period of time. An example of
the f i r s t 5 minutes of a current response i s shbwn in Figure 4.6. ~ o t d i n
Figure 4.3, that the lower the TCNE concentration is, the longer it tokes for
the current t o reach steady state conditions. The steady state conductivity
of the 0.01 M solution of TCNE i s ( 1 . 2 + 0 . l ) x l 0 ~ Q-lrn-! This i s 2 orders of -8 -1 1 magnitude larger than the DCE conductivity of about 10 Q m- .
/
* Figure a4 shows current vs. [ T C N E m r e m e n t s using a different
, - -- procedure. A square wave potential ( f = 0 . 0 9 5 Hz., T = 33 minutes) was
\ #
applied to T C N E / D C E ~ ~ ~ Q \ ~ ~ - ~ & the period bf many hours. A typical . /-'
FIGURE 4.3 - STEADY STATE !JM?REHT-+S. (TCNE] - (SINGLE STEP APPLIED WLTAGE) i
V = 10 Volts
The approximate time required for the cumnt to stabilize to within 215% is indicated with each data point.
t
25 minutes
350 minutes -
TCNE concentration (M)
FIGURE 4.4 - PEAK AND STEADY STATE CURREHT VS. DCNEJ (SQUARE WAVE VOLTAGE, f =O.O~OSHZ.)
V = + - 15.2Volts
4 'Steady State' Current after 15 cycles Peak Current after 1 5 cycles
I at 10 cycles rather than 1 5 cycles
TCNE Concentration (M) -
FIGURE 4.5 - CURRENT VS. HESITYLENE CONTENT
V = 10 Volts.
Sarnpl e: [TCNE] = 0.00 1 H. in DCE /mesi t yl ene mixtures
m 'Steady State' Current after 6 min. Peak Current
1 0.0008 M TCNE/DCE 2 DCE
-
3 4:1 Mesitylene/DCE
0.4-
L
/-\ \ \ \ \ \ \ \ \ * \ \
0.1
2 I I
- 0 0.3 ?., 0.2 0.3 0.4 0.5 0.6 0.7 0.8 0.9 1.0
Mesitylene Fraction 5
- -
current response i s shown i n Figure 4.7. The peak and 'steady state* 5
currents ( steady state = a f ter 16 minutes ) af ter each voltage reversal are
plotted w i t h respect to the number of cycles in Figure 4.8. Over
consecutive cycles, the peak and 'steady state* currents decrease and level
o f f af ter about 5 hours. Some other features of the s h r e wave response
over long periods of t ime wi11 be discussed in Section 4:2. Values of i,,
and i,,, i n the level region are'plotted-against TCNE concentration in
Figure 4.4. An approximately linear r+nship i s observgd between i,, ,'---'\
end ITCNE I up to 0.0 1 N. The 1-, vs. ~TCNE] curve levels o f f d n n d /' !
concentrations of 0.005 M. The peak andsteady state conductivities fora, ' '
0.0 1 N solution of TCNE are respectively ( 1 -6 + 0.2) x 10* W1 m-l and (7 i 2) //- 1
-7 -1 -1 'x 10. O m i n this measurement. The'steady statem conductivity /'
dasu red using a one-step voltage application ( Figure 4.3) l ies between
these values.
When these measurements were made, the major charge carriers 'in
< ' TCNEIDCE solutions had not yet been identified. A l l that could be cdncluded
at the t ime was that TCNE related ions were in the solution. ~he'dominant
anion i n solution was la ter identif ied as pentacyarmpropenide which i s a
derivative of TCNE. (See Chapter 6). Cations in solution were thought t o be
solvent related. This was consistent w i t h the ides th;t the weak charge
transfer interaction between DCE and T'CNE contributed t o the presence of
charge carriers in solution '3 ( a different mechanism was la ter proposed . , .
for the generation of charge carriers in solution - Chapter 6)
9
i
FIGURE 4.6 - CURRENT REPONSE T O A STEP VOLTAGE
Sample: [TCNE] = 0.0 1 H. in DCE
, Time (min)
, . v 10 Volts
*
*
t
FIGURE 4.7 - SCJ_UARE WAVE CURReW3 RESPONSE
f = 0.0005 HZ. V = - +15 Volts
Sample: [TCNE] 7 0.0 1 M. in DCE /
The current response was measured dfter about 17 hours of Voltage application.
FIGURE 4.8 - PEAK AND STEADY STATE CURRENTS . VS. NUVBER OF SQUAR~! WAVE CYCLES .
Sample: [TCNE] = 0.005 M. in DCE
The addition of mesi tylene to DCE does not result i n a significant increase
i n the DC current over the DCE level. A sample w i t h a 1.4 M concentration of ,
mesitylene in DCE ( 0.2 = fraction of mesitylene in DCE ) fe l ls wi th in the
range of DCE peak conductivities measured a t (3-6) x 1 0 ~ n-lrn-' during a
1 set of concurrent runs. By i tself , mesi tylene has a conductivity
signifiCantly less than 1 0%-' m-'. Mesi tylene, a non-polar liquid, does not
stabilize f iee i o s to the same extent as DCE. 4 Figure 4.5 shows how the DC current behaviour of a 0.00 1 fl TCNE solution i s
influenced by the addi t ion of mesi tylene. The peak and 'steady state'
currents (after about 6 minutes) are plottea as a function of the fraction of Y
mesitylene i n solution. For mesitylene/DCE fractions f rom 0 - 0.2 the
current increases w i t h the amount of mesitylene added. Beyond mesitylene .A
fractions of 0.3 the current decreases w i th the fraction of mesi tylene. The
observed decrease in current at higher donor concentrations can be
accounted fo r i n terms of lowering the effective dielectric constant of the
solution. The lower the dielectric constant, the less stable free ions are in
solution 6. In the lower mesi tylene concentration range, the increase i n L
solution conductivity w i t h added mesi tylene i s probably the result of chargem
transfer interactions between TCNE and the donor molecules.
complexes are known to dissociate spontaneously i n liquids
high dielectric constant7.
The nature of charge kaniers in rnesityl&T~~~/dichloroethane samples j
n
was not investigated in dil. The dominance of the TCNE related charge
carriers for charge transfer solutions used in the earlier photosignal
6, , 6, = thickness of electrical boundary layers C
@ = positive* space c h a r d
@ negative space charge -. - ~ .
(V,* and V,*) i s sketched. The l imi t ing value of the boundary potentials (as
t ime -> inf ini ty) depends on the applied voltage. The current through a weak
electrolyte depends on the* ef f ective voltage (VH) across the bulk of the
sample end the resistance of the sample. Since the sum of V,, V, *, and
V,* must give the applied voltage V (Figure 4-10). the measured current can
be wr i t ten as shown below:
The variation of current w i th t ime af ter an in i t ia l voltage application i s
accounted for qualitatively i n terms of the growth of electrical boundary
layers. As the charged layer at each elect-rode grows to some
vol tage-dependent l imi t ing value, the effective voltage across the bulk of
the solution decreases and so does the current.
t
Any t ime dependence of the resistance of the bulk of the solution can be
incorporated into the equation.
\
R(t), the effective resistance of the solution, depends on the ionic
concentration between the electrodes.
d = distance across solution (m) \
K = conductivity ( ~ ' r n - ' ) = t +ci
-1 1) AV equivalent conductance of the ia ion &'m M
'i I concentration of the ia ion i n solution (fl)
Returning to the interpretation of the current response af ter the in i t ia l .'
voltage application, the resistance of the bulk of the sample can be expected
to decrease as ions are dragged toward respective electrodes. This was
verified w i t h spectroscopic studies of the ion con ntration in solution 7 (Chapter 5 1. The decrease i n conductivity, and accompanying increase of
resistivity, would work together w i th boundary layer effects to decrease
T
the current w i t h time.
At long enough times af ter voltage application, and fo r suff ic ient ly large
space charge densities a t the electrodes, convection establishes i t se l f and
red(lces the magnitude of the electrical boundary layers. Whenever a net
space charge i s present i n solutions, an unbalanced f w c e (F) exists per unit
volume of l iquid and can generate suff icient pressure gradients fo r f lu id
f low to occur 12.
F = pE where p = space charge density
E = electric f ie ld
- /- - + = \ P = ,f( pEMx where P = pressure generated f i om 0 t o d P
. /
-,
In Gibbings work on kerosene lo, the onset of convection i s marked by the I
current response levelling out. In the following discussion, i t w i l l be
assumed that during the in i t ia l current vs. t ime response, convection has
not yet had t ime to establish i tsel f . However, i f convection i s established
at steady state conditions, the current response immediately following
vol tage reversal w i l l be affected by f lu id f low because of i t s f in i te decay
time. These assumptions were confirmed through spectroscopic work (Ch.5). 5
Convective effects w i l l be discussed in more detail i n Section 4.4 and
Chapter 5. T
L. After voltage reversal, the temporal behaviour of the current response i s
d i f f icu l t toaccount f o r i n termsof speceshsrgeeffects. The t ime
displacement of the current peak appears to bd related t o ion transit times.
The transit t ime fo r iops moving from one electrode t o another i n solution
decreases as a function of the applied voltage. Experiment shows a definite
correlation between the peak t ime displacement and voltage: the peak t ime
i s inversely proportional t o the applied voltage i n the range up t o 15 volts
(Table 4.2, Figure 4.9).
sinbe the current peak can bep la ted to the d r i f t velocity of ions moving
through e constant distance, i t i s reasonable topropose that the t ime
required fo r current camers to travel from the electrodes to a point
TABLE 4.2
VOLTIhGEDEPENDENCE OFCURRENTPEAKTIHE
SAMPLE:O.OlM TCX in=
VOLTAGE PEAK TIME (tp)
hall-way across the cell corpsponds to the current peek time. Under these
conditions the number of charge carriers in the bulk of the l iquid would be a /
msximum. According to th is model the expected travel t ime and cument
pesly lme (1,) i s given by
where d = distance between electrodes 'w v = ME = effective* d r i f t velocity of charge carriers .r
= effective* mobil i ty of charge carriers
E = electric f ie ld i n solution z V/d ** V = applied volt age
* Both anions and cations would contribute t o the effective d r i f t I
velocity and mobil i ty given i n this expression. This mobi l i ty could'
include the effects of convection.
**the electric f ie ld i n solutibn could not be assumed constant when
there were ion concentration gradients present (Chapter 5).
Note: One coi;ld equally wel l propose that the charge carriers have to travel
the fu l l distance d t o give a current pulse. This would only change the 1- calculation by a factor of two.
If the relationshy between the current peak t ime and voltage i s correct as /
shown above. then the product of the two (Vt,,) should be a constant. The
datainTable4.2show that t h i s i s i n d d thecaseand theproduct,Vt,.isa 4 constant wi th in the experimental unc&ainty U h i s does not hold fo r square
wave frequencies greater than 1/2t,,. The peak displacement t ime decreases +
w i t h increasing freque'ncy. Figure 4.13 shows the current response to a D
square wave w i th f> 1/25 for a th in lndium (In) electrode cel l described i n . .
Section 4.4). From the measured value of 450 V s. f o r - V$, and the known r
electrode separation of 2 mm., an effective mobi l i ty of 0.4 x lo9 m? v ls - l
i s estimated.. This mobil i ty i s i n a range typical f-or charge caniers i n polar
organi c 1 i quids. The positive charge carriers i n ni trohnzene have a
mobi l i ty130f (1.6- 2.31% 1 0 ' 8 d ~ 1 s - 1 .
The amount of charge associated w i t h the current peak af ter voltage
reversal i s about 6 x 1 0 ~ C. (Figure 4.9, V = 10 Volts). The existence of a
current pulse can be accounted for qualitatively in terms of electrical
bounday layer charge migrating across the samplb. However, an estimate
of the amount of space charge associated w i th boundary layers shows that.
th is interpretation i s not reasonable. The amount of space charge
associated w i t h the boundary layers in solution could have been no larger kl
than the metal electrode surf ace charge neccesary t o produce the applied
11 voltage. For 1 0 volts sppl ied across parallel metal plates and a dielect c
l iquid
FIGURE 4.13 - CURRENT VS. TIME (SqUME WAVE VOLTAGE, f = 0.005 HZ.) --
' V = 0.9 Volts \
1 /2f < transit time
Sample: [TCNE] = 0.0 1 M. in DCE
= 4.4 x 1 C where A = electrode area 2
d = electrode separation
e . = 10 = dielectric constant fo r DCE . I
e = permit t iv i ty of a vacuum
The. charge associated w i th the current peak (6 x 10-- C) i s much too lprge
to be accounted fo r only on the basis of a space charge originating i n the
boundary layers.
~ h d dispdllaced current peak i n t ime also cannot be accounted for b
considering the variation of V, i n time. Immediate1 y after vol
V i s a maximum given by e f f
where (V1* + V,*) i s the voltage develbped across the b oundary layers prior .
t o the vol tsge reversal. The effective vol tage decreases in Mme following J
v6? t a p reversal. b
r
The reversal of voltage may increase the conductivity of- the solution by.
releasing ions into the solution (and th is was la te r venffied). The
concentration of ions associated with the current f lux q n be estimated
given the speed of charge transport ( v = d/2tp = 1 x 1 o - ~ m i 4 5 s = 2.2 x' 1 O*
m/s) and the current density (j) of about 2p~/crr? .
I
a * - Thls can be converted to a concentration of 4.7 x 1 @ N. which i s consistent !
+;
the concentration range later verified f o r anions i n t h e system by
spectroscopic studies (Chapter 5).
- The width of current peaks af ter voltage reversal seems to indicate that
\ diffusion processes contribute to charge transport. The width of the peak
increases as a function i f the travel t ime (Flgure 4.9). Diffusion effects
would not have been expected to be very s i g n F n t in a system with
coivection as a contributing charge transport process. The Nernst-Planck r
equations descr-i be mass tranfer in solutions and include dri f t , diffusion.
and convection terms. In one dimensional form:
j, = hE(x)ci(x)- Di dci(x)/ax + ci(x)v(x)
where j, = current f lux from the 1" ion ( */(m2s))
1 1 pi = mobili tfty of ilh ion (m2v s- ) = (5F/RT)Di
Di = diffusioncoefficient of i'hion(rn2s-1) 1
'i = concentration of im ion (*/m3).
E = electric field (~m- '? = d V l d x
v = Iiquid velocity (ms-'1
x = position relative to anode (m)
J The width of a current peak was about equal t o th6 transit time (2s = 90
seconds at V=lO Volts, Figure 4.9). A rough es imate of the time required J f o r particles t o diffuse through a mean distance of tyg,milllrneters
(distance between electrodes) i s given by the following equation: l4
J ' Calculating a value for the diffusion constant from the effective mobility of
0.4 x 10% m2 V' s-I gives D = 1 x 1 O-lo m2 s-I. Using this i n the preceding
equation results i n an - . average time of 330 minutes (5.5 hours) for ions40 / '
diffuse - across. 2 mm. Even for an order of magnitude calculation. this - - - - r -- - 3
doesn't compare well with peak width times. Obvious% the contribution of \ % /
i
diffusion to he shape of the current'peak had to be reconsidered. .!I I
<-. - Theimportanceofionconcentrationgradientsinthebulkcfthesolution i s
evidenced by the effect of mixing 00 sample current characteristics.
However, no quant i tat i ve estimates of &/ax could be obtained from these
measurements. Af ter a sample had been previously exposed to voltage the '1
current peak was displaced i n t ime w i th voltage reversal. If, a f ter voltage ..- i
exposuni, +, the sample was physical1 y mixed (using a pipette) before flipping
the voltage again, W n the current peak was no. longer o
displaced in time (Figure 4-19. The immediate peaking
a s tep in voltage i s s imi l iar t o that observed fo r samples without previ
voltage exposure (Figure 3.9). a
I
Nixing destroys any ion concentration gradients in the bulk o f the solution
as wel l as reduces the electrical bounday layer charge. The effect of
mixing the sample af ter voltage application essentially restores the cell t o
conditions l ike those before vol tage was ever applied. This accounts fo r the
immediate peaking of the c u m n t fo r the sample mixed af ter voltage 1
appl icat i on.
+ As a result of these in i ti81 studies on the current-time response of L
b
TCNEIDCE solutions i t $as clear that bulk ion concentrations and space
charge significantly affected the ci4"~e"M~chbracteristics and would have to 4-
be incorporated into a model fo r conduction in the syst-em. However, the
behaviour of ion concentrations in space and time, and the relationship of
th is w i t h the change i n current w i t h time, could not be unravelled w i t h the
experimental techniques e&loyed. Further information on the behaviour of
ion concentrations in solution as a function of position and t ime had to be
obtained. A spectroscopic study of ion concentration beheviour i s presented w
d .
FIGURE 4.14 - CURRENT RESPONSE TO VOLTAGE REVERSAL AFTER MIXING
*
r I
Sample: VCNE] =-0.002 M. in DCE
v SAMPLE
MIXED 10 VoJ$s (reverse polarity)
time (min.)
in Chapter 5 and provides the basis of the interpretation of conduction of
TCNE/DCE solutions.
4.2.1 -CURRENT RESPONSE TO SQUARE WAVE VOLTAGE OVER MANY C Y C ~ E S
Application of a square wave vol t a p (f = 0.0005 Hz.) t o the TCNEIDCE
- samples results in a decrease i n the peak and steady state currents over
many cycles (Figure 4.8). Af ter about 8 hours the peak and steady state .
currents approach a l imi t ing value. This behaviour was already referred to
i n Section 4.8. One explanation fo r the overall decrease i n conductivity i s
that some ions, or other charge c a g i n g particles, are irreversibly dragged
out of the dblution during voltage exposure over long periods of time. This L
effect i s sometimes referred to as electrical pur i f icat iod5 or .. electrostatic
cleaning. Another possibility fo r the overa:l current decrease i s the
continual growth of electrical boundary layers. This i s not unreasonable
because of a small asymmetry i n the positive and negative cycle times of - the square wave ( a 4% difference i n positive and negative cycle times for f
4.3 -TEMPERATURE and MECHANICAL VIBRATION
The effects of temperature and mechanical vibration on conduction in
TCNE/DCE samples are considered in this section. The temperature - -
dependence was studied by placing a carefully sealed sample i n a circulating
water bath. In thermal equilibrium the solution i s homogeneous throughout
the cell, i n contrast t o local heating by a focussed laser beam. Table 4.3
shows that the steady state current increases w i t h increasing temperature.
As temperature increases, the viscosity of a fluid, and also the resistance
to charge motion, usually decreases. A corresponding increase i n the
'current i s expected. Isotropic heating of a sample does not interfere w i t h
convection patterns (unless a change i n l iquid viscosity brings about a
cihvec t i ve transition).
The effect of ccntinuous mechanical vibration was observed by measuring
the sample current w i t h end without water circulation around the cel l
(without temperature change, of course). Water circulation i s a simple way L
of providing fa i r ly uniform vibration. The presence of external mechanical
v i brstion decreases the current magnitude (Cumnt without vibration =
0.36-0.49 PA.; Current w i th vibration = 0.28-0.39 PA ; [TCNE] = 0.004 M., V
= 10 Volts, R, = 1 OkO) . This behaviour i s consistent with the previously
observed decrease i n current as a result of acoustic noise and localized
illumination.
\
The change i n conductivity w i t h mechanical vibration can be quali tat ivel y
interpreted i n two wqys: I1 1 vibration i n t e m p t s convection patterns
important to mass and charge transport by introducing cross-f ie ld l iquid
motion; I21 vibration disturbs electrical boundary layers and ion
concentration gradients i n the solution. The second option seems less l ikely
since the disturbance of charged layers would decrease V, * and V,* and
TABLE 4.3
TEMPERATURE DEPENDENCE OF CONDUCTlVlTr
TEMPERATURE (T 2 0.2s0~)Y CURRENT (MA)
result in an increase in the current. Any distuhance of ion concentration
gradients would also not be expected to decrease the sample current.
Convective effects on sample current response wil l be discussed further in
Section 4.4.
4.4 - CURRENT VOLTAGE CHARACTERISTICS t
- 4
- . Several experimental approaches were used to characterize the
current-voltage response of TCNE/DCE and TCNE/mesitylene/DCE samples.
The various approaches and sample responses w i l l be discussed i n this
section. As i n Section 4.2 some aspects of the i-V response can-be
b interpreted i n terms of changes i n electrical boundary layers and bulk
sample resistivity. The most interesting conclusions arrived at in these I
studies are related to electrohydrodynamic effects. Certain types of
c x ren t behaviwr are indicative of transitions i n l iquid f low such as those
that had been previously observed in the Indigo Blue/DCE system (Chapter 3).
'Critical' voltage conditions for transitions i n the convecti ye behaviour of
dielectric liquids have been reported i n the l i terature 16,17,18
t
Electrohydrodynamic and conduction studies have already been camed out
on systems w i t h a variety of charge generation mechanisms. Unipolar and
bipolar injection of charge have been extensively considered i n the
l i terature 1 9 3 ) 0 21. Electrohydrodynamic studies on weak electrolyte
solutions are rare and apparently the instabi l i t ies i n such systems are not .
wel l understood at present1*. Since the current response of TCrJE/DCE
solutions resembles that of weak electrolyte solutions, v e y l i t t l e of the
published work on electroconvection ii applicable. Further d i f f icul t ies
regarding electrode injection and discharge processes arise which are
specific t o TCNEIDCE solutions.
The interpretation of cr i t ical voltage behaviour in the TCNEIDCE systems in
this study a fundamental d i f f icu l ty i n the separation of
convective e l f ects and electrode in jectionIdischarge processes
- (electrochemistry). The appearance of f low instabi l i t ies in dielectric
1 i qui ds i s cr i t ical 1 y dependent on the electrode boundary conditions? The
same would be expected to be true of the TCNEIDCE system. The
expeiimental work described concerns different electrode geometries and
materials. Instead o f leading t o a single interpretation of the current '
characteristics, the discussion presents several different interpretations
that are a l l qualitatively consistent w i t h the observations.
4.4.0 - EXPERIMENTAL 9
The types of measurements discussed i n t m e e c t i o n a l l involve the
variation of current response w i t h voltage. Current measurements were
carried out using the method described at the beginning of th is chapter. A
~ o u h Omnigraphic 2000 X-Y recorder was used to record continuous i -V
scans. Cell di scharge currents af ter vol tagmppl i ca t ion were monitored
using the lower circuit i n Figure 4.2.
Two types of electrode materials were used i n the measurements: indium
(In) and platinum (P t ). The Pt cel l has already been described in Section 4.1.
A thin cel l construction was developed using In metal and i s shown i n Figure
4.15. --
FIGURE 4.15 - THIN INDIUM CELLS
3
Top View --
microscope slide cover slips
Side View
Indium metal str ips
2dges dipped in
hot paraffin wax
for skal ing
Glass s l i e \
Typical cel l dimensions :
w = 1-2 mm.
Sample cav i t y
Typically, the electrode spacing i n the th in In cel l construction was lmm.
and the electrode areas were 30mm. x 0-lmm (Figure 4.15 ). Two In str ips "
were sandwiched side by side between microscope siide cover slips. This \
~n/~ldsc&n~ernent was carefully heated on a hot plate to wet both glass
surfaces-with In metal. Once the cell was allowed to cool, the ln/glass -
interfaces formed a good seal. The hollow between the electrodes could be .
f i l l ed with l iquid samples by capillary action. A quick dip i n hot paraff in
way was used t o seal the cel l at each end. The l i fe t ime of {!he cells was
from one t o two days depending on the seal preparation and handling
procedure. other thin cel l designs were tested and found to be inferior. -The
advditages of the thin In cel l system include the simple, variable closed i
'l j geometqand the disposabili t y of the cells. .*'
This thin, closed cel l construction was chosen because the closed cell
design eliminated any free l iquid/air interfaces which could affect
convection via surface instabi l i t ies =, and the convective f low was I
t o one degree of freedom. Also, particle f low i n the
system could be clearly observed w i t h the use of a L
microscope but ~t was dif.ficu1t to corre!ate the current and particle
behaviour i n detail. Current peaks were qualitatively associated w i th
particle transit times, and above about 5 volts convective patterns were
observed. Generally, the stabi l i ty of the i-V and i-t curves was improved
over the Pt cells w i t h their larger geometry. Init ial ly, the stabi l i ty
vement was associated w i th fewer available degrees of freedom fo r
f low. Later results indicated that the improved stabi l i ty could
also have been related to
RESULTS AND Dl SCUSSi ON
he electrode material being used.
The current responses w i th stepwise and continuous changes i n vol-will
be discussed i n terms of electrical boundary layer and ion concentration
eyfects. Certain current voltage behaviour can also be interpreted i n terms 1
of convective transi'tions.
4.4.1 - IV RESPONSE (VOLTAGE STEPS) I
<
In ~ i g u f e 4.16, the variation of current w i t h voltage steps i s shown. A th in I
In cel l was used i n this measurernetft. ~f t e r each voltage s t e ~ e a s e , the
current slowly decreases in t ime to approach a 'steady state' value.
Following each 10 volt decrease i n voltage, the c u m n t approaches a new L
'steady state value' immediately, or a f ter a very sl ight increase in the
current. The new 'steady state' cument a f ter a step-down in voltage i s
lower than that observed at the same voltage i n the preceding voltage.
step-up sequence. As a result, t h plot of I, vs. V shown in the corner of
Figure 4.16 displeys t q s t m i s . A s imi l iar sort of hysteresis (high& -
currents with increasing voltage r a t m r than decreasing voltage) i s observed
for the 1-V plots shown i n Figures 4.20 t o 4.23 f o r the slower voltage scan
rates.
FIGURE 4.16 - CURRENT VS. TIME FOR VOLTAGE STEPS
Sample: [TCNE] = 0.0 1
i ndi urn el ec thdes
w z lmm hxO.1 mm.
Qualitatively, the hysteresis of the current response can be accounted for by cs
discussing electrical boundary layer effects in the system. As i n Section
4.2, the sample current can be expressed in terms of the applied voltage (V),
the electrical boundary layer potentlals(V, * and v,*i, and the sample ,
resistance (R).
The potentials, V, *, V2* , and the associated charge layers at each electrode
are an increasing function of the applied voltage. With each step-up i n
vol t q e , the electrical boundary layers grow i n t ime ,and result i n a current
decrease. With each step-down i n voltage, less space charge i s supported at
the electrodes and so a c u m n t increase results in t ime as the space c h a r g d h
d ~ m s h e s . - i -*+
& 1
As in Section 4.2, the change in bulk solution res is t iv i ty w i t h t lme must 1 \i
a1 so be cbnsi dered (i =Vm(t)/R(t)). Each voltage increase pulls more ions out
.of the bulk of solution, thereby increasing the resist iv i ty. A voltage
decrease releases the ions back into the solution. This sort of ion
concentration effect'was later observed, and the rate of ion release from
the electrodes was much-slower than the rate of ion depletion i n the bulk of
the 1 iquid (Section 5.1.5). A combination of space charge of fects and
resist iv i ty changes account quail tat ively fo r the observed current behaviour
w i th voltage steps.
The importance of space charge effects i s demonstrated equally wel l by
their apparent absence in the linear plot of current vs. voltage in Figure
4.1 7. In this example a Pt electrode cel l i s discharged between current
measurements at different voltages. The peak currents '(immediately
following voltage application) are plotted vs. voltage. Af ter approaching a
steady state current, the cell. i s discharged by shorting out the two
electrodes fo r about 4 minutes. Samples of the discharge current response /L
are shown i n Figure 4.18. Based on the l inearity of the resulting ipdvs.V
plot, shorting out the cell was thought to have the effect of eliminating t most of the space cha$e associated w i t h the electrodes.
e hoped to gain information on the magnitude of the space charge -
by measuring the di c arge current as a function of time. 4 1 In Figure 4.19, the number of coulombs discharged through a P t cell i s
plotted as s function bf the previously applied voltage (electrode area =
1 c d ) . The 150 second discharge appears t o level out around50 to 60 \
microcoulombs at V 2 4.0 volts, even though the peak current w i t h applied
voltage increases linearly w i th V (Figure 4 17). A charge of only 1.8 x 1 0-' ' ~ / c d would be required to generate 4 volts across 2mm of l iquid with a
dielectric constantpf '10 (based on Q = fe.AV/d I l T h i s sets a l imi t fo r the I
smount of space c h s ~ e stored in the electricel boundary layer, since eny
greater charge density associated w i th the solution interface would cancel
the applied field. Since the number of coulombs discharged through the cel l
7
FIGURE 4.1 7 - PEAK CURRENT (after dischame) VS. VOLTAGE *
Sample: DCNE] = 0.0 1 M. in DCE
platinum electrodes $
FIGURE 4.18 - DISCHARGE CURREW VS. TIME * Sample: [TCNE] = 0.0 1 M. in DCE
1
platinum electrodes
1 1 1 1 1 1 1 1 1 1 1 l 1 1 1
0 50 100 150
Time (sec)
1 1 1 1 ~ 1 1 1 1 ~ 1 1 1 1 ) /
0 50 i 00 150
Time (sec) 4 \
/
FIGURE 4.19 - Q DISCHARGED IN 150 SECONDS VS. VOLTAGE *
Sample: " [TCNE] = 0.01 M. in DCE
pi at i num electrodes
Steady state conditions were approached prior to cell discharge
F r . -9 - -+
i s six orders of magnitude larg an the maximum for electrical boundey * - layer charge, the discharge of cal bound85 layers obviously ddes not
account fo r the current observed when the Pt cel l i s shorted. Electmactive
species generated w i t h voltage treatment probably revert back to their
original oxidation state w i th voltage removal and thereby produce the 0
discharge current. Even though the discharge current measurements don't
give a handle on the magnitude of the space charge, or the electrical
boundary layer potentials, presumably space charge effects are s t i l l an
important consideration in modelling the cbnduction properties and related
electrohydrodynami c behaviour of TCNEIDCE solut@hs. 4
interestingly, there i s a correlation between the discharge and current
instabi l i t ies in TCNEIDCE solutions under the conditions discussed i n the
previous paragraph. The number of coulombs discharged through the Pt cell
levels out around 4.0 volts. Current instabi l i t ies grow as d function of
voltage beyond 4.0 volts and th is type of behaviour can be associated w i th
electrohydrodynamic instabilit ies. The current response b ow this cr i t ical
voltage i s smooth and decreases monotonically w i t h time. 3 A ove the
cr i t ical voltage, the 'steady states current levels out or increases slightly
w i t h time. Growth i n the concentration of any electroactive species near
. the electrodes i s restricted by turbulent convection. This accounts
qusli tat ively fo r the cel l discharge levelling o f f beyond a cr i t ica l voltage. \
*
The preceding behaviour i s consistent w i t h a transit ion from laminar to i*
turbulent f lo& -- - tb cri t ical vdtage. The observations also demonstrate i
the close relationship between electrohydpdynamic effects and electrode .
D
processes. There are three possible regimes of l iquid flow: [ 1 ] stationary
liquid (ions f low through without significant drag on the liquid) 121 laminar
f low (smooth, non-turbulent f low) [3] turbulent f low %. As space charge
induced pressure gradients grow w i t h increased applied voltage, the f low . response of the l iquid i s expected t o pass from stationary to laminar to
turbulent behaviour. Further evidence fo r convective transitions w i l l be
discussed i n the next section.
a
4.4.2 - I V RESPONSE (CONTINUOUS VOLTAGE SCANNING) \ -
In this section, i-V characteristics w i t h conJinuous voltage variation w i l l
be discussed i n terms of space charge effects and convective transitions.
P3 A ,
Figures 4.20 and 4.2 1 show sample i -V curves fo r scans with V-> V > 0 .
(Fi gure 4.20-triangul ar wave, Figure 4.2 1 - sinusoi dal wave). Figure 4.22
shows i-V responses for voltages rangiing between a positive and negative 1
maximum value -V,, > V > V,, . The i-V responses w i t h positive and
negative voltages show reasonable symmetry about the origin over one
cycle.
Decreasing the scan rate has the effect of decreasing the current magnitude
at a given voltage. The slower the scan rate, the more t ime i s available fo r
space charge to collect at the electrodes and/or ion concentration to
# - - FIGURE 4.20 - CURRENT VS. VOLTAGE. ABOVE AND BELOW THE CRlT ICAL FREQUENCY (TRIANGULAR WAVE VOLTAGE1 ,
[TCNE] = 0.01 H. in DCE Sample:
indium electrodes
: b FIGURE 4.21 - c
Sample: .
:URREM VS. VOLTAGE. ABOVE AND BELOW THE CRITICAL FREQUENCY - (SINE WAVE VOLTAGE^
[TCNE] = 0.0 1 H. in DCE
indium electrodes
FIGURE 4.22 - CURRENT VS. VOLTAGE RESPONSE B AT DIFFERENT FREQUENCIES (TRIANGULAR WAVE VOLTAGE)
/- L. Sample: RCNE] = 0.01 M. in DCE
indium electmdes
deplete i n the bulk of the solution. The locat ion o f current plateaus i s also -
l
a funct ion o f the scan rate. The s lower the scan rate, the l ower the
voltages at which plateaus occur. The current decreases as a funct ion of
voltage a f t e r the second current plateau f o r the s lowest scan ra te i n Figure
4.22. The preceding i -V curves were a l l measured using th in In ce l l s and
0.0 1 M TCNEIDCE solutions. Note the qual i ta t ive s i m i l a r i t i e s between these
data and the i -V curves f o r TCNE/Mesi tyleneIDCE *solutions i n a P t ce l l
(Figures 4.23.1 and 4.23.2). Again, the s lower the scan ra te the lower the
vol tag? a t which current plateaus appear.
here are t w o possible explanations f o r the plateaus i n the current f o r
unmxed samples: [ 1 ] the concentration of e lectroact ive species diminishes
near the electrpdes via ce l l redox reactions; 121 electrohydrodynamic
t rans i t ions e t c r i t i c a l space charge densit ies a l t e r the &rent
character ist ics. The evolut ion of concentration gradients or electrical 4
boundary layers i s expected t o depend on both voltage and time, consistent &
w i t h the observed behaviour-of current plateaus. It i s also possible that the
combined e f fec ts of electroconvection and c o n c e n t r a t i q depletion rl
contribute t o the locat ion of cudent plafeaus. t l ixing, v ia theanset of
turbulent canvection, narrows concentration deplet ion layers and thus
The decrease i n current with voltage increase a f t e r the smmd f+tatew
(Figures 4.22) i s d i f f i c u l t to account f o r i n terms of electrohydrcldynamic @
t ransi t ions. The mor&easonable explanation f o r t h i s behaviour i s that the 1
FIGURE 4.23.1 - CURREm VS. VOLTAGE ( f= 0.002 HZ. < f TRIANGULAR WAVE VOLTAGE) -C,
Sample: 3 rnl- of 0-00 1 Pt TCNEIDCE
2 ml. of mesi tylene
platinum electrodes
d = 2 m m
Current
Voltage (V)
FJGURE 4.23.2 - CURRENT VS. VMTAGE ( f= 0.007 HZ. < f TRIANGULAR WAVE VOLTAGE1 -C ,
Sample: 3 ml. of 0.00 1 M. TCNE/DCE
2 ml. of mesitylene
platinum electrodes . -
Current (PA)
I
-- - - Voltage +15 V - P
-0.2 '
w
total concentration of electroactive species depletes not only near the
electrode but also i n the bulk of the sample.
Current plateaus disappear w i th external mixing. For a *
TCNE/Hesi tylene/DCE sample (Pt electrodes, d = 2 mm), i 9 e s w i th and
without external mixing are shown in Figures 4.24 and 4.23.2, respectively,.
A linear dependence of the current on v o l w e i s observed when the sample
i s continuously mixed using a maghetic st irrer. Mixing destroys any ion
concentration gradients i n the bulk of the solution 8nd also decreases the . P
electi-ical+oundary layers. As has been discussed repeatedly, changes in A-
space charge and bulk ion concentrations have an ,important influence sn the
current c h a m ter i s ti cs i n an uns ti rred solution.
The i-V plot of \3p mixed CT sample i s l ike that of a simple resistor. Note
that the effective resistance of the mixed CT sample appears to be higher t
than that fo r the unmixed sample at the same scan rate, resulting i n a lower .
current. This i s consistent w i th observations previously reported i n
Chapter 3 and Section 4.3. When cross-field f low i s introduced vla mixing
P or localized heating, the charge transport efficiency decreases. External
I#
mixing eliminates any transitions i n the f low properties of tke medium and -- -
S maintains a constant concentration distribution in the bulk of the solution.
The hysteresis behaviour of i -V curves can also be associated w i th
tmnsi tions i n convective flow. Triangular or sinusoidal waves w i t h V->O
were used to observe i-V hysteresis i n .the thin ln/TCNE/DCE system. A t
FIGURE 4.24 - CURRENT VS. VOLTAGE ( f= 0.007 HZ. <
Ssmpl e: 3 ml. of 0.00 1 M. TCNEIDCE
t
2 ml. of mesi tylene
WITH MIXING
4- _ platinum electrodes
Current
--S-
L., z ---+,
5"'- > '" ,, /i -.,, ?--- '
3 =c\ %- \
\
'crit ical ' voltage scanning frequencies the hysteresis behaviour changes \i ,
character. Above a certain voltage scanning frequency the current reponse , ' lags behind the voltage, and the i V curve loops counterclockwise (~ igures
:?.:
4.20,%2 1 ). Below a certain frequency t9e current tends to plateau w i th --A
increasing vol ta$, or loop clockwise. Figures 4.25 and 4.26 show the 1
gradual shape variation of i-V curves fo r scanning frequencies above and I '\
> below the cr i t ica l f reqbmy. The frequency at which i-Y hysteresis
changes character i s voltage dependent.
Figures 4.27 ahd 4.29 show the dependence of the cr i t ica l frequency on
voltage amplitude using log-log graphs for two sets of measurements. p lots
of 1 If,, or the cr i t ica l t ime (t,), against b v e are shown in Figures 4.28 T i
and 4.30. The two sets of measurements used different electrode spacings
and cel l thicknesses. The timing between runs was-about 15 dinutes i n
I Figure 4.30 and was 61 LJ about 5 minutes in Figure 4.28. -
The power law relationship between t, and V, ( to = V + a), i s given by the
log-log plots i n Figures 4.26 and 4.27 and 'coincidentally* gives values of n =
0.5, 1,s) and 2.0. At this point i't i s d i f f icu l t t o attach particular J simfic'ance to the values of the exponent 'n', other than that a change i d 'n'
appears at a cr i t ica l voltage. In each graph, the transit ion in the voltage *
dependence of 1, and f, occurs at 4.0 - 4.3 volts. This corresponds to the 6
voltage at which a jump in the discharge current occurs in a thin In cel l
wlth'somewhat different geometry(Figure4.31 Thechangeinthe 5
, . FIGURE 4.25 - I/V R E S P O N ~ WIT'H CHANGING FRE~ENCY LSINE WAVE VOLTAGE)
Sample: RCNE] = 0.01 M. in DCE
indium electrodes - h
FIGURE 4.26 - I/V RESPONSE WITH CHANGING FREQUENCY (TRIANGULAR WAVE VOLTAGE)
, Sample: [TCNE] = 0.0 1 N. in DCE
i n d w electrodes L
V = +1.0 Volt mw
f - -0.45 Hz. C
frequency ( H t . )
FIGURE 4.27 - CRITICAL FREQUENCY VS. VOLTAGE AMPLITUDE (TRIANGULAR WAVE VOLTAGE1
Sample: [TCNE) = 0.0 1 M. in DCE
indium electrodes
w = 1 mm. h = 0.09 mm
Voltage Amplitude (V) I
FIGURE 4:28 - CRITICAL TIME VS. VOLTAGE AMPLITUDE (TRIANGULAR WAVE VOLTAGE)
Sample: (TCNE] = 0.0 1 M. in DCE
i ndi um el ec tmdes
2 4 6 8 10
Voltage Amplitude (V)
FIGURE 4.29 - CRITICAL FREQUENCY VS. VOLTAGE AMPLITUDE flRI ANGULAR WAVE VOLTAGQ 3
!
Sample: (TCNE] = 0.0 1 M. in DCE
i ndi um el & trodes
measurements taken from
low to high voltage - 3
c
last measurement
1 2 . 3 4 5 10 &k) -,"
. Voltage Amplitude (volts)
$'•̃ VOLTAGE AMPLlTgDE FlGURE4.30-CRITICALTIHE {TRIANGULAR WAVE VOL~B~IE)
a \
Sompl e: (TCNE] = 0.0 1 M. in DCE
i ndi urn el ec tmdes
w = 1.5mm. h=0.11 mm. A.
measurements taken- from
low to high voltage d
last measurement
- e--
Voltage Amplitude (Volts)
8
FIGURE 4.3 1 - DISCHARGE CURRENT VS. VOLTAGE
Sample: [TCNE] = 0.01 H. in DCE
indium elec tmdes
w = 2 m m h=0.2mm
Voltage (V)
-- ,
discharge current may reflectla change i n electrode processes at 4 Volts, J
%
w h p i h turn relates l o masvflow i n the cell. .,
b -
8elow 4 volts i n Figure 4.28, tC=((vP5 +a) and abdve th is voltage t,=((vF+b). 7 . /
In Figure 4.30, t = ((v)'%) and t =((vPsS+d) below and above 4 volts, 2'
respectively. Thin In cells of dif f e p n t geomety were used i n each case so L
h e applied f ie ld was not the same at the cr i t ica l voltage. The difference i n
geometry also affects the nature of f lu id flow, and th is may account for the
difference i n fhe log-log plots of tc vs. V even though the cr i t ica l voltage
remains at about the same value. ' - ,-
t The variation of cr i t ical frequencies i n t ime i s included as an uhcer-kinty i n
the plots of f, versus V. For the 1 -0 and 2.0 Volt measurements i n Figure - -
4.29, f, increases w i th time (i.e. at 1.0 V, f, changes fromabout 0.20 Hz t o "
0.22 Hz. i n 550 seconds). In the measurements taken at higher voltages. fc I
decreases i n t ime (i.e. at 1 0.0 V, fc changes from 0.025 HZ: Zo 0.023 Hz. in . - 146 seconds). A l l but one of the cr i t ical frequencies ke re *zeh~@ed i n ' I
r- /
order from low to high voltage amplitudes. ne measurement of f, at 2.0 . " A
vo l t s (indicated by a c m i g n Figure 4.29) fqllowed 'b mepswement at 10.0 P ,
Vol tg,. The in i t ia l vahebtor f, i's i i iwer the? the previous1 y observed veiue.
As t ime progresses f, increases slowlg t o approach the.value pqebiousl y .
obsefied (in about 40 minutes f, varied from 0.05 Hz to 0.07 Hz). In Figure
4.29, the f, value of 0.05 Hz. a t 2.0 Volts f i t s on the l ine
characteristic of higher voltagei i n the plot. A; the value for forincreases = .
i t approaches the l ine characteristic of lower voltages. Further.comments
w i l l be made about these plots after some possible qualitative models for i*
the cr i t ical time, t havezbeen proposed below.
= -1
he cr i t ical tlmes observed for i-Vhysteresis at a particular voltage could
have been the result of a decay time in convective flow, o r the result of a
characteristic t ime fo r chaiging or discharging electrical ' b o ~ n d a ~ l a y e r s .
A closer look at the data lends some meri t t o both of these proposals. +
Consider the current response for volt age scanning frequencies greater than /
f, (Figures 4.20, 4.2 1 ). The current continues to r ise even af ter the volta e i. B
begins to decrease. There are two feasible explancltiolls for this behaviour i
and both need to be considered i n modelling the cr i t ical time. pne'
explanation i s that thd inertia of l iquid f low i n the system carfies extra r
current w i th i t even a i ter the voltage has decreased. The speed of -
convective f low i s an increasing function of the voltage (v=~,' or ~ F V * ) 20,
? f h e hlaxat ion t ime for convective f low depends on the speed, viscosity, ."
ahd density of the liquid. A f the maximum applied voltage increases; the *
9
speed of f low also increases and'henke-the timexonstant associated w i th t &
- \ slowing down the f low i s eipectet&&..&rease. This i s cot~sistent w i th 3% '
what IS Observed i n the graph of t, vs. v IR Figures 4.28 and 4.30.
Another explanation for the current lag i s ii terms of eh&ing the . C 6.
electrical boundary layers at each electrode. The t ime constant f o r such a
_ f process i s estimated using a simple RC c i rcui t t o model a space charge 4
layer and the neighbouring solution. The sample resistance i s typically
about 1 0 NO. The, o,bserved t i m d constants are in the iange of 5 - 50 i ,31 .
seconds which indicates boundary lay& capaci tances of the order of 0.2 - 2
flF. According to the Guoy-Chapman theoy ", the di f ferent ial capacitance ;lr
o f a double layer K, = dpJdV, where p=surface charge density, V=effective
potential across the double layer) i s a strong function of the voltage and i&
conceptration. The d h b l e layer capacitance increases w i t h vol tage and
decreases w i t h ion concentration. L For 1:1 electrolytes w i t h concentrations '.-* ,?
of 0.0 1 M. anti V= 1 00mV, the di f ferent ial capaci t m c e i s predicted tb be
f abou 1 0 0 p ~ / c d ~ a b o u t 3 flF fo r the th in electrode geometry z6 . The
comparison c i ted here i s somewhat strained since i n our samples the ion u
concentrations were about 10 *~ , and the boundary layer potentials were
d i f f i cu l t to estimate. The l im i t i ng voltage rmge fo r electrochemical work - on DCE w i t h a supporting electrolyte i s repor te~ l t o be 2.3 2 0.2 Volts [anode)
and 2.2 + 0.1 Volts [cathode] ~ h i ~ T i ' v e s an uc per l i m i t f o r boundary
layer voltages. A t any rate, i t appears reasonable t o suggest effective
e lecthcal bounday layer capacitances of the order of 0.2-2.0 pF i n our
samples. h t
Since the electrical boundary 1 ayer capaci tancl: i's expected t o increase w i t h i. / < * \
voltage, thereby increasing the charscter5stic ch ng time, this m o d e l m
consistent w i t h the observations. Tl ansi tions in the capac&$nce of !he 4'
bounder$ layers as a function of voltage may occur as tM result of changes
. 'k
i n electrochemical kinetics or convective transitions. The mixing as a \
result of convection_ w i l l tend t o narrow the boundary layer 8s wel l as
decrease the amount of surf ace charge. Convective f l ow w i l l also influence
the res is t iv i ty of the solution which i n turn w i l l have an ef fect on the ,
b
cr i t i ca l time. 4
L
Obtaining the explicit power laws (t, = V" + b) i n given voltage regions i s
d i f f i u using either c r i t i ca l -ti me model. A t ten and Malrai son suggest
that sik t e speed of l iquid convection varies as the square of the voltage
(vav2) or directly w i t h the voltage (vzV) m . Using the f i r s t relationship
one can quali tat ivel y ackou~ t f o r the v2 depende.nce of 1, in Figure 4.28 i f t i b
i s proportional to v, and i f the sol A i o n resistance does not vary
signif icantly as a function of the voltage amplitude (the steady state ion
concentration was, however, observec~ i n spectrascopic studies t o be a
function of the voltage ). Derivations of the possible power laws between ,/- .
flu id f l ow relaxation times and the applied voltage f rom f i r s t principles
were considered t o be beyond the scope of th is work. \
ry3
~orrnulat ing a relationship f o r the voltage dependence of t, by modelling the
electrfcal boundary lager capacl tance Is not stralghtf omard, e l ther. Since
recent models fo r double l ayer capaci tance general 1 y require the simplifying
assumptions avail able i n solutions w i t h larger ion concentrations, there i s
no general theoretical description that f i t s the conditions in our samples.
i++
In the discussion of i-V characteristics and critical voltage behaviour i n
TCNEIDCE samples, the difficulty of separating convective and
electrochemical effects becomes apparent. ~ h e k e s u ! l s to be discussed in
Chapter 5 do not resolve this problem, but do give insight into the close
relationship between ion concentration behaviour at the electrode interface
andtheappearanceofflowinstabilities. ,
*
REFERENCES: r-=-r
1. WJ.Hiddleton,E.L.Little,K.K.Coffman,V.A.Engelhardt, 'Cyanocarbon Acids and their Salts', Journal of the Ameri'can Chemical Society l958,W- 2795-2806.
2. I% I toh, 'Dimerimtion and Electionic Absorption Spectra of Tetracyenoethylene Anion i n Solution and in Solid', Bulletin of the Chemical Societu of J a m 1972,s 1947. -
3. A J. Pearmin, B.Makin, A.W.Bright, 'Purification, lmpuri t y Content and Resistivity of Ni trobenzene', 4th In temt iona l Conference on Conduction and Breakdown i n Dielectric ~ iau jds . 1972, T J. Gall agher, Editor; 68. -. + I
4 - - 4. RE. Memf ield, W.D. Phillips, 'Spectroscopic Studies of the
Molecular Complexes of Tetracyanoethylene', Journal of the American Chemical Society 1958, & 2778-82
5. F. Gutmann, J.P. Farges, In 'Modem Aspects of Electrochemistry', , No. 13; J. OaH. Bockris, B.E. Conway, Editors; Plenum Press: New Yo*, 1979, p 36 1.
6. M.V. Ramanhmurti, P.v.s.~ Prabhu, 'Conductometri c Studies of Charge Transfer Complexes i n Solution', Elec trochemica Acta 1 9 6 2 , z 40 1-404.
P
7. F. Gutmann, J.P. Farges, In 'Modern aspects of Electrochemistry', No. 13; J. O'M. Bockris, B.E. Conway, Editors; Plenum Press: New York, 1979, p 362.
8. - V. Novotny, M.A. Hopper, 'Transient Conduction of Weakly Dissociating Species in Dielectric Fluids', Journal of the Electrochemical Society 1 979, 1 2& 925-929.
9. J.C. Gibbings, G.S. S l u j a and A.H. Hackey, 'Current Decay and Fluid Conyection i n a Conductivity Cell', Static ~ l ec i r i f i ca t i on 1975, lnst i tute of Phusics Conference Series No.27; A.R. Bl ythe, Editor; 18.
1 0. A.M. Mackey and J.C. Gibbings, 'Charge Convection in Electrically Stressed, Low-Conductivi t y Liquids', Journal of Electrostatics I 98 1 , s 355-366. -
1 1. A.J. Bard, LJ. Faulkner, 'Electrochemical Hethbw; John Wiley and Sons: New York, 1980, Ch. 12.
13. TJ. Gallagher, 'Simple Dielectric Liquids', Oxford University I
Press: London, 1975, p 17.
1 4. W J . Moore, 'Physical Chemistry', 4th Edition; Prentice-Hall: Englewood Cliffs, New Jersey, 1972, p 163.
,7 (.-
3 15. 1. Adamczewski, 'Ionization, Conductivity and Breakdown i n Dielectric Liquids'; Taylor - and Francis Ltd.: London, 1969, pp 139 - 140.
1 6. J.H. Schneider, P.K. Watson, 'Eledrohydrodynamic Stabil i ty of t Space-Charge-Limi ted Currents in Dielectric Liquids I:
Theoretical Study I I: Experimental Study', The Phusics of Fluids 1970,u 1948-1961.
1 7. T J. Gal lagher, 'Simple Dielectric ~iquids', Oxford University Press: London, 1975, pp 13- 15
18. P. Atten, 0. Halraison , S. A l i Kani, pElectrohydrodynarnic Stabil i ty 1 C
of Dielectric Liquids Subjected to A.C. Fields', Journal of - E l e c t r ~ ~ t a t i c s 1,982,12.477- 488.
1 9. P. Atten, J.C. Lacroix, 'Non-Linear Hydrodynafic Stabil i t y of Liquids Subjected to Uni pdlar Injection', Journal de Meeanique 1979, 468-5 10.
20. 8. Malraison, P. Atten, 'Chaotic Behavior of Instabil i ty Due to Unipolar Ion Injection i n a Dielectric Llqui Phusical Review 6 %
Letters 1982,a 723-726.
21. Y. Aikawa, H. Shimodp, K. Kobayashi, A. Takahashi, S. Takeda, T. Sakata, M. Sukigara, 'Electrohydrodynamic Dissipative Structure i n Unipolar and Bipolar l n j ection Cases', The Bulletin of the Chemical Societu of JI3~8n l 9 8 2 , a 654-659.
22. J.C. Gibbings, 'Interaction of Electrostatics and Fluid Motion',
T Electrostatics 1 979. lnst i tute of Phusics Conference Series No.48; J. Lowell, Editor; 145. .
23. A. Rich, J.L. Sproston, 'Some Observations on Bulk / /-1--
Electroconvection In Electrically Stressed Liquid Dielectrics',,,/ ~ou rna l of Electrostatics 1982,W- 503. /
I
24. T J. Gal lagher, 'Simple Dielectric Ciquids', Oxford Univeni ty press: London, 1975, p 13.
1
i
25. AJ. Bard, L.R. Faulkner, 'Electrochemical Methods'; ~ 6 h n Wile and Sons: New York, 1980; p 507.
,L' Y
1--26. AJ. Bard, L.R. Faulkner, '~lectr&hemical methods'; John W\ey and Sons: New York, 1980; p 508. 'Ld'
27. T. Osa, T Kuwana, Journal of Electroanalutical Chemistry 1 969, a 389-406.
d -
CHAPTER 5 - ION CONCENTRATION BEHAVIOUR WITH APPLIED VOLTAGE . i
I
In this chapter, experiments correlating the current response and sample ion
concentration w i l l be discussed. Each - of the samples, TCNE/DCE and
TEA'PCP%CE, have charge carriers w i th visible absorption peaks (Chapter
6). Concentration changes in the range lo4 - 1 v7 H. are monitored as a
function of t ime and position w i th simultaneous current measurements.
This leads to a discussion of the different contributions to the ion transport
in the system.
Af ter describing the experimental details i n Section 5.0, the temporal
behaviour of the ion concentration w i th voltage treatment i s presented in 4
Section 5.1. This i s followed by a description of the evolution of the
concentration profiles i n space and time i n Section 5.2. Finally, i n Section
5.3, the electrohydrodynamic instabil i t ies in low conductivity liquids are
discussed as the basis of a theoretical model explaining the results.
5.0, - EXPERIMENTAL
The studies of ion concentration behaviour i n TCNE/DCE solutions were
carried out using the sample cells shown i n Figure 5.1. Visible or +
visible/UV Hellma cells w i th a 1.000 cm path length contained the samples.
A1 fqil electrodes were used i n most of the reported measurements. A1 Joi l
was ch*&n as the electrode material in many of these preliminary
experiments since i t was readily available, disposable and cheap. Pt and In
FIGURE 5.1 - SAMPLE CELLS AND ELECTRODES
samp!e .............. level
......
sample .......... lev0 l
\
r i
Beam posltlon ,.' - x = d / 2 '%
- -
a] Aluminum foil e lectrode
Az2.8 cm?
bl Tef Ion spacer '
cl Cuvette 11.000 cm.1
a ] Platinum 'electrode
bITef lon spacers
c l c u v e t t e 11.000 cm.1
, electrodes were also used. In electrodes were prepared from a thin sheet of - 7 ' 1 y the ktel,in' the same way es the A1 electrodes.
. A1 electrodes were prepared by wrapping fo i l around glass rectangles f o ~
support. Teflon spacers were used to position the electrodes in the cell
(Figure 5.1). Note the substantial difference i n electrode geometry
compared w i th that in the Pt and In cells described intChapter 4. The change - d
in geometry was made to accommodati the use of 1 em. spectroscopic cells. , ~r* - -
This change was, of course, expected ta-affect electrohydrodynamic P
behdviour i n the samples.
Each electrode extended outside the cell for electric contacts. Care was ! taken to keel the fo i l away from the glass on the inside o i the cel l above
'
the l iquid t o minimize sample loss via capillary action. Fresh electrodes
were prepared for each experiment. Sample sealing consisted of a tef lon b -%
cap and a small (1 ' x 1') square of plastic fo i l which was secured around the
top of the cell using teflon tape. The plastic (from Baggiese) did not
dissolve in DCE or react w i th TCNE. The same sealing procedure was used
w i th the In electrode cell. Unfortunately, the Pt electrode cel l was more
di f f icul t t o sea7 and used only over shorter mns because of epporation. k, 1
Both electric and optical responses were monitored simultaneously. The
cwrent through the cell was monitored using a Kei thley digital mu1 ti mete^
(model I??) with a chart recorder output. The switching c i rcu i t fo r voltage
reversal and cell shorting (V=O) i s shown in Figure 4.2. Both nd
Cay 2 10 spectrophotometen were used for UV/VIS meesurements of
optical absorbance versus time or wavelength. The CARY 17 allowed coarse
of the beam position between the electrodes. .
i The optical responses shown i n Figure 5-16 were recorded using apparetus4n *< < 6 b
, , whichthebeampositi~nbetweenelectrodescoul be continuously varied 8: .;:
(Figure 5.2) . In this ca* the light source was a Coherent 2000 K Krypton
ion laser ( 41 3.1 nm, beam width z 0.2 mm.), Transmission changes through
the sample were moni t ored by dividing the photomultiplier signals from
sample and reference beams after ampli f &ation. It was necessary to
off set the divider voltage to observe changes i n sample transmission in
time on a chart recorder. Changes in concentration were estimated from
changes i n the digider output using =
where be = change i n doncentratidn (M = mol&li ter) f
B = molar absorption coefficient (K' cm-'
I = transmitted light intensity - -
I = reference light intensity . t 0
V = divider oetput (Volts) :: I --
V, = reference divider output (Volts) a I,
lo and V, were arbitrarily chosen reference values.
- The plots of transmission profiles in space and t ime required some t
dl terations of the experimental se t up just described (Figure 5.3). A high
pressure mercury lamp w i th cg interference f i l t e r (415 nm) was used a d h e
l ight source. The beam was focussed to a width of 0.5 - 1.0 mm. through the
sam~le. A potentiometer readout was arranged to give a measure of the cell
position. Plots of divider output vs. beam position were scanned manually i n t
sequence.
TCNEIDCE sxmple preparation was already discussed i n Chapter 1. For the .. purpose of comparing spectral and electrical properties of an analogue weak
electrolyte solution, samples of a pentacyanopropenide (PCP-) salt i n DCE +%
were prepared. Tetrae thy1 ammoni urn- 1,1,2,3,3 pentacyanopropeni de (TEA'
PCP-) was prepared according to the method o dleton et. 01.' The salt of
PCP- (TEA' PCP-) dissolved easily i n DCE. P t and A1 electrode systems
were used i n the TEA+PCP'/DCE measurements.
The correlation of current reponse and ion concentration changes verified
some of the ideas dikussed i n Chapter 4 about transient behaviour i n the
sample resisklWg. In this section, the temporal behaviour of ion
concentration response at the center of the samples w i l l be discussed. The
PCP- concantra t i on was monitored spectroscopicall y i n the range from 400
t o 420 nm where the molar absorption coefficient i s (2.220.1 ) x 1 0 4 ~ ' c m - '
FIGURE 5.3 - APPARATUS. TRANSMISSION PROFILES
I
I
I Cell Position1
' Readout I
I I
Photomultiplie tubes
Amplifier
Beam width 0.5-1.0 mm
I SAMPLE
I - - - - -
1L
1 t
r Cylindrical Lens
I t - Mirror -. - -
D~aphra
D N sample
XY recorder
L
Divider WD
\ 1 I
-Beam Splitter I
PM N I -
r Filter (415 nm)
+ . . I
u Mercury Arc lamp
lens 2
Pinhole
lens 1
Position
(Chapter 6).
Figures 5.4.5.5 and 5.6 show the response of log l,/l vs t lme (at 415 nm.),
a f te r an i n i t i a l voltage application, a ~ d s f t e r a voltage reversal. The
current response i s also shown. The application of voltage t o a sample
without previous voltage exposure results in an approximately exponential .. decrease of abborbance i n t ime which i s preceded by a short delay time.
Except f o r the delay time, the current and optical absorbance parallel one
another. With voltage reversal the optical response again parallels that of
the current except f o r a t ime lag i n the optical response. Both current and
absorbance increase t o a maximum before decaying t o steady state
conditions. This. type of optical and electr ic response i s characteristic fo r
a1 1 TCNE/DCE samples observed. However, the magnitude of absorbance
changes i s sensitive t o sample and electrode preparation, as we l l as t o \
voltage history. k
Optical absorbance changes are a function of the wavelength. A possi blo
contribution t y electroconvection t o the optical response i s assumed
negligible compared w i t h the ef fect of changes i n PCP- ion concentration. a,
Spectral scans of &NE/DCE solutions a t di f ferent t imes during vol tege
application are shown i n Figure 5.7. The t w o peaks observed a t about. 400
and 420 nm correspond t o peaks i n the PCP- spectnrm. Ion concentrations
are i n the range 1w7- lo6 H. before end during voltage application.
Stable spectra of PCP- could not be monitored during voltage application
agrees with the values obtained from other samples with
FIGURE 5.12 - A(LOG 1J1) VS. TIME
VOLTAGE SET TO ZERO AFTER 20 V TREATMENT
Sample: [TCNE] = 0.02 M. in DCE
aluminum electrodes
d = 7.3 mm.
The absorbance af ter 60 minutes i s comparable .to the sample absorbance pr ior t o voltage appl icat ion.
C
FIGURE 5.13 -[LOG l,/l) VS. TlME ' . .-- T /
en circuit) ---
Sample: ITCNE] = 0.0 1 M in DCE
R
aluminum electrodes
d = 7.3 mrn.
before sett l ing to a value v e y close t o that observed a t the t ime of voltage
removal. The oscil lat ion lasts somewhat longer when the voltdge
. applicationisintemptedatthecumntpeak. Whentheosci l lat ionsdie
down, diffusion processes dominate any further Ehanges in the ion p" concentration. The source of the temporary instabi l i ty in ion comn t ra t i ons
a f ter voltage removal may be related t o the relaxation of e lec ihcal
boundary layers and space charge i n solution, and/or t o the dying dowm of
conve6tion I f l ow patterns. E
5.1.6 - CONCENTRATION GRADIENTS IN SOLUTION /-"
<;
The ef fect of ion concentration gradients on d r i f t velocity and current
response w i l l be discussed i n th is section. The observation of transient I -
concentration behaviour in solution requires, according t o Fick's law, the
presence of concentration gradients:
where D = diffusion coefficient (m2/s)
Other experimental evidence supporting the existence of concentration
gradients in solution includes the effect of external mixing on sample
c u m n t response (Chapter 4).
In the estimates of d r l f t velocity , a uniform ion concentratlon dlstr ibutlon
was assumed under certatn conditions. In general, however, the
9 ' a
concentration has to be considered a function of position and time. A t a
given time, the d r i f t velocity w i l l also generally be a function of position . . i n .
order to maintain a constant current flux throughout the sample.
j = PAec(x)v(x) = constant Y
A d r i f t velocity estimated using concentration measurements at a
particular value,of x applies on1 y to that position.
The dependence o f concenttation on position must b8 included i n a
discussion of the current reponse The greatest contribution to ssmpl e /
resistance arises from that portion of the solution having the fewest charge
/' ,,-' carriers. The total resistance o f the solution i s given by summing
/'
. resistances R,(x,t) of individual layers of solution between the electrodes
(See Figure 5.14).
OR = P q/(2e~.tc~(x,t)A) - -
= 1 1(2ejiA) o ( 1 /c(x,t)) dx
%= (constant) p ( 1 /c(x,t)) dx 0
where R, = resistance of 1% fluid layer (O)
%
FIGURE 5.14 - SOLUTION RESISTANCE
Anode
ebl
. . . . I : : : :
ebl = electrical
olut ion n-1 n
boundary layer
Cathode
R =z R. total .
1 I
4xi = thickness of i& flu id layer (m) 1
Ki = conductance o f i" f lu id layer (F1 m-I 1
A = electrode area ($1 > - -
C = equivalent conductance o f solution&?-' rriel (+m'3r1 )
= effect ive mobi l i ty of ions i n solutton
c*(x,t) = equivalent concentration (-m-3)
Pc,(x,t) = to ta l ion concentration, ia layer a t x and t(* /m3)
e C+ = C- = ci(x,t) 2
and Ri = &xi/(KiA) = ~x~/(Z&,c*(x ,t)A); ~x~ / (2ec .pA) 1
Using th is expression f o r the resistance, the current can be w r i t t en
according t o th is model as
i(t) = (V* - Vli(t) - V2*(t)) ( 2 e i ~ ) t
Convective effects can a be included by introducing a new e f f ec t i i e mobi l i t t j
in order to predict the current response in our samples, i n f orrnat ion on the
magni tude end transient behaviour of electr ical bounday l a y e n i s required.
- - The variation of concentration i n space and t ime also has t o be mapped. In
Section 5.2 some measurements pf the evolution of concentration profi les in i ,=
space and t ime w i l l be discussed, /
. I
* 5.2.1 - SPATIAL CONCENTRATION BEHAVIOUR IN TIME
In th is study the current response of organic s ~ l u t i o n s has been interpreted
qualitatively in terms of the trarisient behaviour of sample ion
concentration. Some features of ion concentration distr ibutions in solution,'
such as the magnitude of amcentration gradients. and the nature of
concentration instabi 1 i ties, can be observed direct ly by monitoring PCP-
concentration as a function of position and time.
With voltage applicatiod& in i t ia l l y homogeneous distr ibut ion of ion , /
concentration evolves and develops spatial asymmetry. When the optical
response (415 nm.) of a TCNE/DCE/Al system i s monitored a t a position
closer to one electrode than the other, consecutive voltage reversals
demonstrate asymmetry i n ion concentration changes with respect t o the - anode and cathode. The optical responses are shown in Figures 5.15 and 5-16
and were measured using the CARY 17 and the Krypton laser arrangement
(Figure 5.2) respectively.
The absorption vs. t ime profi les observed w i t h the beam near the a e are +@
broader and shak f ower than those observed near the cathode. The s ape of 2 these prof i les can be accounted fo r i f a pulse of PCP- charge migrates f rom " - the negative to the positive electrode a f ter each voltage reversal and
disperses as i t travels. A narrower absorption response i s predicted w i t h 6
the beam near the cathode a f ter voltage reversal. The asymmetry of PCP-
distr ibution must, however, be interpreted in terms of the to ta l ion
FIGURE 5.15 - l,0G 1,/1 VS. TIME,
BEAM POSITIONED CLOSER TO ONE ELECTRODE
Sample: KCHE] = 0.0 1 M
aluminum electrodes
\d = 50 Volts
,FIGURE 5.1 6 - ABSORPTION VS. T l ME
-Sample: [TCNE] = 0.02 M
aluminum electrodes
168b
INCREASING ABSORPTION
concentration. Con,centra ti ons of unbalanced negative space charge can .
never be expected to approach lv7 M. (See Section 5.3 for typical space
charge densities i n solution). The preceding obsemations do not .
nekesari ly require a pulse of ion concentration tra l l ing across the % 7
solution. The asymmetry of the optical rcspons only demonstrates that the .c rateofionconcentration ngesaregreateratthecathodethanatthe i"R" enode i n the TCNE/DCE/Al system. The asymmetry of the ion concentration
behaviour could also have resulted from differences in anion and cation
mobility, and/or anode and cathode processes.
fle&urements of ion concentration changes as a function of position and
time clearly show the importance of processes occurring a t the >
electrode/liquid interface. ~owevf ihe current response of samples i s
, largely determined by the effective ion concentration i n the bulk of the
solution. The evolution of concentration profiles w i l l be described i n
TCHE/DCE with A), In and Pt electrodes. The data are recorded as a sequence
o f diagrams with relative optical transmission plotted against beam
Monitoring PCP- as the dominant negative charge carrier i n the system was
equivalent to monitoring the behaviour of the total ion concentration at a
given position i n solution (c,, = 2 c ) Only relative ih concentration peg w' a
I
changes in space and time could be estimated reliably wi th the *
measurements because o f baseline drift in the apparafus. A
Figures 5.17 to 5.2 1 show sequences of transmission profiles fo r
&E 5-17 - TRANSMISSION PROFILE
aluminum electrodes -
- -
V = 20 Volts
Scan 1 : prior to voltage application
Divider .Output
r ' Jo l ts !
'? INITIAL VOLTAGE APPLICATION
Anode ( A l l Cathode (Al )
P / - r'
F I CURE 5.1 8 - TRANS,MI SS I ON PROF I LE
r"" Samp le: - [TCNE] = 0.04 M.
I
aluminum electrodes
d = 7.3 mm.
V = 20 Volts
Scan I : prior to voltage reversal
1 ,----------------------------------------;---------- Anode ( A l l .
FIGURE 5.1 9 - TRANSMISSION PROF1 LE
Sample: [TCNE] = 0.04 M.
aluminum electrodes 2
d = 7.3 mm.
V = 20 Volts
Cathode (All
CONTINUATION OF FIRST VOLTAGE EVERSAL k
concentration bump
FIGURE 5.20 - BANSMI SSlON PRO~TLE
Sample:. [~CNEI = 0.04 M -
+ Scan ..----9
w+
' aluminum electrodes
d = 7.3 mm. %
V = 20 Volts
I ': pr ior t o second voltage reversa
Anode ( A l l
SECOND VOLTAGE REVERSAL
Cathode -(Al) -,
b Fl GURE 5.2 1 - TRANSMISSION PROFILE
Sample: [TCNE] = 0.04 M.
aluminum electrodes .
1
d = 7.3 mm.
V = 20 Volts
- --- -
Scan 4: 15 minutes a f te r vo l tage reversal -
CONTINUATION SECOND VOLTAGE REVERSAL
Anode ( A l ) Cathode (Al)
-
3 'i
t concentration bump
TCNE/DCE/Al. The f i r s t diagram shows the ef fect of i n i t i a l voltage
application on sample transmission. An increase in optical transmission a t
. the anode corresponds to depletion of PCP-. The decrease in PCP- -,"
concentration spreads across the cel l un t i l a level optical response i s
observed a t steady state. The decrease in overall ion concentration i s
accompanied by current decoy.
Af ter voltage reversal, decreasing transmission near the cathode indicates
growth i n the concentratibn of PCP- (Figure 5.18 ). As the current peak i s
approached, the effective ion concentration increases and distr ibutes fa i r ly
evenly across the cell . Beyond the durrent peak the overall ion
concentration decreases t o approach a steady state level (Figure 5.19). The
second voltage reversal qua1 i tat ivel y reproduces the behavi our observed -
-after the f i r s t polari t y reversal (Figures 5.20 and 5.2 1 ). ; b
j-
The sequence of transmission fo r T C N E ~ C E w i t h In electrodes are
guali ta.tively s imi l iar to those w i t h A1 electrodes (Figure 5.22 and 5.23). \
The i n i t i a l transmission prof i le i s uneven but relat ive cha.nges in PCP7
concentration at a given position are s t i l l observable. ~ i m \ l a r i t i e s of the
concentration response w i t h A1 and In electrodes re f lec t s imi lar i t ies in
injection/discharge processes for the two metals in DCE. Both metals
belong t o the oro on group and form surface oxide layers. The log 1,/1 vs:
.F time, wd c w e n t vsl time responses f o r a TCN#DCE/ln sample are s imi la r a
to those observed using A1 electrodes.
F l GURE 5.22 - TRANSMI SS l ON PROF l LE
Sample: [TCNE] = 0.04 M
indium electrodes
d = .7.3 mm.
Scan 1: prior to voltage application
Anode (In)
INITIAL VOLTAGE APPLICATION i
( Cathode (In)
rior to voltage I application I-
F l GURE 5.23-- TRANSMISSION PROF i LE
Sample: [TCNE] = 0.04 M
C w indium electrodes
V = 20 Volts
&
Scan 5: 10 minutes after voltage reversal
FIRST VOLTAGE REVERSAL
Cathode (Id Anode (In)
concentration bump
Ion concentration behaviour i n TCME/DCE/Pt i s di f ferent f rom that observed
using A1 o r In electrodes, a1 though the current reponse of the Pt system c
resembles qualitat ively that of the other electrode systems. Sequences of
transmission vs. position prof i les are shown in Figures 5.24 t o 5.26. In i t ia l
application of voltage decreases the transmission near he cathode. Y ' lnstobi l i t ies in the concentration profi les fo l low a d e l 4 t ime during which i \
ion concentration builds up at the cathode: In th is sarnplkpmcentration
fluctuations were too rapid to be continuously monif ored w i t h the apparatus
available. The increasi ng magnitude of concentration fluctuations w i t h
applied voltage (Fjgure 5.27) suggest that electrohydrodynamic effects play
an important role i n the system.. It i s also possible that the size $f
concen trat ion gradients near the cathode increases 6s a function of ~ o l tage . and-% therefore accompanied by larger drag forces (See Section 5.2.2).
Af ter voltage reversal, a bui ld-up in ion concentration f l i s gain observed
near the Pt cathode and concentration instabi l i t ies persist. Higher ion
concentration i s maintained near the cathode i n spite of the turbulent 3
behaviour i n the rest of the solution. TCNE-, f rom the reduction of TCNE, /
could have contributed to the lower transmission observed near the Pt
cathode. TCNE- and PCP- both absorb l ight a t the monitored wavelength of
The data demonstrate that injectioddischarge processes a t a P t swface are ., L
substantially di f ferent from those a t A1 and in surfaces. The absence of a
surface oxide layer on Pt distinguishes i t s electrochemical behaviour f rom
FIGURE 5.24 - TRANSMISSION PROF 1 LE
Sample: [TCNE] = 0.04 M
4 platinum electrodes
Scan I : prior t o voltage application
Anode (Pt)
-- - """ INITIAL VOLTAGE APPLICATION
'Cathode (Pt)
FIGURE 5.25 - TRANSMISSION PROFILE
Sample: fTCNEj = 0.04 M I
platinum electrodes
V = 10 Volts
CONTINUATION OF FIRST VOLTAGE APPLICATION
Anode (Pt) Cathode (Pt) ,
concentration ,bumps !
F l GURE 5.26 - TRANSMI SSlON PROF l LE
Samp 1 e:. - [TCNEI = 0.64 M
platinum electrodes
d = 76 mm.
V = 20 Volts /-
I
Anode (Pt)
FIGURE 5.27 - LOG &/I FLUCTUATIONS AT DIRRENT VOLTAGES
Samp 1 e: [TCNE] = 0.02 M. in DCE
I
platinum ectrodes
d - 6 m m . C
,that of In and Al. Another distinguishing feature of Pt metal i s the
possibility of d-orbi ta l interactions w i th surf ace adsorbed molecules. For
example, TCNE-Pt complexes are known which involve interaction of f i l led
.r Ptd-orbitalswiththeemptyfi*orbitalofTCNE4. *
/' - I
Electrode materiels have a strong influence on concentration response and
the appearance of hydrodynamic instabil i t ies i n the organic solutions under
study. The impofiance of understanding electrode injection processes when
studying low conductivity dielectric liquids i s also discussed i n the
literature
5.2.2 - CONCENTRAT ION GRADIENT~ND HYDRODYNAMIC INSTABILITIES
\
The observations just discussed have implications regarding ion N
concentration gradients and hydrodynamic instabil i t ies i n the liquid. A f'
3 model correlating I J concentration gradients, space charge and convective
inStabili t ies w i l l be discussed i n Section 5.3. According to this model, *
unbalanced kg forces and pressure gradients i n electrolyte solutions are
associated w i th ion 'c6pIc4entration gradients and space ch Q'
unbalanced force always points from high to low ion concentration regions, \ a - i n solution.The larger the coricentration gradient,,the larger the force on
I
the liquid. Large enough forces lead to laminar or turbulent f low i n the .
solution. The diffuslon Induced drag force per unit volume of l lquid (F,) can
be estirrlsted from concentration gradients i n solution using
where k = Bol tzmann constant (J/K)
T = temperature (K) 3'
'c, = to ta l ion concentration
b c, /ax = concentration ~ r a d i e n t (*/m4) s
A typical ion concentration gradient in the bulk o f TCNEIDCE solutions
during non-steady state current conditions can be estimated using
Figure 5.1 7. A PCP-concentration difference of 2.8 x 1 fin. i s
observed over about 6 mm. This gives rr concentration gradient of
( ~ A c ~ ) / A x = 2 (3 x 1 o - ~ M)/ 6 mm. = I x M/mm f
= 6 x l@ /m4 + 6
In. Figure 5.18 and 5.24, larger concentration gradients af about 6 x ,lo-' M/mm o r 3.6 x ld3 /m4 are observed. Concentration gradients of th is size
produce a force of 1.5 x 1 o - ~ Newton per uni t cm3 o f solution. This i s ~,=. -1
equivalent t o the weight of a 0.15 gm mass being applied as an unbalanced
force t o a 1.2 gm. port ion of DCE. /'
Evidence of turbulent f l ow i s observed i n the TCNE/DCE/Pt system and
preceded by growth i n ion concentration near the cathdde (Figure 5.24.5.25).
A net drag force on the l iquid points f rom the cathode t o the region o f lower
ion concentration i n the bulk of the solution. Liquid f lowing f rom the - Y
r 1
%
. -7 \
cathode into the center of the cell i n response t'o the unbalanced force *
r uces the build-up of ionconcentrationnearthecathode. '=fb
In the TCNE/DCE/Al sample, the evolution of concentration profiles i n t ime I
shows v e y smooth behaviour af ter the in i t ia l application of voltage.
Concentration gradients, were smaller than those observed af ter the ih i t ia l
voltage application i n Pt. Thg absence of turbulence does not eliminate the
possibility of laminar f luid f low inAthe system. Laminar f low would be
expected to decrease the magnitude of concentration gradients i n a smooth
fashion.
After voltage reversal and the build up of ion concentratibn near the A1
cathode, aTtemporay instabil i ty i n the soluiion i s marked by a bump i n the
concentration (Scan 1, Figure 5. t 9). Concentration bumps are also observed
af ter the next voltage reversal, and under s imi l iar conditions iri the
TCNE/DCE/ln system (Scan 4, Figure 5.23). 9, The temporay nature of f luid instabil i t ies i n TCNE/DCE/Al samples i s in
contrast t~ the continuous turbulent behaviour m o n h r e d in the
TCNE/DCE/Pt system. in the Pt system a higher ion concentration i s ,
maintained at the cathode w i th respect to the bulk, whereas i n the A1
system the bui ldLup of ion concentration i s only temporary. At steady
state conditions i n TCNE/DCE/Al samples, concentration gradients disappear
and fluctuations i n concentration at a given position reach a minimum. This
--7 behaviour indicates the absence of turbulent flow.
i
Table 5.4 l is ts experimentally observed concentration gradients and
diffusion induced drag forces per unit volume of 1 i quid. The drag force is
compared to solvent weight per unit volume. The drag force i s a significant
fraction of the solvent weight for the larger of the two concentration
gradients considered. This corresponds to 8 situation in which .
hydrodynamic instabilities are observed i n solution. When the drag force i s L
only about 2% of the liqi! td weight, there i s no evidence of hydrodynamic \
instabilities.
v
This behaviour supports a model in which ion concentration gradients are
responsible for initiating fluid flow in weak electrolyte solutions. Steady
state turbulent flow requires a mec'hanism for'sustaining ion concentration -2
gradienb. Transient fluid instabili t ~ e s indicate temporary establishment of
concentration gradients i n thebul k of the solution. The contribution of
space charge effects to hydrodynamir instabilities wi l l be considered in the
next section.
TABLE 5.4 CONCENTRATION GRADIENTS AND DIFFUSION- INDUCED DRAG FORCES
l x W 7 6 x l P 2.4xld 0.02 stationary or laminar
FD1 p,g is the ratio of the diffusive drag force 3 to the weight of the liquid
= DCE mess d e n s i t p = 1.235 1 x 1 O" kg/& p1 4 9 . 1.21 X 10⁴ ( ~ / r n ~ ) .
7 *53 - ELECTROHYDRODYNAMIC INSTABILITIES If4
LOW CONDUCTIVITY ELECTROLYTE SOLUTIONS
Electrohydrodynami c instabilities are a general phenomenon in low
conductivity solutions. However, the sou* of these instabilities in
elestrplyte solut!ons i s s t i l l not well understood 6. In this chapter a model -- i s proposed that pr sdi c t s the .exis tmce of presswa gradients in elec tml yte
solutions with concentration gradients. The contribution of space charge
and diffusion to pressure gradients i s considered. I
Fluidfl~wcanbeinitiatedviaunbalancedfm
presence of any space charge in solution wi l l I
volumgof liquid i f an electric field i s applied
F, = space charge drag force per unit volume (~/m")
p = a unbalanced charges per unii volume (*/dl ,
e = unit electronic charge = 1.6 x C
E = electric field (J/C) &
f, = force per unit electronic charge (N)
, In the strictest definition of an electrolyte solution. no spsce c h q e rxlsts 'L
7
i n the bulk of the liquid and so no presswe gradients we expected in an
. applied f ie)B\ However, in the case of even small violations of charge
neutmli t y i n the bulk of the solution the space charge drag force must be
considered.
-L volume of liquid with or without tho benefit of an applied electric field.
1 ,@ / -.rC-- -
where F,, = diffusion drag force per unit volume ( ~ t / m )
c, = concentrbtion of particles (*/rn3)
3 c#Qx = concentrstion gradient (*/m4)
Ed = diffusion field (J/C) = ikT/( %el) b %/bx
1 fd = diffusion force per particle = (kT/ %) b %/ax
There i s no fundamental diff~rencd in the way forces from space chwge or
k diffusion are tmnsferred to the liquid. In both cases theyhg force k t e d
$ L a
by the liquid on the moving Grticle i s accompanied bg an equal force i n the
oppwite direction on the l i ~ ~ i d (i.a in the direction of particle motion).
Another source of unbalanced f wces in chemical systems i s the existence of-
mass density gradients (sometimes ref erred to as natural convection). Mass
density gradients cun an'se from tempers ture gradients ( h a r d convect ion
i s a special case) or large enough concentration gradients. In the organic
solutions under study, concentration di f f emnces of the order of 1 0+ M. are L
9 not expected to result in significant mass density gradients. Significant
ternperaturn grsdients would have been present on1 y in the photocurrent
measumments. Theref are, the contribution of density gradients to 4
convection wil l be ignored. 4'
t
The pressure developedacross a liquid can be written in terns of the
contributions from space charge und diffusion following the reasoning of
The contribution from gravitational effects i s assumed to be negligible and
the liquid i s incompressible 8nd without rotational motion. It i s not the aim a
of this model to predict the details of hgdrodgnamic flow wi th iven a,
presswe gradients. he alm of this model i s to suggest a general mechanism \
by which pressure gradients are established i n an electrolyte liquid with
gradients we not independent parsmeters. This can be shown uslng a few \ physical assumptions: <,
a given time:
I positions in the sblution: .
3. The Poisson equation in one dimension relates electric f ield . ' ,I- - - gradients and sp8ce charge density in salutf on: .
electric field distributions at a given time can be
t
I
2 j = P~c(x)E(x) = constant
theref ore
Since the product oftelectric f ield and concentratibn i s constant w i t h *
respect t o position we have t * *
1 -,
-
Using the Poi-sson equation to rewri te dEb)/dx and rearranging gives
I 5
e < . . - ~quat ion4 1 f r e gmoient present a t a given position
u-.
i.)
+ . q in s o l u h n to the &ace char& density at the same p o d t i on. Using 1'
conditions applicable to the organic~solutioni under study; the space charge rX
d
density, p, can be shown t o be much Tess than the ion concentration.
8 - *
Using dddx = 3.6 x 1 d3 /m4 ,. E
8
gives
rp.- For a pos j t ive concentration gradi entgnd positive 'appl ied field, the space 6 r- 3 &- -4-e' . -
charge i s negative. The space charge for positive and negative -7 P
P concenttation gradients i s sketched i n different f ields i n Figure 5-28. In
each Fase t& space charge enhances the electric f ie ld i n the region of low - i i n concentration a ~ d i m i n i s h e s the electr ic f ie ld i n the region of high ion
concentration. This aUows a constant current flux to be maintained on
either side of the cpncantration ~radient . %
I L
4 r f
Given the transient nature of concentration gradients and current flux i n \kb 2
"% L
solutions under stkdy, it i s reasonable to question whetber a wel l defifbd &-
a 3 space charge distribution can be associated w i th a concentration gradient in solution at a given time. In order to estimate a characteristic t ime for - establishing the space charge distribution required to maintain constant
current f lux as a function of PO 't ion imagine the following situation: A Y portion of a concentration gradient w i th a positive slope exists i n a solution
+ti thout upplied electric f ield (Figure 5.29). No space charge i s associated
w i th the ion distribution under these conditions. With the application of hi
electric f ie ld i n the positive direction, some seyrat ion of chatge results in
FIGURE 5.20 - SPACE CHARGE ASSOCIATED WITH ION CONCENTRATION GRADIENTS TO MAINTAIN
I
A CONSTANT CURRENTFLUX , +
c i El = constant
FIGURE 5.29 - FORMhTION OF A SPACE CHARGE LAYERe6N A CONCENTRATJON GRADIENT
I
- '0 c , ' - -
, !
.-$ $ 3 4 - the region with the gradient. In t h k example, negative charge moves from .,
? thehighi~r iconcentrat iok~ion 6ths1t1wionconcentrationre~idn.~he : result i s an unbaianced negative space charge in the region,of the . * - -
f i -' concentration gradient. Once, the condi (lons for constent current flux are
met, the space charge i s d;f i"ed in terms of th; concehtration gradient
(Equation 1). i
4
C
J
f i e chsncterlstlc tlme (t,) for meeting Me condltlon,of constant current '
flux for a given concentration A gradient depends on how quickly the negative , I-
and positive charge profiles separate to form - the desired space charge + .
distribution. *Negativgand p ~ s i tive charges initially separate at a speed v, d J
whichGis the sum df id individual ion v e l i i t b s . , .
The thlckness of the space charge layer (b) st canstant current flux i s glven
by the product of v, and the time,' 1,.
s'- The characteristic time, t,, can be rewritten in terms of p, c h , g, and E
i using the simlliar triangles in Figwe 5.29. From the tr ia 18s
hence, hB
I
'L. Substitution of Equatlon ( 1 ) into the previous equation gives <
.- Sd . S -.
~ o t $ t * t ~ t t, i s independent .of the rnsgni tude of the concentration gradient,
as well as of the electric field. t, increases with decreasing ion ' 9.
concentration. A characteristic time for establishing constant c u h n t flux
for a solution of given concentration can be estimated using physical
constants applicable to the organic solutions in this study.
P
Since t, i s much smaller than typical times fw changes in concentrstim . f grsdiente, it i s reasonable $0 associate a well Wined spec0 chsrg& @ensf ty :aQh . s
L +
2 & ' a & ; 4 %
I G . ,
C
'' w i th a given concentmtim gradient i n scdwtion. It i s also reasonable to
assume that current flux i s constant bs a function of position i n thB cell.
The relative contributions of diffusion and space charge to liquid drag
forces might be expected to vary wi th electric f ield and concentration. The
ratio of space charge and di f f usiob forces per unit volume can be writ ten
* Fd 2(kT) c (3) a
I
This rat io determines the concentration and electric f ie ld conditions f o r
which space charge effects can be expected to "mminate diffusion effects.
At high fields and low iohic cventrst ions, space charge *ffects are' %
expected to dominate. This i s consistent w i th the&p8wance of ,
d electroconvective phenomena in low rather t h y gh conductkitg l k y ~ i d g ,
The range of this rat io under expeFTmentally observed conditions i n this L
,
Equation (3) obviously has some consequences f q experimental work on
" *Wectrohydrodynamic instabilities in liquids. In order to select a sample for - ..a> * n .. .> )-, i I" -
:-%"dying the contribution of space charge effects to hydrodynamic Q%
i iP' "h--;
j d x * ihstabil i ties in DCE, the rat io of E ~ I C must be much larger than 9.1 x 1 Q' ' .
1
k,> <= (2kT/eee st 293%. Table 5 6 l ists values o f fields and - . * -
%-U
/' L- concentrations for which space charge anddiffusion contributionsXo the ,
t
liquid drag force ap-equal. Even exceedingly pure solvents with ion I I
4 concentratioflsuf the order of:^)-'^ tl would~have diffusion drag forces
L / i
contributing to hydrodynamic instabhi ties at low enough electricdields. '- .."& %. ') 3 +&. *: dti. ,/*
' . k - * e * . .hi
/ 'a " ' a '
As a rule, the inclusion of diffusion drag for& ha? been ignored in i f . >
elect~hydrodynamic studies. This approach i s wsrgnted in systemd wi th /
uni pol a r injection as the only source of charge cam e k . Ho%ever, diffusion - -J
/ drag forces must be considerad in industrial dielectric l i q u w c h as fuels, , ,
\ , /
mineral oil, and solvents according to our model. /
Note: The potential l imits f o r a DCE solutton with , ,
0.1 fl of n-Bu,NClO, of supporting electrolyte are - i
anode : 2.13 t o 2.48 Volts ,
cathode: -2.07 ta -2.32 Volts
- from T. Osa, T. Kuwena, Journal of Electroanaluticel Chemistry l 969 ,Z 389-406.
-
1. W J . Middleton, E.L. Little, K.K. Co 'Cyanocarbon Acids and their Sal
b ' Chemical Society 1958, Be. 2795-2806. a
2. R.H. Boyd, 'lonizatibn Behaviour of Cyanocarbon Acids', lournal of -
3. R.H: ~oyd, ' The Solution Conductance of Cyanocarbop Salts', d ournal of Phusical' Chemisty 196 I,,& 1834- 1843
4. G. Henrici-Ol ive, S. Olive, 'Coordination and Catalysis'; Verlag Chemie: 9 . ~einheim, New York, 1976; pp 1 10- 1 12
5. J.C. Gibbings, 'Interaction of Electrostatics and Fluid Hotion', Electrostatics t9791 Institute of Phusics Conference Series; No.48; J. Lowell, Editor; 145.
1
6. P. Attan, 8. ~al&son, S. Al i Kani. +lectrohydrodynsm'k htabi l i ty of Dielectric Liquids subjected to A.C. Fields', Journel of Electrostaticg 1982,12477-408. - -
7. W. F. Pickard, 'Ion Drag Pumping', Journal of Amlied Phusics t 963, 39,246.
J F"
CHAPTER 6 SOHE CYANOCARBO$~~EHISTRY % k r*"l
-
c-
Chemical and el ec trochemi ;a1 processes contributing to the pvduc ti on of
charge carriers in t%e organic solutions under study are honsi dered in this
chapter. The chemist y of the l,l,2,3,3 pentacyanopropenide anion (PCP-),
and the tricyanovinylalcoholate anion nCV-1 are discussed. The
electrochemical genemli on of TCNE- in solution i s also considered.
6.0 - EXPERIMENTAL
The t etraethylammonium salt of pent acyanopropenide ( TEA+PCP- ) was
prepared according to the method of ~iddleton el. sl? 'except that TEA'CI-
Was used as a reactant instead of TEA%-., The TEA'PCP- salt dissolves
easily in a variety of SOIY~~~S. Spectm w recorded wl th the CARY 2 10 ,
spectrophotometer.
Acetoni trll e (CH&N) i s s twl ce d l s i llad under nl trogen, uslng P 2 4 as 7
dying agent. Spectroscopic grade DCE $s distilled once under the same
condt i ons. Te t rshydrof umn and 2-nethyl t e\hydrof uran were dl stilled -- - 9
under nitrogen and sodium metal wbs dying agent. I f solvents
were not used immediately, they nitrogen.
3 4
B
\
The sample prepamtion used t o study the resctlon of TCNE and water in DM J--
and CH&N wi l l now be described. Water i s vey soluble in Ol&N,'krt h
'L I
p&l soluble in DCE (0.16% by weight at 20 C) 2. Micropipettes were used
C introduce distilled water directly into CYCN solutions of TCNE. The
samples were then vigorqllsl y shaken, trsnsferred tb s 1.000 cm. ,
spectroscopic cell (Hellma), and carefully sealed with pamf i lm and teflon
tape. Water was added to TCNE/DCE samples by f i rst saturating s portion of
the solvent with water. By adding different fractionsof $0 ss tukdDCE
to the sample, the concentration of whter could be varied. Changes i n the -= @
visible spectrum of t ~ ~ ~ / s o l v e n t samples were monitored nyth the CARY
2 10. b -
i
* - - - The preparation of voltage treated samples of TCNE/CH&N was c m e d out
using the A1 electrode cell shown in Figure 6.1. Vol tsge was applied for
about an hour until steady state had been reached. Alter voltage treatment.
the solution was removed from this cell and sealed i n a 1.000 ern.
spectroslopic cell using parafilm and a teflon tape wrapping. Again. the
CARY 2 10 was.rrsed t o record the chemlcal changes i n the cell
spec t roscopicall y.
6.1 - RESULTS AND DISCUSSION \
Absorption sp+scopy can be used to monitor the chemistry of
cymcarbon ibns ib solution. Each of the anions, PCP-. TCV- and TCNE-, has
an intense ul tmviolet or visible spectrwn with peak molar absorption
coefficients frap 7 1 OO t o 22.400y1cm-' (Flgures 6.2 6.3 ) . PCP- in
2 a) Aluminum foil electrode
Area= 6.3 cm2
b) Teflon spacer
Teflon c a p
- lFIGURE 6.2 - ABSORPTION SPECTRUM OF TCNE. TCK
IN METHYLTETRAHYDROFURAN
FIGURE 6.3 - PCP-, E V -
PCP -
, '
PCP'in water, TCV'in water
----- PCP- in acetone/CCI, 6-1 0.3 1
DCE i s characterized by a band with' two peaks dt 41 4 and 398 nm . Table .
6.1 l is ts the peak positions o f PCP- i n several solvents. Figwe 6.4 shows
the spectrum of PCP- in DCE with v k s at 417 and 398 nm. TCV- h a m
single peak at 295 rim in water ( ~ i ~ u r b 6.3). The TCNE- spectrum has a
number of vibronic peaks and a maximum absorbance a t 425 and 435 nm. i n a
Cf-&CN. The TCNE- peaks is CH$N are compared with those reported in the
literature i n Table 6.2.
Figure 6.5 shows the structure of the cyanocarbon anions PCP-, TCV-.
PCP-and TCV- have conjugate acids which also have intense spectra i n the \ +
UV/VIS region (Figure 6.6 6). The protonated forms of PCP- and TCV- have L
pK, values of (-8.5 and -5.3 re~pect ively~.~.
TABLE 6.1
PCP- - - PEAKS IN DIFFERENT SOLVEWTS
1 - DCE 398 2 1 417' 1-
* TEA' PCP- was insoluble in CCl, .
These peaks were measured in a sample of reagent grade CCI, saturated with TCNE. The undissociated form of PCP--
~ h e ' s t r e n ~ t h of these cysnocsrbon acfds, whfch r ivals that of HCI (pK, =
-7). i s related t o the resonance stabilization eneby of the anions ? Resonance forms of PCP- are shown i n Figure 6.5. The spectrum of ;he
conjugate acid of TCV- (275 nm) i s shifted to shorter wavelengths than the
anion (295 nm.)6. Much the same effect i s observed fo r the PCP- conjugate
acid except some dissociated PCP- contributes to the shifted spectrum
shown i n Figure 6.6 6. %
6.1.1 - REAUIONS OF WATER AND TCNE IN SOLUTION
-
Both PCP- and TCV- are possible products of the reaction of water w i th
TCNE . Neutral to acidic conditions favour formation of il
- t ri cyanovlnyl alcohol (or tricyanoethanol). The presence of e bese favours
<
the f onnatlon of PCP-. The following reactions are representative of
chemistry involving TCNE end water:
0 = pyridine, quinoline BH+ = pyri di ni um, qui no1 i ni urn
Quaterwy ammonium sal t s of PCP- can be prepared by dissolving TCNE i n a
sodi um bicarbonate solution (aqueous) and addi ng quaternary ammonium
chloride or bromide salts. The mechanism for reactions pr6du'Eing PCP- i s
not wel l understood. Tricysnoethsnol i s not a l ikely reaction intermediate
Conditions leadhq to PCP- generation i n solution&hlCE and CH&N relate
to the conductivity studies. PCP- i s the dominant negative charge canler i n
TCNEIDCE and TEA'PCP-/DCE solutions. Addition of water to TCNE/DCE and
TCNEICYCN samplas results i n the growth of PCP- concentration. The set
of spectra i n Fig 7 shows the change in the sample absorbance i n t ime
af ter thbaddi t ion of 40 p1 of water to 3 ml. of 0 . 0 4 TCNE/CH&N. A plot of
[PCP-] vs. t ime i s shown i n Figure 6.8 for three TCNE/CH&N samples w i th
different water concentrations. In each sample a rapid increase in PCP- r;
anion concentration i s init iated by the addition of water and i s followed by
FIGURE 6.7 - TCNEICkCN SPECTRA AFTER ADDITION O , ~ A T E R
Sample: 3 mi. of 0.04 M TCNEIDCE 40 p1 water
Time sfter water addition
Scan 1: 3 min Scan 2: 27 min Scan 3: 55 min Scan 4 92 min Scan 5: 151 mln
FIGURE 6.8 - LOG 1,/1 VS. T lNE AFTER W A T B ADDlT ION
Sample: 0-04 H TCNEIDCE
A=414 nm 4 0 pt H20 added
\
A 2 0 pl H20 added no %O added * Time of water addition
Time after TCNE addition to CH,CN (min)
a slower increase of [PCP-] which i s independent of [YO]. In Figure 6.9. a
C graph of [PCP-] vanus added [H, 1 demonstrates a linear relationship
between the two. The slope of the line i s independent of the time after
sample preparation. The starting amount of water in the acetonitrile
sample can be estimated at 0.5 M.
Figure 6.10 shows the effect of water sddi tion on the g r o w m ~ ~ -
concentretion i n s 0.0 1 3 M TCNE/DCE,&&O~. A plot of [PCP-] versus . -
added YO concentration demonstrates 8 linear relationship. Two sets of L
data 8m plotted for different times after samp;s preparaiion. The slope of . , the lines are the same within the experimental uncc!rtainty. In this case the
starting concentration of water i n DCE (0.008 HI f s much less than that
observed i n the CH&N sample.
< 1
The concentra tlon ratlo [PCP-I/(TCNEI[t$OI corresponds t o a possible
equilibrium constant for the systems just considered. Values of this rat io - are calculated i n ~able. 6.3 for DCE and CYCN. The ratios for the two
solvents are of the same order of magnitude.. Further studies would be
required to measure the equi 1 i br i urn constant vemi ng [PCP-], mCNEI and 9P fH201 i n solution. - - I
The slow rate of PCP- growth i n DCE and CH&N i s tabulated i n Table 6.4.
Rate's were independent of water concentration i n both solv$nts. The 1
Fl GURE 6.9 - [PCP-] VS. [H,OI *
Sample:
- H,O added (M)
FIGURE 6-10 - [PCP-] vs. [H20)
Sample:
. l-$O 1 = 0.1 1 M.in saturated DCE ,
TABLE 6.3 -
I qFORnATION OF PCP- FROM TCNE + H20
IN DICHLOROETHANE AND ACETONITRILE
DCE 0.0 1 3 N (6.8 2 0.3) x 1 o - ~ (5.2 2 0.4) x 10* N-'
TABLE 6.4
SLOW FORMATION OF PCP- IN TCNE/SOLVENT -
(INDEPENDENT OF WATER CONCENTRAT ION)
reactant producing this Gcr-ease in [PCP-I i s probably present in the -.
atmosphere. The data are insufficient t o establish the chemical
identity of the reactant. Reaction ons st ants (normalized to TCNE
concentration) are of the same order of magnitude in DCE and CYCN. The - $ ,
equili brf um ratios and normalized rate constants in DCE ples am about
twice as large a as i n CYCN.
The addition of water to TCNEICCSCN solu ions also increases the spectral C $
absorbdnce at shorter wavelengths and this i s probably the result of TCV'
produced i n solution. Again. the presence of the intense TCNE band made it
di f f icul t t o make detailed measurements i n the region of the TCV- peak
(295 nm.). Figure 6.1 1 shows the growth in absorbance at 332 nm as a
function of tlme. The rs te of growth increases w i t h w ~ t e r concentration.
t Determining the factors influencing the balance of fp -=and TCV- ions i n ,
DCE &Quires more experimental work than i s presented in this preliminary
study. In aqueout solution, pH. or the presence of Lewis bases. dramatically
influences whether PCP- rather than TCV- i s a favoured product of the ,
reaction of TCNE with water. Simil iar considerations need to be applied to
DCE and CH&N solutions.
Exposure to water and a i r can influence charge camers i n solution at
dl f f e m t stages of the TCNEIDCE sample preparation. The effect of solvent
dist i l lat ion on a TCWDCE spectrum i s shown in Figure 6.12. The' effect of
FIGURE 6.J 1 -'LOG I /I VS. TIME ( h = 332m. l
Sample: 3 ml. of 0.04 M TCNE/Ct-$CN
- -
Time after H,O added (minutes) *
$
FIGURE 6.1 2 - TCNE/DCE SPECTRA WITH AND WITHOUT DISTILLED SOLVENT
Sample: [TCNE] = 0.04 M.
succesive sublimations of TCNE cys ta l s onghe PCP- peek intensity in 0.04
H. TCNE i n DCE samples i s shown in Figure 6.13. The first sublimation
b dramatically reduces the PCP- concentration observed i n solution. The
residual PCP- concentration observed after the first sublimation could be
the result of water i n the solvent, water absorbed during 3 days of sample - - agitation t o dissolve TCNE, water absorbed during ref rigerator storagd of
I
so!utidris; o r water introduced from the surface of pipettes used t o tranfer J
salutions. The elimination of water from the samples would have required
that a l l spectroscopic and electrical measurements, as wel l as sample - preparation broc d"t=s %d- out in a dry box: 'i F .. t
\' J
h e ef f e ~ t of water on TCNEIDCE solutions tums out t o be ysef u l s i n w the \
production of PCP- allows direct correlation of ion concentmtion and
current characteristics. The PCP- ion concentrat i on in extiemel y pure
TNCEIDCE samples would have been too ibw t o monitor usirig the CARY 2 10
or CARY 17 bpectrophotometers.
6.1.2 -- TCNE- INJECTION IN TCNEICYCN AND TCNE/DCE
TCNE- i s easily produced in TCNE/CYCN by passing a DC c m n t thrwgh the
sample. The cell arrangement used to prepare TCNE- i n acetoni t f i l e
solutictns i s shown i n Figure 6.1.
A spectrum of TCNE/CH&N before voltage applicstioa i s shown in Figure
Trial 1 and Trial 2 were carried out on 'two consecutive days.
[TCNE] b: 2x 1 o - ~ H nf tb one sublimation.
A=420 nm Trial 1
0 Trial 2
'+ Number of TCNE Sublimations
m
Z
6.14 (scan 1). The resulting profile arises from superimposed spectra of
TCNE- and PCP- l,n CH3CN. Note the TCNE- peaks at 457 and 468 nm. During
vol t a r application. the PCP- peak disappears and i s rep1aced.b~ TCNE-
(Figure 6.1 4 scan 2). The gCerstion of TCNE- i n solution i s accompanied by - *
the sample turning yellow nea the cathode. The yellow colour results from ' i
the absorption band of TCNE- (Figure 6.2). After &few midutes of voltage t
?
application, the yellow colour of the TCNEICYCN solutbn appears to dq e i' I \+
fairly evenly distributed across the cell. Abwt 30 minutes i s required for
the cwrent and optical absorption to settle to steady state values. The data .
i n Table 6.5 include the concentrations of TCNE- produced at different c $ .
voltages and TCNE concentrations. The amount of TCNE- generated increases 3
+
w i th ITCNEI. The ratio of ITCNE-I/(V) ITCNEl for s few different tria1,s agree
within the experimental uncertainty and give an average value of 2.1 x 1 O* *
vl. I - P
In C%CN the conversion from TCNE- to PCP- can be observed
spectroscopically after setting the voltage to zero. TCNE- converted back
to PCP- over 3 to 4 hours. Figure 6-15 shows a serles 01 spectra
demonstrating ihe conversion of TCNE- to PCP-. Note the isobestic point at
428 tun. resulting from one to one conversion of TCIIE- to PCP-. The
decrease in TCNE- concentration i s equal to the increase in PCP-
concentration ( (6.820.5) x I @ HI. Probably oxygen. rather than water. in
solutjon reacted wi th TCNE- to produce the observed C O ~ V ~ O ~ ? ~ o t only
i s Tcm- more l ikely to react wl th oxygen than water. but the reaction wi th LJ
FIGURE 6.1 4 - TCNE/CkCN BEFORE AND AFTER
VOLTAGE TREATMENT
+ Sample:
P Scan 1 : prior to vvl tage application
3 Scan 2: after 27 minutes of voltage ,application
0 * LC)
0 CV LC)
TABLE 6.5
[TCNE-I INJECTED INTO ACETONITRILE
FIGURE 6.1 5 - CONVERSION OF TCNE- TO PCP-
' Sample: 0.04 Pl TCNEICYCN %
Time after vol ta e removal 10 min.
&an 2: 1 hr.
a Scan 3: 1 hr. 50 min.*
3 hr. 40 min. t i
water produces TCV- and PCP-. Conversion of TCNE- to both %@- and PCP-
wouldundepnine the 1 : 1 conversion supported by the data,. , fL-.
'The TCNE- absorbance decayed exponentially i n t ime (Figyfe 6.161.
Log I o / I = [TCNE-J( /( Dl) i
where D = molar absorption coefficient (K' cm-I 1
1 = optical path length (cm)
$ = rate constant (s-'1
therefore
Measured rate constants are i n the range (0.5-7) x 1 o-' s-I for 0.008 to 0. l H
TCNEIDCE solutions. The rate constant i s very sensitive to solvent o r
solution aging. I
h
The growth of a spectral a peak at about 520 nm i s also observed in the
TCNE/CH&N sample with the lowest in1 t ia l TCNE- concentration (Figure
6.17). This peak remains unidentif led a1 though i t s location i s comparable
FIGURE 6.16 - In (ITCNE-J@l) vs. Time
Sample: 0.04 M. TCNELCYCN
k, i s the rate constant of the reaction.
FIGURE 6.17 - CONVERSION OF TCNE- TO PCP- AND ANOTHER SPECIES WITH X= 320 nm.
9
Sample: 0.008 N. TCNE/CH&N
Time after vol taae removal 8 -
Scan 1: 10 min. Scan 2: 1 hr. 20 min. Scan 3: 2 hr. 55 min. Scan 4: 4 hr. 35 min.
C
with that, of the (TCNE-1, d lmy at 77 K i n MHF (FiguA 6.18). The .
- -
sppearance of a dimer peak at low TCNE- concentrations and at room
temperature is unlikely. %
The chemistry observed in TCNE/Ct&CN solutions i s different from that in
TCNEIDCE solutions. The injection of TCNE- into solution was favoured in
CH$N rather than DCE. A comparison of two spectra of voltage treated
E/DCE and TCNEICYCN demonstrates this. The 520 nm. pesk observed
TCNE/CH&N solutions i s not obseived in DCE solutions. The two
ions common to both acetoni tr i le and DCE solutions were TCV- and PCP-, J-'
and TCV- was present in TCNE/DCE solutions only with special qmple
preparation (See next section).
' 6.1.3 - IONS IN CONDUCTIVITV STUDIES
The ion of greatest importance in the TCNE/DCE conductivity studies is
PCP-. PCP- i s produced in TCNEIDCE solutions by the reaction of TCNE with
water. The presence or absence of TCV- could not be spectroscopically
monitored in these samples bec'ause of the strong TCNE absorption in the a
ultrsviolet. There was, however, no evidence of my contribution of TCV- to
conduction in TCNEIRCE samples prepared using the stpndwd procedures - , 1 -.
@@lined in Chapter 1.
A DCE solution with a mixture of PCP- and TCV- ions was prepared by ffmt I
FIGURE 6.18 - SPECTRUH OF N ~ + J T C N ~ ~ T T H F AT 77 7
reacting TCNE with deionized water (15 MOlcm) and then introducing the
aqueous solution into DCE. The spectrum of this sample i s shown in Figure
5.1 1 and the TCV- peak i s not hidden by the absorption band of TCNE i n the
ultraviolet. The conduction of this sample s could be accounted for by ci +
ing the effects of TCV- and PCP- in solution (Section 5.1.4).
i
TEA' PCP- dissolves easily tn DCE to produce TEA' and PCP- ions. No trace
of TCV- i s observed in DCE samples containing the tetraethylamoniun salt
of PCP- (i.e. PCP- did not decompose into TCV- with time) The conduction
of this sample could be accounted for strictly on the basis of PCP-
concentrat ion. .
0
REFERENCES: a
WJ. ~ iddleton, E.L. Little, ~b. Cof V.A. Engel hardt, 'Cyanocarbon Acids and their Salt umal of the American Chemical Society 1958, 2795-2806. Q
I. Meltan, 'Industrial Solvents Handbook'; Noyes Data Corporation: Park Ridge, NJ, 1970; pp 78-79. Q -
M. I toh, 'Formation and Spectrum of Tetrscyanoethylene ~ i m e r Anion (TCNE),- ', Journal of the American Chemical Society 1970, %
R. Boyd, The Solution Conduct ance of Cyanocarbon Salts', J o u y l -of ..---
Phusical Chemistry 196 1, a 1834- 1843.
O.W. Webstkr, W. Mahler, R.E. Ernson, Xhep l i s t y of Tetmcyanoetbyl ene Anion Radi cel', Journal of the American Chemtcsl society 1962; M.3678-3684.
R. Boyd, T h e Ionization Behaviwr of Cyanocsrbon Acids', Journal Phusicsl Chemistry 1963, hZ. 737-744.
R.H. Boyd, The Strengths of Cyanocarbon Acids and an H-Acidlty Scale for Csncentrated Acid Solutions', m a 1 of the American Chemical societu 1 96 1,83,4288- 4290.
C.L inson on, D.W. Wiley, B.C. HcKusick, "Iricyanoethylene and Tricyanovinyl Chloride', Journal of the American Chemical Society 1 960 ,a 6 132-6 136.
9. H. Itoh, '~ imehzst ion and Electronic Absorption S m t m a f +
Tetracyanoethylene Anion in Solution and in Solid', Bulletin of the memica1 societu O I ~ J ~ D ~ 1972, .Y 1947- 1950.
CHAPTER 7 - CONCLUSIONS i
P
This chapter includes a summary of the main conclusions of the thesis as
well as suggestions for further work
7.1 - SUMMARY OF THESIS RESEARCH
9
In the previous chapters a variety of data h a ~ b e e n presented
i n orianic solutions of TCNEIDCE and TEA*P'CP-/OW. hot ocohuct ion
effects in solutions of TCNE/Mesi t y l eneIDCE were a1 so resorted.
The pho tocurren t response b f TCNE CT solutions had been interpreted
f '
previously i n terms of a model of photoionic dissociation of CT complexes.
An alternative interpretation of the photosignal as resulting fmm the
interruption of convective patterns i n m u t i o n by bbsorption of l ight was
proposed to account or the observ8tions repoAed in th is thesis. 1 Further work on the current characteristics of.TCNEIDCE solutions
demonstrated the importance of convective trsnsi tions, electrical boundary
layers. and spatial
negative charge carrier in
identified w PCP-. ~CNE-YOIDCE solutfons contained both PCP- andTCV-. p-=-'
lob concentrations were typically in the rdnge of 1 o - ~ - 104 H. .
-The ini t i a l current reponse of these solutions to a step voltage V across a
distance d between the electrodes was accounted fo r by terms proportional
he t o j on concentratidh and velocity, cv (with v = uV/d where p i s an
mobility). The'effective mobilit ies of ions i n TCNE/DCE,
TEA- PCP-/DCE were (321 )x 10% dvl s-I, (421 )x 1 0% dvl s-'a and
(4.0~0.9)xlO* rn2v%' respectively. Transient current behsviour followed
differed from pV/d because of el ectr i cal bounday 1 syer pot en ti a1 s and C
convective f low i n the solution.
F
An investigation of the t ime evolution of spatial ion concentration profiles
demonstrated the presence of hydrodynamic instabil i t ies in solution. - Instabil i ty in f lu id f low was associated with a concentrationgradient of
about 6x lo-', M/mm. This gradient was sufficient t!, generate a diffusion
drag f h e i n the l iquid which was 12 X of the weight of the f lu id DCE.
3
A model describing the contributions of the.diffusion drag
space charge drag fome (F,) in electrolyte solutions was P .i
forces were shown to increase w i th the magnitude of +cent \
gradients. The ralative contrib;tian of F, and F, was ?lated lo the i&
concentration and electric f ie ld :
The contribution of diffusion drag forces should be considered over a wide d
range of ion concentrat ions and electric fields, but it has been largely -
ignored in studies of conduction in dielectric liquids. This study i s the f i rst
to examine the importance of diffusion generated convection in solutions in
the absence of gravitatipnally driven fluid flow.
7.2 - SUGGESTIONS FOR FURTHER WORK ,
2 Y
The study of conduction and convection i n organic solutions with
cyanocarbon anions should be extended to i a wider range of ion &
concentrationsandappliedelectricfields.
Diffusion driven convection i s a general mechanism for genera ti ng fluid
flow and should be considered in corrosion studies, and electrochemical
work. and diffusion driven convection are likely to be
Theconcentmtiongmdientsand
electric fields existing near cell membranes may be sufficient to generate
fluid flow under some circumstanc&. Fluid flowxould in turn influence the t
t transport of 1 i f e-supporting .substances to and from the cell wall. . C
Hydrodynamic flow f mm the presence of concentration gradients i s
expected to occur in the absence of a gravitational field. This prediction -
cwld be tested in low or zero gravity conditions. Understanding the
mechanisms for convection under conditions of zero gravity i s of *
technological importance for materi a1 s science in space1.
R FERENCES: L .. C \, 1. V.I. Polethoev, 'Convective Processes st Low Gravi ty', Material
Sciences in S~ace . P rocaed inas of the Third Eum~ eon Sum~os Grenoble 24-27 ~ p r i l 1979,25-3 1.