Peru’s national nutrition information systems are refl ective of the country’s current focus on improving nutrition throughout the lifecycle through coordinated multi-sectoral e� orts at all levels of government.
The current National Strategy for Social Development and Inclusion, “Inclusion for Growth”, focuses on closing gaps for the most vulnerable families, including the goal to reduce chronic child malnutrition and anemia. The Ministry of Development and Social Inclusion (MIDIS), established in 2011 to facilitate the coordination of decentralized social programs of the regional and local governments, has been instrumental in bringing the di� erent sectors together to adopt a common conceptual framework, identify evidence-based strategies and interventions, set common goals and share information across sectors to monitor progress in an integrated manner.i
Three main elements can be highlighted from this case: i) the results based management approach that has been instrumental to defi ne key targets and indicators, which facilitates sectorial collection of data; ii) the availability of information in the public sphere, provided by the government; iii) the existence of consensus-building groups that bring government and civil society actors together to discuss progress based on information updates facilitates the dialogue and use of the evidence for achieving both political and programmatic objectives.
National Nutrition Information Systems | Peru Case Study
Figure A: Map of Peru showing anemia prevalence in children 6-36 months of age based on the annual national health survey (Source: ENDES 2016)
Fuente: Encuesta Demográfica y de Salud Familiar - INEI (2010-2016).Elaborado con información actualizada al mes de Diciembre 2016.Nota: Estimación regional de LIMA elaborado por la DGSE.
Los indicadores de resultado nos permiten medir el nivel de afectación de la anemia principalmente en gestantes, enmujeres en edad fértil (de 15 a 49 años) y en los niños y niñas de 6 a menos de 36 meses de edad. La información de estosgráficos proviene de la encuesta nacional ENDES-INEI y de los registros administrativos SIS- MINSA, los datos nos permitiránconocer la evaluación de los indicadores a nivel nacional y regional.
Seleccionar IndicadorPorcentaje de niñas y niños de 6 a menos de 36 meses de edad con anemia
USE OF DATA AND INFORMATION Information has played an important role in Peru’s story of reducing chronic malnutrition, used by a range of stakeholders. This section outlines the uses of data and information by various stakeholders in the country.
For tracking program implementation
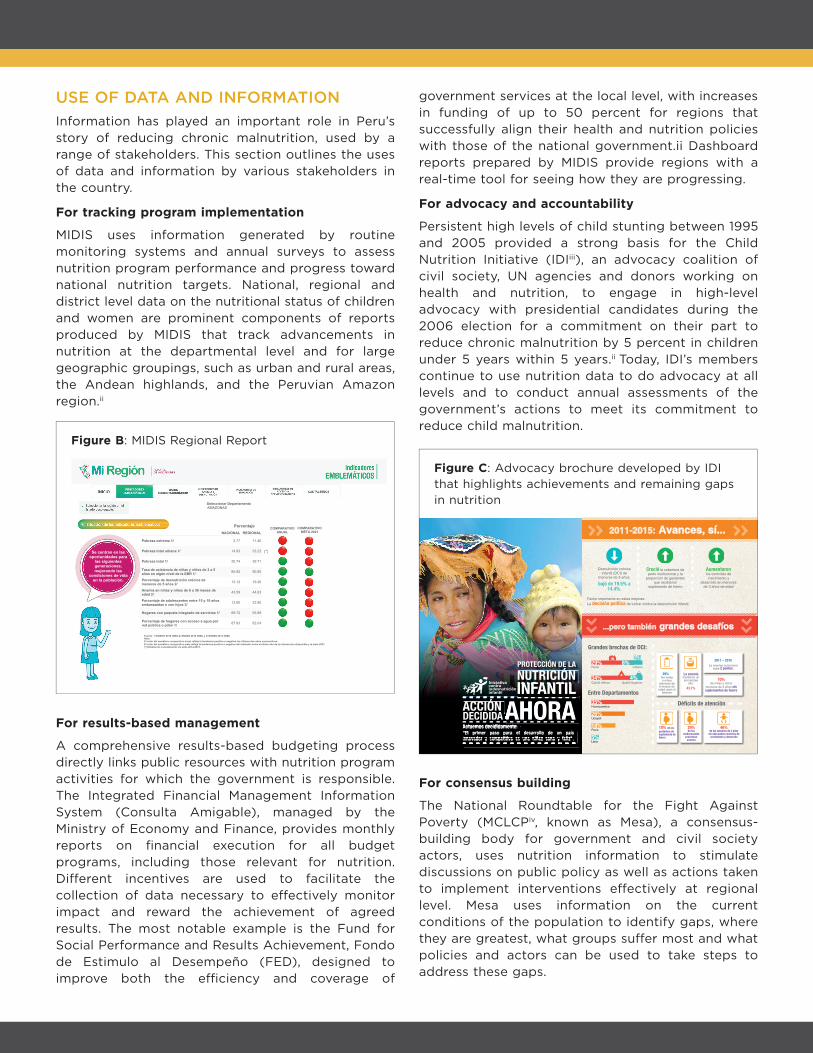
MIDIS uses information generated by routine monitoring systems and annual surveys to assess nutrition program performance and progress toward national nutrition targets. National, regional and district level data on the nutritional status of children and women are prominent components of reports produced by MIDIS that track advancements in nutrition at the departmental level and for large geographic groupings, such as urban and rural areas, the Andean highlands, and the Peruvian Amazon region.ii
For results-based management
A comprehensive results-based budgeting process directly links public resources with nutrition program activities for which the government is responsible. The Integrated Financial Management Information System (Consulta Amigable), managed by the Ministry of Economy and Finance, provides monthly reports on fi nancial execution for all budget programs, including those relevant for nutrition. Di� erent incentives are used to facilitate the collection of data necessary to e� ectively monitor impact and reward the achievement of agreed results. The most notable example is the Fund for Social Performance and Results Achievement, Fondo de Estimulo al Desempeño (FED), designed to improve both the e� ciency and coverage of
government services at the local level, with increases in funding of up to 50 percent for regions that successfully align their health and nutrition policies with those of the national government.ii Dashboard reports prepared by MIDIS provide regions with a real-time tool for seeing how they are progressing.
For advocacy and accountability
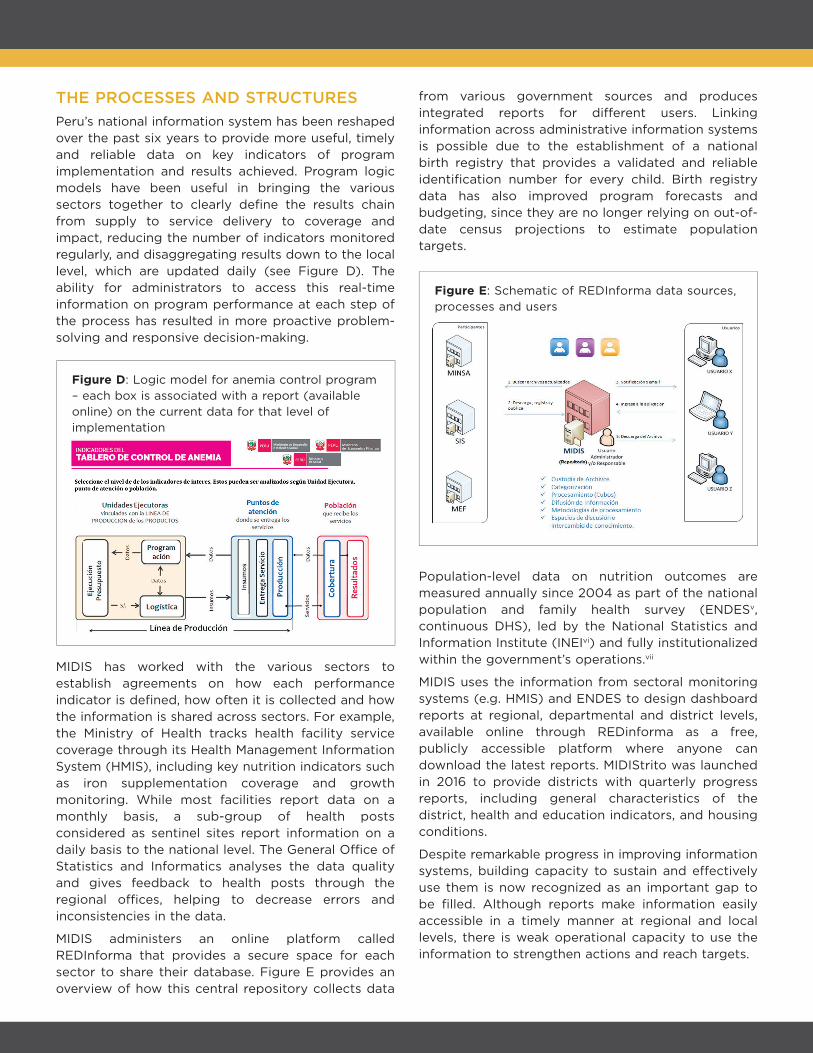
Persistent high levels of child stunting between 1995 and 2005 provided a strong basis for the Child Nutrition Initiative (IDIiii), an advocacy coalition of civil society, UN agencies and donors working on health and nutrition, to engage in high-level advocacy with presidential candidates during the 2006 election for a commitment on their part to reduce chronic malnutrition by 5 percent in children under 5 years within 5 years.ii Today, IDI’s members continue to use nutrition data to do advocacy at all levels and to conduct annual assessments of the government’s actions to meet its commitment to reduce child malnutrition.
For consensus building
The National Roundtable for the Fight Against Poverty (MCLCPiv, known as Mesa), a consensus-building body for government and civil society actors, uses nutrition information to stimulate discussions on public policy as well as actions taken to implement interventions e� ectively at regional level. Mesa uses information on the current conditions of the population to identify gaps, where they are greatest, what groups su� er most and what policies and actors can be used to take steps to address these gaps.
Figure B: MIDIS Regional Report
2011-2015: Avances, sí...
Factor importante en estas mejoras: La decisión política de luchar contra la desnutrición infantil.
Déficits de atención
...pero también grandes desafíos
Creció la cobertura de parto institucional y la
proporción de gestantes que recibieron
suplemento de hierro
Aumentaron los controles de
crecimiento y desarrollo en menores
de 3 años de edad
Desnutrición crónica infantil (DCI) de
menores de 5 años:
bajó de 19.5% a 14.4%.
Grandes brechas de DCI:
Entre Departamentos
Quintil SuperiorQuintil Inferior34% 4%
UrbanoRural29% 8%
Huancavelica35%
Ucayali26%
Puno18%
Lima5%
29%De niñas y niños
menores de 6 meses de
edad usan el biberón
2011 – 2015La anemia nutricional
sube 2 puntos.
La anemia mantiene un porcentaje
alto:
43.7%
70%de niñas y niños
menores de 3 años sin suplementos de hierro
gestantes sin suplemento de hierro
10% de lasde los menores de 3 años
sin adecuados controles de crecimiento y desarrollo
46% de las
embarazadas presentan
anemia
29%
ALTo CosTo soCIAL y NACIoNAL DE LADEsNUTRICIÓN CRÓNICA INfANTIL
NUTRICIÓN
Figure C: Advocacy brochure developed by IDI that highlights achievements and remaining gaps in nutrition
COMPARATIVOANUAL
COMPARATIVOMETA 2021
Porcentaje
Se centran en lasoportunidades para
las siguientesgeneraciones,mejorando las
condiciones de vidaen la población.
(*)
NACIONAL REGIONAL
Pobreza extrema 1/
Pobreza total urbana 1/
Pobreza total 1/
Tasa de asistencia de niñas y niños de 3 a 5años en algún nivel de la EBR 1/Porcentaje de desnutrición crónica demenores de 5 años 2/Anemia en niñas y niños de 6 a 36 meses deedad 2/Porcentaje de adolescentes entre 15 y 19 añosembarazadas o con hijos 3/
Hogares con paquete integrado de servicios 1/
Porcentaje de hogares con acceso a agua porred pública o pilón 1/ 82.04
55.89
22.80
44.63
19.26
90.60
39.71
33.23
11.46
87.93
69.72
13.60
43.59
13.12
85.92
20.74
14.93
3.77
Seleccionar DepartamentoAMAZONAS
Fuente: 1/ ENAHO 2016 (INEI),2/ ENDES 2016 (INEI) y 3/ ENDES 2015 (INEI)Nota:El color del semáforo comparativo anual refleja la tendencia positiva o negativa los últimos dos años consecutivos.El color del semáforo comparativo meta refleja la tendencia positiva o negativa del indicador entre el último año de la información disponible y la meta 2021.(*) Estimación considerando los años 2014-2015.
THE PROCESSES AND STRUCTURESPeru’s national information system has been reshaped over the past six years to provide more useful, timely and reliable data on key indicators of program implementation and results achieved. Program logic models have been useful in bringing the various sectors together to clearly defi ne the results chain from supply to service delivery to coverage and impact, reducing the number of indicators monitored regularly, and disaggregating results down to the local level, which are updated daily (see Figure D). The ability for administrators to access this real-time information on program performance at each step of the process has resulted in more proactive problem-solving and responsive decision-making.
MIDIS has worked with the various sectors to establish agreements on how each performance indicator is defi ned, how often it is collected and how the information is shared across sectors. For example, the Ministry of Health tracks health facility service coverage through its Health Management Information System (HMIS), including key nutrition indicators such as iron supplementation coverage and growth monitoring. While most facilities report data on a monthly basis, a sub-group of health posts considered as sentinel sites report information on a daily basis to the national level. The General O� ce of Statistics and Informatics analyses the data quality and gives feedback to health posts through the regional o� ces, helping to decrease errors and inconsistencies in the data.
MIDIS administers an online platform called REDInforma that provides a secure space for each sector to share their database. Figure E provides an overview of how this central repository collects data
from various government sources and produces integrated reports for di� erent users. Linking information across administrative information systems is possible due to the establishment of a national birth registry that provides a validated and reliable identifi cation number for every child. Birth registry data has also improved program forecasts and budgeting, since they are no longer relying on out-of-date census projections to estimate population targets.
Population-level data on nutrition outcomes are measured annually since 2004 as part of the national population and family health survey (ENDESv, continuous DHS), led by the National Statistics and Information Institute (INEIvi) and fully institutionalized within the government’s operations.vii
MIDIS uses the information from sectoral monitoring systems (e.g. HMIS) and ENDES to design dashboard reports at regional, departmental and district levels, available online through REDinforma as a free, publicly accessible platform where anyone can download the latest reports. MIDIStrito was launched in 2016 to provide districts with quarterly progress reports, including general characteristics of the district, health and education indicators, and housing conditions.
Despite remarkable progress in improving information systems, building capacity to sustain and e� ectively use them is now recognized as an important gap to be fi lled. Although reports make information easily accessible in a timely manner at regional and local levels, there is weak operational capacity to use the information to strengthen actions and reach targets.
Espacio centralizado que almacena y mantiene bases de datos o archivos digitales, que provienen de diversas fuentes. Los datos deben ser previamente consensuados y homologados.
Se accede a la información por vía web para su uso público, basados en el principio de transparencia.
El repositorio facilita los procesos de:• Auto-archivo.• Interoperabilidad.• Libre acceso.• Preservación a largo plazo.
Repositorio Digital de Información Multisectorial (REDInforma)Figure E: Schematic of REDInforma data sources, processes and users
Figure D: Logic model for anemia control program – each box is associated with a report (available online) on the current data for that level of implementation
Regional Liaison Teams provide support and technical advice to lower levels of government who are responsible to design and implement their own programmes, and the MOH provides training and support to health sta� and statisticians at both the national and regional levels. Regional consultants use the dashboard reports produced by MIDIS to discuss results with regional and local level stakeholders and encourage problem-solving. However, specifi c investment in both human resources and infrastructure is needed. Although the system is well-organized at the national level, local level health posts are often under-resourced and utilizing out-of-date equipment and systems.
RECOMMENDATIONS FOR OTHER COUNTRIESThe Peru example underlines the importance of collecting national and subnational data, allowing for timely monitoring of key nutrition indicators. High-quality data can fl ag potential problems with program design and implementation.
• Availability of annual data on select results, coverage, and fi nancing is critical for enabling a collaborative approach to monitoring and to adjusting programs as required.
• Results based management has strengthened monitoring and evaluation system adherence, as stakeholders recognize the relevance and value of this information for decision-making.
• Regional and local level stakeholders need training and support to e� ectively utilize the results for designing and adjusting local programming.
• Making information available in the public sphere is useful for ensuring ongoing dialogue between government and civil society actors.
• Continuous surveys based on representative sampling methods are useful for verifying the quality of administrative registry data. The more confi dence that stakeholders have in the quality of this data, the more likely they are to use it.
• Consensus-building groups, such as Mesa, that bring government and civil society actors together to discuss progress based on information updates are helpful for encouraging continued dialogue and using the evidence for achieving both political and programmatic objectives.
• Establishing a national birth registry information system with a unique identifi cation number for each child has been instrumental in improving the coordination and quality of data in related information systems.
• Increasing the likelihood of lower levels of government accessing the information through di� erent incentives and capacity building initiatives is important. Tracking a small number of key performance indicators and presenting them in a user-friendly way - such as tra� c lights or happy/sad faces - can be helpful.
References and Notesi Strengthening the capacity of SUN countries to scale up nutrition
through learning routes: a pioneer project in Peru
ii Yosef & Goulden (2016) “Commitments and accountability: Peru’s unique nutrition journey”, in Nourishing Millions: stories of change in nutrition, ed. Gillespie, Hodge, Yosef & Pandya-Lorch. IFPRI: Washington DC.
iii Iniciativa contra la desnutricion infantile
iv La Mesa de Concertación para la Lucha Contra la Pobrezas
v Encuesta Demográfi ca y de Salud Familiar (ENDES)
vi Insituto Nacional de Estadistica e Informatica (INEI)
vii Rutstein, Shea O., and Ann Way. 2014. The Peru Continuous DHS Experience. DHS Occasional Papers No. 8. Rockville, Maryland, USA: ICF International.
AcknowledgementsThis case study was written by Kendra Siekmans, with input from Paola Victoria, Daniel Lopez de Romana Forga and Shannon King. Information and insights from interviews with Federico Amillas (Mesa), Jose Enrique Velasquez (MIDIS), and Karim Pardo (OGEI, MOH) are gratefully acknowledged. This work was supported by Nutrition International, formerly the Micronutrient Initiative (MI), under its DFID-supported Technical Assistance for Nutrition project.
September 2016
ENGAGE INSPIRE INVESTgovernments, civil society,
the UN system, donors, business and scientists
each other to discover new ways of working
collectively
in priority actions for everyone’s right to good nutrition
WHAT IS SCALING UP NUTRITION?The Scaling up Nutrition (SUN) Movement is a renewed effort to eliminate malnutrition, based on the principle that everyone has a right to food and good nutrition. The Movement’s vision is to, by 2030, ensure a world free from malnutrition in all its forms. Led by governments and supported by organisations and individuals – collective action ensures every child, adolescent, mother and family can realise their right to food and nutrition, reach their full potential and shape sustainable and prosperous societies. The Movement is unique by bringing different groups of people together – governments, civil society, the United Nations, donors, businesses and scientists. It is transforming the way in which people work together by empowering people to put in place effective systems and to increase investments. SUN Countries and their supporters are working towards the World Health Assembly targets on maternal, infant, and young child nutrition by 2025, in addition to relevant targets for preventing and controlling non-communicable diseases.
WHY NUTRITION?Today, more than one third of young children suffer from some form of malnutrition with devastating consequences for health, learning, future earning potential, economic development, resilience and security. There is strong evidence, mostly generated by economists, to show that eliminating malnutrition in young children has multiple benefits.1 It can:• Boost Gross National Product by 11% in Africa and
Asia• Prevent more than 1/3 of child deaths per year• Improve school attainment by at least one year• Increase wages by 5-50%• Reduce poverty as well-nourished children are
33% more likely to escape poverty as adults• Empower women to be 10% more likely to run
their own business• Break the inter-generational cycle of poverty
Because when…
1 2 3
Girls & women are well-nourishedand have healthynewborn babies
Children receive proper nutrition
and developstrong bodies
& minds
Adolescents learn better
& achieve higher grades
in school
Young adults are better able to
find work& earn more
Families & communities
emerge out of poverty
Communities & nations
are productive& stable
The world is a safe, more resilient & stronger place
WANT TO FIND OUT MORE?Go to www.scalingupnutrition.org
The SUN Movement Secretariat is supported by the Bill & Melinda Gates Foundation, Canada, the European Union, France, Germany, Ireland, and the United Kingdom. Human resource capacity has been made available by France. The activity plan and budget of the SUN Movement Secretariat supports the implementation of the SUN Movement Strategy and Roadmap (2016-2020).
57 countries are leadinga global movement to end malnutrition in all its forms.
1 Haddad, L. Child Growth = Sustainable Economic Growth: Why we should invest in nutrition. May 2013.
Fuente: Base de datos HIS (2014 - 2017).Información al mes de Mayo 2017.Fecha de actualización de la información: Julio 2017.Nota: La información considera enfermeros y enfermeras más técnicos sin restricción.
Nota: El semáforo es calculado en base número de EESS activos según RENAES.Fuente: Base de datos SISMED - MINSA (2016 - 2017 ).Información al mes de Julio 2017.Fecha de actualización de la información: 13.07.2017