38


1 7
NATIONAL N U T R I T I O N MONITORING BUREAU
Report for the year 1976
NATIONAL INSTITUTE OF NUTRITION Indian Counci l of Medical Research Hyderabad — 500 007.
1977


..2..
C O N T E N T S page No.
Page No.
I n t r o d u c t i o n ... 1
C o v e r a g e ... 2
Income status; Pattern of Food and Nutrient intake - Families ... 3
Average Nutrient intake of Individuals 8
Table - 1 Total coverage of population 10
Table - 2 Coverage during the year 11
Table - 3 Coverage of Districts 12
Table - 4 Distribution of H H by income 13
Table - 5 Daily Intake of foods per c.u. 14
Table - 6 Daily Intake of nutrients per c.u. 15
table - 7 Distribution of H H by Calorie
Protein adequacy ... 16
Table - 8 Nutrient intake of 1-4 years children 17
Table - 9 Nutrient intake of 4-7 years children 18
Table - 10 Nutrient Intake of 7-10 years children ... 19
Tablo -11 Nutrient intake of 10-13 years children ... 20
Table -12 Nutrient intake of 13-18 years Boys 21
Table -13 Nutrient intake of 13-18 years Girls 22
Table -14 Nutrient intake of Sedentary Males 23
Table -15 Nutrient intake of Moderately active
Males ••• 24
Table -16 Nutrient intake of NPNL Women 25
Table -17 Nutrient intake of lactating women 26
Deficiency Signs ••• 27
Anthropometry ••• 28
Gomez Classification; Seoane and Latham
Classification ... 30
PREVALENCE OF DEFICIENCY SIGNS
Table -18 I n f a n t s ... 32
Table -19 Preschool Children ... 33
Table -20 5-12 Years Children ... 34
Table -21 12 - 21 Years Males ... 35
Table -22 12 - 21 Years Females ... 36
Anthropometric Measurements by Age
Table -23 Kerala Males ... 37
Table -24 Kerala Females ... 38
Table -25 Tamil Nadu Males ... 39
Table -26 Tamil Nadu Females ... 40
Table -27 Karnataka Males ... 41
Table -28 Karnataka Females ... 42
Table -29 Andhra Pradesh Males ... 43
Table -30 Andhra Pradesh Females ... 44
..3..
Page No.
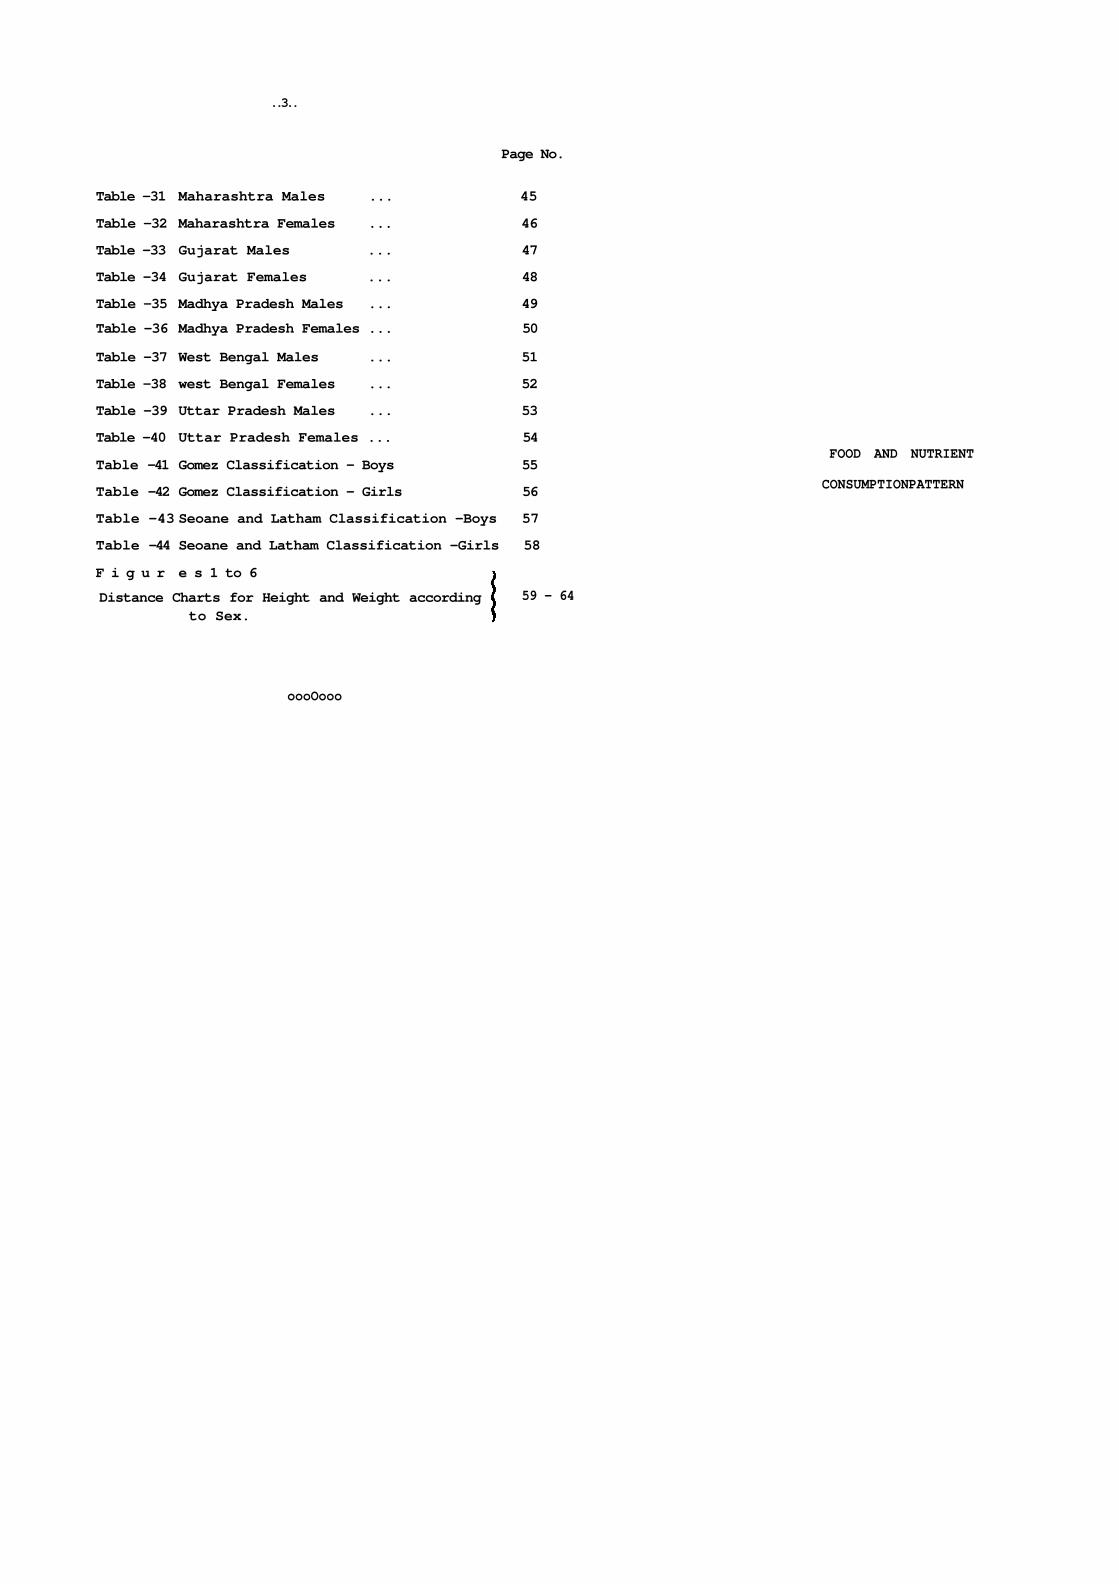
Table -31 Maharashtra Males ... 45
Table -32 Maharashtra Females ... 46
Table -33 Gujarat Males ... 47
Table -34 Gujarat Females ... 48
Table -35 Madhya Pradesh Males ... 49
Table -36 Madhya Pradesh Females ... 50
Table -37 West Bengal Males ... 51
Table -38 west Bengal Females ... 52
Table -39 Uttar Pradesh Males ... 53
Table -40 Uttar Pradesh Females ... 54
Table -41 Gomez Classification - Boys 55
Table -42 Gomez Classification - Girls 56
Table -43 Seoane and Latham Classification -Boys 57
Table -44 Seoane and Latham Classification -Girls 58
F i g u r e s 1 to 6
FOOD AND NUTRIENT
CONSUMPTIONPATTERN
Distance Charts for Height and Weight according to Sex.
59 - 64
oooOooo
A National Nutrition Monitoring Bureau was
set up in June 1972 by the Indian Council of Medical
Research with a view to collecting information on
nutritional status and dietary habits of different
representative segments of the population making use
of standardized procedures and techniques. The
National Institute of Nutrition is the Central Reference
Laboratory which is responsible not only for technical
guidance and coordination of the state units, but also
for analysis and interpretation of data. The aims and
objectives of the Bureau have already been reported
(Plan of Operation, NNMB - 1972).
Data on food consumption and nutritional status
of population from the States of Andhra Pradesh,
Gujarat, Karnataka, Kerala, Madhya Pradesh, Maharashtra,
Tamil Nadu, Uttar Pradesh and West Bengal, have been
collected. Table-I gives the cumulative coverage of
households for dietary and nutrition surveys, since
inception of the Bureau, i.e. 1972. The results of the
analysis of the data collected from the regional units
for the previous years with respect to rural households
have been already reported (NNMB - Interim Report, 1974,
NNMB Reports 1975 and 1976).
This year, the report is presented in two separate
sections. Section-I provides results of the analyses
of the data according to States, while in Section-II
2
district-wise information on diet and nutrition
consumption pattern across different income groups
has been given. This Section is mainly intended for
the use of regional units and no attempt has been made
to interpret the results of district data at this
stage of analysis.
COVERAGE
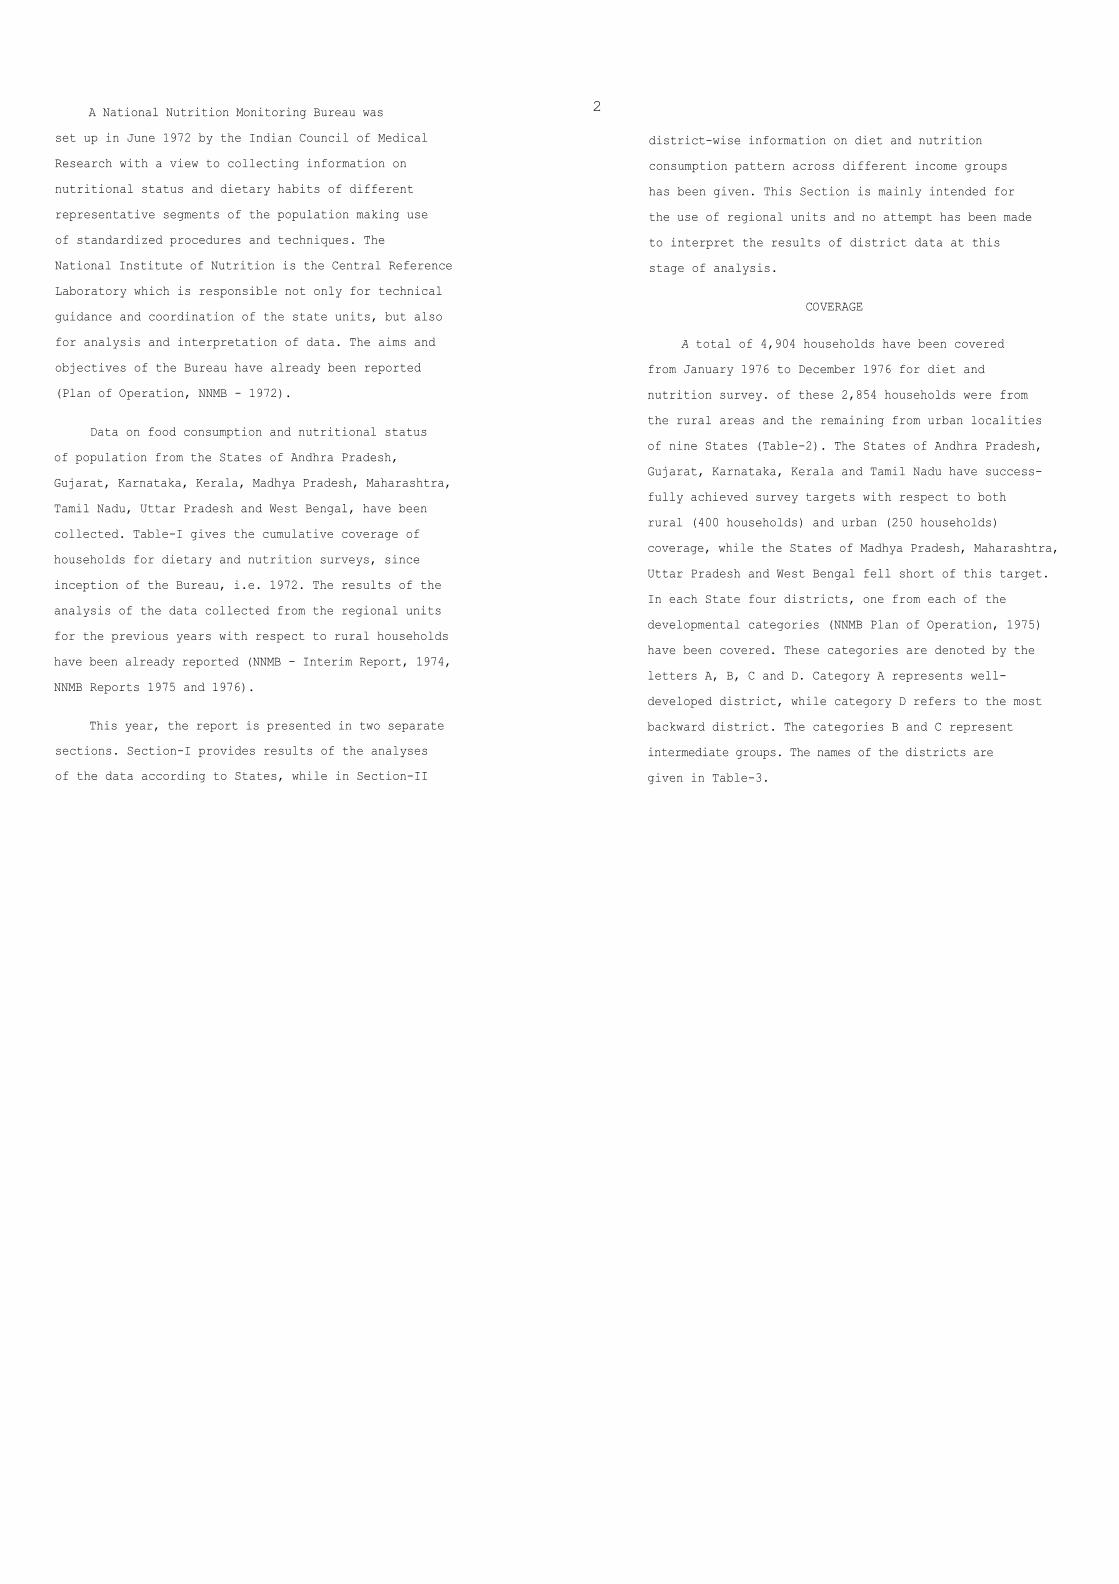
A total of 4,904 households have been covered
from January 1976 to December 1976 for diet and
nutrition survey. of these 2,854 households were from
the rural areas and the remaining from urban localities
of nine States (Table-2). The States of Andhra Pradesh,
Gujarat, Karnataka, Kerala and Tamil Nadu have success-
fully achieved survey targets with respect to both
rural (400 households) and urban (250 households)
coverage, while the States of Madhya Pradesh, Maharashtra,
Uttar Pradesh and West Bengal fell short of this target.
In each State four districts, one from each of the
developmental categories (NNMB Plan of Operation, 1975)
have been covered. These categories are denoted by the
letters A, B, C and D. Category A represents well-
developed district, while category D refers to the most
backward district. The categories B and C represent
intermediate groups. The names of the districts are
given in Table-3.

3
INCOME STATUS
The distribution of householdes, according to
daily per capita income, showed that, a third of the
households surveyed had an income less than a rupee.
(Table-4). About 68% had per capita daily income
below Rs.2/-. only 7% of the households surveyed had
daily income of Rs.5/- or more per caput. The income
distribution of households surveyed during the year
was similar to that observed last year, i.e. 1976.
PATTERN OF FOOD AND NUTRIENT INTAKE
FAMILY DIETS : Tables 5 and 6 give the average intake
of foodstuffs and nutrients per c.u. per day based on
family diet surveys (one day weighment method).
FOODSTUFFS: (Table-5)
Cereals and Millets: Highest consumption of
cereals and millets was seen in the State of Karnataka
(723 g.) while the lowest was observed in Kerala (328 g.).
In general, the consumption levels in all the States
were similar to those obtained in the previous year,
i.e. 1976, except in Kerala and Uttar Pradesh. In Kerala,
the intake was less by 60 g., while in Uttar Pradesh
it was less by 100 g., as compared to last year. However,
the reasons for these observed differences in these two
States are not clear.
PULSES: The mean intake of pulses ranged from 15 g.,
in Kerala to 65 g., in Uttar Pradesh. Out of the 9 States
4
surveyed, the intake was more than SO g. per c.u. per
day in Uttar Pradesh, Karnataka, Madhya Pradesh and
west Bengal. However, in all the States, the pulse
intake was below the suggested level of 75 g. The
consumption level observed in this year, compared well
with levels of intake seen in the previous year, except
in west Bengal where a three-fold increase was noticed
during the current year. This enormous increase could
be explained by the fact that in Malda District of
West Bengal, nearly a third of households (i.e. 15 out
of 43) showed an excessive consumption of kesari dal
and lentil. The increased consumption of pulses in
those households was accompanied by reduction in cereals.
The pattern and consumption levels of other
foodstuffs during the year did not show significant
changes as compared to last year. In all the States,
the consumption of all other food items were well below the
suggested levels (ICNR. Balanced Diet).
NUTRIENTS
Based on family diet surveys, the average nutrient
intakes in different States per c.u. per day were
calculated. These have been presented in Table-6.

5
PHOTEIN
The average intake of protein per c.u. per day
was found to be well above the recommended levels in
all the States except in Kerala. The intake in Tamil Nadu
was around the recommended level of 55 g. per c.u. per day
The pattern of intake of protein in all the States
was found to be similar to that observed in earlier
years except in west Bengal where the intake was more
by 12 g. during the current year. The reason fox the
above exception may be the higher levels of consumption
of pulses like Kesari Dal and lentil in some of the
households of Maida District as stated earlier.
CALORIES
The mean intake of calories per c.u. per day
ranged from 2052 in Kerala to 3058 in Karnataka. The
States of Karnataka, Andhra Pradesh, Madhya Pradesh and
West Bengal met the calorie requirement of 2,400 per
c.u. per day, while in the remaining States, varying
degrees of deficits in calories were observed. The
deficits ranged from 4% in Maharashtra to 15% in Kerala.
The pattern of calorie consumption in all the States
remained similar to that observed in the previous year
except in Uttar Pradesh, where a reduction of about 200
calories and in Nest Bengal, where an increase of 200
calories was observed. These differences could be
3
6
explained on the basis of decreased cereal intake in
Uttar Pradesh and increased intakes of cereals and
pulses in west Bengal.
MINERALS
IRON
The intake of Iron ranged from 21 mg. in Kerala
to 49 mg in Karnataka. Excepting Kerala all the other
States showed an intake which is above the average
recommended level of 25 mg per c.u. per day.
CALCIUM
In all the States, the average intake of calcium
was more than 500 mg. except in west Bengal and Uttar
Pradesh where the intake was around 440 mg per c.u. per
day.
VITAMINS
VITAMIN A :
In all the States diets provided inadequate amounts
of retinol. The lowest level of intake was observed in
Kerala ( 156 /ug ), while the highest level of 409 /ug
was seen in Maharashtra.
THIAMINE & RIBOFLAVIN :
The intake levels of thiamine and riboflavin
were found to be similar to those observed in the
previous year. Though the diets of all the States except
7
Kerala and Tamil Nadu, showed adequate levels of
Thiamine, the levels of riboflavin were uniformly low
per c.u. per day when compared to recommended allowances
for these vitamins.
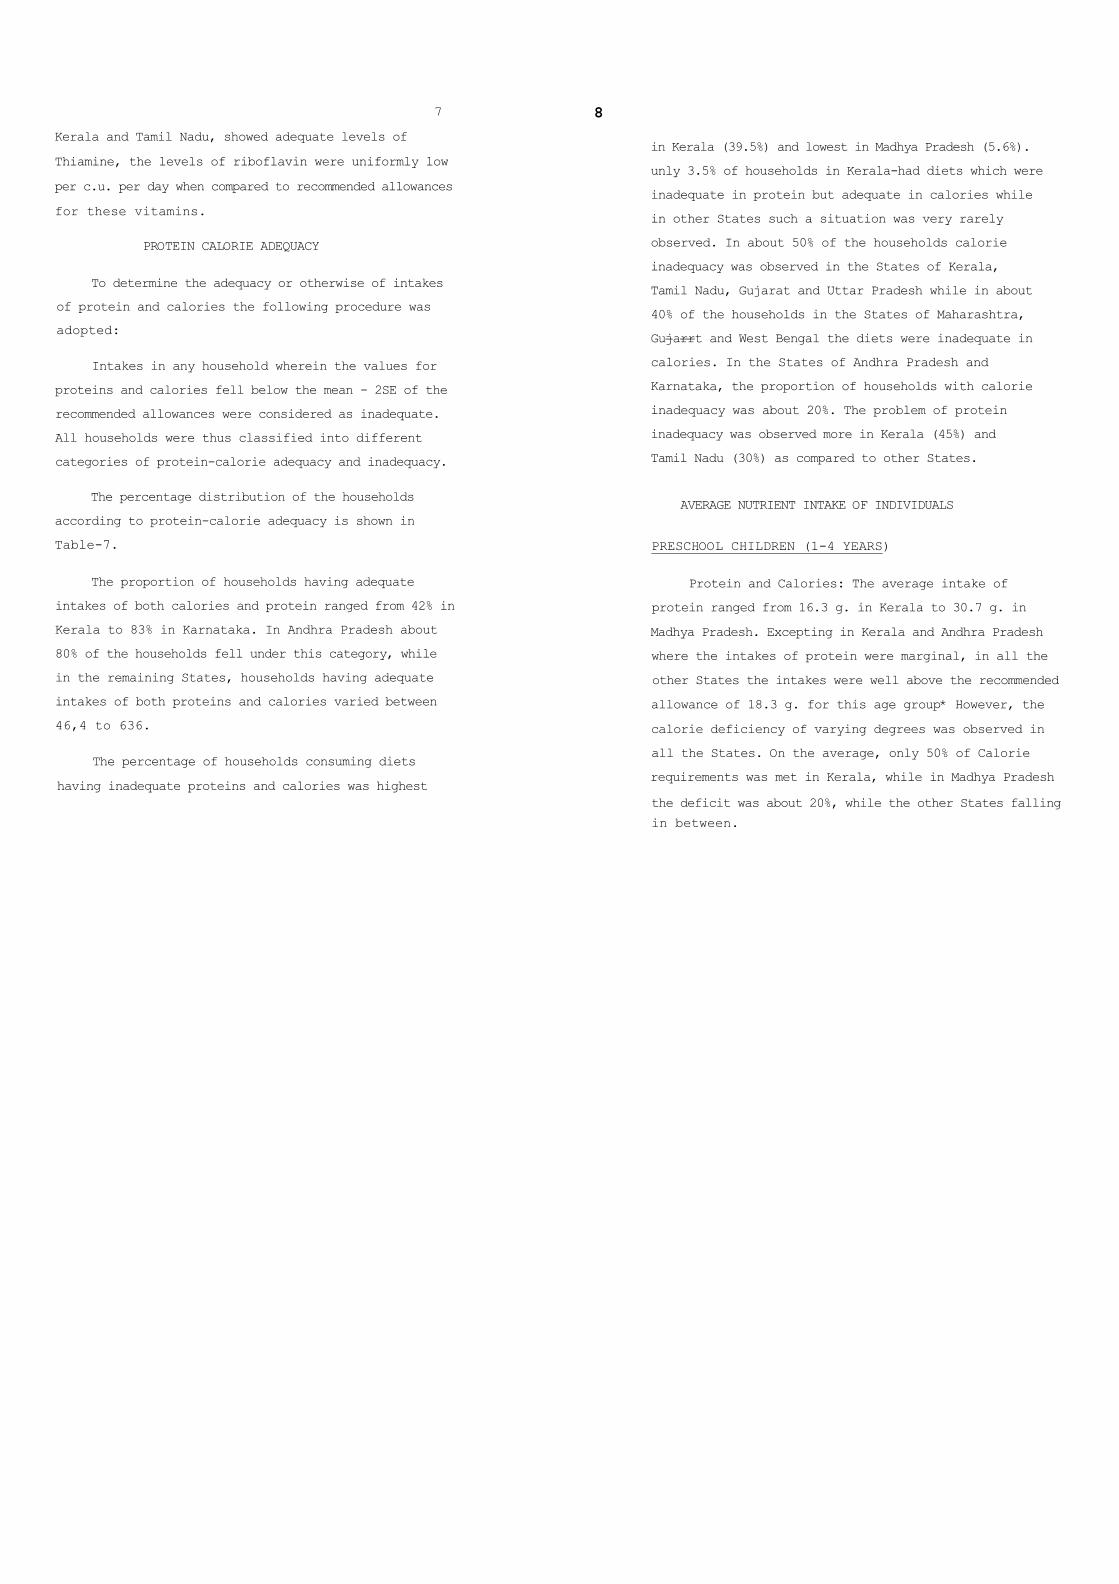
PROTEIN CALORIE ADEQUACY
To determine the adequacy or otherwise of intakes
of protein and calories the following procedure was
adopted:
Intakes in any household wherein the values for
proteins and calories fell below the mean - 2SE of the
recommended allowances were considered as inadequate.
All households were thus classified into different
categories of protein-calorie adequacy and inadequacy.
The percentage distribution of the households
according to protein-calorie adequacy is shown in
Table-7.
The proportion of households having adequate
intakes of both calories and protein ranged from 42% in
Kerala to 83% in Karnataka. In Andhra Pradesh about
80% of the households fell under this category, while
in the remaining States, households having adequate
intakes of both proteins and calories varied between
46,4 to 636.
The percentage of households consuming diets
having inadequate proteins and calories was highest
8
in Kerala (39.5%) and lowest in Madhya Pradesh (5.6%).
unly 3.5% of households in Kerala-had diets which were
inadequate in protein but adequate in calories while
in other States such a situation was very rarely
observed. In about 50% of the households calorie
inadequacy was observed in the States of Kerala,
Tamil Nadu, Gujarat and Uttar Pradesh while in about
40% of the households in the States of Maharashtra,
Gujarrt and West Bengal the diets were inadequate in
calories. In the States of Andhra Pradesh and
Karnataka, the proportion of households with calorie
inadequacy was about 20%. The problem of protein
inadequacy was observed more in Kerala (45%) and
Tamil Nadu (30%) as compared to other States.
AVERAGE NUTRIENT INTAKE OF INDIVIDUALS
PRESCHOOL CHILDREN (1-4 YEARS)
Protein and Calories: The average intake of
protein ranged from 16.3 g. in Kerala to 30.7 g. in
Madhya Pradesh. Excepting in Kerala and Andhra Pradesh
where the intakes of protein were marginal, in all the
other States the intakes were well above the recommended
allowance of 18.3 g. for this age group* However, the
calorie deficiency of varying degrees was observed in
all the States. On the average, only 50% of Calorie
requirements was met in Kerala, while in Madhya Pradesh
the deficit was about 20%, while the other States falling
in between.

9
Minerals & Vitamins (Table-8)
Intakes of IRON were low in all the States, the
lowest being in Kerala. In respect of CALCIUM, the
intakes were far below the recommended allowance of
450 mg. for this age group, in all the states excepting
in Tamil Nadu and Karnataka where the intakes were 410 mg
and 448 mg. respectively (Table-8).
The intakes of VITAMIN A were low in all the States
excepting in Gujarat and weat Bengal where the intakes
were 552 /ug and 261 /ug respectively. However, in
Kerala, Tamil Nadu and Andhra Pradesh they were found to
be low. The intakes of THIAMINE met the requirement
level in all the States, while the intakes of RIBOFLAVIN
did not meet the recommended allowance in any of the
states (Table-8).
The nutrient intakes of various other age and sex
groups have been given in Tables 9 to 17. It may
generally be mentioned that the diets in all the age
groups with a few exceptions seem to contain adequate
amounts of protein while they are deficient in
calories.
The protein deficiency was, however, associated with
calorie indequacy and making good of calorie deficit in
the diets of these groups will automatically bridge the
protein gap as well. The diets were also found to be
deficient particularly in vitamin A, riboflavin and
calcium in most of the States. The intakes of iron and
thiamine appeared to satisfy the requirement level.
10
Individuals covered for
nutritional assessment
11,952
8,376
12,138
11,922
9,300
13,710
9,498
8,946
6,510
92,352
Total
1,992
1,396
2,023
1,987
1,550
2,285
1,583
1,491
1,085
15,392
Urban
750
551
682
589
650
677
450
400
215
4,964
COVERAGE OF HOUSEHOLDS FOR
DIET SURVEY
Rural
1,242
345
1,341
1,398
900
1,608
1,133
1,091
870
10,428 ,
STATE
Kerala
Tamil Nadu
Karnataka
Andhra Pradesh
Maharashtra
Gujarat
Madhya Pradesh
West Bengal
Uttar Pradesh
Tota
l
Table-1
NNMB -
TOTAL
COVERAGE OF POPULATION
(Till the end of December, 1976)
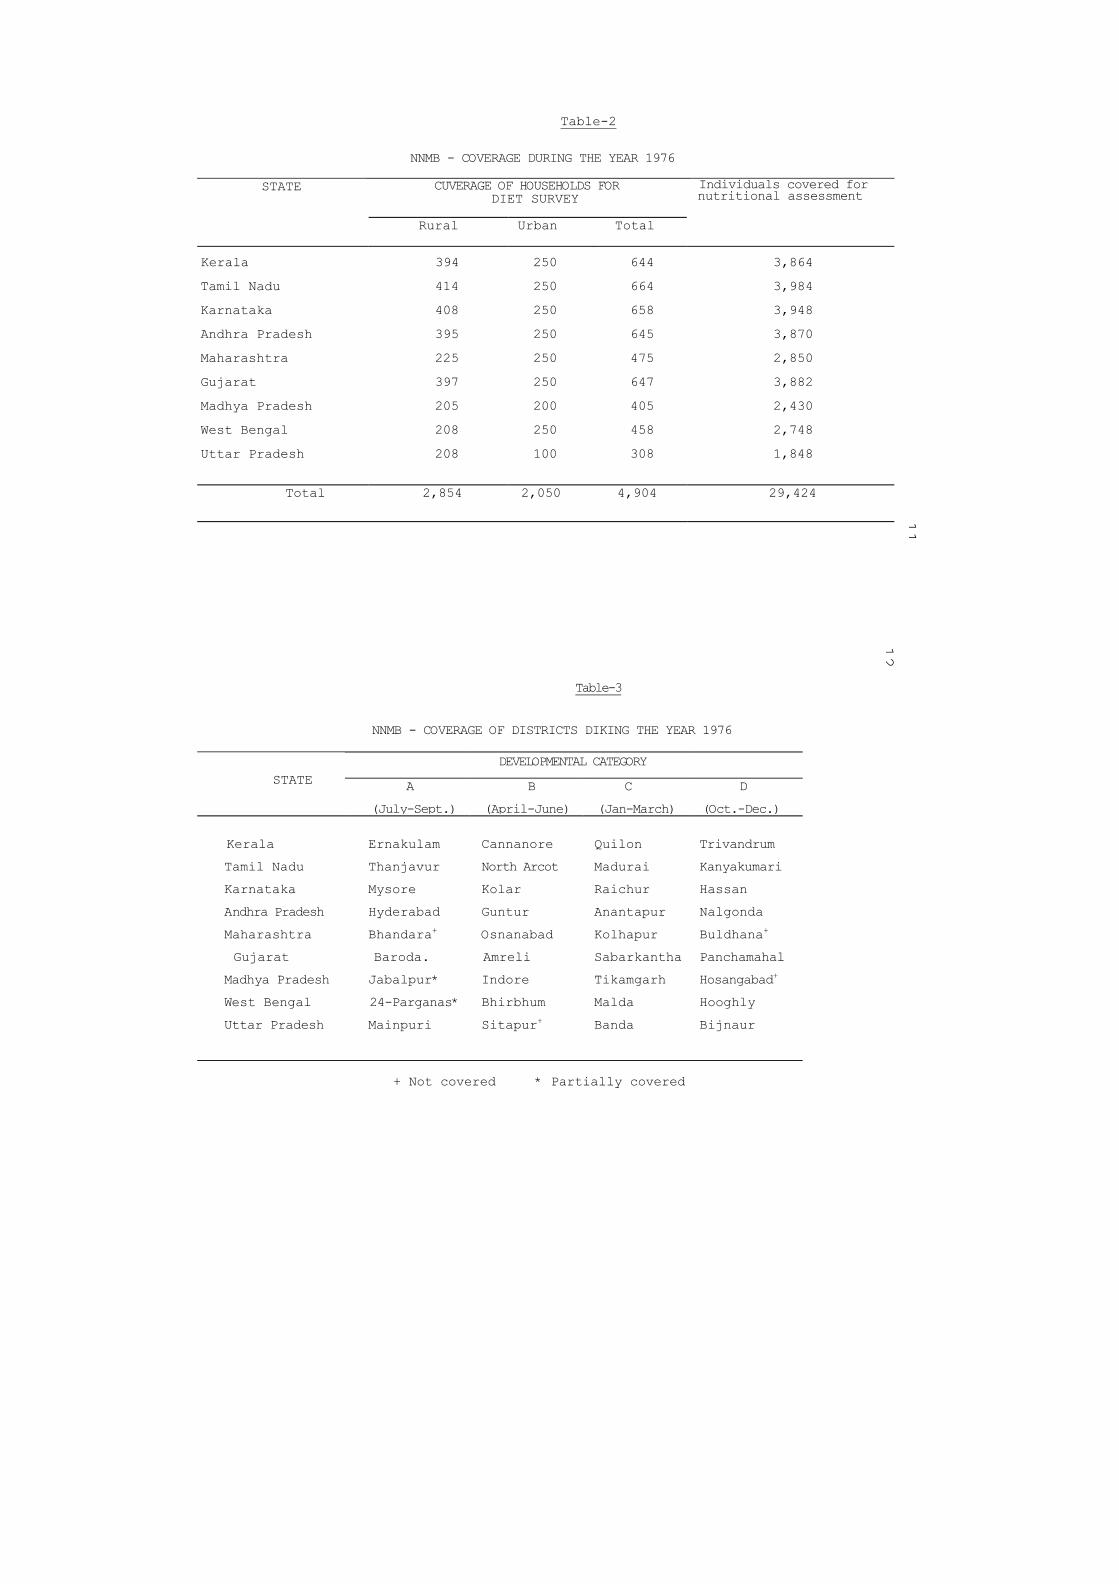
Table-2
NNMB - COVERAGE DURING THE YEAR 1976
CUVERAGE OF HOUSEHOLDS FOR DIET SURVEY
STATE
Rural Urban Total
Individuals covered for nutritional assessment
Kerala
Tamil Nadu
Karnataka
Andhra Pradesh
Maharashtra
Gujarat
Madhya Pradesh
West Bengal
Uttar Pradesh
394
414
408
395
225
397
205
208
208
250
250
250
250
250
250
200
250
100
644
664
658
645
475
647
405
458
308
3,864
3,984
3,948
3,870
2,850
3,882
2,430
2,748
1,848
Total 2,854 2,050 4,904 29,424
11
12
Table-3
NNMB - COVERAGE OF DISTRICTS DIKING THE YEAR 1976
DEVELOPMENTAL CATEGORY STATE A
(July-Sept.)
B
(April-June)
C
(Jan-March)
D
(Oct.-Dec.)
Kerala
Tamil Nadu
Karnataka
Andhra Pradesh
Maharashtra
Gujarat
Madhya Pradesh
West Bengal
Uttar Pradesh
Ernakulam
Thanjavur
Mysore
Hyderabad
Bhandara+
Baroda.
Jabalpur*
24-Parganas*
Mainpuri
Cannanore
North Arcot
Kolar
Guntur
Osnanabad
Amreli
Indore
Bhirbhum
Sitapur+
Quilon
Madurai
Raichur
Anantapur
Kolhapur
Sabarkantha
Tikamgarh
Malda
Banda
Trivandrum
Kanyakumari
Hassan
Nalgonda +Buldhana
Panchamahal +Hosangabad
Hooghly
Bijnaur
+ Not covered * Partially covered

Table-4
NNMB - PERCENT DISTRIBUTION OF HOUSEHOLDS ACCORDING TO DAILY PER CAPITA INCOME
Income Category Year
Less than Re.1 Rs. 1 - 2 Rs. 2 - 5 RS. 5 & more
1975
1976
41.6
33.4
32.2
34.3
20.9
25.2
5.3
7.1
Total 37.5 33.3 23.1 6.2
Table-5
NNMB - AVERAGE INTAKE OF FOODSTUFFS (GRAMS/CONSUMPTION UNIT PER DAY)
State
Total cerealsand
milleta
PulsesLeafyVege-tables
OtherVege-tables
Roots and
Tubers
Nuts and oil seeds
Condi-mentsand
spices
Fruits FishOtherfleshfoods
Milk&
milkpro-duct
Fatsandoils
Sugarand Jag- gary
Kerala
Tamil Nadu
Karnataka
Andhra
Pradesh
Maharashtra
Gujarat
Madhya
Pradesh
West Bengal
Uttar
Pradesh
328
479
723
594
492
447
488
554
460
15
35
64
34
42
30
54
52
65
3
7
7
6
23
8
5
27
20
79
62
22
40
35
56
35
78
51
166
58
24
33
15
34
58
87
66
76
12
5
3
5
5
-
-
-
14
20
27
23
12
4
9
5
1
26
14
6
23
14
12
24
12
5
36
12
*
6
-
1
-
12
2
*
7
*
4
2
*
3
7
-
44
95
81
103
134
190
146
47
85
5
10
6
13
14
16
21
9
3
19
20
35
11
30
27
30
18
9
* Less than one great
13
14

NNBM - AVERAGE INTAKE OF DIFFERENT NOIRIENTS PER C.U. PER DAY
State Protein(9) Calories Calciue
(mg) Iron Vitamin A
(ug) (Retinol)
Thiamin(mg)
Riboflavin(mg)
Nicotinicacid (mg)
Vitamin C (mg)
Kerala
Tamil Nadu
Karnataka
Andhra Pradesh
Mahazashtra
Gujarat
Madhya Pradesh
West Bengal
Utter Pradesh
Recommonded intake (ICMR 1968)
46.9
54.5
80.9
62.9
65.9
64.5
76.0
67.6
70.2
55.0
2052
2249
3058
2569
2315
2146
2393
2473
2064
2400
516
546
1375
624
641
546
561
442
437
400-500
21.1
26.0
49.4
30.7
35.6
24.7
32.2
32.9
30.5
20-30
156
222
263
284
409
284
368
342
308
750
0.75
0.90
2.57
1.15
1.92
1.92
2.41
1.32
2.12
1.20
0.75
0.76
1.28
0.85
1.03
1.08
1.39
0.89
1.17
1.30
11.5
12.4
16.6
15.4
16.7
14.8
23.9
18.2
19.7
16.0
74
42
22
30
33
35
31
57
42
50
Table-7
NNMB- PERCENT DISTRIBUTION OF HOUSEHOLDS ACCORDING TO PROTEIN-CALORIE INADEQUACY
State PI CI PI PA
CI PA CA PI CI
Kerala 39.5 3.5 14.6 42.4 43.0 54.1
Tamil Nadu 29.4 0.6 19.1 50.9 30.0 48.5
Karnataka 7.7 - 9.2 83.1 7.7 16.9
Andhra Pradesh 12.4 0.6 8.3 78.7 13.0 20.6
Maharashtra 20.7 - 22.9 56.4 20.7 43.6
Gujarat 10.1 - 41.0 48.9 10.1 51.1
Madhya Pradesh 5.6 - 31.9 62.5 5.6 37.5
West Bengal 17.2 - 21.5 61.3 19.2 38.7
U.ttar Pradesh 13.4 - 40.2 46.4 13.4 53.6
PI - Protein Inadequacy
CI - Calorie Inadequacy
PA - Protein Adequacy
CA - Calorie Adequacy
15
16
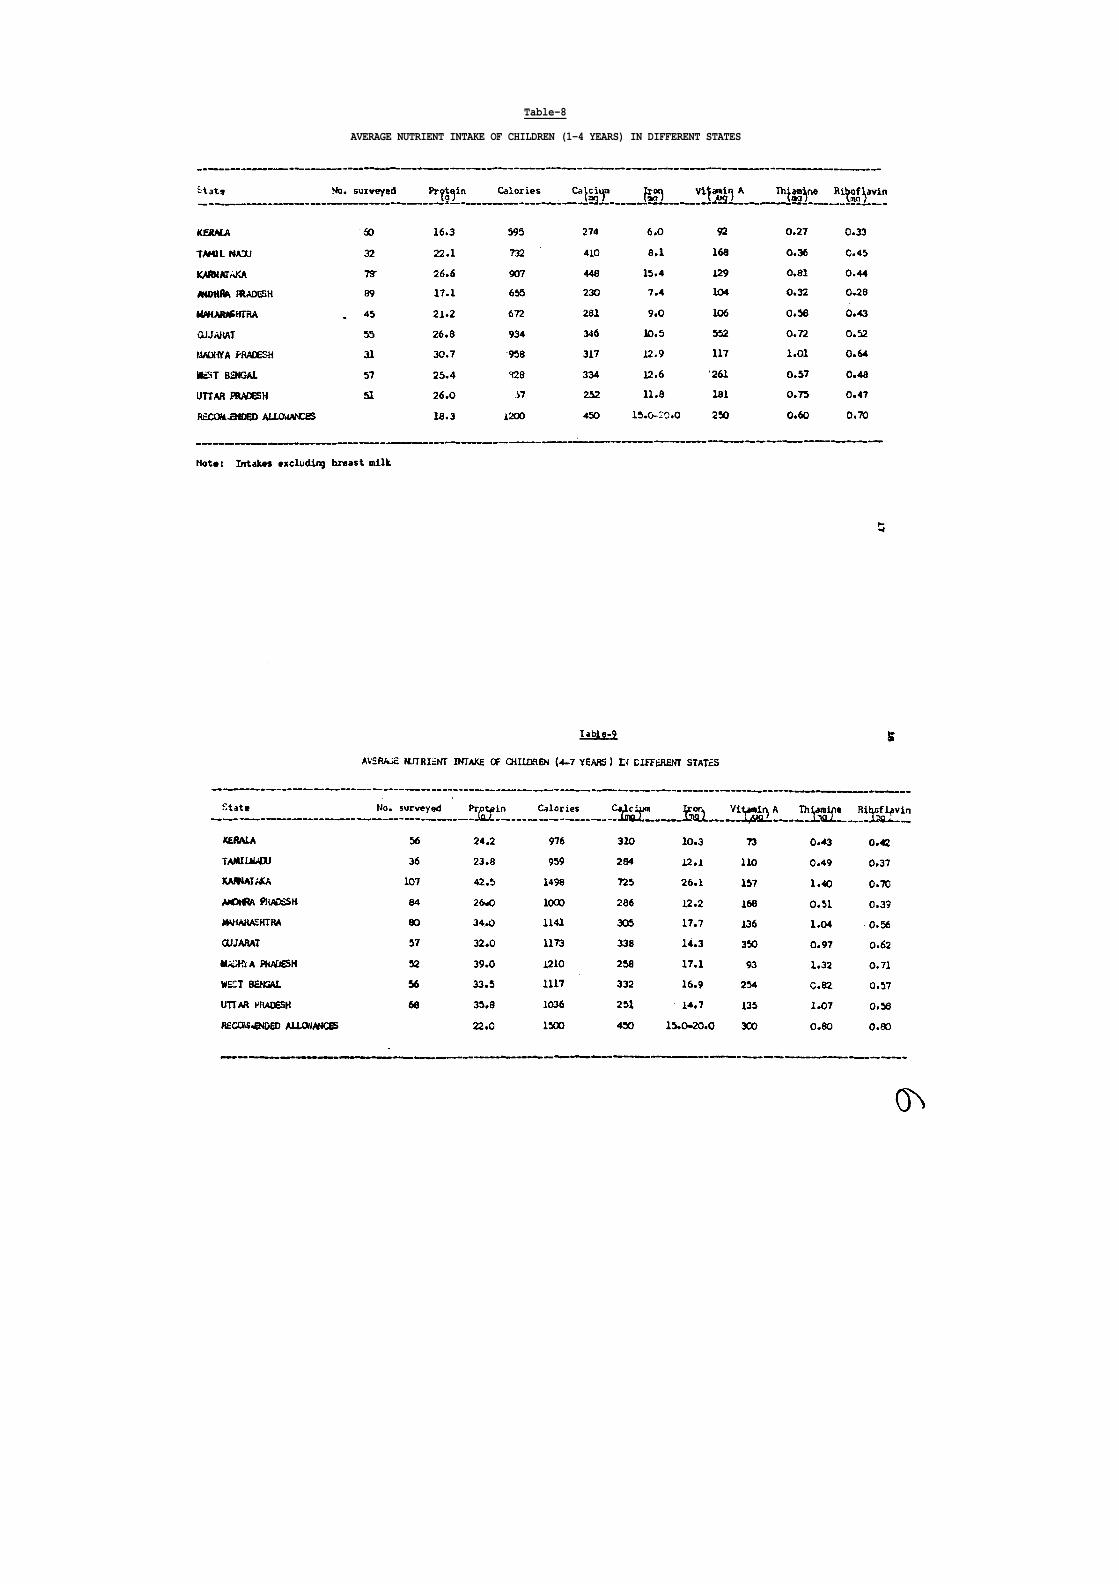
Table-8
AVERAGE NUTRIENT INTAKE OF CHILDREN (1-4 YEARS) IN DIFFERENT STATES
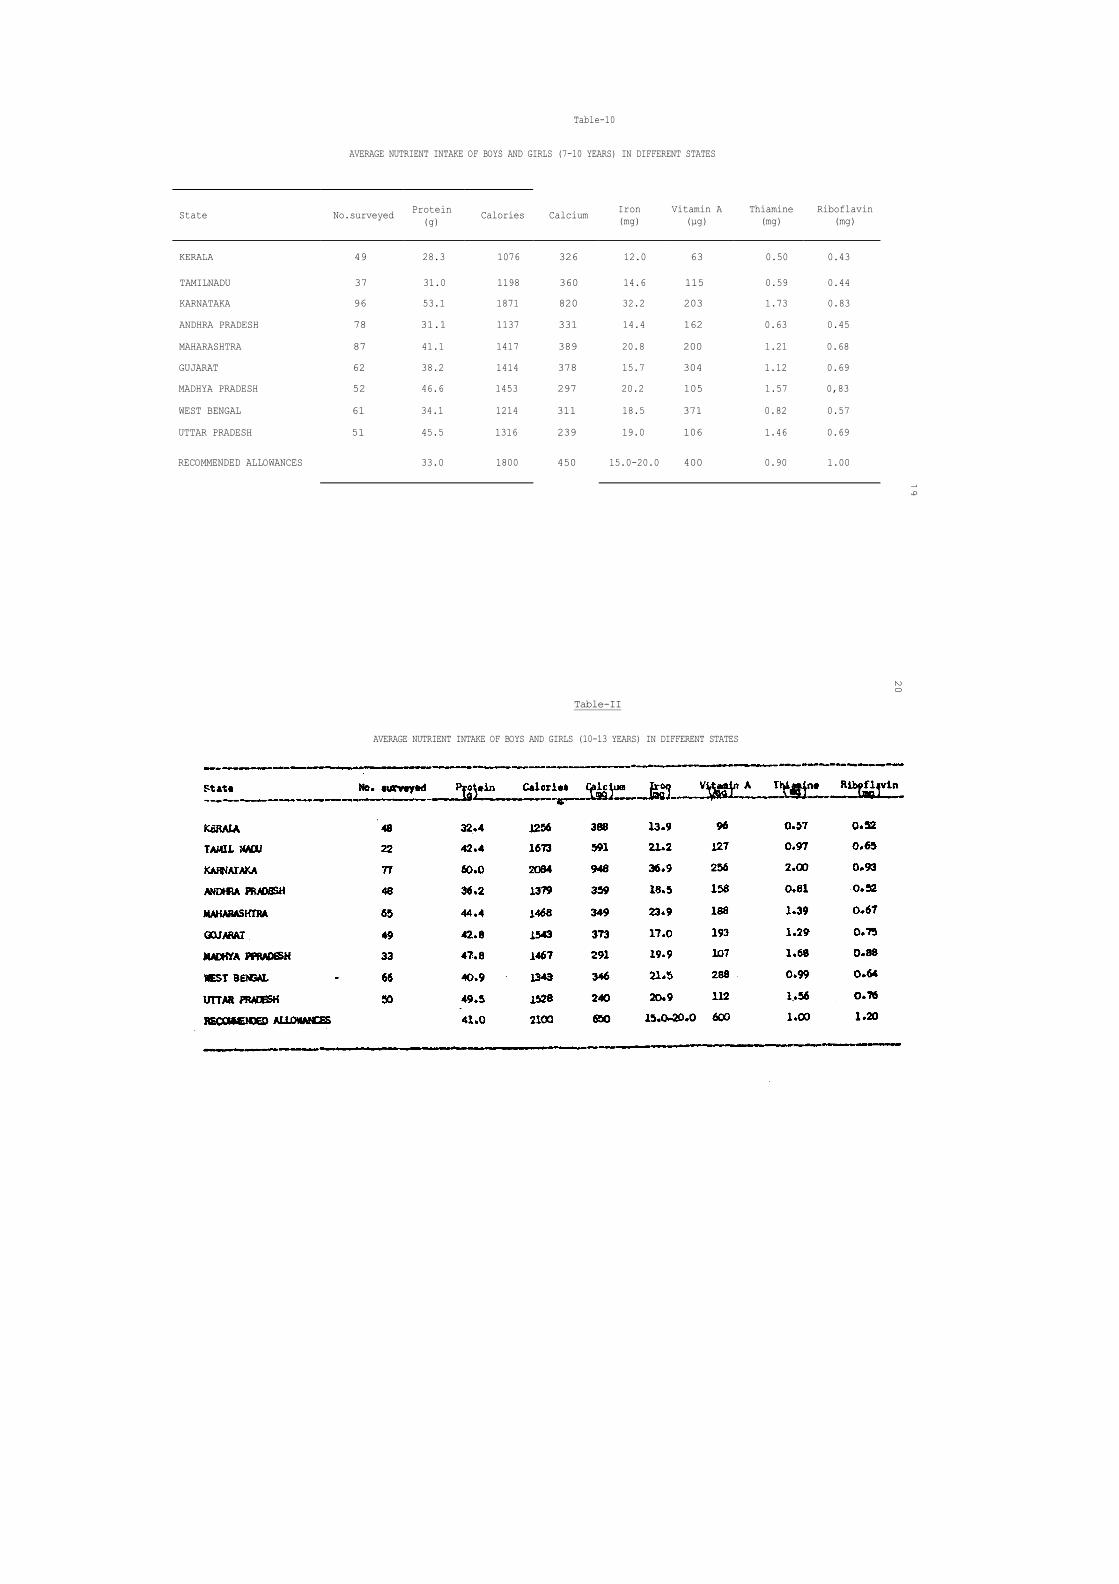
Table-10
AVERAGE NUTRIENT INTAKE OF BOYS AND GIRLS (7-10 YEARS) IN DIFFERENT STATES
State No.surveyed Protein (g) Calories Calcium Iron
(mg) Vitamin A
(μg) Thiami ne(mg)
Riboflavin(mg)
KERALA 49 28.3 1076 326 12.0 63 0.50 0.43
TAMILNADU 37 31.0 1198 360 14.6 115 0.59 0.44
KARNATAKA 96 53.1 1871 820 32.2 203 1.73 0.83
ANDHRA PRADESH 78 31.1 1137 331 14.4 162 0.63 0.45
MAHARASHTRA 87 41.1 1417 389 20.8 200 1.21 0.68
GUJARAT 62 38.2 1414 378 15.7 304 1.12 0.69
MADHYA PRADESH 52 46.6 1453 297 20.2 105 1.57 0,83
WEST BENGAL 61 34.1 1214 311 18.5 371 0.82 0.57
UTTAR PRADESH 51 45.5 1316 239 19.0 106 1.46 0.69
RECOMMENDED ALLOWANCES 33.0 1800 450 15.0-20.0 400 0.90 1.00 1
9
20
Table-II
AVERAGE NUTRIENT INTAKE OF BOYS AND GIRLS (10-13 YEARS) IN DIFFERENT STATES

Table—12
AVERAGE NUTRIENT INTAKE OF BOYS (13-18 YEARS) IN DIFFERENT STATES

Table-14
AVERAGE NUTRIENT INTAKE OF ADLT KALES (SEDENTARY) IN DIFFERENT STATES
State No.surveyed Protein(9) Calories Calclin
(mg) Iron (mg)
Vitamin A (μg)
Thiamina(mg)
Riboflavin(mg)
KERALA 52 53.9 1770 515 18.9 132 0.75 0.71
TAMIL NADU 43 56.4 2227 677 26.5 189 1.07 0.82
KARNATAKA 119 75.4 2811 1895 45.4 263 2.42 1.21
ANDHRA PRADESH 93 50.3 1961 521 21.8 226 0.86 0.69
MAHARASHTRA 123 66.9 2176 506 34.6 358 1.99 1.02
GUJARAT 102 61.5 2127 619 25.6 492 1.88 1.15
MADHYA PRADESH 75 66.6 1991 430 27.7 156 2.20 1.21
WEST BENGAL 37 57.6 2012 486 30.7 477 1.31 0.88
UTTAR PRADESH 86 77.1 2241 398 32.5 191 2.37 1.21
RECOMMENDS) ALLOWANCES 55.0 2400 450 20.0 750 1.20 1.30
Table-15
AVERAGE NUTRIENT INTAKE OF ADULT MALES (MODERATE) IN DIFFERENT STATES
State No. surveyed
Protein (g)
Calories Calciu m(mg)
Iron (mg)
Vitamin A (μg)
Thiamine(mg)
Riboflavin (mg)
KERALA 102 53.9 2037 614 23.0 230 0.95 0.84
TAMIL NADU 53 54.1 2278 765 29.6 170 1.20 0.80
KARNATAKA 113 78.9 2813 1095 48.6 262 2.67 1.20
ANDHRA PRADESH 78 49.4 1999 650 25.6 171 0.95 0.63
MAHARASHTRA 64 69.2 2270 484 39.1 291 2.20 1.00
GUJARAT 67 63.6 2164 468 26.0 201 1.97 1.01
NASHYA PRADESH 31 71.0 2087 371 33.2 144 2.59 1.26
WEST BENGAL 75 56.1 2052 395 30.7 439 1.26 0.82
UTTAR PRADESH 91 72.7 2159 380 32.3 310 2.34 1.17
RECOMMENDED ALLOWANCES 55.0 2800 490 20.0 750 1.40 1.50

Table-16
AVERAGE NUTRIENT INTAKE OF ADULT WOMEN IN DIFFERENT STATES
State No. surveyed Prote in(g) Calories Calciu m
(mg) Iron (mg)
Vitamin A(μg)
Thiamine (mg)
Riboflavin(mg)
KERALA 180 31.3 1365 362 14.6 93 0.59 0.54
TAMIL NADU 84 39.7 1669 689 22.0 113 0.93 0.63
KARANATAKA 172 75.6 2562 1145 46.4 322 2.54 1.17
ANDHRA PRADESH 169 47.5 1800 406 23.2 175 0.99 0.64
MAHARASHTRA 142 57.1 1912 342 33.2 229 1.86 0.81
GUJARAT 134 45.3 1607 351 18.0 200 1.22 0.71
MADHYA PRADESH 80 64.3 1875 357 27.8 122 2.26 1.30
WEST BENGAL 91 48.6 1642 429 39.3 856 1.40 0.84
UTTAR PRADESH 144 50.5 1480 395 31.9 680 1.69 0.93
RBCOMMENDED ALLOWANCES 45.0 1900 450 30.0 750 1.00 l.00
*NON-PREGNANT NON-LACTATING 2
526
Table-7
AVERAGE NUTRIENT INTAKE OF LACTATING WOMEN IN DIFFERENT STATES

27
NUTRITIONAL STATUS
A total of 17,862 subjects were examined for
the presence of nutritional deficiency signs and on
whom anthropometric measurements were also taken. of
these, about 3% were infants (less than one year), 13%
preschool children (1-5 years), 21% school aged
children (5-12 years), 20% adolescents (12-20 years)
and 43% adults (above 20 years).
DEFICIENCY SIGNS
MOST commonly observed nutritional disorders
were Calorie-Protein Malnutrition, Vitamin A and
B-complex deficiency and deficiency of essential fatty
acids (Tables 18 to 22). The signs of Calorie-Protein
Malnutrition were observed more frequently in infants
and preschool children, while those of vitamin
deficiencies in children of school age and adolescents.
Varying degrees, of dental caries were seen in the age
group beyond 5 years.
Protein Calorie Malnutrition
Clinical cases of kwashiorkor and marasmus/
emaciation were seen in almost all the States, except
in Madhya Pradesh in the present survey. Prevalence of
marasmic type of PCM was common in infants, while in
preschool children both the types of PCM, i.e. kwashiorkor
28
and marasmus were seen. The per cent prevalence of
frank cases of oedema and clinical marasmus was highest
in Uttar Pradesh as compared to other States. The point
prevalence of 2 or more clinical signs of PCM ranged from
0.5% in Maharashtra to 19.0% in Uttar Pradesh in the age
group of 1.5 years.
Vitamin deficiencies
Signs of vitamin A and B-complex deficiencies were
relatively more in preschool children as compared to
other age groups. The infants were found to be free from
Obvious manifestations of vitamin A and vitamin B-complex
deficiency signs. However, in Madhya Pradesh the prevalence
of 2.4% vitamin" A deficiency and in Karnataka and Andhra
Pradesh about 1.0% of B-complex deficiency was seen in
infants.
The prevalence of vitamin A deficiency signs ranged
from 0.7% in Kerala to 8,7% in Madhya Pradesh in pre-
school age group, while in school age group the prevalence
ranged from 0.8% in Maharashtra to 27.0% in Madhya Pradesh.
The prevalence of B-complex deficiency signs was highest
in Karnataka, while it was lowest in Maharashtra in both
preschool and school age groups.(Tables 19 & 22). It
may be mentioned here that in general, the prevalence
of B-complex deficiency signs indicated direct relationship
with the consumption of calories. In older age groups,
i.e. beyond 12 years, varying degrees of vitamin deficiency
signs were seen. However, the prevalence rates tended
to be more in males than in females.

29
ANTHROPOMETRY
Nutritional anthropometry is extensively used
in community nutritional surveys to assess the
nutritional status of population groups.On all the
individuals examined, measurements such as standing
height, body weight, mid arm circumference and fat
fold atriceps were obtained.
Means and standard deviations of an thropometric
measurements by age and sex for each State are presented
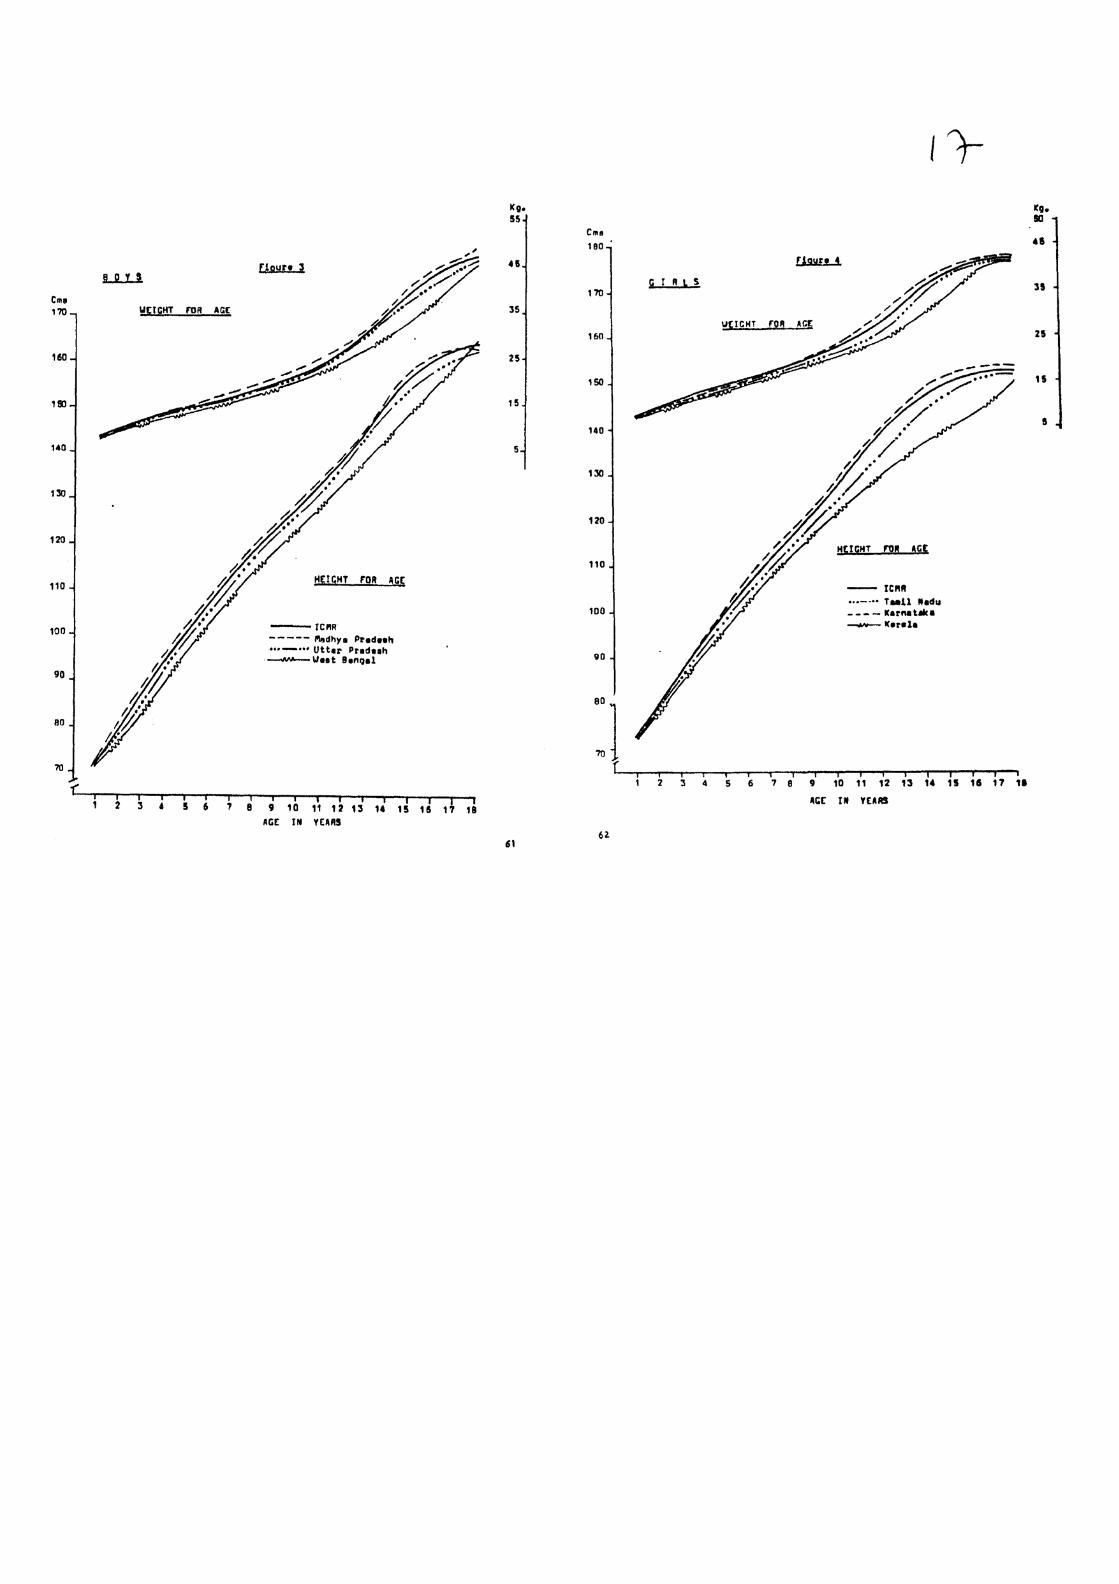
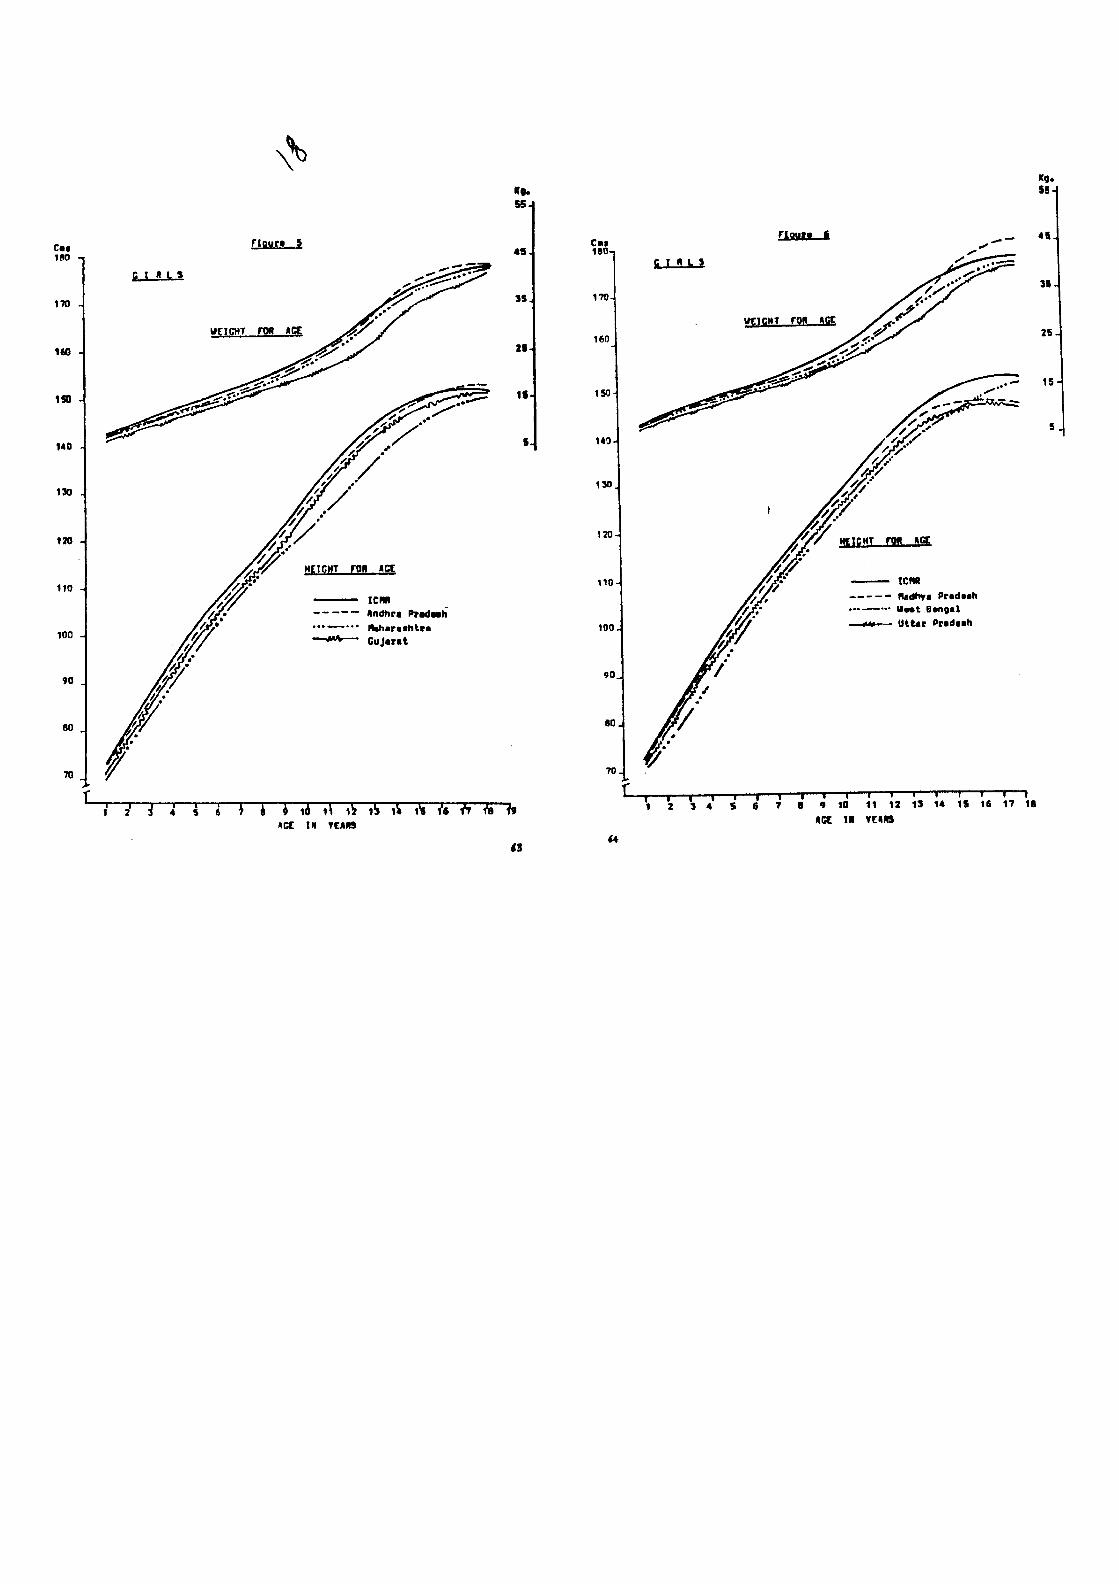
in Tables 23 to 40. The distance charts for heights
and weights are presented in figures. The growth
curves for the States of Kerala, Gujarat, Maharashtra,
west Bengal and Tamil Nadu fell below the 50th per
centile of Indian Council of Medical Research values,
while those of Andhra Pradesh, Karnataka and Uttar
Pradesh were comparable to the 50th percentile of
Indian Council of Medical Research data. However, the
differences in growth pattern were minimal during the
preschool age in all the States. This is, in fact,
confirmed when the body weights were classified according
to Gomez's classification (Table 41 & 42).The inter-state
differences in growth pattern increased with advancing
age.
30 PREVALENCE OF UNDERNUTRITION IN PRESCHOOL CHILDREN
USING ANTHROPOMETRY
Weight for age:
Underweight fox age has been considered as one
of the early objective signs of calorie-protein
Malnutrition. As such the weight of all the children
surveyed in different States were expressed as per-
centage of standard weights (Indian well-to-do) and
grouped into various grades of malnutrition (Gomez's
classification) Table 41 and 42.
About 10% of the children had normal body
weights. The proportion of children suffering from
mild and moderate degrees of malnutrition was found
to be similar (about 40% in each category). Severe
degree of malnutrition (weight below 60% of the
standard) was observed in 8.5% of the preschool children.
The degree of undernutrition was similar in boys and
girls. On the whole, the extent of undernutrition
was of the same order in different states. The extant
of undernutrition noticed during this year is quite
low as compared to last year figures (NNMB - 1976),
this difference is due to the fact that the American
Standard of reference was used in the previous year.
Distribution of children according to the
classification suggested by Seoane and Latham which

31
also indicates the type of malnutrition, whether it
is long term chronic or short term, etc., suggested
that nearly 25% of the boys surveyed were normal
(i.e. weight for age, height for age and weight for
height were normal). Another 28% suffered from
current long duration malnutrition, while about 3%
suffered from short term malnutrition. The remaining
43% were suffering from past chronic malnutrition and
could be considered as nutritional dwarfs, i.e. their
heights and weights were low for their age while the
weight for height values were normal.(Table-43). The
girls appeared to be slightly better off than the
boys (Table-44) when the above classification was used
to grade malnutrition.
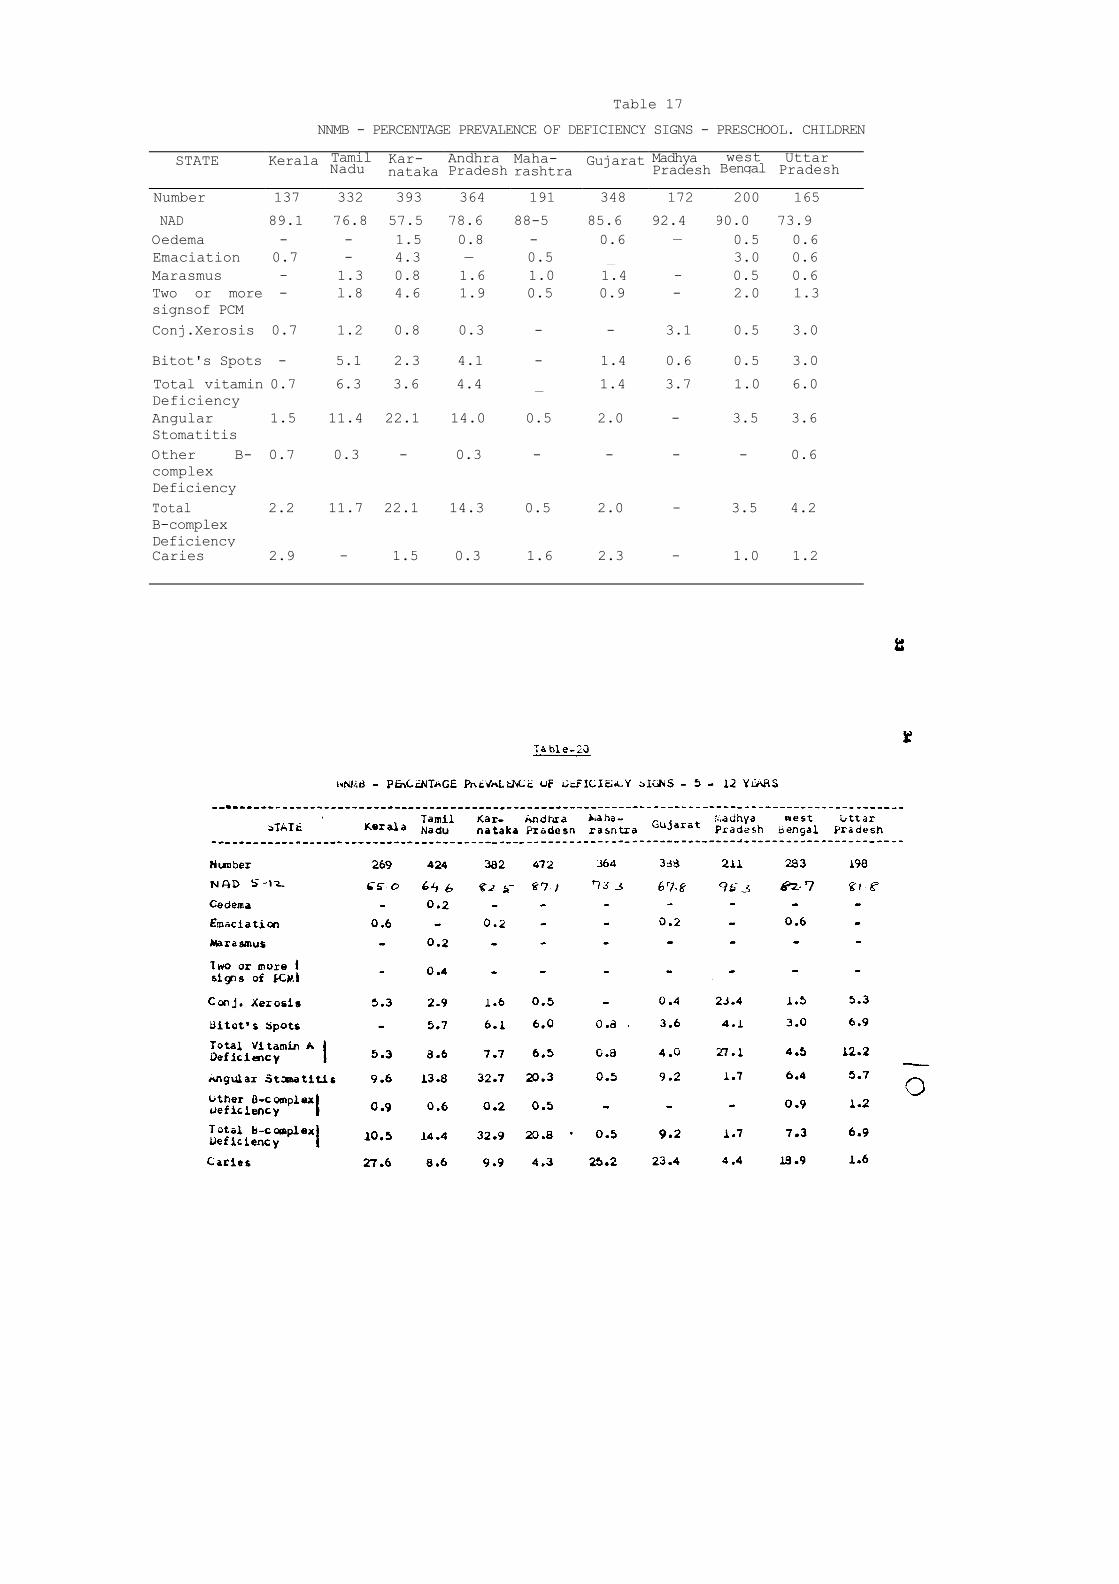
Table 17
NNMB - PERCENTAGE PREVALENCE OF DEFICIENCY SIGNS - PRESCHOOL. CHILDREN
STATE Kerala TamilNadu Kar- nataka
AndhraPradesh
Maha- rashtra
Gujarat Madhya Pradesh
west Bengal
Uttar Pradesh
Number 137 332 393 364 191 348 172 200 165
NAD 89.1 76.8 57.5 78.6 88-5 85.6 92.4 90.0 73.9 Oedema - - 1.5 0.8 - 0.6 — 0.5 0.6 Emaciation 0.7 - 4.3 — 0.5 _ 3.0 0.6 Marasmus - 1.3 0.8 1.6 1.0 1.4 - 0.5 0.6 Two or more signsof PCM
- l.8 4.6 1.9 0.5 0.9 - 2.0 1.3
Conj.Xerosis 0.7 1.2 0.8 0.3 - - 3.1 0.5 3.0
Bitot's Spots - 5.1 2.3 4.1 - 1.4 0.6 0.5 3.0
Total vitamin Deficiency
0.7 6.3 3.6 4.4 _ 1.4 3.7 1.0 6.0
Angular Stomatitis
1.5 11.4 22.1 14.0 0.5 2.0 - 3.5 3.6
Other B-complex Deficiency
0.7 0.3 - 0.3 - - - - 0.6
Total B-complex Deficiency
2.2 11.7 22.1 14.3 0.5 2.0 - 3.5 4.2
Caries 2.9 - 1.5 0.3 1.6 2.3 - 1.0 1.2

Table-21
NNMB - PERCENTAGE PREVALENCE OF DEF ICIENCY SIGNS - 12 - 21 YEARS MALES
STATE Kerala TamilNadu Kar-nataka
AndhraPradesh
Maha- rashtra Gujarat Madhya
PradeshWest
bengal Uttar Pradesh
Number 132 370 371 373 203 337 158 163 229
NND 12-21M 63.7 64.3 64.4 65.7 86.2 57.9 81.0 89.9 84.7
Conj.Xerosis 5.5 3.2 1.3 0.3 1.0 0.6 15.2 - 1.7
Bitot's Spots 0.5 5.4 5.9 5.6 0.5 5.6 1.3 0.9 Total Vitamin A | Deficiency | 6.0 8.6 7.2 5.9 1.5 6.2 16.5 - 2.6
Angular Stomatitis a.2 9.5 19.8 15.3 0.5 10.1 - 4.3 3.5
Other B-complex Deficiency 1.2 1.1 - O.3 - - - 1.2 2.6
Total B-complex Deficiency | 9.4 10.6 19.8 15.6 0.5 10.1 - 5.5 6.1
Caries 16.5 4.9 4.9 1.3 7.9 11.6 1.9 7.4 0.9

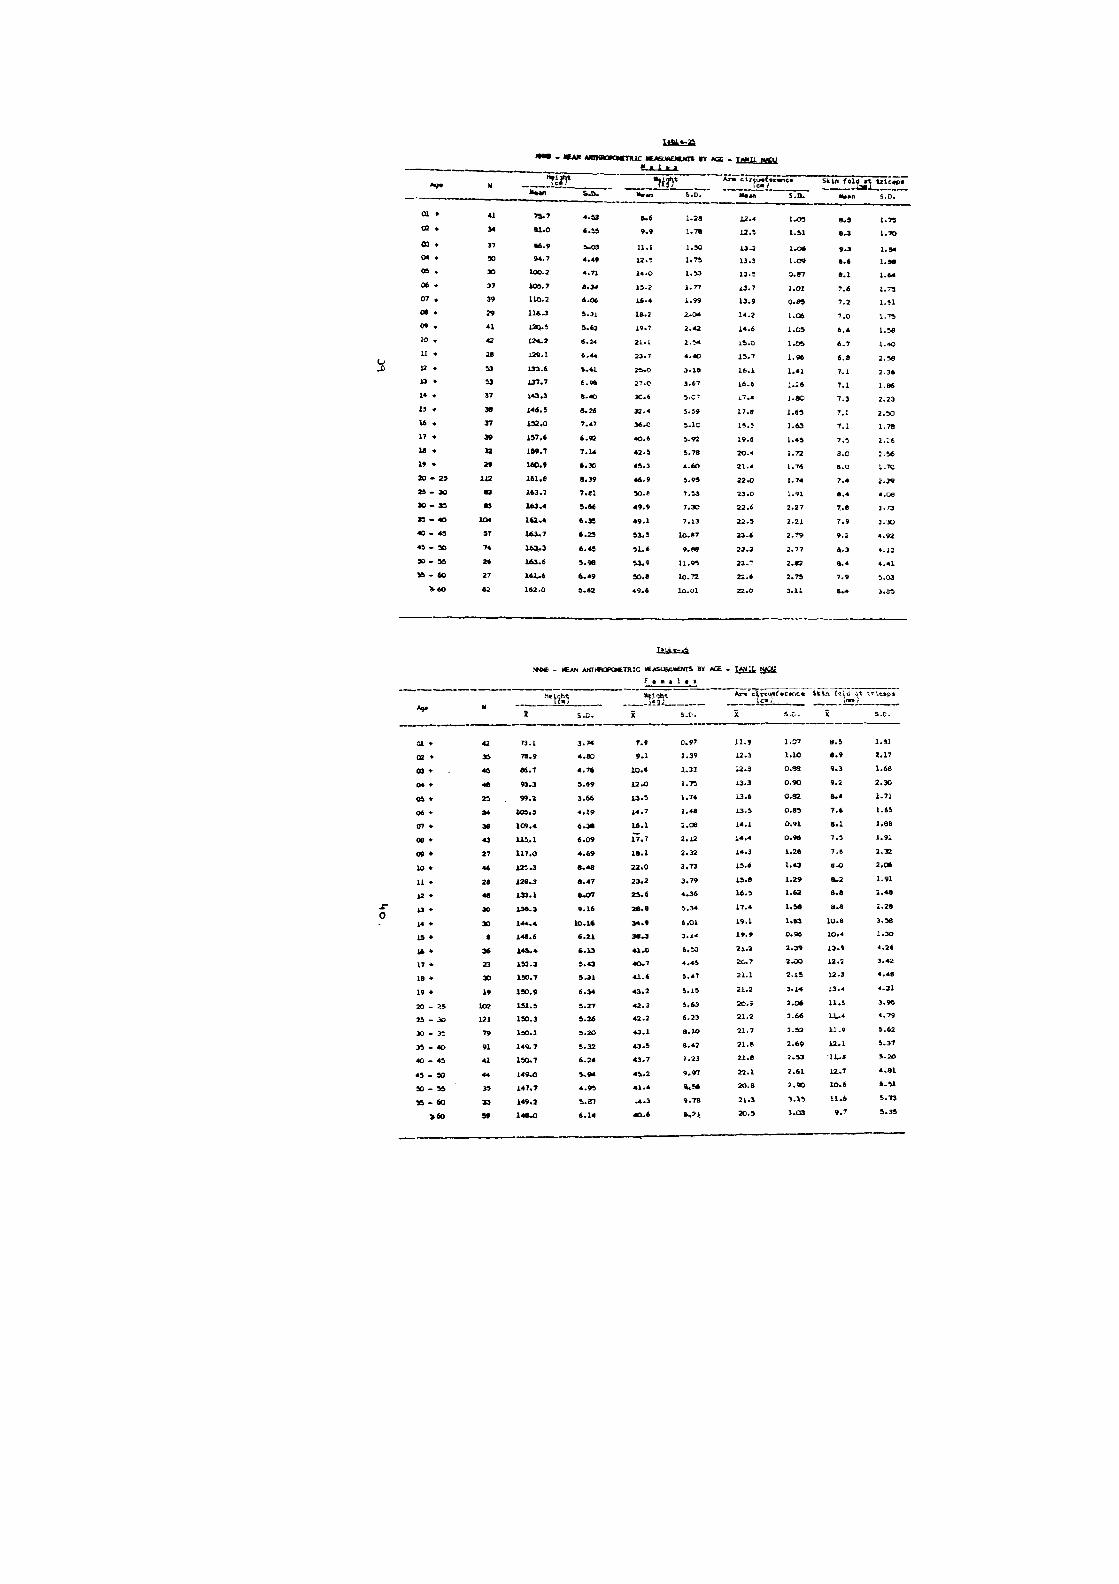


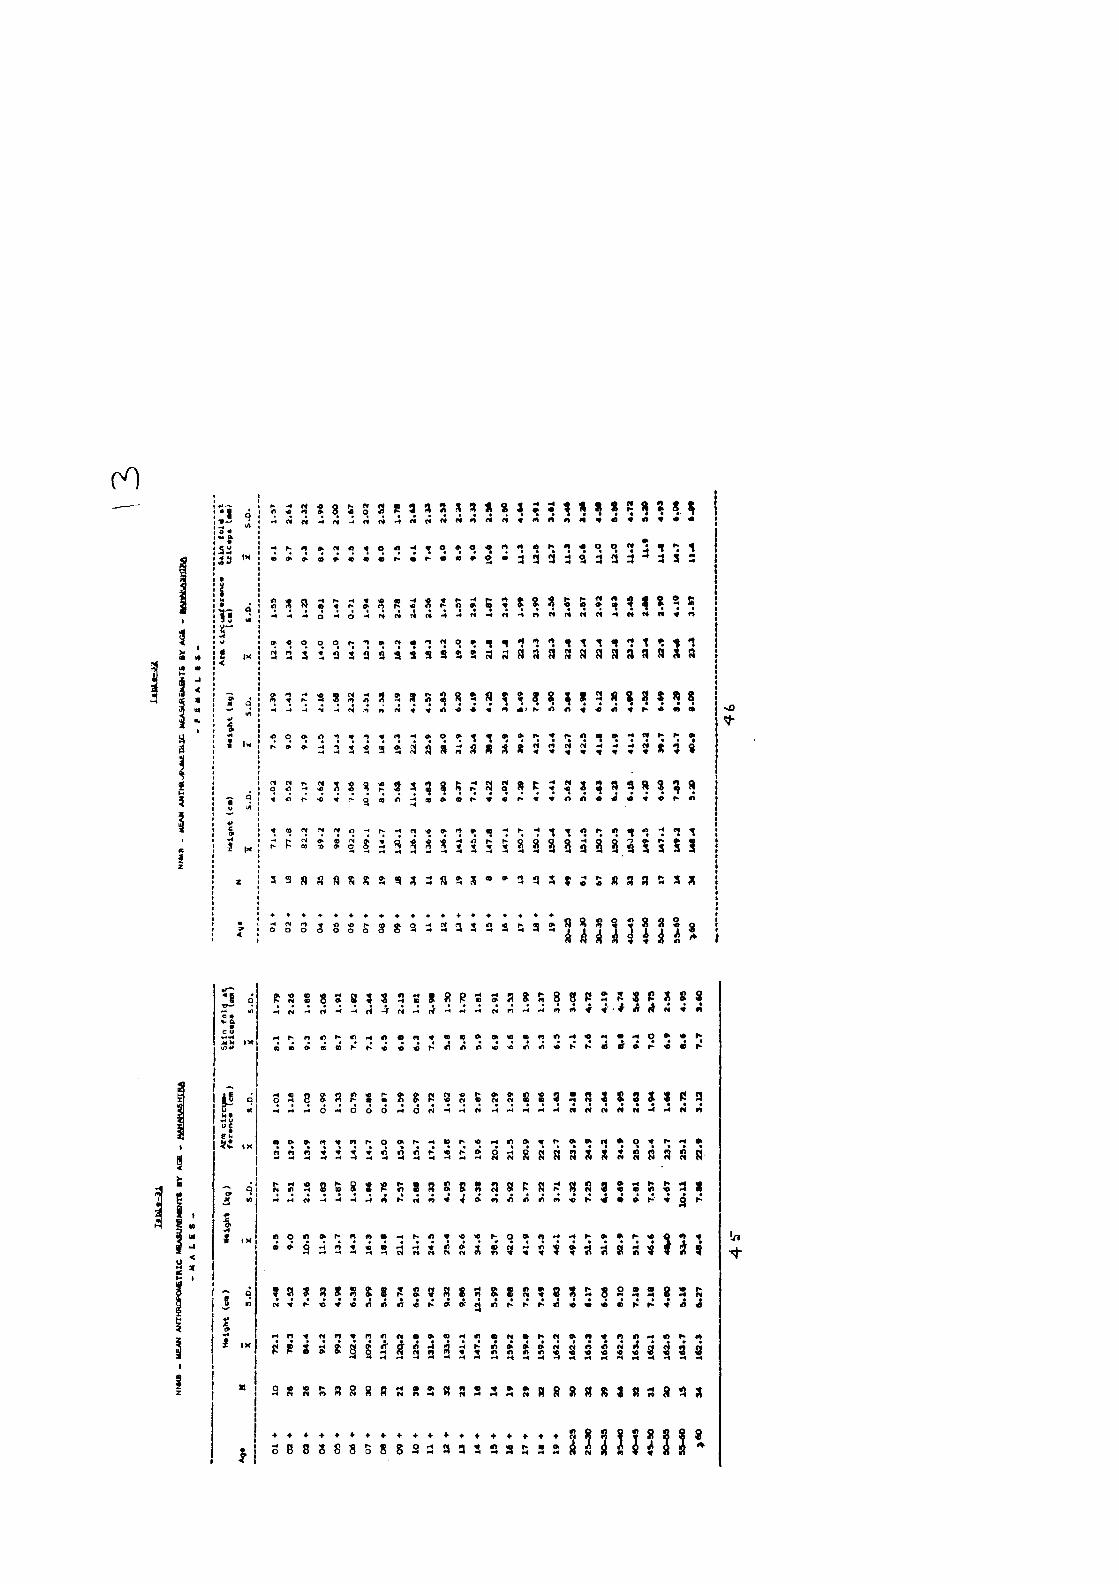
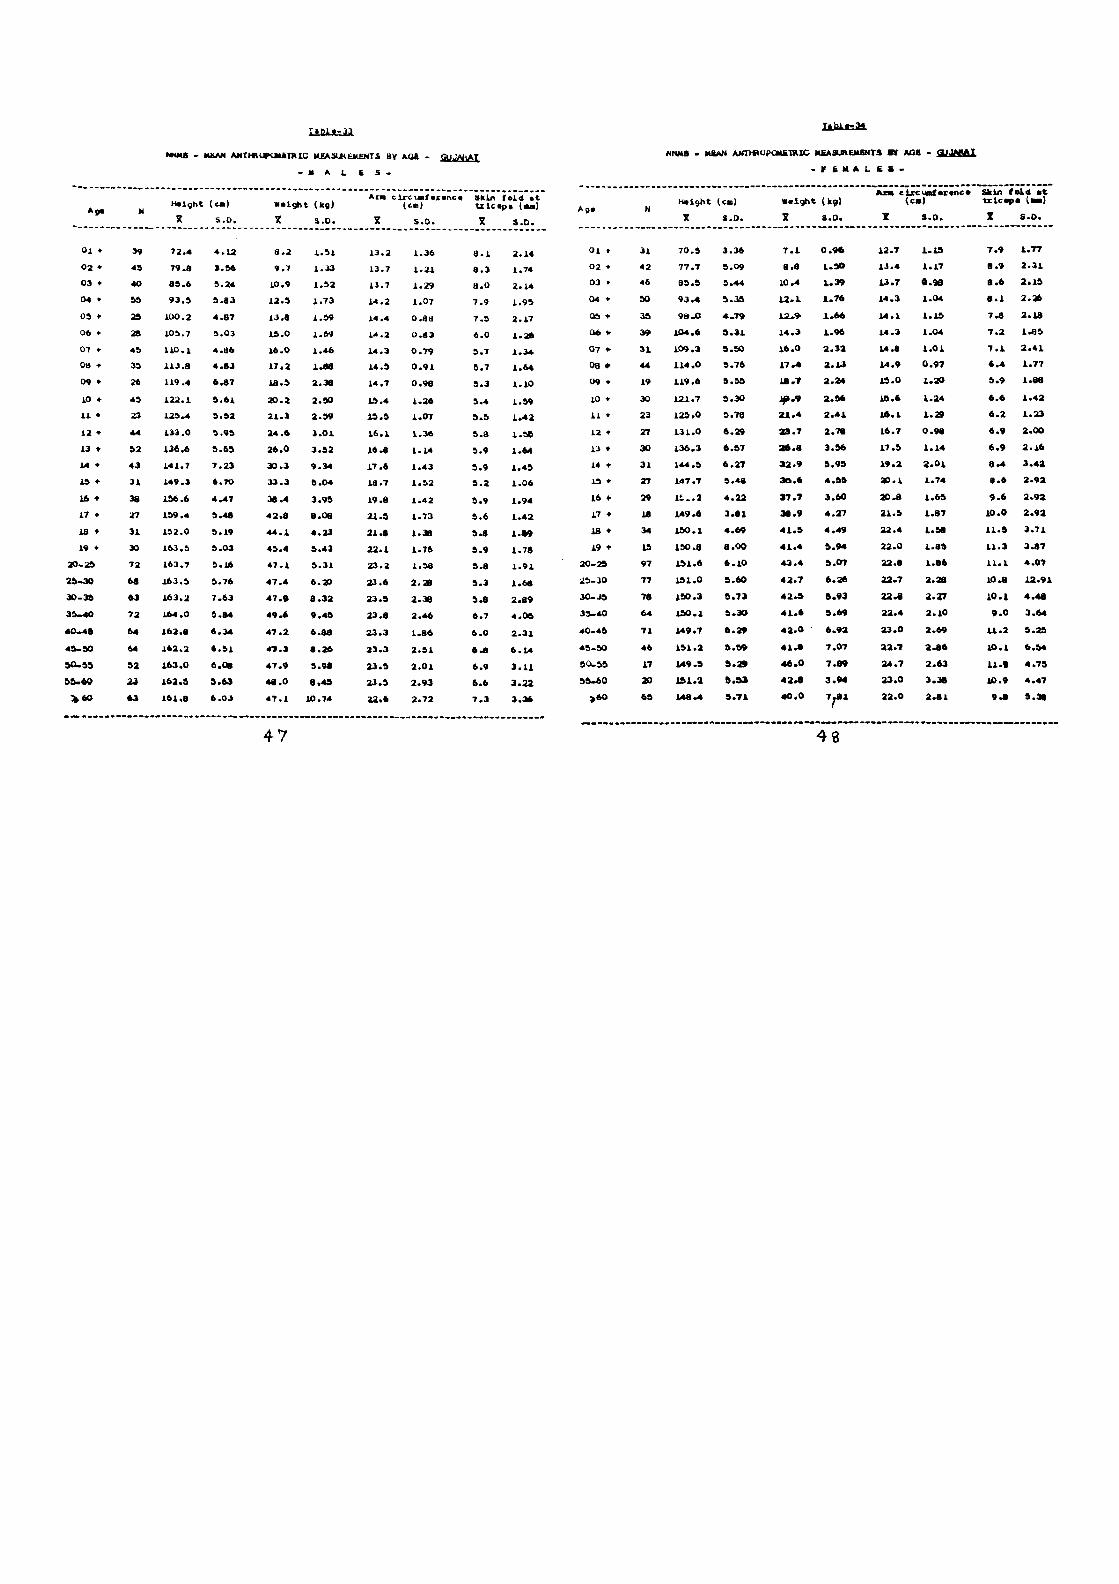


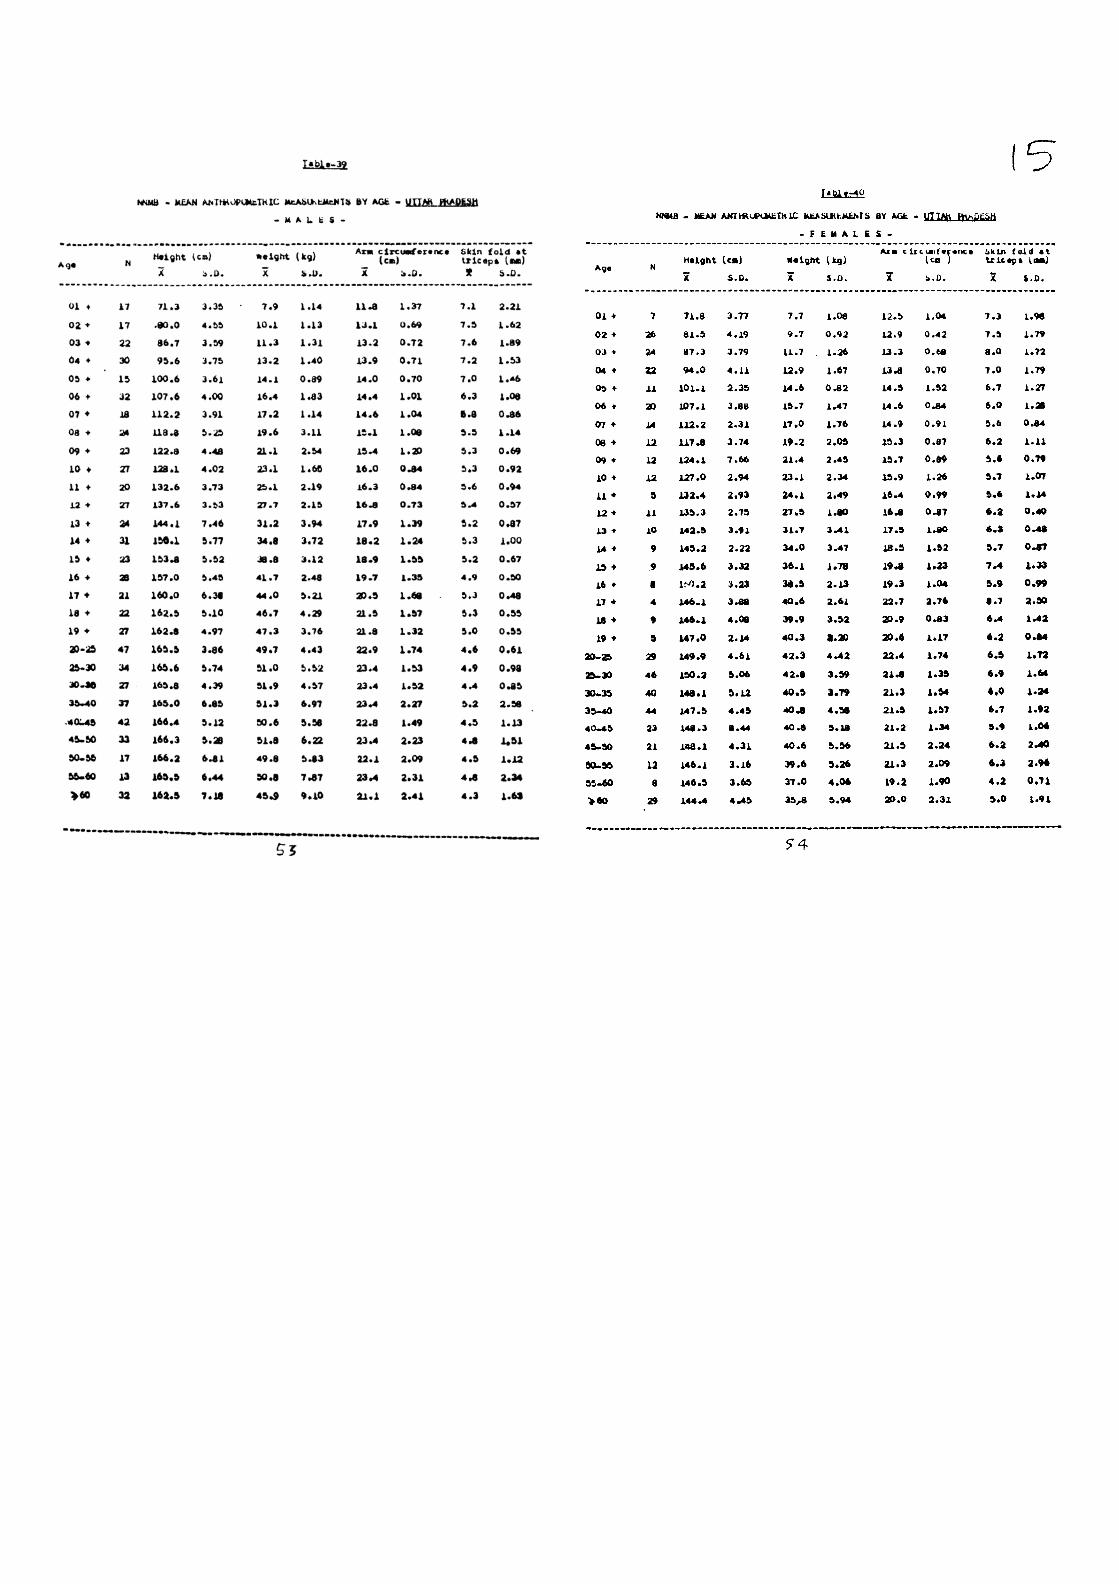

Table-41NNMB - PERCENT DISTRIBUTION OF PRE-SCHOOL CHILDREN (1-5 YEARS) ACCORDING TO
GUMEZ CLASSIFICATION IN DIFFERENT STATES - BOYS
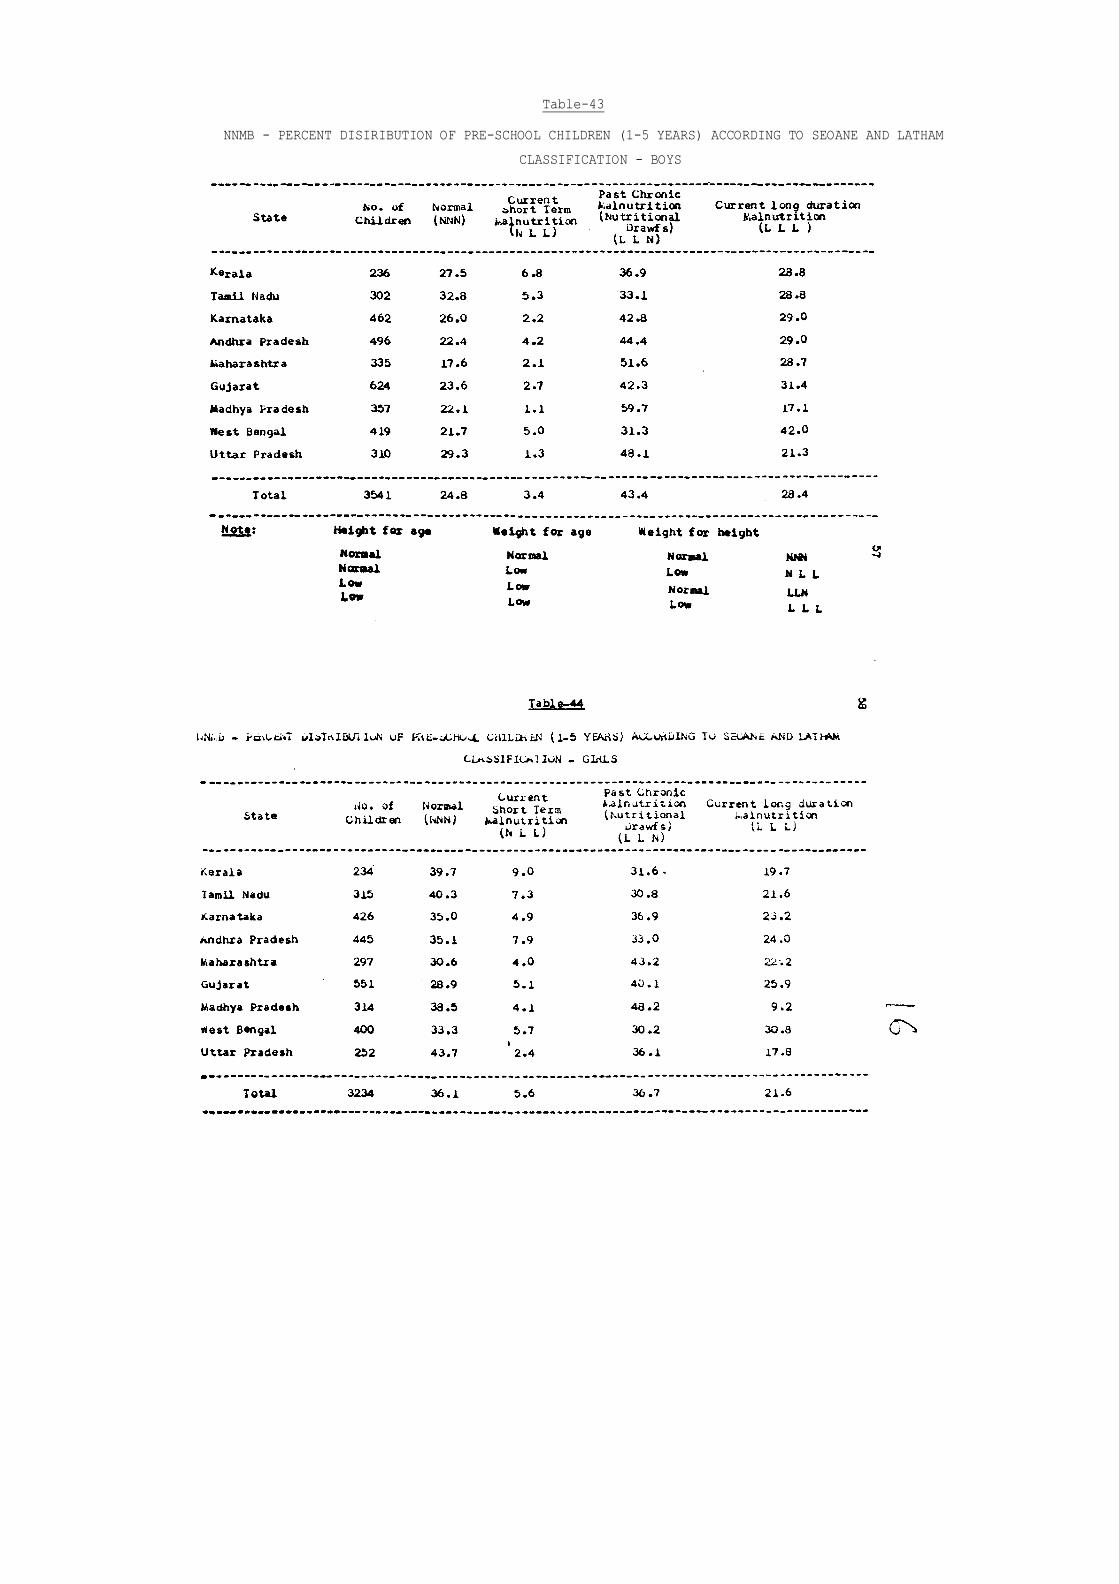
Table-43
NNMB - PERCENT DISIRIBUTION OF PRE-SCHOOL CHILDREN (1-5 YEARS) ACCORDING TO SEOANE AND LATHAM
CLASSIFICATION - BOYS