Page 1
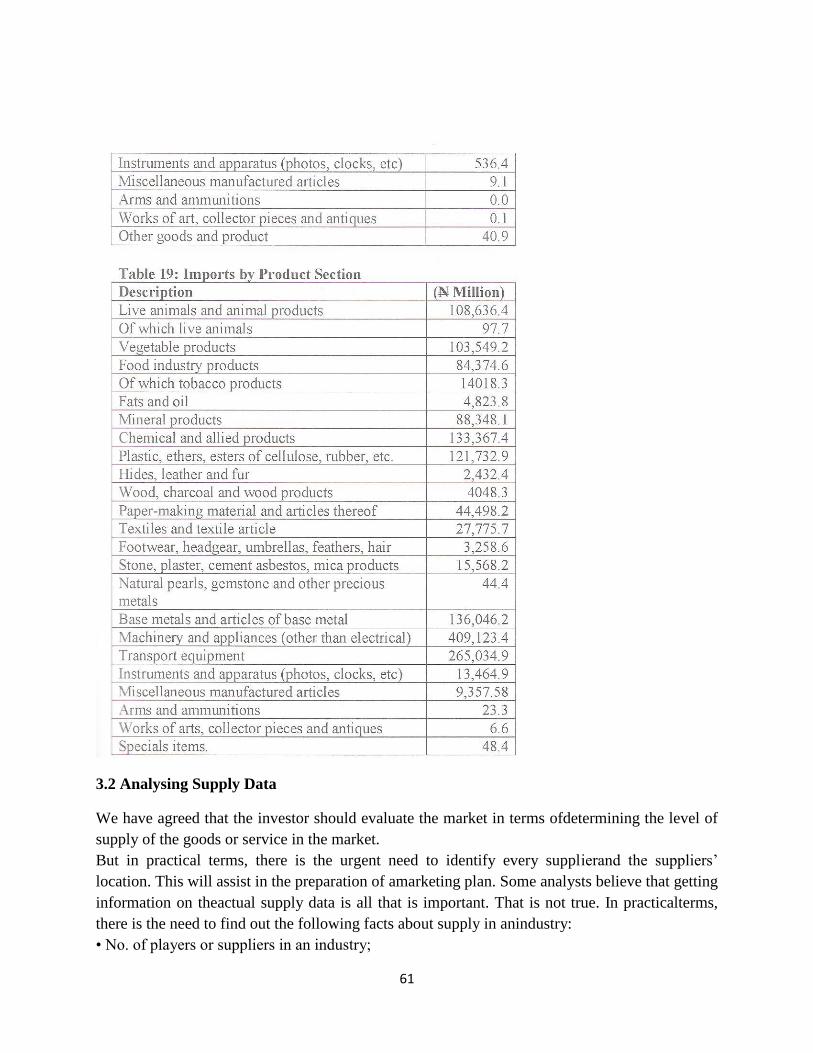
1
National Open University of Nigeria, Headquarters
91, Cadastral Zone, University Village Jabi, Abuja
FACULTY OF MANAGEMENT SCIENCES
Course Code: BFN409
Course Title: Project Evaluation
Course Writers: 1.Dr. Esther Evbayiro-Osagie
Department of Banking and Finance,
University of Benin
2. Mr Kayode Kadiri
Department of Administration, NOUN
Course Editor: Dr Usman Abubakar
Dept of Public Administration, A. B. U. Zaria.
Course Coordinator: Mrs Olakunbi Lawal
Dept of Financial Studies, NOUN
HEAD OF DEPT: Dr. (Mrs.) Ofe I. Inua
Dept of Financial Studies, NOUN
Page 2
2
COURSE GUIDE
INTRODUCTION
BFN 409: Project Evaluation is a semester course work of two credit units. It will be available to
all students in the School of Business and Human Resources Management. The course consists
of 4 modules involving the subject area of Project Evaluation.
The course guide tells you what the course is all about and the relevant materials that you require
to make your study very successful. Other vital information contained in this course guide deals
with Assessment which consists of the Tutor- Market Assignments, and written examination.
The Course Contents
The course contents consist of project evaluation from the project cycle to engineering
evaluation, demand/market evaluation. It also includes financial and economic analyses of
projects.
Course Aims
The aims of this course are to expose you to the knowledge of how to evaluate projects either as
a project initiator or an evaluator. It aims to sharpen your skills in the evaluation of either new
projects or existing projects with a view to deciding whether they meet certain predetermined
investment criteria.
Course Objectives
At the end of this course you should be able to:
discuss the totality of project evaluation
prepare simple project plans/business plans
evaluate projects submitted to you for consideration
analyze the profit ratio and social profit of a project
The Course Materials
The main components of the course are:
1. The Course Guide
2. Study Units
3. References/Further Readings
4. Assignments
Study Units
There are 20 units in this course and they should be studied carefully
Page 3
3
Module 1: Project Meaning
Unit 1 Project meaning, relation with programme
Unit 2The Project Cycle
Unit 3 Project Evaluations – An Introductory Format
Unit 4 Factors Affecting Location of Projects
Unit 5 Capacity and Production Planning
Unit 6: Techniques of Project Identification
Module 2: Project Planning and Analysis
Unit 1 Manpower Planning and Evaluation
Unit 2 Demand Analysis
Unit 3 Supply Analysis
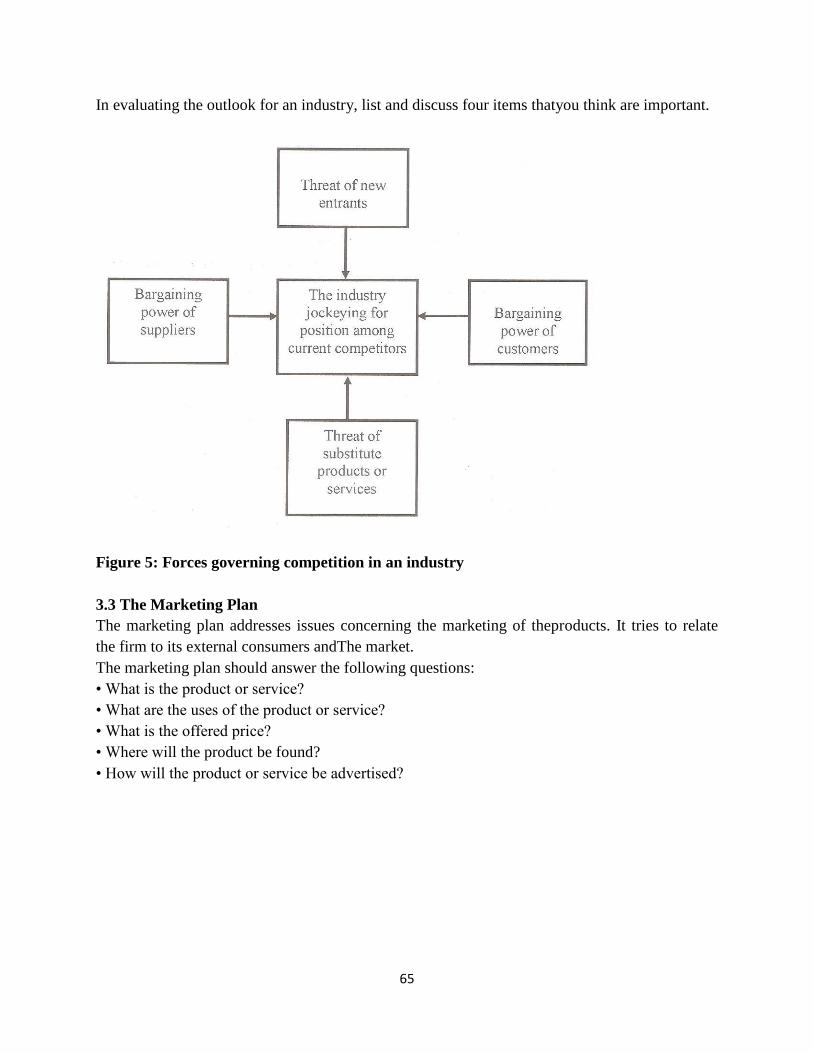
Unit 4 Competition and Marketing Plans
Unit 5 Project Cost Analysis
Unit 6: Elements of project analysis
Module 3: Project Income and Evaluation
Unit 1 Projected Income Statement
Unit 2 Projected Cash Flow Statements
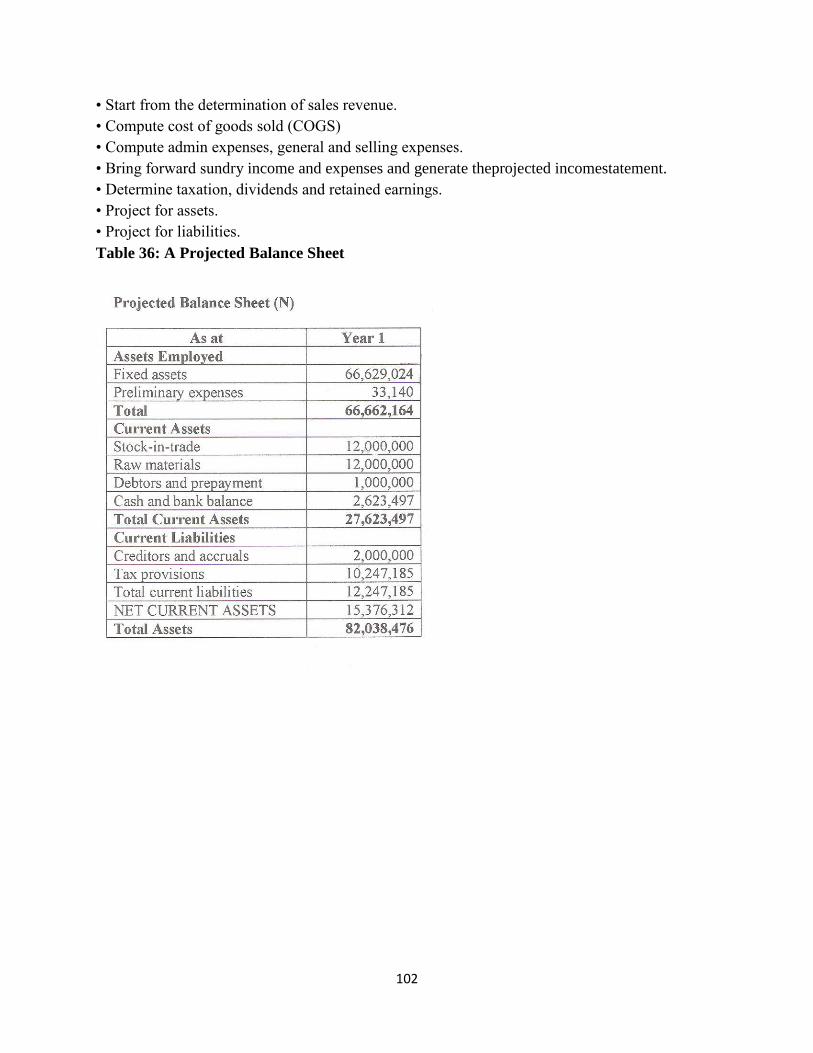
Unit 3 Projected Balance Sheets
Unit 4 Project Evaluation Criteria
Unit 5 Introduction to Economic Analyses
Unit 6: Cash flow Dimensions
Module 4 Risk and Cost Analysis
Unit 1 The Evaluation Methods
Unit 2 Concept of Risk in an Organisation
Unit 3 Risk and Uncertainty
Unit 4 Assessment of Social Profitability
Unit 5 Cost Benefit Analysis
Module 1 provides you with the necessary background knowledge you require for your study.
The remaining module 2 to 4 focus attention on the subject matter of project evaluation. Each
study unit will take at least two hours and it includes:
The introduction, objectives, main content, exercise, conclusion, summary,references and the
Tutor-Marked Assignments (TMAs).
You are required to study the materials, reflect on them and do the exercises. Some of the
exercises require that you visit some organisations and find out how they carry our project
evaluation practice. You should also read the textbooks and other recommendedmaterials.
Page 4
4
Assignments
In each unit, you will find exercises which you are required to do. Theexercises will enable you
to have a better understanding of what youhave studied.
Assessment:
As a student of the Open and Distance Learning (ODL) system, you are expected to access your
learning ability by the extent of your understanding of the units and the entire course. This
assessment prepares you for the final examination. The final examinations will come at the end
of the course. You are expected to write this examination whose score together with what you
made in the TMAs will form the course grade.
Tutor-Marked Assignment
In doing the Tutor-Marked Assignments, you are expected to apply whatyou have learnt in the
contents of the study unit. The TMAs areexpected to be computer base for grading. They
constitute 30%of the total score.
Final Examination and Grading
At the end of the course, you will write the final examination. It willattract the remaining 70%.
This makes the final score to be 100%.
Summary
The course BFN 409 – Project Evaluation will expose you to theknowledge and understanding of
how to evaluate projects. When youcomplete the course, you would have been armed with the
necessaryknowledge required to evaluate projects.
Page 5
5
National Open University of Nigeria, Headquarters
91, Cadastral Zone, University Village Jabi, Abuja
FACULTY OF MANAGEMENT SCIENCES
Course Code: BFN409
Course Title: Project Evaluation
Course Writers: 1.Dr. Esther Evbayiro-Osagie
Department of Banking and Finance,
University of Benin
2. Mr Kayode Kadiri
Department of Administration, NOUN
Course Editor: Dr Usman Abubakar
Dept. of Public Administration, A. B. U. Zaria.
Course Coordinator: Mrs Olakunbi Lawal
Dept. of Financial Studies, NOUN
HEAD OF DEPT: Dr. (Mrs.) Ofe I. Inua
Dept. of Financial Studies, NOUN
Page 6
6
MODULE 1 PROJECT MEANING
Unit 1 The Meaning of Project
Unit 2The Project Cycle
Unit 3 Project Evaluation – An Introductory Format
Unit 4 Factors Affecting the Location of Projects
Unit 5 Capacity and Production Planning
Unit 6The Concept Of Engineering Evaluation
MAIN COURSE
CONTENTS
1.0 Introduction
2.0 Objectives
3.0 Main Content
3.1.1 Definition of Project
3.1.2 The characteristics ofa Project
3.1.3 The Differences between Project and a Programme
4.0 Conclusion
5.0 Summary
6.0 Tutor-Marked Assignment
7.0 References/Further Readings
1.0 INTRODUCTION
Ordinarily, a project is an undertaking that requires commitment of human and material
resources.Projects require commitment and deployment of resources. As abusiness manager of
the future, you will encounter various projects inyour work place or environment. Most of the
projects are likely to beprivate sector driven. They may be manufacturing projects or theycould
be petrochemical or civil engineering projects. Your key task, asa project evaluator, is to
carefully consider each and every projectbrought to your attention and see how useful or
valuable they are.
Our first task and which we will accomplish in this unit is to examinethe concept of a project
cycle. This concept is very important as it givesus an overview of projects. The knowledge so
gained, will lead usthroughout the duration of this course.
2.0 OBJECTIVES
At the end of this unit, you should be able to:
• explain the meaning of project
• describe the various underlying characteristics of a project.
Page 7
7
3.0 MAIN CONTENT
3.1.1 Definition of Project
Project has been defined in various ways. Some authorities see projects as mere activities while
others see them as programmes of action.
Longman Dictionary of Contemporary English defines a project as ―an important and carefully
planned piece of work that is intended to build or produce something new, or to deal with a
problem‖. From this simple definition, we can see that a project, apart from being
Important, should be carefully planned so as to produce something. Some of the things that a
project seeks to produce may be tangible or intangible. A motorcycle is a tangible product but
conducting a census is not a tangible product.
Also, A project is a temporary endeavor undertaken to create a unique product, service, or result.
Like most organizational effort, the major goal of a project is to satisfy a customer‘s need.
Beyond this fundamental similarity, the characteristics of a project help differentiate it from
other endeavors of the organization.
3.1.2 Characteristics of a Project
The major characteristic of a project are as follows;
1. An established objective.
2. A defined life span with a beginning and an end.
3. Usually, the involvement of several departments and professionals.
4. Typically, doing something that has never been done before.
5. Specific time, cost, and performance requirements.
First, projects have a define objective – The following are examples of define objectives of
projects
• Construction of a 50-bed hospital at Ikeja by the Lagos State Government. Or constructing a
12-story apartment complex by January 1 or releasing version 2.0 of a specific software package
as quickly as possibly.
• Dualisation of the Benin-Lagos highway by the Federal Ministry of Works.
• Sinking of 10 water bore-holes at Ikorodu town by the local government council.
From whatever angle we see these projects, some of their features are that they will require the
commitment and deployment of scare resources.
3.1.3 Differences between Project and Programme
Page 8
8
What a project is not; project should not be confused with everyday work. A project is not
routine, repetitive work! Ordinary daily work typically requires doing the same or similar work
over and over, while a project is done only once; a new product or service exists when the
project is completed.
Programme versus project; in practice the term project and programme cause confusion.
They are often used synonymously. A programme is a group of related projects designed to
accomplish a common goal over an extended period of time. Each project within a programme
has a project manager. The major differences lie in scale and time span. Programme
management is the process of managing a group of ongoing, inter- dependent, related projects
in a coordinated way to achieve strategic objectives.For example, a pharmaceutical organization
could have a programme for curing cancer, different project are outlined to achieve the set
programme.
SELF ASSESSMENT EXERCISE
DiscussDifferences between Project and Programme .
4.0 Conclusion
This unit has treated the meaning of project, the characteristics, differences and it relation with
programme. This is an introductory aspect to the study of project evaluation. Now that we have
the basic foundation, we shall further our discussion with Project cycle as an introductory
framework on project evaluation.
5.0 Summary
In this unit we have discussed the meaning of project.We have seen thecharacteristics of
project, its relation to programme and their differences.
6.0 TUTOR-MARKED ASSIGNMENT
1. Explain what you understand by the Characteristics of a Project.
2. List and discuss the various objectives of a project.
Page 9
9
UNIT 2 THE PROJECT CYCLE
CONTENTS
1.0 Introduction
2.0 Objectives
3.0 Main Content
3.1 The Project Cycle – Meaning and Stages
3.1.1 The Project Idea Stage
3.1.2 The Project Identification Stage
3.1.3 The Project Evaluation Stage
3.1.4 The Project Selection Stage
3.1.5 The Project Execution Stage
4.0 Conclusion
5.0 Summary
6.0 Tutor-Marked Assignment
7.0 References/Further Readings
1.0 INTRODUCTION
Ordinarily, a project is an undertaking that requires concentrated effort. Projects require
commitment and deployment of resources. As abusiness manager of the future, you will
encounter various projects inyour work place or environment. Most of the projects are likely to
beprivate sector driven. They may be manufacturing projects or theycould be petrochemical or
civil engineering projects. Your key task, asa project evaluator, is to carefully consider each and
every projectbrought to your attention and see how useful or valuable they are.
Our first task and which we will accomplish in this unit is to examinethe concept of a project
cycle. This concept is very important as it givesus an overview of projects. The knowledge so
gained, will lead usthroughout the duration of this course.
2.0 OBJECTIVES
At the end of this unit, you should be able to:
• explain a project cycle
• describe the sequences in a project cycle.
3.0 MAIN CONTENT
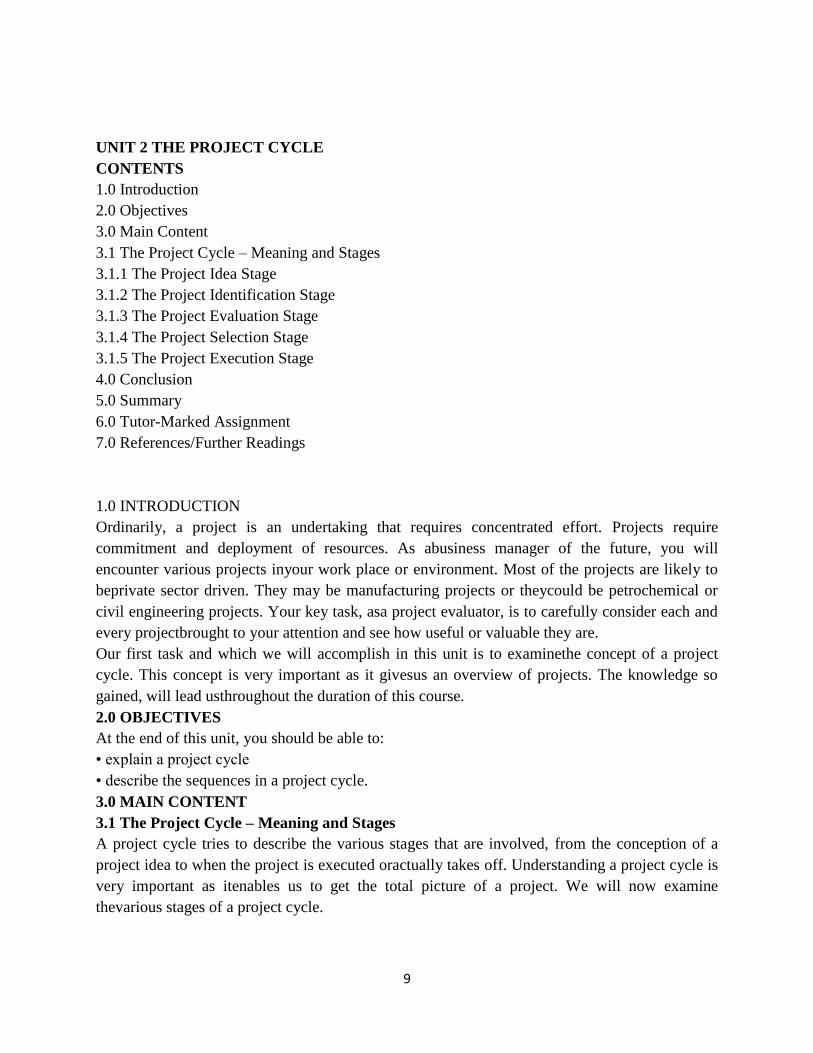
3.1 The Project Cycle – Meaning and Stages
A project cycle tries to describe the various stages that are involved, from the conception of a
project idea to when the project is executed oractually takes off. Understanding a project cycle is
very important as itenables us to get the total picture of a project. We will now examine
thevarious stages of a project cycle.
Page 10
10
Basically, projects consist of the projection of ideas and activities into new endeavours. As
earlier discussed, projects may be public sectorprojects in agriculture, defense or transportation.
A major railway linkfrom Ibadan to Onitsha may constitute a major public sector project. Anew
brewery springing up at Enugu is a typical example of a privatesector initiative. But whatever
type of project that we are considering,we need to first understand what is usually known as the
project cycle.
So before we go into the real subject of our discussion –Project Evaluation, we need to build a
strong background. This background isin the form of proper understanding of how a project is
conceived.Itexplains who conceives a project. It also explains the flow of activitiesup to the
execution of the project.
Page 12
12
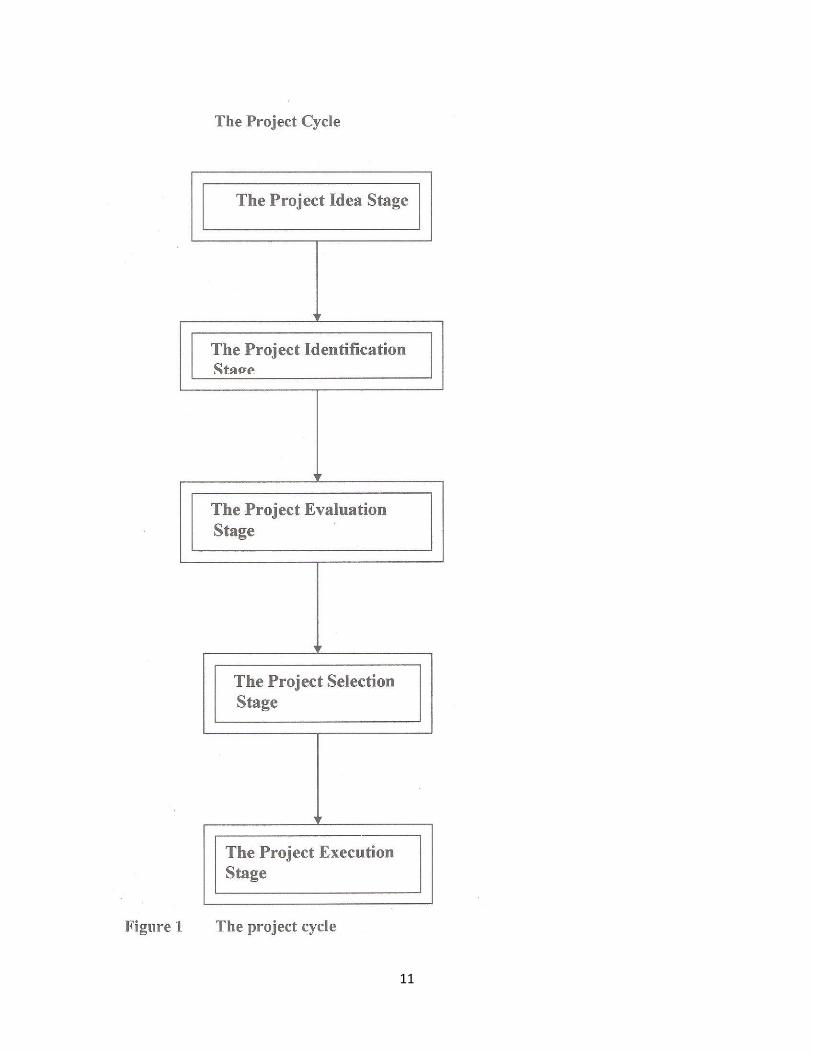
SELF ASSESSMENT EXERCISE 1
List the stages of a project cycle.
Customer
Marketing
Design
Production
Planning
Purchasing
Production
Figure 2 A manufacturing project cycle
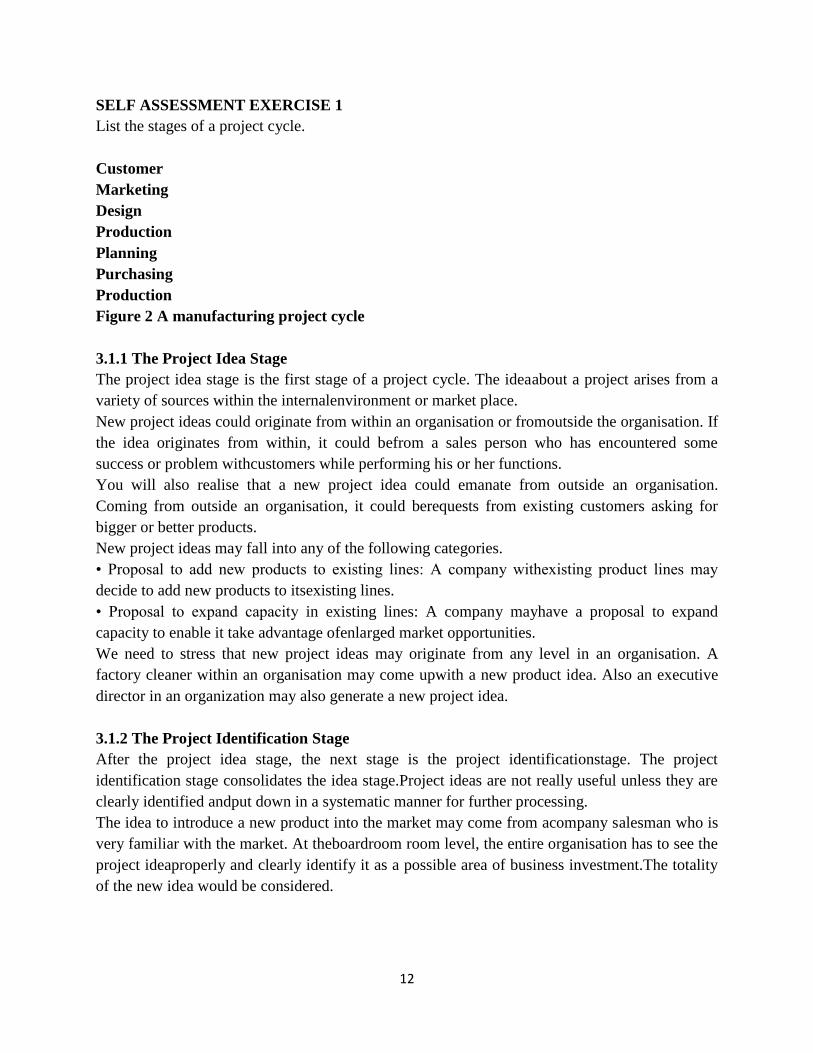
3.1.1 The Project Idea Stage
The project idea stage is the first stage of a project cycle. The ideaabout a project arises from a
variety of sources within the internalenvironment or market place.
New project ideas could originate from within an organisation or fromoutside the organisation. If
the idea originates from within, it could befrom a sales person who has encountered some
success or problem withcustomers while performing his or her functions.
You will also realise that a new project idea could emanate from outside an organisation.
Coming from outside an organisation, it could berequests from existing customers asking for
bigger or better products.
New project ideas may fall into any of the following categories.
• Proposal to add new products to existing lines: A company withexisting product lines may
decide to add new products to itsexisting lines.
• Proposal to expand capacity in existing lines: A company mayhave a proposal to expand
capacity to enable it take advantage ofenlarged market opportunities.
We need to stress that new project ideas may originate from any level in an organisation. A
factory cleaner within an organisation may come upwith a new product idea. Also an executive
director in an organization may also generate a new project idea.
3.1.2 The Project Identification Stage
After the project idea stage, the next stage is the project identificationstage. The project
identification stage consolidates the idea stage.Project ideas are not really useful unless they are
clearly identified andput down in a systematic manner for further processing.
The idea to introduce a new product into the market may come from acompany salesman who is
very familiar with the market. At theboardroom room level, the entire organisation has to see the
project ideaproperly and clearly identify it as a possible area of business investment.The totality
of the new idea would be considered.
Page 13
13
3.1.3 The Project Evaluation Stage
When a project has been identified, the next step is to evaluate the project. Project evaluation
involves the estimation of the benefits andcosts of a project. Benefits and costs should be
measured in terms ofcash flows.We have to emphasise at this point that the estimation of the
cash flowof a project is a very difficult task. It is difficult in the sense that thecash flow to be
estimated is future cash flow. For example in the year2007, we will tried to estimate the cash
flow for the year 2008.
In a corporate setup, the evaluation of projects should be carried out by ateam of experts drawn
from the various departments like production,marketing, accounts and administration. The team
of experts should beobjective in their evaluation of projects.Alternatively, the evaluation of a
project may be contracted to a thirdparty like consultants. Contracting evaluation of projects to
tends to eliminate bias.
3.1.4 The Project Selection Stage
After the project evaluation stage, the next stage is the project selectionstage. Faced with an
array of projects with different values and worth,there is need to select which projects to
embarked upon. There is nostandard procedure for selecting projects as this will differ
frombenefit seen. The important thing to note is that the project selection functionis a top
management responsibility which in most cases goes toBoard of Directors of an organisation. In
selecting projects,management usually considers the financial outlays involved andmatches them
with the financial capabilities of the firm. For example, afirm that has only N10,000,000 (ten
million naira only) be considering a new investment that involves a capital outlay of
N40,000,000 (forty million naira only) except if it can sourcemoney externally e.g., from banks.
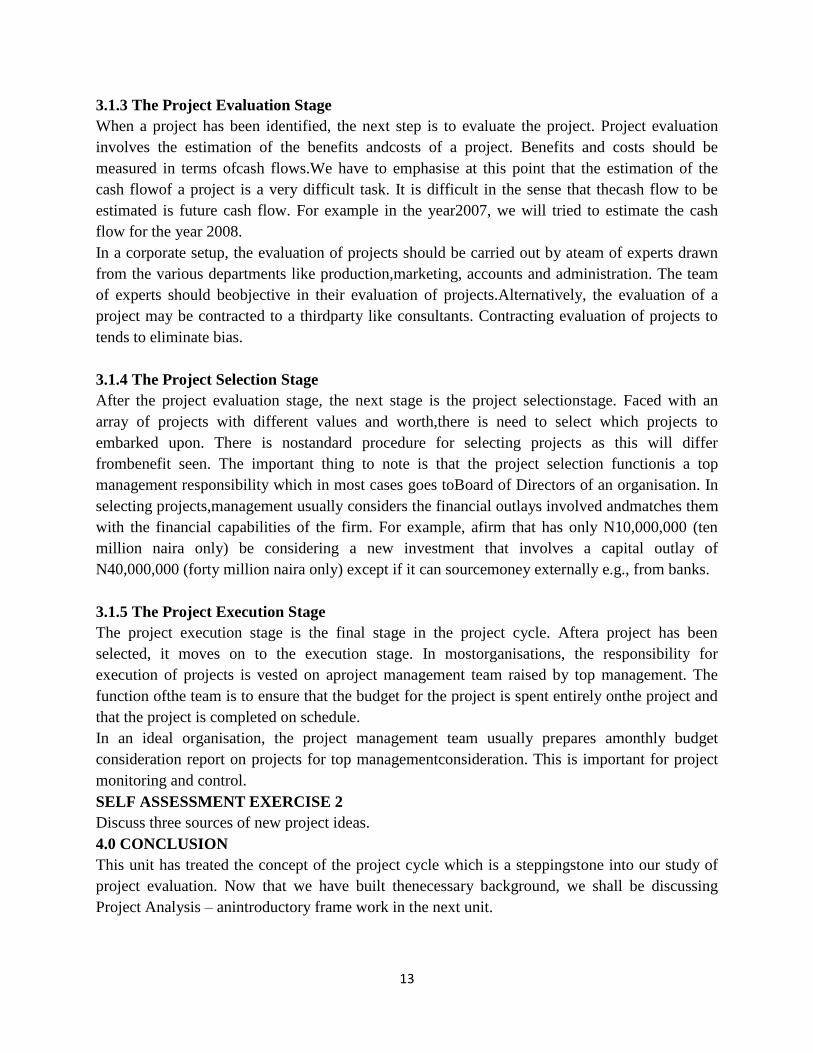
3.1.5 The Project Execution Stage
The project execution stage is the final stage in the project cycle. Aftera project has been
selected, it moves on to the execution stage. In mostorganisations, the responsibility for
execution of projects is vested on aproject management team raised by top management. The
function ofthe team is to ensure that the budget for the project is spent entirely onthe project and
that the project is completed on schedule.
In an ideal organisation, the project management team usually prepares amonthly budget
consideration report on projects for top managementconsideration. This is important for project
monitoring and control.
SELF ASSESSMENT EXERCISE 2
Discuss three sources of new project ideas.
4.0 CONCLUSION
This unit has treated the concept of the project cycle which is a steppingstone into our study of
project evaluation. Now that we have built thenecessary background, we shall be discussing
Project Analysis – anintroductory frame work in the next unit.
Page 14
14
5.0 SUMMARY
In this unit we have discussed the concept of the project cycle. We haveseen that it starts from
the project idea stage, goes to the identificationstage, to the evaluation stage. From the evaluation
stage it moves to theselection stage and finally to the project execution stage.
6.0 TUTOR-MARKED ASSIGNMENT
1. Explain what you understand by the term ―project cycle‖.
2. List and discuss the various stages involved in a project cycle.
7.0 REFERENCES/FURTHER READINGS
Leon Ikpe, (1999). Project Analysis and Evaluation. Lagos: ImpressedPublishers.
Page 15
15
UNIT 3 PROJECT EVALUATION – ANINTRODUCTORY FORMAT
CONTENTS
1.0 Introduction
2.0 Objective
3.0 Main Content
3.1 Project Evaluation – An Introductory Format
3.1.1 The Technical and Engineering Segment
3.1.2 The Management Segment
3.1.3 The Demand and Market Segment
3.1.4 The Financial Segment
3.1.5 The Economic Segment
4.0 Conclusion
5.0 Summary
6.0 Tutor-Marked Assignment
7.0 References/Further Readings
1.0 INTRODUCTION
In the first unit, we discussed the concept of the project cycle which isvery crucial to our
understanding of project evaluation. In this unit, wewill discuss project evaluation in a proper
context. In doing this, weshall build an introductory format which will assist us in our discussion.
Evaluation of a project involves a careful consideration of the totality ofthe project with a view
to seeing how useful or valuable itis Evaluation enables us to attach proper financial value to a
project andalso allows us the liberty of comparing it with other projects.
You will note that an analysis is not done in a vacuum. It is usuallydocumented.A problem
usually encountered in project evaluation is how to arrangethe work to make it readable or
understandable.
A very simple format which we will adopt in the evaluation of projectsis one that recognizes the
various functional aspects or units ofan organization.
2.0 OBJECTIVE
At the end of this unit, you should be able to:
• explain the format for project evaluation.
3.0 MAIN CONTENT
3.1 Project Evaluation – An Introductory Format
The introductory format for the evaluation of projects is the arrangementof our work into
carefully defined segments. We will now discuss thevarious segments of project evaluation.
3.1.1 The Technical and Engineering Segment
Page 16
16
The technical and engineering segment of project evaluation tries toevaluate the total technical
and engineering soundness of a project. Italso tries to relate the project to the environment in
which it is located.
We will now proceed to draw up a checklist for the technicalengineering segment of project
evaluation.
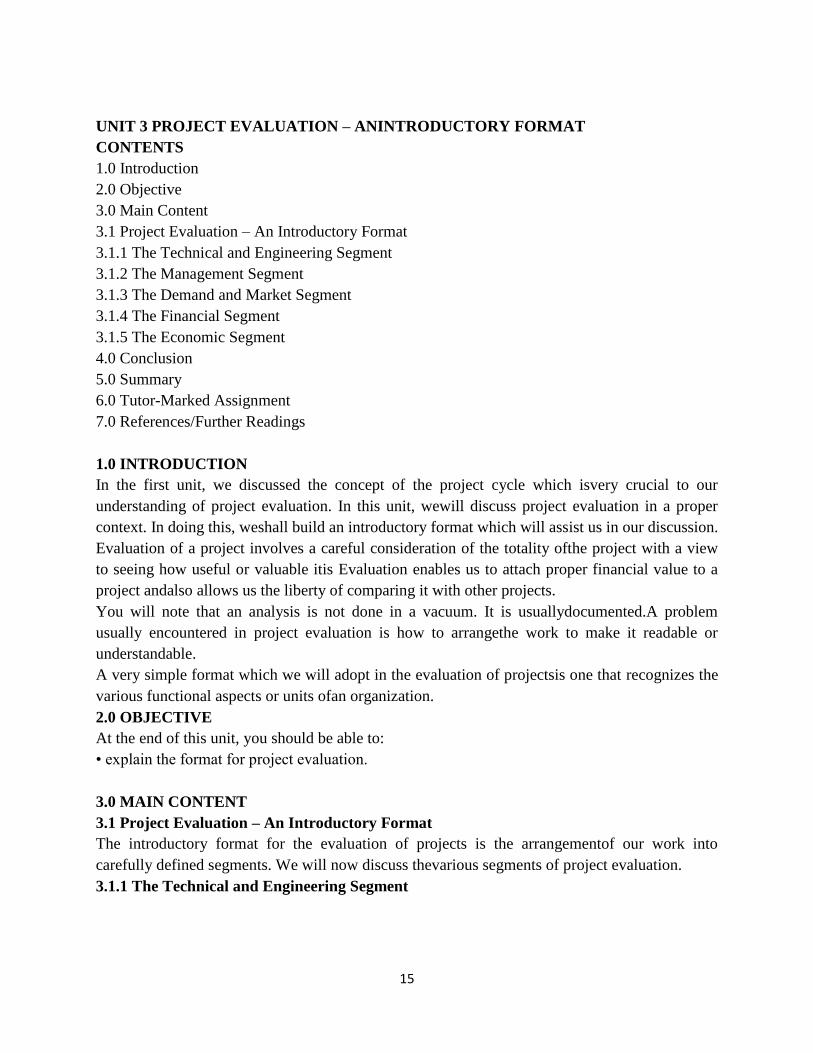
3.1.2 The Management Segment
After evaluating the technical and engineering segments of projects, thenext segment we need to
discuss is the management segment.
The management segment focuses attention on the management aspects of aproject. Projects
only become successful if they are well managed.We do not need to over-stress the importance
of management. Again,we need to evaluate the legal form of the organization that is evaluated
and see if it can carry the project in question.
Page 17
17
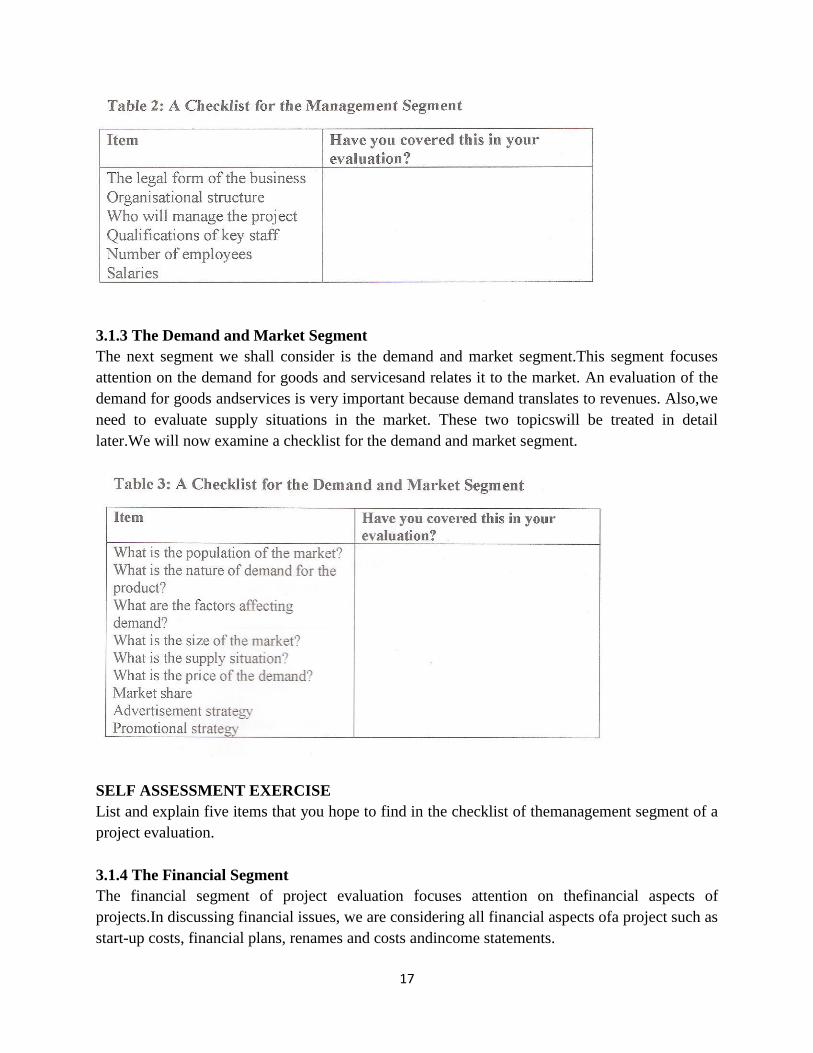
3.1.3 The Demand and Market Segment
The next segment we shall consider is the demand and market segment.This segment focuses
attention on the demand for goods and servicesand relates it to the market. An evaluation of the
demand for goods andservices is very important because demand translates to revenues. Also,we
need to evaluate supply situations in the market. These two topicswill be treated in detail
later.We will now examine a checklist for the demand and market segment.
SELF ASSESSMENT EXERCISE
List and explain five items that you hope to find in the checklist of themanagement segment of a
project evaluation.
3.1.4 The Financial Segment
The financial segment of project evaluation focuses attention on thefinancial aspects of
projects.In discussing financial issues, we are considering all financial aspects ofa project such as
start-up costs, financial plans, renames and costs andincome statements.
Page 18
18
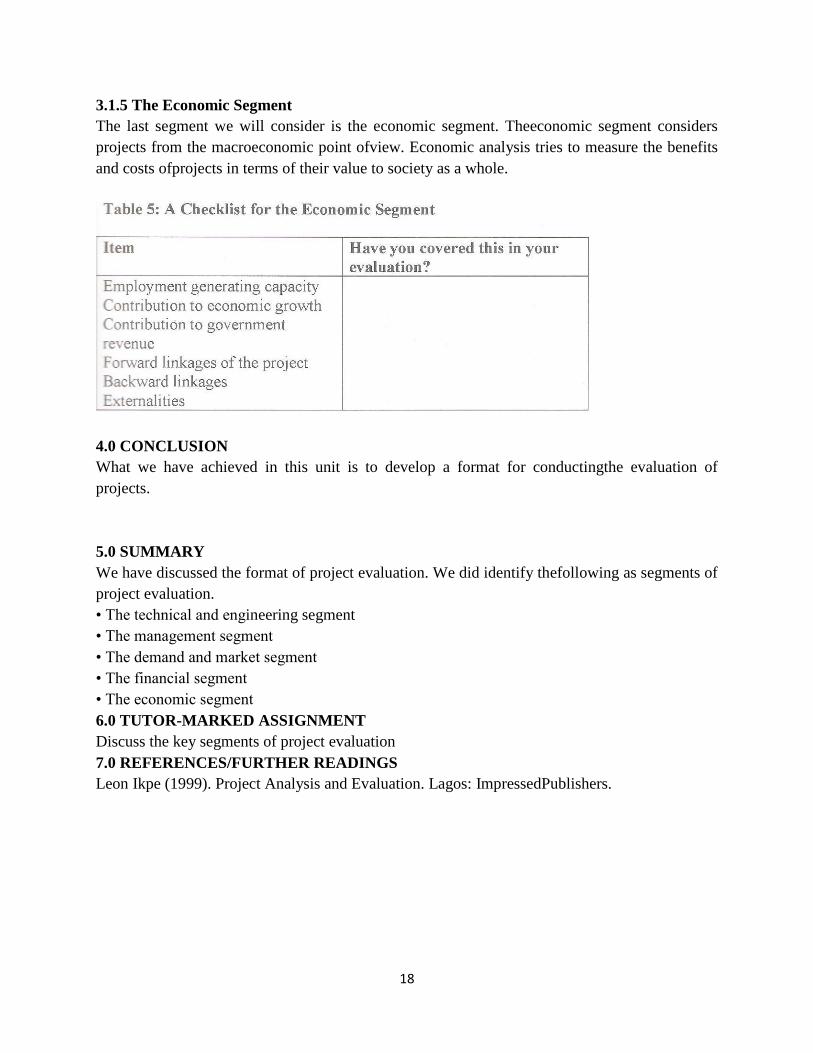
3.1.5 The Economic Segment
The last segment we will consider is the economic segment. Theeconomic segment considers
projects from the macroeconomic point ofview. Economic analysis tries to measure the benefits
and costs ofprojects in terms of their value to society as a whole.
4.0 CONCLUSION
What we have achieved in this unit is to develop a format for conductingthe evaluation of
projects.
5.0 SUMMARY
We have discussed the format of project evaluation. We did identify thefollowing as segments of
project evaluation.
• The technical and engineering segment
• The management segment
• The demand and market segment
• The financial segment
• The economic segment
6.0 TUTOR-MARKED ASSIGNMENT
Discuss the key segments of project evaluation
7.0 REFERENCES/FURTHER READINGS
Leon Ikpe (1999). Project Analysis and Evaluation. Lagos: ImpressedPublishers.
Page 19
19
UNIT 4 FACTORS AFFECTING THE LOCATION OFPROJECTS
CONTENTS
1.0 Introduction
2.0 Objective
3.0 Main Content
3.1 Factors Affecting the Location of Projects
3.1.1 Nearness to Markets
3.1.2 Nearness to Sources of Raw Materials
3.1.3 Nearness to Power Supply
3.1.4 Nearness to Water Supply
3.1.5 Availability of Good Road Networks
3.1.6 Availability of a Good Rail System
3.1.7 Nearness to Airports
3.1.8 Availability of Land
3.1.9 Political Considerations
3.1.10 Intervention Projects
4.0 Conclusion
5.0 Summary
6.0 Tutor-Marked Assignment
7.0 References/Further Readings
1.0 INTRODUCTION
In Unit 2 we discussed the format for the evaluation of projects. In thisunit, we shall discuss
factors affecting the location of projects. This isimportant because it enables us as analysts to
have a proper knowledgeof the key issues relating to project locations. Understanding this
unitwill give you the advantage of knowing in advance what should be andwhat should not be
when issues of project location are raised. Forexample if a project is located in an area without
any justification, theproject analyst should be aware of this based on his or her
previousknowledge of project location issues.
2.0 OBJECTIVE
At the end of this unit, you should be able to:
• explain the factors affecting the location of projects.
3.0 MAIN CONTENT
3.1 Factors Affecting the Location of Projects
Whether in the private sector or the public sector, projects are locatedaccording to set guidelines.
In the private sector, project location isbased purely on economic guidelines, usually put in place
by the variousorganisations. These guidelines regulate the ways and means by whichprojects are
located. In the public sector, projects may belocated according to a different set of guidelines and
they may not be driven byProfit motive. It is the discussion of these factors affecting the
locationof projects that will now take our time.
Page 20
20
3.1.1 Nearness to Markets
A major factor affecting the location of projects is their nearness tomarkets. Most businesses are
established primarily for profit.A business organisation will make profit if the goods or Produced
are purchased by third parties. It is the difference betweenrevenues and costs that constitute
profit. You will easily and quicklyrealise that most populations that constitute markets are
located mainlyin the urban areas of Nigeria. So we shall hold firmly to the fact that thenearness
to markets is a major factor influencing the location of mostprojects in Nigeria. Most of the
entire population of Nigeria is locatedin such areas like Lagos, Onitsha, Port Harcourt, Kano,
Ibadan, Abuja,etc. Because of this, most businesses and government establishmentsare located
near the critical markets that they wish to serve. That is tosay those businesses follow their
markets. Concentrations of people orcritical markets are very important to corporate officials
who designmarketing plans.
If you take a good look at your environment, you will realise that a lot ofcompanies are located
within Lagos. It is not by accident. Rather it isby design. Businesses are attracted to areas of core
concentration ofpeople who constitute vital markets.
3.1.2 Nearness to Sources of Raw Materials
Nearness to sources of raw materials is another strong factor affectingthe location of projects,
especially manufacturing concerns. Servicebased projects can locate without reference to any
raw material source.But manufacturing concerns cannot afford to gloss over the issue of raw
materials.For a manufacturing concern, the raw material source is very importantbecause in most
cases, raw materials may constitute over 80% of aproduct. If a company decides to establish its
factory very far awayfrom its raw material source, it is going to end up spending a lot ofmoney
to transport raw materials from the source to its factory. Thiswill mean added costs and in the
long run, the company may not be ableto compete effectively in its chosen market.
If you sit back and think deeply, you will see patterns of industriallocations that tend to suggest
that most industrial projects are locatedclose to the sources of raw materials. The Nigerian Coal
CorporationEnugu is located in Enugu close to the source of coal.
Most cocoa processing firms are located in the western parts of Nigeriabecause cocoa is found in
abundant quantities there.In the eastern parts of the country, oil mills and vegetable oil plants
litterthe economic landscape simply because the oil palm grows wildly thereand it is also the
major raw material for palm oil manufacture andvegetable oil.
If you go up north, you will also realise that the tea producing companyis located at the
Mambilla Plateau because the plateau is very rich in teacultivation.
3.1.3 Nearness to Power Supply
Power supply is a very critical input in business, whether service basedor manufacturing based.
In the case of service-based concerns likebanks, electricity will be needed to power computers,
servers and otherequipment needed to provide service to customers.In a manufacturing concern,
electricity is everything. Withoutelectricity, a manufacturing concern is not likely to operate.
Page 21
21
Electricityis needed to mix chemicals, to drive machinery and equipment and tostart electric
motors etc.
So in the choice of where to locate, every concerned establishment orbusiness should properly
address the issue of power supply.Interruptions in power supply create production problems for
industries;this also translates to inability to meet production schedules, andinability to meet
production schedules leads to frequent customercomplaints for failed deliveries. Frequent
failures to deliver goods onschedule may lead to loss of customers.
In our peculiar Nigerian situation, irregular power supply has taken itstoll on the manufacturing
sector and even service-based activities. Theresult of this poor public power supply has led most
organisations tooperate their own plants but with the attendant high operating costs ofboth fuel
and servicing of generating plants.
3.1.4 Nearness to Water Supply
Water is very important in business especially in manufacturingindustries. Many manufacturing
companies use a lot of water for manufacturing activities.Soft drink manufacturers for example,
use a lot of water in the production process.In the agricultural sector, garri processing factories
use a lot of waterand they are attracted to areas where there is plentiful supply of water.
3.15 Availability of Good Road Networks
Availability of good road networks is another major factor influencingthe location of projects in
the economic landscape. Road networks arevery important. They are important for the movement
of essential rawmaterials from raw material sources to factories and also forthe movement of
finished goods to the markets where they are needed.Most investors in the economy are usually
attracted to areas with goodroad networks. Good road net works reduce the cost of
transportation.
3.1.6 Availability of a Good Rail System
Another important factor influencing the location of projects is the availability of a good rail
system. A good railway system ensures cheaptransportation and evacuation of raw materials
from their sources tofactory locations and also the movement of finished goods to markets.You
may observe that the development of trading locations in Nigeriaseemed to have followed the
railway system. The North –Eraaislwtearyn system runs through towns today which have
become tradingposts. Aba, Umuahia, etc., all enjoy good trading activities because theyare
located along railway line routes.
3.1.7 Nearness to Airports
Another identified factor affecting location of projects is nearness toairports. A lot of businesses
tend to be located close toAirports. encourage quick movement of people to and from
variouslocations. If you take a good look at the country today, the towns thatare served with air
links tend to be enjoying faster economic growth anddevelopment. Port Harcourt, Calabar,
Enugu, etc., enjoy good air linkswhich facilitate the movement of people.
Page 22
22
3.1.8 Availability of Land
In economic theory, there are four factors of production namely: land,labour, capital and the
entrepreneur. Each of these factors is veryimportant. However, Land appears to assume very
importantdimensions especially where large scale agricultural projects areinvolved. Very large
agricultural projects like oil palm plantationsrequire vast areas of land before they can become
profitable. A cassavafarm which will feed a garri processing plant needs to be very vast interms
of land space. You may realise that invariably projects areattracted to areas where there is
adequate land.
3.1.9 Political Considerations
The location of most business projects is driven mainly by economicmotives. Private sector
projects are mainly profit-driven and theirlocation is based only on economic merits. Also the
public sector, sincethe era of economic reforms, has bought the idea of economic reformsand is
now locating projects based on economic merit and viability.
However, not all projects are located based on sound economicjudgment. Political considerations
occasionally play very importantroles in deciding where a project will be located. For example
an oilrefinery may be located very far away from crude oil sources. The costof transporting crude
oil to the refinery may result in the refineryoperating at a loss.
3.1.10 Intervention Projects
Intervention projects are those projects which are conceived and locatedwithin specific areas to
correct inequalities in distribution of resources.In the emerging political dispensation, the issue
of uneven developmenthas been brought to the front line of discussions. Complicating
thediscussions is the issue of resource control and the attendant politicaland social implications.
The Niger Delta region of Nigeria produces a major percentage of theoil revenues of Nigeria.
Recent thinking is that the region hasNot received sufficient attention as a major oil producing
region. Currently,the federal government is focusing attention on the region and a lot
ofdevelopmental projects are now springing up in the area.
SELF ASSESSMENT EXERCISE
List and discuss four factors that have influenced the locationOf industrial projects in your
present environment.
4.0 CONCLUSION
In this unit, we have discussed those factors which affect the location ofprojects in Nigeria. The
projects may be private or public sector projects. The factors may be economic or in some cases
be political.
5.0 SUMMARY
In this unit, we have discussed those factors that affect the location ofprojects in Nigeria. They
range from market driven forces to politicalforces. We have also discussed intervention projects
which are a newfeature in our economy.
6.0 TUTOR-MARKED ASSIGNMENT
a. Mention four factors that are likely to influence the location ofprojects in Nigeria.
Page 23
23
b. Discuss the four factors that you have mentioned.
7.0 REFERENCES/FURTHER READINGS
Leon Ikpe (1999). Project Analysis and Evaluation. Lagos: ImpressedPublishers.
Page 24
24
UNIT 5 CAPACITY AND PRODUCTION PLANNING
CONTENTS
1.0 Introduction
2.0 Objectives
3.0 Main Content
3.1 Capacity and Production Planning
3.2 Concepts of Capacity
3.3 The Nature of the Production Plan
4.0 Conclusion
5.0 Summary
6.0 Tutor-Marked Assignment
70. References/Further Readings
1.0 INTRODUCTION
In Unit 3, we discussed factors affecting location of projects. There weexamined such factors as
nearness to critical markets, nearness tosources of power and other factors. In this unit, we shall
discuss capacityand production planning.
2.0 OBJECTIVES
At the end of this unit, you should be able to:
• explain capacity and production planning
• describe the practical applications in industry.
3.0 MAIN CONTENT
3.1 Capacity and Production Planning
Our interest in capacity and production planning is for two main reasons. First, it could be that
we are project initiators trying to draw upa business plan for a start-up project in which case we
want to knowwell in advance what the capacities of our plants will be andthe production plan.
Understanding capacity of a project assists us to designand construct such items like cash flow
statements, etc. On the otherhand, we could be analysts on the other side of the fence. In this
case,we must have been presented with a business plan or a project plan andhave been asked to
evaluate the project. So no matter on which side weare, we must understand capacity and
production plans. No firmundertakes to produce goods without production plans. Production
plansare linked to the firm‘s demand for goods and services. We shall nowdiscuss ―capacity‖ in
relation to production plans. The production plansare in relation to the manufacture of tangible
goods.
3.2 Concepts of Capacity
Ordinarily, capacity means ―ability to do something‖. But inproject terms, the capacity of a plant
is a reference to the output of the plant ormachine. When discussing plant capacity, we should
realise that thereare three types of capacity namely:
• Installed capacity
• Attainable capacity
• Actual capacity
Page 25
25
Installed Capacity
The installed capacity of a plant or machine is the maximum output interms of tangible goods
which the plant or machine is capableof producing at a given time. The capacity is usually given
bythe manufacturers of the equipment.
We can therefore define installed capacity in terms of the following:
• Number of goods produced per minute
• Number of goods produced per hour
• Number of goods produced per day
• Number of goods produced per year
In practice, we usually define installed capacity in terms ofcapacity. The best way to visualise
installed capacity is to consider aMercedes Benz car that has a speedometer limit of 200km per
hour. Ineffect, 200km/hour is the maximum speed the car can attain according tothe
manufacturers. This 200km per hour is the installed capacity of thecar.
SELF ASSESSMENT EXERCISE 1
A plant can produce 2000 sachets of water per hour, all things beingequal. What is the installed
capacity of the plant per annum?
Attainable Capacity
We have just discussed the installed capacity of a plant or machine anddescribed it as the
maximum output that a plant or machine can achieve.However in real life, no machine can work
for 60 minutes in an hour, 24hours a day and 365 days in a year without breaking down. There
mustbe production loss arising from servicing of the machines, changes inshift, repairs of
machines, etc.Because of these reasons, we now have a more realistic capacity whichin the
literature is known as the attainable capacity of a plant/machinery.
The attainable capacity captures the effect of plant servicing and orrepairs on production output.
Let us go back to our Mercedes Benz car. We said it has an installedcapacity of 200km per hour.
Practically, we know that no person willlike to drive a car at a speed of 200km per hour.
Everyone should bethinking of safety. We could agree amongst ourselves that 100km perhour
constitutes a safe speed. In that line of thinking, we can now define100km per hour as the
attainable capacity of the car. This is the speed atwhich a sane person can drive the car.
Actual Capacity
Actual capacity refers to the real output that a plant can achieve giventhe market situation. We
should realise that the actual capacity of a plantdepends on a lot of factors. First is the issue of
the market for the plant‘soutput of goods. A plant should produce only what it can sell at a
giventime.Again financial resources can limit the output of a plant because firmsrequire finance
to purchase raw materials and other inputs forproduction.
3.3 The Nature of the Production Plan
The production plan shows exactly the proposed output of a plant orproject under consideration.
In constructing the production plan,information on the plant capacity, shift arrangements, raw
Page 26
26
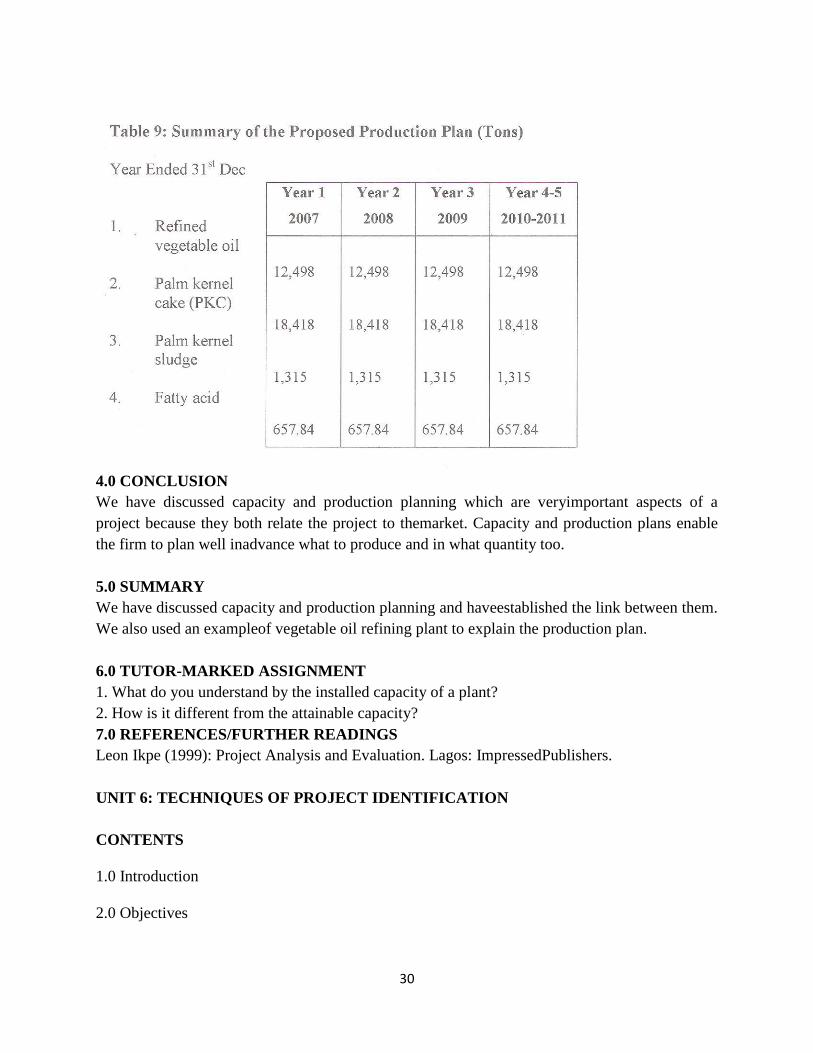
materialsourcing, etc., are all used. Below is the production plan of a vegetableoil refining plant
that uses palm kernel oil as base raw material.
You are requested to properly study the production plan and make sureyou understand it.
An Example of a Production Plan
The Plant
The plant under consideration is a modern vegetable oil refining plantusing palm kernel oil
(PKO) as base raw material. The installed capacityof the plant is 50 metric tons per day of 24
hours.
Working on a shift of 10 hours, an output of 20.83 tons is possible whiletwo (2) shifts of 10
hours each will yield daily output of 41.66tons of refined vegetable oil. Because of the need to
accommodate plantrepairs, servicing, public holidays, etc., the plant will be operated for300
working days in a year. Proposed capacity is based on 2 shifts of 10hours each per day.
To ensure that there is uninterrupted supply of palm kernel oil to feedthe plant, the project
promoter already has in operation 26 Muar ban LeePalm Kernel Oil (PKO) expellers with a total
Installed capacity of 220tons/day.
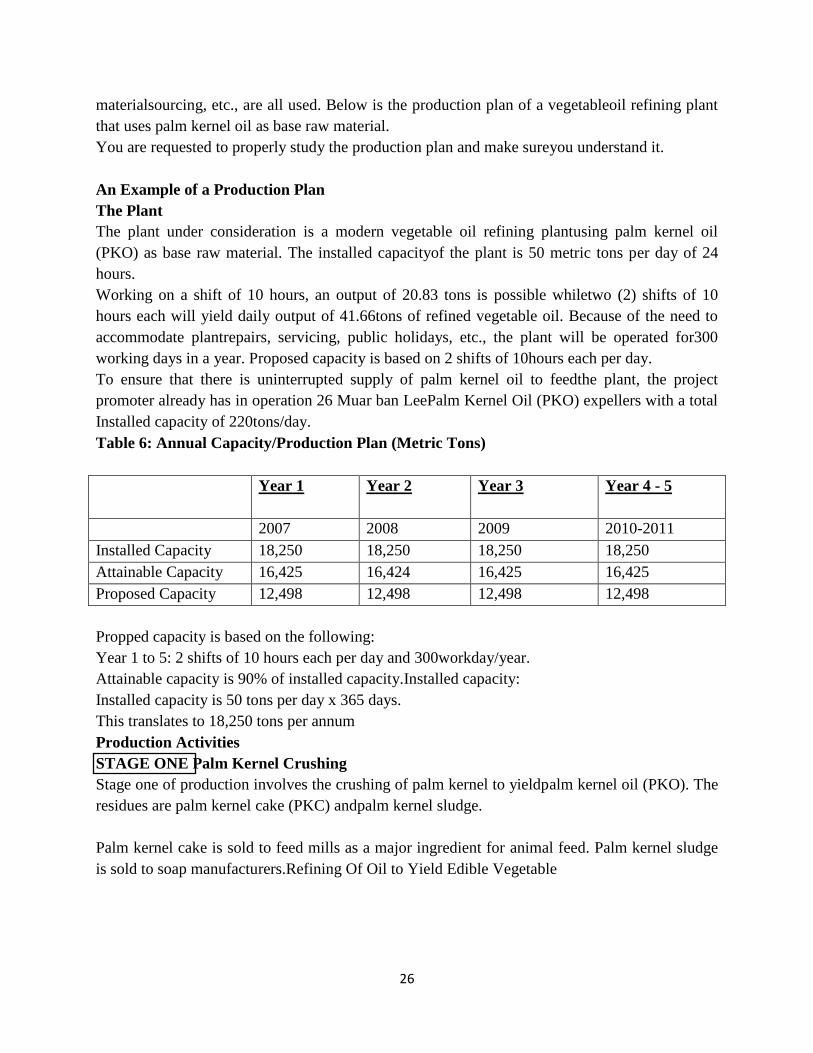
Table 6: Annual Capacity/Production Plan (Metric Tons)
Year 1 Year 2 Year 3 Year 4 - 5
2007 2008 2009 2010-2011
Installed Capacity 18,250 18,250 18,250 18,250
Attainable Capacity 16,425 16,424 16,425 16,425
Proposed Capacity 12,498 12,498 12,498 12,498
Propped capacity is based on the following:
Year 1 to 5: 2 shifts of 10 hours each per day and 300workday/year.
Attainable capacity is 90% of installed capacity.Installed capacity:
Installed capacity is 50 tons per day x 365 days.
This translates to 18,250 tons per annum
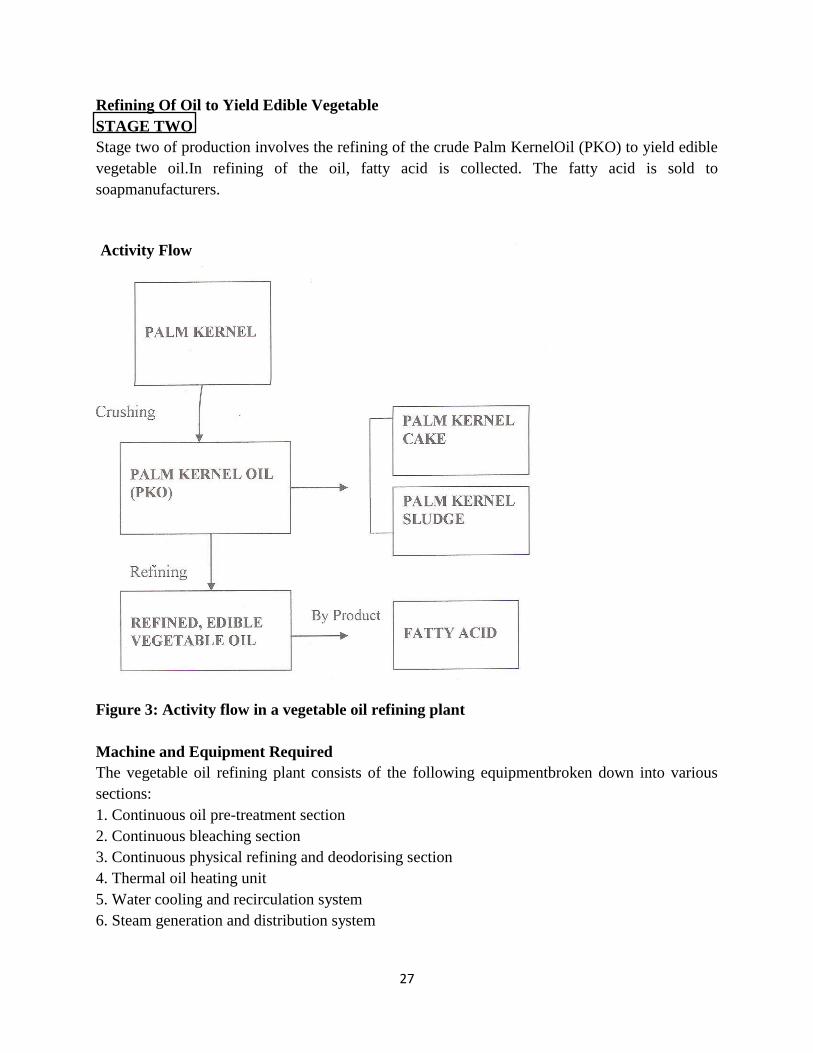
Production Activities
STAGE ONE Palm Kernel Crushing
Stage one of production involves the crushing of palm kernel to yieldpalm kernel oil (PKO). The
residues are palm kernel cake (PKC) andpalm kernel sludge.
Palm kernel cake is sold to feed mills as a major ingredient for animal feed. Palm kernel sludge
is sold to soap manufacturers.Refining Of Oil to Yield Edible Vegetable
Page 27
27
Refining Of Oil to Yield Edible Vegetable
STAGE TWO
Stage two of production involves the refining of the crude Palm KernelOil (PKO) to yield edible
vegetable oil.In refining of the oil, fatty acid is collected. The fatty acid is sold to
soapmanufacturers.
Figure 3: Activity flow in a vegetable oil refining plant
Machine and Equipment Required
The vegetable oil refining plant consists of the following equipmentbroken down into various
sections:
1. Continuous oil pre-treatment section
2. Continuous bleaching section
3. Continuous physical refining and deodorising section
4. Thermal oil heating unit
5. Water cooling and recirculation system
6. Steam generation and distribution system
Activity Flow
Page 28
28
These machinery and equipment will be sourced from overseas.However, in addition, the
following items form part of the equipment required but they will be sourced locally:
1. 2 units crude oil tank 200 tons
2 1 unit refined oil tank 300 tons
3. 1 unit fatty acid tank 50 tons
4. 1 unit furnace oil tank.
Vegetable Oil RefiningProcess Description
Pre Treatment
The crude oil received in the crude oil tanks, if required, is given a hotwater treatment and
allowed to settle to remove settled impurities alongwith water. The oil is then heated till drying
and transferred to highshear mixer wherein the requisite quantity of phosphoric acid is dosed into
allow conversion of non hydra tablephosphotides. Theacidulatemixture is then given a retention
time for complete reaction ofphosphoric acid in the reaction vessel.
Bleaching
The heated oil (acid conditioned, degummed or neutralised) enters theinlet mixing tube of the
vacuum bleacher. Bleaching earth isproportioned by a valve dosing system that also desecrates
thebefore it enters the vessel. The earth is introduced under the oil spray inthe mixing tube for
improved mixing, so that earth does not enter thebleaching vacuum system. The earth absorbs
any residual gumssoap as well as trace metals, colour bodies and other polar impurities.
The bleacher has multiple agitated compartments and operates undervacuum to ensure complete
moisture and air removal. The dried oil andearth mixture is discharged by the bleacher discharge
pump to one of thefilters where the spent earth is removed. The filtered oil is collected inthe
bleached oil receiver. The bleached oil pump sends the oilfiter via one of the alternating polish
filters.
Filter Management
The standard bleaching system is based on the use of two filters ofwhich one is on line while the
other is being cleaned and prepared forthe next cycle. When a filter has reached maximum
capacity, asindicated by high feed pressure, it is taken offline for cleaning andreplaced by the
other filter.
The cleaning procedure begins by first pressurizing the filters with steamto expel residual oil into
the Heel Tank and dry the spent filter cake. Theoil recovered from the filter cake is collected in
the tank and can usuallybe recycled to the bleacher. After drying, a bottom discharge valve onthe
filter is opened and the leaves pneumatically vibrated so that thespent cake is dislodged and
discharged via a hopper. The filter is thenclosed and prepared for the next batch. Before going
online again it canbe pre-coated with filter aid and/or bleaching earth in order to seal the
filter.
Raw Material Requirements
Page 29
29
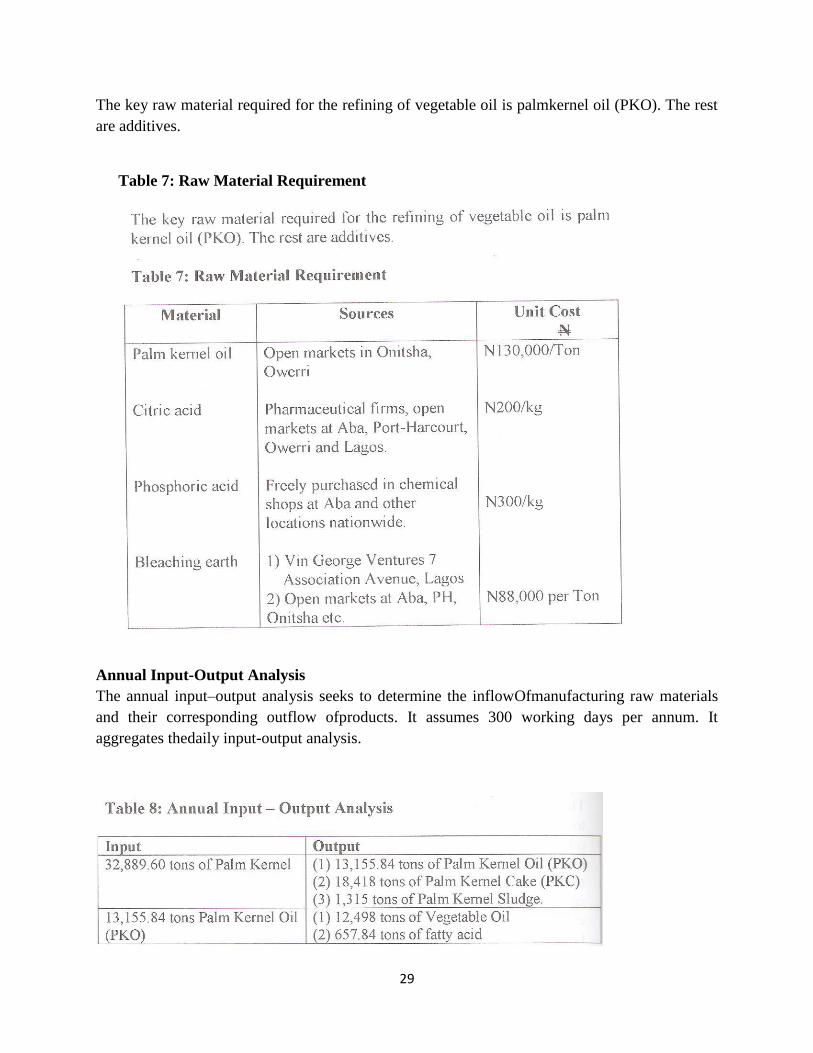
The key raw material required for the refining of vegetable oil is palmkernel oil (PKO). The rest
are additives.
Annual Input-Output Analysis
The annual input–output analysis seeks to determine the inflowOfmanufacturing raw materials
and their corresponding outflow ofproducts. It assumes 300 working days per annum. It
aggregates thedaily input-output analysis.
Table 7: Raw Material Requirement
Page 30
30
4.0 CONCLUSION
We have discussed capacity and production planning which are veryimportant aspects of a
project because they both relate the project to themarket. Capacity and production plans enable
the firm to plan well inadvance what to produce and in what quantity too.
5.0 SUMMARY
We have discussed capacity and production planning and haveestablished the link between them.
We also used an exampleof vegetable oil refining plant to explain the production plan.
6.0 TUTOR-MARKED ASSIGNMENT
1. What do you understand by the installed capacity of a plant?
2. How is it different from the attainable capacity?
7.0 REFERENCES/FURTHER READINGS
Leon Ikpe (1999): Project Analysis and Evaluation. Lagos: ImpressedPublishers.
UNIT 6: TECHNIQUES OF PROJECT IDENTIFICATION
CONTENTS
1.0 Introduction
2.0 Objectives
Page 31
31
3.0 Main Content
3.1 Project identification
3.2 Steps in Project Identification
3.3 Project Identification Techniques
3.4 Tools for Data Collection among Project Identification Techniques
4.0 Conclusion
5.0 Summary
6.0 Tutor-Marked Assignment
7.0 References/Further Reading
1.0 INTRODUCTION
In this unit, we will examine project identification and project identification techniques. Project
identification results from issues emerging from the external environment. You might pick up on
these issues in the environment by reading reports on trends in the geographical area where you
work and/or when speaking to stakeholders (including users) about the local issues arising. The
unit also discusses a lot on project identification techniques that will address the needs and
capacities of the stakeholders.
2.0 OBJECTIVES
At the end of this unit, you should be able to:
understand the meaning and steps in project identification.
explain the top-bottom and bottom-up approaches to project identification as well as their
merits and demerits.
Describe the various project identification techniques.
Page 32
32
3.0 MAIN CONTENT
3.1 Project identification
Identification, the first stage of the projectcycle, is a crucially important process leadingto the
initial screening of projects.Project identification is the initial phase of the project development
cycle. It begins with the conceiving of ideas or intentions to set up a project. These ideas are then
transformed into a project.
This first step in the project cycle is to identify an issue that a project could address. This usually
involves ‗needs assessment andcapacity assessment‘or ‗appreciative enquiry‘ as referred by
some people.Need assessmentfinds out what community needs are and whom they affect. The
project should seek to strengthen any weaknesses. That is, prevailing problem in a given area.
Capacity assessmentis by asking community members to identify the resources they have and
then asks them how they want to use them in the future. Also explain availability of resources in
a given location.
Projects are usually identified or conceived by the followingentities:
a) Government agencies preparing the national,regional or sectoral developmentplan;
b) Bilateral or multilateral aid agencies/international development agencies
conductingcountry economic/sector studies orex-post evaluation of completed projects;
c) Public or private-sector entities in the countryor donor countries, municipalities, policy
makers; localresidents/group of people/communities, non-governmental organizations
(NGOs), academics; and
d) Others (individuals or planners) conductinga project.
3.2 Steps in Project Identification
Page 33
33
Project identification generally consists ofthe following steps:
1. Propose measures to solve major problemsidentified in the development strategy andto
meet diverse development needs, whilesetting clear project objectives and
identifyingtarget groups receiving benefits fromthe project;
2. Establish the project concept (together withalternative plans) that will effectively serveto
achieve the country‘s development objectives;
3. Assess the priority or urgency of the projectin the context of the country‘s economicand
social development plan and sector investmentprogram;
4. Examine consistency with the master plan and the regional development plan;
5. Consider the adequacy of the ExecutingAgency and the possibility of private-
sectorparticipation in the project;
6. Estimate approximate project cost (togetherwith the cost of alternatives) based on
theconceptual design; and
7. Make preliminary assessment of the feasibilityof the project and its impacts on
thecountry, its specific region or sector.
3.3 Project Identification Techniques
There are two major techniques or approaches to project identification
a) Top-down technique/approach
b) Bottom-up technique/approach
A) Top-down technique/approach
In this approach, projects are identified based on demands from beyond the community. This
may include directives from:international conventions; international institutions or NGOs that
Page 34
34
have determined particular priorities and thus projects; national policy makers identifying
projects that pertain to party manifestos and/or national plans. The approach as some advantages
and disadvantages:
Advantages of Top-Down Approach
1. It may be a rapid response to disasters like floods, war outbreak because there is limited
time and chance to consult the beneficiaries.
2. It can be effective in providing important services like education, health, water, roads etc.
3. It can contribute to wider national or international objectives and goals and therefore
potentially be part of a wider benefit (e.gtrans-boundary resources, such as climate)
Limitations of Top-Down Approach
1. Does not help in modifying strongly established ideas and beliefs of people.
2. Assumes external individuals know better than the beneficiaries of the service.
3. Communities have little say in planning process rendering approach devoid of human
resource development.
4. Community develops dependency syndrome on outside assistance and does not exploit
their own potential.
5. The development workers (change agents) become stumbling blocks to people-led
development tendency to impose their own biases, etc. on people.
Top-down techniques to project identification
Technique 1: The household (socio-economic) survey
Page 35
35
This technique studies social and economic situations of a given area e.g. climate, geographical
set-up, economic activities, political set up, education system, culture, diet, social services,
physical infrastructure etc. The data collection techniques arelistening, questionnaires,
interviews, documentation, and direct observation.The data collected through these means are
processed and analyzed and projects are then identified.
Technique 2: Rapid appraisal
This is also called Rapid Rural Appraisal (RRA) when carried out in a rural areas, and Rapid
Urban Appraisal(RUA) in an urban area. The method collects and assesses data quickly using
any data collection techniques. The primary purpose is to acquire the information in the shortest
time possible and it lowers the cost.It is rapid because investigation, assessment and
identification of projects are done at the same time. Rapid appraisal uses the following data
collection techniques:Analysis of secondary data sources; Interviews; Direct observation at site
and visualization of Resources like social organizational maps and time series maps.
Technique 3:Needs Assessment Survey
It is also referred to as situation analysis (SITAN). It involves: fact finding about problems or
needs in a given area or community; finding out what is lacking in a given area or community;
investigating a situation in a given area; finding out the problem in a given community so as to
identify the most appropriate solution (s)/project (s) to solve the problem (s) in question; and
analyze the causes of the problems and seek likely solutions to the problems leading to project
identification.
B). Bottom-Up Technique/Approach
Page 36
36
In this approach community/beneficiaries are encouraged to identify and plan the projects
themselves with or without outsiders. This approach also has some merits and demerits.
Advantages of Bottom-Up Approach
1. Interveners accomplish more with limited resources since people tend to safeguard what
they have provided for themselves.
2. Develops people‘s capacity to identify problems and needs and to seek possible solutions
to them.
3. Provides opportunities of educating people.
4. Helps people to work as a team and develop a ―WE‖ attitude - makes project progressive
and sustainable.
5. Resources are effectively managed; dependence reduces, there is increased equity,
initiative, accountability, financial and economic discipline.
Limitations of Bottom-Up Approach
1. Not always effective for projects that require urgency to implement
2. Time-consuming and requires patience and tolerance.
3. People sometimes dislike approach because they do not want to take responsibility for
action.
4. The agency using this approach is never in control and cannot guarantee the results it
would want.
5. The priorities of communities may not fit with national or international priorities that
seek to have a broader impact
Page 37
37
Bottom-up techniques to project identification
Techniques 1: Animation
This is the process of stimulating people to become more aware and conscious of problems they
suffer from. This will help to gain confidence in their ability to deal with these problems and take
initiatives to improve situation. Animation makes the community better understand and be
prepared to overcome its problems and take decisions with full responsibility. It is carried out by
Animators / Helpers / Change agents, which could be internal or external (Internal Animators if
they come from within the community or External Animators if from outside).
Technique 2:Facilitation/Community action
This technique is an attempt to assist people to get over problems by (say) training them in
certain skills, providing them with the needed information e.g. market information, linking them
up with relevant agencies and organizations to improve access to the needed resources etc.
Technique 3:Participatory Appraisal
The participatory appraisal technique could be in two forms - participatory rural appraisal(PRA)
when carried out in rural areas; and participatory urban appraisal (PUA) when carried out in
urban areas. PRA/ PUA techniques can be described as a family of approaches, methods and
behaviours that enable people to express and analyze the realities of their lives and conditions, to
plan for themselves what action to take, and to monitor and evaluate the results. The key to
PRA/PUA is that the only external involvement is in facilitation. The communities themselves
determine the issues, priorities and courses of action.Once the needs/issues have been grouped,
community members can decide which of the issues should be given priority. They then place
Page 38
38
them in order, from the most important to the least important. After priority has been set, decide
whether it is realistic for the organization to strengthen the community‘s capacity to meet the
priority need: Does meeting the need fit in with our mission?Does meeting the need agree with
our values?Do we have enough experience? Do we have enough resources?
Technique 4:Needs Assessment Survey
It is also referred to as situation analysis (SITAN).In general, needs assessment is done fairly
quickly. How projects come about through need assessment are: the project should come out of
what people say they want and not from assumptions that we make; sometimes the needs are not
immediately clear or cannot be easily understood; by talking to different people, we will be able
to understand how problems affect people differently; circumstances change in the environments
(such as there may be new people in the community; there may be new needs; old needs might
have been addressed; and problems might be affecting people differently); and needs assessment
gives people an opportunity to priorities their needs, which leads to a more sustainable
development project.
Technique 5: Capacity Assessment Survey
Communities should be encouraged to use their own capacities and resources to address the
problems they face. It is therefore important to carry out a capacity assessment after needs
assessment to identify strengths that the community could use to address the problems they
identified earlier. The project, if needed, should focus on strengthening the community‘s
Page 39
39
capacities to address their problems. By doing this, we are facilitating the community to address
their problems rather than addressing their problems for them.
Capacity Assessment involves Six Types of Assets, they are: Human: These enable people to make
use of their other resources. They include skills, knowledge, ability to work and good health.
Natural: These form the local environment and include land, trees, water, air, climate and
minerals.Social: These are based on relationships and include organizations and groups within
the community, political structures and informal networks.Economic: These are things that people
can use to sustain their livelihoods, such as money and savings, grain stores, livestock, tools and
equipment.Physical: These are man-made, such as building, transport, water supply and
sanitation services, energy sources and telecommunications.Spiritual: These include faith,
scripture, guidance and prayer.
Technique 6: Focus Groups
This tool is used with a group of 10–20 people. It helps them to understand and voice some of
the problems they face and the needs they have. A focus group enables people with different
views to discuss their differences, challenge assumptions and come to a collective understanding
of the needs of the community. By exploring issues together from the start, communities start to
own the development intervention.
Questions to stimulate discussion could include the following:What are the main pressures that
people in the community are facing?What simple things could be done to improve the
situation?If you could change one thing in this community, what would it be? Why?
Technique 7: Community Mapping
Page 40
40
This tool involves community members drawing a map of their community to tell their story
together. They draw either on paper or outside on the ground, using whatever resources are
available. They are given little guidance of what to include. The important point of the exercise
is to discuss what people have drawn. The map might show the natural and physical resources in
the area – forests, rivers, roads, houses, wells. It might show important people and organizations.
Once the map has been drawn, encourage discussion by asking questions such as:How did you
decide what to include? What was excluded?What was emphasized? Which are the most
important parts?What was difficult to represent? What were the areas of disagreement?What can
we learn from the map about the needs of the community?To gain greater understanding of the
issues facing different groups within the community, the groups should work separately. A map
by young people may show very different information from that of older people.
These many techniques discussed enable communities to identify their needs and project
identifier the project to do.
3.4 Tools for Data Collection among Project Identification Techniques
A few tools are outlined below as examples of some of the options available for data collection
Questionnaire:The kind of questions we ask makes a difference to the information we can
gather. Asking the wrong kind of questions will limit the information discovered. The important
thing is to avoid closed questions where people can answer only yes or no. Try to use open-
ended questions which allow the person replying to give more information. For example, ‗What
do you think of the new health post?‘To explore people‘s answers, questions normally begin
with one of the six ‗helping words‘: What? When? Where? Who? Why? How?
Page 41
41
Listening:Listen carefully, and explore people‘s answers. Be flexible and be ready to ask
unprepared questions if someone says something interesting. By listening for the issues about
which people have the strongest feelings, it is possible to identify the issues that they most want
addressed and projects which they are most likely to participate in.
Interviewing:This tool helps us to gain greater understanding of the issues. It involves talking to
key people in the community in order to discuss their knowledge, experience and understanding
of the issues. These people might already be involved in community development activities, they
might be people that the community turn to in times of crisis or those who are seen as the heart
of the community. Key people include health workers, traders, religious leaders, village chiefs,
pastors and teachers. When choosing people to interview, make sure their views and opinions are
likely to represent those of others in the community. Take care not only to interview the
powerful, but also to interview those whose views are not usually heard.Use open-ended
questions such as: What are the main problems you face in your area of work?What are the main
pressures that people in the community face?What simple things could be done to improve the
situation?
4.0 CONCLUSION
We conclude that need and capacity assessment are important for project identification. Helpful
techniques for project identification are household (socio-economic) survey, need assessment
survey, participatory appraisal, capacity assessment survey, focus group, community mapping
and animation.
5.0 SUMMARY
Page 42
42
In this section of the module, we have discussed project identification and steps in project
identification. We them explain needs assessment and capacity assessment as mean of project
identification. The section alsoidentify and talk about techniques for project identification
household (socio-economic) survey, need assessment survey, participatory appraisal, capacity
assessment survey, focus group, community mapping and animation.
6.0 TUTOR-MARKED ASSIGNMENTS
1. Discuss the meaning of project identification.
2. List the steps in project identification.
3. Identify and discuss five techniques of project identification in any of the approaches.
7.0 REFERENCES/FURTHER READINGS
Tearfund (2003).Project identification.Project Cycle Management, Root 5, Tearfund Roots
Resources, 6-18.
Project Identification, Module 5, 1-23.
Tsige, K. (2012). Project Cycle Management: Project Identification and Selection
Phase.Altantic International University, Press Room AIU News, 1-17
MODULE 2: Man Power Planning and Analysis
Unit 1 Manpower Planning and Evaluation
Unit 2 Demand Analysis
Unit 3 Supply Analysis
Unit 4 Competition and Marketing Plans
Unit 5 Project Cost Analysis
Page 43
43
UNIT 1 MANPOWER PLANNING AND EVALUATION
CONTENTS
1.0 Introduction
2.0 Objectives
3.0 Main Content
3.1 Manpower Planning and Evaluation
4.0 Conclusion
5.0 Summary
6.0 Tutor-Marked Assignment
7.0 References/Further Readings
1.0 INTRODUCTION
In Unit 5, we discussed the concept of an engineering evaluation of aproject. Engineering
evaluation of a project as we saw seeks to evaluatethe engineering soundness of a project. This is
very crucial especiallywhen the project will be ranked or compared with another project.
Every enterprise requires labour. It is labour that coordinates the otherfactors of production like
land and capital. In terms of projectevaluation, our concern is to look at the project and examine
the humanresources aspects. In terms of manpower planning and evaluation, weneed to examine
the following:
• Key employees
• The key responsibilities
• The qualifications
• Hours of work
• Training and development of the staff
• Remuneration of the staff
2.0 OBJECTIVES
At the end of this unit, you should be able to:
• explain manpower planning and evaluation
• discuss the practical applications in industry.
3.0 MAIN CONTENT
3.1 Manpower Planning and Evaluation
In general terms organising manpower in an organisation is the processof assigning duties
amongst personnel and coordinating efforts towardsthe attainment of the firm‘s objectives. But
Page 44
44
before organising, there mustbe a plan. It is the plan that leads to the shaping of an
organization‘sstructure.
Conceptually, the project initiative in structuring the organisation shouldbe concerned about two
critical things.
• Job definitions in the project under consideration
• Departmentalisation which follows job definitions.In doing this, similar jobs are grouped
together to form a department.The most common way of organising a project is by function.
For example a manufacturing plant may be divided into threetype‘snamely:
• Production
• Marketing
• Finance
There are two uses of the manpower plan. The first use is by the projectinitiator. When the
project initiator is structuring the project, themanpower plan definitely is a critical component.
The project initiatorneeds to know well in advance who the key employees will be. The
keyemployees will depend on the nature of the business in question. If thebusiness is, for
example, soap manufacturing, then a lot of theproduction staff should be industrial or pure
scientists plus other coresupport staff. Apart from that, each employee should have their
variousresponsibilities. For example, in a soap plant, you will have production staff and also
quality control staff. They have difference responsibility. And of course, the qualifications of the
various staffincluding their years of experience should be properly documented andevaluated.
The second use of the manpower plan is that financial institutions likebanks, before granting
loans or overdraft for a project, usually insist onbeing convinced of the management skills that
will be available or areactually available in the firm that seeks to borrow money. They willlook
at the people concerned, their qualifications and match them withthe jobs allocated to them.
Hours of work and the salary and wages of the entire work force areanother critical input. The
salary and wages of those working on aproject is actually expected to hover around the average
for the industry.
In practical terms, the manpower of a project can be grouped into twonamely:
• Direct labour
• Indirect labour
When we talk about direct labour in a manufacturing project, e.g., a soapplant, we are talking
about staff attached to the actual production of thesoap. The production manager, production
supervisor and factoryattendants are all direct labour.
Indirect labours on the other hand are those workers who do not workdirectly on the
manufactured goods but indirectly. They includeaccounting and admin staff, marketing staff and
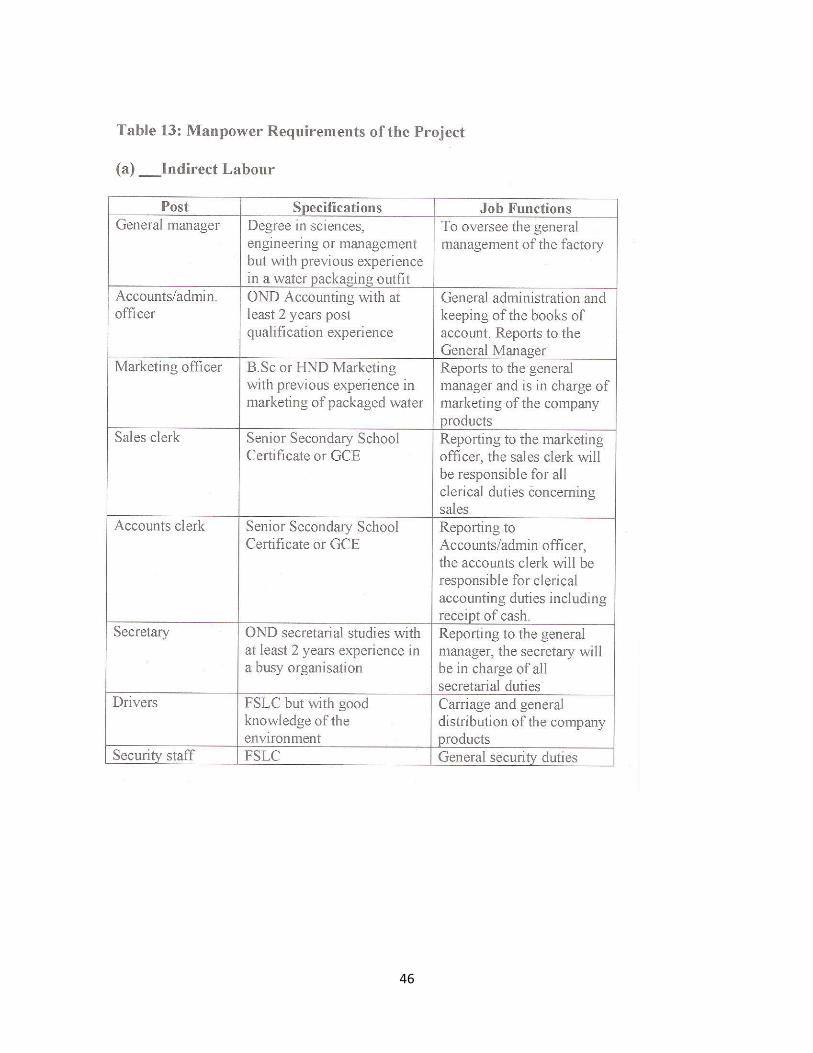
others.We have an example of a manpower plan. It contains the following:
• Manpower requirements of the project broken down into direct andindirect labour
• Remuneration of the staff
Page 45
45
SELF ASSESSMENT EXERCISE
List and explain four departments that could be found in a bigmanufacturing firm.
Page 47
47
Post Specifications Job Functions
General manager Degree in sciences, To oversee the generalengineering or management of the
factorybut with previous experiencein a water packaging outfitAccounts/admin. OND
Accounting with at General administration andofficer least 2 years post keeping of the books
ofqualification experience account. Reports to theGeneral ManagerMarketing officer B.Sc or
HND Marketing Reports to the generalwith previous experience in manager and is in charge
ofmarketing of packaged water marketing of the companyProductsSales clerk Senior Secondary
School Reporting to the marketingCertificate or GCE officer, the sales clerk willbe responsible
for allclerical duties concerningsalesAccounts clerk Senior Secondary School Reporting
toCertificate or GCE Accounts/admin officer, theaccounts clerk will beresponsible for
clericalaccounting duties includingreceipt of cash.Secretary OND secretarial studies with
Reporting to the generalat least 2 years experience in manager, the secretary willa busy
organisation be in charge of allsecretarial dutiesDrivers FSLC but with good Carriage and
generalknowledge of the distribution of the companyenvironment productsSecurity staff FSLC
General security duties
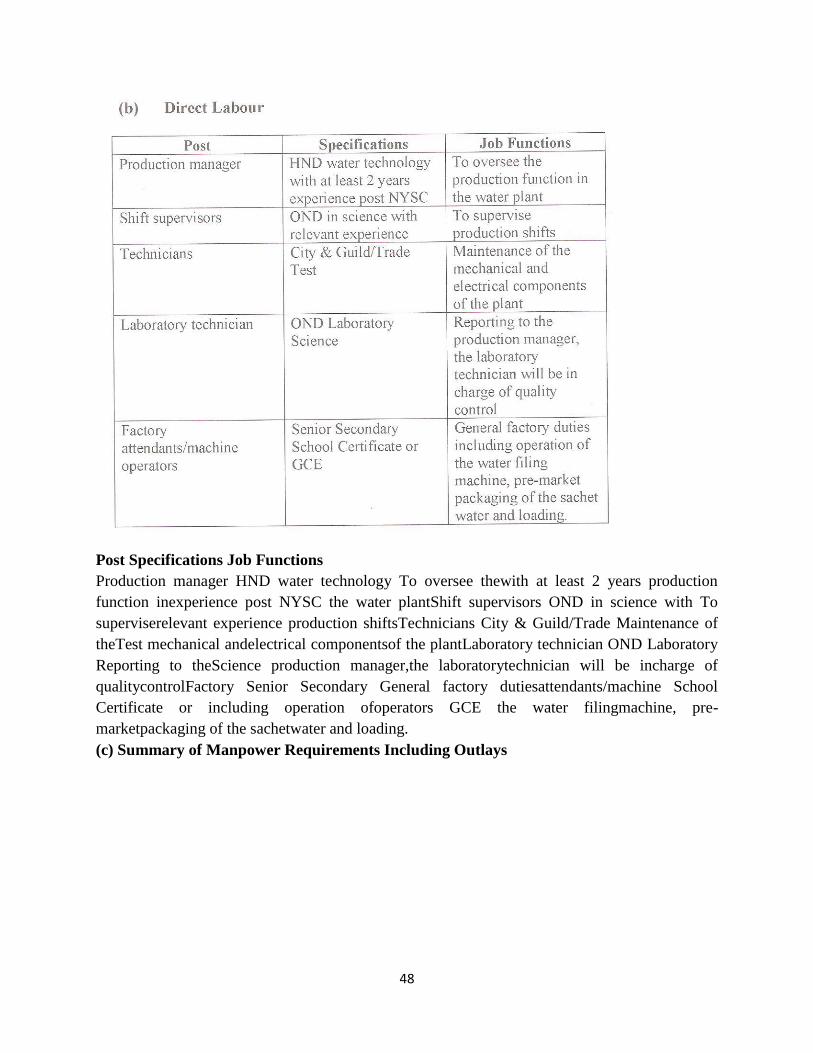
(b) Direct Labour
Page 48
48
Post Specifications Job Functions
Production manager HND water technology To oversee thewith at least 2 years production
function inexperience post NYSC the water plantShift supervisors OND in science with To
superviserelevant experience production shiftsTechnicians City & Guild/Trade Maintenance of
theTest mechanical andelectrical componentsof the plantLaboratory technician OND Laboratory
Reporting to theScience production manager,the laboratorytechnician will be incharge of
qualitycontrolFactory Senior Secondary General factory dutiesattendants/machine School
Certificate or including operation ofoperators GCE the water filingmachine, pre-
marketpackaging of the sachetwater and loading.
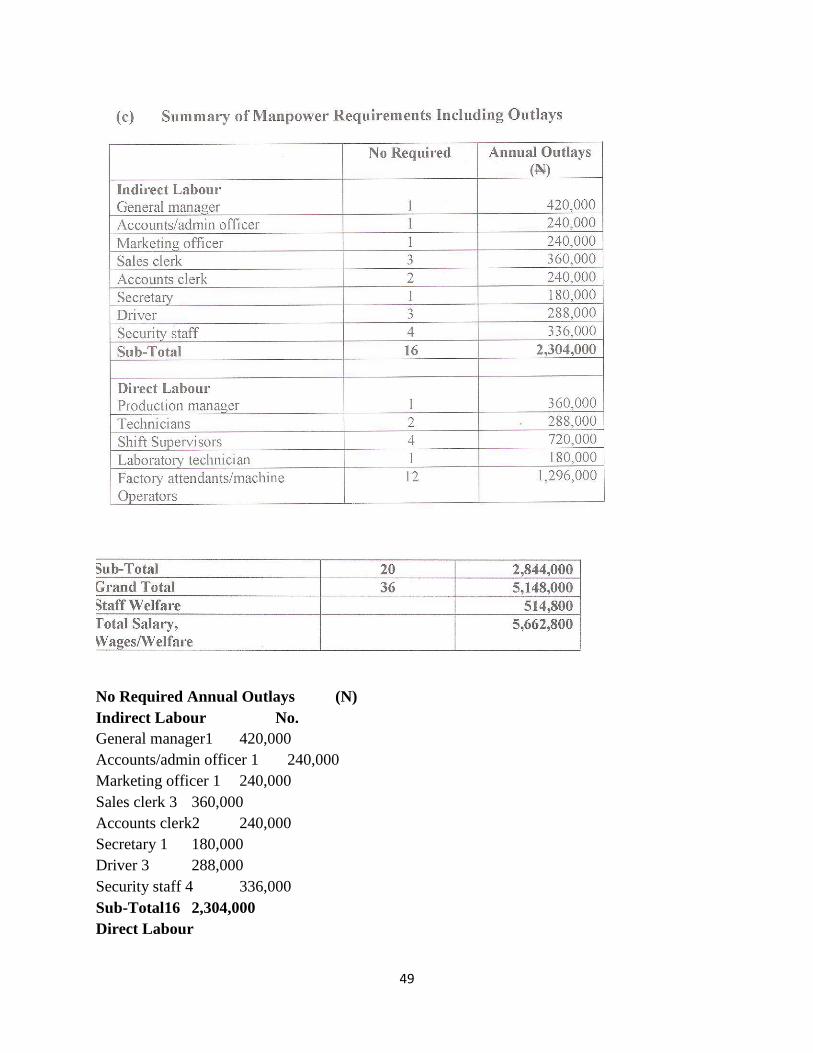
(c) Summary of Manpower Requirements Including Outlays
Page 49
49
No Required Annual Outlays (N)
Indirect Labour No.
General manager1 420,000
Accounts/admin officer 1 240,000
Marketing officer 1 240,000
Sales clerk 3 360,000
Accounts clerk2 240,000
Secretary 1 180,000
Driver 3 288,000
Security staff 4 336,000
Sub-Total16 2,304,000
Direct Labour
Page 50
50
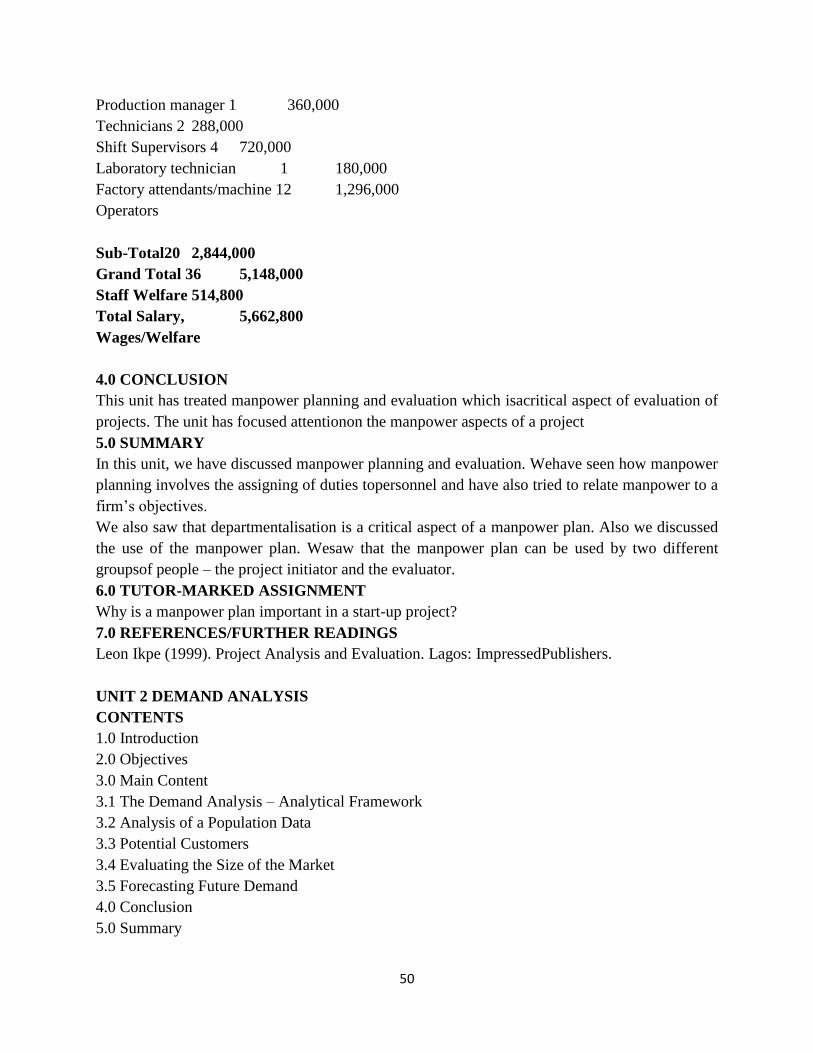
Production manager 1 360,000
Technicians 2 288,000
Shift Supervisors 4 720,000
Laboratory technician 1 180,000
Factory attendants/machine 12 1,296,000
Operators
Sub-Total20 2,844,000
Grand Total 36 5,148,000
Staff Welfare 514,800
Total Salary, 5,662,800
Wages/Welfare
4.0 CONCLUSION
This unit has treated manpower planning and evaluation which isacritical aspect of evaluation of
projects. The unit has focused attentionon the manpower aspects of a project
5.0 SUMMARY
In this unit, we have discussed manpower planning and evaluation. Wehave seen how manpower
planning involves the assigning of duties topersonnel and have also tried to relate manpower to a
firm‘s objectives.
We also saw that departmentalisation is a critical aspect of a manpower plan. Also we discussed
the use of the manpower plan. Wesaw that the manpower plan can be used by two different
groupsof people – the project initiator and the evaluator.
6.0 TUTOR-MARKED ASSIGNMENT
Why is a manpower plan important in a start-up project?
7.0 REFERENCES/FURTHER READINGS
Leon Ikpe (1999). Project Analysis and Evaluation. Lagos: ImpressedPublishers.
UNIT 2 DEMAND ANALYSIS
CONTENTS
1.0 Introduction
2.0 Objectives
3.0 Main Content
3.1 The Demand Analysis – Analytical Framework
3.2 Analysis of a Population Data
3.3 Potential Customers
3.4 Evaluating the Size of the Market
3.5 Forecasting Future Demand
4.0 Conclusion
5.0 Summary
Page 51
51
6.0 Tutor-Marked Assignment
7.0 References/Further Readings
1.0 INTRODUCTION
In Unit 1, we discussed manpower planning and evaluation. Here wesaw the fact that labour is
one of the most important aspects of a projectwhether a start-up or an on-going one. We also
used an example to drivehome our point.
In this unit, we shall discuss demand analysis. Demand analysis is onefirst steps towards looking
at a market.Demand analysis is the starting point of our discussions concerning theproject and
the external environment which is the market. A project isestablished for a purpose –to serve a
market.
The demand analysis is the measurement and forecasting of demand forgoods and services of a
project. It is like a peep into the future, which asyou know, is unknown. A project will survive if
the products andservices produced by the project are acceptable to the market.
Acceptability means that consumers are willing to pay for the goods orservices. Demand analysis
is a tool used by the project initiator toanalyse the total picture of the market that he/she wants to
play in.Likewise, providers of loanable funds like banks also conduct demandanalysis to ensure
that the projects they wish to sponsor financially havethe chances to survive in the market. So
from whatever angle you lookat it, demand analysis is important.
2.0 OBJECTIVES
At the end of this unit, you should be able to:
• explain what a demand analysis is
• discuss how to conduct demand analysis.
3.0 MAIN CONTENT
3.1 The Demand Analysis – Analytical Framework
To arrange our discussion in an orderly manner, we will try to build ananalytical framework that
we shall use to do demand analysis.The frame work will guide us to take an architectural view of
the subjectmatter. In taking an architectural view, we shall be looking at the largerpicture. The
analytical framework we shall adopt will follow thesequence below:
• Get total population data and make projections.
• Study the details of the population.
• Define the good or service for which demand analysis isto beinducted.
• Define demand again to guide your direction.
• Look at factors affecting demand.
• Using both quantitative and qualitative techniques, generateconditional demand.
• Generate projections for demand using quantitative and qualitativemethods.
Page 52
52
3.2 Analysis of a Population Data
Page 53
53
We have seen that the starting point of our discussion of a properdemand analysis is to study the
population. But we should alsounderstand that getting the total population figure is not the end of
thejob. We should go further and analyse the population. The purpose ofthe analysis is to
understand certain characteristics of the population.
For example, a manufacturer of lipstick has nothing to do with the totalpopulation. Rather what
is important to the manufacturer is the totalfemale population. There are other aspects of the
population that weconsider important. Age distribution of a population is one of suchaspects.
The age distribution of a population is important because itbreaks down the population into the
various age brackets. Perfectknowledge of the age distribution of a population enables a would-
beinvestor have an idea of his total feasible market well in advance. Forexample, a manufacturer
of baby toys will not be interested in the totalpopulation of Nigeria. What will interest the
manufacturer is the totalnumber of babies in the population. We have stressed the importance
ofpopulation data in the understanding of demand analysis. We will go a
step further to provide a checklist of further information that is requiredwhen we are analysing a
population data.
3.3 Potential Customers
Page 54
54
A starting point for our discussion is to properly define whothe potential customers of the
business are or will be. Customer definition isnot an easy task as we shall soon see.Sometimes
confusion arises as to who is a customer because people alsofail to distinguish customers from
consumers.
The term consumer refers to the person or one who uses a product (orservice) for his/her
personal satisfaction or benefit. The consumer is the one who changes the form of a product
toalter its identity. For example, a soap manufacturer will buy caustic sodaand use it to
manufacture soap. He is the consumer of the raw material.On the other hand, a customer may be
a consumer or a dealer who buysa product and eventually resells the product. Also even for a
service, thebusiness should clearly identify the types of consumers that they wish toserve. For
example, there may be many types of hotels because of thetypes of customers that need to be
served namely:
• hotels for students
• hotels for travellers
• hotels for high-class individuals
3.4 Evaluating the Size of the Market
Apart from identifying who the potential customers of the smallbusiness are, there is the need for
us to go ahead and evaluate the size ofthe market for our products or services. The evaluation of
the size of themarket is very important because it gives us a picture of the total marketsize in
terms of naira and kobo.
A standard analysis should state the market size of the product or servicein question. The size of
the market is usually estimated by using bothqualitative and quantitative methods. To enable us
Page 55
55
approach our studiescarefully, let us follow the following steps in our effort to evaluatemarket
size:
• Define demand
• Examine factors affecting demand
• Examine demand for intermediate and capital goods
• Build market demand.
Defining Demand
For us to be able to properly prepare demand analysis, we need to definedemand and understand
what we mean by demand.For purposes of our study, we shall define demand for a product
orservice as the total quantity of goods or services that able customers in adefined area are
willing to buy at set prices. In effect therefore, demandrefers to a set of quantities that customers
are willing to buy at different in prices. In the traditional economic setting, the demand curve
isdownward sloping (with a price and quantity axis).It will also be very important for us at this
particular time to define anddistinguish between two types of demand – total market demand
andproject demand. Total market demand refers to the total demand withina set geographical
area like Nigeria. For example we can make statement that the total demand for beer in Nigeria is
10 million bottlesper annum. The meaning of the statement is that in Nigeria, the totalquantity of
beer demanded is 10 million bottles at the current rulingprices. But we also need to define
another type of demand which weshall call project demand.
Project demand is a subset of the total market demand. If a market for aproduct or service
already exists, the project demand is theprojects total market demand. If a market is saturated
with goods, newprojects may face the difficulty of selling their products or services. Byand
large, it is important to focus attention on a projects which tend to be fatal occur when analysts
confuse market andproject demand.
Factors Affecting Demand
We have just defined demand which is very important in our study. Butwe need to go a step
further to examine the factors affecting demand inthe market place. It is going to help us build a
good demand schedule. Inthe traditional economic platform, one of the most important
factorsaffecting demand is price. If we assume a well behaved demand curve,then the higher the
price of a product, the smaller the quantity that willbe bought.Also the lower the price, the
greater the quantity that will bepurchased. This appears to be a rational behaviour
especiallywhen human beings are involved.
Another important factor affecting demand for a product or service is theincome of the
population. Given a basket of income available to purchasers, it is logical to believe that the
higher incomes of people, the more goods and services they are likely to purchase. So wecan say
with a measure of confidence that a population with a higherincome is more likely to purchase
more goods and services population with a lower income.
Page 56
56
Apart from income, population is another major factor affecting demandin any given setting. It is
certain that a large population demand more goods and services than a smaller population. A
majoraspect of any population which we should not forget is the ethnic andreligious structure of
the population. The ethnic structure of a populationaffects the type of goods and services that
will be demanded. Forexample, in the Nigerian setting, palm oil tends to sell much more in
theSouthern States than in the North because most Southerners tend to usepalm oil in cooking.
But in the Northern States, groundnut oil seems tobe more available and by implication the
people use more of it for theircooking. Also, religion is another aspect of any population that
needs tobe looked at while drawing up any demand schedule. Again in theNigerian setting, pork
is not an acceptable diet for Muslims but mostChristians eat pork. These are the type of critical
inputs you need whenyou are trying to build a demand schedule. Prices of other goods alsotend
to affect demand. For example, tea and sugar are said to complementary goods since they go
hand in hand. It is therefore logicalto say that the price of tea at any given time will affect the
demand forsugar. In the same fashion, bread and butter also appear to becomplementary goods.
Demand for Intermediate and Capital Goods
When we largely discussed demand our general thinking appeared to bethat the goods discussed
ought to be consumer goods. But that is notalways true. There are some goods which are
generally known asintermediate and also capital goods. It is important that we understandthese
two types of goods.
We shall go ahead to discuss intermediate goods as goods which are notpurchased for immediate
consumption but rather are used in theproduction of consumer goods. For example flour is an
intermediategood mostly used in the manufacture of bread. Tyres also appear to beintermediate
goods if purchased by a car manufacturers. But a tyre isalso a consumer product if purchased by
Mr. Solomon for use in his car.On the other hand, capital goods are those goods that are used for
themanufacture of both intermediate and consumer goods. A manufacturingplant is a capital
good. One thing we need to know about capital goodsis that they last for very long periods
because of their nature.
Building a Market Demand
We have defined what demand for a product or service is generally.
Also we understand what a population is.
Let X = No. of persons in a population
Y = average number of a given product consumed byeach person in that population per annum
Then XY = Total market demand per annum for the product inquestion
SELF ASSESSMENT EXERCISE
There are 400,000 persons in a city called Ireoluwa. Each person in thecity drinks a bottle of
water daily. What is the annual demand for waterin Ireoluwa.
3.5 Forecasting Future Demand
Page 57
57
Some of us will assume that building the demand schedule for a productis all that is required; but
that is not true because the analyst should beable to forecast future demand for the product in
question or the serviceas the case may be. Forecasting future demand appears to be a difficult
task because there is a lot of uncertainty attached to the forecastof a future event. Ordinarily, the
demand for many goods may be eitherstable, erratic or out rightly unpredictable. Social change,
structuraladjustments, change of taste and technology all add up to forecasting a difficult task
especially of demand.
Usually, there are two basic approaches that are available when trying toforecast demand
namely:
• Qualitative techniques
• Quantitative techniques
Qualitative Techniques
Qualitative techniques are mainly desk methods which are based onreports obtained from various
sources. One of the sources could expert opinion obtained from a pool of experts in an industry
experts usually are seen to be knowledgeable about a product or industryand therefore are in a
position to forecast what the future demand for a
product is likely to be. Another way of obtaining information for use inforecasting demand is
known as the sales force composite method.
With this method, salesmen in a particular industry can provide expertdata on demand. But in
most cases, the data and the forecast that theyprovide differ significantly from that provided by a
panel of experts. Thegeneral belief is that since salesmen operate at the grassroots level, theyare
more knowledgeable about the demand for products and theaccompanying forecast.
Quantitative Techniques
The majority of the data generated are often unreliable, biased argued by a subjective state of
mind of the people making the forecasts.
Also, we think they are clumsy data in the hands of the entrepreneur.
Quantitative techniques in forecasting, however, are less subjective andare more or less based on
past data.In the main they are mathematical in nature and tend to be more accurate. One of the
quantitative techniques used is the time seriesapproach. The time series approach generally has
become very popularwith analysts who are trying to forecast the demand for a good orservice.
The general feeling is that time is a crucial explanatory variablethat explains the future.
According to this thinking, past data can explainrelationships between the demand of a
commodity and time. Forexample, we can display the relationship between demand and time in
agraphical way.
4.0 CONCLUSION
We have fully discussed the demand analysis. We discussed theanalytical framework for
preparing a demand analysis. We alsodiscussed the analysis of a population data which we said
is very crucial.
Page 58
58
We defined demand and discussed the evaluation of market size andthen went further to discuss
the forecasting of demand.
5.0 SUMMARY
Understanding demand analysis is our first practical step towardsunderstanding the format of a
market.
6.0 TUTOR-MARKED ASSIGNMENT
Why do you think that the analysis of a population data is importantwhen building a demand
analysis?
7.0 REFERENCES/FURTHER READINGS
Leon Ikpe (1999). Project Analysis and Evaluation. Lagos: Impressed
Publishers.
UNIT 3 SUPPLY ANALYSIS
CONTENTS
1.0 Introduction
2.0 Objectives
3.0 Main Content
3.1 The Supply Equation
3.2 Analysing Supply Data
4.0 Conclusion
5.0 Summary
6.0 Tutor-Marked Assignment
7.0 References/Further Readings
1.0 INTRODUCTION
In Unit 2, we discussed demand analysis which basically looked at themarket from the demand
side. In this unit, our task is to look at themarket from the supply side. Basically when an
investor iscontemplating an investment in the manufacture of goods for themarket, he/she tries to
evaluate the nature of the market for the proposedgoods or services. Understanding the nature of
the market will involveunderstanding demand as well as supply.
Supply analysis in project analysis tries to focus attention on the supplyside of the market. The
potential investor will like to know who the current suppliers of the goods or services are.
Because this will guidehim/her in understanding what is known as the demand/supply gap.
Supply analysis tries to identify the supply of given goods or services. Ittries to identify who the
suppliers are and their locations.Generally, in measuring the supply of a good, the following
should betaken into consideration:
• The domestic supply of the good or service;
• The foreign supply of the good or service. (the imported quantity);and
• The export of the good or service (export quantity).
2.0 OBJECTIVES
Page 59
59
At the end of this unit, you should be able to:
• explain what a supply analysis is
• discuss it in relation to project evaluation.
3.0 MAIN CONTENT
3.1 The Supply Equation
Consider a firm called Fiyinfunoluwa Nigeria Limited that wishes to set up aliquid soap
manufacturing plant in Nigeria. The firm now wants toanalyse the supply of liquid soap in
Nigeria. As we have said, there arethree key items to consider. Those three items are:
• The domestic supply of the liquid soap;
• The foreign supply of the liquid soap;
• The export of the liquid soap in question.
Let A = the domestic supply of a good
B = the foreign supply of a good
C = the export of the good
Then supply X = (A + B) – C.
This is called the supply equation.
You will notice that C is the exported quantity and which will not beavailable for local
consumption.
Page 61
61
3.2 Analysing Supply Data
We have agreed that the investor should evaluate the market in terms ofdetermining the level of
supply of the goods or service in the market.
But in practical terms, there is the urgent need to identify every supplierand the suppliers‘
location. This will assist in the preparation of amarketing plan. Some analysts believe that getting
information on theactual supply data is all that is important. That is not true. In practicalterms,
there is the need to find out the following facts about supply in anindustry:
• No. of players or suppliers in an industry;
Page 62
62
• Their current installed capacities;
• Their current actual operating capacities;
• Anticipated expansion plans;
• Critical labour costs in the industry;
• Raw materials costs in the industry and the likely direction; and
• Categorising the suppliers into their various categories – big,medium or small players.
SELF ASSESSMENT EXERCISE
Explain the supply equation and its relevance.
4.0 CONCLUSION
The supply analysis attempts to identify the components of the supply ofgiven goods and
services as well as the supplies and their locations.
5.0 SUMMARY
The supply analysis seeks to analyse the supply of goods and services. Itenables the would-be-
investor or analyst to have a clear picture of thesupply in the market place. Understanding supply
is a must if we are tounderstand the nature of competition in industry.
6.0 TUTOR-MARKED ASSIGNMENT
Discuss the three components of supply that make up thesupply equation.
7.0 REFERENCES/FURTHER READINGS
Leon Ikpe (1999). Project Analysis and Evaluation. Lagos: ImpressedPublishers.
Page 63
63
UNIT 4 COMPETITION AND MARKETING PLANS
CONTENTS
1.0 Introduction
2.0 Objectives
3.0 Main Body
3.1 Analytical Framework
3.2 The Nature of Competition
3.3 The Marketing Plan
4.0 Conclusion
5.0 Summary
6.0 Tutor-Marked Assignment
7.0 References/Further Readings
1.0 INTRODUCTION
We have discussed market demand when we were looking at marketanalysis. We also discussed
supply. We now want to move ahead andsee how both of them interplay in what is known as the
market.
In this intellectual journey, we have put ourselves in the shoes of the would-be investor or
analyst who wants to understand the nature ofcompetition in the market. Every firm takes market
demand as given andno firm can single-handedly change demand which we said depends ona lot
of factors. Also, every firm takes supply to the market as givenbecause no firm is able to control
the supply to the market from othercompetitors.
It is because of this that we really need to understand the nature ofcompetition in the market.
Every dynamic environment createsopportunities and problems for firms. A company must be
able torespond constructively to this market setting, analyse the opportunitiesand threats, and
then formulate marketing plans to remain in thecompetition.
2.0 OBJECTIVES
At the end of this unit, you should be able to:
• explain the meaning of competition
• discuss marketing plans and how they are designed.
3.0 MAIN CONTENT
3.1 Analytical Framework
We know where we are coming from and we also know where we aregoing. Our task is to
discuss the competition and also the marketingplan. To guide us so that we do not forget our
direction, we shall have our proposal an outline – a type of framework that should guide us
whenevaluating competition and also the design of marketing plans.
Marketing plans are very crucial from the point of view of the projectinitiator as well as from the
project evaluator.
Page 64
64
3.2 The Nature of Competition
In every industry, competition exists. It is not a matter of sheer bad luckor coincidence.
Competition occurs because every firm in an industrywants to sell its products and also get
market share to the detriment ofother players.
In the market, the state of competition depends on five basic forces asshown in Figure 5
Therefore, any discussion on competition must takeinto consideration these five basic forces
since they cannot be glossedover. The first force exists within the industry where we see firms
alljockeying for position. Here, all firms unleash their strategies and fighteach other. In the end,
some firms emerge as clear leaders, some emergeas followers, while others might close shop.
The second force is the threat of new entrants. New entrants into anindustry bring in new
capacity. But we should note that the threat ofentry depends on the barriers present and also the
reaction of existingplayers. We should also not forget the forces arising from suppliers.
Strong suppliers can exert strong bargaining power on marketparticipants to the extent of raising
prices and influencing the price ofgoods generally. Powerful buyer groups, when they exist in an
industry,tend to influence prices since they more or less dictate the price at whichthey will buy.
Finally substitute goods or the threat of substitute goods also influencecompetition in an
industry. Substitute goods tend to limit the potentialsof an industry. For example sugar tends to
limit the honey industry‘spotentials for growth and expansion.
SELF ASSESSMENT EXERCISE
Page 65
65
In evaluating the outlook for an industry, list and discuss four items thatyou think are important.
Figure 5: Forces governing competition in an industry
3.3 The Marketing Plan
The marketing plan addresses issues concerning the marketing of theproducts. It tries to relate
the firm to its external consumers andThe market.
The marketing plan should answer the following questions:
• What is the product or service?
• What are the uses of the product or service?
• What is the offered price?
• Where will the product be found?
• How will the product or service be advertised?
Page 66
66
4.0 CONCLUSION
In this unit, we have discussed competition and marketing plans. Wehave also discussed the
analytical framework for discussing competition. Apart from these, we have provided a check
list formarketing plan.
5.0 SUMMARY
We have discussed competition and marketing plans. We saw howcompetition and marketing
plans relate to each other. The framework foranalysis presented discussed industry outlook and a
company‘s positionin the industry.
60 TUTOR-MARKED ASSIGNMENT
Discuss the five basic forces that govern competition in industry.
7.0 REFERENCES/FURTHER READINGS
Leon Ikpe (1999). Project Analysis and Evaluation. Lagos: ImpressedPublishers.
Michael E. Porter. (1980). Competitive Strategy: Techniques forAnalyzing Industries and
Competitors. New York: Free Press.
Page 67
67
UNIT 5 PROJECT COST ANALYSIS
CONTENTS
1.0 Introduction
2.0 Objectives
3.0 Main Body
3.1 Project Cost Analysis
4.0 Conclusion
5.0 Summary
6.0 Tutor-Marked Assignment
7.0 References/Further Readings
1.0 INTRODUCTION
In Unit 4, we discussed competition and marketing plans. We saw howcompetition takes place in
the market place. We also discussedcomponents of marketing plans as prepared by project
initiators. Themarketing plan as we discussed is very important to both the projectinitiators and
the evaluators.
In this unit, we shall discuss project cost analysis which is very important in this course.
2.0 OBJECTIVES
At the end of this unit, you should be able to:
• explain what project cost analysis is
• discuss how the analysis can be prepared.
3.0 MAIN CONTENT
3.1 Project Cost Analysis
Project cost analysis provides total frameworks for calculating orestimating the total cost of a
project. For example, a firm wants to set upa garri processing plant to enable it serve the food
needs of a growingpopulation. How does the firm know the cost of the envisaged garriprocessing
plant?
To guide our discussions, let us define project cost as all those costs thatare incurred in the
process of setting up a project. The costs must beattached to the project. And the list of the items
must be exhaustive. Butwe need to arrange the cost items in an orderly and consistent manner
sothat like items stay together. To ease our discussions and to make themas easy as possible, we
shall divide project cost items into the followingsub-headings:
• Cost of land
• Cost of building
• Cost of machinery and equipment
• Cost of utilities
• Cost of furniture and other fittings
• Cost of vehicles
• Pre-operational expenses
• Working capital
Page 68
68
Although we have listed the cost sub-headings, we shall go ahead andprepare a small checklist
that will guide us. After the checklist, we willwork through a practical demonstration using a
vegetable oil refiningplant as an example.
Page 72
72
4.0 CONCLUSION
Project cost analysis is an important aspect of our study of projectevaluation. Project cost
analysis is important to both the project initiatorand the financial analyst who may want to
evaluate a project.
5.0 SUMMARY
In this unit, we discussed project cost analysis. In doing this we agreedthat cost of land,
buildings, machinery and equipment, utilities, furnitureand fittings, etc., all form part of the total
project cost. We also used acheck list to guide the preparation of the cost analysis. Finally we
used aworked example of a vegetable oil refining plant to throw more light onthe project cost
analysis.
6.0 TUTOR-MARKED ASSIGNMENT
Why do you think that it is important to know the total cost of a project?
7.0 REFERENCES/FURTHER READINGS
Leon Ikpe (1999). Project Analysis and Evaluation. Lagos: ImpressedPublishers.
Wearne, S.H. (1989). Control of Engineering Projects. London: ThomasTelford.
Page 73
73
UNIT 6:ELEMENTS OF PROJECT ANALYSIS
CONTENTS
1.0 Introduction
2.0 Objectives
3.0 Main Content
3.1 Elements of project analysis defined and identify
3.2 Basic elements of project analysis
3.3 Other elements of project and project analysis
4.0 Conclusion
5.0 Summary
6.0 Tutor-Marked Assignment
7.0 References/Further Reading
1.0 INTRODUCTION
In this unit, we will discuss the elements required to do a project analysis. The section firstly
defines the term element and identifies possible elements in project analysis. Secondly it
examines six main elements and other possible element of project and project analysis. When
these elements are present, the tools of project analysis and appraisal will work and be
appropriate.
2.0 OBJECTIVES
At the end of this unit, you should be able to:
identify the elements of project analysis.
six main elements of project analysis
Page 74
74
3.0 MAIN CONTENT
3.1 Elements of project analysis defined and identified
Some basic elements are fundamental to project analysis and project success. Elements of project
analysis are basic or essential parts or principles of which project consists, or upon which the
fundamental powers of project analysis are based. Similarly, elements of project analysis can be
described as characteristic parts of a project analysis.
Some basic elements of project and project analysis have been identified by various authors. To
one, they are time,cost, and quality (or scope). And another identifies time, quality, and resource
expenditures. Yet to another, they are resources, time, cost, risk and scope. In this unit, we
identify the main elements of project analysis asresources, time,cost, quality, risk and decision
rule.Each element must be managed effectively. All these elements are interrelated and must be
managed together if the project is to be a success.
3.2 Basic Elements of Project Analysis
The following six elements have been identified as important in project analysis. The order of the
factors is a function of the task that is the most important part of doing the project analysis. It
various from one project to another, however, they are interrelated,
Element 1 - Resources
All projects involve the commitment of resources now to obtain extra resources in the future.
These are resources assigned to the project. The labour hours of the project team are included
also.There are four types ofresources available: men, machines, money, and materials (the four
Page 75
75
M's). ―Men‖ includesthe human (people) resources of the project.The people resources mean
having the right people, with the right skills and the proper tools, in the right quantity at the right
time. Machines are the resources used for a project that stillexist after the project is over such as
trucks, meeting rooms, and so on. They also means equipment (cranes, trucks and other heavy
equipment) used for the project Materials arethe required resources that are used up or
transformed during the project. They also meanthe materials (pipe, insulation, computers, etc)
assigned to the project. Last of all is theresource that project analysts pay the most attention to
during projects, Money. However,this is only one resource not the only resource. In fact, for
many projects there is no realmoney involved. Internal projects use peoples time but not real
money. That money would be spent if the project was done or not, therefore, it is notthe project
that costs this money. The only money assigned to the project is actual nairathat would not have
been spent if the project was not performed. This includes specialconsultants and contractors
used for this project. Resources can be traded for one anotherand that is why they are lumped
into a single category. Resource Expenditures become thenumber one factor when we are limited
in our use or the availability of any of the above.
Page 76
76
Element 2 - Time, Timing and Schedule
Time is a critical element for any successful project analysis. Time and Timing are
different. Time means the absolutetime of the project, a specific moment, such as
starting the road construction.Regulatory projects and many competitive projects
may be driven by Time. Hence time become a very important element in its analysis.
Unfortunately, manyprojects are given short deadlines in the hope of forcing the
project to be done faster. This isludicrous. It may work once but not always.
Timing includes projects that are not necessarily driven by the end date (although
this couldbe part of it) but are driven by the close interdependency in time from one
task to the nextsuch as mixing and pouring concrete in drainage construction. The
timing of cash flows is also important here because of the time value of money – that
is cash inflows and outflows on a timely basis.
The most common cause of bloated project budgets is lack of schedule management.
Fortunately there is a lot of software on the market today to help you manage your
project schedule or timeline. Any project can be broken down into a number of tasks
that have to be performed. To prepare the project schedule, the project manager has
to figure out what the tasks are, how long they will take, what resources they
require, and in what order they should be done.
Page 77
77
Analysis can take place at any time in a project. However, the most appropriate
timing will be governed by the nature of the project, and the reason for carrying out
the analysis. It will be most effective when it is built in as a fundamental part of your
overall project, and should be considered while the project is being designed.
You may decide that you will:
carry out an initial baseline exercise against which to compare progress at the end of the
project
refine the project on an ongoing basis; therefore, analysis will be part of your regular
project activities
or
evaluate the project at agreed milestones, for example on a bi-monthly basis.
Apart from required reporting on the project, the timing and intensity of a project‘s analysis is up
toproject participants. Many coastal management actions will benefit from being evaluated over
a longerperiod of time, such as one to five years after the project has been completed. This can
allow for the impactsof management action on aspects such as dune stability and vegetation
health to be evident.
Projects must have a definite start date and stop date. This is importantas the start and stop date
define the life cycle of the project as identify in previous unit. Everything born eventuallydies.
Everything has a lifecycle. By knowing the lifecycle of something we also know a lotabout it
simply by knowing where we are in that lifecycle. When receiving a new project consider the
most pressing question at that moment.You want to know ―What‖ you are being asked to create.
Answering this questionrequires nouns. We must identify what we are being asked to create. We
may state we are building a house, car, or software application. In any event, it is the
Page 78
78
identification of allthe nouns or things we are to create that determine our project. However,
knowing ―what‖we are going to create is not adequate; we must also know the requirements for
each thing.That is, we must describe the ―what‖ in enough detail that we can feel confident in
creatingit. We use adjectives to describe our nouns. These are known as ―requirements.‖ The
outputs of this phase are the scopestatement and requirements.
Once we feel confident in ―what‖ to create the next question is ―how will we create it?‖what are
the steps, who will do them, when will they be done? This phase is characterizedby the verbs that
describe the actions required to create the ―what.‖ When completed, thisphase has the schedule
as its primary output.
Element 3 - Costs
In project analysis, the ability to do a project within budget is applauded. The project cost is the
initial price of the project including the working capital. For example, the cost of acquiring
borehole equipments could be ₦7million but it may require about ₦2.5 million to set up the
drilling equipments. The extra ₦2.5 million must be considered as part of the initial cost of the
project because without incurring that cost, the drilling cannot commerce. The extra cost the
project would incurred before the project can commerce is fundamental to project analysis. The
omission of this aspect has stalled many projects in government.
Furthermore, project cost can be broken down into three components – initial expenditures,
replacement expenditures and residual values. Initial expenditures refer to the cost involved in
establishing and commissioning project. Replacement expenditures refer to the cost of equipment
and other investment items in the operating phase of a project to maintain its productive capacity.
Page 79
79
The residual values refer to the value of all these investment items at the end of the project life
(that is, when production is expected to cease or be substantially changed).
Similarly, project costs is said to include estimated cost, actual cost and variability cost. The
estimated cost is a written statement indicating the likely cost/price that will be charged for
specific project. The actual cost is the market or current cost/price that will be charged for
specific project. Contingency cost takes into account influence of weather, suppliers and design
allowances.
Price is an important factor here. Price deals with the valuation of the project estimated effects
(cost and benefit). Price can be in two forms:
(1) constant prices – estimated effects value at a specified set of prices; and
(2) current prices – an attempt to forecast price in the future.
The constant price is generally use for project analysis.
Element 4 - Quality
Quality is the distinctive attribute or characteristics of a project(s). It describes the standard or
degree of excellence of the project. Quality becomes the number one factor in project analysis
when the client wants the product or service to beexactly as specified. Consider the product
Microsoft Word. Is this a high or low grade product? It‘s obviously high grade. There are
hundreds of features. Nowconsider the quality of the product, high or low? The quality of Word
is somewhere in themiddle. I wouldn‘t classify it as high quality by any stretch. It crashes and
misbehavesendlessly. However, it does work most of the time. It‘s well known that as grade
Page 80
80
increases,quality becomes a bigger challenge. The more features a product has the more difficult
it isto ensure all of those features work as promised and expected. The converse is true as
well.The fewer features a product has the easier (usually) it is to make sure they all work.Adding
features increases cost and the challenge of making all those features work. Inaddition, it takes
longer to create additional features.
Element 5 - Risk
In the face of scare resources, there is greater need to investigate the risk involved in any project
of investment an organization want to commit fund in order to minimize its effect. This enables
projects to be analyze in view of the changing variables in the environment – government
policies, consumer income, culture of the people and their values, inflation, technology and
world economy. A change in these variables will certainly increase the risk in our project and has
implication for project analysis.
Risk is the variability in the size of possible returns in an investment. It could be describe in two
forms:
o a situation where there is incomplete predictability of alternative events;
o a situation in which parametric knowledge of probability distribution is used to assess a
set of alternative event.
Also, risk is complex in nature because it involves the assessment of uncertain future events
which are difficult to predict. In project analysis it is incorporated in the required rate of return
(the discount rate).
Page 81
81
Decision Rules
A feature of project analysis is the ability to make decision on what project to invest in at a given
time. These guidelines can be grouped as two basic decisions facing project analyst. They are:
o Accept or reject decision problem, the analyst has two options to whether accept or reject
a particular project. To make this decision, there must be an appropriate rule for judging
the economic worth (profitability) of an investment project. If a project is profitable it is
accepted, if not, it is rejected.
o Select from alternative the best project: in the face of limited resources acting as a
constraint or when working with a given project, the best project or most profitable
project is selected, others are sacrificed or forgone. The projects are said to be mutually
exclusive, that is, the choice if one preclude the other.
3.3 Other Elements of project analysis
Unique
Projects are unique, one-of-a-kind, never been done before. It‘simportant to know what it means
to be ―unique‖ if we hope to separate the common fromthe uncommon. In the performance of a
project, there is an enormous amount of work to bedone. Some of it will be unique and some of it
will not. The tools of project analysis are designed to control and manage the uncertainty
inherent in projects. We must therefore,separate these two types of work and apply project tools
to the unique work and operationaltools (when required) to the common work. Of all the work
required to bring a project in ontime and on budget only some portion of it will be unique.Only
some part of all the work required will be unique and therefore ―project‖ work.The rest of the
Page 82
82
work is operational work. We must apply project tools to project work andoperational tools to
operational work.The ―project‖only analyzes and plans for the unique work.
One Accountable Entity
Accountability implies someonethat has both the responsibility and the authority to do the work
of the project.Because operations have clearly defined and segmented work that is repeated over
and overit is possible to have separate entities accountable for each section of the work. This
controlcomes through the well defined processes that drive the work. In projects, there are few
welldefined processes for the work (actually, the processes of planning and managing a
projectare operational while the work of the project is unique). The project plan represents the
besteffort to create a one time process that will have many missing parts. Such
uncertaintyrequires one person to have full accountability for all the work of the project. This
does notmean the same person must remain the one accountable entity for the entire project.
Somepeople are very good at getting the team organized and planning the project but fail
whenit's time to drive the details of daily work. Feel free to change project leaders at each
phaseif it‘s necessary. If you intend to change leaders at strategic points in the project make
sureeveryone knows up front to prevent rumors of leadership failure.
Now that we see why we need one accountable entity let's define the term. Accountablemeans to
answer to somebody for your actions. Responsible means someone who has theconfidence to
boldly state, "Fire me first" when things don't work out. The accountableentity knows the phrase
"the buck stops here" and provides no excuses for failure. It meansto be responsible and have
authority. Being responsible is the "no excuses" part of the job.Authority means to be able to
make sound decisions that guide the project. If theaccountable entity is unable to make decisions,
he cannot manage the project.
Page 83
83
4.0 CONCLUSION
We conclude that resource, time and timing, cost, quality, risk, decision rules, unique and one
accountable entityare elements of project and project analysis. They are well discussed in detail
in this unit.All these elements are interrelated and must be managed together if project and
project analysis, is to be a success.
5.0 SUMMARY
In this unit, we have identified various elements of project and project analysis. They are
resources, time and timing, cost, quality, risk, and decision rules. We have also discussed them in
detail.
6.0 TUTOR-MARKED ASSIGNMENTS
4. Identity the basic elements of project analysis and briefly discuss any three.
5. Explain decision rules as it relates to project analysis.
7.0 REFERENCES/FURTHER READINGS
Curry, S. & Weiss, J. (1993). Project Analysis in Developing Countries.Britain, Palgrave
Macmillan.
Elder, A. (2006).The five elements of a project. No Limits Leadership Inc. 1-10.
Page 84
84
MODULE 3
Unit 1 The Projected Income Statement
Unit 2 Projected Cash Flow Statements
Unit 3 The Projected Balance Sheet
Unit 4 Project Evaluation Criteria
Unit 5 Introduction to Economic Analysis
Unit 6: Cashflow dimensions
UNIT 1 PROJECTED INCOME STATEMENT
CONTENTS
1.0 Introduction
2.0 Objectives
3.0 Main Content
3.1 Projected Income State
3.2 The Structure in the Projected Income Statement
4.0 Conclusion
5.0 Summary
6.0 Tutor-Marked Assignment
7.0 References/Further Readings
1.0 INTRODUCTION
In Unit 5 of Module 2, we discussed project cost analysis. We discussedhow to cost a project,
especially a start-up project. We saw that fixedcosts and working capital all add up to constitute
the project cost. In thisunit, we shall discuss the projected income statement which is a veryvital
statement required for project analysis and evaluation.
The key basis for financial planning and project evaluation is financial information. The financial
information is required to record,compare and evaluate a firm‘s earning power and ability. In an
alreadyexisting project, the financial information is already provided since it isa historical data.
The income statement or the profit and loss account is asummary of revenues, expenses and net
profit of an enterprise for aperiod of time. This serves as a measure of the firm‘s profitability
overthe period. For an on-going project or firm, when prepared, the incomestatement becomes a
historical statement. The projected incomestatement is a forecast of the revenues, expenses and
the net profit of anenterprise or project.
2.0 OBJECTIVES
At the end of this unit, you should be able to:
• explain the meaning of projected income statement
• discuss its application in project evaluation
• prepare a projected income statement.
3.0 MAIN CONTENT
3.1 The Projected Income Statement
Page 85
85
The projected income statement is usually needed by a variety of people.Some of the users of the
projected income statement might have direct interest in the firm while others have indirect
interest.The owners or sponsors of a project have a direct interest inthe projected income
statement. It is so because they are entrusting theirinvestment to the firm. They wish to know
before hand what therevenues, expenses and net profit of the firm will be, and mostimportantly,
their own expected dividends.
Another important group that is expected to have a direct interest in theprojected income
statement of a project is the management. Usuallywhen a project is conceived and a project plan
is written, the plan willcontain the projected income statement as conceived by the
projectsponsors or consultants. Usually, the projected income statement ishanded down to the
project managers as a guide.
Also financial institutions are interested in a projected income statement.
Practically, when any firm approaches a financial institution forfinancial assistance, the firm is
expected to prepare a business plan or aproject feasibility study which contains, amongst other
things, theprojected income statement. Financial institutions need to study theprojected income
statement to evaluate the revenues, expenses andprofitability of the investment project. When
they do this, they will alsotest the cash flows of the project to see whether the proposed project
canrepay any loan granted together with the interest.
Other people that might be interested in the projected income statementare potential investors.
Potential investors need to examine the projectedincome statement to decide whether or not they
will invest in a firm.
3.2 The Structure of the Projected Income Statement
We have just explained what the projected income statement is. It is astatement that shows
projected revenues, projected expenses, and ofcourse, net profit of a proposed investment, an
expansion project or anexisting project.
In the standard practice, there is an acceptable arrangement that shouldgroup like items together
and this leads to building a projected incomestatement that is broken into revenues, expenses and
the net profit.
• Revenues
Ordinarily, revenues are the value of output of goods or services that anenterprise supplies to its
customers. Revenues, therefore, arise when afirm produces or manufactures goods which it sells
to third parties for afee. Secondly, revenues can arise when a firm is engaged in the buyingand
selling of goods. It purchases goods which it later resells at a profitor a loss as the case may be.
Thirdly, revenues can also arise throughprovision of services by a firm. A hospital may
specialise in surgery andprovide surgical services to its customers for whom it collects
relevantpayments, which when added up, make up the revenues.
Finally, a firm can earn revenue by loaning its economic resources. Forexample, a bank lends
money to customers and earns interest income.
Page 86
86
The interest earned is revenue.In projecting for revenues in a project situation, care must be
taken sothat proper estimates or forecasts are made. And this is made qualitative judgment plus
quantitative judgment on the part of the project evaluator. For example, if the project is a
manufacturing facilitythat will produce goods for the market, the best option is to start with
theknown market price of the good to be produced. For example, if thegood in question is the
type of bread that sells for N100 a loaf, then theproject evaluator or initiator has to start from the
known price of a loafof bread and that is N100 a loaf. If the number of loaves of bread to
beproduced per annum amount to 1,000,000 then the projected revenue ofthe project is
N100,000,000.Likewise, if a firm is engaged in the provision of services, the revenueslikely to
be earned can be easily estimated. If for example a hospital isprojecting revenues, it has to first
estimate the likely number of patientsthat will use its facility and also the average fee it charges a
patient. Thenumber of patients multiplied by the average fee per patient will give usthe projected
revenue of the health facility.
The projection for revenues can cover various periods. In mostorganisations, revenue projections
for project evaluation purposesstretch over a period of three years. Some banks ask for fiveyear
revenue forecasts. In the revenue projections care must be taken so asnot to overstate the
revenues or understate them.
• Expenses
The cost of earning revenue is known as the expense. Expenses aredifferent from costs. Cost is
the outlay incurred to acquire some asset.
For example, when a car is purchased by a company for its business, thesum used to purchase the
vehicle is the cost of the vehicle. If the vehicleuses fuel for the firm‘s operations, that constitutes
an expense.In projecting the expenses of a firm‘s investment, a lot of factors areusually taken
into consideration.
Firstly, we have to get proper estimates of the current cost profile of thevarious items. For
example, when projecting gas and oil expenses of aproject, the proper starting point is to collect
data on the current pricesof gas and oil.
Revenue Projections
From the proposed production plan, the following is the revenue profilefor the project in year
one (year 2007).
Table 30: Revenue Projection for a Vegetable Oil Refining Plant
Page 87
87
Consumption of Utilities and Chemicals per Ton of Bleached and
Refined Vegetable Oil
Steam at 50 psig = 70kg
Barometric water = 6 m3
Clean water in circulation = 7 m3
Fuel oil = 4 kg
Bleaching earth = 15 kg
Citric acid = 200 gms
Phosphoric acid (for dosing) = 300 gm
Vegetable Oil Packaging Expenses
The refined vegetable oil will be sold in two ways:
1. Direct to vegetable oil distributors who will purchase thevegetable oil in tanker loads. In this
case, the vegetable Oil tankers will come and load vegetable oil at the factory.
2. The refined vegetable oil will be filled into plastic jerry cans of 9litres and 18 litres capacity
and also sold to the market. The purpose ofthis is to ensure that the brand of vegetable oil will be
in affordableunits and prices to the market.
Table 31: Projected Manufacturing Account for a Vegetable Oil
Page 90
90
SELF ASSESSMENT EXERCISE
List and explain four expense items that can be found in a projectedincome statement.
4.0 CONCLUSION
We have discussed the projected income statement. We discussed thestructure of the projected
income statement, revenues, expenses and netprofit concepts.Finally we used as an example to
demonstrate a projected incomestatement.
5.0 SUMMARY
We have treated the projected income statement in this unit. Theprojected income statement is
one of the most important items in projectevaluation from the project sponsor‘s position or from
the bank oranalyst‘s position.
6.0 TUTOR-MARKED ASSIGNMENT
Discuss the likely users of a projected income statement.
7.0 REFERENCES/FURTHER READINGS
Leon Ikpe (1999). Project Analysis and Evaluation. Lagos: ImpressedPublishers.
Page 91
91
UNIT 2 PROJECTED CASH FLOW STATEMENTS
CONTENTS
1.0 Introduction
2.0 Objectives
3.0 Main Content
3.1 Projected Cash Flow Statements – Meaning and uses
3.2 The Structure of the Projected Cash Flow Statement
3.2.1 Cash Inflows
3.2.2 Cash Outflows
3.3 Sensitivity Analysis
4.0 Conclusion
5.0 Summary
6.0 Tutor-Marked Assignment
7.0 References/Further Readings
1.0 INTRODUCTION
In Unit 1 we discussed the projected income statement. Therewe discussed he concept of
revenues and expenses and also net profit. Wealso discussed the fact that the projected income
statement is used by avariety of users like the project initiators, bankers and financial analysts.In
this unit, we shall discuss the projected cash flow statements.
2.0 OBJECTIVES
At the end of this unit, you should be able to:
• explain what a projected cash flow statement is
• explain how it can be prepared
• explain the usefulness.
3.0 MAIN CONTENT
3.1 Projected Cash Flow Statement – Meaning and Uses
It is important to understand and analyse the projected cash flows of thefirm. We shall begin our
discussion by defining a cash flow statement.A cash flow statement is a statement that shows the
actual receipt ofcash (inflows) and the disbursement of cash (out flows) of a firm orproject.
Having said that, we can now go ahead to define a projectedcash flow statement.
A projected cash flow statement is a statement which shows theforecasts of actual receipts of
cash (inflows) and the disbursement ofcash (outflows) of a firm or project. There are many users
ofinformation contained in projected cash flow statements. The first userof the projected cash
flow statement is the project sponsor or initiator.
The project sponsor or initiator is interested in knowing well in advancethe future cash flows of
the firm. This is important because the futurefinancing needs of the firm have to be known well
in advance. Theproject initiator needs to distinguish between credit sales and cash sales.
Page 92
92
If the project initiator does not distinguish between credit sales and cashsales, then his/her
project may suffer cash flow problems. The initiatormay not be able to estimate the amount of
cash needs of the project aswell as timing of the cash needs.
Similarly, providers of finance especially the lending banks are usuallyvery interested in the
projected cash flow statement. They need todetermine the firm‘s ability to service debt. The debt
in question may beexisting debts or future debts. Ability to service debts is a function offuture
cash flows.
Projected cash flow statements assist us to evaluate a firm‘s futureperformance and of course
financial condition that enables the projectevaluator answer the following questions.
• What is the nature of the firm‘s projected cash flow statement?
• Will the projected cash flow be able to service the project‘s debts(loan, overdraft + interest)?
• When will the project need financing and to what extent?
• How should the loan or overdraft or finance be structured?
• How stable are the cash flows?
3.2 The Structure of the Projected Cash Flow Statement
The basic format of the projected cash flow statement is displayed inTable 33 is a projected cash
flow statement of a company. But it coversa period of only 3 months. You can project a cash
flow as long as yourequire but the basic principles should be followed. If you examineTable 33
properly, you will realise that the projected cash flowstatement is divided into two main sections,
namely:
1. The cash inflows
2. The cash outflows (outgoings)
We will now go ahead to break down the projected cash flow statement.
Page 93
93
Table 34: A Three Month Projected Flow StatementNiger LimitedCash Inflows January
Page 94
94
3.2.1 Cash Inflows
We have seen that a projected cash flow statement is broken down intothe inflows and the
outflows (outgoings). Let us now proceedto examine some of the key items contained in the
projected cash flowstatement. The items will vary from capital to loan introduced and alsocash
sales. We shall treat them individually.
• Capital Introduced
Every firm or project should have a capital. At the time a project conceived or is being expanded,
the owners of the firm usually bring inwhat is known as capital.
In a limited liability company, the share holders usually contribute thecapital of the firm. In cash
flow construction, capital is usually enteredas an inflow. The reason is clear. When you
introduce capital, you bringin cash.
• Loan
Another item appearing in a projected cash flow statement is loan. Insome cases, a project is
funded through loan from banks.
The loan will usually have the following features:
1. The loan amount will be specific
2. The loan has an interest rate attached to it.
3. The loan will be repaid in agreed installments.
• Cash Sales
The sales figure is the most important in a projected cash flowstatement. Projections for sales
pose one of the most difficult challengesin cash flow projections. We must quickly distinguish
between totalsales, credit sales and cash sales. Total sales are the total value of goodsor service
sold to third parties. Credit sales refer to sales for whichpayment is not made immediately. The
figure for credit sales is usually
transferred to the debtors list. Cash sales are the difference between total
sales revenue and credit sales.
As far as we are concerned, the cash sale is the mostimportant component of sales and it is the
one that appears in the projected cashflow statement. Credit sales are only reflected in the cash
flow whenthey are converted to cash. For example, if in January 2007, a companysells four cars
at a credit of N10,000,000. In the cash flow for January2007, there will be no entry for cash
sales. But if in February 2007, the
company receives a cash payment of N5,000,000, then that figure willappear in the inflows
column for February 2007.
The basic rule is that only actual cash received is usually entered in theinflow column.In actual
practice, projecting for cash sales will involve exhaustiveconsideration of the following:
Page 95
95
• General economic outlook in the country
• The industry outlook. What is the demand situation like? What is thesupply situation?
• What is the structure of competition and how fierce is it?
• What will be the effect of competition on prices in the firm‘s area ofoperation?
3.2.2 Cash Outflows
Cash outflows or outgoings will include all expenses that use cash. Theywill include items like:
• Raw material expenses
• Salary and wages
• Stationery
• Loan repayment
• Interest charges
• Selling expenses
• Office admin expenses
• Oil and gas expenses
• Taxation
• Rates and permits
3.3 Sensitivity Analysis
Usually, when constructing a projected cash flow statement, the first setof projections is what we
call normal estimates of cash flows. Normalestimates of cash flows especially cash revenues are
based on all thingsbeing equal; but all things cannot be equal. A lot of things may happen.
In a market, supply can come from unexpected source and cause pricesto fall. Prices of raw
materials may rise suddenly and all these tend toreduce our earlier revenue projections and jack
up expenses.
Sensitivity analysis provides the tool for subjecting a project‘scash flow s to adverse market
situations. Sensitivity analysis seeks to adjustrevenues for risk and also costs. In conducting
sensitivity analysis, wesay that we are adjusting a project‘s cash flows for risk. If we
conductsensitivity analysis on a cash flow, we may do that by making one, twoor three of the
following assumptions:
• Due to intense competition the project will not be able to make theearlier normal sales volume.
Cash revenues will drop.
• Due to excess supply, prices in the market will fall, that will reducecash revenues.
• The prices of raw materials and other items will rise. A closeexamination will reveal that the
impact of any of the above will havethe effect of reducing the cash revenues of a project.
We now state that if a normal projected cash flow statement isreconstructed to accommodate the
fact that the market could be worse,we say that the reconstructed cash flow is now called a risk
―adjustedcash flow statement.‖ The risk- adjusted cash flow is a pessimistic cashflow and should
be admired by analysts.
Page 96
96
Table 34 is a risk-adjusted income statement reconstructed from Table33.The critical assumption
is that Table 34 assumes that only 75% ofcash sales of Niger limited will be realised.
Sensitivity analysis is a tool for subjecting cash flows to risk analysis.The key objective of the
sensitivity analysis is to forecast a worst-casescenario for a project.
Other ways of conducting a sensitivity analysis is to assume thatexpenses attached to a project
will increase.
Page 97
97
Table 35: A Three Month Risk-Adjusted Projected Cash Flow
Statement Niger Limited
Page 98
98
4.0 CONCLUSION
MBA 840
PROJECT EVALUATION
We have discussed projected cash flow statements. We discussed thenature of cash flow
statements and their users. We also examined thestructure of cash flow statements. We used an
example to show what aprojected cash flow statement looks like. We also constructed a
riskadjustedcash flow statement.
5.0 SUMMARY
In this unit we treated projected cash flow statements which we saidconstitutes a very vital
document used in the evaluation of projects. Thecash flow gives us a picture of cash inflows and
outflows together withtiming.
6.0 TUTOR-MARKED ASSIGNMENT
Why do you think that banks are interested in projected cashflow statement of projects?
7.0 REFERENCES/FURTHER READINGS
Leon Ikpe (1999). Project Analysis and Evaluation. Lagos: ImpressedPublishers.
Page 99
99
UNIT 3 THE PROJECTED BALANCE SHEET
CONTENTS
1.0 Introduction
2.0 Objectives
3.0 Main Content
3.1 Meaning of a Balance Sheet
3.2 Components of a Balance Sheet
3.2.1 Assets
3.2.2 Liabilities
3.3 Construction of the Projected Balance Sheet
4.0 Conclusion
5.0 Summary
6.0 Tutor-Marked Assignment
7.0 References/Further Readings
1.0 INTRODUCTION
In Unit 2, we discussed the projected cash flow statement. There, wediscussed inflows and
outflows (outgoings) of a firm or project. We alsodiscussed the structure of the projected cash
flow statement and went astep further to provide an example of a projected cash flow
statement.In this unit, we shall discuss the projected balance sheet.
2.0 OBJECTIVES
At the end of this unit, you should be able to:
• explain the meaning of a projected balance sheet
• explain the preparation of the projected balance sheet
• prepare a projected balance sheet.
3.0 MAIN CONTENT
3.1 Meaning of a Balance Sheet
Before we delve into the projected balance sheet proper, it is veryimportant for us to first
understand what a balance sheet is.The balance sheet or the statement of financial position is one
of themost important financial statements. It shows the financial condition orbetter still, the
statement of affairs of a firm or business. WeWill therefore, define a projected balance sheet as a
forecast of a futurebalance sheet as at a future date.
3.2 Components of the Balance Sheet
The balance sheet has two main sides namely:
• Assets
• Liabilities
3.2.1 Assets
Page 100
100
When we are talking of assets generally, we are talking aboutthe valuable possessions owned by
the firm, valued in monetary terms. Theywill include land and buildings, stock of goods, raw
materials, cash,vehicles and other valuables.
But generally we can classify assets under the following headings:
• Current assets
• Investments
• Fixed assets
Lets us now discuss each of them:
Current Assets
The current assets of a firm or business are those assets which are heldin the form of cash or
expected to be converted into cash in aperiod or within the accounting period of the firm. In
actual practice, theaccounting period is usually of one-year duration.
The current assets of the firm will include the following:
• Cash
• Book debts (debtors).
• Prepaid expenses
• Marketable securities.
• Stock
Let us start with cash which is one of the most liquid current assets.Cash will mean cash on hand
or cash in the bank.
Another current asset which is important is book debts (debtors). Bookdebts are sometimes
called account receivables. These are amounts duefrom debtors to whom goods have been sold
or service rendered. Someof the book debts may be realised by the firm. If they are not realized
they turn into what is called bad debts and may be written off later.
Prepaid expenses are also current assets. They are expenses of futureperiods that are paid in
advance. An example of prepaid expenses is rentwhich may be payable in advance by a firm. For
example in January2007, a firm may pay rent for its office for January 2007 to December,2007.
If in April, 2007, the financial year of the firm ends, it will regardthe portion of rent paid from
May 2007 to December, 2007 as a prepaidexpense which invariably is a current asset.
Stock (inventory) is another current asset and includes raw material,work in process and finished
goods. The raw materials and work inprocess are required for maintenance of the production
function of thefirm.
Finished goods usually will be already packed and kept ready forpurchase by customers of the
business.Marketable securities are the firm‘s short term investment in shares,bonds and other
securities. The securities are usually marketable and canbe converted into cash in a very short
time.
Investments
Investments represent the firm‘s investments in shares, debentures andbonds of either firms or
the government. By their nature, theinvestments are long term.It is important to note that the
investments yield income to the firm.
Page 101
101
Fixed Assets
Fixed assets are long-term assets held for periods longer than one year.They are usually held for
use in the firm‘s business. Fixed assets includeland, buildings, machinery and equipment,
vehicles, etc.
We have briefly seen what the assets are. We shall now move over anddiscuss liabilities.
3.2.2 Liabilities
When we talk of liabilities, we mean the debts that are payable by thefirm or business to
creditors. They may represent various obligationsdue to various third parties arising from various
business transactions.
Examples of liabilities include creditors, accounts payable, taxespayable, bonds, debentures,
etc.But generally, liabilities are divided into two broad groups namely:
• Current liabilities and
• Long-term liabilities
We shall discuss each of the groups
Current Liabilities
Current Liabilities are those debts that are payable in a shortperiod usually within a year.One of
the major current liabilities is the bank overdraft. Most banksgrant their customers overdraft
which are repayable within a period ofone year. The other type of current liability includes
provisions for taxesand dividends. These are liabilities that will mature within one year.
Another type of liability is expenses payable. The firm mayexpenses to public power supply
organisation or have rents to be paid.
Long Term Liabilities
Long-term liabilities are the obligations which are payable in a period oftime greater than a
year.One of the long term liabilities of a firm is term loan. The firm mayborrow money from a
bank that will be repayable over aperiod preceding one year. Such a borrowing or loan is
regarded as long-termliability.Also, when a firm needs to raise a large sum of money,
itdebentures. A debenture is an obligation on the part of a firm to payinterest and principal under
the terms of the debenture.
However one of the most stable types of long term liability is owners‘equity. Owner‘s equity
represents the owners‘ interest in the firm. Inpractical terms, the total assets of a firm less the
liabilities realized on the interest. The owners interest in the firm consist of
• Paid up share capital and
• Retained earnings (undistributed profits).
SELF ASSESSMENT EXERCISE
Discuss the components of a balance sheet.
3.3 Construction of the Projected Balance Sheet
In the earlier sections of this unit, we have discussed the balance sheet generally. That was from
a historical perspective. We shall now discussthe construction of a projected balance sheet.
The following steps are recommended:
Page 102
102
• Start from the determination of sales revenue.
• Compute cost of goods sold (COGS)
• Compute admin expenses, general and selling expenses.
• Bring forward sundry income and expenses and generate theprojected incomestatement.
• Determine taxation, dividends and retained earnings.
• Project for assets.
• Project for liabilities.
Table 36: A Projected Balance Sheet
Page 103
103
4.0 CONCLUSION
We have discussed the projected balance sheet. We first discussed assetsgenerally and then went
ahead to discuss liabilities. We discussed theconstruction of the projected balance sheet and
provided a checklist forthe projection for both assets and liabilities.
5.0 SUMMARY
We have treated the projected balance sheet. The projected balance sheetas we discussed is a
forecast of a future balance sheet as at a future date.It will show what the assets will be and also
what the liabilities will be.It is a very important document in project evaluation.
6.0TUTOR-MARKED ASSIGNMENT
1. Who do you think are the users of the information in a projectedbalance sheet?
2. Why do they need the information contained in it?
7.0 REFERENCES/FURTHER READINGS
Leon Ikpe (1999). Project Analysis and Evaluation. Lagos: ImpressedPublishers.
Page 104
104
UNIT 4 PROJECT EVALUATION CRITERIA
CONTENTS
1.0 Introduction
2.0 Objectives
3.0 Main Content
3.1 Traditional Criteria of Project Evaluation
3.2 The Discounted Cash Flow (DCF) Method
4.0 Conclusion
5.0 Summary
6.0 Tutor-Marked Assignment
7.0 References/Further Readings
1.0 INTRODUCTION
Let us recall that the focus of this course is project evaluation. From unit1, we discussed the
project cycle. From there we moved on to discussfactors affecting location of projects. We also
discussed capacity andproduction planning, demand analysis, supply analysis, project
costanalysis, projected income statements, cash flows and the balance sheet.
All these have set the stage for us to tie the discussions. We now want todiscuss a very crucial
aspect of this course, which is the project evaluation criterion. Project evaluation criteria seek to
present themethods to be adopted to measure the value of an investment project.The evaluation
enables us to choose between two or more projects oncethe values are known.Any project
evaluation criterion to be adopted should posses thefollowing characteristics:
• It should provide a means to distinguish between acceptable andunacceptable projects.
• It should also be able to rank projects in order oftheir desirability.
• It should be a criterion that is applicable to any conceivableproject.
• It should recognise that bigger cash flows are preferable tosmaller ones.
• It should recognise that early cash flows or benefits arepreferable to later cash flows or
benefits.
Although there are a lot of project evaluation criteria in the literature, weshall discuss the most
widely accepted criteria which are the traditionalcriteria and the discounted cash flow (DCF)
criteria
2.0 OBJECTIVES
At the end of this unit, you should be able to:
• discuss project evaluation criteria
• distinguish between the traditional criteria and the discounted cashflow relative to project
evaluation.
3.0 MAIN CONTENT
3.1 Traditional Criteria of Project Evaluation
Page 105
105
In the traditional criteria, we shall discuss two methods, namely: thepayback period and the
accounting rate of return method.
The Payback Period
The payback period is one of the most popular methods of projectevaluation. The payback period
is defined as the number of yearsrequired to recover the original cash outlay invested in a
project. If theproject yields constant annual cash inflows, the payback period can becomputed by
dividing cash outlay by the annual cash inflow.So we say thus:
Payback period Cash outlay (investment)=Annual Cash inflow
Example
A project requires a cash outlay of N200,000 and yields an annual cashinflow of N50,000 for a
period of 10 years; calculate the paybackperiod.
The payback period is N200, 000 = 4 years.
--------------
N50, 000
However, it is to be noted that in the case of unequal cash inflows, thepayback period can be
computed by adding up the cash inflows until thetotal is equal to the initial cash outlay.The
payback period is greatly admired by project evaluators because itis very simple to understand.
Another good virtue of the payback periodis that it costs less than most of the other sophisticated
methods.
However, despite its simplicity, the payback period may not beadesirable investment criterion. In
the first place, it fails to recognise thecash flows that come in after the payback period. Again
itfails to consider the pattern of cash inflows and that early cash inflows rather than later cash
inflows.
Despite its weakness, the payback period is very popularanalogy. It tries to emphasizes early
recovery of an investment. Thismeans that it gives an insight into the cash inflows of the project.
The Accounting Rate of Return (ARR) Method
The accounting rate of return (ARR) is a method that uses accountinginformation to measure the
profitability of an investment.The accounting rate of return (ARR) is computed by dividing
average income after taxes by the average investment.
ARR Average Income
------------------------
= Average Investment
Example
A project costs N100,000 and has a scrap value of N40,000. The streamof income before
depreciation and taxes are N40,000, N50,000, N60 , 000 for the first three years. The tax rate is
50% and depreciation ison straight line basis.
Calculate the accounting rate of return for the project.
Page 106
106
As an accept or reject criterion, the ARR method will accept all thoseprojects whose ARR is
greater than the minimum rate established bymanagement. If the ARR is lower than the
minimum rate established bymanagement, then the project should be rejected.The ARR method
is very simple to understand and use. It can also beeasily calculated using accounting
information.
However, the ARR suffers from three main weaknesses. First it usesaccounting profits not cash
flows in appraising projects.Secondly ARR ignores the time value of money. The profits
occurringin different periods are valued equally.
Page 107
107
Thirdly, it does not allow the fact that profit can be reinvested to earnmore profits.
3.2 Discounted Cash Flow (DCF) Methods
We have discussed two of the traditional methods used in the evaluationof projects. One is the
payback period while the other is the accountingrate of return (ARR). Although two of them are
simple to use andunderstand, they are not theoretically sound. Both of them fail toconsider the
timing of cash flows. Both fail to consider the time value ofmoney.
Because of these limitations, we shall consider two superior investmentcriteria which fully
recognise the timing of cash flows.
The two methods are the net present value (NPV) method andthe internal rate of return (IRR)
method. These two methods are referred toas discounted cash flow (DCF) methods or the tme-
adjusted methods.
The Net Present Value (NPV) Method
This method correctly recognises the fact that cash flows arisingdifferent time periods differ in
value and are comparable only when theirequivalent- present values are found out.
The following steps are followed when computing the net present value(NPV).
1. A discount rate is selected to discount the cash flows. The correctdiscount rate should be the
firm‘s cost of capital which is theminimum rate of return expected by the investors to be earned
bythe firm.
2. The present value of cash inflows and outflows are computedusing cost of capital as the
discounting rate.
3. The net present value (NPV) is the present value of cash inflowsless present value of cash
outflows.
The acceptance rule using the NPV method is to accept a project if theNPV is positive, and to
reject it if the NPV is negative.
If NPV is greater than zero, then the value of the firm is expected toincrease. It is also important
for us to understand the interpretation ofNPV. The net present value may be interpreted to mean
the immediateincrease in the wealth of a firm if the investment proposal is accepted. Itis equal to
an unrealised capital gain. The net present value can also beinterpreted to represent the amount
the firm could raise at a required rateof return in addition to the initial cash outlay to distribute
immediatelyto its shareholders and by the end of the project life to have paid off allthe capital
raised plus interest on it.
Example
Calculate the net present value of a project which cost N500,000. Butgenerates cash inflows of
N150,000, N300,000 and N400,000 over athree year period. The required rate of return is 10%.
Page 108
108
In terms of merit, the NPV method is very significant since it recognizes the time value of
money. It also is consistent with the objective ofmaximising the wealth of shareholders.
However, the NPV suffers fromthe following limitations.
Firstly, it is fairly difficult to use.
Secondly, in computing the NPV, it is assumed that the discount ratewhich usually is a firm‘s
cost of capital is known. But as we know, thecost of capital is a fairly difficult concept to
measure in real life.
Thirdly, NPV may not yield a consistent answer when the projects beingcompared involve
different amounts of investment.
The Internal Rate of Return (IRR) Method
The internal rate of return (IRR) can be defined as that rate whichequates the present value of
cash inflows with the present value of cashoutflows of an investment. Put in another way, the
internal rate of returnis the rate at which the NPV of an investment is zero. It is called theinternal
rate because it depends solely on the outlay and the resultingcash inflows of the project and not
any rate determined outside the
investment.
Let C = Cash outlays of an investment
A1 = Cash inflows received in(I+R). year I discounted atthe cost of capital R.
A2 = cash inflows received in year 2(I+R)2 discounted at the cost ofCapital R.
A3 = cash inflows received in year 3(I+R)3 discounted at the cost ofCapital R.
Write the basic equation
Page 109
109
The value of R in the equation at which total cash outlays equal totalcash inflows is called the
internal rate of return (IRR).Usually the value of R can be found out by trial and error. Generally,
ifthe calculated present value of the expected cash inflows is lower thanthe present value of cash
outflows, a lower rate should be tried. On theother hand, if the calculated present value of the
expected cash inflowsis higher than the present value of cash outflows, a higher rate should
betried.
Example
A barbers‘ shop costs N32,400 to establish and is expected to generatecash inflows of
N16,000,N14,000 and N12,000 over its life of threeyears. Calculate the internal rate of return.
The net present value is –N514 at 16% discount factor. Let us try alower rate like 14%
Page 110
110
You will observe from the above calculations that when we tried 16%discount rate, the NPV was
negative at –N514, when we tried14%discount rate, the NPV became positive at N498.
Therefore, theinternal rate of return we are looking for lies between 14% and 16%.
The basic accept-or-reject rule, using the IRR method, is to accept theproject if its internal rate of
return is higher than the firm‘s required rateof return. However, the project should be rejected if
its internal rate ofreturn is lower than the firms cost of capital.It is important that we understand
the interpretation of the internal rateof return (IRR).
The internal rate of return (IRR) represents the highest rate of interest afirm would be ready to
pay on funds borrowed to finance the projectwithout being financially worse-off, by repaying the
loan principal plusaccrued interest out of the cash inflows generated by the project.
We should also see the internal rate of return method as a very soundmethod. As we said, it is a
discounted cash flow method and also itconsiders the time value of money. It is also compatible
with the firm‘sdesire to maximise the owners‘ wealth. However the IRR method isfairly difficult
to understand and it involves complex computations.
SELF ASSESSMENT EXERCISE
Distinguish between the traditional project evaluation methods and thediscounted cash. Show
criteria.
4.0 CONCLUSION
We have discussed project evaluation criteria which we said constitute avery crucial topic in this
course. We discussed traditional criteria ofproject evaluation. Here we mentioned the payback
period andthe accounting rate of return (ARR). We also discussed discounted cash inflow
criteria. Here we mentioned the net present value (NPV) methodand the Internal Rate of Return
(IRR).
5.0 SUMMARY
Project evaluation criteria provide us with the tools with which we canchoose from various
investment proposals using acceptable techniques.The evaluation criteria guide the project
initiator and assist him/her tochoose among alternative projects. Also banks use project
evaluationcriteria to decide whether or not to lend money for a project.
6.0 TUTOR-MARKED ASSIGNMENT
Why are the discounted cash flow (DCF) techniques better and moreacceptable than the
traditional methods of project evaluation?
7.0 REFERENCES/FURTHER READINGS
Leon Ikpe (1999). Project Analysis and Evaluation. Lagos: ImpressedPublishers.
Page 111
111
UNIT 5 INTRODUCTION TO ECONOMIC ANALYSIS
CONTENTS
1.0 Introduction
2.0 Objectives
3.0 Main Content
3.1 Financial Analysis and Economic Analysis- AComparison
3.2 The Nature of Economic Analysis
3.3 Adjustments to Financial Analysis
3.4 Linkage Effects of a Project
4.0 Conclusion
5.0 Summary
6.0 Tutor-Marked Assignment
7.0 References/Further Readings
1.0 INTRODUCTION
Generally, in a project analysis situation, most analyses focus on thecash inflows and outflows of
a project. Critical expenses and incomesare usually compared to determine whether a project
should beundertaken or not. But expenses and revenues in most financial analysesare mainly the
consideration of a private investor.
The implication of financial analysis is that it provides a micro view of aproject and concentrates
attention on things like accounting profits.
Economic analysis on the other hand considers projects from a macropoint of view. The type of
questions asked in an economic analysis are:
1. Will the project under consideration lead to the general wellbeing of the community, the state
and the nation?
2. Will the project generate employment at various levels in themacro environment?
3. Will the project lead to economic growth?
4. What are the linkages that the project has, i.e., forward orbackward linkages?
5. Will the project generate more technical knowledge?
The questions that we have asked are not exhaustive but only go todemonstrate the type of
questions that economic analyses seek toanswer.
2.0 OBJECTIVES
At the end of this unit, you should be able to:
• explain the meaning of an economic analysis
• distinguish between an economic analysis and a financial analysis.
3.0 MAIN CONTENT
3.1 Financial Analysis and Economic Analysis – aComparison
In general theory, a financial analysis tries to solve resource allocationproblems. It tries to use
information from projects to determine whetherprojects should come on stream or not.Economic
analysis also tries to solve resource allocation problems in aneconomy. In economic theory,
Page 112
112
resources are very scarce and it is part ofany good analysis to allocate resources between
competing projects. Forexample, resource allocation problems can arise if a community is
tryingto decide whether to build a school or a hospital with limited scareresources.
Financial analysis equally tries to allocate resources but from a microview point. So, both
financial and economic analyses solve resourceallocation problems.
Financial analysis tries to concern itself with issues of both benefits andcosts arising from a
project. In the financial analysis, the concern of theanalysis is to evaluate the stream of costs
attached to a projectand deduct same from the stream of benefits.
If the stream of benefits is greater than the stream of costs, then project in question has a positive
value and should be accepted,allthings being equal. However, if the stream of costs is greater
than thestream of benefits, then the project in question has a negative value andshould not be
accepted, all things being equal.
Economic analysis also concerns itself with costs and benefits arisingfrom a project. If the
stream of benefits is greater than the stream ofcosts, then the project in question has a positive
value and should beaccepted.
However, if the stream of costs is greater than the stream of benefits,then the project in question
has a negative value and shouldnot be accepted , all things being equal.So we could say that
financial analysis and economic analysis bothconcern themselves with costs and benefits arising
from a project. In theend, they provide answers to the question of whether a project should
beacceptable or not. In evaluating projects, both use discounting andcompounding techniques to
arrive at their answers.
However, there exist conceptual differences between financial analysisand economic analysis.
While financial analysis has a primary objectiveof establishing the viability and acceptability of
a project from afinancial view point, paying no attention to society, economic analysishas the
objective of establishing the fact that a project is acceptable ornot to the society as a whole. So
while financial analysis has a microobjective, economic analysis has a macro objective.
Finally, in reaching a decision as to whether or not to accept a project,financial analysis and
economic analysis both try to establish arelationship between costs and benefits.
For example in financial analysis, costs and benefits arising from aproject are usually defined in
monetary variables such as profits. Buteconomic analysis goes really beyond the vague
definitions of profit. InEconomic analysis, costs are defined in terms of opportunity costs
orforegone costs to the society as a whole.
SELF ASSESSMENT EXERCISE 1
Compare and contrast financial analysis and economic analysis.
3.2 The Nature of Economic Analysis
In economic analysis, the costs and benefits attached to a project areusually compared before a
decision can be reached on whether or not toaccept a project.
In the literature, there exist three discounted measures of project worthwhich we will now
discuss:
The Net Present Worth
Page 113
113
The net present worth is the difference between the present worth ofbenefits and the present
worth of costs. We can write thus:
Net Present Worth =
Generally, according to the net present worth theory, a projectis acceptable if the net present
worth is positive. If the net present worth isnegative, the project will be rejected.
Benefit-Cost Ratio
If you divide the present worth of benefits of a project by the presentworth of its costs, then you
have what is known as the benefit-cost ratio.We can write thus:
Benefit-Cost ratio = Present worth of benefits
-------------------------------
Present worth of costs
Generally, a project is acceptable if the benefit-cost ratio is greater than1 (one).
If the benefit-cost ratio is exactly 1 (one), that project is abreak even project.
The Internal Rate of Return (IRR)
The internal rate of return is a discount rate where the present worth ofbenefits is equal to the
present worth of costs.
Under the internal rate of return evaluation method, a project will beacceptable if its internal rate
of return is higher than the firm‘s requiredrate of return.
The starting point of economic analysis is the financial analysisof a project which should be
properly concluded before embarking on aneconomic analysis. Some adjustments will be made
to the calculations to arrive at economic data.
First, it may be necessary to include or exclude some costs and benefitswhich may have been
included or excluded from the financial analysis.
Secondly, some project inputs and outputs may have to be revalued iftheir shadow prices differ
significantly from their market prices.
SELF ASSESSMENT EXERCISE 2
Discuss the nature of economic analysis with emphasis on the methodsof evaluating the worth of
a project.
3.3 Adjustments to Financial Analyses
We have stated that the starting point of an economic analysis is afinancial analysis, so if we
have financial data on financial analysis, weneed to make some adjustments to the financial
analysis to arrive ateconomic analysis data. We shall now consider some of the adjustments:
Transfer Payments
Transfer payments represent transfer of resources from one section ofsociety to another. They do
not make any claim on the country‘sresources and as such, their impact should be clearly
distinguished andanalysed in the economic analysis.
Present Worth
of benefits
Present Worth
of costs
Page 114
114
One of the first transfer payments we shall consider is interest. Interestis a reward for capital. For
example, if a project is funded through abank loan, the interest component is included in the
profit and lossstatement.
The interest charges in the profit and loss statement represent transferpayments from a project to
the provider of funds. What the project lost(interest) has become a gain to the provider of funds.
In effect, both figures are equal and cancel out without any net increaseto society of funds.
Therefore in economic analysis, interest charges areexcluded since they only represent transfer
payments.
The second transfer payment we shall consider is tax. When a project isprofitable it is expected
to pay taxes to the government at the ruling rate.In computing the profit of a project taxes are
deducted to arrive at netprofit. Taxes therefore appear as outgoing cash flows. Taxes
representtransfer payments from a project to government.
In the economic analysis of a project, taxes are excluded because fromthe point of view of the
society, they are only a transfer of resourcesfrom one section of the economy to another.
The third transfer payment is subsidies. In a traditional private sectors setting, it would be
unheard of to talk of subsidies. But in economicanalysis, subsidies appear as important data.
Most public sector projectsenjoy government subsidies to enable the poor gain access to
certainservices which ordinarily they cannot afford without governmentassistance. Subsidies
represent opportunity costs to a nation as a whole.
Therefore in estimating the true cost of a project in an economicanalysis, subsidies should be
included.
3.4 Linkage Effects of a Project
Consider a simple case where a university is newly located inan environment. Many investments
will begin to spring up. New housingdevelopments will begin to spring up; canteens will begin to
spring up;hair dressing salons, etc. will begin to spring up to cater for the needs ofthe new
university community. Such constitute the linkage effects of aproject.
Generally, there are two types of linkage effects which we shall brieflydiscuss:
Forward Linkage Effects
Forward linkage is the stimulus given to industries that use the productsof a project. A case in
point is a flour manufacturing project. Flour hasso many uses. If a flour mill is located in an
environment, it will lead tothe establishment of such projects as bakeries which will use the
flour.
Backward Linkage Effects
Backward linkage demonstrates the stimulus to industries that supplythe inputs to a project. For
example, the establishment of a flour mill inan environment will lead to demand for wheat which
is a major input forflour mill. The flour mill will lead to investment in wheat cultivation.
Also, the establishment of a car assembly plant will lead tothe establishment of tyre
manufacturing plants that need to supply tyres tothe car assembly plant.
Page 115
115
Example of an Economic Analysis
In the year 2006, the World Bank was considering the desirability orotherwise of assisting
Nigeria set up an ethanol plant covering thousandsof hectares in the Niger Delta area.
Under the scheme, young farmers will be allocated hectares of land forsubsidized cassava
cultivation. Such inputs like fertilizers will be heavilysubsidized while technical advice will be
provided by the World Bank/Nigerian agricultural experts.
4.0 CONCLUSION
In this unit, we discussed the nature of economic analysis and comparedit with the financial
analysis of a project. We discussed netpresent benefit cost ratio and the internal rate of return
(IRR).
5.0 SUMMARY
Introduction to economic analysis has provided us with the tools toconduct economic analyses,
with financial analyses as a starting point.
Financial analysis is the private sector‘s view of a project withoutconsidering a project‘s impact
on the society. Economic analysis is amacro view of a project, taking into consideration the
project‘s impacton society.
6.0 TUTOR-MARKED ASSIGNMENT
What do you see as the basic differences between the financial analysisof a project and the
economic analysis of a project?
7.0 REFERENCES/FURTHER READINGS
Leon Ikpe (1999). Project Analysis and Evaluation. Lagos: ImpressedPublishers.
Page 116
116
UNIT 6:CASHFLOW DIMENSIONS
CONTENTS
1.0 Introduction
2.0 Objectives
3.0 Main Content
3.1 Meaning of Cashflow
3.2 Cash and Cash Equivalent
3.3 Benefits of Cashflow
3.4 Dimensions of Cashflow
3.5 Treatment of other Items in Cashflow Statement
4.0 Conclusion
5.0 Summary
6.0 Tutor-Marked Assignment
7.0 References/Further Reading
1.0 INTRODUCTION
In this unit, we will discuss cashflow dimensions. The section firstly establishes the meaning of
cashflow and its benefits and thereafter the dimensions of cash flow. Cash is mainly generated
for operating activities which is buying assets and discharging liabilities. Cash is also raised
fromthe issue of shares and debentures or loans but adequate cash should beavailable for use in
time and no cash should remain idle. For this, a tool of analysis is used which is referred to as the
cash flow statement.
Page 117
117
2.0 OBJECTIVES
In this lesson, you will learn about:
meaning of cashflow and its benefits.
dimensions of cashflows and its methods of preparation.
Cashflow statement
3.0 MAIN CONTENT
3.1 Meaning of Cash Flow
The summary of cash transactions (receipts and payments) during an accounting period is called
Cash Flow Statement. Cash flows are inflows (i.e. receipts) and outflows (i.e. payments) of cash
and cash equivalents. Cash inflows represent benefits and cash outflows represent costs. The
difference between the two at any point in time is called net cash flows.Cashflowcomprises of
cash on hand and demand deposits.Movement in cash and cash equivalents are not cash flows.
3.2 Cash and Cash Equivalents
Cash: Cash comprises of cash in hand and deposits repayable on demand with any bank or other
financial institution.Cash Equivalents: cash equivalents are short term, highly liquid investments
that are readily convertible into known amounts of cash and are subject to insignificant
risk/change to value. They are not held for investment or other long term purposes, but rather to
meet short-term cash commitments. To fulfil the above definition, an investment's maturity date
should normally be within three months from its acquisition date. It would usually be the case
then that equity investments (i.e. shares in other companies) are not cash equivalents.
Page 118
118
3.3 Benefits of cash flow information
Benefits here explain the advantages or helps from cashflow and cashflow information. The use
of statements of cash flows is very much in conjunction with the rest of the financial statements.
Some benefits to be derived from cashflow and cashflow information are:
a. Cash flow information of a historical nature can be used as an indicator of the amount,
timing and certainty of future cash flows.
b. Statements of cash flows enhance comparability as they are not affected by differing
accounting policies used for the same type of transactions or events
c. Users can gain further appreciation of the change in net assets, entity's financial position
(liquidity and solvency) and entity's ability to adapt to changing circumstances by
affecting the amount and timing of cash flows.
d. Past forecast cash flow information can be checked for accuracy as actual figures emerge.
The relationship between profit and cash flows can be analyzed as a result of changes in
prices over time.
3.4 Dimensions of Cashflow
The dimensions of cashflow mean the various aspects of cashflows arising from activities in the
organization. The dimensions of the cashflow are in different forms. The cashflows generated
through various activities in the organization are classified as:
1. Operating cashflow.
2. Investing cashflow.
3. Financing cashflow.
The remaining part of this section will discuss each of this in detail with illustrations where
necessary.
Page 119
119
1. Operating Activities
Operating activities are principal revenue producing activities of the enterprise.It is perhaps the
key part of the statement of cash flows because it shows whether, and to what extent, companies
can generate cash from their operations. It is these operating cash flows which must, in the end
pay for all cash outflows relating to other activities, i.e. paying loan interest, dividends and so on.
Most of the components of cashflows from operating activities will be those items which
determine the net profit or loss of the entity, i.e. they relate to the main revenue-producing
activities of the entity. Other activities that are not investing or financing activities are also
referred to as operating activities.
Examples are:
o Cash receipts from sale of goods or rendering services.
o Cash receipts from royalties, fees, commissions and other revenue.
o Cash payments to suppliers of goods and service.
o Cash payments to and on behalf of employees.
Reporting of Cashflow from operating activities
Cashflow from operating activities can be reported in two forms. It can be derived either from
direct method or indirect method.
Direct method
In this method, gross receipts and gross payments of cash are disclosed.
Cash receipts from customers XX
Cash paid to suppliers XX
Cash paid to employees XX
Cash paid for other operating expenses XX
Cash generated from operation XX
Income tax paid XX
Net cash from operating activities XX
Page 120
120
Indirect method:
In this method, profit and loss account is adjusted for the effects of transaction of noncash and
non-operating nature.Cash flows from operating activities are identified by adjusting the profit
before tax figure. It arrives at the cash from operating activities figure indirectly by reconciling a
profit figure to a cash figure. The adjustments remove the impact of accruals and non-cash items
and also relocate somefigures to other positions in the statement of cash flows.Cash flow
statement of listed companies shall be presented only under the indirect method as prescribed
below.
Retained Earnings XX
Add: Dividend paid XX
Income Tax XX
Net Profit before Tax XX
Add: Depreciation XX
Loss on sale of Asset/Investment XX
Interest Paid XX
Provision for Bad debts XX
Less: Interest/ Dividend Received XX
Profit on sale of Asset/ Investment XX
Funds from operations XX
Add: Decrease in Current Asset XX
Add: Increase in Current Liabilities XX
Less: Increase in Current Asset XX
Less: Decrease in Current Liabilities XX
Cash generated from operation XX
Income Tax Paid XX
Net Cash flow from operating activities XX
Example 1: The following information has been extracted from the financial statements of
Hopper Company for the year ended 31 December 2014.
₦
Sales 1,280,000
Cost of sales (400,000)
Gross profit 880,000
Wages and salaries (290,000)
Other expenses (including depreciation ₦25,000) (350,000)
Page 121
121
240,000
Interest charges (50,000)
Profit before tax 190,000
Tax on profit (40,000)
Profit after tax 150,000
Extracts from the statement of financial position:
At 1 Jan. 2013 At 31 Dec.2013
₦ ₦
Trade receivables 233,000 219,000
Inventory 118,000 124,000
Trade payables 102,000 125,000
Accrued wages and salaries 8,000 5,000
Accrued interest charges 30,000 45,000
Tax payable 52,000 43,000
Required: Present the cash flows from operating activities as they would be presented in a
statement of cash flows using:
a) the direct method; and
b) the indirect method.
Answer:Direct method
Statement of cash flows: direct method ₦
Cash flows from operating activities
Cash receipts from customers(W1) 1,294,000
Cash payments to suppliers(W3) (383,000)
Cash payments to employees(W4) (293,000)
Cash paid for other operating expenses (325,000)
Cash generated from operations 293,000
Taxation paid (tax on profits)(W5) (49,000)
Interest charges paid(W5) (35,000)
Net cash flow from operating activities 209,000
Workings:
(W1) Cash from sales ₦
Trade receivables at 1 January 2013 233,000
Sales in the year 1,280,000
1,513,000
Trade receivables at 31 December 2013 (219,000)
Cash from sales during the year 1,294,000
Page 122
122
(W2) Purchases ₦
Closing inventory at 31 December 2013 124,000
Cost of sales 400,000
524,000
Opening inventory at 1 January 2013 (118,000)
Purchases in the year 406,000
(W3) Cash paid for materials supplies ₦
Trade payables at 1 January 2013 102,000
Purchases in the year (W2) 406,000
508,000
Trade payables at 31 December 2013 (125,000)
Cash paid for materials 383,000
Financial reporting
(W4) Cash paid for wages and salaries ₦
Accrued wages and salaries at 1 January 2013 8,000
Wages and salaries expenses in the year 290,000
298,000
Accrued wages and salaries at 31 December 2013 (5,000)
Cash paid for wages and salaries 293,000
(W5) Interest and tax payments Tax Interest ₦ ₦
Liability at the beginning of the year 52,000 30,000
Taxation charge/interest charge for the year 40,000 50,000
92,000 80,000
Liability at the end of the year (43,000) (45,000)
Tax paid/interest paid during the year 49,000 35,000
Answer: Indirect method
Statement of cash flows: indirect method ₦
Cash flows from operating activities
Profit before taxation 190,000
Adjustments for:
Depreciation and amortization charges 25,000
Interest charges in the statement of comprehensive income 50,000
265,000
Decrease in receivables (233,000 – 219,000) 14,000
Increase in inventories (124,000 – 118,000) (6,000)
Increase in trade payables
(125,000 + 5,000) – (102,000 + 8,000) 20,000
Cash generated from operations 293,000
Taxation paid (49,000)
Interest charges paid (35,000)
Page 123
123
Net cash flow from operating activities 209,000
2. Investing Activities
The activities of acquisition and disposal of long term assets and other investments not included
in cash equivalent are investing activities.This is the second part of a statement of cash flows,
after cash flows from operating activities.The cash flows classified under this heading show the
extent of new investment in assets which will generate future profit and cash flows.It includes
acquiring and disposal of debt and equity instruments, property and fixed assets etc.The most
important items in this part of the statement are cash paid to purchase non-current assets and cash
received from the sale or disposal of non-current assets but it also includes interest received and
dividends received on investments.
Examples:
o Cash payments for purchase of fixed assets.
o Cash receipts from disposal of fixed assets.
o Cash payments to purchase shares, or debt instruments of other companies.
o Cash receipt from disposal of above investments.
3. Financing Activities
Financial activities are those activities that result in changes in size and composition of owner‘s
capital and borrowing of the organization.This section of the statement of cash flows shows the
share of cash which the entity's capital providers have claimed during the period. This is an
indicator of likely future interest and dividend payments.It includes receipts from issuing shares,
debentures, bonds, borrowing and payment of borrowed amount, loan etc.
Example:
Page 124
124
o Issue of equity shares.
o Buy back of equity shares.
o Issue/ redemption of preference shares.
o Issue / redemption of debentures.
o Long term loan / payment thereof.
o Dividend / interest paid.
Payments of dividends are also usually included within cash flows from financing activities, in
this part of the statement of cash flows. (Some entities may also include interest payments in this
section, instead of including them in the section for cash flows from operating activities.
3.5 Treatment of other Items in the Cashflow Statements
Interest: Interest received on investment is treated as investment inflow. Interest received from
short term investment is classified as cash equivalents and should be considered as cash inflows
from operating activities. Then interest received on trade advances, operating receivables and
financial enterprises should be in operating inflows. On the other hand, interest paid on
loans/debts is financing activities. And on working capital loan or loan taken to finance operating
activities are included in operating inflows. Then for financial enterprises is in operating outflow.
Dividend: Dividend received for non-financial enterprises is an investing inflow. While dividend
received for financial enterprises is an operating inflow.On the other hand, dividend paid is
always classified as financing inflow.
Foreign currency transactions:The effect of change in exchange rate in cash and cash
equivalents held in foreign currency should be reported as separate part of the reconciliation of
Page 125
125
cash and cash equivalents. Unrealized gain and losses arising from changes in foreign exchanges
rates are not cash flows.
Extraordinary items:The cash flows associated with extraordinary items should be classified as
arising from Operating, Investing or Financing activities as appropriate and separately disclosed.
For example: insurance claim received against loss of stock or profits is extraordinary operating
cash inflow; insurance claim received against loss of fixed assets is extraordinary investing cash
inflow.
Treatment of tax:Cash flow for tax payments / refund should be classified as cash flow from
operating activities.Taxes deducted at source against income are operating cash outflows if
concerned income are operating.Cash flow for tax payments identified with a specific investing
or financing flow should be classified as investing or financing flow respectively. For
exampledividend tax is recognized as financing flow.
Acquisitions and disposals of subsidiaries/other businesses:Cash flow on acquisition and
disposal of subsidiaries and other business units should be presented separately and classified as
investing activities.Total purchase and disposal should be disclosed separately. Also the position
of the purchase / disposal consideration discharged by means of cash and cashequivalents should
be disclosed separately.
Non-cash transactions:These should be excluded from the cash flow statement.Rather, these
transactions should be disclosed in the financial statements.Examples are acquisition of assets by
assuming directly related liabilities; acquisition of an enterprise by means of issue of equity
shares; conversion of debt to equity etc.
Page 126
126
Disclosures of cash and cash equivalents: The components of cash and cash equivalents should
be disclosed.Reconciliation of the amount in the cash flow statement with the equivalent items
reported in the balance sheet.
4.0 CONCLUSION
We conclude that cash flows are inflows (i.e. receipts) and outflows (i.e. payments) of cash and
cash equivalents in the organization.The dimensions of the cashflow are generated from various
cash related activities in the organization. They are operating cashflow, investing cashflow and
financing cashflow.
5.0 SUMMARY
In this unit the meaning of cashflow was stated along with cash and cash equivalent. Then the
benefits of cashflow listed. The dimensions of Cashflow arising from cash related activities in
the organization are operating cashflow, investing cashflow and financing cashflow. The main
content of the unit ended with the treatment of other Items – interest, tax, non-cash transaction,
dividend etc in cashflow statement.
6.0 TUTOR-MARKED ASSIGNMENTS
6. What is the meaning of cashflow?
7. Explain with example the operating cashflow dimension.
7.0 REFERENCES/FURTHER READINGS
Mason, R. (2012), Finance for Non Financial Managers. Holder & McGraw Hill Companies.
International Accounting Standard (IAS 7)
Financial Reporting: ICAN Study Text: Nigeria, Emily Woof International 2014
Page 127
127
MODULE 4 RISK AND COST ANALYSIS
Unit 1 The Evaluation Methods
Unit 2 Concept of Risk in an Organisation
Unit 3 Risk and Uncertainty
Unit 4 Assessment of Social Profitability
Unit 5 Cost Benefit Analysis
Unit 6: Evaluation Techniques
Unit 7: Assessment of Private Profitability
UNIT 1 THE EVALUATION METHODS
CONTENTS
1.0 Introduction
2.0 Objectives
3.0 Main Content
3.1 Purpose of Evaluation
3.2 Types of Evaluation
7.0 References/Further Readings
2.0 OBJECTIVES
At the end of this unit, you should be able to:
• explain the meaning of Evaluation
• analyse the purpose of evaluation and classify difference types of project evaluation.
3.0 Introduction
The evaluation of on-going and completed projects is one of the basic responsibilities of the
Planning and Development Division.
3.1 Purpose of Evaluation
The final phase in the project cycle is project evaluation. The analyst looks systematically at the
elements of success and failure in the project experience to learn how to plan better for the future.
The basic objective of such a study is to ascertain the real worth of a project or programme as far as
possible. Broadly speaking, evaluation may be defined as "a process which attempts to determine as
systematically and objectively as possible the relevance, effectiveness and impact of activities in the
light of the objectives". It is, thus, a critical analysis of the factual achievements/results of a project,
Page 128
128
programme or policy vis-a-vis the intended objectives, underlying assumptions, strategy and
resource commitment. In specific terms, it makes an attempt to assess objectively the following:-
(a) the relevance and validity of the objectives and design of the project/programme in terms of
broader issues of development policy, sector/sub-sector priorities and strategies as well as other
problems of a wider nature;
(b) the efficiency and adequacy of the pace of progress of the project/programme where the focus is
mainly on managerial performance and productivity;
(c) the effectiveness of the project/programme - a major part of an evaluation exercise-in realizing
the intended objectives from a variety of angles; and
(d) the identification of reasons for the satisfactory or unsatisfactory accomplishment of the results
of the project/programme and to deduce critical issues and lessons which may be of relevance to
other on-going and future projects/programmes of a similar nature.
3.1.3 Types of Evaluation
Evaluation can be applied for different purposes as well as to a specific activity, project or
programme. It is not restricted to the completion stage only but involves periodic investigations at
many stages. The different types of project evaluations carried out are: (i) ex-ante evaluation, (ii)
on-going evaluation and (iii) terminal evaluation/ex-post evaluation. The ex-ante evaluation/pre-
approval appraisal has already been discussed with methods and techniques in Chapter-5. The on-
going evaluation is carried out by the organization of its own to re-assess the projected feasibility of
the PC-I content because of the time lag, while external evaluation is done by an agency other than
the body involved in the implementation of a project. On-going and post-completion evaluations are
discussed below:-
(a) On-going/Mid-term Evaluation
The main purpose of an on-going/mid-project evaluation is to assist the project management to
make appropriate adjustments in the changed circumstances or to rectify any shortcomings in the
original design, so as to improve its efficiency and overall performance.
(b) Post-Completion Evaluation
The purpose of an ex-post or post-hoc evaluation is to discover the actual, as opposed to the
projected, results of implementing a project. The aim of evaluation is primarily to compare the
actual outcome of the project with the projections made at the appraisal stage. The examination of
different aspects of the project can provide important lessons derived from experience for the new
projects. The overall impact of the project will result in a number of effects which can be classified
as costs and benefits, direct and indirect or tangible and intangible. Ex-post evaluation takes place
Page 129
129
after the completion of the project and is often more in-depth as it focuses on the analysis of impact.
Besides, it is time-consuming, costly and calls for persons with special skills.
SELF ASSESSMENT EXERCISE 2
Discuss the nature of evaluation of a project.
4.0 CONCLUSION
In this unit, we discussed the nature of economic analysis and compared it with the financial
analysis of a project. We discussed net present benefit cost ratio and the internal rate of return
(IRR).
5.0 SUMMARY
Introduction to meaning of evaluation, the purpose of evaluation and types of evaluation.society.
6.0 TUTOR-MARKED ASSIGNMENT
Write short note on midterm evaluation and post-completion evaluation?
7.0 REFERENCES/FURTHER READINGS
Leon Ikpe (1999). Project Analysis and Evaluation. Lagos: Impressed Publishers.
UNIT 2 CONCEPT OF RISK IN AN ORGANIZATION
CONTENTS
1.0 Introduction
2.0 Objectives
3.0 Main Content
3.1 Meaning of Risk
3.2 Types of Risk
3.3 Relationship between Risk and the Objectives of anOrganization
3.4 Organization‘s Risk Exposure
4.0 Conclusion
5.0 Summary
6.0 Tutor Marked Assignment
7.0 References/Further Readings
1.0 INTRODUCTION
Risk is part of everyday life. Consequently everyone has his own viewas to what risk is all about,
most especially based on his own personalexperiences.
Risk could range from near accident misses to catastrophic events suchas the terrorist attack of
the World Trade Center in United States ofAmerica in September 11th 2001 or the Ikeja Bomb
blast of January2002.
In the same vein, different people have different level of tolerance ofrisk. This is why the study
of risk-either on individual or corporate levelis very vital.
2.0 OBJECTIVES
After studying this unit, you should be able to:
Explain the potential risk to mankind.
Page 130
130
Differentiate between speculative risk and operational risk.
Describe the relevance of risk management within corporatestrategies.
Explain the regulatory and advisory pressures on management.
Explain the fundamental steps in the process of risk management.
Describe the role and position of the risk manager within anorganization.
3.0 MAIN CONTENT
3.1 Meaning of Risk
Risk has been described as a natural ingredient to any activity. Noventure, no success; this could
be recorded as no risk, no success eitherfor an individual or organization.
The question now is what do we mean by risks?
To answer this question, there is need for us to note that differentauthors have defined risk in
various ways. Williams Jr. and Heins(1985) had posited that, no one definition is ―correct‖. That
is, thedefinition could be likened to the story of the seven blind men‘sdescription of the elephant
– all of which are correct and at the sametime incorrect. The above might not be unconnected to
the fact that risksexist whenever the future is unknown. More so, that the adverse effectsof risk
had challenged the survival of mankind on planet earth ever sincetime immemorial.
In this regard, we will like to look at the different views of some of thereputable authorities on
the subject, as stated below.
1. ―The term risk has a variety of meaning in business and everydaylife. At its most general
level, risk is used to describe anysituation where there is uncertainty about what outcome
willoccur. Life is obviously very risky, even the short-term future isoften highly uncertain. In
probability and statistics, financialmanagement, and investment management, risk is often used
in amore specific sense to indicate possible variability in outcomesaround some expected value –
Harrington, Nichaus (1999,p3)
2. Risk will be looked at from the viewpoint of whether an incidentis likely to occur. It is also
necessary to consider how often suchan incident could happen and how damaging the incident
wouldbe if and when it occurred. - David Kaye (2001, p1/2)
3. RISK is the variation in the outcomes that could occur over aspecified period in a given
situation. If only one outcome ispossible, the variation and hence the risk is O. If many
outcomesare possible, the risk is not O.The greater the variation, thegreater the risk. - Williams,
Jr and Heins (1985, P6).
4. Risk, defined as uncertainty as to loss poses a problem toindividuals in nearly every walk of
life. Students,householders, business people, employees, travelers‘ investors,and farmers all must
face risk and develop ways to handle it. Ifa cost or loss is certain to occur, it may be planned for
in advanceand treated as a definite, known expense. It is when there isuncertainty about the
occurrence of a loss that risk becomesimportant problem. Greene andTriechman (1984, 3).The
essence of the above descriptions is to assist usappreciate theimportance of risk to our everyday
existence. These descriptions beensummed up in nutshells in the definitions below:
i Risk is variation in possible outcomes of an event based onchance. – orfman‘s Introduction to
Risk Management &Insurance, 4th Edition.
Page 131
131
ii Risk is uncertainty as to loss.– Greene &Trieschmann‘s, Risk & Insurance, 7th Edition.
iii Risk equals uncertainty. Risk has principally to do with theuncertainty of a loss.
– Mehr&Cammack‘s Principle of Insurance 3rd Edition.
iv Risk may be defined as the possibility that loss will be greaterthan is normal, expected, or
usual.– Mehr&Hedges‘s Risks Management Concept &Application.
At this point, it is important to note that there are those who enjoy anduse risk as well as those
that are risk averse – they avoid risks! Inbetween the two extremes that majority of people can be
located.
3.2 Types of Risk
For the purpose of this course, we look at risk from these two types.That is, the speculative risk
and operational risk.
Speculative Risk
These are risks where the outcomes could either be a loss, no loss orprofit. For instance, if a
company decides to invest its money in aproject, the objective of using fund in the way is to
make profit. But inreality, the outcome could either be a loss, a break-even or a profit.
Risks with such tendencies are classified as speculative risks. Examplesof speculative risks are:
Decision as to invest in a new project, the timing of such aninvestment
Whether to enter a new market place or a new country (as in thedeveloped countries‘
emerging market concept of Asia, etc.)
A car maker deciding to replace a current model, the timing and levelof investment
needed, etc.
Operational Risk
These are risks that any organization faces in carrying out its dailyactivities. This occurs when
something unplanned and unpleasant hit theorganization causing losses – either to men or
materials – in theorganization. In an operational risk, the outcome is either a loss or noloss
situation. Some textbooks refer to this type of risk as Pure Risks.
As a result of the unexpected nature of this kind of risks, organizationscan prepare for losses
following the occurrence of such risks, throughinsurance, contingency planning and other
funding mechanisms. Thereis always thechallenge to organization to recognize and manage
theoperational risks threatening their existence.
SELF ASSESSMENT EXERCISE 1
Differentiate between speculative risk and operational risk.
3.3 Relationship Between Risk and the Objectives of anOrganization
The objective of an organization is to maximize its profit. This mainobjective has always been
made difficult as a result of the impact of riskto the organization. For instance, if an organization
suffers from anindustrial accident which, let say, makes it pay out the sum of N50Million in form
of various compensation to the victims of such losses.
You will note that this will affect the overall result of the organization atthe end of its financial
year.Apart from the objective of profit maximization, a modern organizationhas alongside other
Page 132
132
objectives. The objective of an organization may beinformal while at times, they are formal and
documented in form ofstrategic plan.
These objectives are shared with the organization‘s ‗stakeholders‘.The ‗stakeholders‘ have been
defined by Kaye (2001) as people ororganization, which could be affected by a risk incident
occurring in theorganization itself. As, he sees risk as having the potential to ―threaten the
operations, assets and other responsibilities of an organization‖. Theidentified ‗stakeholders‘ by
Kaye (2001) are:
1. Employees.
Morale and pride. This often reflects the degree of the employees‘interest in the success
of an organization and has a direct link into thequality of work performed.
A need for a job to sustain personal and family life and also selfesteem.
A safe working environment
2. Suppliers
Suppliers to the organization will depend on its survival to be able todeliver and receive
payment for the goods or services contracted.
Sometimes the loss of one or more large customers can destroy asupplier of goods and
services.
The organization, as supplier, can destroy customers who are furtherup the delivery
chain.
3. Customers and Other Recipients of Service
Most business customers are free to move to other organizations.They will do so if they
lose confidence in either delivery or quality.
Other, non-commercial, service suppliers may find that theirrelationships with their
existing recipients will become difficult andeven fail should confidence be lost.
Sales teams will find it increasingly difficult to find new customers.
Failure to deliver the contracted services with sufficient quality canlead to litigation for
damages well beyond the value of the item indispute.
4. Distributors
Distributors are in effect wholesale customers. All the commentsabout customers
therefore apply.
Some distributors depend on few or even one source of supply (e.g. adistributor of a new
motor vehicles). Failure of that one source ofsupply could damage that distributor on
many different ways. It caneven cause it to fail if an adequate replacement supplier is not
foundsoon enough.
5. Regulators
There are various regulators who, in many different ways, will take acontinuing interest
in the origination.
Failure to satisfy the statutory and other requirement of theseregulators can result in them
imposing fines, restricting business orclosing down the business altogether.
The losses therefore can range from financial, reputational damageand even closure.
Page 133
133
6. The Media
The media has many firms:
Local and international Newspapers
Television and Radio
Popular and Professional Magazines
Increasingly, the Internet.
These can be regarded as wholesale distributors of the reputation ofan organization and
its officials.
If a publication is negative about an organization much damage canbe done. This is so
whether the story reflects the truth, only part ofthe truth, or even is factually incorrect.
The impact therefore is of significance to all other stakeholders.
7. Private Investors
Private, monetary, investors can range from family, partners,employees, associated
companies and other investors in anorganization often they can be exposed to devastating
loss than stockmarket investors who have more opportunity to spread theirinvestments,
and therefore the risk across different companies andmarket.
There are also ‗investors‘ who have a non-monetary stake in theorganization. They stake
their professional and personal reputationsalongside that of the organization. They too
can suffer loss alongsideany damage to the organization itself. They can find it a very
longand difficult process to rebuild this type of asset.
8. Banking Industry
Banking and investor finance companies will maintain, throughout,an interest in the
fortunes of those organizations to which they haveprovided money.
If that money is perceived to be at greater risk due to an unexpecteddownturn in the
strength of an organization, the cost of borrowingcan increase significantly.
If the financier believes there is sufficient cause for concern, theassets that are the
security for that loan can be sold. The lender canhave that power under the terms of the
loan or mortgage agreement.Primarily the decision when to sell the mortgage assets will
be basedon the interests of the financier and not necessarily the longer-terminterests of
the organization and its other stakeholder.
9. Quoted Shareholders
Quoted shareholders come to the organization through stock marketsin various forms.
Usually the investor has many choices beyond the subjectorganization and can switch
funds away rapidly.
Stock market sentiments however have many other influences(beyond the success of the
individual quoted organization) and thusits behaviour becomes a risk in itself.
Failing stock values can also increase the cost of borrowing capital.If leaders perceive
that the relationship between total borrowings andthe value of the company is narrowing
they can demand higherinterest rates and security.
Page 134
134
Single points of influence can affect shares widely. These influencesinclude credit rating
agencies such s Standard and Poor‘s, andinvestment analysts employed by the bigger
brokers and merchantbankers.
10. The Environment
Increasingly, there is public and statutory interest in the quality ofthe environment.
It is a very wide subject not only covering pollution of the physicalenvironment.
Organizations may need to consider money launderingand insider dealing through to
corporate manslaughter and otherpotential criminal acts.
And Others
Individual organizations may have their own, different stakeholderpressure. One example
would be a political organization with owndependencies to protect.
Competitors too are a form of ‗stakeholders‘. If an organization isweakened by an
unexpected damaging incident, there is usually awhole range of competitors who will see
the incident as anopportunity for themselves.
SELF ASSESSMENT EXERCISE 2
Identify and explain organization‘s stakeholders
3.4 Organization Risk Exposure
The organization is exposed to risk, which could affect its people, itsassets and / or other people
as well as their assets.
People
The people are usually exposed to the risks of injury, sickness or deathdepending on the nature
of activities carried out in the organization. Forinstance, for an employee of an asbestos
manufacturing company, apartfrom the risk of injury, he or she could be exposed to asbestos
relatedsickness such as lung cancer, etc.The people exposed to organization‘s risk are:
Employees
Visitors / Customers
Third parties
Assets
The assets of the organization are also exposed to the risk of damage.Such assets are:
Balance Sheet assets – such as money, building, equipment, vehiclesetc.
Off balance sheet assets – such as intellectual assets
(Information and knowledge) reputation network of critical,suppliers, distribution system,
customer base, etc.
Liabilities
These are the legal liabilities, which the organization owes others as aresult of wrongdoing. It
could be as a result of injury to third partyproperty.
Risk Map
Page 135
135
The risk map describes how risks can be presented graphically. Thisassists the organization to
have a picture of its risk exposures. Anexample of risk map is shown below.
SELF ASSESSMENT EXERCISE 3
Explain what you understand by the term speculative risk?
4.0 CONCLUSION
In this unit you have learnt important issues that relate to risk in anorganization and the different
stakeholders in an organization.
5.0 SUMMARY
Page 136
136
We have dealt with the meaning of risk, types of risks, relationshipbetween risk and the
objectives of an organization, etc. The unit thatfollows is a continuation of the analysis.
Therefore, in the next studyunit, we shall treat risk and uncertainty.
6.0 TUTOR - MARKED ASSIGNMENT
Identify six stakeholders to an organization and discuss their roles.
7.0 REFERENCES/FURTHER READINGS
Chilellezi, Obinna (2006) Risk Management for Insurance PracticeLagos: Inter. Training and
Educational Services.
Kaye, David (2004) Risk Management London: Chartered InsuranceInstitute
Page 137
137
UNIT 3 RISK AND UNCERTAINTY
CONTENTS
1.0 Introduction
2.0 Objectives
3.0 Main Content
3.1 Risk and Uncertainty distinguished
3.2 Subjective versus Objective Risk
3.3 Subjective Risk and Attitude to Risk
4.0 Conclusion
5.0 Summary
6.0 Tutor Marked Assignment
7.0 References/Further Readings
1.0 INTRODUCTION
Risk and Uncertainty are critical aspects of our lives. While some events of life involve losses,
others may not. Some of these losses might be common and somewhat predictable; many others
are shocking, unexpected events. Each involves risk or uncertainty. While the basic element of
risk has been discussed in this Unit 2, our focus is to provide a further insight into risk and
uncertainty. The discussion will additionally dwell on attitude to risk and uncertainty.
2.0 OBJECTIVES
After you have completed this unit, you should be able to:
Explain the term uncertainty
Distinguish between risk and uncertainty
Differentiate between objective and subjective risks
Discuss the different attitudes to risk
3.0 MAIN CONTENT
3.1 Risk and Uncertainty Distinguished
Even though no statistical treatment of risk is envisaged in this study, some basic facts from that
approach seem necessary for proper understanding of the concepts under discussion. Indeed, it is
true that the future cannot be known precisely by man. However, there are events or
development of events that can be known up to a given point in time, past or present and which
can be analyzed statistically in order to forecast what the future hold for the event(s).
Under condition of risk, a person or a decision maker is faced with a situation in which results of
an action or decision are not totally known, but will probably fall within a possible range of
outcomes. Here there could be more than one possible outcomes resulting from the selection of
an option. The decision maker is assumed to know the probability of occurrence of each
outcome. The decision maker‘s problem is to estimate, the mathematical probabilities of
occurrence. Basically, some errors of estimate, forecast or prediction are bound to occur, this
error being termed risk, implying the error of being wrong- in one‘s prediction. Happily enough,
statisticians have a way of determining such errors and measuring them. Indeed, the decision
maker can determine from past experience the objective probability and relative frequency of the
Page 138
138
occurrence of various outcomes. Thus, measurements could be possible with the aid of past
experience and record kept. Examples of measurable events are births, vehicular traffic, death,
population structure, schools and school attendance, number of buildings in a town, etc.
(Oluoma, 1999:10).
Under uncertainty condition, the decision maker has difficulty assigning probabilities to
outcomes either because there is a lack of information or an absence of knowledge concerning
what outcome can be expected. In other words, there are either two main possible outcomes or
too many known facts or both. In this case, the decision maker cannot predict the outcome with
any degree of confidence. In fact since the possible outcomes of the event under consideration
and/or their probabilities are unknown, it is difficult to measure or forecast accurately. This
situation is faced frequently by mangers when entirely new products or services are being
introduced. Other examples of non-measurable events are salvation in religion, state of mind, etc.
In addition, unlike risk, uncertainty is a subjective phenomenon. The implication is that two or
more individuals are unlikely to have identical views of the outcome of decisions taken under
condition of uncertainty. Consequently, it is very difficult to develop universally acceptable
techniques for dealing with uncertainty. In practice, a decision maker faced with uncertainty
would attempt to generate a probability distribution of possible outcomes on the basis of his
personal judgment of the situation. For instance, any predication as to which of two teams,
hitherto unknown, will win a match is bound to be subject. People are bound to give their
opinions according to their fancies of the team.
Risk concerns variations in possible outcomes in a situation. Uncertainty is often used as a
synonym for risk, although when so used it usually refers to objective (measurable or quantified)
uncertainty.
Economists and Statisticians use this concept when they measure variation in occurrences. On
such measure of variation is called the standard deviation which helps predict expected
variations from a norm.
Predictability of an expected probability actually occurring is increased as the number of events
is increased as evident in the principle of large numbers. (Bickelhaupt, 1974:5).
Still within the realm of uncertainty, there is a dividing line between objective and subjective
uncertainty. According to Bickelhaupt, subjective uncertainty which involves a feeling or state of
mind as to expected results differs from the above concept of objective uncertainty.
Lack of knowledge as to the real facts, prejudices, unwarranted high hopes, or other factors can
cause different predictions. Therefore, different subjective risks occur, and these often deviate
from the underlying objective risk. This kind of uncertainty is not readily measurable and is not
usually what is meant when the term risk is used.
In summary, risk is associated with measurability while uncertainty with non-measurability of
the event(s) or the error(s) of forecast about future situation(s).
Measurability here should be addressed from two important angles:
Knowledge of the possible outcomes of an event and their probabilities of occurrence;
and
Page 139
139
Objectiveness of measurement
SELF ASSESSMENT EXERCISE 1
State the differences between risk and uncertainty
3.2 Subjective Versus Objective Risk
Trieschmann, Gustavson and Hoyt (2001: 5) draw a distinction between subjective and objective
risks. According to them, subjective risk refers to the mental state of an individual who
experiences doubt or worry as to the outcome of a given event. In addition to being subjective, a
particular risk may also be either pure or speculative and either static or dynamic. Subjective risk
is essentially the psychological uncertainty that arises from an individual‘s mental attitude of
state of mind.
Objective risk differs from subjective risk primarily in the sense that it is more precisely
observable and therefore measurable. In general, objective risk is the probable variation of actual
from expected experience. This term is most often used in connection with pure static risks,
although it can also be applied to the other types of uncertainties.
The concept of subjective risk is especially important because it provides a way to interpret the
behaviour of individuals faced with seemingly identical situations yet arriving at different
decision. For example, one person may be ultra conservative and tend always to take the ―safe
way‖ out, even in cases that may seem quite risk – free to other decision makers. Objective risk
may actually be the same in two cases but may be viewed very differently by those examining
this risk from their own perspectives. Thus, it is not enough to know only the degree of objective
risk; the attitude towards risk of the person who will act onthe basis of this knowledge must also
be known.
SELF ASSESSMENT EXERCISE 2
State the differences between subjective and objective risk.
3.3 Subjective Risk and Attitude to Risk
Before going further into the intricate aspects of risk management it will be necessary to briefly
highlight some basic features of risk and individual‘s reaction to risks situations which are
fundamental ingredients in decision taking toward effective handling of risks.
It should be noted that although a particular type of event may be of such a nature that in
principle it ought to be possible to calculate both the probability and the potential variation in
particular outcomes, often defects in the quality of the data available to risk managers prevent the
calculation of reliable objective estimates of future loss probabilities.
Two common problems are:
insufficiently large samples (that is, the available details of past experience are based on
only a small number of exposure units), and
changes in risk factors that cast doubts on the usefulness of past experience as a guide to
the future.
In such circumstances there is no alternative but to draw on one‘s experience and judgment to
interpret loss trends to arrive at subjective probability estimates. Such estimates may differ
Page 140
140
markedly from the underlying true probabilities, not least because the estimator‘s judgment may
be coloured by his own attitude to uncertainty.
When risk cannot be measured objectively with a high degree of accuracy, so that individual
judgment and attitudes enter into the process, then subjective risk will be present. Subjective risk
has been defined as ―the uncertainty of an event as seen or perceived by an individual‖.
Attitude to risk could be approached from three angles:
a) risk averter,
b) risk optimist/risk seeker
c) risk neutral
To be risk averse implies that a person is willing to pay in excess of the expected return in
exchange for some certainty about the future. To pay an insurance premium, for example, is to
forgo wealth in exchange for the insurer‘s promise that covered losses will be paid. Some people
refer to this as an exchange of a certain loss (the premium) for an uncertain loss. An important
aspect of the exchange is that the premium is larger that the average or expected loss because
insurer expenses and profit are included. A person willing only to pay the average loss as a
premium would be considered risk neutral. Someone who accepts risk at less than the average
loss, perhaps even paying to add risk such as through gambling is a risk seeker. (Pritchett, schmit
et al, 1996. p. 4, 7) One person may be very cautious and averse to taking chances, whereas
another may be highly optimistic regarding uncertain outcomes: the former (risk averter) is likely
to arrive at higher loss probability estimates than the latter (risk optimist). Someone who is
strongly averse to accepting even the smallest variation in outcomes from the expected may
choose to insure, whereas a less risk adverse individual may be prepared to carry the risk
himself. In fact, attitude to risk influences not only subjective estimates of probability but also
risk handling decisions.
What causes one person to be more risk averse than another? This is a question best answered by
psychologists, sociologists, or anthropologists. However, it is safe to say that family and societal
influences, genetics, and religious / philosophical beliefs all play an important role. Somewhat
less clear is the relationship between a Person‘s risk aversion and his or her uncertainty; a
problem that is influenced by the imprecise way the terms ―aversion‖ and uncertainty‖
commonly are used. In some respects, uncertainty could be affected by aversion. For example, an
individual might be so wary of risk in general that he/she would tend to discount his / her own
judgment regarding a particular risk. In that respect, her/his own level of uncertainty regarding a
particular risk might be driven higher by her / his aversion to risk. In other situations, it is
possible to say that uncertainty influences aversion, in that a person consistently exposed to an
environment of seemingly random and unpredictable events (say, a citizen of Sarajevo) might
eventually develop a high level of aversion to risk. (Williams, Smith and Young, 1995: 7)
Some scholars have taken a different approach in relating to risk, risk aversion, and uncertainty
to one another. For instance, William and Heins (1989) discuss risk as consisting of objective
and subjective components. Objective risk refers to the measurable component of risk, while
Page 141
141
subjective risk reflects an individual reaction to (attitude towards) risk. In this approach,
uncertainty becomes an aspect of subjective risk.
Other views are possible and perhaps the best that can be said is that risk aversion and
uncertainty are distinct concepts that are not fully independent of one another. (Williams, Smith
and Young, 1995: 7)
SELF ASSESSMENT EXERCISE 3
Distinguish between a risk averter and a risk optimist.
4.0 CONCLUSION
Risk and uncertainty are two concepts that occupy the center stage of human and business
activities. They can make or man the future of any entity. What ever degree or level they assume
at any circumstance and the response or attitude of the individual or business will determine the
extent to which they can be taken to play negative or respectful role.
5.0 SUMMARY
You have learnt in this unit that risk and uncertainty are central in measuring organizational
performance. We have equally discovered that attitude to risk is vital to determining the best part
to take in resolving organizational problems. It is thus, trite to assert that a conscious effort in
handling organizational risks must start with a proper synergy of risk and uncertainty and the
adaptability of organizations to such business dynamics. In the next unit, we shall discuss the
impact of risk and uncertainty
6.0 TUTOR - MARKED ASSIGNMENT
Distinguish between risk and uncertainty.
7.0 REFERENCES/FURTHER READINGS
Bickechaupt, David (1974). General Insurance, 9th Ed, Richard D.Illinois, USA
Oluoma, Remi O. (1999). Elements of Insurance, Impressed publishers,Ikeja, Lagos, Nigeria.
Pritchet, S.T; J.J Schmit, et al (1996): Risk Management and Insurance7th edition, West
Publishing Company, USA.
Trieschmann, J. S. Gustavson, S. G.; and Hoyt, R.E. (2001).RiskManagement and Insurance,
11th Edition, South – WesternCollege Publishing, USA.
Williams, C.A; Smith M.L. and Young P.C. (1995).Risk Managementand Insurance, 7th Ed,
McGraw-Hill, Inc, New York Chartered Insurance Institute (1985):Risk Management, CII
Tuition
Page 142
142
UNIT 4 COMPETITION AND MARKETING PLANS
CONTENTS
1.0 Introduction
2.0 Objectives
3.0 Main Content
3.1 Social Profitability
3.2 Margin and Ratio
3.3 Effects of Divergences
4.0 Conclusion
5.0 Summary
6.0 Tutor-Marked Assignment
7.0 References/Further Readings
1.0 INTRODUCTION
Every firm is most concerned with its profitability. One of the most frequently used tools of
financial ratio analysis is profitability ratios which are used to determine the company's bottom
line and its return to its investors. Profitability measures are important to company managers and
owners alike. If a small business has outside investors who have put their own money into the
company, the primary owner certainly has to show profitability to those equity investors.
Profitability ratios show a company's overall efficiency and performance. We can divide
profitability ratios into two types: margins and returns. Ratios that show margins represent the
firm's ability to translate sales dollars into profits at various stages of measurement. Ratios that
show returns represent the firm's ability to measure the overall efficiency of the firm in
generating returns for its shareholders.
.
2.0 OBJECTIVES
At the end of this unit, you should be able to:
• explain the meaning of profit
• discuss social profitability plans and how they are designed.
3.0 MAIN CONTENT
3.1 Social Profitability
The second row of the accounting matrix utilizes social prices, as indicated in Table 2.1. These
valuations measure comparative advantage or efficiency in the agricultural commodity system.
Efficient outcomes are achieved when an economy's resources are used in activities that create
the highest levels of output and income. Social profits, H, are an efficiency measure because
outputs, E, and inputs, F + G, are valued in prices that reflect scarcity values or social
Page 143
143
opportunity costs. Social profits, like the private analogue, are the difference between revenues
and costs, all measured in social prices-H = (E - F - G).
For outputs (E) and inputs (F) that are traded internationally, the appropriate social valuations are
given by world prices-cif import prices for goods or services that are imported or fob export
prices for exportables. World prices represent the government's choice to permit consumers and
producers to import, export, or produce goods or services domestically; the social value of
additional domestic output is thus the foreign exchange saved by reducing imports or earned by
expanding exports (for each unit of production, the cif import or fob export price). Because of
global output fluctuations or distorting policies abroad, the appropriate world prices might not be
those that prevail during the base year chosen for the study. Instead, expected long-run values
serve as social valuations for tradable outputs and inputs.
The services provided by domestic factors of production-labor, capital, and land-do not have
world prices because the markets for these services are considered to be domestic. The social
valuation of each factor service is found by estimation of the net income forgone because the
factor is not employed in its best alternative use. This approach requires the commodity systems
under analysis to be excluded from social factor price determination. For example, if land is
planted to wheat, it cannot grow barley during the identical crop season; the social opportunity
cost of the land for the wheat system is thus the net income lost because the land cannot produce
barley. Similarly, the labor and capital used to produce wheat cannot simultaneously provide
services elsewhere in agriculture or in other sectors of the economy. Their social opportunity
costs are measured by the net income given up because alternative activities are deprived of the
labor and capital services applied to wheat production.
The practice of social valuation of domestic factors begins with a distinction between mobile and
fixed factors of production. Mobile factors, usually capital and labor, are factors that can move
from agriculture to other sectors of the economy, such as industry, services, and energy. For
mobile factors, prices are determined by aggregate supply and demand forces. Because
alternative uses for these factors are available throughout the economy, the social values of
capital and labor are determined at a national level, not solely within the agricultural sector.
Actual wage rates for labor and rates of return to capital investment are therefore affected by a
host of policies, some of which may distort factor prices directly. An enforced and binding
minimum-wage law, for example, raises the market wage above what it would have been in the
absence of policy and causes observed wages to be higher than the social opportunity cost of
labor. But indirect effects can also be important. Distortions of output prices cause different
activities to expand or contract, altering in turn the demand and prices of mobile domestic
factors.
Fixed, or immobile, factors of production are the factors whose private or social opportunity
costs are determined within a particular sector of the economy. The value of agricultural land, for
Page 144
144
example, is usually determined only by the land's worth in growing alternative crops. Because
land is immobile, its value is not directly affected by events in the industrial and service sectors
of the economy. But the social opportunity cost of farmland is sometimes difficult to estimate.
Within any agroclimatic zone, complete specialization in the most profitable crop is rarely
observed. Instead, farmers prefer rotations or intercropping systems that reduce risks of income
losses from price variability, yield losses, and pest and disease infestation. Therefore, the social
opportunity cost of the land is not accurately approximated by the net profitability‘s of a single
best alternative crop; instead, it is measured by some weighted average of the social profits
accruing from the set of crops planted. Because the correct weights and social profits associated
with each crop in the set are generally not known, it is convenient in assessing farming activities
to reinterpret crop profits as rents to land and other fixed factors (for example, management and
the ability to bear risk) per hectare of land used. This reinterpretation includes private (and
social) returns to land as parts of D (and H). Profitability per hectare is then interpreted as the
ability of a farming activity to cover its long-run variable costs, in either private or social prices
or as a return to fixed factors such as land, management skill, and water resources.
SELF ASSESSMENT EXERCISE
In evaluating the outlook for profitability, list and discuss four items that you think are
important.
3.2.0 Margin Ratios
Gross Profit Margin
The gross profit margin looks at cost of goods sold as a percentage of sales. This ratio looks at
how well a company controls the cost of its inventory and the manufacturing of its products and
subsequently pass on the costs to its customers. The larger the gross profit margin, the better for
the company. The calculation is: Gross Profit/Net Sales = ____%. Both terms of the equation
come from the company's income statement.
3.2.1 Operating Profit Margin
Operating profit is also known as EBIT and is found on the company's income statement. EBIT
is earnings before interest and taxes. The operating profit margin looks at EBIT as a percentage
of sales. The operating profit margin ratio is a measure of overall operating efficiency,
incorporating all of the expenses of ordinary, daily business activity. The calculation is:
EBIT/Net Sales = _____%. Both terms of the equation come from the company's income
statement.
3.2.2 Net Profit Margin
Page 145
145
When doing a simple profitability ratio analysis, net profit margin is the most often margin ratio
used. The net profit margin shows how much of each sales dollar shows up as net income after
all expenses are paid. For example, if the net profit margin is 5%, that means that 5 cents of
every dollar is profit.
The net profit margin measures profitability after consideration of all expenses including taxes,
interest, and depreciation. The calculation is: Net Income/Net Sales = _____%. Both terms of the
equation come from the income statement.
3.2.3 Cash Flow Margin
The Cash Flow Margin ratio is an important ratio as it expresses the relationship between cash
generated from operations and sales. The company needs cash to pay dividends, suppliers,
service debt, and invest in new capital assets, so cash is just as important as profit to a business
firm.
The Cash Flow Margin ratio measures the ability of a firm to translate sales into cash. The
calculation is: Cash flow from operating cash flows/Net sales = _____%. The numerator of the
equation comes from the firm's Statement of Cash Flows. The denominator comes from the
Income Statement.The larger the percentage, the better.
3.2.4 Returns Ratios
Return on Assets (also called Return on Investment)
The Return on Assets ratio is an important profitability ratio because it measures the efficiency
with which the company is managing its investment in assets and using them to generate profit.
It measures the amount of profit earned relative to the firm's level of investment in total assets.
The return on assets ratio is related to the asset management category of financial ratios.
The calculation for the return on assets ratio is: Net Income/Total Assets = _____%. Net Income
is taken from the income statement and total assets is taken from the balance sheet. The higher
the percentage, the better, because that means the company is doing a good job using its assets to
generate sales.
3.2.5 Return on Equity
The Return on Equity ratio is perhaps the most important of all the financial ratios to investors in
the company. It measures the return on the money the investors have put into the company. This
is the ratio potential investors look at when deciding whether or not to invest in the company.
The calculation is: Net Income/Stockholder's Equity = _____%. Net income comes from the
income statement and stockholder's equity comes from the balance sheet. In general, the higher
Page 146
146
the percentage, the better, with some exceptions, as it shows that the company is doing a good
job using the investors' money.
3.2.6 Cash Return on Assets
The cash return on assets ratio is generally used only in more advanced profitability ratio
analysis. It is used as a comparison to return on assets since it is a cash comparison to this ratio
as return on assets is stated on an accrual basis. Cash is required for future investments. The
calculation is: Cash flow from operating activities/Total Assets = _____%. The numerator is
taken from the Statement of Cash Flows and the denominator from the balance sheet. The higher
the percentage, the better.
3.2.7 Comparative Data
Financial ratio analysis is only a good method of financial analysis if there is comparative data
available. The ratios should be compared to both historical data for the company and industry
data.
3.3 Effects of Divergences
The second identity of the accounting matrix concerns the differences between private and social
valuations of revenues, costs, and profits. For each entry in the matrix-measured vertically-any
divergence between the observed private (actual market) price and the estimated social
(efficiency) price must be explained by the effects of policy or by the existence of market
failures. This critical relationship follows directly from the definition of social prices. Social
prices correct for the effects of distorting policies-policies that lead to an inefficient use of
resources. These policies often are introduced because decision-makers are willing to accept
some inefficiencies (and thus lower total income) in order to further nonefficiency objectives,
such as the redistribution of income or the improvement of domestic food security.
In this circumstance, assessing the tradeoffs between efficiency and nonefficiency objectives
becomes a central part of policy analysis.
But not all policies distort the allocation of resources. Some policies are enacted expressly to
improve efficiency by
Table 2.2: Expanded Policy Analysis Matrix
Revenues Costs Profits
Tradable Inputs Domestic Factors
Private Prices A B C D
Social Prices E F G G
Page 147
147
Diverges and efficient policy I J K L
Effects of market failures M N O P
Effects of distorting policy Q R S T
Effects of efficient policy U V W X
Table Notes:
Private profits, D, equal A minus B minus C. Social profits, H, equal E minus F minus G. 30utput
transfers, 1, equal A minus E; they also equal M plus Q plus U. lnput transfers, J, equal B minus
F; they also equal N plus R plus V. Factor transfers, K, equal C minus G; they also equal O plus
S plus W. Net transfers, L, equal D minus H; they also equal I minus J minus K; and they equal P
plus T plus X.
4.0 CONCLUSION
In this unit, we have discussed profitability plans. We have also discussed the social profitability
and theeffects of divergences. Apart from these, we have provided a check list for profitability
ratio plan.
5.0 SUMMARY
We have discussed profitability plans and social profitability. We saw how profit ratio relate to
each other. The framework for analysis presented discussed social profitability of an
organisation‘s position in the industry.
60 TUTOR-MARKED ASSIGNMENTS
8. Discuss the five basic profit ratio.
9. Use matrix policy to analyse organization cost, revenue and profits.
7.0 REFERENCES/FURTHER READINGS
Hill, T. & R. Westbrook (1997). "SWOT Analysis: It‘s Time for a Product Recall". Long Range
Planning 30 (1): 46–52..
Michael E. Porter. (1980). Competitive Strategy: Techniques for Analyzing Industries and
Competitors. New York: Free Press.
Page 148
148
UNIT 5 COST BENEFIT ANALYSIS
CONTENT
1.0 Introduction
2.0 Objectives
3.0 Main Content
3.1 Principles of CBA
3.2 Challenges of CBA
3.3 Benefits of CBA
3.4 Decision Criteria for Project
4.0 Conclusion
5.0 Summary
6.0 Tutor-Marked Assignment
7.0 References/Further Reading
1.0 INTRODUCTION
COST BENEFIT ANALYSIS
Cost-Benefit Analysis (CBA) estimates and totals up the equivalent money value of the benefits
and costs to the community of projects to establish whether they are worthwhile.
Cost-Benefit Analysis (CBA) estimates and totals up the equivalent money value of the benefits
and costs to the community of projects to establish whether they are worthwhile. These projects
may be dams and highways or can be training programs and health care systems.
The idea of this economic accounting originated with Jules Dupuit, a French engineer whose
1848 article is still worth reading. The British economist, Alfred Marshall, formulated some of
the formal concepts that are at the foundation of CBA. But the practical development of CBA
came as a result of the impetus provided by the Federal Navigation Act of 1936. This act
required that the U.S. Corps of Engineers carry out projects for the improvement of the waterway
system when the total benefits of a project to whomsoever they accrue exceed the costs of that
project. Thus, the Corps of Engineers had created systematic methods for measuring such
benefits and costs. The engineers of the Corps did this without much, if any, assistance from the
economics profession. It wasn't until about twenty years later in the 1950's that economists tried
to provide a rigorous, consistent set of methods for measuring benefits and costs and deciding
Page 149
149
whether a project is worthwhile. Some technical issues of CBA have not been wholly resolved
even now but the fundamental presented in the following are well established.
2.0 OBJECTIVES
At the end of this unit, you should be able to:
oject analysis.
3.0 MAIN CONTENT
3.1 Principles of Cost Benefit Analysis
One of the problems of CBA is that the computation of many components of benefits and costs is
intuitively obvious but that there are others for which intuition fails to suggest methods of
measurement. Therefore some basic principles are needed as a guide.
There Must Be a Common Unit of Measurement
In order to reach a conclusion as to the desirability of a project all aspects of the project, positive
and negative, must be expressed in terms of a common unit; i.e., there must be a "bottom line."
The most convenient common unit is money. This means that all benefits and costs of a project
should be measured in terms of their equivalent money value. A program may provide benefits
which are not directly expressed in terms of dollars but there is some amount of money the
recipients of the benefits would consider just as good as the project's benefits. For example, a
project may provide for the elderly in an area a free monthly visit to a doctor. The value of that
benefit to an elderly recipient is the minimum amount of money that that recipient would take
instead of the medical care. This could be less than the market value of the medical care
provided. It is assumed that more esoteric benefits such as from preserving open space or historic
sites have a finite equivalent money value to the public.
Not only do the benefits and costs of a project have to be expressed in terms of equivalent money
value, but they have to be expressed in terms of dollars of a particular time. This is not just due
to the differences in the value of dollars at different times because of inflation. A dollar available
Page 150
150
five years from now is not as good as a dollar available now. This is because a dollar available
now can be invested and earn interest for five years and would be worth more than a dollar in
five years. If the interest rate is r then a dollar invested for t years will grow to be (1+r)t.
Therefore the amount of money that would have to be deposited now so that it would grow to be
one dollar t years in the future is (1+r)-t. This called the discounted value or present value of a
dollar available t years in the future.
When the dollar value of benefits at some time in the future is multiplied by the discounted value
of one dollar at that time in the future the result is discounted present value of that benefit of the
project. The same thing applies to costs. The net benefit of the projects is just the sum of the
present value of the benefits less the present value of the costs.
CBA Valuations Should Represent Consumers or Producers Valuations As Revealed by Their
Actual Behavior
The valuation of benefits and costs should reflect preferences revealed by choices which have
been made. For example, improvements in transportation frequently involve saving time. The
question is how to measure the money value of that time saved. The value should not be merely
what transportation planners think time should be worth or even what people say their time is
worth. The value of time should be that which the public reveals their time is worth through
choices involving tradeoffs between time and money. If people have a choice of parking close to
their destination for a fee of 50 cents or parking farther away and spending 5 minutes more
walking and they always choose to spend the money and save the time and effort then they have
revealed that their time is more valuable to them than 10 cents per minute. If they were
indifferent between the two choices they would have revealed that the value of their time to them
was exactly 10 cents per minute.
3.2 Challenges of CBA
The most challenging part of CBA is finding past choices which reveal the tradeoffs and
equivalencies in preferences. For example, the valuation of the benefit of cleaner air could be
established by finding how much less people paid for housing in more polluted areas which
otherwise was identical in characteristics and location to housing in less polluted areas.
Page 151
151
Generally the value of cleaner air to people as revealed by the hard market choices seems to be
less than their rhetorical valuation of clean air.
3.3 Benefits of CBA
Benefits Are Usually Measured by Market Choices
When consumers make purchases at market prices they reveal that the things they buy are at least
as beneficial to them as the money they relinquish. Consumers will increase their consumption of
any commodity up to the point where the benefit of an additional unit (marginal benefit) is equal
to the marginal cost to them of that unit, the market price. Therefore for any consumer buying
some of a commodity, the marginal benefit is equal to the market price. The marginal benefit
will decline with the amount consumed just as the market price has to decline to get consumers
to consume a greater quantity of the commodity. The relationship between the market price and
the quantity consumed is called the demand schedule. Thus the demand schedule provides the
information about marginal benefit that is needed to place a money value on an increase in
consumption.
Some Measurements of Benefits Require the Valuation of Human Life
It is sometimes necessary in CBA to evaluate the benefit of saving human lives. There is
considerable antipathy in the general public to the idea of placing a dollar value on human life.
Economists recognize that it is impossible to fund every project which promises to save a human
life and that some rational basis is needed to select which projects are approved and which are
turned down. The controversy is defused when it is recognized that the benefit of such projects is
in reducing the risk of death. There are many cases in which people voluntarily accept increased
risks in return for higher pay, such as in the oil fields or mining, or for time savings in higher
speed in automobile travel. These choices can be used to estimate the personal cost people place
on increased risk and thus the value to them of reduced risk. This computation is equivalent to
placing an economic value on the expected number of lives saved.
Page 152
152
The Analysis of a Project Should Involve a With Versus Without Comparison
The impact of a project is the difference between what the situation in the study area would be
with and without the project. This that when a project is being evaluated the analysis must
estimate not only what the situation would be with the project but also what it would be without
the project. For example, in determining the impact of a fixed guideway rapid transit system such
as the Bay Area Rapid Transit (BART) in the San Francisco Bay Area the number of rides that
would have been taken on an expansion of the bus system should be deducted from the rides
provided by BART and likewise the additional costs of such an expanded bus system would be
deducted from the costs of BART. In other words, the alternative to the project must be explicitly
specified and considered in the evaluation of the project. Note that the with-and-without
comparison is not the same as a before-and-after comparison.
Another example shows the importance of considering the impacts of a project and a with-and-
without comparison. Suppose an irrigation project proposes to increase cotton production in
Arizona. If the United States Department of Agriculture limits the cotton production in the U.S.
by a system of quotas then expanded cotton production in Arizona might be offset by a reduction
in the cotton production quota for Mississippi. Thus the impact of the project on cotton
production in the U.S. might be zero rather than being the amount of cotton produced by the
project.
Cost Benefit Analysis Involves a Particular Study Area
The impacts of a project are defined for a particular study area, be it a city, region, state, nation
or the world. In the above example concerning cotton the impact of the project might be zero for
the nation but still be a positive amount for Arizona.
The nature of the study area is usually specified by the organization sponsoring the analysis.
Many effects of a project may "net out" over one study area but not over a smaller one. The
Page 153
153
specification of the study area may be arbitrary but it may significantly affect the conclusions of
the analysis.
Double Counting of Benefits or Costs Must be Avoided
Sometimes an impact of a project can be measured in two or more ways. For example, when an
improved highway reduces travel time and the risk of injury the value of property in areas served
by the highway will be enhanced. The increase in property values due to the project is a very
good way, at least in principle, to measure the benefits of a project. But if the increased property
values are included then it is unnecessary to include the value of the time and lives saved by the
improvement in the highway. The property value went up because of the benefits of the time
saving and the reduced risks. To include both the increase in property values and the time saving
and risk reduction would involve double counting.
Decision Criteria for Projects
If the discounted present value of the benefits exceeds the discounted present value of the costs
then the project is worthwhile. This is equivalent to the condition that the net benefit must be
positive. Another equivalent condition is that the ratio of the present value of the benefits to the
present value of the costs must be greater than one.
If there are more than one mutually exclusive project that have positive net present value then
there has to be further analysis. From the set of mutually exclusive projects the one that should
be selected is the one with the highest net present value.
If the funds required for carrying out all of the projects with positive net present value are less
than the funds available this means the discount rate used in computing the present values is too
low and does not reflect the true cost of capital. The present values must be recomputed using a
higher discount rate. It may take some trial and error to find a discount rate such that the funds
required for the projects with a positive net present value is no more than the funds available.
Sometimes as an alternative to this procedure people try to select the best projects on the basis of
Page 154
154
some measure of goodness such as the internal rate of return or the benefit/cost ratio. This is not
valid for several reasons.
Introduction of Project Decision Criteria’s
NPV, IRR, PV etc.
SELF-ASSESSMENT EXERCISE
1) What are the challenges of CBA
2) Discuss the principles of CBA
4.0 CONCLUSION
A cost benefit analysis is done to determine how well, or how poorly, a planned action will turn
out. Although a cost benefit analysis can be used for almost anything, it is most commonly done
on financial questions. Since the cost benefit analysis relies on the addition of positive factors
and the subtraction of negative ones to determine a net result, it is also known as running the
numbers.
5.0 SUMMARY
This unit focuses on CBA with core objectives on the usage of CBA in project analysis. Further
explanation based on challenges and benefits of CBA with criteria for project selection. The
impacts of a project are defined for a particular study area was considered .A cost benefit
analysis is done to determine how well, or how poorly, a planned action will turn out. Although a
cost benefit analysis can be used for almost anything, it is most commonly done on financial
questions.
6.0 TUTOR-MARKED ASSIGNMENT
Review the articles that surround CBA.
7.0 REFERENCES/FURTHER READING
"Albert Humphrey The "Father" of TAM". TAM UK.Retrieved 2012-06-03.
See for instance: Mehta, S. (2000) Marketing Strategy
Page 155
155
UNIT 6:EVALUATION TECHNIQUES
CONTENT
1.0 Introduction
2.0 Objectives
3.0 Main Content
3.1 What is Evaluation?
3.2 Evaluation Techniques
4.0 Conclusion
5.0 Summary
6.0 Tutor-Marked Assignment
7.0 References/Further Reading
1.0 INTRODUCTION
Evaluation provides information used in the decision-making process. Evaluation is simpler for
direct financial investment which leads into clearly measured outcome (profit). Techniques and
methods for evaluating projects are used for assessing whether and how fast the fund invested
will return. Various evaluation techniques will be discussed in detail in this unit.
2.0 OBJECTIVES
At the end of this unit, you should be able to:
o Explain evaluation
o Discuss evaluation techniques as well as identify their merits and demerits
o Compute how companies can value any projects they're considering to invest in whether
they are worth undertaking.
Page 156
156
3.0 MAIN CONTENT
3.1 What is Evaluation?
Evaluation is the systematic and objective assessment of an on-going or completed project or
programme, its design, implementation and results. The aim is todetermine the relevance and
fulfillment of objectives, development efficiency,effectiveness, impact and sustainability. Also,
evaluation involves a comprehensive assessment of the given project, policy,programme or
investments, taking into account all its stages: planning, implementation, and monitoring of
results. It provides information used in the decision-making process.Evaluation is one of the core
duties of a fundamental project analyst, as evaluations (along with cash flows) are typically the
most important drivers of project prices over the long term. Evaluation should answer the simple
yet vital question: what is something worth? The analysis is then based on either current data or
projections of the future.
For evaluation, it is important to determine the cash flows of a project. These cash flows can be
segmented as follows: 1. Initial Investment Outlay(these are the costs that are needed to start the
project, such as new equipment, installation, etc.); 2. Operating Cash Flow over a Project's
Life(this is the additional cash flow a new project generates); and 3. Terminal-Year Cash Flow
(this is the final cash flow - inflows and outflows and salvage value).
Purposes of project evaluations - Evaluations contribute to secure theoptimal quality and impact
of development interventions. They also help managers ofprojects and programmes to manage
and improve their implementation. The purposes of evaluations are:
Page 157
157
1. Learning from experience: With the assistance of evaluations, successes andfailures can
be interpreted. Based on those experiences, both current and futureprojects and
programmes can be improved.
2. Transparency: Evaluations illustrate the responsible utilization of the resourcesand justify
the results and their effects vis-à-vis the contractor, the partners, thetarget groups in the
recipient country and the tax payers.
3. Deepening understanding: Evaluation is a tool for deepening knowledge
andunderstanding of the assumptions, options and limits of development cooperation.
4. Improved communication: An evaluation is intended to foster communication
andunderstanding within and between the groups mentioned above, even if this canonly
be managed in different ways and with different participations in each case.
Evaluation is simpler for direct financial investment which leads into clearly measured outcome
(profit) than indirect financial investment which leads to measuring future success (when
financial result may not be clear at first sight or in the short term).
3.2 Evaluation Technique
Evaluation techniques are used to evaluate the potential merits of an investment or to objectively
assess the value of a project or asset.The techniques and methods for evaluating projects are used
for assessing whether and how fast the fund invested will return. There are many techniques and
methods for assessing the financial evaluation and success factor evaluation of investment. For
success factor evaluation, we have the following techniques:
a) Query techniques: this technique requires asking people through interviews (structured
and unstructured) and questionnaires. Interviews require that all interviewees be asked
Page 158
158
the questions, in an order. Questionnaires can be conducted in person, by telephone, or by
mail as a medium to quickly obtaininformation from a wide variety of people.
b) Observational methods: this evaluation method involves listening, watching, and
documenting what is seen and heard. Through asking questions, and by noting comments,
behaviours and reactions, useful information is provided to the evaluation process. The
method gathers accurate information about how a group and project operates in the field.
c) Field or site studies: this could be in the form of photographic and holographic records.
The use of photographic records is useful as amethod to monitor a site over time, and can
be used as an evaluation tool combined with other methods. Holographic records capture
the appearance of a coastal site, and allow comparisons of before and aftermanagement
actions and are useful for on-ground projects.
For financial evaluation, there are a large number of techniques. They can be distinguished into
two groups:
a) Statistical methods or Static evaluation methods
b) Dynamic evaluation methods.
A) Static Evaluation Methods
These evaluation techniques focus especially on monitoring of cash benefits or measuring of the
initial expenditure. They do not include a risk factor in evaluation and take the time factor into
account only in a limited extent. In other words, they do not consider the time value of money.
Evaluation techniques here are:
1. Accounting Rate of Return
2. Payback Period
Page 159
159
3. Annual Percentage Rate
1. Accounting Rate of Return (ARR)
Accounting rate of return (also known as simple rate of returnor average rate of return) is the
ratio of estimated accounting profit of a project to the average investment made in the project.
ARR is used in investment appraisal. It is given as
Average accounting profit is the arithmetic mean of accounting income expected to be earned
during each year of the project's life time. Average investment may be calculated as the sum of
the beginning and ending book value of the project divided by 2. Another variation of ARR
formula uses initial investment instead of average investment.
Advantages:
1. Like payback period, this method of investment appraisal is easy to calculate.
2. It recognizes the profitability factor of investment.
Disadvantages:
1. It ignores time value of money. Suppose, if we use ARR to compare two projects having
equal initial investments. The project which has higher annual income in the latter years
of its useful life may rank higher than the one having higher annual income in the
beginning years, even if the PV of the income generated by the latter project is higher.
2. It can be calculated in different ways. Thus there is problem of consistency.
Page 160
160
3. It uses accounting income rather than cash flow information. Thus it is not suitable for
projects which having high maintenance costs because their viability also depends upon
timely cash inflows.
Decision Rule: Accept the project only if it‘s ARR is equal to or greater than the required ARR.
In case of mutually exclusive projects, accept the one with highest ARR.
Example: An initial investment of N130, 000 is expected to generate annual cash inflow of N32,
000 for 6 years. Depreciation is allowed on the straight line basis. It is estimated that the project
will generate scrap value of N10, 500 at end of the 6th year. Calculate its accounting rate of
return assuming that there are no other expenses on the project.
Solution
Annual Depreciation = (Initial Investment − Scrap Value) ’ Useful Life in Years
Annual Depreciation = (130,000 − 10,500) ’ 6 ≈ 19,917
Average Accounting Income = 32,000 − 19,917 = 12,083
Accounting Rate of Return = 12,083 ÷ 130,000 ≈ 9.3%
2. Payback Period
The payback period, also called the payback rule, is the length of time required to recover the
cost of an investment.The PB reveals how many years are required to for the cash inflows to
equate to the one million dollar outflow. A short PB period is preferred as it indicated that the
project will "pay for itself" within a smaller time frame. Since the payback period does not
reflect the added value of a capital budgeting decision, it is usually considered the least relevant
valuation approach. However, if liquidity is a vital consideration, PB periods are of major
importance. It is given as:
Page 161
161
Advantages and Disadvantages
Advantages: Payback periods are typically used when liquidity presents a major concern. If a
company only has a limited amount of funds, they might be able to only undertake one major
project at a time. Therefore, management will heavily focus on recovering their initial
investment in order to undertake subsequent projects. Another major advantage of using the PB
is that it is easy to calculate once the cash flow forecasts have been established.
Disadvantages: While the payback rule appears very straightforward, there are two significant
disadvantages with this method.
1. It ignores the time value of money.
2. It ignores any benefits that occur after the payback period and therefore does not measure
profitability.
Decision Rule: If the discounted payback period is less that the target period, accept the project.
Otherwise reject. For mutually exclusive projects, the better investment is the one with the
shortest payback period.
Example 1: If a project cost N100,000 and is expected to return N20,000 annually, what is the
payback period?
Solution: Payback period = N100,000 / N20,000
= 5 years
Example 2: Given the following investment Inflows
Page 162
162
Year 0 Year 1 Year 2 Year 3 Year 4 Year 5
-1,000,000 300,000 300,000 300,000 300,000 300,000
Solution: Payback period = N1,000,000 / N30,000
= 3.33 = 3 years and 4 months
B) Dynamic Evaluation Methods
These evaluation techniques take into account the time and risk factors. In other words, they do
not consider the time value of money. The basis is the discounting of input parameters.
Evaluation techniques here are:
1. Net Present Value (NPV)
2. Internal Rate of Return (IRR)
3. Profitability Index (PI)
4. Discounted Payback Period (DPP)
1. Net Present Value
Net present value (NPV) is the present value of an investment's expected cash inflows minus the
costs of acquiring the investment.NPV is used to analyze an investment decision and give
company management a clear way to tell if the investment will add value to the company.
Typically, if an investment has a positive net present value, it will add value to the company and
benefit company shareholders. For example, if a company decides to open a new product line,
they can use NPV to find out if the projected future cash inflows cover the future costs of starting
and running the project. If the project has a positive NPV, it adds value to the company and
therefore should be considered. The formula for NPV is given as:
Page 163
163
Where = cash flow at time n; = cost of capital; = initial project cost
Decision rule: The management should accept all projects with positive NPVs and thereby
maximize the company‘s value. For independent projects, accept project with positive NPV and
reject project with negative NPV. For mutually exclusive projects, select the project with the
highest positive NPV.
Illustration 1: OdifePlc is to undertake a project worth N10m and having the following cash
flow profile with a discount rate of 25%. Compute the Net Present Value.
Year CF (N)
1 5,000,000
2 6,000,000
3 8,000,000
Solution
Year CF(₦) DF at 25% PV (₦)
0 (10,000,000) 1 (10,000,000)
1 5,000,000 0.8000 4,000,000
2 6,000,000 0.6400 3,840,000
3 8,000,000 0.5120 4,096,000
NPV 1,936,000
2. Internal Rate of Return
Internal rate of return (IRR) is the interest rate at which the net present value of all the cash flows
(both positive and negative) from a project or investment equal zero. Internal rate of return is
Page 164
164
used to evaluate the attractiveness of a project or investment.Also, IRR is best-suited for
analyzing venture capital and private equity investments, which typically entail multiple cash
investments over the life of the business, and a single cash outflow at the end via IPO or sale.
Advantages and Disadvantages of IRR
Advantages: IRR considers the time value of money. Also, it allows managers to rank projects
by their overall rates of return rather than their net present values. The ease of comparison makes
IRR attractive, but there are limits to its usefulness. For example, IRR works only for
investments that have an initial cash outflow followed by one or more cash inflows.
Disadvantages: IRR does not measure the absolute size of the investment or the return. This
means that IRR can favor investments with high rates of return even if the naira amount of the
return is very small. Another short-coming is that IRR can‘t be used if the investment generates
interim cash flows. Finally, IRR does not consider cost of capital and can‘t compare projects
with different durations.
Decision Rule: If the IRR of a new project exceeds a company‘s required rate of return, that
project is desirable. If IRR falls below the required rate of return, the project should be rejected.
Where: P0, P1, P2…,Pn equals the cash flows in periods 0, 1, 2, . . . n, respectively
Example 1: Assume Company XYZ must decide whether to purchase a piece of factory
equipment for N300,000. The equipment would only last three years, but it is expected to
generate N150,000 of additional annual profit during those years. Company XYZ also thinks it
can sell the equipment for scrap afterward for about N10,000. Using IRR, Company XYZ can
Page 165
165
determine whether the equipment purchase is a better use of its cash than its other investment
options, which should return about 10%.
Solution: IRR, 0 = -$300,000 + ($150,000)/ (1+.2431) + ($150,000)/ (1+.2431)2 +
($150,000)/ (1+.2431)3 + $10,000/ (1+.2431)
4
IRR = 24.31%
Decision: From a financial standpoint, Company XYZ should purchase the equipment since this
generates a 24.31% return for the company, which is much higher than the 10% return available
from other investments.
A general rule of thumb is that the IRR value cannot be derived analytically. Instead, IRR must
be found by using mathematical trial-and-error to derive the appropriate rate. However, most
business calculators and spreadsheet programs will automatically perform this function. IRR can
also be used to calculate expected returns on stocks or investments, including the yield to
maturity on bonds. IRR calculates the yield on an investment and is thus different than net
present value (NPV) value of an investment. The IRR interpolation formula is given as;
Where: = lower discount rate with +ve NPV; = higher discount rate with –ve NPV;
= amount of positive NPV; = amount of negative NPV
Example 2: Calculate the IRR of a project having the following cash flows
Year NCF(N)
0 (3610)
1 1000
2 2000
Page 166
166
3 3000
Note: In computing IRR using the trial and error method, the student is expected to use any two
rates that will give both positive and negative NPVs.
Solution
Year NCF DCF at 15% PV DCF at 26% PV
0 (3610) 1 (3610) 1 (3610)
1 1000 0.87 870 0.79 790
2 2000 0.76 1520 0.63 1260
3 3000 0.66 1980 0.50 1500
760 (60)
3. Profitability Index
Profitability index is an investment appraisal technique calculated by dividing the present value
of future cash flows of a project by the initial investment required for the project.Profitability
index is actually a modification of the net present value method. While present value is an
absolute measure (i.e. it gives as the total naira figure for a project), the profitability index is a
relative measure (i.e. it gives as the figure as a ratio). Profitability index is sometimes called
Page 167
167
benefit-cost ratio too and is useful in capital rationing since it helps in ranking projects based on
their per naira return. It is given as
Decision Rule: Accept a project if the profitability index is greater than 1, stay indifferent if the
profitability index is 1 and don't accept (reject) a project if the profitability index is below 1.
Example 1: Company C is undertaking a project at a cost of ₦50 million which is expected to
generate future net cash flows with a present value of ₦65 million. Calculate the profitability
index.
Solution
Profitability Index = PV of Future Net Cash Flows / Initial Investment Required
Profitability Index = 65M / 50M = 1.3
Net Present Value = PV of Net Future Cash Flows − Initial Investment Required
Net Present Value = 65M - 50M = 15M.
The information about NPV and initial investment can be used to calculate profitability index as
follows:
Profitability Index = 1 + (Net Present Value / Initial Investment Required)
Profitability Index = 1 + 15M/50M = 1.3
The decision here is for company C to accept the project.
Example 2: Ancoll Investment Company limited has three projects A, B and C to evaluate and
rank using profitability index (PI) criterion. Each project cost of capital is 12% and the after – tax
cash flows for each project are as follows:
Year Project A Project B Project C
0 (N10,000) (N30,000) (N18,000)
1 2,800 6,000 6,500
Page 168
168
2 3,000 10,000 6,500
3 4,000 12,000 6,500
4 4,000 16,000 6,500
Solution
Year Project A Project B Project C
(10,000) (30,000) (18,000)
1 2,800 x 0.893
= 2500.12
6,000 x 0.893
= 5,357.40
6,500 x 0.893
=5,803.85
2 3000 x 0.797
= 2391.60
10,000 x 0.797
= 7972.00
6,500 x 0.797
= 5181.15
3 4,000 x 0.711
= 2847.20
12,000 x 0.711
= 8541.60
6,500 x 0.711
= 4626.70
4 4,000 x 0.636
= 2542.00
16,000 x 0.636
= 10,163.00
6,500 x 6355
= 4130.75
PV = 10,281 PV = 32,040 PV= 19,744
Project A – PI = - Third choice
Project B – PI = - Second choice
Project C – PI = - First choice
4. Discounted Payback Period
One of the major disadvantages of simple payback period is that it ignores the time value of
money. To counter this limitation, an alternative procedure called discounted payback period
may be followed, which accounts for time value of money by discounting the cash inflows of the
project.In discounted payback period we have to calculate the present value of each cash inflow
taking the start of the first period as zero point. For this purpose the management has to set a
suitable discount rate. The discounted cash inflow for each period is to be calculated as:
Discounted Cash Inflow = Actual Cash Inflow/(1 + i)n
Where,i is the discount rate;n is the period to which the cash inflow relates.
Page 169
169
Usually the above formula is split into two components which are actual cash inflow and present
value factor (i.e. 1 / (1 + i)n). Thus discounted cash flow is the product of actual cash flow and
present value factor.
The rest of the procedure is similar to the calculation of simple payback period except that we
have to use the discounted cash flows as calculated above instead of actual cash flows. The
cumulative cash flow will be replaced by cumulative discounted cash flow.
Where,A = Last period with a negative discounted cumulative cash flow; B = Absolute value of
discounted cumulative cash flow at the end of the period A;C = Discounted cash flow during the
period after A.
Note: In the calculation of simple payback period, we could use an alternative formula for
situations where all the cash inflows were even. That formula won't be applicable here since it is
extremely unlikely that discounted cash inflows will be even.
Advantages and Disadvantages
Advantage: Discounted payback period is more reliable than simple payback period since it
accounts for time value of money. It is interesting to note that if a project has negative net
present value it won't pay back the initial investment.
Disadvantage: It ignores the cash inflows from project after the payback period.
Decision Rule: If the discounted payback period is less that the target period, accept the project.
Otherwise reject.
Page 170
170
Example: An initial investment of $2,324,000 is expected to generate $600,000 per year for 6
years. Calculate the discounted payback period of the investment if the discount rate is 11%.
Solution
Step 1: Prepare a table to calculate discounted cash flow of each period by multiplying the actual
cash flows by present value factor. Create a cumulative discounted cash flow column.
Year
n
Cash Flow
CF
₦
Present Value
Factor
PV₦1=1/(1+i)n
Discounted Cash
Flow
CF×PV₦1
Cumulative
Discounted
Cash Flow
0 −2,324,000 1.0000 −2,324,000 −2,324,000
1 600,000 0.9009 540,541 − 1,783,459
2 600,000 0.8116 486,973 − 1,296,486
3 600,000 0.7312 438,715 − 857,771
4 600,000 0.6587 395,239 − 462,533
5 600,000 0.5935 356,071 − 106,462
6 600,000 0.5346 320,785 214,323
Step 2: Discounted Payback Period = 5 + |-106,462| / 320,785
= 5.32 years
4.0 CONCLUSION
When a firm is presented with a capital budgeting/investment decision on a project, one of its
first tasks is to determine whether the project will prove to be profitable. The net present value
(NPV), internal rate of return (IRR), payback period (PB) and discounted payback period (DPB)
methods are the most common approaches to project selection. Although an ideal capital
budgeting solution is such that all three metrics will indicate the same decision, these approaches
Page 171
171
will often produce contradictory results. Depending on managements' preferences and selection
criteria, more emphasis will be put on one approach over another.
5.0 SUMMARY
In this unit, we have discussed evaluation and evaluation techniques. Evaluation techniques have
be talk about under two broad groups – the static evaluation method (Accounting Rate of Return,
Payback Period) and the dynamic evaluation methods (Net Present Value, Internal Rate of
Return, Profitability Index and Discounted Payback Period).
6.0 TUTOR-MARKED ASSIGNMENTS
10. What is evaluation?
11. Identity three techniques in success factor evaluation and briefly discuss them.
12. Explain Internal Rate of Return and Profitability Index with examples.
7.0 REFERENCES/FURTHER READINGS
Curry, S. & Weiss, J. (1993). Project Analysis in Developing Countries.Britain, Palgrave
Macmillan.
Dix, A., Finay, J. Abowd, G. & Beale R. (2004). Evaluation Techniques, Human-Computer
Interation (3rd
Edition), 1-17
Costal Planning and Management Manual (2004).Project Evaluation, 1-6
Page 172
172
UNIT 7: ASSESSMENT OF PRIVATE PROFITABILITY
CONTENT
1.0 Introduction
2.0 Objectives
3.0 Main Content
3.1 Private Profitability Assessment
3.2 Private Profitability Assessment Criteria
3.3 Other measures of private profitability
4.0 Conclusion
5.0 Summary
6.0 Tutor-Marked Assignment
7.0 References/Further Reading
1.0 INTRODUCTION
A number of different assessment methods are used by private firms to evaluate whether a
particular course of action (construction of a new manufacturing facility, purchase of another
business, investment in a sports facility, et cetera) meets the entity‘s goals or more specifically
defined - objectives. In this unit, we considered only financial criteria, such as internal rate of
return, net present value, profitability index, payback period, and other proxy measure of
profitability such as return on capital employed, return on asset, return on sales, etc.2.0
OBJECTIVES
After reading this unit, you should be able to:
- Explain profitability assessment
Page 173
173
- Identify the main and proxy criteria for assessing private project profitability
3.0 MAIN CONTENT
3.1 Profitability Assessment
Aprofitability assessment refers to the measurement of the rate of return made by private firm
oninvestments in a line of business, company or industry over a time period; andcomparing it
against an appropriate benchmark. If the estimated returns arehigher than the benchmark, the
investment can be said to be profitable; if lowerthan the benchmark, the investment is
unprofitable. This in turn guides theinvestment decision of firms.
Economic activities typically have a pattern of an initial investment (cash outflow/cost),followed
by a stream of revenues (cash inflows/benefits) in subsequent periods. Consider the perspective
of the private firm. For example, if an electric system operator is considering the construction of
an additional thermal power plant,
the costs of the project equal: the up-front construction costs related to land, labor and
materials; annual operating (fuel and other), maintenance and replacement costs;
estimates of the costs of unscheduled breakdowns and risks imposed by changes in fuel
prices (and other input costs) over time; costs of meeting environmental regulations; and
any costs related to the eventual mothballing of the facility. All costs are discounted
depending on when they are incurred.
Benefits are provided by the discounted stream of expected revenues from sales of
electricity to households and industry, plus any ‗salvage‘ value at the end of the facility‘s
useful life.
Page 174
174
As long as financial benefits over the lifetime of the project exceed costs, the private
investor determines the investment to be feasible. That is, the rate at which the system
operator weights the streams of costs and revenues is the rate of return that he or she
hopes to earn on the investment. Thus, if the weighted stream of benefits exceeds that of
costs, the project earns a higher rate of return on the investment than could be earned
elsewhere.
Private profitability assessment excludes spillovers unless the authority specifically requires the
firm to pay for access to natural resources, to pay compensation to those ‗harmed‘ by the firm‘s
activities, to pay an environmental tax, to purchase ‗pollution rights‘, or requires the firm to post
a bond to offset society‘s potential future need to mitigate environmental damage caused by the
firm‘s activities. These costs would be included by the firm in its financial analysis of a project.
Furthermore, a private profitability assessment uses market prices for natural resources, labor,
land and other inputs instead of the opportunity costs of those resources.
Regardless of these limitations, it is important that projects are valued from the perspective of
private firms. For example, if the government wants to implement a given project and the
financial performance of the project is attractive from a private perspective, it might be wise just
to let the private sector pursue it.
3.2 Private Profitability Assessment Criteria
Private projects are usually assessed on the basis of financial criteria such as net present value
(NPV), the benefit-cost ratio (BCR), internal rate of return (IRR), and/or modified internal rate
of return (MIRR).
A. Net Present Value (NPV)
Page 175
175
The NPV is the sum of the discounted benefits minus the sum of the discounted
costs of the project over the project lifetime. For ranking projects on the basis of
NPV, the following assumptions are needed:
the discount rate is given and usually taken as the market interest rate;
capital is always readily available;
the interest rate for borrowing is the same as the interest rate for lending;
cash flow projections include all relevant costs and benefits, and taxes; and
projects are mutually exclusive (so that they can be evaluated separately). Any
combination of projects should be considered as a separate option.
If these assumptions are valid, NPV can be expressed as:
where represents the benefits derived from the project in period t, Ct the costs in period , T is
the lifespan of the project and is the interest rate in period (although the interest or discount
rate is generally assumed to remain constant in each period).
If we are evaluating a single project and NPV is greater than zero, the project is worth
undertaking. If we are evaluating several projects, the one with the highest NPV should generally
be chosen, although that will depend on factors unique to each project. For example, some
projects may be riskier than others, or projects have different life spans (in which case one might
wish annualize the net discounted benefits of each project in order to make the comparison).
B. Benefit-cost ratio (BCR)
This is the ratio of the discounted total benefits from a project divided by the discounted total
costs of the project. It is given as:
Page 176
176
If the BCR for a single project is larger than 1, then the project increases real wealth. When
comparing different projects, however, the problem of scaling appears. For example, a project
with total benefits of ₦1 million may generate a greater increase in real wealth than a project
with total benefits of ₦100, but the ratio of benefits to costs may not be as high. Thus, projects
musthave an equal outlay basis if they are to be compared.
C. Payback Period
For the vast majority of private projects, costs are incurred before any benefits are realized,
which is why the term ‗cost-benefit analysis‘ is preferred here to ‗benefit-cost analysis‘. During
the construction phase of a project, a firm incurs costs only – costs are ‗front-loaded‘. Benefits
do not usually accrue until construction is complete. The payback period, therefore, is the point
in time when a project‘s total benefits exceed its total costs. At that time, the project has ‗paid
back‘ its initial investment. Both costs and benefits should be discounted when estimating the
payback period. The major problem with the payback method is that it ignores cash flows – costs
and benefits – that occur beyond the payback period. If this is the only financial criterion taken
into account, it is possible then to accept a project that has a negative NPV. Nevertheless, the
payback period is a useful indicator for firms that are unsure about future cash-flows and their
position in the market. Obviously, firms tend to prefer projects with a shorter payback period.
D. Internal Rate of Return (IRR) and Modified Internal Rate of Return (MIRR)
Page 177
177
The IRR is a popular criterion for private project appraisal. The IRR is the discount rate for
which the NPV is zero – where the project‘s discounted benefits exactly balance discounted
costs. It is found by setting NPV=0 and solving for r (assuming r does not change over time).
The project with the largest IRR is generally preferred, subject to the proviso that the IRR
exceeds the interest rate. Despite its popularity, the IRR criterion needs to be used with caution.
First, for complex cash flows, there might be more than one IRR for a single project. And
second, the IRR approach assumes that the project can both borrow and lend at the internal rate
of return. In other words, excess funds generated by the project can be invested externally at the
IRR. This is certainly not the case.
The modified IRR (MIRR) is the average annual rate of return that will be earned on an
investment if the cash flows are reinvested at the firm‘s cost of capital. Therefore, MIRR more
accurately reflects the profitability of an investment than does IRR. To determine the MIRR, it is
necessary to solve the following equation:
Where, is the capital investment (effectively calculated at time zero) and is the
future (as opposed to present) value of the cash flow estimated using the interest rate that reflects
the firm‘s cost of capital.
Page 178
178
This literaturesuggests that the internal rate of return (IRR) and the net present value (NPV)are
the conceptually correct measures of profitability of an activity (aninvestment, a line of business,
or a company). They take into account the inflows and outflows of an activity overtime, and
reflect the economic principle of time preference of money. They arealso the two most
frequently used profitability measures in the business world.
3.3 Other measures of private profitability
The following describes two broad categoriesof profitability measures, some of which can be
used as proxy measures for theIRR and NPV in certain circumstances:
accounting ratios (ROCE, ROE, return on sales, or ROS, and gross margins) are
essentially snapshots of a company‘s performance at particular points in time, and can be
obtained from accounting reports, and
market valuations (the Tobin‘s q, the market-to-book ratio and total returns to
shareholders are based on investors‘ expectations of future returns.
These proxy measures can have some advantages over the IRR or the NPV for the assessment of
private profitability. First, theyare often easier and more convenient to obtain than the IRR.
Second, there arecertain circumstances under which it would be difficult to estimate the IRR due
to imperfect information.
A) Return on Capital Employed
The return on capital employed (ROCE) is a commonly used accounting measureof private
profitability, and is calculated as follows:
Page 179
179
Where,Atis total capital employed in period t.
Although ROCE is a widely used indicator of profitability, the ROCE for any yearcan give
results that are significantly different from the IRR. This is primarilybecause ROCE is highly
sensitive to the specific underlying accounting principles,while the IRR is much less so. In
particular, the IRR is calculated from actual cashinflows and outflows each year. ROCE diverges
from cash inflows and outflowsbecause of the spread of investment costs over a large number of
periods(through depreciation) and because of the accounting principles of recognitionand
accruals.In principle, ROCE can be calculated based on pre- or post-tax earnings. Using pre-tax
earningsprovides a measure of total returns to capital employed, including those that are
apportioned toequity-holders, debt-holders and government. Using post-tax earnings would
provide a measure ofreturns to equity- and debt-holders only.
Nevertheless, the average ROCE over the period in question may be used as a proxy forthe IRR
if each of the following conditions is met:
the correct asset valuation is used (i.e. based on the value-to-the-owner principle)
the accounts are fully articulated such that all changes in the book value of assets flow
through the profit and loss account.
B) Return on Equity
ROCE can be decomposed into various components which themselves aresometimes used as
measures of the profitability of an activity. In particular, EBITcan be decomposed into net
earnings after taxes (Π), interest payments (I), andtax (T), while capital employed (A) can be
decomposed into equity- and debtfundedcapital (E and D, respectively). ROCE can therefore
bere-expressed as follows:where ROE is the return on equity (i.e. Π divided by E), another
measure ofprofitability.
Page 180
180
C) Return on Sales
ROCE can also be re-expressed as follows:
whereQis sales (turnover) and A is total capital employed. ROS (the ratio ofearnings to sales) is
another measure of profitability, which essentially measureshow profitable an activity‘s sales are
from an operating perspective. The ROS measure eliminates the need toestimate the total capital
employed. Hence, while its conceptual foundations maybe weaker than those of the IRR or the
NPV, given that there is no direct linkbetween the ROS and a benchmark, the ROS has the
advantage that it is ofteneasier and more convenient to obtain than the IRR, particularly in cases
where it isdifficult to estimate the assets employed.
D) Gross Margins
Another proxy measure which is closely related to the ROS is gross margins,which can be
obtained from the decomposition of ROS as follows:
Where,Q is sales; the cost of goods sold usually includes direct costs such as rawmaterials or the
wholesale costs of the goods; and other costs include overheadssuch as selling, and general and
administrative expenses. Different companiesmay include different items in the category of ‗cost
of goods sold‘ in theiraccounts. Hence, before making comparisons of gross margins across
companies, check to ensure that theclassification is consistent.
Page 181
181
E) The Tobin’s Q and The Market-To-Book Ratio
The Tobin‘s q is a market-based indicator of profitability. Market-based indicatorsessentially use
valuations provided by the stock market. They are based on theassumption that stock markets
operate in accordance with rational-pricing modelswhich suggest that the higher the expected
stream of future returns, the higherthe market valuation of the business. In this way, the indicator
providesinformation about the underlying returns that a company is expected to make —i.e. it
provides a proxy for future private profitability. The Tobin‘s q is the market value ofa company‘s
debt and equity, divided by the replacement value of the assets
A closely related measure is the market-to-book ratio. This is the ratio of themarket value of a
company to the book value of its common stock (i.e. equity):
Therefore, firms have an incentive to invest when the Tobin‘s q is greater than 1(i.e. when the
value generated by the capital equipment is higher than the cost ofreplacing it) and will stop
investment only when the ratio is less than 1 (i.e. whenthe value generated by the equipment is
lower than its MEA value). When theratio is less than 1, it may be cheaper to acquire assets
through a takeover than to buy new ones.
4.0 CONCLUSION
We conclude that the internal rate of return (IRR) and the net present value (NPV)are the
conceptually correct and frequently used measures of profitability of an activity (aninvestment, a
line of business, or a company). They take into account the inflows and outflows of an activity
Page 182
182
overtime, and reflect the economic principle of time preference of money. There are other
profitability measures, some of which can be used as proxy measures for theIRR and NPV in
certain circumstances, such as accounting ratios (ROCE, ROE, return on sales, or ROS, and
gross margins) andmarket valuations (the Tobin‘s q, the market-to-book ratio) based on
investors‘ expectations of future returns.
5.0 SUMMARY
In this unit, we discuss thatprivate projects are usually basically assessed on the basis of financial
criteria such as net present value (NPV), the benefit-cost ratio (BCR), internal rate of return
(IRR), and/or modified internal rate of return (MIRR). Others proxy measures are return on
capital employed, return on equity, return on sales, the Tobin‘s q among others.
6.0 TUTOR-MARKED ASSIGNMENTS
13. What is private profitability assessment?
14. Explain two main measures of assessing private profitability.
15. Discuss two proxy measures of assessing private profitability.
7.0 REFERENCES/FURTHER READINGS
Odufala, O. (2000).The Principle and Techniques of Project Analysis and Evaluation. Lagos,
Nigeria: Y2K Academy Ltd.
Office of Fair Trading (2003). Assessing Profitability in Competitive Policy Analysis.Economic
Discussion Paper 6, July, 34-68.