41
National Performance Measures for Congestion, Reliability, and Freight, and CMAQ Traffic Congestion General Guidance and Step-by-Step Metric Calculation Procedures June 2018
| Date post: | 25-Aug-2018 |
| Category: |
Documents |
| Upload: | nguyendiep |
| View: | 215 times |
| Download: | 0 times |

National Performance Measures for Congestion, Reliability, and Freight, and CMAQ Traffic Congestion
General Guidance and Step-by-Step Metric Calculation Procedures
June 2018


MAP-21 Measures for Congestion, Reliability, and Freight Step-by-Step Metric Calculation Procedures
i
Notice
This document is disseminated under the sponsorship of the U.S. Department of Transportation (USDOT) in the interest of information exchange. The U.S. Government assumes no liability for the use of the information contained in this document.
The U.S. Government does not endorse products or manufacturers. Trademarks or manufacturers’ names appear in this report only because they are considered essential to the objective of the document.
Quality Assurance Statement
The Federal Highway Administration (FHWA) provides high-quality information to serve Government, industry, and the public in a manner that promotes public understanding. Standards and policies are used to ensure and maximize the quality, objectivity, utility, and integrity of its information. FHWA periodically reviews quality issues and adjusts its programs and processes to ensure continuous quality improvement.
MAP-21 Measures for Congestion, Reliability, and Freight Step-by-Step Metric Calculation Procedures
ii
1. Report No. FHWA-HIF-18-040
2. Government Accession No. N/A
3. Recipient’s Catalog No. N/A
4. Title and Subtitle National Performance Measures for Congestion, Reliability, and Freight, and CMAQ Traffic Congestion: General Guidance and Step-by-Step Metric Calculation Procedures
5. Report Date June 2018 6. Performing Organization Code: N/A
7. Author(s) and Contributor(s) Richard A. Margiotta (Cambridge Systematics, Inc.); Shawn Turner (Texas A&M Transportation Institute); Rich Taylor (FHWA); and Christopher Chang (FHWA)
8. Performing Organization Report No. TBD
9. Performing Organization Name and Address Cambridge Systematics, Inc. 200 Prosperity Road Knoxville, TN 37923
10. Work Unit No. N/A 11. Contract or Grant No. N/A
12. Sponsoring Agency Name and Address Federal Highway Administration Office of Operations and Office of Infrastructure 1200 New Jersey Avenue, SE, Washington DC 20590
13. Type of Report and Period See Abstract 14. Sponsoring Agency Code N/A
15. Supplementary Notes 16. Abstract National Performance Measures for Congestion, Reliability, and Freight, and CMAQ Traffic Congestion: General Guidance and Step-by-Step Metric Calculation Procedures presents recommended steps for calculating the National Highway System performance metrics (23 CFR 490.511), the Truck Travel Time Reliability metrics (23 CFR 490.611), and the Peak Hour Excessive Delay metric (23 CFR 490.711).
17. Key Words Performance Metric, Data, Travel Time Reliability, Freight Reliability.
18. Distribution Statement No restrictions. This document is available to the public through the FHWA Website: https://www.fhwa.dot.gov/tpm/guidance/
19. Security Classification. (of this report) Unclassified
20. Security Classification. (of this page) Unclassified
21. No. of Pages 41
22. Price $0

MAP-21 Measures for Congestion, Reliability, and Freight Step-by-Step Metric Calculation Procedures
iii
Table of Contents Table of Contents .......................................................................................................... iii
1.0 General PM3 Performance Measure Development Guidance ................... 1-1 Q. How can hourly traffic volumes be estimated for the Peak Hour
Excessive Delay measure? ......................................................................... 1-1 Step 1: Directional Split .............................................................................. 1-2 Step 2: Monthly Adjustment ..................................................................... 1-3 Step 3: Day-of-Week Adjustment ............................................................. 1-3 Step 4: Hourly Estimation.......................................................................... 1-4
Q. If desired, how are road closures excluded from metric calculation? ................................................................................................ 1-10
2.0 Step-by-Step Calculation Procedures for PM3 Metrics ............................... 2-1 Definitions ............................................................................................................. 2-1 Data Preparation .................................................................................................. 2-2
Dataset Composition .................................................................................. 2-2 Overview of Data Processing .................................................................... 2-3 Importing/Reading the Data .................................................................... 2-5 Data Preparation: Joined Travel Time and Locational Dataset ............ 2-6
National Highway Performance Program Reliability Metrics ...................... 2-8 Calculation Steps ........................................................................................ 2-8 Relation of the LOTTR Metrics to the NHPP Reliability Measure .... 2-14 Annual Reporting Requirements ........................................................... 2-15
Freight Reliability Metrics ................................................................................ 2-15 Calculation Steps ...................................................................................... 2-15 Relation of the TTTR Metrics to the Freight Reliability Measure ...... 2-17 Annual Reporting Requirements ........................................................... 2-17
Annual Hours of Peak Hour Excessive Delay (PHED) Metric .................... 2-18 Calculation Steps ...................................................................................... 2-18 Relation to the Annual Hours of Peak Hour Excessive Delay per Capita Measure ......................................................................................... 2-20 Annual Reporting Requirements ........................................................... 2-23


MAP-21 Measures for Congestion, Reliability, and Freight Step-by-Step Metric Calculation Procedures
1-1
1.0 General PM3 Performance Measure Development Guidance
Q. HOW CAN HOURLY TRAFFIC VOLUMES BE ESTIMATED FOR THE PEAK HOUR EXCESSIVE DELAY MEASURE?
A. The data requirements for Annual Hours of Peak Hour Excessive Delay (PHED) per Capita (23 CFR 490.709(c)) include hourly traffic volumes for each weekday of the calendar year. The regulations offer two possible approaches:1 1) use hourly traffic counts from continuous count stations and apply to multiple reporting segments; or 2) use a method to estimate hourly traffic volumes for each weekday using Annual Average daily traffic (AADT) values reported in the Highway Performance Monitoring System (HPMS).
The following guidance is applicable to the second approach. This guidance provides an example of one possible method to estimate hourly traffic volumes using AADT values from HPMS that have been included in the National Performance Management Research Data Set (NPMRDS) segment attributes file (TMC_Identification.csv). Other hourly traffic volume estimation methods may be used. Regardless of the method used, 23 CFR 490.709(c)(3)) requires State DOTs to report to FHWA the method used to develop hourly traffic volumes estimates.
For this example, the following data items will be needed to estimate hourly traffic volumes on each reporting segment:
• AADT value (included in the NPMRDS segment attributes file).
• Facility type (included in the NPMRDS segment attributes file).
• Functional class (included in the NPMRDS segment attributes file).
• Monthly and day-of-week traffic count adjustment factors (default values provided here, also can be calculated from State-specific continuous traffic count stations).
• Annual average time-of-day weekday speed values (calculated from NPMRDS speed data).
1 23 CFR 490.709(c)(1).

MAP-21 Measures for Congestion, Reliability, and Freight Step-by-Step Metric Calculation Procedures
1-2
Under this example, the overall process for estimating hourly traffic volumes is as follows:
• Directional split. Apply a directional split adjustment factor to those AADT values that represent both travel directions to estimate directional AADT values.
• Monthly adjustment. Apply monthly adjustment factors to each directional AADT value to estimate directional month-by-month average daily traffic volumes.
• Day-of-week adjustment. Apply day-of-week adjustment factors to directional monthly average daily traffic volumes to estimate directional average daily traffic values for each month and each day of the week.
• Hourly estimation. Apply hourly adjustment factors to estimate directional hourly traffic volume for each day in each month.
These four steps are described in more detail in the following sections.
STEP 1: DIRECTIONAL SPLIT In Step 1, a directional split adjustment factor is applied to each AADT value that represents two separate directions of travel. The AADT values included in the NPMRDS segment attributes file are obtained from HPMS, which currently reports many attributes for a roadway centerline, and not a specific direction of travel.
The faciltype attribute in the NPMRDS segment attributes file is from HPMS and indicates whether the reported AADT value is for a one-way or two-way roadway.2 Specifically, if faciltype=1, then the reporting segment is a one-way roadway and the reported AADT value represents all traffic in that one direction. If faciltype=2 or 6, then the reporting segment is part of a two-way roadway and the reported AADT value in the NPMRDS segment attributes file represents both directions of travel. Therefore, when faciltype=2 or 6, a directional split adjustment factor must be applied to estimate the portion of AADT that occurs on the direction of the reporting segment. If a specific directional split adjustment factor is not available from other traffic counts, an even directional split (e.g., 50 percent/50 percent) should be assumed. That is, the two-way
2 23 CFR 490.101 defines “mainline highways” as the through travel lanes of any
highway. Mainline highways specifically exclude ramps, shoulders, turn lanes, crossovers, rest areas, and other pavement surfaces that are not part of the roadway normally traveled by through traffic. Mainline highways in HPMS is identified by Facility Type data value equal to 1, 2, or 6. Please see Chapter 4 in the HPMS Field Manual (December 2016). https://www.fhwa.dot.gov/policyinformation/hpms/fieldmanual/

MAP-21 Measures for Congestion, Reliability, and Freight Step-by-Step Metric Calculation Procedures
1-3
AADT value should be multiplied by 50 percent to estimate the directional AADT value for that reporting segment.
STEP 2: MONTHLY ADJUSTMENT In Step 2, monthly adjustment factors should be applied to each directional AADT value to estimate 12 monthly average daily traffic volume values. The preferred approach is to use continuous count stations within your specific State to calculate monthly adjustment factors for urban and rural functional classes.
However, if calculating monthly adjustment factors from continuous count data is not feasible, Table 1.1 provides national default values for monthly adjustment factors.
Table 1.1 National default values for monthly adjustment factors. Month of Year Adjustment Factor
January 94%
February 88%
March 101%
April 101%
May 105%
June 104%
July 105%
August 108%
September 99%
October 104%
November 95%
December 97%
(Source: Derived from Urban road locations in the Federal Highway Administration (FHWA) Traffic Volume Trends.3)
STEP 3: DAY-OF-WEEK ADJUSTMENT In Step 3, day-of-week adjustment factors should be applied to each directional monthly average daily traffic volume to estimate monthly average day-of-week daily traffic volume values. The preferred approach is to use continuous count stations within your specific State to calculate day-of-week adjustment factors for urban and rural functional classes for each month. 3 Traffic Volume Trends (FHWA)—2011-2014 Data:
https://www.fhwa.dot.gov/policyinformation/travel_monitoring/tvt.cfm.
MAP-21 Measures for Congestion, Reliability, and Freight Step-by-Step Metric Calculation Procedures
1-4
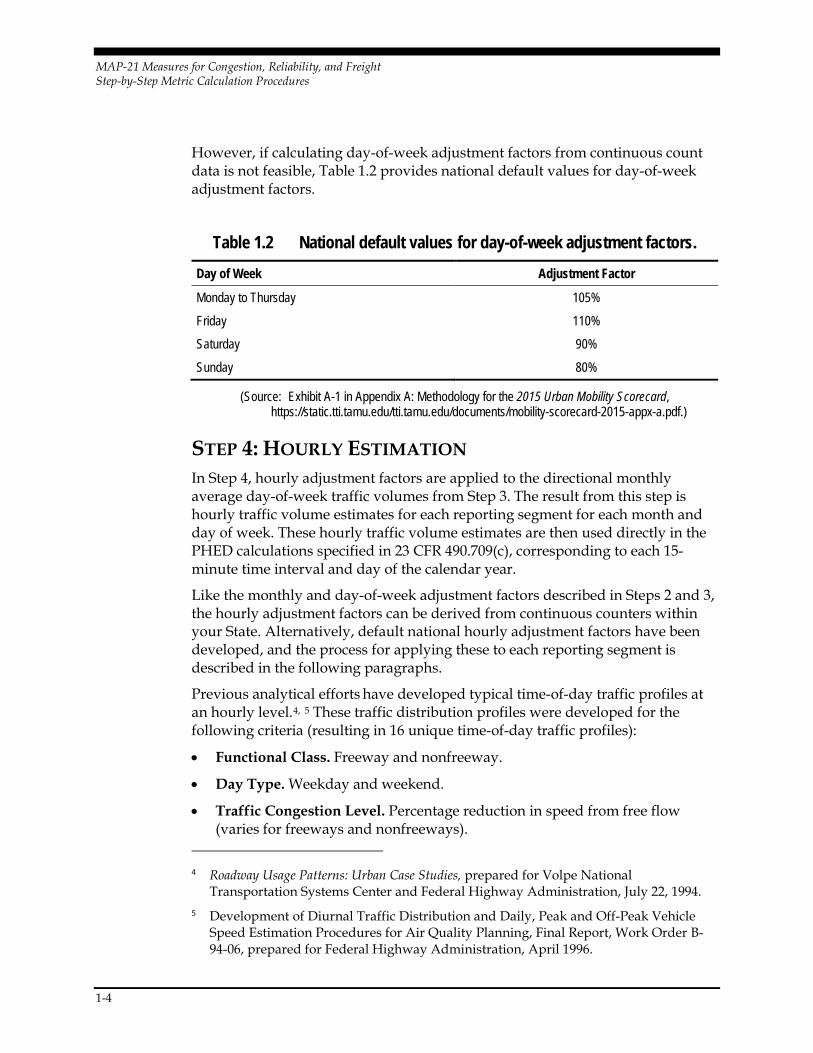
However, if calculating day-of-week adjustment factors from continuous count data is not feasible, Table 1.2 provides national default values for day-of-week adjustment factors.
Table 1.2 National default values for day-of-week adjustment factors. Day of Week Adjustment Factor
Monday to Thursday 105%
Friday 110%
Saturday 90%
Sunday 80%
(Source: Exhibit A-1 in Appendix A: Methodology for the 2015 Urban Mobility Scorecard, https://static.tti.tamu.edu/tti.tamu.edu/documents/mobility-scorecard-2015-appx-a.pdf.)
STEP 4: HOURLY ESTIMATION In Step 4, hourly adjustment factors are applied to the directional monthly average day-of-week traffic volumes from Step 3. The result from this step is hourly traffic volume estimates for each reporting segment for each month and day of week. These hourly traffic volume estimates are then used directly in the PHED calculations specified in 23 CFR 490.709(c), corresponding to each 15-minute time interval and day of the calendar year.
Like the monthly and day-of-week adjustment factors described in Steps 2 and 3, the hourly adjustment factors can be derived from continuous counters within your State. Alternatively, default national hourly adjustment factors have been developed, and the process for applying these to each reporting segment is described in the following paragraphs.
Previous analytical efforts have developed typical time-of-day traffic profiles at an hourly level.4, 5 These traffic distribution profiles were developed for the following criteria (resulting in 16 unique time-of-day traffic profiles):
• Functional Class. Freeway and nonfreeway.
• Day Type. Weekday and weekend.
• Traffic Congestion Level. Percentage reduction in speed from free flow (varies for freeways and nonfreeways).
4 Roadway Usage Patterns: Urban Case Studies, prepared for Volpe National
Transportation Systems Center and Federal Highway Administration, July 22, 1994. 5 Development of Diurnal Traffic Distribution and Daily, Peak and Off-Peak Vehicle
Speed Estimation Procedures for Air Quality Planning, Final Report, Work Order B-94-06, prepared for Federal Highway Administration, April 1996.

MAP-21 Measures for Congestion, Reliability, and Freight Step-by-Step Metric Calculation Procedures
1-5
• Directionality. Peak traffic in the morning (AM), peak traffic in the evening (PM), approximately equal traffic in each peak.
The 16 traffic distribution profiles shown in Figure 1.1 through Figure 1.5 are comprehensive, as they were developed from 713 continuous traffic monitoring locations in urban areas of 37 States.
Figure 1.1 Chart. Weekday traffic distribution profile for no to low congestion.
(Source: Margiotta, Richard, Eisele, Bill, and Short, Jeffrey, Freight Performance Measure Approaches for Bottlenecks, Arterials, and Linking Volumes to Congestion Report, FHWA-HOP-15-033, August, 2015,
https://ops.fhwa.dot.gov/publications/fhwahop15033/index.htm.)
0%
2%
4%
6%
8%
10%
12%
12 AM 2 AM 4 AM 6 AM 8 AM 10 AM 12 PM 2 PM 4 PM 6 PM 8 PM 10 PM
Percent of Daily Volume
Hour of DayAM Peak, Freeway WeekdayPM Peak, Freeway WeekdayAM Peak, Non-Freeway WeekdayPM Peak, Non-Freeway Weekday

MAP-21 Measures for Congestion, Reliability, and Freight Step-by-Step Metric Calculation Procedures
1-6
Figure 1.2 Chart. Weekday traffic distribution profile for moderate congestion.
(Source: Margiotta, Richard, Eisele, Bill, and Short, Jeffrey, Freight Performance Measure Approaches for Bottlenecks, Arterials, and Linking Volumes to Congestion Report, FHWA-HOP-15-033, August, 2015,
https://ops.fhwa.dot.gov/publications/fhwahop15033/index.htm.)
Figure 1.3 Chart. Weekday traffic distribution profile for severe congestion. (Source: Margiotta, Richard, Eisele, Bill, and Short, Jeffrey, Freight Performance Measure Approaches for
Bottlenecks, Arterials, and Linking Volumes to Congestion Report, FHWA-HOP-15-033, August, 2015, https://ops.fhwa.dot.gov/publications/fhwahop15033/index.htm.)
0%
2%
4%
6%
8%
10%
12%
12 AM 2 AM 4 AM 6 AM 8 AM 10 AM 12 PM 2 PM 4 PM 6 PM 8 PM 10 PM
Percent of Daily Volume
Hour of DayAM Peak, Freeway WeekdayPM Peak, Freeway WeekdayAM Peak, Non-Freeway WeekdayPM Peak, Non-Freeway Weekday
0%
2%
4%
6%
8%
10%
12%
12 AM 2 AM 4 AM 6 AM 8 AM 10 AM 12 PM 2 PM 4 PM 6 PM 8 PM 10 PM
Percent ofDaily Volume
Hour of DayAM Peak, Freeway WeekdayPM Peak, Freeway WeekdayAM Peak, Non-Freeway WeekdayPM Peak, Non-Freeway Weekday

MAP-21 Measures for Congestion, Reliability, and Freight Step-by-Step Metric Calculation Procedures
1-7
Figure 1.4 Chart. Weekday traffic distribution profile for severe congestion and similar speeds in each peak period.
(Source: Margiotta, Richard, Eisele, Bill, and Short, Jeffrey, Freight Performance Measure Approaches for Bottlenecks, Arterials, and Linking Volumes to Congestion Report, FHWA-HOP-15-033, August, 2015,
https://ops.fhwa.dot.gov/publications/fhwahop15033/index.htm.)
Figure 1.5 Chart. Weekend traffic distribution. (Source: Margiotta, Richard, Eisele, Bill, and Short, Jeffrey, Freight Performance Measure Approaches for
Bottlenecks, Arterials, and Linking Volumes to Congestion Report, FHWA-HOP-15-033, August, 2015, https://ops.fhwa.dot.gov/publications/fhwahop15033/index.htm.)
0%
2%
4%
6%
8%
10%
12%
12 AM 2 AM 4 AM 6 AM 8 AM 10 AM 12 PM 2 PM 4 PM 6 PM 8 PM 10 PM
Percent of Daily Volume
Hour of DayFreeway Non-Freeway
0%
2%
4%
6%
8%
10%
12%
12 AM 2 AM 4 AM 6 AM 8 AM 10 AM 12 PM 2 PM 4 PM 6 PM 8 PM 10 PM
Percent ofDaily Volume
Hour of DayFreeway Weekend Non-Freeway Weekend

MAP-21 Measures for Congestion, Reliability, and Freight Step-by-Step Metric Calculation Procedures
1-8
To determine which of the 16 traffic distribution profiles should be assigned to each reporting segment, the following guidance is provided:
• Functional Class. Assign based on f_system in NPMRDS segment attributes file):
– Freeway. f_system=1 or 2.
– Nonfreeway. f_system=3, 4, 5, 6, or 7.
• Day Type. Assign volume based on each day of week:
– Weekday (Monday through Friday): Use Figure 1.1 to Figure 1.4.
– Weekend (Saturday and Sunday): Use Figure 1.5.
• Traffic Congestion Level. Assign based on the peak-period speed reduction percentage calculated from NPMRDS in the calendar year on each reporting segment. Note that congestion level is used only to determine weekday traffic profile assignments, and is not used for weekend traffic profile assignment.
– Calculate a simple average peak-period speed (add up all the morning and evening peak-period speeds, and divide the total by the eight periods in the eight peak hours) for each reporting segment using speed data from 6:00 a.m. to 10:00 a.m. (morning peak period) and 3:00 p.m. to 7:00 p.m. (evening peak period). Alternatively, one could use speeds from 4:00 p.m. to 8:00 p.m. if those hours are used to represent the evening peak period in calculating the PHED metric.
– Calculate a free-flow speed during light traffic hours (e.g., simple average speed for all hours between 10:00 p.m. to 5:00 a.m. on all days).
– Calculate the peak-period speed reduction percentage for each reporting segment by dividing the average combined peak-period speed by the free-flow speed.
𝑆𝑆𝑆𝑆𝑆𝑆𝑆𝑆𝑆𝑆𝑅𝑅𝑆𝑆𝑆𝑆𝑅𝑅𝑅𝑅𝑅𝑅𝑅𝑅𝑅𝑅𝑅𝑅 𝐹𝐹𝐹𝐹𝑅𝑅𝑅𝑅𝑅𝑅𝐹𝐹
=
𝐴𝐴𝐴𝐴𝑆𝑆𝐹𝐹𝐹𝐹𝐴𝐴𝑆𝑆 𝑃𝑃𝑆𝑆𝐹𝐹𝑃𝑃𝑃𝑃𝑆𝑆𝐹𝐹𝑅𝑅𝑅𝑅𝑆𝑆 𝑆𝑆𝑆𝑆𝑆𝑆𝑆𝑆𝑆𝑆
𝐹𝐹𝐹𝐹𝑆𝑆𝑆𝑆 − 𝐹𝐹𝐹𝐹𝑅𝑅𝐹𝐹 𝑆𝑆𝑆𝑆𝑆𝑆𝑆𝑆𝑆𝑆(10 𝑆𝑆𝑝𝑝 𝑅𝑅𝑅𝑅 5 𝐹𝐹𝑝𝑝)
Figure 1.6 Equation. (Source: Margiotta, Richard, Eisele, Bill, and Short, Jeffrey, Freight Performance Measure Approaches for
Bottlenecks, Arterials, and Linking Volumes to Congestion Report, FHWA-HOP-15-033, August, 2015, https://ops.fhwa.dot.gov/publications/fhwahop15033/index.htm.)
For Freeways:
– No to Low Congestion. Speed reduction factor ranging from 90 percent to 100 percent.
MAP-21 Measures for Congestion, Reliability, and Freight Step-by-Step Metric Calculation Procedures
1-9
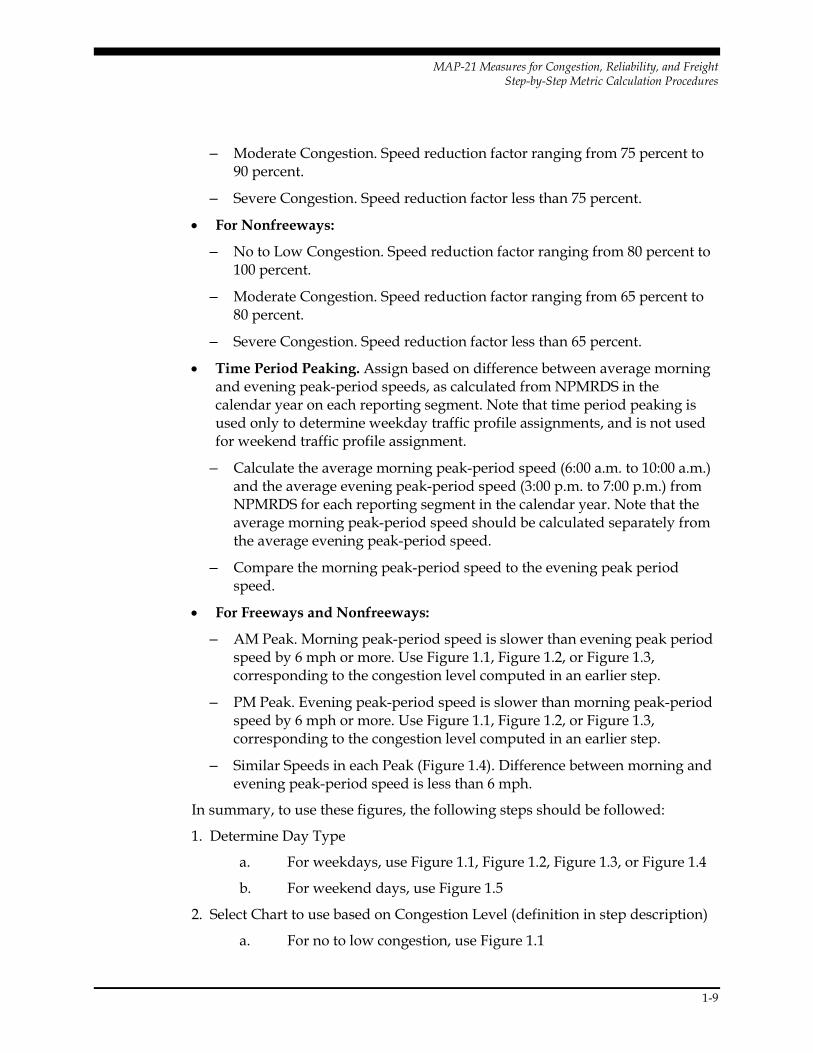
– Moderate Congestion. Speed reduction factor ranging from 75 percent to 90 percent.
– Severe Congestion. Speed reduction factor less than 75 percent.
• For Nonfreeways:
– No to Low Congestion. Speed reduction factor ranging from 80 percent to 100 percent.
– Moderate Congestion. Speed reduction factor ranging from 65 percent to 80 percent.
– Severe Congestion. Speed reduction factor less than 65 percent.
• Time Period Peaking. Assign based on difference between average morning and evening peak-period speeds, as calculated from NPMRDS in the calendar year on each reporting segment. Note that time period peaking is used only to determine weekday traffic profile assignments, and is not used for weekend traffic profile assignment.
– Calculate the average morning peak-period speed (6:00 a.m. to 10:00 a.m.) and the average evening peak-period speed (3:00 p.m. to 7:00 p.m.) from NPMRDS for each reporting segment in the calendar year. Note that the average morning peak-period speed should be calculated separately from the average evening peak-period speed.
– Compare the morning peak-period speed to the evening peak period speed.
• For Freeways and Nonfreeways:
– AM Peak. Morning peak-period speed is slower than evening peak period speed by 6 mph or more. Use Figure 1.1, Figure 1.2, or Figure 1.3, corresponding to the congestion level computed in an earlier step.
– PM Peak. Evening peak-period speed is slower than morning peak-period speed by 6 mph or more. Use Figure 1.1, Figure 1.2, or Figure 1.3, corresponding to the congestion level computed in an earlier step.
– Similar Speeds in each Peak (Figure 1.4). Difference between morning and evening peak-period speed is less than 6 mph.
In summary, to use these figures, the following steps should be followed:
1. Determine Day Type
a. For weekdays, use Figure 1.1, Figure 1.2, Figure 1.3, or Figure 1.4
b. For weekend days, use Figure 1.5
2. Select Chart to use based on Congestion Level (definition in step description)
a. For no to low congestion, use Figure 1.1
MAP-21 Measures for Congestion, Reliability, and Freight Step-by-Step Metric Calculation Procedures
1-10
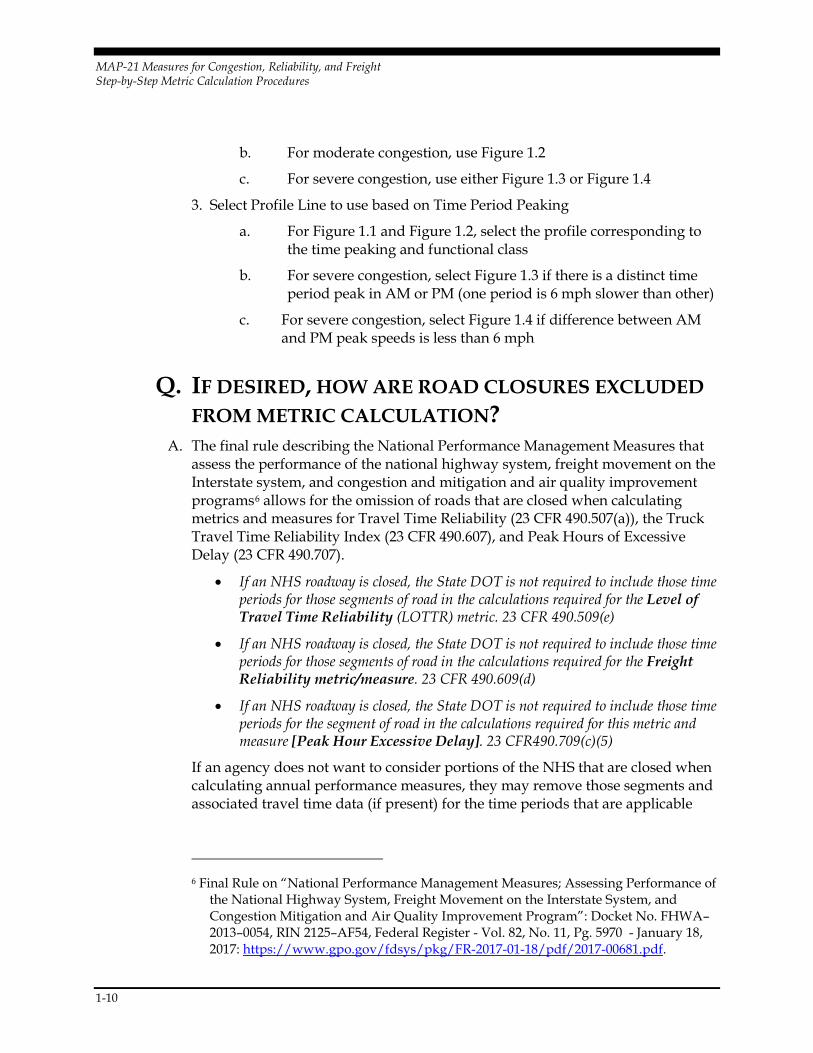
b. For moderate congestion, use Figure 1.2
c. For severe congestion, use either Figure 1.3 or Figure 1.4
3. Select Profile Line to use based on Time Period Peaking
a. For Figure 1.1 and Figure 1.2, select the profile corresponding to the time peaking and functional class
b. For severe congestion, select Figure 1.3 if there is a distinct time period peak in AM or PM (one period is 6 mph slower than other)
c. For severe congestion, select Figure 1.4 if difference between AM and PM peak speeds is less than 6 mph
Q. IF DESIRED, HOW ARE ROAD CLOSURES EXCLUDED FROM METRIC CALCULATION?
A. The final rule describing the National Performance Management Measures that assess the performance of the national highway system, freight movement on the Interstate system, and congestion and mitigation and air quality improvement programs6 allows for the omission of roads that are closed when calculating metrics and measures for Travel Time Reliability (23 CFR 490.507(a)), the Truck Travel Time Reliability Index (23 CFR 490.607), and Peak Hours of Excessive Delay (23 CFR 490.707).
• If an NHS roadway is closed, the State DOT is not required to include those time periods for those segments of road in the calculations required for the Level of Travel Time Reliability (LOTTR) metric. 23 CFR 490.509(e)
• If an NHS roadway is closed, the State DOT is not required to include those time periods for those segments of road in the calculations required for the Freight Reliability metric/measure. 23 CFR 490.609(d)
• If an NHS roadway is closed, the State DOT is not required to include those time periods for the segment of road in the calculations required for this metric and measure [Peak Hour Excessive Delay]. 23 CFR490.709(c)(5)
If an agency does not want to consider portions of the NHS that are closed when calculating annual performance measures, they may remove those segments and associated travel time data (if present) for the time periods that are applicable
6 Final Rule on “National Performance Management Measures; Assessing Performance of
the National Highway System, Freight Movement on the Interstate System, and Congestion Mitigation and Air Quality Improvement Program”: Docket No. FHWA–2013–0054, RIN 2125–AF54, Federal Register - Vol. 82, No. 11, Pg. 5970 - January 18, 2017: https://www.gpo.gov/fdsys/pkg/FR-2017-01-18/pdf/2017-00681.pdf.

MAP-21 Measures for Congestion, Reliability, and Freight Step-by-Step Metric Calculation Procedures
1-2
and then calculate travel time measures as described in Section 2 of this document.
To accomplish this, agencies must have a record of the road closure location(s) and time and duration, so that applicable reporting segments and travel time data can be identified in the travel time data set and then removed for the duration of the road closure.

MAP-21 Measures for Congestion, Reliability, and Freight Step-by-Step Metric Calculation Procedures
2-1
2.0 Step-by-Step Calculation Procedures for PM3 Metrics
DEFINITIONS7 • Highway Performance Monitoring System (HPMS) is a national-level highway
information system that includes data on the extent, condition, performance, use, and operating characteristics of the Nation’s highways.
• Measure means an expression based on a metric that is used to establish targets and to assess progress toward achieving the established targets.
• Metric means a quantifiable indicator of performance or condition. Metrics are used to calculate measures.
• National Performance Management Research Data Set (NPMRDS) means a data set derived from vehicle/passenger probe data (sourced from Global Positioning Station (GPS), navigation units, cell phones) that includes average travel times representative of all traffic on each mainline highway segment of the National Highway System (NHS), and additional travel times representative of freight trucks for those segments that are on the Interstate System. The data set includes records that contain average travel times for every 15 minutes of every day (24 hours) of the year recorded and calculated for every travel time segment where probe data are available. The NPMRDS does not include any imputed travel time data.
• Reporting segment means the length of roadway that the DOT and MPOs define for metric calculation and reporting and is comprised of one or more travel time segments.
• Target is a quantifiable level of performance or condition, as a value for the measure, to be achieved within a time period required by FHWA.
• Travel time reliability means the consistency or dependability of travel times from day to day or across different times of the day.
• Travel time segment means a contiguous stretch of the NHS for which average travel time data are summarized in the travel time data set.
• Urbanized area boundary is identified based on the most recent U.S. Decennial Census, unless FHWA approves adjustments to the urbanized area as
7 23 CFR 490.101 and 490.103 and 23 CFR 450.104.

MAP-21 Measures for Congestion, Reliability, and Freight Step-by-Step Metric Calculation Procedures
2-2
provided by 23 U.S.C. 101(a)(34) and these adjustments are submitted to HPMS.
• Metropolitan Planning Area is means the geographic area determined by agreement between the MPO for the area and the Governor, in which the metropolitan transportation planning process is carried out.
DATA PREPARATION
DATASET COMPOSITION The step-by-step procedures that follow use the travel time dataset in the NPMRDS Version 2 as a starting point. If users are using an alternate travel time dataset, they must use a dataset satisfies the requirement specified in 23 CFR 490.103(e) and (f). Two types of travel times need to be present: all vehicles and trucks only. The travel time dataset also must cover all mainline highways8 on the NHS.9 In addition, at a minimum, the following data elements for each reporting segment also should be present in the final travel time data set that is used; these come from the Traffic Message Channel (TMC) Identification file in NPMRDS Version 2:
• Reporting segment length (“miles”).
• Percent of reporting segment length that is designated as being on the NHS (“nhs_pct”).
• State code (“state”).
• Urbanized area code (“urban_code,” see HPMS Field Manual).10
• Functional system (“f_system,” see HPMS Field Manual).11
8 23 CFR 490.101 defines “mainline highways” as the through travel lanes of any
highway. Mainline highways specifically exclude ramps, shoulders, turn lanes, crossovers, rest areas, and other pavement surfaces that are not part of the roadway normally traveled by through traffic. Mainline highways in HPMS is identified by Facility Type data value equal to 1, 2, or 6. Please see Chapter 4 in the HPMS Field Manual (December 2016). https://www.fhwa.dot.gov/policyinformation/hpms/fieldmanual/.
9 23 CFR 490.509(a)(1), 490.609(b), and 490.709(b) 10 HPMS Field Manual (December 2016): https://www.fhwa.dot.gov/
policyinformation/hpms/fieldmanual/. The Field Manual is incorporated by reference in 23 CFR 490.111.
11 HPMS Field Manual (December 2016): https://www.fhwa.dot.gov/policyinformation/hpms/fieldmanual/.
MAP-21 Measures for Congestion, Reliability, and Freight Step-by-Step Metric Calculation Procedures
2-3
• NHS designation (“nhs,” see HPMS Field Manual).12
• Direction of traffic (“direction”; eastbound, westbound, northbound, southbound).
• One-way or two-way operation in inventory and non-inventory directions (“faciltype,” see HPMS Field Manual).
• Annual Average Daily Traffic13 (“aadt,” see HPMS Field Manual)14.
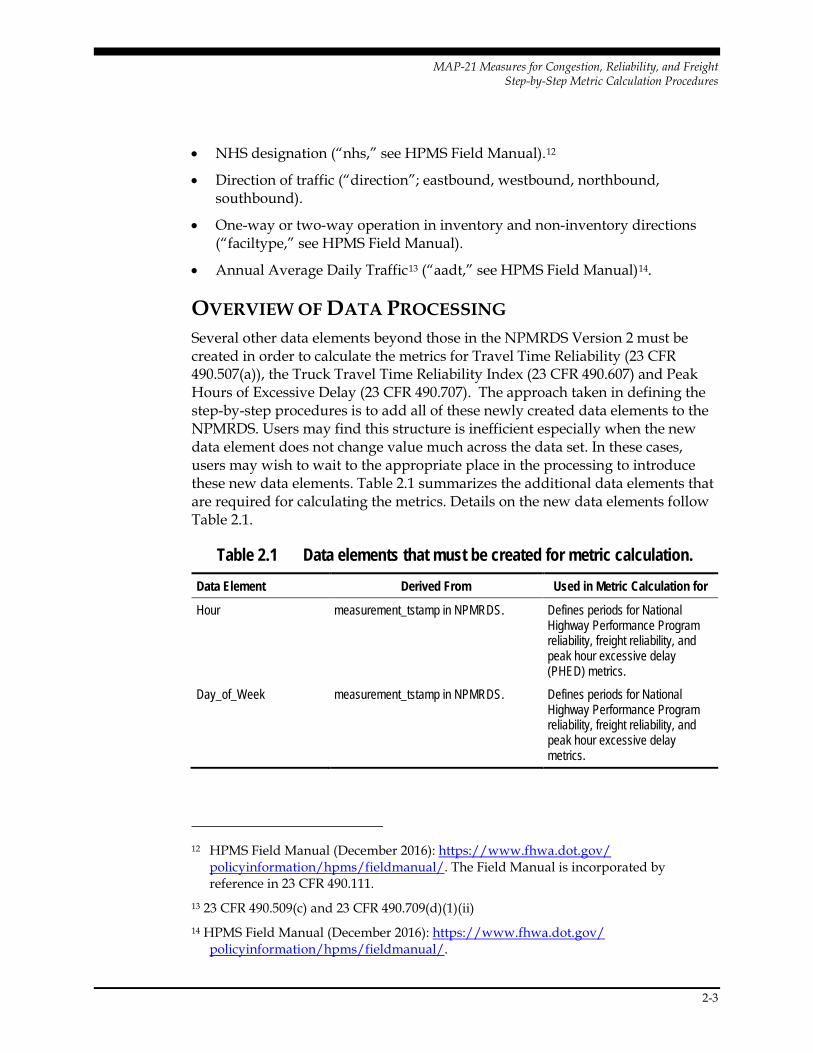
OVERVIEW OF DATA PROCESSING Several other data elements beyond those in the NPMRDS Version 2 must be created in order to calculate the metrics for Travel Time Reliability (23 CFR 490.507(a)), the Truck Travel Time Reliability Index (23 CFR 490.607) and Peak Hours of Excessive Delay (23 CFR 490.707). The approach taken in defining the step-by-step procedures is to add all of these newly created data elements to the NPMRDS. Users may find this structure is inefficient especially when the new data element does not change value much across the data set. In these cases, users may wish to wait to the appropriate place in the processing to introduce these new data elements. Table 2.1 summarizes the additional data elements that are required for calculating the metrics. Details on the new data elements follow Table 2.1.
Table 2.1 Data elements that must be created for metric calculation. Data Element Derived From Used in Metric Calculation for
Hour measurement_tstamp in NPMRDS. Defines periods for National Highway Performance Program reliability, freight reliability, and peak hour excessive delay (PHED) metrics.
Day_of_Week measurement_tstamp in NPMRDS. Defines periods for National Highway Performance Program reliability, freight reliability, and peak hour excessive delay metrics.
12 HPMS Field Manual (December 2016): https://www.fhwa.dot.gov/
policyinformation/hpms/fieldmanual/. The Field Manual is incorporated by reference in 23 CFR 490.111.
13 23 CFR 490.509(c) and 23 CFR 490.709(d)(1)(ii) 14 HPMS Field Manual (December 2016): https://www.fhwa.dot.gov/
policyinformation/hpms/fieldmanual/.

MAP-21 Measures for Congestion, Reliability, and Freight Step-by-Step Metric Calculation Procedures
2-4
Data Element Derived From Used in Metric Calculation for Month measurement_tstamp in NPMRDS. May be used in the calculation of
15-minute traffic volumes for the PHED metric.
NHPP_Period Hour and Day_of_Week. (23 CFR 490.511(b))
NHPP reliability
Freight_Period Hour and Day_of_Week. (23 CFR 490.611(a))
Freight reliability
Dir_AADT AADT and faciltype15 in NPMRDS. (23 CFR 490.509(c) and 23 CFR 490.511(e)(2))
NHPP reliability
15 Please see the section on “National Highway Performance Program Reliability Metrics”
for using facility type value for splitting AADT by direction.
MAP-21 Measures for Congestion, Reliability, and Freight Step-by-Step Metric Calculation Procedures
2-5
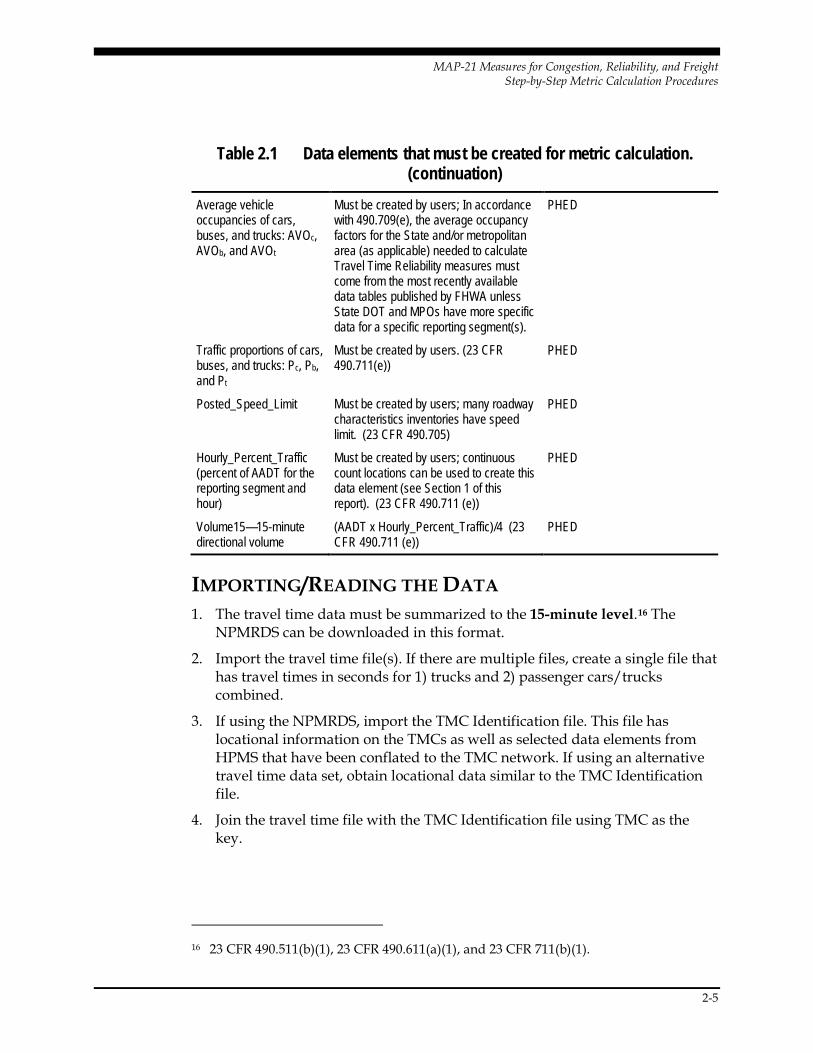
Table 2.1 Data elements that must be created for metric calculation. (continuation)
Average vehicle occupancies of cars, buses, and trucks: AVOc, AVOb, and AVOt
Must be created by users; In accordance with 490.709(e), the average occupancy factors for the State and/or metropolitan area (as applicable) needed to calculate Travel Time Reliability measures must come from the most recently available data tables published by FHWA unless State DOT and MPOs have more specific data for a specific reporting segment(s).
PHED
Traffic proportions of cars, buses, and trucks: Pc, Pb, and Pt
Must be created by users. (23 CFR 490.711(e))
PHED
Posted_Speed_Limit Must be created by users; many roadway characteristics inventories have speed limit. (23 CFR 490.705)
PHED
Hourly_Percent_Traffic (percent of AADT for the reporting segment and hour)
Must be created by users; continuous count locations can be used to create this data element (see Section 1 of this report). (23 CFR 490.711 (e))
PHED
Volume15—15-minute directional volume
(AADT x Hourly_Percent_Traffic)/4 (23 CFR 490.711 (e))
PHED
IMPORTING/READING THE DATA 1. The travel time data must be summarized to the 15-minute level.16 The
NPMRDS can be downloaded in this format.
2. Import the travel time file(s). If there are multiple files, create a single file that has travel times in seconds for 1) trucks and 2) passenger cars/trucks combined.
3. If using the NPMRDS, import the TMC Identification file. This file has locational information on the TMCs as well as selected data elements from HPMS that have been conflated to the TMC network. If using an alternative travel time data set, obtain locational data similar to the TMC Identification file.
4. Join the travel time file with the TMC Identification file using TMC as the key.
16 23 CFR 490.511(b)(1), 23 CFR 490.611(a)(1), and 23 CFR 711(b)(1).

MAP-21 Measures for Congestion, Reliability, and Freight Step-by-Step Metric Calculation Procedures
2-6
DATA PREPARATION: JOINED TRAVEL TIME AND LOCATIONAL DATASET 1. Select only those TMC segments where facility type (“faciltype”) is equal to 1,
2, or 6.17
2. If truck travel times are not available in NPMRDS or are equal to 0, set them equal to the travel time for combined passenger cars and trucks for the corresponding “tmc_segment” and “measurement_tstamp.”18
3. Parse the NPMRDS field “measurement_tstamp” into date and time; create new data elements:
a. “Hour” from the time data element.
b. “Month” from the date data element.
c. “Day_of_Week” from the date data element, with two values.
i. Weekdays.
ii. Weekends.
4. Create a new data element for time periods for the NHPP Reliability (“NHPP_Period”) with the following values:19
a. 6:00 a.m.–10:00 a.m., weekdays.
b. 10:00 a.m.–4:00 p.m., weekdays.
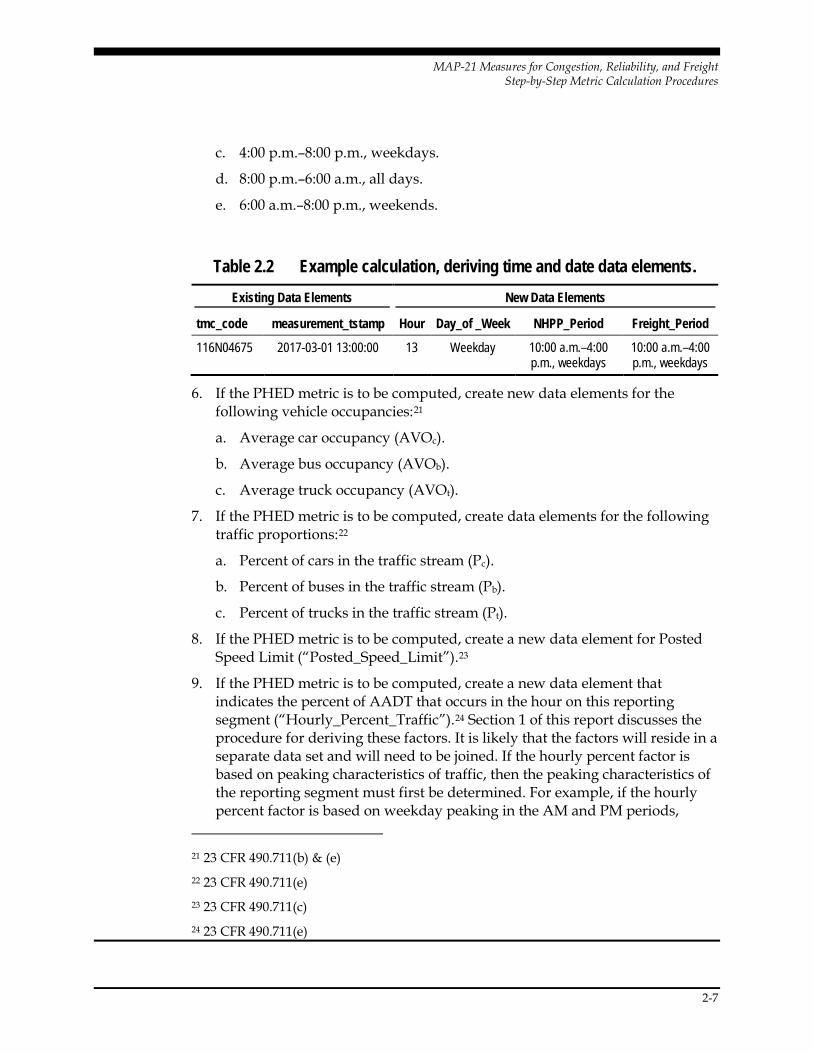
c. 4:00 p.m.–8:00 p.m., weekdays.
d. 6:00 a.m.–8:00 p.m., weekends.
5. Create a new data element for time periods for Freight Reliability (“Freight_Period”), with the following values:20
a. 6:00 a.m.–10:00 a.m., weekdays.
b. 10:00 a.m.–4:00 p.m., weekdays.
17 23 CFR 490.101 defines “mainline highways” as the through travel lanes of any
highway. Mainline highways specifically exclude ramps, shoulders, turn lanes, crossovers, rest areas, and other pavement surfaces that are not part of the roadway normally traveled by through traffic. Mainline highways in HPMS is identified by Facility Type data value equal to 1, 2, or 6. Please see Chapter 4 in the HPMS Field Manual (December 2016). https://www.fhwa.dot.gov/policyinformation/hpms/fieldmanual/
18 23 CFR 490.609(c) 19 23 CFR 490.511(b) 20 23 CFR 490.611(a)
MAP-21 Measures for Congestion, Reliability, and Freight Step-by-Step Metric Calculation Procedures
2-7
c. 4:00 p.m.–8:00 p.m., weekdays.
d. 8:00 p.m.–6:00 a.m., all days.
e. 6:00 a.m.–8:00 p.m., weekends.
Table 2.2 Example calculation, deriving time and date data elements. Existing Data Elements New Data Elements
tmc_code measurement_tstamp Hour Day_of _Week NHPP_Period Freight_Period
116N04675 2017-03-01 13:00:00 13 Weekday 10:00 a.m.–4:00 p.m., weekdays
10:00 a.m.–4:00 p.m., weekdays
6. If the PHED metric is to be computed, create new data elements for the following vehicle occupancies:21
a. Average car occupancy (AVOc).
b. Average bus occupancy (AVOb).
c. Average truck occupancy (AVOt).
7. If the PHED metric is to be computed, create data elements for the following traffic proportions:22
a. Percent of cars in the traffic stream (Pc).
b. Percent of buses in the traffic stream (Pb).
c. Percent of trucks in the traffic stream (Pt).
8. If the PHED metric is to be computed, create a new data element for Posted Speed Limit (“Posted_Speed_Limit”).23
9. If the PHED metric is to be computed, create a new data element that indicates the percent of AADT that occurs in the hour on this reporting segment (“Hourly_Percent_Traffic”).24 Section 1 of this report discusses the procedure for deriving these factors. It is likely that the factors will reside in a separate data set and will need to be joined. If the hourly percent factor is based on peaking characteristics of traffic, then the peaking characteristics of the reporting segment must first be determined. For example, if the hourly percent factor is based on weekday peaking in the AM and PM periods,
21 23 CFR 490.711(b) & (e) 22 23 CFR 490.711(e) 23 23 CFR 490.711(c) 24 23 CFR 490.711(e)

MAP-21 Measures for Congestion, Reliability, and Freight Step-by-Step Metric Calculation Procedures
2-8
average weekday speeds from the NPMRDS can be used to determine if the reporting segment peaks in the AM or PM. That is, if average speeds are lower in the AM, then it is assumed the reporting segment peaks in the AM.25
10. If the PHED metric is to be computed, create a new data element that is the volume of total traffic that occurs on the reporting segment for the 15-minute epoch (“Volume15”). This is done by multiplying AADT by Hourly_Percent_Traffic in the above step, then dividing by 4. The result should be rounded to the nearest tenth.26
Table 2.3 Example calculation for creating 15-minute volumes.
tmc_code AADT faciltype Dir_AADT Time Hour Hourly_Percent_
Traffic Volume15
116N04675 16,600 1 16,600 17:00–17:15 17 0.03500 145.3
116N04675 16,600 1 16,600 17:15–17:30 17 0.03500 145.3
116N04675 16,600 1 16,600 17:30–17:45 17 0.03500 145.3
116N04675 16,600 1 16,600 17:45–18:00 17 0.03500 145.3
118P05761 90,000 2 45,000 8:00–8:15 8 0.03248 365.4
118P05761 90,000 2 45,000 8:15–8:30 8 0.03248 365.4
118P05761 90,000 2 45,000 8:30–8:45 8 0.03248 365.4
118P05761 90,000 2 45,000 8:45–9:00 8 0.03248 365.4
NATIONAL HIGHWAY PERFORMANCE PROGRAM RELIABILITY METRICS
CALCULATION STEPS 1. For MPO reporting, only reporting segments within the MPO Planning
Boundary are used in these calculations.
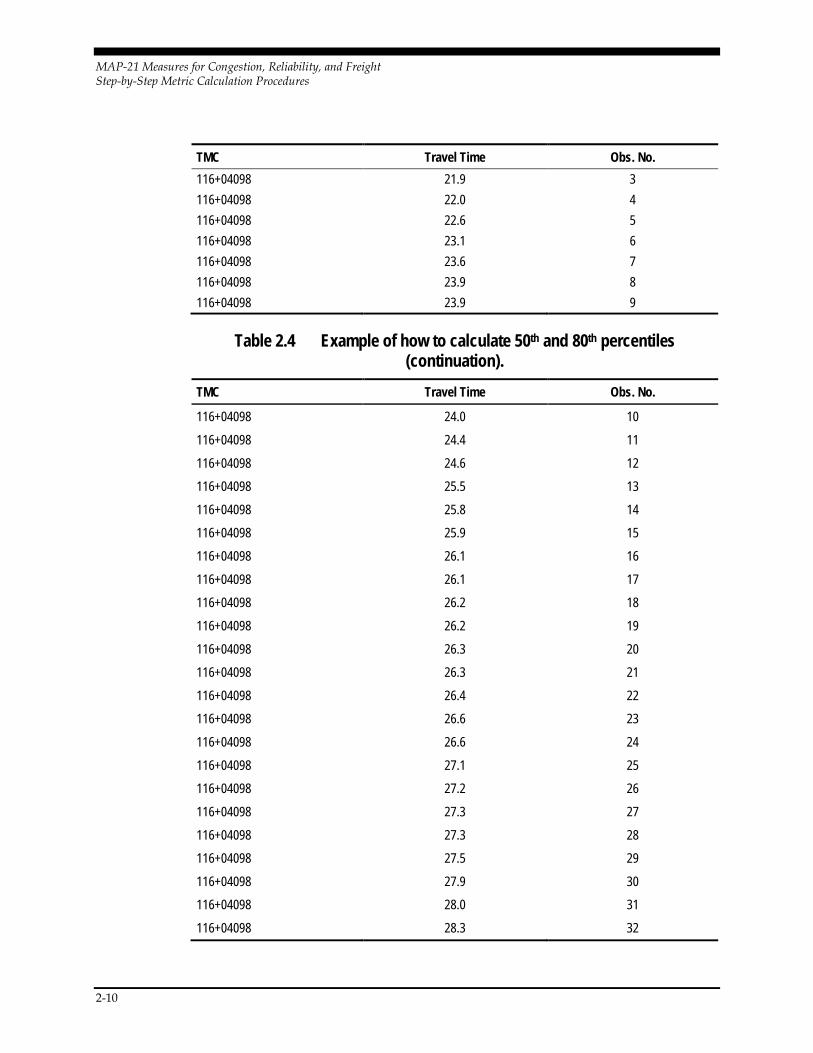
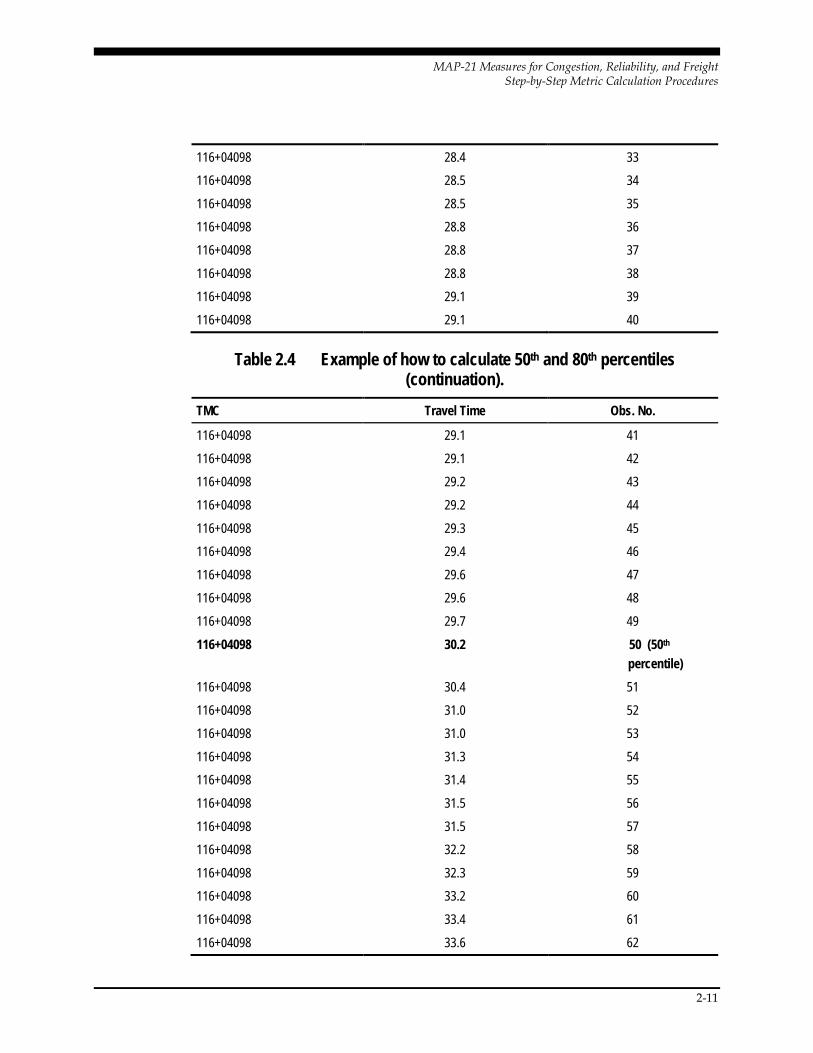
2. For each reporting segment (e.g., TMC) and NHPP time period (NHPP_Period) combination, compute the 50th and 80th percentile travel times for all vehicles.27 Do not round the percentiles. These statistics are derived from travel time distributions that are created for each of the four time periods and for each of the reporting segments individually. Figure 2.1 shows the distribution of travel times for a TMC located on an urban
25 See Section 1.0. 26 23 CFR 490.711(d)(2). 27 23 CFR 490.511(c)

MAP-21 Measures for Congestion, Reliability, and Freight Step-by-Step Metric Calculation Procedures
2-9
freeway. Table 2.4 shows how the percentiles are actually calculated from an example data set of 100 observations. The observations are sorted from lowest to highest travel time values. The 50th percentile is the value where 50 percent of the observations are below it; the 80th percentile is the value where 80 percent of the observations are below it.
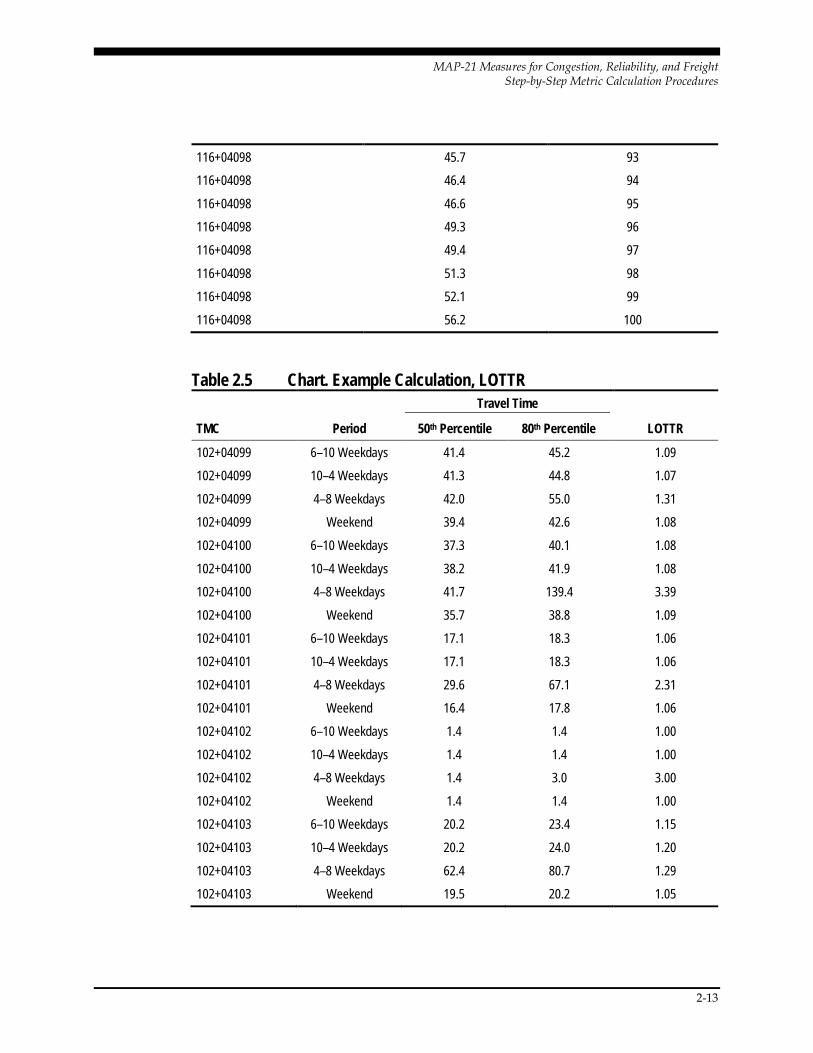
3. For each of the four time periods for a TMC, compute a Level of Travel Time Reliability Metric (LOTTR) as the 80th percentile travel time divided by the 50th percentile travel time. Round the LOTTR metrics to the nearest hundredth.28 Table 2.5 shows example calculations and Figure 2.3 shows a visual example of the process.
Figure 2.1 Graph. Distribution of travel times on an urban freeway (weekdays, 6:00 a.m. to 10:00 a.m.).
(Source: Created for this report.)
Table 2.4 Example of how to calculate 50th and 80th percentiles. TMC Travel Time Obs. No. 116+04098 17.1 1 116+04098 19.0 2
28 23 CFR 490.511(b)(3).
tt = 28 tt = 540
2000
4000
6000
8000
10000
12000
14000
16000
0 20 40 60 80 100 120 140 160 180 200
No. of Epochs
Travel Time (sec)50th Percentile 80th Percentile
MAP-21 Measures for Congestion, Reliability, and Freight Step-by-Step Metric Calculation Procedures
2-10
TMC Travel Time Obs. No. 116+04098 21.9 3 116+04098 22.0 4 116+04098 22.6 5 116+04098 23.1 6 116+04098 23.6 7 116+04098 23.9 8 116+04098 23.9 9
Table 2.4 Example of how to calculate 50th and 80th percentiles (continuation).
TMC Travel Time Obs. No.
116+04098 24.0 10
116+04098 24.4 11
116+04098 24.6 12
116+04098 25.5 13
116+04098 25.8 14
116+04098 25.9 15
116+04098 26.1 16
116+04098 26.1 17
116+04098 26.2 18
116+04098 26.2 19
116+04098 26.3 20
116+04098 26.3 21
116+04098 26.4 22
116+04098 26.6 23
116+04098 26.6 24
116+04098 27.1 25
116+04098 27.2 26
116+04098 27.3 27
116+04098 27.3 28
116+04098 27.5 29
116+04098 27.9 30
116+04098 28.0 31
116+04098 28.3 32
MAP-21 Measures for Congestion, Reliability, and Freight Step-by-Step Metric Calculation Procedures
2-11
116+04098 28.4 33
116+04098 28.5 34
116+04098 28.5 35
116+04098 28.8 36
116+04098 28.8 37
116+04098 28.8 38
116+04098 29.1 39
116+04098 29.1 40
Table 2.4 Example of how to calculate 50th and 80th percentiles (continuation).
TMC Travel Time Obs. No.
116+04098 29.1 41
116+04098 29.1 42
116+04098 29.2 43
116+04098 29.2 44
116+04098 29.3 45
116+04098 29.4 46
116+04098 29.6 47
116+04098 29.6 48
116+04098 29.7 49
116+04098 30.2 50 (50th percentile)
116+04098 30.4 51
116+04098 31.0 52
116+04098 31.0 53
116+04098 31.3 54
116+04098 31.4 55
116+04098 31.5 56
116+04098 31.5 57
116+04098 32.2 58
116+04098 32.3 59
116+04098 33.2 60
116+04098 33.4 61
116+04098 33.6 62

MAP-21 Measures for Congestion, Reliability, and Freight Step-by-Step Metric Calculation Procedures
2-12
116+04098 33.6 63
116+04098 34.5 64
116+04098 34.6 65
116+04098 34.6 66
116+04098 34.7 67
116+04098 35.2 68
116+04098 35.3 69
116+04098 35.6 70
116+04098 35.6 71
Table 2.4 Example of how to calculate 50th and 80th percentiles (continuation).
TMC Travel Time Obs. No.
116+04098 35.9 72
116+04098 35.9 73
116+04098 37.5 74
116+04098 38.1 75
116+04098 38.4 76
116+04098 38.9 77
116+04098 39.9 78
116+04098 40.5 79
116+04098 40.7 80 (80th percentile)
116+04098 40.9 81
116+04098 41.0 82
116+04098 41.3 83
116+04098 41.4 84
116+04098 41.8 85
116+04098 42.5 86
116+04098 42.6 87
116+04098 43.2 88
116+04098 43.3 89
116+04098 43.8 90
116+04098 43.8 91
116+04098 44.7 92
MAP-21 Measures for Congestion, Reliability, and Freight Step-by-Step Metric Calculation Procedures
2-13
116+04098 45.7 93
116+04098 46.4 94
116+04098 46.6 95
116+04098 49.3 96
116+04098 49.4 97
116+04098 51.3 98
116+04098 52.1 99
116+04098 56.2 100
Table 2.5 Chart. Example Calculation, LOTTR
TMC Period
Travel Time
LOTTR 50th Percentile 80th Percentile
102+04099 6–10 Weekdays 41.4 45.2 1.09
102+04099 10–4 Weekdays 41.3 44.8 1.07
102+04099 4–8 Weekdays 42.0 55.0 1.31
102+04099 Weekend 39.4 42.6 1.08
102+04100 6–10 Weekdays 37.3 40.1 1.08
102+04100 10–4 Weekdays 38.2 41.9 1.08
102+04100 4–8 Weekdays 41.7 139.4 3.39
102+04100 Weekend 35.7 38.8 1.09
102+04101 6–10 Weekdays 17.1 18.3 1.06
102+04101 10–4 Weekdays 17.1 18.3 1.06
102+04101 4–8 Weekdays 29.6 67.1 2.31
102+04101 Weekend 16.4 17.8 1.06
102+04102 6–10 Weekdays 1.4 1.4 1.00
102+04102 10–4 Weekdays 1.4 1.4 1.00
102+04102 4–8 Weekdays 1.4 3.0 3.00
102+04102 Weekend 1.4 1.4 1.00
102+04103 6–10 Weekdays 20.2 23.4 1.15
102+04103 10–4 Weekdays 20.2 24.0 1.20
102+04103 4–8 Weekdays 62.4 80.7 1.29
102+04103 Weekend 19.5 20.2 1.05

MAP-21 Measures for Congestion, Reliability, and Freight Step-by-Step Metric Calculation Procedures
2-14
Figure 2.2 Illustration. Creating NHPP Reliability Metrics by TMC. (Source: Created for this report.)
RELATION OF THE LOTTR METRICS TO THE NHPP RELIABILITY MEASURE29 For each reporting segment, the four LOTTR values are compared to a threshold value of 1.50. If all four of the LOTTR values are below this threshold, the reporting segment is deemed to be reliable; if not, it is deemed to be unreliable. The NHPP reliability measure is then calculated as the total person miles that are reliable divided by the total person miles. Separate measures are computed for the Interstate system and non-Interstate NHS routes:
𝑁𝑁𝑁𝑁𝑃𝑃𝑃𝑃 𝑅𝑅𝑆𝑆𝐹𝐹𝑅𝑅𝐹𝐹𝑏𝑏𝑅𝑅𝐹𝐹𝑅𝑅𝑅𝑅𝑏𝑏 𝑀𝑀𝑆𝑆𝐹𝐹𝑀𝑀𝑅𝑅𝐹𝐹𝑆𝑆 = ∑ 𝑆𝑆𝑆𝑆𝑖𝑖× 𝐴𝐴𝐴𝐴𝑖𝑖 × 𝑂𝑂𝐹𝐹𝑗𝑗𝑅𝑅𝑟𝑟=1
∑ 𝑆𝑆𝑆𝑆𝑖𝑖 𝑇𝑇𝑡𝑡=1 × 𝐴𝐴𝐴𝐴𝑖𝑖 × 𝑂𝑂𝐹𝐹𝑗𝑗
Figure 2.3 Equation. (Source: 23 CFR 490.513(b).)
Where:
29 23 CFR 490.513

MAP-21 Measures for Congestion, Reliability, and Freight Step-by-Step Metric Calculation Procedures
2-15
SLi = the segment length of reporting segment i (nearest thousandth) for the highway system being considered.
AVi = annual traffic volume of reporting segment i.
= 𝐴𝐴𝐴𝐴𝐴𝐴𝐴𝐴 ×𝐴𝐴𝑅𝑅𝐹𝐹𝑆𝑆𝑅𝑅𝑅𝑅𝑅𝑅𝑅𝑅𝑅𝑅𝐹𝐹𝐹𝐹 𝐹𝐹𝐹𝐹𝑅𝑅𝑅𝑅𝑅𝑅𝐹𝐹 × 365.
Directional Factor = factor for splitting AADT by direction (0.5 if faciltype = 2 or 6; 1 if faciltype = 1).
OFj = occupancy factor for vehicles on the NHS within a specified geographic area j within the State/Metropolitan planning area.
R = total number of Interstate or non-Interstate reporting segments exhibiting an LOTTR below 1.50 for all 4 time periods.
T = total number of Interstate or non-Interstate reporting segments.
ANNUAL REPORTING REQUIREMENTS30 Starting in 2018 and annually thereafter, State DOTs must report the LOTTR metrics, in accordance with HPMS Field Manual by June 15th of each year for the previous year’s measures. Metrics are reported to HPMS by reporting segment. All reporting segments where the NPMRDS is used must be referenced by NPMRDS TMC(s) or HPMS section(s). If a State DOT elects to use, in part or in whole, the equivalent data set, all reporting segment must be referenced by HPMS section(s).
The LOTTR metric (to the nearest hundredths) must be reported for each of the four time periods. The corresponding 80th percentile travel times (to the nearest second), the corresponding 50th percentile travel times (to the nearest second), and directional AADTs. If a State DOT does not elect to use FHWA supplied occupancy factor, that State DOT must report vehicle occupancy factor (to the nearest tenth) to HPMS.
The reporting of the reporting segment length to HPMS must be based on the proportion of the segment that is designated as the NHS. The data element “nhs_pct” is used to produce this length.
FREIGHT RELIABILITY METRICS
CALCULATION STEPS 1. Only reporting segments on the Interstate system are used in the calculation
of the Freight Reliability metrics (where f_system = 1).
30 23 CFR 490.511(e)

MAP-21 Measures for Congestion, Reliability, and Freight Step-by-Step Metric Calculation Procedures
2-16
2. For MPO reporting, only reporting segments within the MPO Planning Boundary are used in these calculations.
3. Create a new data element that takes on the value of truck travel time if truck travel time is not null or not zero, and the travel time of combined trucks and passenger cars if truck travel time is null or zero.31
4. For each reporting segment (e.g., TMC) and Freight Reliability time period (Freight_Period) combination, compute the 50th and 95th percentile travel times. Do not round the percentiles. As with the NHPP Reliability calculation, these percentiles are derived from the distribution of travel times similar to the one shown in Figure 2.1 and Table 2.4, except the percentiles are now the 50th and 95th.32
5. Compute the Truck Travel Time Reliability (TTTR) metric as the 95th percentile travel time divided by the 50th percentile travel time for each of the five time periods for each reporting segment. Round the TTTR metric to the nearest hundredth.
Table 2.6 Example calculation, TTTR.
TMC Period
Travel Time
TTTR 50th Percentile 95th Percentile 102+04099 6–10 Weekdays 41.3 85.2 2.06 102+04099 10–4 Weekdays 41.3 54.3 1.31 102+04099 4–8 Weekdays 42.7 155.8 3.65 102+04099 Overnight 40.0 51.2 1.28 102+04099 Weekend 39.4 48.5 1.23 102+04100 6–10 Weekdays 37.1 75.3 2.03 102+04100 10–4 Weekdays 38.4 97.7 2.54 102+04100 4–8 Weekdays 42.5 188.0 4.42 102+04100 Overnight 35.8 45.8 1.28 102+04100 Weekend 35.4 43.5 1.23 102+04101 6–10 Weekdays 17.0 25.1 1.48 102+04101 10–4 Weekdays 17.9 54.6 3.05 102+04101 4–8 Weekdays 30.3 88.9 2.93 102+04101 Overnight 15.5 19.3 1.25 102+04101 Weekend 16.3 57.4 3.52 102+04102 6–10 Weekdays 46.7 55.5 1.19 102+04102 10–4 Weekdays 45.1 49.9 1.11
31 23 CFR 490.609 and 490.611. 32 23 CFR 490.611

MAP-21 Measures for Congestion, Reliability, and Freight Step-by-Step Metric Calculation Procedures
2-17
TMC Period
Travel Time
TTTR 50th Percentile 95th Percentile 102+04102 4–8 Weekdays 49.9 56.6 1.13 102+04102 Overnight 39.8 51.1 1.28 102+04102 Weekend 41.3 44.4 1.08 102+04103 6–10 Weekdays 20.2 42.6 2.11 102+04103 10–4 Weekdays 20.2 72.4 3.58 102+04103 4–8 Weekdays 61.3 108.4 1.77 102+04103 Overnight 18.4 26.0 1.41 102+04103 Weekend 19.4 24.4 1.26
RELATION OF THE TTTR METRICS TO THE FREIGHT RELIABILITY MEASURE33 For each reporting segment, the TTTR metric with the highest value of the five TTTR metrics is selected as the “maximum TTTR.” The Freight Reliability Measure is then calculated as the produce of the maximum TTR times reporting segment length, divided by the
𝐹𝐹𝐹𝐹𝑆𝑆𝑅𝑅𝐴𝐴ℎ𝑅𝑅 𝑅𝑅𝑆𝑆𝐹𝐹𝑅𝑅𝐹𝐹𝑏𝑏𝑅𝑅𝐹𝐹𝑅𝑅𝑅𝑅𝑏𝑏 = ∑ (𝑆𝑆𝑆𝑆𝑖𝑖 × 𝑝𝑝𝐹𝐹𝑚𝑚𝐴𝐴𝐴𝐴𝐴𝐴𝑅𝑅𝑖𝑖)𝑇𝑇𝑖𝑖=1
∑ (𝑆𝑆𝑆𝑆𝑖𝑖𝑇𝑇𝑖𝑖=1 )
Figure 2.4 Equation. (Source: 23 CFR 490.613(b).)
Where:
i is an Interstate reporting segment.
maxTTTRi = the maximum TTTR of all five time periods for segment i (nearest hundredth).
SLi = length of segment i (nearest thousandth), which accounts for the proportion of the segment that is designated as NHS.
T = total number of Interstate segments.
ANNUAL REPORTING REQUIREMENTS34 Starting in 2018 and annually thereafter, State DOTs must report the TTTR metrics in accordance with the HPMS Field Manual by June 15th of each year for the previous year’s Freight Reliability measures. All metrics must be reported to 33 23 CFR 490.613 34 23 CFR 490.611
MAP-21 Measures for Congestion, Reliability, and Freight Step-by-Step Metric Calculation Procedures
2-18
HPMS by reporting segments. When the NPMRDS is used, metrics must be referenced by NPMRDS TMC(s) or HPMS section(s). If a State DOT elects to use, in part or in whole, the equivalent data set, all reporting segment must be referenced by HPMS section(s).
The TTTR metrics must be reported to HPMS for each reporting segment (to the nearest hundredths) for each of the five time periods. The corresponding 95th percentile travel times (to the nearest second) and the corresponding 50th percentile travel times (to the nearest second) also must be reported.
The reporting of the reporting segment length to HPMS must be based on the proportion of the segment that is designated as the NHS. The data element “nhs_pct” is used to produce this length.
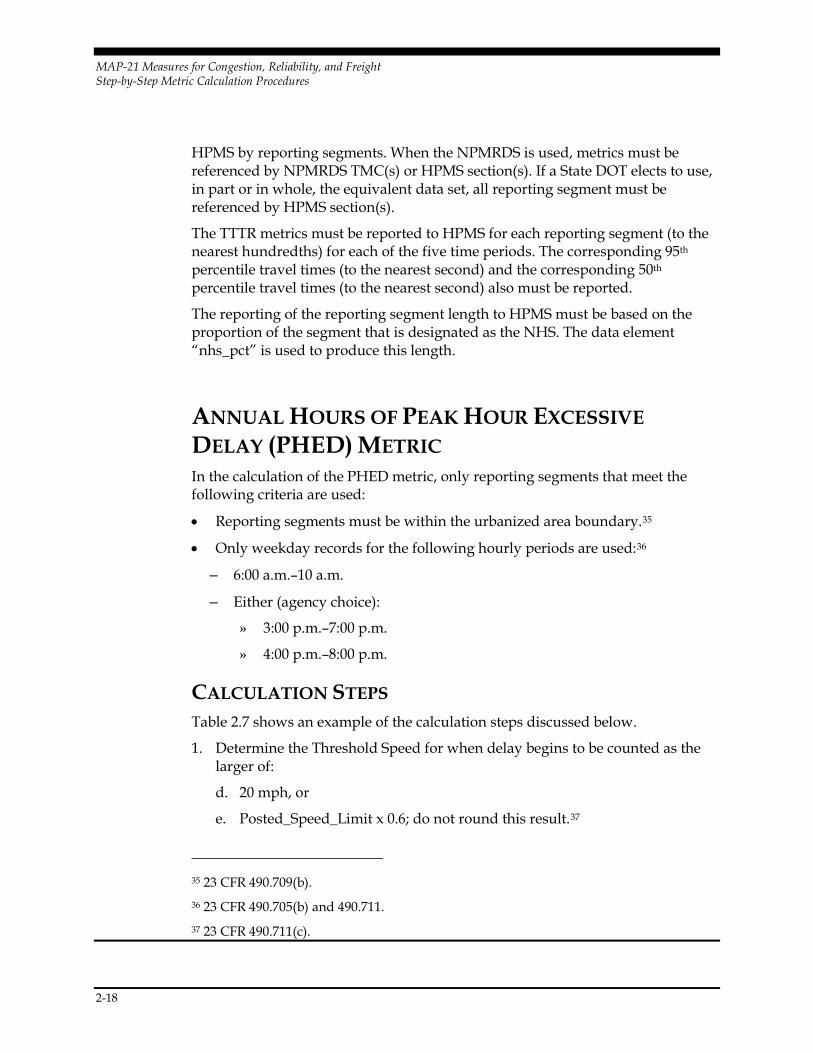
ANNUAL HOURS OF PEAK HOUR EXCESSIVE DELAY (PHED) METRIC In the calculation of the PHED metric, only reporting segments that meet the following criteria are used:
• Reporting segments must be within the urbanized area boundary.35
• Only weekday records for the following hourly periods are used:36
– 6:00 a.m.–10 a.m.
– Either (agency choice):
» 3:00 p.m.–7:00 p.m.
» 4:00 p.m.–8:00 p.m.
CALCULATION STEPS Table 2.7 shows an example of the calculation steps discussed below.
1. Determine the Threshold Speed for when delay begins to be counted as the larger of:
d. 20 mph, or
e. Posted_Speed_Limit x 0.6; do not round this result.37
35 23 CFR 490.709(b). 36 23 CFR 490.705(b) and 490.711. 37 23 CFR 490.711(c).

MAP-21 Measures for Congestion, Reliability, and Freight Step-by-Step Metric Calculation Procedures
2-19
2. Compute the Excessive Delay Threshold Travel Time (EDTTT), rounded to the nearest second.38 The EDTTT is the travel time on the segment above which delay would be incurred and is calculated as:
𝐸𝐸𝑚𝑚𝑅𝑅𝑆𝑆𝑀𝑀𝑀𝑀𝑅𝑅𝐴𝐴𝑆𝑆 𝐴𝐴𝑆𝑆𝐹𝐹𝐹𝐹𝑏𝑏 𝐴𝐴ℎ𝐹𝐹𝑆𝑆𝑀𝑀ℎ𝑅𝑅𝐹𝐹𝑆𝑆 𝐴𝐴𝐹𝐹𝐹𝐹𝐴𝐴𝑆𝑆𝐹𝐹 𝐴𝐴𝑅𝑅𝑝𝑝𝑆𝑆𝑠𝑠
= � 𝐴𝐴𝐹𝐹𝐹𝐹𝐴𝐴𝑆𝑆𝐹𝐹 𝐴𝐴𝑅𝑅𝑝𝑝𝑆𝑆 𝑆𝑆𝑆𝑆𝐴𝐴𝑝𝑝𝑆𝑆𝑅𝑅𝑅𝑅 𝑆𝑆𝑆𝑆𝑅𝑅𝐴𝐴𝑅𝑅ℎ𝑠𝑠
𝐴𝐴ℎ𝐹𝐹𝑆𝑆𝑀𝑀ℎ𝑅𝑅𝐹𝐹𝑆𝑆 𝑆𝑆𝑆𝑆𝑆𝑆𝑆𝑆𝑆𝑆𝑠𝑠�×3,600
Figure 2.5 Equation. (Source: 23 CFR 490.711(c).)
Where: s is the reporting segment; Travel Time Segment Length (s) = Total length of travel time segment to the nearest hundredth of a mile for travel time reporting segment s.
3. Compute the travel time segment delay (RSD), rounded to the nearest second, as:39
𝑅𝑅𝑆𝑆𝐴𝐴𝑠𝑠,𝑏𝑏 = 𝐴𝐴𝐹𝐹𝐹𝐹𝐴𝐴𝑆𝑆𝐹𝐹 𝐴𝐴𝑅𝑅𝑝𝑝𝑆𝑆𝑠𝑠,𝑏𝑏 − 𝐸𝐸𝐴𝐴𝐴𝐴𝐴𝐴𝐴𝐴𝑠𝑠
Figure 2.6 Equation. (Source: 23 CFR 490.711(c)(1).)
Where:
Travel Times,b = travel time of all vehicles on segment s and 15-minute time bin b.
4. Compute the Excessive Delay (ED), rounded to the nearest thousandth hour, as:40
𝐸𝐸𝑚𝑚𝑅𝑅𝑆𝑆𝑀𝑀𝑀𝑀𝑅𝑅𝐴𝐴𝑆𝑆𝐴𝐴𝑆𝑆𝐹𝐹𝐹𝐹𝑏𝑏𝑠𝑠,𝑏𝑏 =
⎩⎪⎨
⎪⎧
𝑅𝑅𝑆𝑆𝐴𝐴𝑠𝑠,𝑏𝑏3,600𝑅𝑅𝐹𝐹
0 𝐹𝐹ℎ𝑆𝑆𝑅𝑅 𝑅𝑅𝑆𝑆𝐴𝐴𝑏𝑏 < 0
𝐹𝐹ℎ𝑆𝑆𝑅𝑅 𝑅𝑅𝑆𝑆𝐴𝐴𝑠𝑠,𝑏𝑏 ≥ 0
Figure 2.7 Equation. (Source: 23 CFR 490.711(c)(2).)
5. Compute Average Vehicle Occupancy (AVO) from previously created data elements shown in Table 2.1:41
38 23 CFR 490.711(c). 39 23 CFR 490.711(d)(1). 40 23 CFR 490.711(d)(2). 41 23 CFR 490.711(e).

MAP-21 Measures for Congestion, Reliability, and Freight Step-by-Step Metric Calculation Procedures
2-20
AVO = (𝑃𝑃𝑐𝑐 × 𝐴𝐴𝐴𝐴𝑂𝑂𝑐𝑐) + (𝑃𝑃𝑏𝑏 × 𝐴𝐴𝐴𝐴𝑂𝑂𝑏𝑏) + (𝑃𝑃𝑡𝑡 × 𝐴𝐴𝐴𝐴𝑂𝑂𝑡𝑡)
Figure 2.8 Equation. (Source: 23 CFR 490.711(e).)
Average vehicle occupancies of cars, buses, and trucks: AVOc, AVOb, and AVOt
Traffic proportions of cars, buses, and trucks: Pc, Pb, and Pt
6. Compute Total Delay (TD), rounded to the nearest thousandth, for each reporting segment and 15-minute epoch as:
𝐴𝐴𝐴𝐴𝑠𝑠,𝑏𝑏 = 𝐴𝐴𝐴𝐴𝑂𝑂 × 𝐸𝐸𝐴𝐴𝑠𝑠,𝑏𝑏 ×𝐴𝐴𝑅𝑅𝐹𝐹𝑅𝑅𝑝𝑝𝑆𝑆15𝑠𝑠,𝑏𝑏 ×(𝑅𝑅ℎ𝑀𝑀_𝑆𝑆𝑅𝑅𝑅𝑅×0.01)
Figure 2.9 Equation. (Source: 23 CFR 490.711(e).)
nhs_pct is the percent of reporting segment length that is on the NHS. This attribute data value is provided in the NPMRDS and is not an HPMS attribute data. Weighing Total Delay by nhs_pct data value is recommended to account only the NHS portion of a reporting segments for the Delay computation. For example, nhs_pct data value of 100 means the entire length of a reporting segment is on the
NHS, and nhs_pct data value equal 90 means 90% of a reporting segment length is on NHS.
Volume15 is the 15-minute volume for the travel time record
7. Compute Peak Hour Excessive Delay metric (PHED), rounded to the nearest thousandth, for each reporting segment in an applicable urbanized area for the entire year as: 42, 𝑃𝑃𝑁𝑁𝐸𝐸𝐴𝐴𝑠𝑠 = ∑ 𝐴𝐴𝐴𝐴𝑠𝑠,𝑏𝑏𝑏𝑏
Figure 2.10 Equation. (Source: 23 CFR 490.711 (e).)
TDs, b is total delay from Step 6 above.
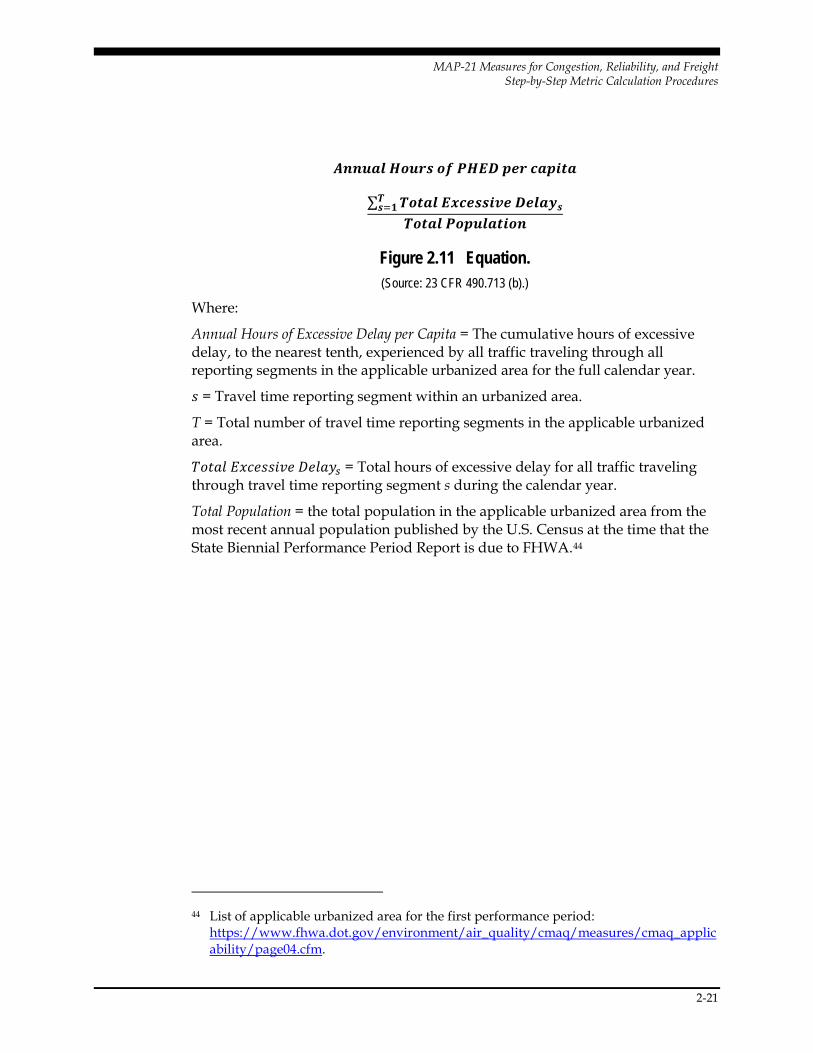
RELATION TO THE ANNUAL HOURS OF PEAK HOUR EXCESSIVE DELAY PER CAPITA MEASURE43 The PHED metric is used to compute the Annual Hours of Excessive Delay per Capita performance measure for Congestion Mitigation and Air Quality (CMAQ) Traffic Congestion by summing all the PHED values for an applicable urbanized area and dividing by the population of that urbanized area:
42 The PHED metric is also known as the Total Excessive Delay, as per the Rule (23
CFR 490.711). 43 23 CFR 490.713
MAP-21 Measures for Congestion, Reliability, and Freight Step-by-Step Metric Calculation Procedures
2-21
𝑨𝑨𝑨𝑨𝑨𝑨𝑨𝑨𝑨𝑨𝑨𝑨 𝑯𝑯𝑯𝑯𝑨𝑨𝑯𝑯𝑯𝑯 𝑯𝑯𝒐𝒐 𝑷𝑷𝑯𝑯𝑷𝑷𝑷𝑷 𝒑𝒑𝒑𝒑𝑯𝑯 𝒄𝒄𝑨𝑨𝒑𝒑𝒄𝒄𝒄𝒄𝑨𝑨
= ∑ 𝑻𝑻𝑯𝑯𝒄𝒄𝑨𝑨𝑨𝑨 𝑷𝑷𝑬𝑬𝒄𝒄𝒑𝒑𝑯𝑯𝑯𝑯𝒄𝒄𝑬𝑬𝒑𝒑 𝑷𝑷𝒑𝒑𝑨𝑨𝑨𝑨𝑫𝑫𝑯𝑯𝑻𝑻𝑯𝑯=𝟏𝟏
𝑻𝑻𝑯𝑯𝒄𝒄𝑨𝑨𝑨𝑨 𝑷𝑷𝑯𝑯𝒑𝒑𝑨𝑨𝑨𝑨𝑨𝑨𝒄𝒄𝒄𝒄𝑯𝑯𝑨𝑨
Figure 2.11 Equation. (Source: 23 CFR 490.713 (b).)
Where:
Annual Hours of Excessive Delay per Capita = The cumulative hours of excessive delay, to the nearest tenth, experienced by all traffic traveling through all reporting segments in the applicable urbanized area for the full calendar year.
𝑀𝑀 = Travel time reporting segment within an urbanized area.
T = Total number of travel time reporting segments in the applicable urbanized area.
𝐴𝐴𝑅𝑅𝑅𝑅𝐹𝐹𝐹𝐹 𝐸𝐸𝑚𝑚𝑅𝑅𝑆𝑆𝑀𝑀𝑀𝑀𝑅𝑅𝐴𝐴𝑆𝑆 𝐴𝐴𝑆𝑆𝐹𝐹𝐹𝐹𝑏𝑏𝑠𝑠 = Total hours of excessive delay for all traffic traveling through travel time reporting segment s during the calendar year.
Total Population = the total population in the applicable urbanized area from the most recent annual population published by the U.S. Census at the time that the State Biennial Performance Period Report is due to FHWA.44
44 List of applicable urbanized area for the first performance period:
https://www.fhwa.dot.gov/environment/air_quality/cmaq/measures/cmaq_applicability/page04.cfm.

MA
P-21 Measures for Congestion, Reliability, and Freight
Step-by-Step Calculation Procedures
2-22 Cam
bridge Systematics, Inc.
Table 2.7 Chart. Example calculation, PHED metric.
Note: Posted_Speed_Limit, Hourly_Traffic_Percent, and Volume15 must be added to the master data set as described in the first section of this chapter. “nhs_pct” is assumed to be 100 percent in these calculations.
TMC Length = 1.0 mile.
AADT = 55,000. (Average Annual Daily Traffic)
AVO = 1.1.
EDTTT (in seconds) = TMC Length/Threshold Speed X 3,600. (Excessive Delay Threshold Travel Time)
RSD (in seconds) = Travel Time—EDTTT. (Travel Time Segment Delay)
ED (in hours) = RSD/3,600 (min = 0). (Excessive Delay)
TD (in person hours) = AVO * ED * Volume15. (Total Delay)
Data Elements in the Master Data Set Data Elements Created During PHED Processing
TMC Time Posted_ Speed_
Limit (in mph) Travel Time (in seconds)
Hourly_ Traffic_ Percent Volume15
Threshold Speed EDTTT RSD ED TD
116+04101 7:00 65 88.2 0.0064 351 39.0 92 0 0.0000 0.0000
116+04101 7:15 65 90.1 0.0064 351 39.0 92 0 0.0000 0.0000
116+04101 7:30 65 100.9 0.0064 351 39.0 92 9 0.0024 0.9313
116+04101 7:45 65 120.0 0.0064 351 39.0 92 28 0.0077 2.9668
116+04101 8:00 65 125.1 0.0075 413 39.0 92 33 0.0091 4.1206
116+04101 8:15 65 115.6 0.0075 413 39.0 92 23 0.0063 2.8602
116+04101 8:30 65 118.3 0.0075 413 39.0 92 26 0.0071 3.2383
116+04101 8:45 65 106.9 0.0075 413 39.0 92 15 0.0041 1.8518
116+04101 9:00 65 83.3 0.0070 385 39.0 92 0 0.0000 0.0000
116+04101 9:15 65 70.5 0.0070 385 39.0 92 0 0.0000 0.0000
116+04101 9:30 65 55.1 0.0070 385 39.0 92 0 0.0000 0.0000
116+04101 9:45 65 52.0 0.0070 385 39.0 92 0 0.0000 0.0000 TMC 116+04101: PHED = 15.9690

MAP-21 Measures for Congestion, Reliability, and Freight Step-by-Step Calculation Procedures
2-23
ANNUAL REPORTING REQUIREMENTS45 Starting in 2018 and annually thereafter, State DOTs must report the PHED metric (to the nearest one hundredth hour) in accordance with HPMS Field Manual by June 15th of each year for the previous year’s PHED measures. The PHED metric must be reported for each reporting segment. All reporting segments of the NPMRDS must be referenced by NPMRDS TMC or HPMS section(s). If a State DOT elects to use, in part or in whole, the equivalent data set, all reporting segments must be referenced by HPMS sections.
45 23 CFR 490.711(f)


