Instructions for the completion of Section 1 are given on Page two of your question and answer booklet.
Record your answers on the answer grid on Page three of your question and answer booklet.
Before leaving the examination room you must give your question and answer booklet to the Invigilator; if you do not you may lose all the marks for this paper.
X740/76/02 Human Biology Section 1 — Questions
*X7407602*
WEDNESDAY, 13 MAY
1:00 PM – 3:30 PM
HTP
Page two
SECTION 1 — 20 marks
Attempt ALL questions
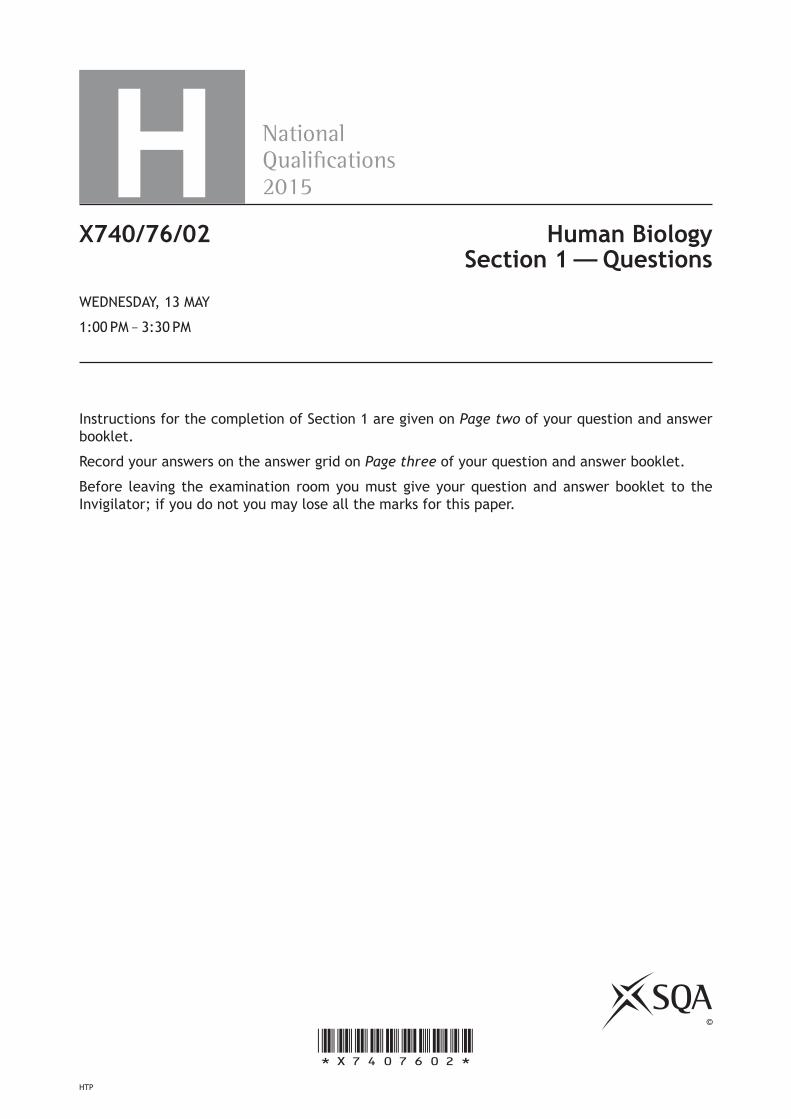
1. The diagram below shows an enzyme-catalysed reaction taking place in the presence of an inhibitor.
P
Q
R T
S
Which line in the table below identifies the molecules in the reaction?
Inhibitor Substrate Product
A P R S
B Q P S
C R P T
D R Q T
2. A primary transcript is a strand of
A RNA comprising just exons
B DNA comprising just exons
C RNA comprising introns and exons
D DNA comprising introns and exons.
Page three
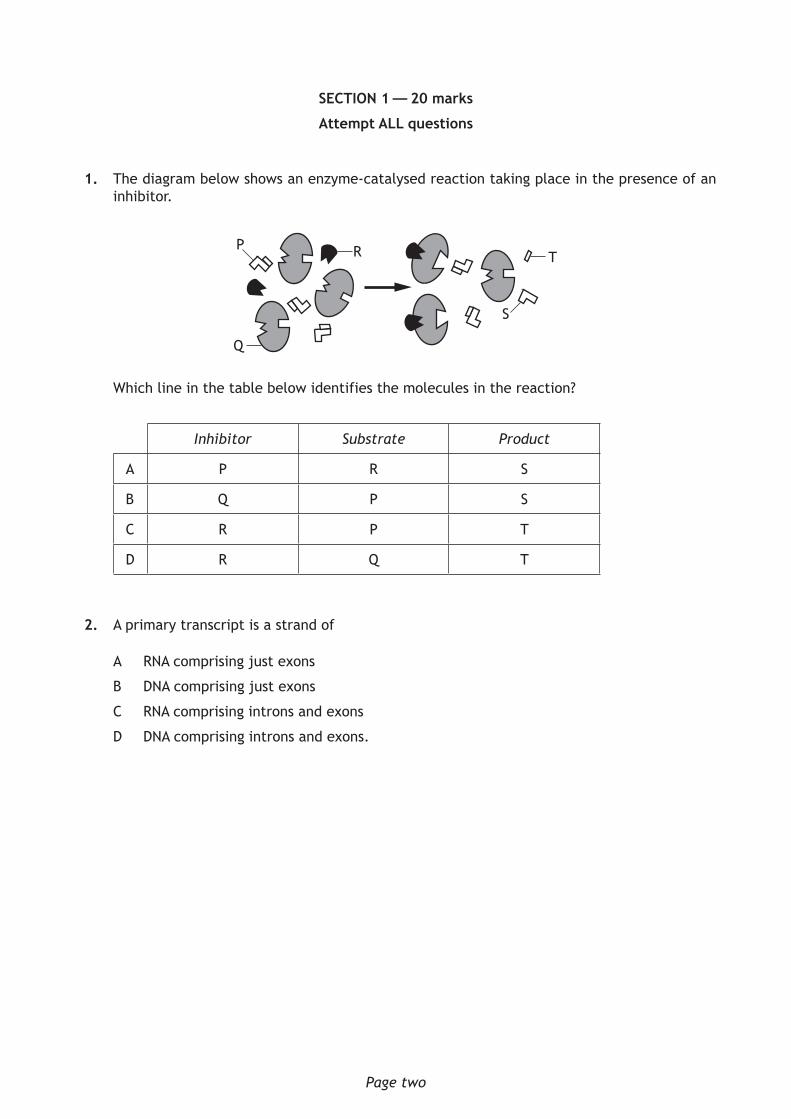
3. The diagram below can be used to identify amino acids coded for by mRNA codons.
amino acid
Arginine
Serine
Lysine
Aspa
ragine
Thre
onin
e
Met
hion
ine
Isol
euci
ne
Leucine
Proline
Histidine
Glutam
ine
Arginine
3rd base OF CODON
2nd base OF CODON
1st base OF CODON
GA
CU
GA
CU
GA
C U G A C U G A C U G A CU
GA
CU
GA
CU
G
G
A
A C
AC
C
U
U
How many different amino acids are coded for by the following mRNA strand?
A U G C C A A C U C C U A G A C G A A U A
A 4
B 5
C 6
D 7
[Turn over
Page four
4. The following are descriptions of three single gene mutations.
Description 1: exon-intron codons are created or destroyed
Description 2: one amino acid codon is replaced with another
Description 3: one amino acid codon is replaced with a stop codon
Which line in the table below matches the descriptions with the correct gene mutation?
Gene mutation
Missense Nonsense Splice site
A 1 2 3
B 1 3 2
C 2 1 3
D 2 3 1
5. DNA profiling may be used in criminal investigations.
During this procedure DNA is cut into fragments by two different enzymes. Each enzyme cuts DNA at a specific point.
Enzyme 1 cut site
DNA strand
Enzyme 2 cut site
Which line in the table below gives the correct number of DNA fragments produced from this DNA strand?
Number of fragments produced using
enzyme 1 only enzyme 2 only enzymes 1 and 2
A 2 3 5
B 2 3 6
C 3 4 7
D 3 4 6
Page five
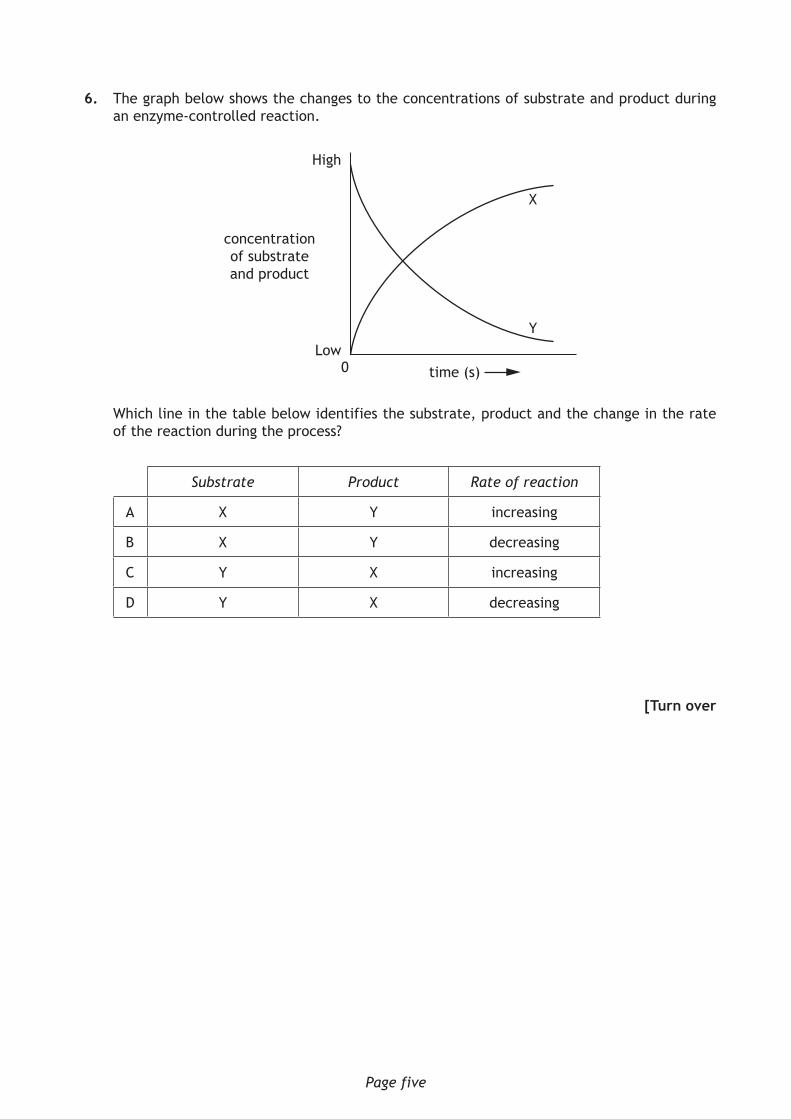
6. The graph below shows the changes to the concentrations of substrate and product during an enzyme-controlled reaction.
concentration of substrate and product
time (s)
High
0
X
Y
Low
Which line in the table below identifies the substrate, product and the change in the rate of the reaction during the process?
Substrate Product Rate of reaction
A X Y increasing
B X Y decreasing
C Y X increasing
D Y X decreasing
[Turn over
Page six
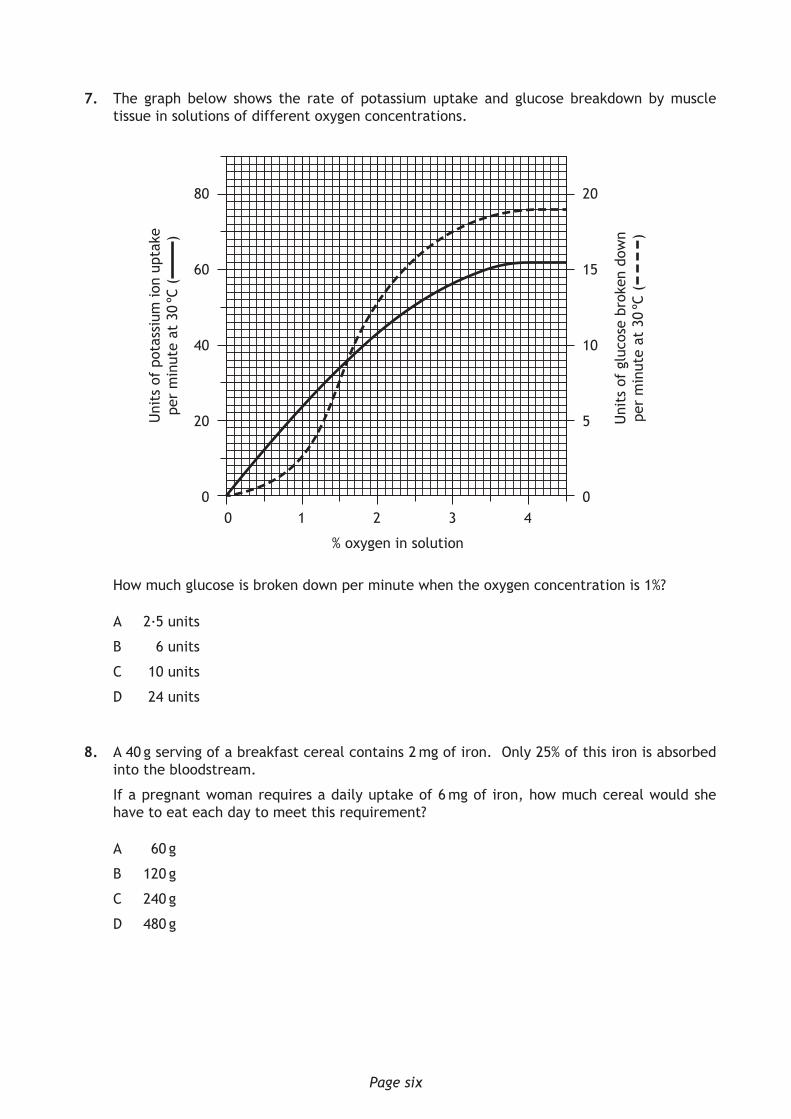
7. The graph below shows the rate of potassium uptake and glucose breakdown by muscle tissue in solutions of different oxygen concentrations.
80
60
40
20
0 0 1 2 3 4
% oxygen in solution
Uni
ts o
f po
tass
ium
ion
upta
ke
per
min
ute
at 3
0 ºC
()
Uni
ts o
f gl
ucos
e br
oken
dow
n pe
r m
inut
e at
30
ºC (
)
20
15
10
5
0
How much glucose is broken down per minute when the oxygen concentration is 1%?
A 2·5 units
B 6 units
C 10 units
D 24 units
8. A 40 g serving of a breakfast cereal contains 2 mg of iron. Only 25% of this iron is absorbed into the bloodstream.
If a pregnant woman requires a daily uptake of 6 mg of iron, how much cereal would she have to eat each day to meet this requirement?
A 60 g
B 120 g
C 240 g
D 480 g
Page seven
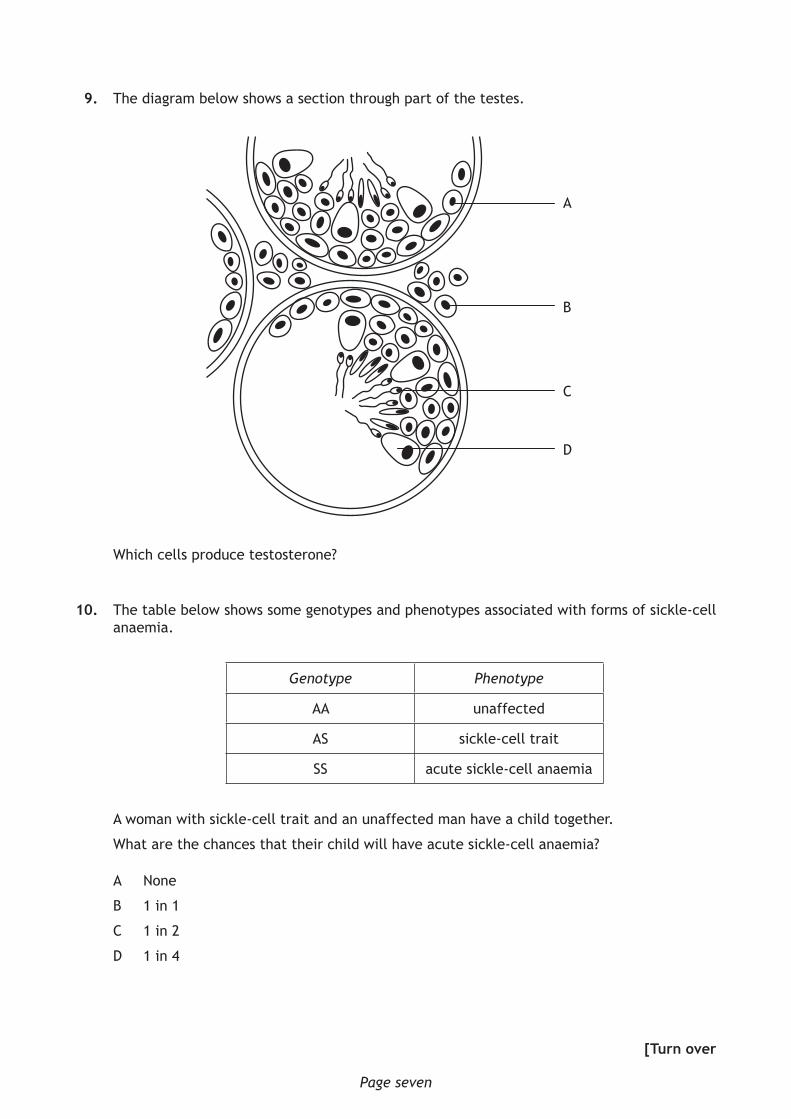
9. The diagram below shows a section through part of the testes.
A
B
C
D
Which cells produce testosterone?
10. The table below shows some genotypes and phenotypes associated with forms of sickle-cell anaemia.
Genotype Phenotype
AA unaffected
AS sickle-cell trait
SS acute sickle-cell anaemia
A woman with sickle-cell trait and an unaffected man have a child together.
What are the chances that their child will have acute sickle-cell anaemia?
A None
B 1 in 1
C 1 in 2
D 1 in 4
[Turn over
Page eight
11. The events leading to formation of a blood clot are listed below.
1. Clotting factors are released.2. An insoluble meshwork forms.3. Fibrinogen is converted to fibrin.4. Prothrombin is converted to thrombin.
The correct sequence of these events is
A 4, 2, 3, 1
B 1, 4, 3, 2
C 1, 3, 4, 2
D 4, 3, 1, 2
12. Which of the following statements describes the role of lipoprotein in the transport and elimination of excess cholesterol?
A Low density lipoprotein transports excess cholesterol from the liver to the body cells.
B Low density lipoprotein transports excess cholesterol from the body cells to the liver.
C High density lipoprotein transports excess cholesterol from the liver to the body cells.
D High density lipoprotein transports excess cholesterol from the body cells to the liver.
13. Which of the following describes typical features of Type 1 diabetes?
Feature of Type 1 diabetes
A occurs in childhood cells unable to produce insulin
B develops later in life cells unable to produce insulin
C occurs in childhood cells less sensitive to insulin
D develops later in life cells less sensitive to insulin
Page nine
14. The following are types of neural pathways.
1. Diverging2. Converging3. Reverberating
Which of these pathways involve nerve impulses being sent back through a circuit of neurons?
A 3 only
B 1 and 2 only
C 1 and 3 only
D 1, 2 and 3
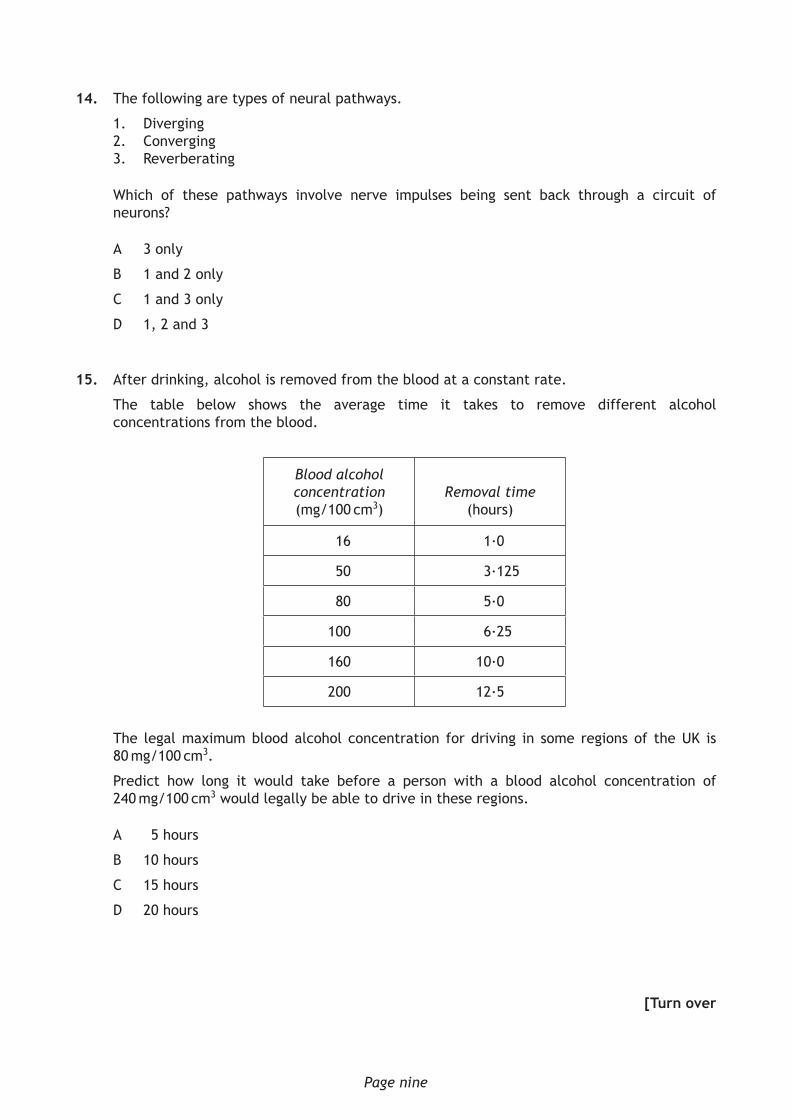
15. After drinking, alcohol is removed from the blood at a constant rate.
The table below shows the average time it takes to remove different alcohol concentrations from the blood.
Blood alcohol concentration (mg/100 cm3)
Removal time
(hours)
16 1·0
50 3·125
80 5·0
100 6·25
160 10·0
200 12·5
The legal maximum blood alcohol concentration for driving in some regions of the UK is 80 mg/100 cm3.
Predict how long it would take before a person with a blood alcohol concentration of 240 mg/100 cm3 would legally be able to drive in these regions.
A 5 hours
B 10 hours
C 15 hours
D 20 hours
[Turn over
Page ten
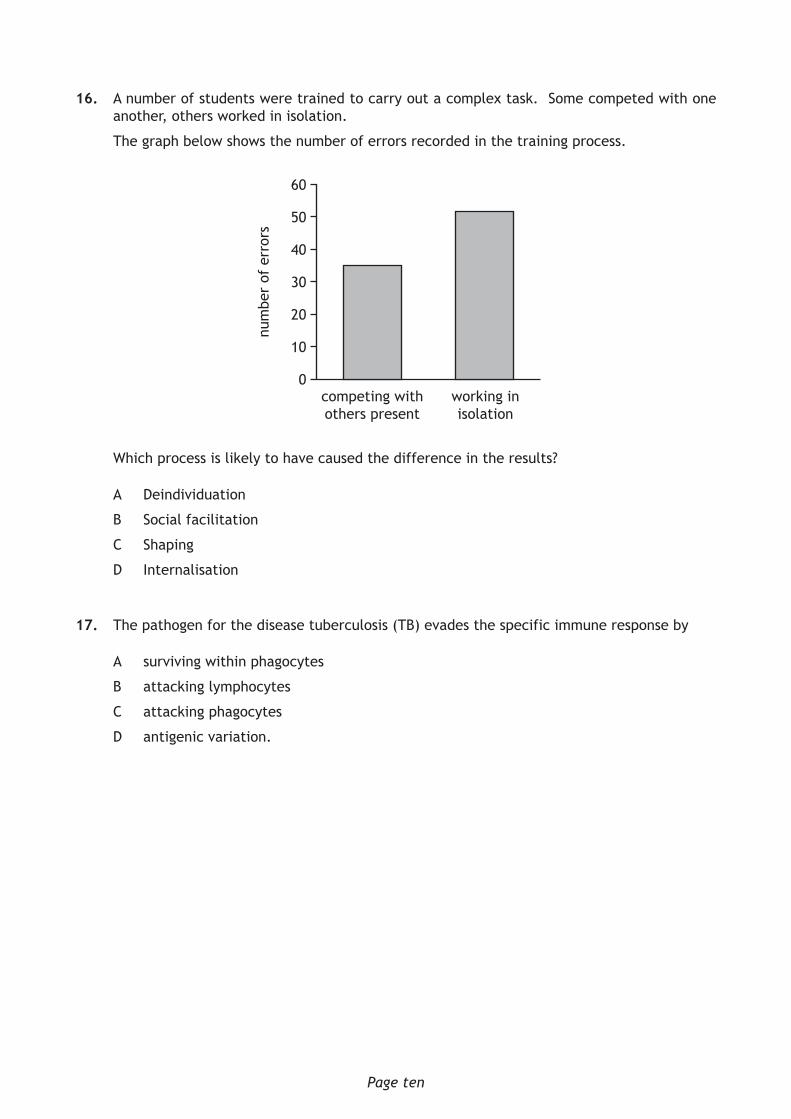
16. A number of students were trained to carry out a complex task. Some competed with one another, others worked in isolation.
The graph below shows the number of errors recorded in the training process.
60
50
40
30
20
10
0
num
ber
of e
rror
s
competing with others present
working in isolation
Which process is likely to have caused the difference in the results?
A Deindividuation
B Social facilitation
C Shaping
D Internalisation
17. The pathogen for the disease tuberculosis (TB) evades the specific immune response by
A surviving within phagocytes
B attacking lymphocytes
C attacking phagocytes
D antigenic variation.
Page eleven
18. The graph below shows the average growth rate of body organs in males.
0
100
90
80
70
60
50
40
30
20
10
05 10
Age in years
brain
reproductive organs
skeleton
Perc
enta
ge o
f to
tal g
row
th f
rom
bir
th
15
What is the ratio of total growth of brain to skeleton in an 8 year old child?
A 11 : 3
B 3 : 11
C 19 : 11
D 11 : 19
19. Failure in regulation of the immune system leading to an autoimmune disease is caused by a
A B lymphocyte immune response to self antigens.
B T lymphocyte immune response to self antigens.
C B lymphocyte immune response to foreign antigens.
D T lymphocyte immune response to foreign antigens.
[Turn over for Question 20 on Page twelve
Page twelve
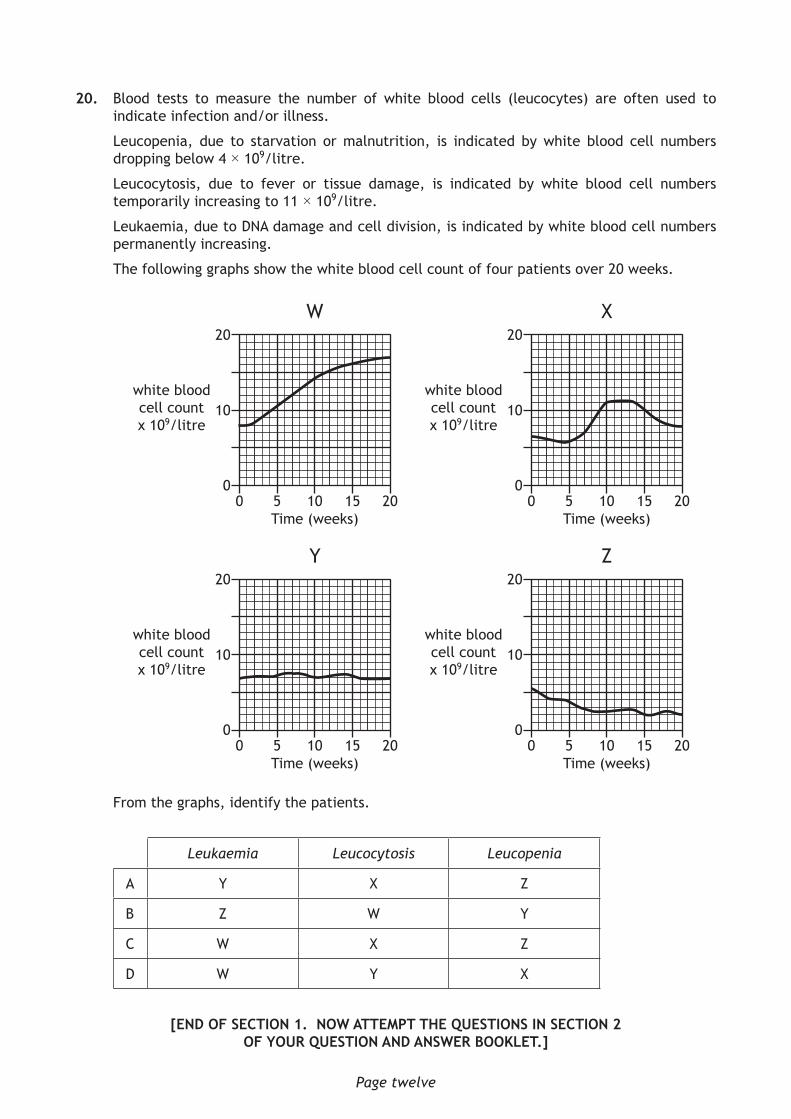
20. Blood tests to measure the number of white blood cells (leucocytes) are often used to indicate infection and/or illness.
Leucopenia, due to starvation or malnutrition, is indicated by white blood cell numbers dropping below 4 × 10⁹/litre.
Leucocytosis, due to fever or tissue damage, is indicated by white blood cell numbers temporarily increasing to 11 × 109/litre.
Leukaemia, due to DNA damage and cell division, is indicated by white blood cell numbers permanently increasing.
The following graphs show the white blood cell count of four patients over 20 weeks.
20
10
00 5 10
Time (weeks)
white bloodcell countx 109/litre
W
15 20
20
10
00 5 10
Time (weeks)
white bloodcell countx 109/litre
X
15 20
20
10
00 5 10
Time (weeks)
white bloodcell countx 109/litre
Y
15 20
20
10
00 5 10
Time (weeks)
white bloodcell countx 109/litre
Z
15 20
From the graphs, identify the patients.
Leukaemia Leucocytosis Leucopenia
A Y X Z
B Z W Y
C W X Z
D W Y X
[END OF SECTION 1. NOW ATTEMPT THE QUESTIONS IN SECTION 2 OF YOUR QUESTION AND ANSWER BOOKLET.]
*X740760101*
FOR OFFICIAL USE
Fill in these boxes and read what is printed below.
Instructions for completion of Section 1 are given on Page two.
SECTION 2 — 80 marks
Attempt ALL questions.
Write your answers clearly in the spaces provided in this booklet. Additional space for answers and rough work is provided at the end of this booklet. If you use this space you must clearly identify the question number you are attempting. Any rough work must be written in this booklet. You should score through your rough work when you have written your final copy.
Use blue or black ink.
Before leaving the examination room you must give this booklet to the Invigilator; if you do not, you may lose all the marks for this paper.
Human Biology Section 1 — Answer Grid
and Section 2
*X7407601*
X740/76/01
WEDNESDAY, 13 MAY
1:00 PM – 3:30 PM
HTP
*X740760102*Page two
SECTION 1 — 20 marks
The questions for Section 1 are contained in the question paper X740/76/02.Read these and record your answers on the answer grid on Page three opposite.Use blue or black ink. Do NOT use gel pens or pencil.
1. The answer to each question is either A, B, C or D. Decide what your answer is, then fill in the appropriate bubble (see sample question below).
2. There is only one correct answer to each question.
3. Any rough working should be done on the additional space for answers and rough work at the end of this booklet.
Sample Question
The digestive enzyme pepsin is most active in the
A mouth
B stomach
C duodenum
D pancreas.
The correct answer is B—stomach. The answer B bubble has been clearly filled in (see below).
A B C D
Changing an answer
If you decide to change your answer, cancel your first answer by putting a cross through it (see below) and fill in the answer you want. The answer below has been changed to D.
A B C D
If you then decide to change back to an answer you have already scored out, put a tick (3) to the right of the answer you want, as shown below:
A B C D
or
A B C D
*X740760103*
SECTION 1 — Answer Grid
*OBJ20AD1*
A B C D
1
2
3
4
5
6
7
8
9
10
11
12
13
14
15
16
17
18
19
20
Page three
*X740760104*
[BLANK PAGE]
DO NOT WRITE ON THIS PAGE
Page four
*X740760105*Page five
[Turn over for Section 2 on Page six
DO NOT WRITE ON THIS PAGE
*X740760106*
MARKS DO NOT WRITE IN
THIS MARGIN
Page six
SECTION 2 — 80 marks
Attempt ALL questions
Note that Question 14 contains a choice
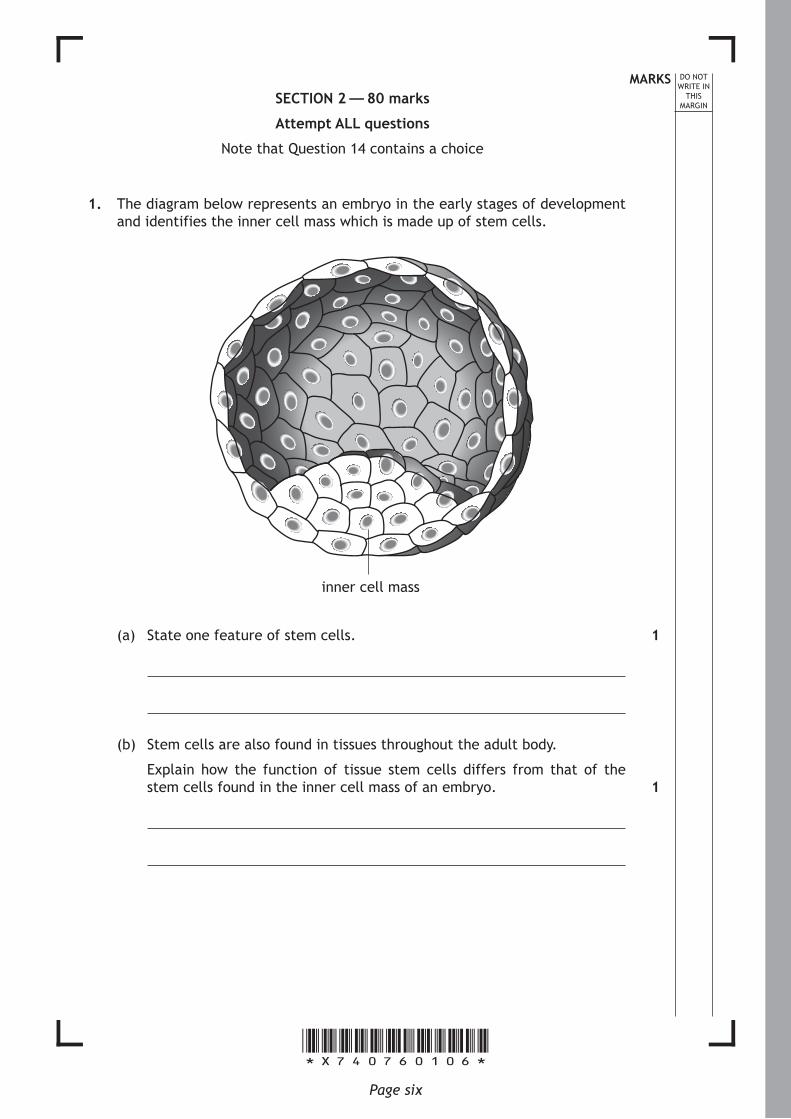
1. The diagram below represents an embryo in the early stages of development and identifies the inner cell mass which is made up of stem cells.
inner cell mass
(a) State one feature of stem cells.
(b) Stem cells are also found in tissues throughout the adult body.
Explain how the function of tissue stem cells differs from that of the stem cells found in the inner cell mass of an embryo.
1
1
*X740760107*
MARKS DO NOT WRITE IN
THIS MARGIN
Page seven
1. (continued)
(c) Stem cells have uses in both therapy and research.
(i) It has been proposed that tissue cells could be used to repair severely damaged muscle tissue.
Suggest how this might be done.
(ii) State how stem cells can be used as model cells in medical research.
[Turn over
1
1
*X740760108*
MARKS DO NOT WRITE IN
THIS MARGIN
Page eight
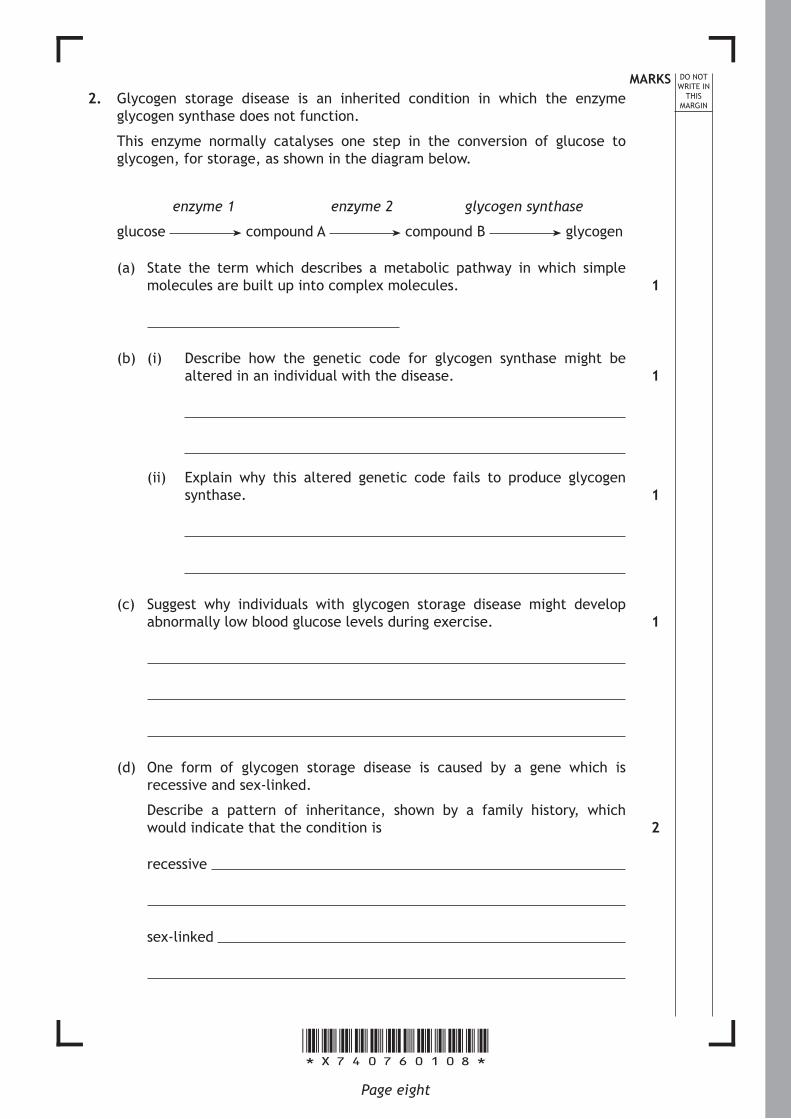
2. Glycogen storage disease is an inherited condition in which the enzyme glycogen synthase does not function.
This enzyme normally catalyses one step in the conversion of glucose to glycogen, for storage, as shown in the diagram below.
enzyme 1 enzyme 2 glycogen synthase
glucose compound A compound B glycogen
(a) State the term which describes a metabolic pathway in which simple molecules are built up into complex molecules.
(b) (i) Describe how the genetic code for glycogen synthase might be altered in an individual with the disease.
(ii) Explain why this altered genetic code fails to produce glycogen synthase.
(c) Suggest why individuals with glycogen storage disease might develop abnormally low blood glucose levels during exercise.
(d) One form of glycogen storage disease is caused by a gene which is recessive and sex-linked.
Describe a pattern of inheritance, shown by a family history, which would indicate that the condition is
recessive
sex-linked
1
1
1
1
2
*X740760109*
MARKS DO NOT WRITE IN
THIS MARGIN
Page nine
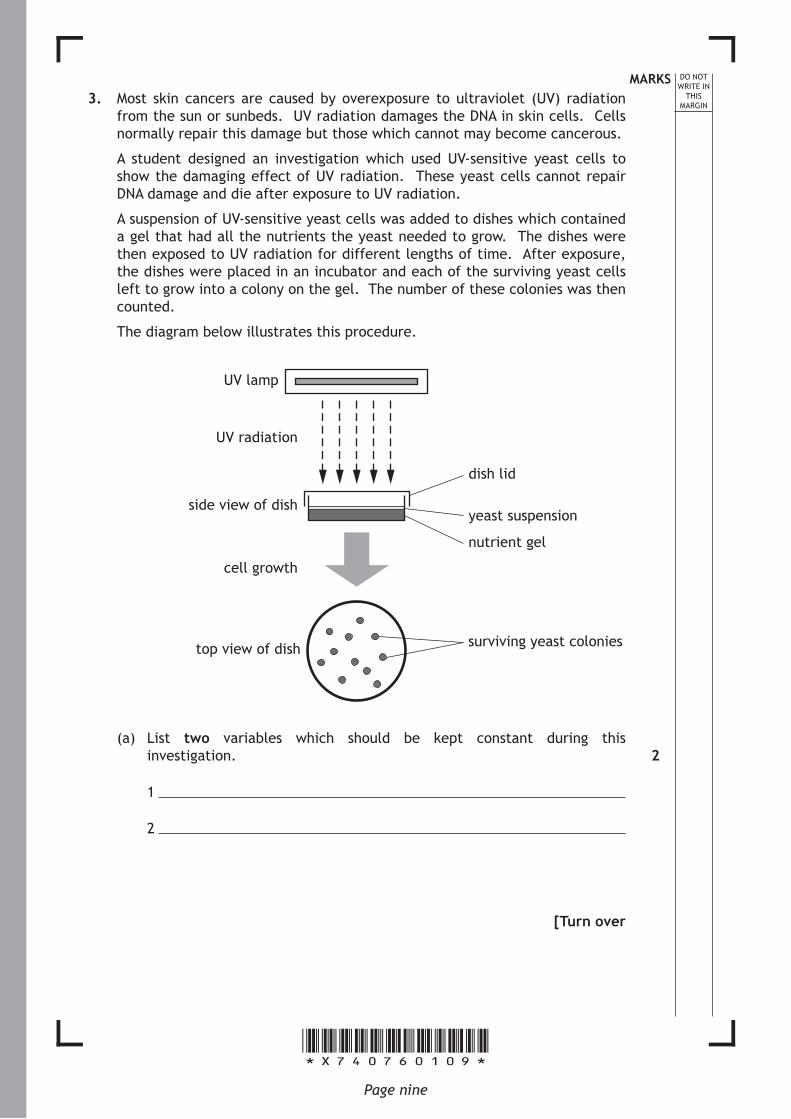
3. Most skin cancers are caused by overexposure to ultraviolet (UV) radiation from the sun or sunbeds. UV radiation damages the DNA in skin cells. Cells normally repair this damage but those which cannot may become cancerous.
A student designed an investigation which used UV-sensitive yeast cells to show the damaging effect of UV radiation. These yeast cells cannot repair DNA damage and die after exposure to UV radiation.
A suspension of UV-sensitive yeast cells was added to dishes which contained a gel that had all the nutrients the yeast needed to grow. The dishes were then exposed to UV radiation for different lengths of time. After exposure, the dishes were placed in an incubator and each of the surviving yeast cells left to grow into a colony on the gel. The number of these colonies was then counted.
The diagram below illustrates this procedure.
UV lamp
UV radiation
side view of dish
dish lid
yeast suspension
nutrient gel
surviving yeast colonies
cell growth
top view of dish
(a) List two variables which should be kept constant during this investigation.
1
2
[Turn over
2
*X740760110*
MARKS DO NOT WRITE IN
THIS MARGIN
Page ten
3. (continued)
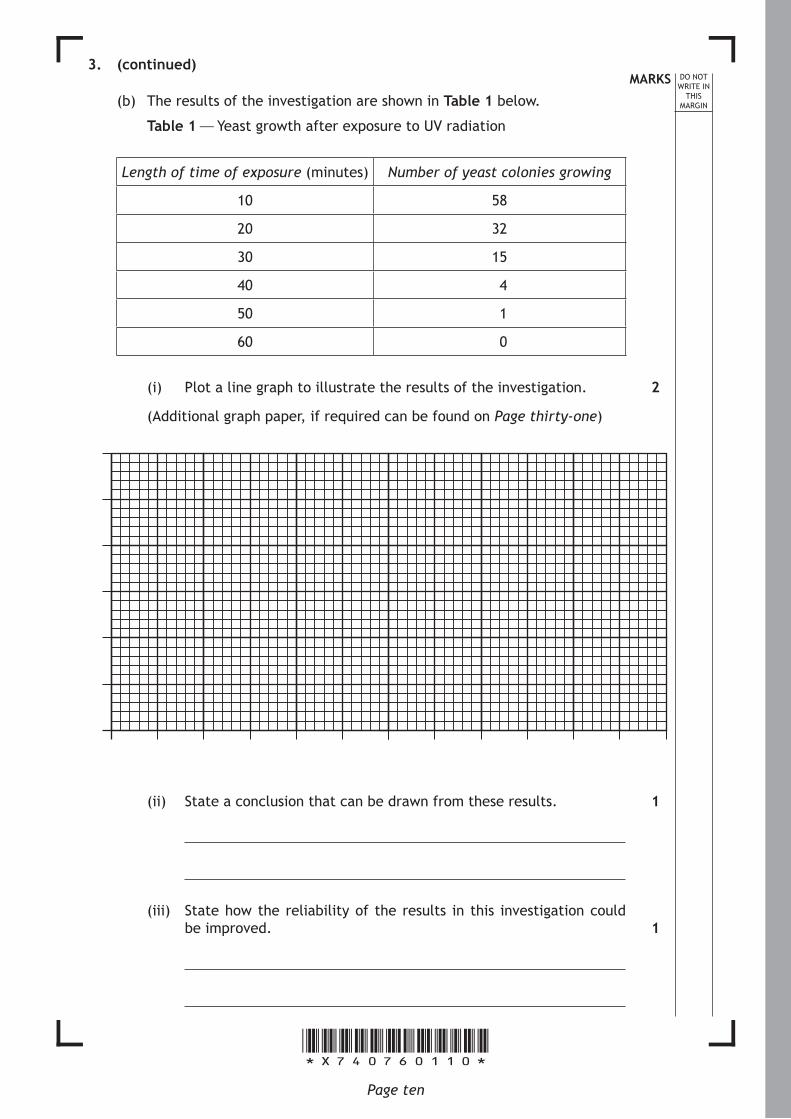
(b) The results of the investigation are shown in Table 1 below.
Table 1 — Yeast growth after exposure to UV radiation
Length of time of exposure (minutes) Number of yeast colonies growing
10 58
20 32
30 15
40 4
50 1
60 0
(i) Plot a line graph to illustrate the results of the investigation.
(Additional graph paper, if required can be found on Page thirty-one)
(ii) State a conclusion that can be drawn from these results.
(iii) State how the reliability of the results in this investigation could be improved.
2
1
1
*X740760111*
MARKS DO NOT WRITE IN
THIS MARGIN
Page eleven
3. (continued)
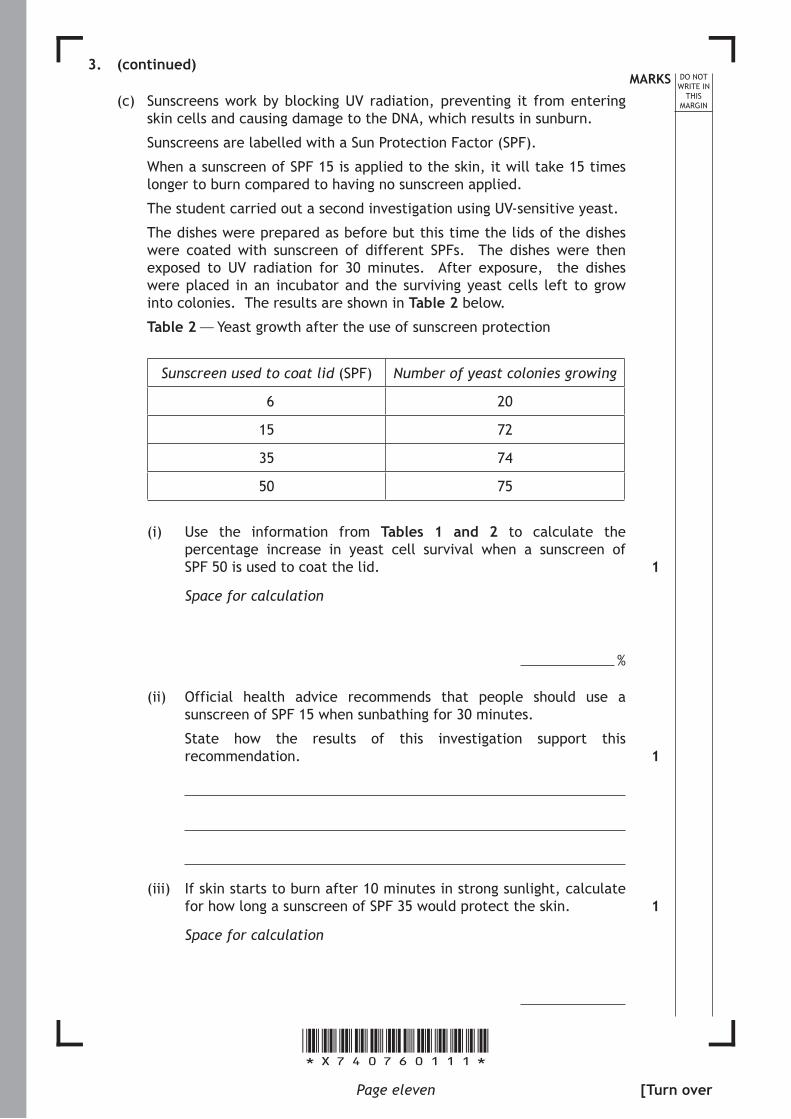
(c) Sunscreens work by blocking UV radiation, preventing it from entering skin cells and causing damage to the DNA, which results in sunburn.
Sunscreens are labelled with a Sun Protection Factor (SPF).
When a sunscreen of SPF 15 is applied to the skin, it will take 15 times longer to burn compared to having no sunscreen applied.
The student carried out a second investigation using UV-sensitive yeast.
The dishes were prepared as before but this time the lids of the dishes were coated with sunscreen of different SPFs. The dishes were then exposed to UV radiation for 30 minutes. After exposure, the dishes were placed in an incubator and the surviving yeast cells left to grow into colonies. The results are shown in Table 2 below.
Table 2 — Yeast growth after the use of sunscreen protection
Sunscreen used to coat lid (SPF) Number of yeast colonies growing
6 20
15 72
35 74
50 75
(i) Use the information from Tables 1 and 2 to calculate the percentage increase in yeast cell survival when a sunscreen of SPF 50 is used to coat the lid.
Space for calculation
%
(ii) Official health advice recommends that people should use a sunscreen of SPF 15 when sunbathing for 30 minutes.
State how the results of this investigation support this recommendation.
(iii) If skin starts to burn after 10 minutes in strong sunlight, calculate for how long a sunscreen of SPF 35 would protect the skin.
Space for calculation
1
1
1
[Turn over
*X740760112*
MARKS DO NOT WRITE IN
THIS MARGIN
Page twelve
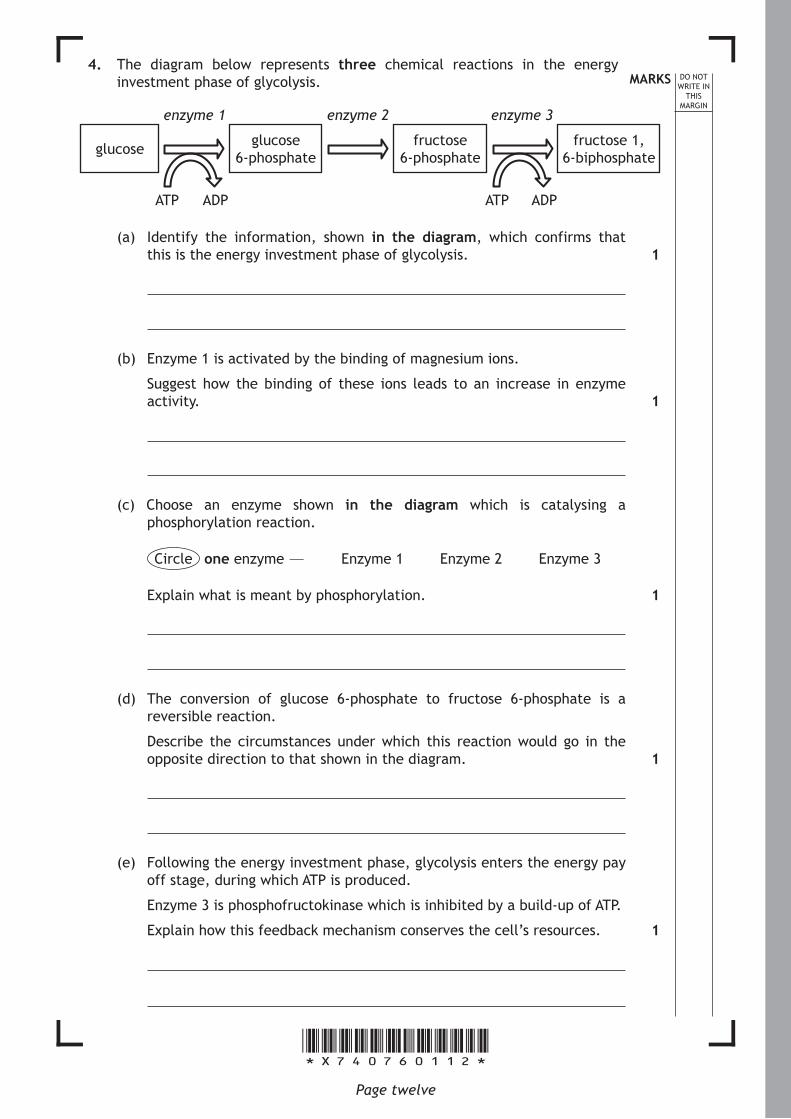
4. The diagram below represents three chemical reactions in the energy investment phase of glycolysis.
fructose 1, 6-biphosphate
fructose 6-phosphate
glucose 6-phosphateglucose
ATP ATPADP ADP
enzyme 1 enzyme 2 enzyme 3
(a) Identify the information, shown in the diagram, which confirms that this is the energy investment phase of glycolysis.
(b) Enzyme 1 is activated by the binding of magnesium ions.
Suggest how the binding of these ions leads to an increase in enzyme activity.
(c) Choose an enzyme shown in the diagram which is catalysing a phosphorylation reaction.
Circle one enzyme — Enzyme 1 Enzyme 2 Enzyme 3
Explain what is meant by phosphorylation.
(d) The conversion of glucose 6-phosphate to fructose 6-phosphate is a reversible reaction.
Describe the circumstances under which this reaction would go in the opposite direction to that shown in the diagram.
(e) Following the energy investment phase, glycolysis enters the energy pay off stage, during which ATP is produced.
Enzyme 3 is phosphofructokinase which is inhibited by a build-up of ATP.
Explain how this feedback mechanism conserves the cell’s resources.
1
1
1
1
1
*X740760113*
MARKS DO NOT WRITE IN
THIS MARGIN
Page thirteen [Turn over
5. Muscle cells utilise a variety of energy systems during strenuous activity.
(a) Creatine phosphate is found in muscle cells.
(i) Describe how creatine phosphate supports strenuous muscle activity.
(ii) Explain why this support is not provided to strenuous activities beyond the first 10 seconds.
(b) Name the substance which builds up in muscle cells as they become fatigued.
(c) Choose a sporting activity and decide whether slow twitch or fast twitch muscle fibres would be best suited for the activity.
Sporting Activity
Slow twitch Fast twitch
Give reasons to justify your choice of muscle fibre.
2
1
1
3
*X740760114*
MARKS DO NOT WRITE IN
THIS MARGIN
Page fourteen
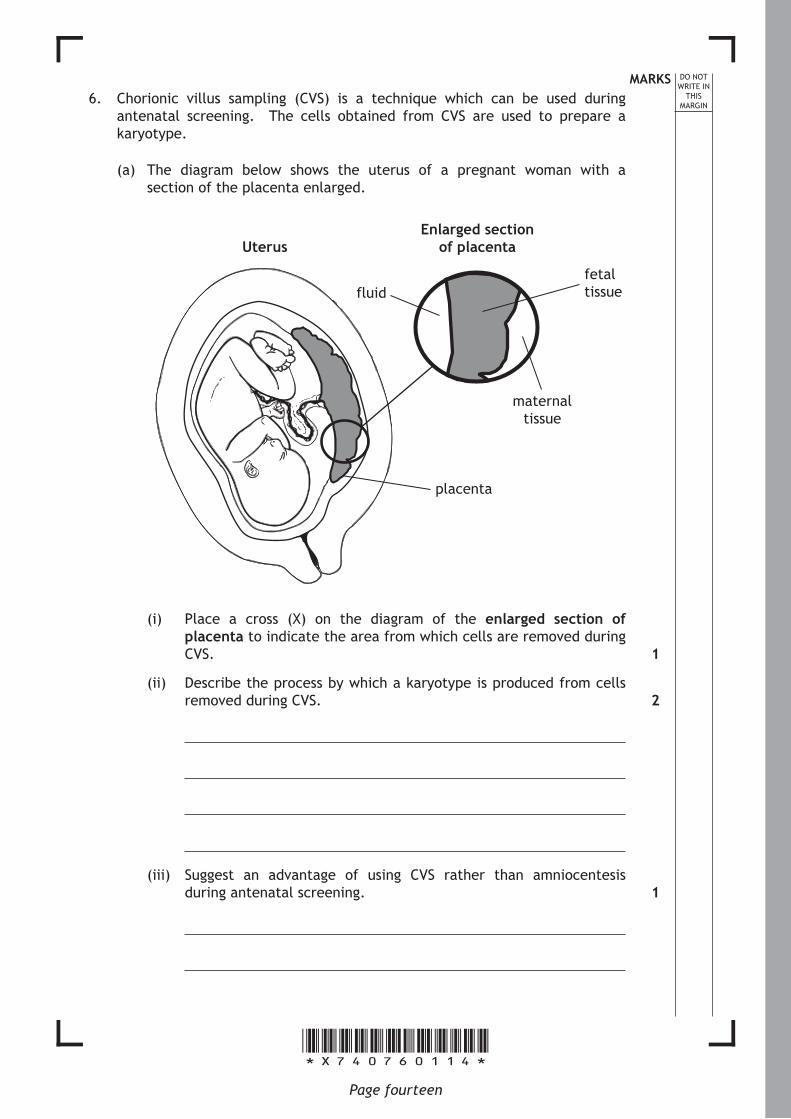
6. Chorionic villus sampling (CVS) is a technique which can be used during antenatal screening. The cells obtained from CVS are used to prepare a karyotype.
(a) The diagram below shows the uterus of a pregnant woman with a section of the placenta enlarged.
maternal tissue
Enlarged section of placentaUterus
placenta
fluidfetal tissue
(i) Place a cross (X) on the diagram of the enlarged section of placenta to indicate the area from which cells are removed during CVS.
(ii) Describe the process by which a karyotype is produced from cells removed during CVS.
(iii) Suggest an advantage of using CVS rather than amniocentesis during antenatal screening.
1
2
1
*X740760115*
MARKS DO NOT WRITE IN
THIS MARGIN
Page fifteen
6. (continued)
(b) Name the type of antenatal screening tests which are routinely carried out to monitor the concentration of certain substances, such as protein, in a pregnant woman’s blood.
[Turn over
1
*X740760116*
MARKS DO NOT WRITE IN
THIS MARGIN
Page sixteen
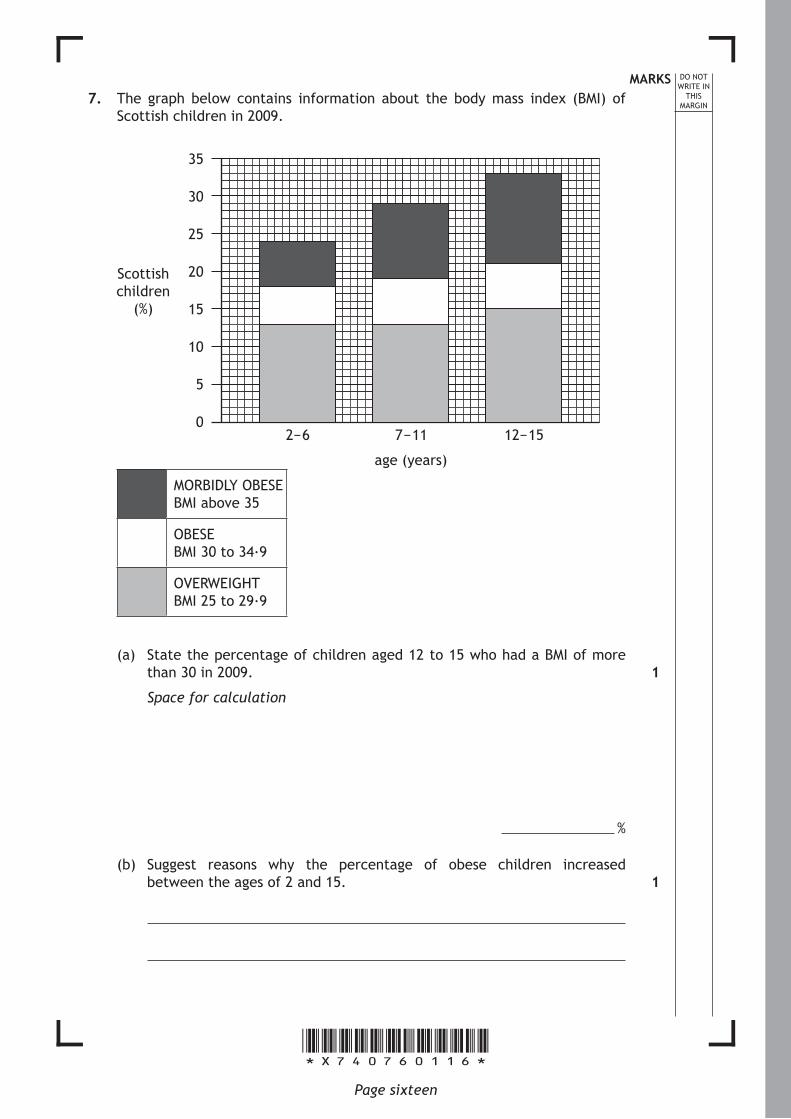
7. The graph below contains information about the body mass index (BMI) of Scottish children in 2009.
35
30
25
20
15
10
5
0
Scottish children
(%)
2−6 7−11 12−15
age (years)
MORBIDLY OBESE BMI above 35
OBESE BMI 30 to 34·9
OVERWEIGHT BMI 25 to 29·9
(a) State the percentage of children aged 12 to 15 who had a BMI of more than 30 in 2009.
Space for calculation
%
(b) Suggest reasons why the percentage of obese children increased between the ages of 2 and 15.
1
1
*X740760117*
MARKS DO NOT WRITE IN
THIS MARGIN
Page seventeen
7. (continued)
(c) Explain how BMI is calculated.
(d) Suggest how children could be encouraged to maintain a healthy BMI by use of the following processes.
Identification
Internalisation
[Turn over
1
2
*X740760118*Page eighteen
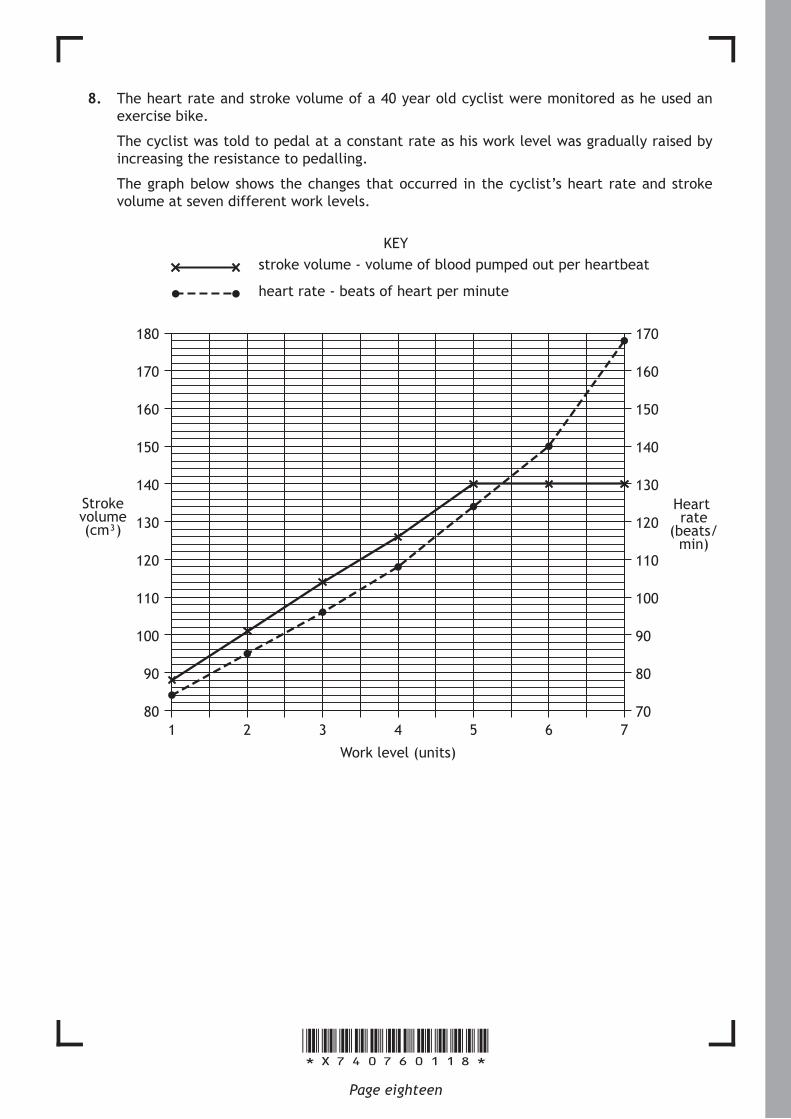
8. The heart rate and stroke volume of a 40 year old cyclist were monitored as he used an exercise bike.
The cyclist was told to pedal at a constant rate as his work level was gradually raised by increasing the resistance to pedalling.
The graph below shows the changes that occurred in the cyclist’s heart rate and stroke volume at seven different work levels.
180
170
160
150
140
130
120
110
100
90
80
170
160
150
140
130
120
110
100
90
80
70
Heart rate
(beats/min)
Strokevolume(cm³)
Work level (units)
1 2 3 4 5 6 7
stroke volume - volume of blood pumped out per heartbeat
heart rate - beats of heart per minute
KEY
*X740760119*
MARKS DO NOT WRITE IN
THIS MARGIN
Page nineteen
8. (continued)
(a) Use data from the graph to describe the changes that occurred in the cyclist’s stroke volume when the work level increased from 1 to 7 units.
(b) State what the cyclist’s heart rate was when his stroke volume was 120 cm3.
Space for calculation
beats/min
(c) Cardiac output is the volume of blood leaving the heart in one minute. It is calculated using the formula shown below.
cardiac output = heart rate × stroke volume
Calculate the cyclist’s cardiac output when his work level was 6 units.
Space for calculation
cm3/min
[Turn over
2
1
1
*X740760120*
MARKS DO NOT WRITE IN
THIS MARGIN
8. (continued)
(d) The table below shows the recommended minimum heart rates that cyclists of different ages should maintain in order to either metabolise fat or improve their fitness.
Age
Minimum heart rate for metabolising fat
(beats/min)
Minimum heart rate for improving fitness
(beats/min)
10 136 168
20 130 160
30 123 152
40 116 144
50 110 136
60 104 128
(i) Use information from the table and the graph to determine the work level that the cyclist should maintain in order to metabolise fat.
units
(ii) Use information from the table to predict the minimum heart rate for improving the fitness of a 70 year old.
(iii) As an individual gets older, their minimum heart rate for improving fitness decreases.
Use the information from the table to calculate the percentage decrease that occurs between the ages of 10 and 60 years.
Space for calculation
%
1
1
1
Page twenty
*X740760121*
MARKS DO NOT WRITE IN
THIS MARGIN
Page twenty-one
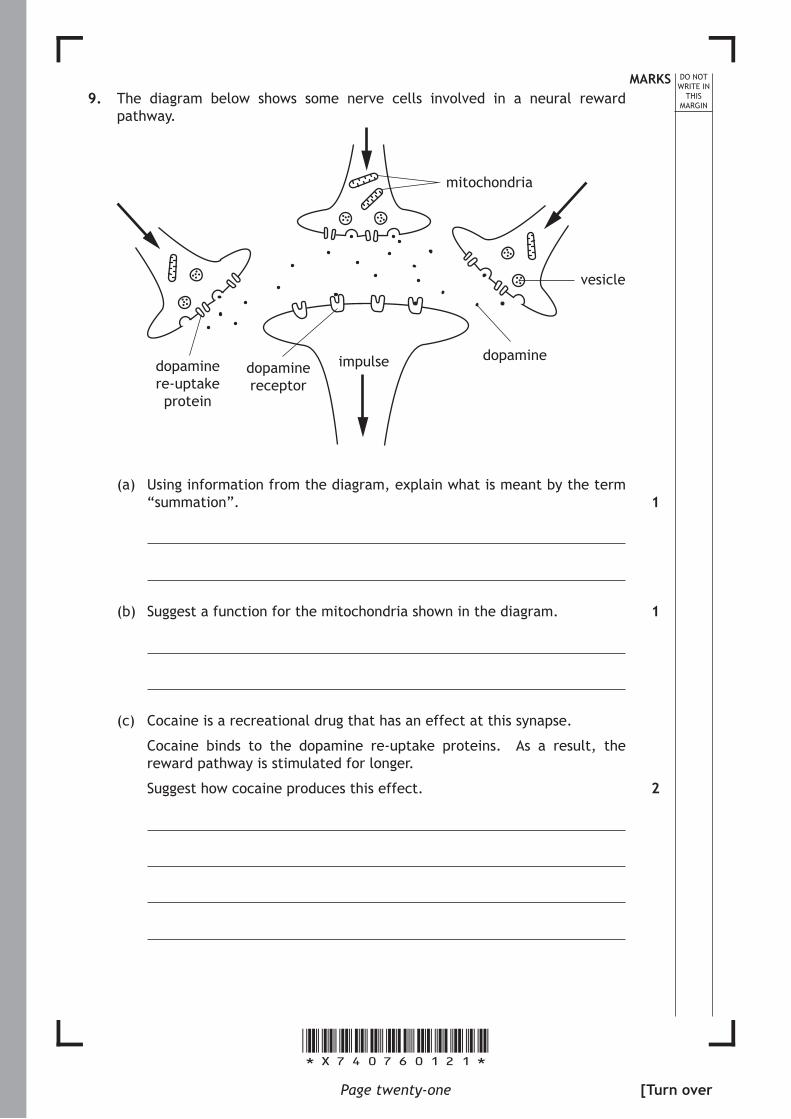
9. The diagram below shows some nerve cells involved in a neural reward pathway.
vesicle
mitochondria
dopamineimpulsedopamine receptor
dopamine re-uptake protein
(a) Using information from the diagram, explain what is meant by the term “summation”.
(b) Suggest a function for the mitochondria shown in the diagram.
(c) Cocaine is a recreational drug that has an effect at this synapse.
Cocaine binds to the dopamine re-uptake proteins. As a result, the reward pathway is stimulated for longer.
Suggest how cocaine produces this effect.
1
1
2
[Turn over
*X740760122*
MARKS DO NOT WRITE IN
THIS MARGIN
Page twenty-two
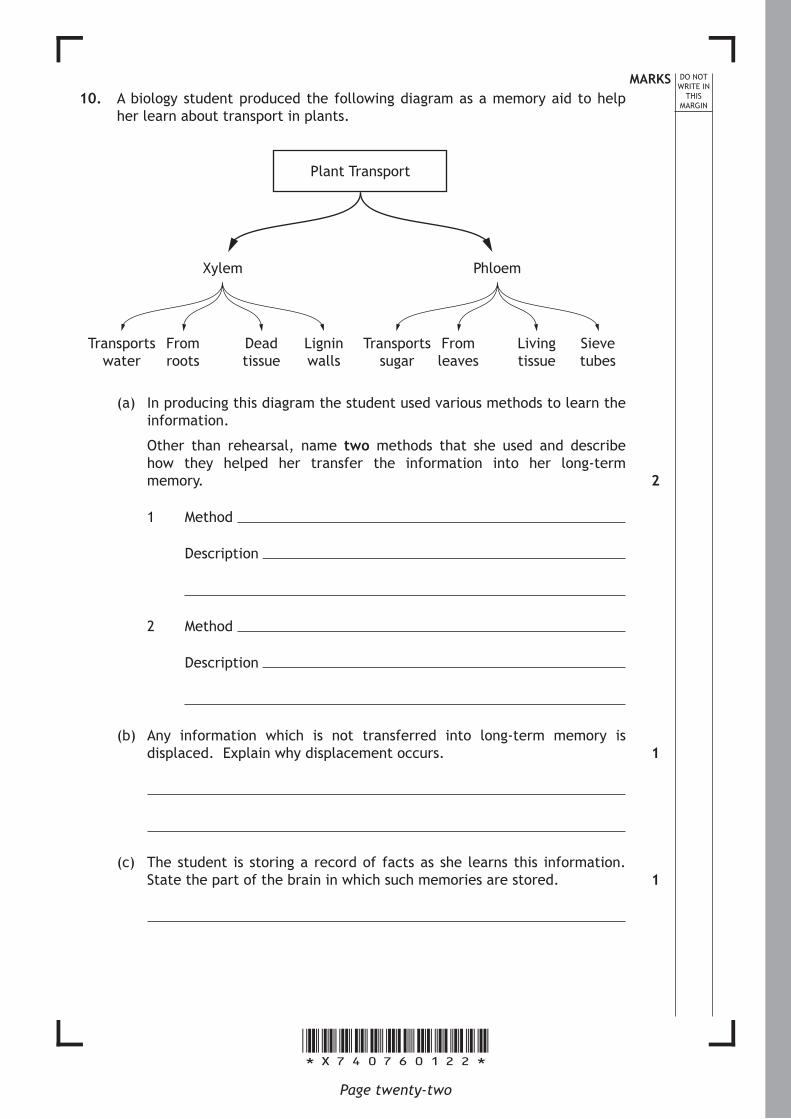
10. A biology student produced the following diagram as a memory aid to help her learn about transport in plants.
Plant Transport
Xylem Phloem
Transports From Dead Lignin Transports From Living Sieve water roots tissue walls sugar leaves tissue tubes
(a) In producing this diagram the student used various methods to learn the information.
Other than rehearsal, name two methods that she used and describe how they helped her transfer the information into her long-term memory.
1 Method
Description
2 Method
Description
(b) Any information which is not transferred into long-term memory is displaced. Explain why displacement occurs.
(c) The student is storing a record of facts as she learns this information. State the part of the brain in which such memories are stored.
2
1
1
*X740760123*
MARKS DO NOT WRITE IN
THIS MARGIN
Page twenty-three
11. Various types of white blood cell are involved in the non-specific immune response.
(a) Describe the role of each of the following cells in the non-specific defence of the body.
(i) Mast cells
(ii) Natural killer (NK) cells
(b) Explain how the presence of phagocytes is important in the activation of T lymphocytes.
[Turn over
2
1
2
*X740760124*
MARKS DO NOT WRITE IN
THIS MARGIN
Page twenty-four
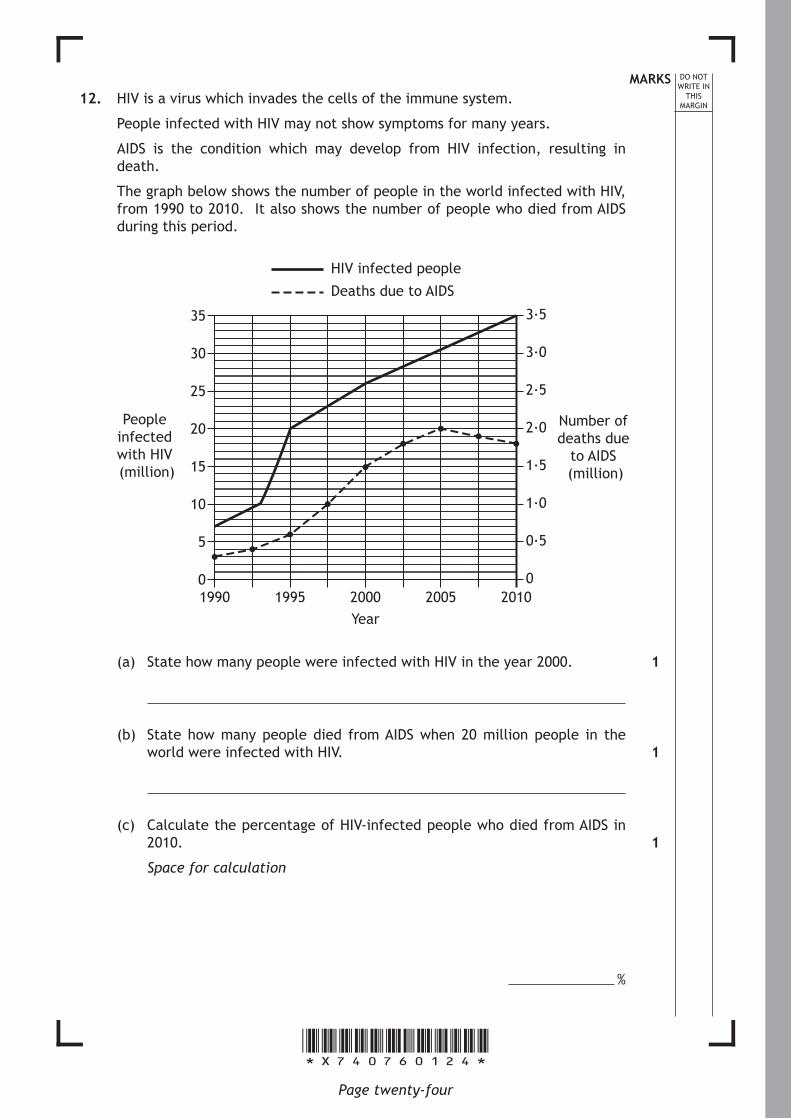
12. HIV is a virus which invades the cells of the immune system.
People infected with HIV may not show symptoms for many years.
AIDS is the condition which may develop from HIV infection, resulting in death.
The graph below shows the number of people in the world infected with HIV, from 1990 to 2010. It also shows the number of people who died from AIDS during this period.
HIV infected people
Deaths due to AIDS
1995 2000Year
2005 2010
35
30
25
20
15
10
5
0
3·5
3·0
2·5
2·0
1·5
1·0
0·5
0
People infected with HIV (million)
Number of deaths due
to AIDS (million)
1990
(a) State how many people were infected with HIV in the year 2000.
(b) State how many people died from AIDS when 20 million people in the world were infected with HIV.
(c) Calculate the percentage of HIV-infected people who died from AIDS in 2010.
Space for calculation
%
1
1
1
*X740760125*
MARKS DO NOT WRITE IN
THIS MARGIN
Page twenty-five
12. (continued)
(d) Describe the evidence from the graph which suggests that the rate of people becoming infected with HIV was greatest between 1993 and 1995.
[Turn over
1
*X740760126*
MARKS DO NOT WRITE IN
THIS MARGIN
Page twenty-six
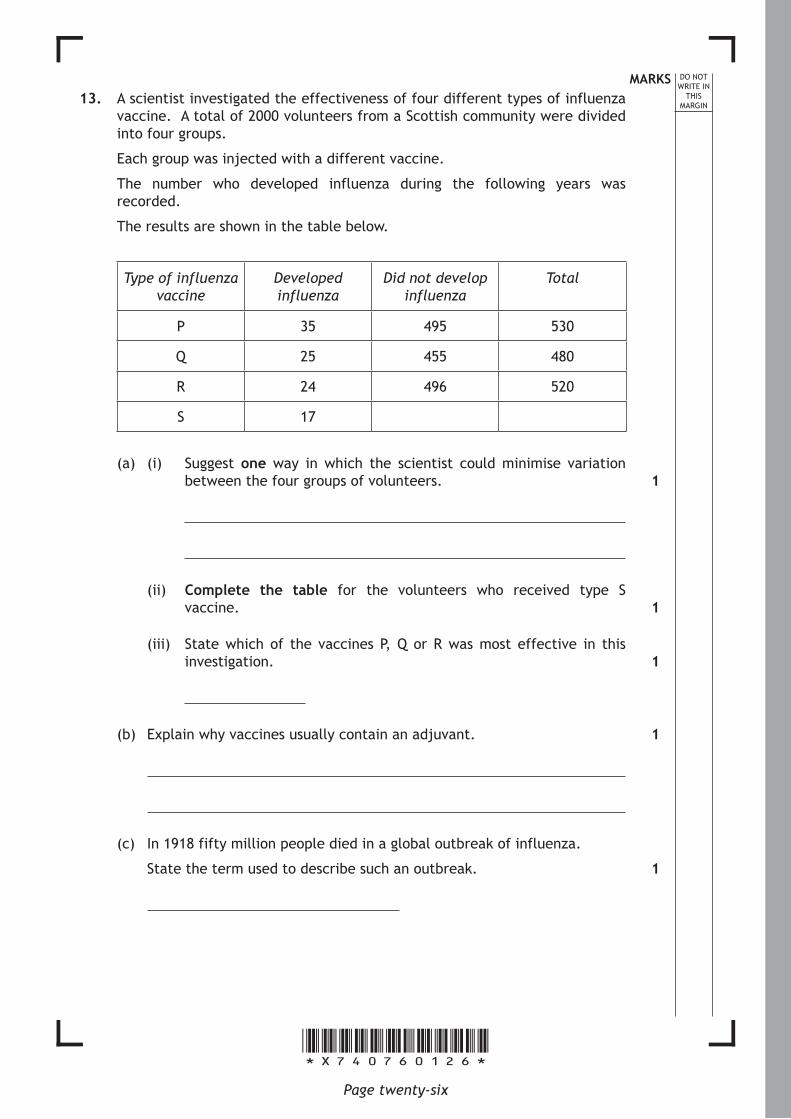
13. A scientist investigated the effectiveness of four different types of influenza vaccine. A total of 2000 volunteers from a Scottish community were divided into four groups.
Each group was injected with a different vaccine.
The number who developed influenza during the following years was recorded.
The results are shown in the table below.
Type of influenza vaccine
Developed influenza
Did not develop influenza
Total
P 35 495 530
Q 25 455 480
R 24 496 520
S 17
(a) (i) Suggest one way in which the scientist could minimise variation between the four groups of volunteers.
(ii) Complete the table for the volunteers who received type S vaccine.
(iii) State which of the vaccines P, Q or R was most effective in this investigation.
(b) Explain why vaccines usually contain an adjuvant.
(c) In 1918 fifty million people died in a global outbreak of influenza.
State the term used to describe such an outbreak.
1
1
1
1
1
*X740760127*
MARKS DO NOT WRITE IN
THIS MARGIN
Page twenty-seven
14. Answer either A or B in the space below.
Labelled diagrams may be used where appropriate.
A Describe hormonal control of the menstrual cycle under the following headings:
(i) events leading to ovulation;
(ii) events following ovulation.
OR
B Describe the cardiac cycle under the following headings:


![National Quali cations SPECIMEN ONLY - SQA · [END OF SPECIMEN QUESTION PAPER] Marking Instructions National Quali cations H SPECIMEN ONLY Mathematics Paper 2 ... •1 set up one](https://static.documents.pub/doc/80x56/5b076f8f7f8b9a79538dee1c/national-quali-cations-specimen-only-end-of-specimen-question-paper-marking-instructions.jpg)


