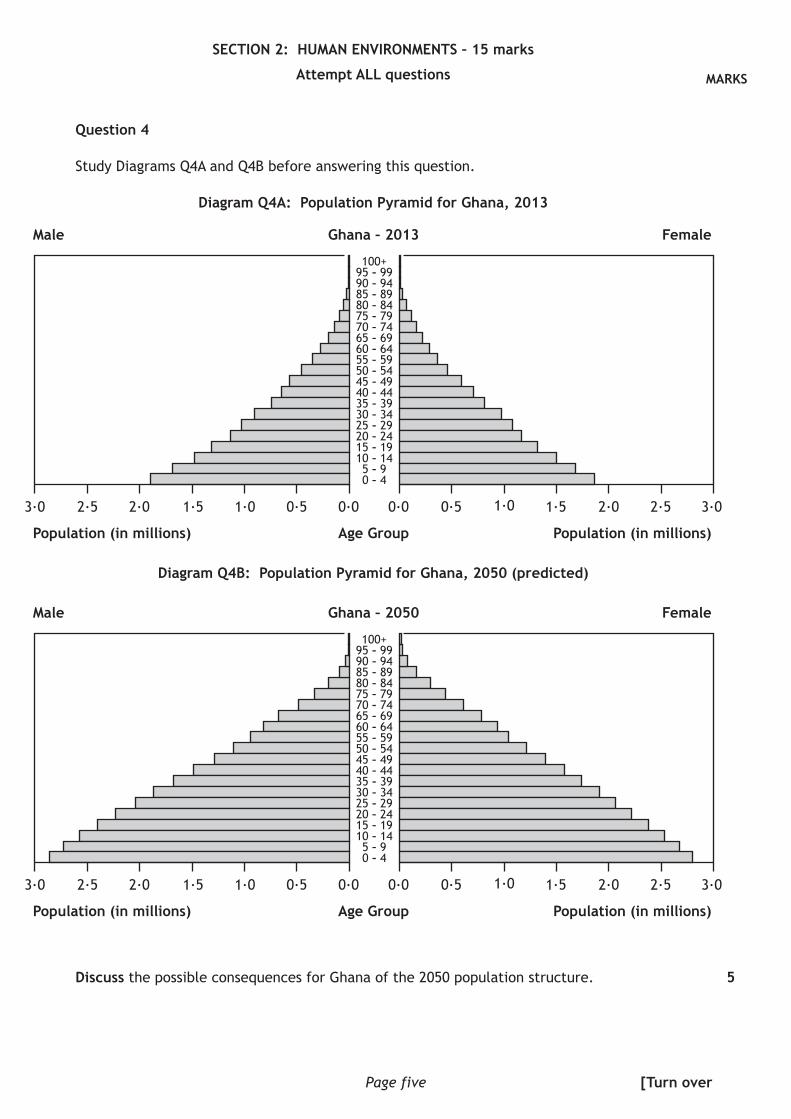
Discuss the possible consequences for Ghana of the 2050 population structure. 5
[Turn over
MARKS
Page six
Question 5
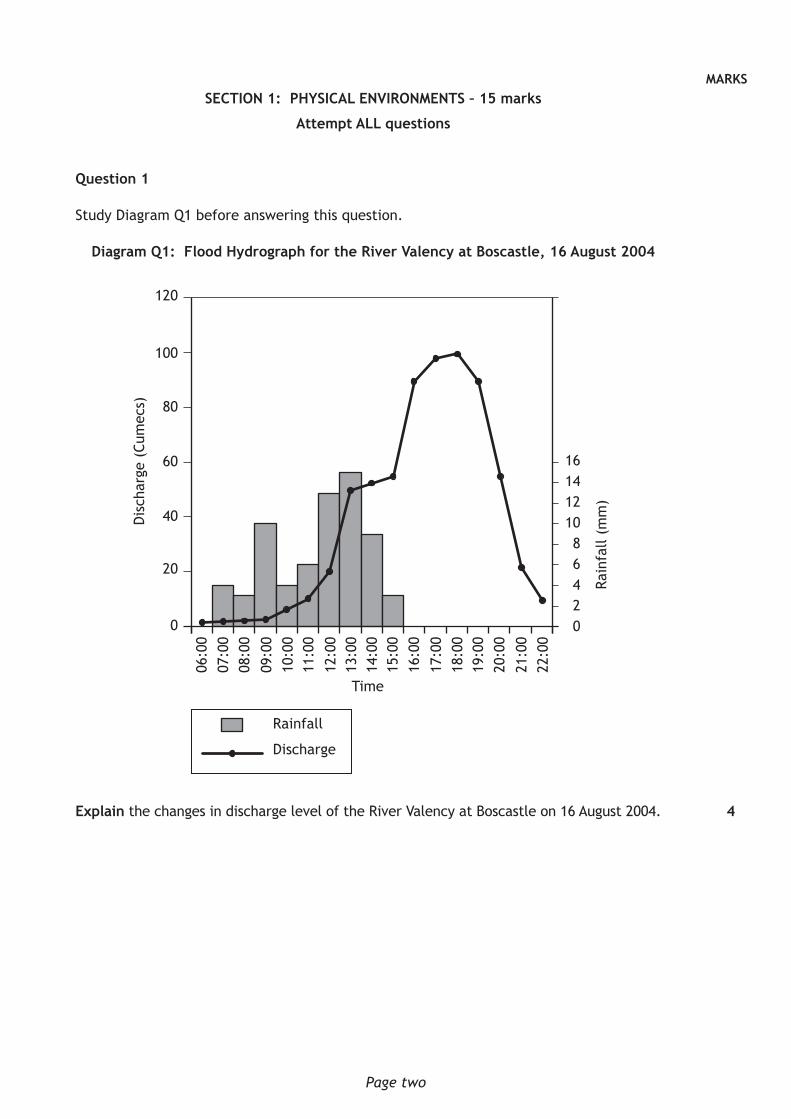
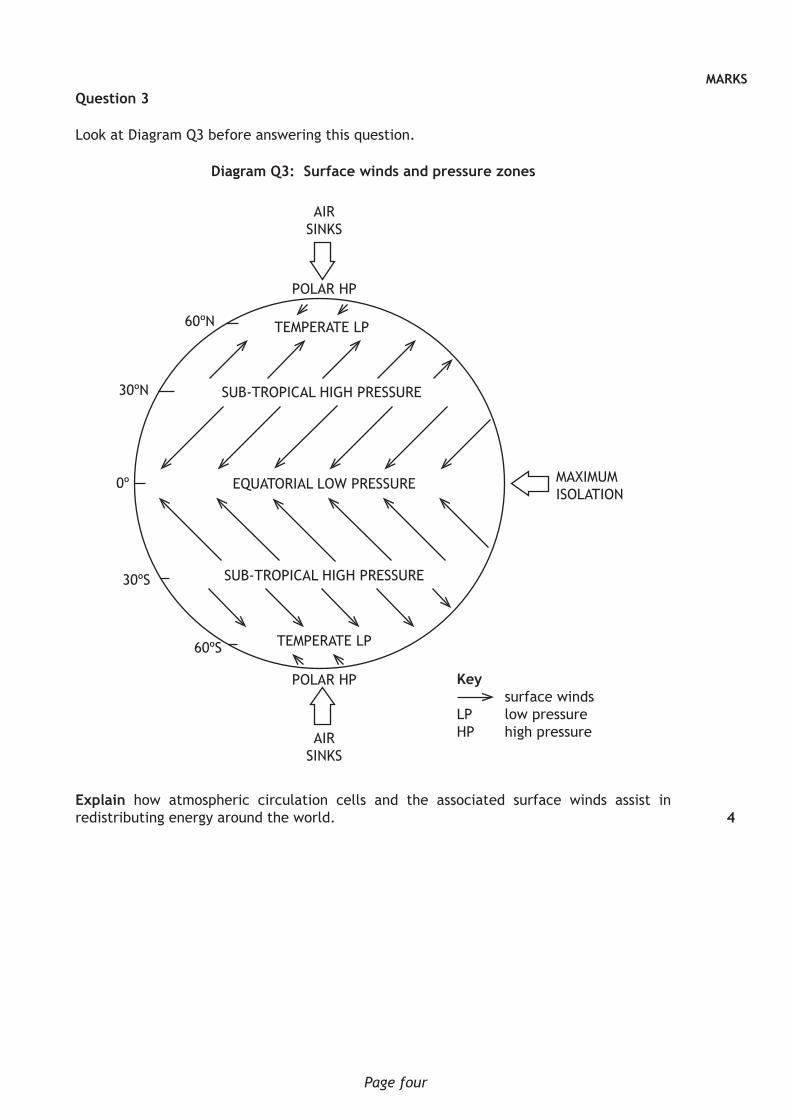
Look at Diagram Q5 before answering this question.
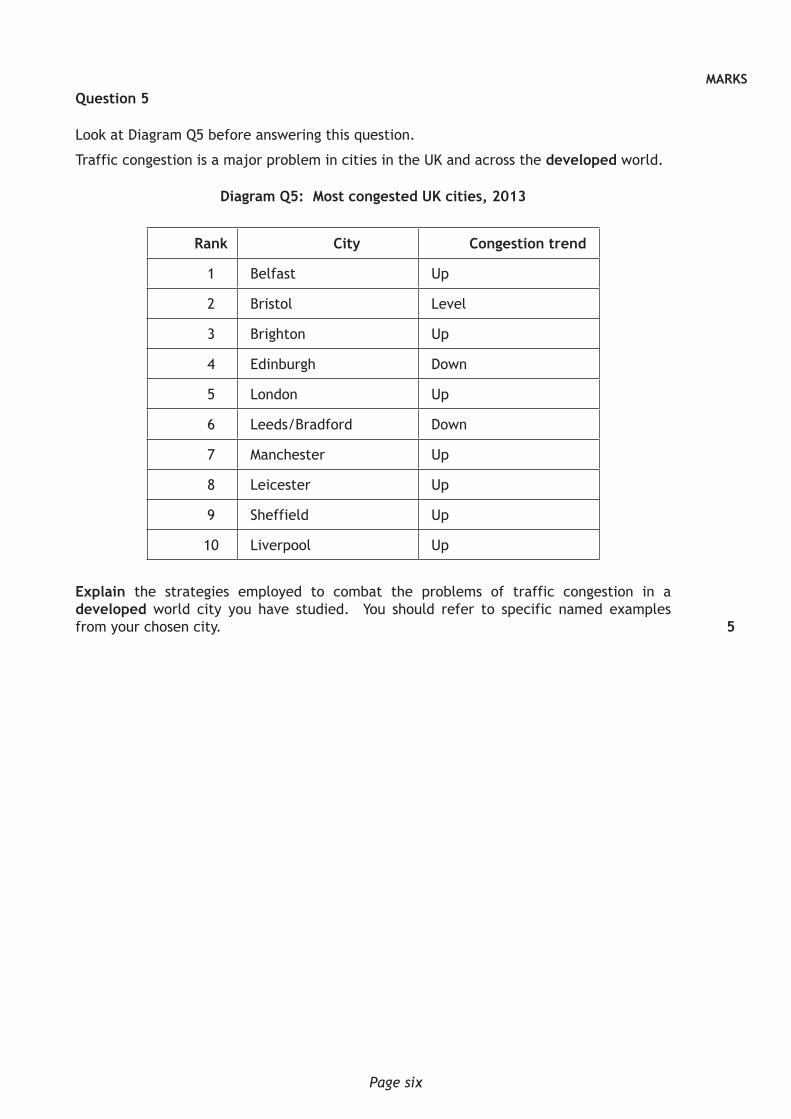
Traffic congestion is a major problem in cities in the UK and across the developed world.
Diagram Q5: Most congested UK cities, 2013
Rank City Congestion trend
1 Belfast Up
2 Bristol Level
3 Brighton Up
4 Edinburgh Down
5 London Up
6 Leeds/Bradford Down
7 Manchester Up
8 Leicester Up
9 Sheffield Up
10 Liverpool Up
Explain the strategies employed to combat the problems of traffic congestion in a developed world city you have studied. You should refer to specific named examples from your chosen city. 5
MARKS
Page seven
Question 6
Look at Diagram Q6 before answering this question.
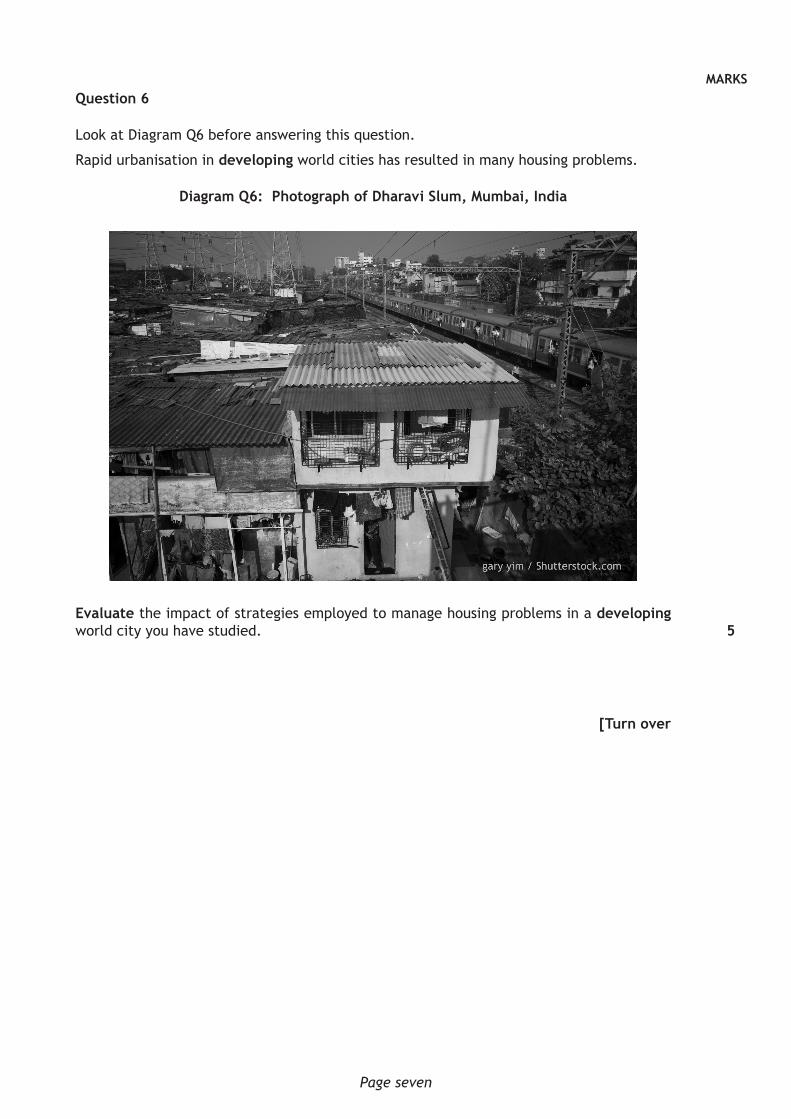
Rapid urbanisation in developing world cities has resulted in many housing problems.
Diagram Q6: Photograph of Dharavi Slum, Mumbai, India
Evaluate the impact of strategies employed to manage housing problems in a developing world city you have studied.
[Turn over
5
Page eight
SECTION 3: GLOBAL ISSUES – 20 marks
Attempt TWO questions
Question 7 River Basin Management Page 9
Question 8 Development and Health Page 10
Question 9 Global Climate Change Page 11
Question 10 Trade, Aid and Geopolitics Page 12
Question 11 Energy Page 13
MARKS
Page nine
Question 7: River Basin Management
(a) Explain the human and physical factors which need to be considered when selecting a site for a major dam and its associated reservoir.
(b) Referring to a water control project you have studied, explain the positive social and economic impacts created by the construction of a major dam and its associated reservoir.
[Turn over
5
5
MARKS
Page ten
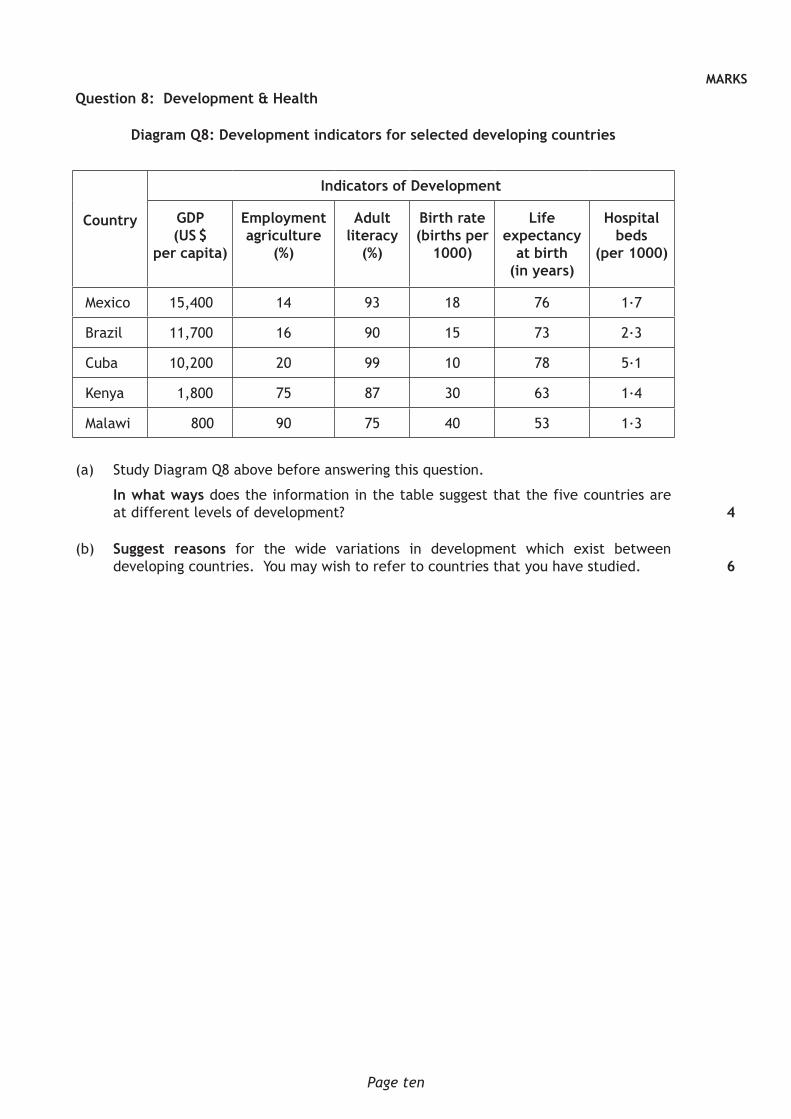
Question 8: Development & Health
Diagram Q8: Development indicators for selected developing countries
Country
Indicators of Development
GDP(US $
per capita)
Employment agriculture
(%)
Adult literacy
(%)
Birth rate (births per
1000)
Life expectancy
at birth (in years)
Hospital beds
(per 1000)
Mexico 15,400 14 93 18 76 1·7
Brazil 11,700 16 90 15 73 2·3
Cuba 10,200 20 99 10 78 5·1
Kenya 1,800 75 87 30 63 1·4
Malawi 800 90 75 40 53 1·3
(a) Study Diagram Q8 above before answering this question.
In what ways does the information in the table suggest that the five countries are at different levels of development?
(b) Suggest reasons for the wide variations in development which exist between developing countries. You may wish to refer to countries that you have studied.
4
6
MARKS
Page eleven
Question 9: Global Climate Change
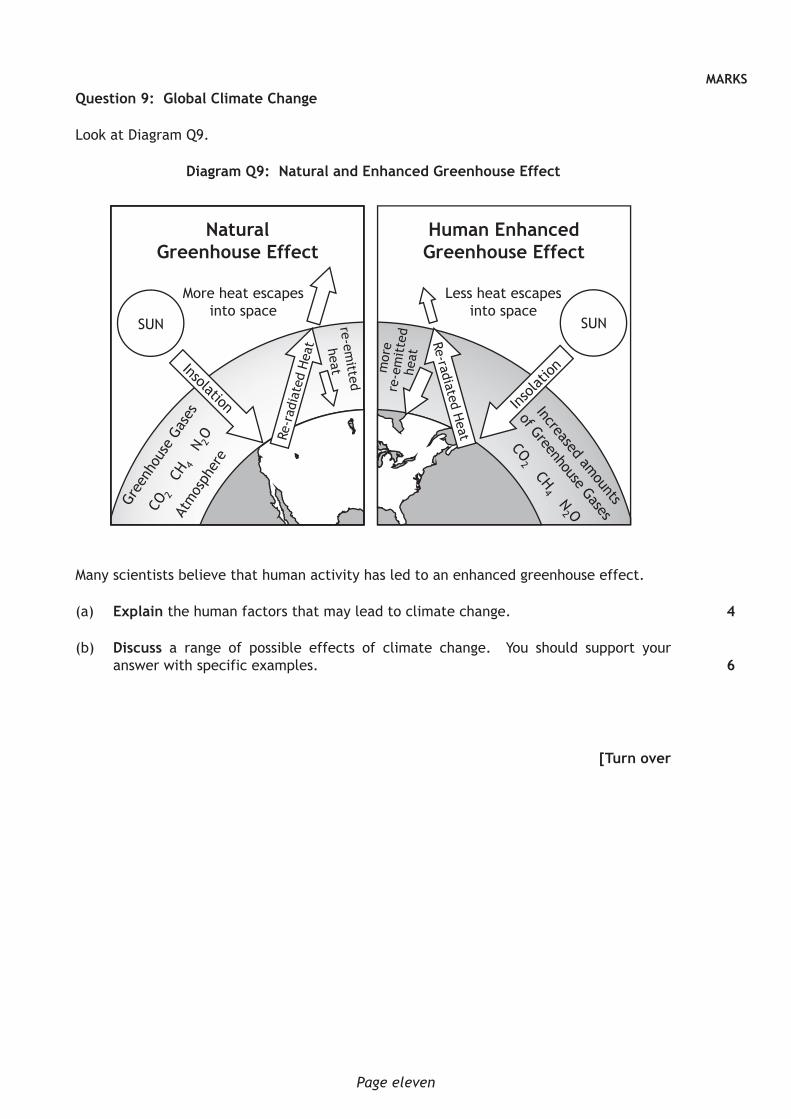
Look at Diagram Q9.
Diagram Q9: Natural and Enhanced Greenhouse Effect
NaturalGreenhouse Effect
Human EnhancedGreenhouse Effect
More heat escapes into space
Less heat escapes into space
SUN SUN
Gree
nhou
se G
ases
CO2
CH4
N 2O
Atm
osph
ere
Insolation Increased amounts
of Greenhouse Gases
CO2 CH
4 N2 O
Insola
tion
Re-r
adia
ted
Hea
t Re-radiated Heat
re-emitted
heat mor
ere
-em
itte
dhe
at
Many scientists believe that human activity has led to an enhanced greenhouse effect.
(a) Explain the human factors that may lead to climate change.
(b) Discuss a range of possible effects of climate change. You should support your answer with specific examples.
[Turn over
4
6
MARKS
Page twelve
Question 10: Trade, Aid and Geopolitics
Read the quotation in Diagram Q10a below.
Diagram Q10a: Quotation from Nelson Mandela (22nd November 2000)
“Where globalisation means, as it so often does, that the rich and powerful now have new means to further enrich and empower themselves at the cost of the poorer and weaker, we have a responsibility to protest in the name of universal freedom.”
(a) Explain the social and economic impacts of unfair trade on people and countries in the Developing World.
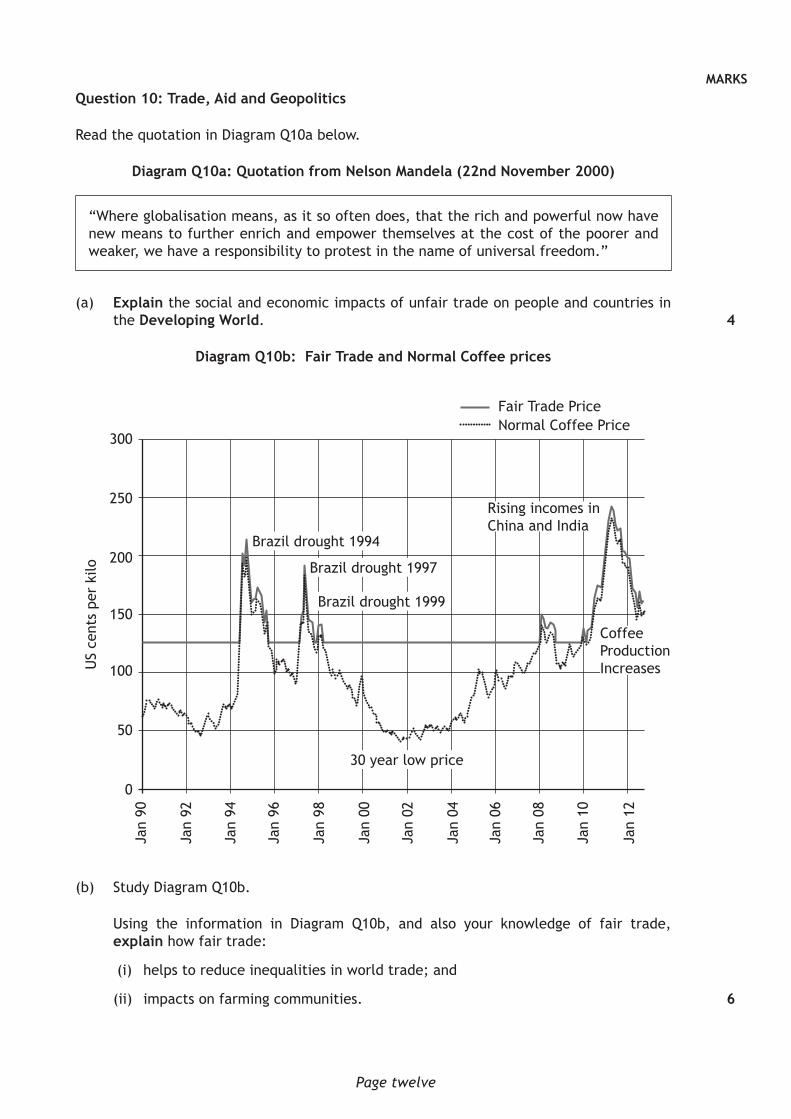
Diagram Q10b: Fair Trade and Normal Coffee prices
Brazil drought 1994
Brazil drought 1997
Brazil drought 1999
30 year low price
US
cent
s pe
r ki
lo
Fair Trade PriceNormal Coffee Price
Rising incomes in China and India
Coffee Production Increases
300
250
200
150
100
50
0
Jan
90
Jan
92
Jan
94
Jan
96
Jan
98
Jan
00
Jan
02
Jan
04
Jan
06
Jan
08
Jan
10
Jan
12
(b) Study Diagram Q10b.
Using the information in Diagram Q10b, and also your knowledge of fair trade, explain how fair trade:
(i) helps to reduce inequalities in world trade; and
(ii) impacts on farming communities.
4
6
MARKS
Page thirteen
Question 11: Energy
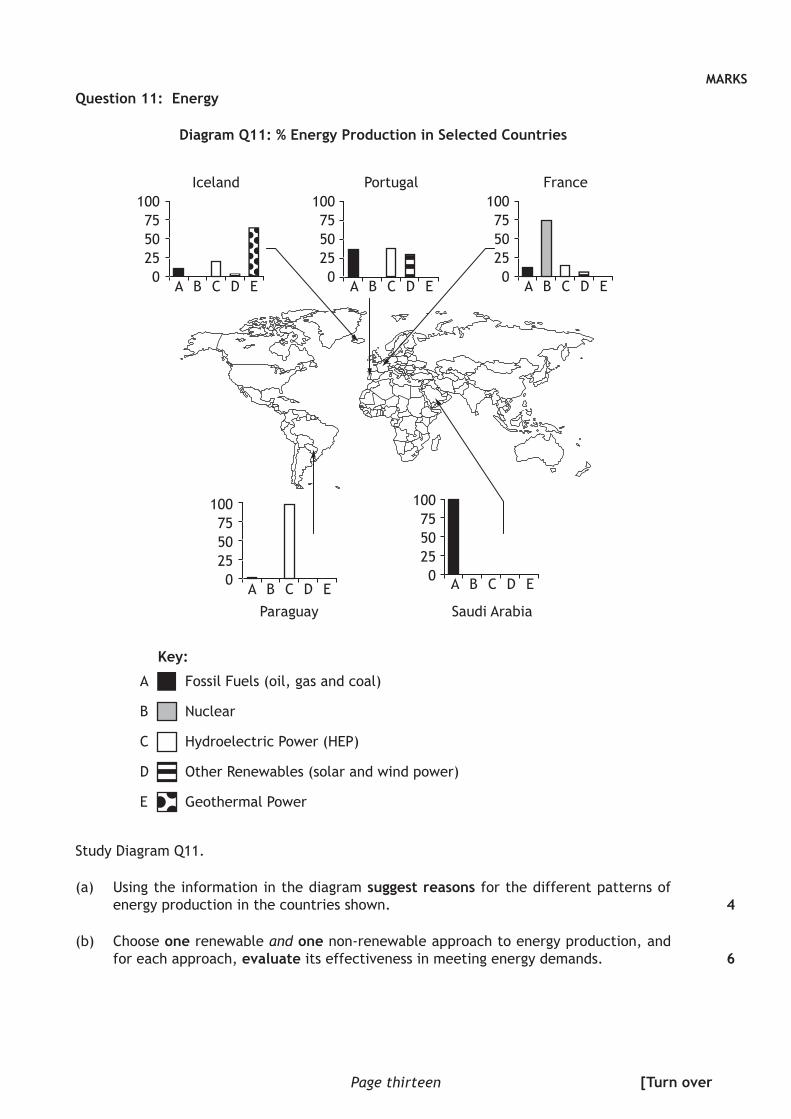
Diagram Q11: % Energy Production in Selected Countries
Iceland1007550250
A B C D E
Portugal1007550250
A B C D E
Paraguay
1007550250
A B C D E
France1007550250
A B C D E
Saudi Arabia
1007550250 A B C D E
Key:
A Fossil Fuels (oil, gas and coal)
B Nuclear
C Hydroelectric Power (HEP)
D Other Renewables (solar and wind power)
E Geothermal Power
Study Diagram Q11.
(a) Using the information in the diagram suggest reasons for the different patterns of energy production in the countries shown.
(b) Choose one renewable and one non-renewable approach to energy production, and for each approach, evaluate its effectiveness in meeting energy demands.
4
6
[Turn over
MARKS
Page fourteen
SECTION 4 : APPLICATION OF GEOGRAPHICAL SKILLS – 10 marks
Attempt the question
Question 12
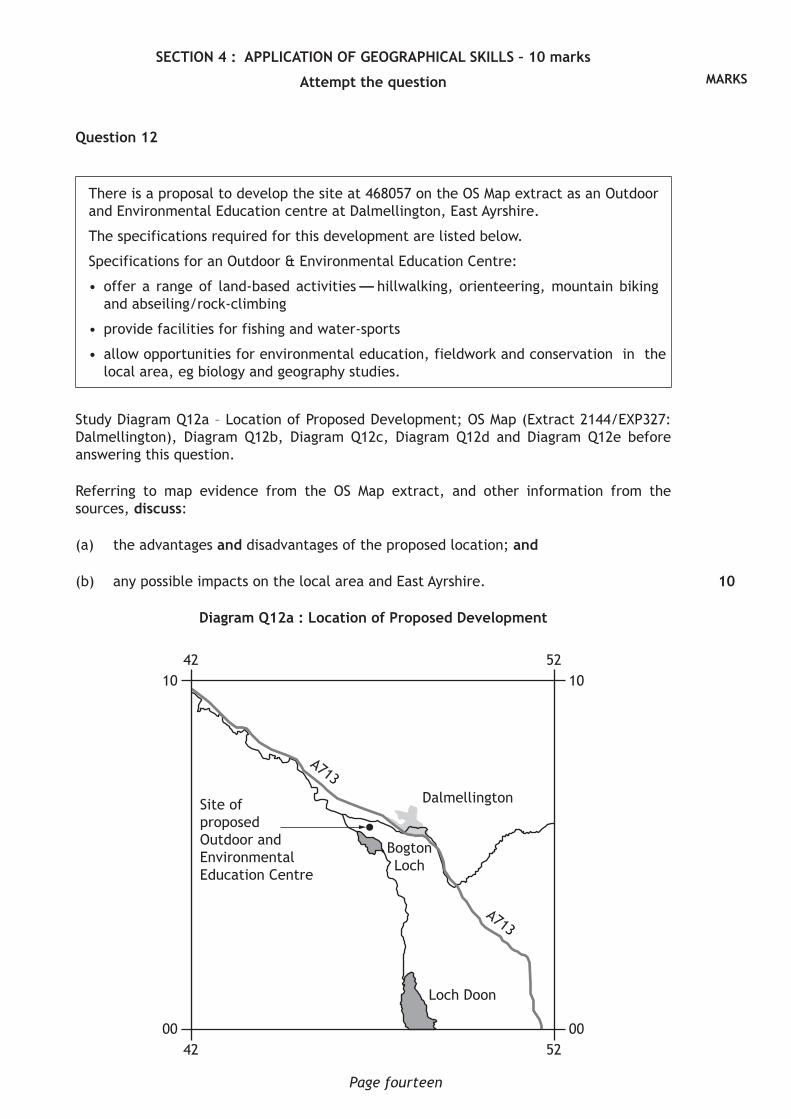
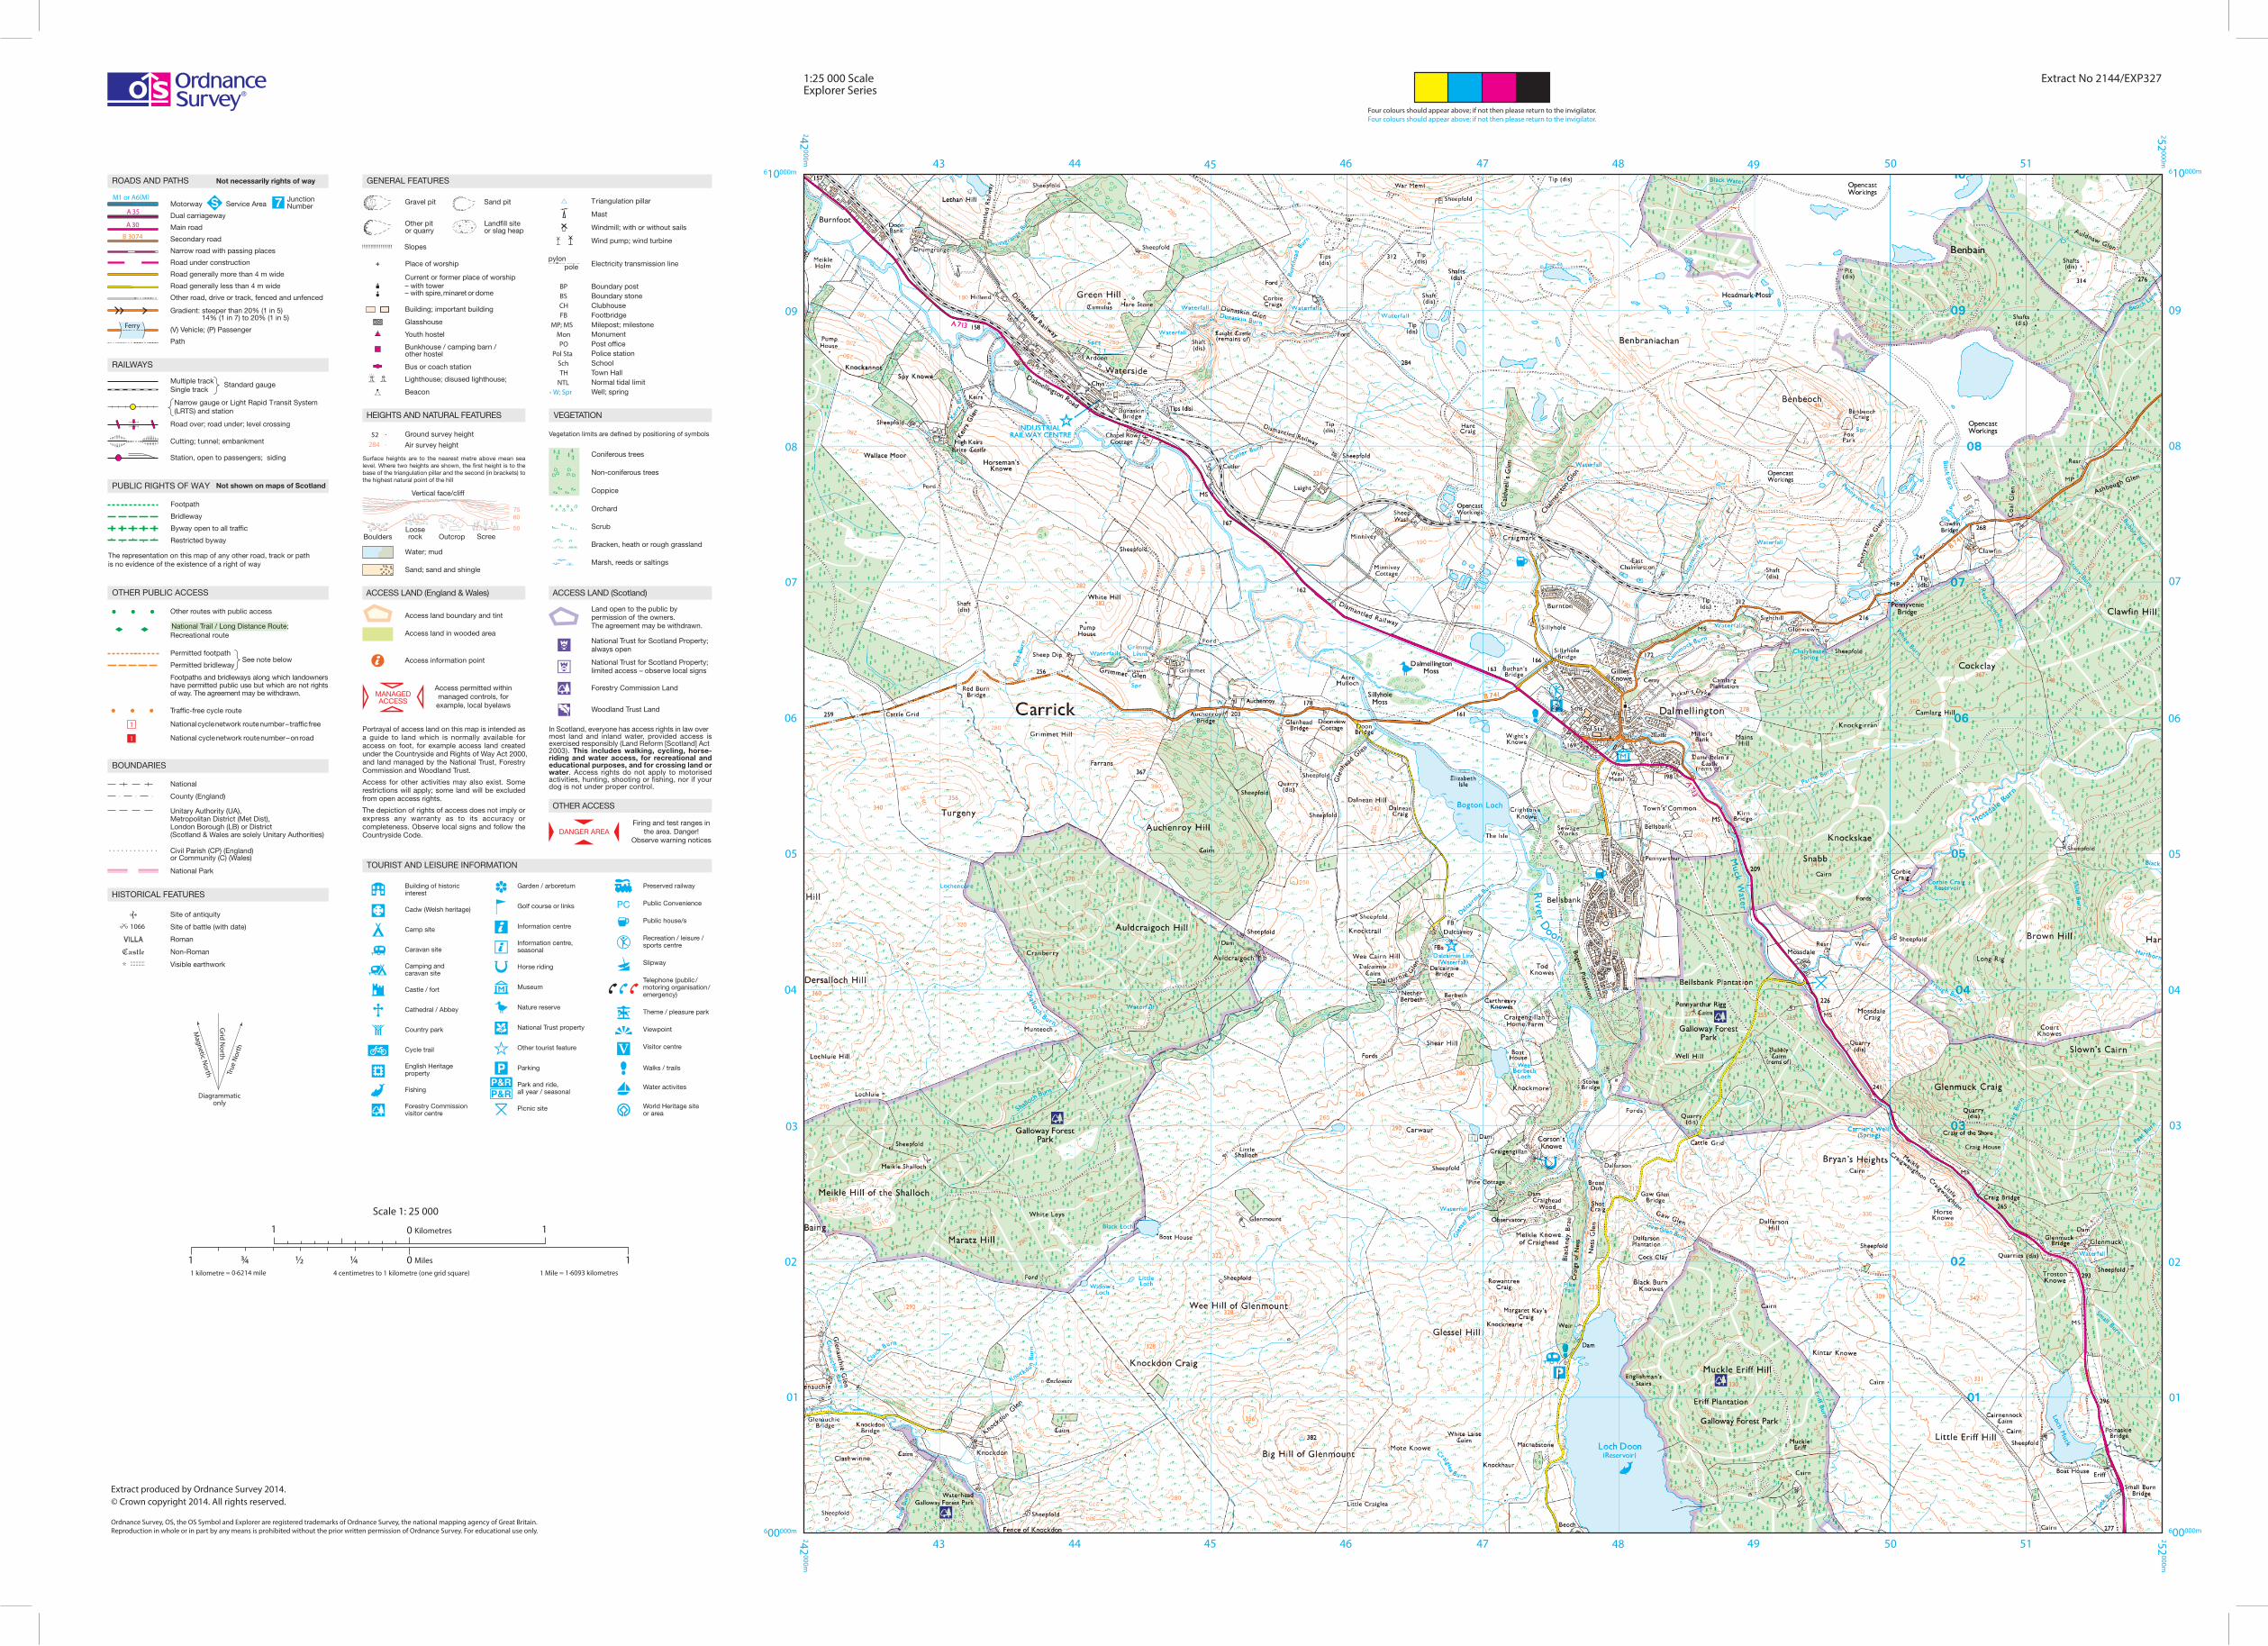
There is a proposal to develop the site at 468057 on the OS Map extract as an Outdoor and Environmental Education centre at Dalmellington, East Ayrshire.
The specifications required for this development are listed below.
Specifications for an Outdoor & Environmental Education Centre:
• offer a range of land-based activities — hillwalking, orienteering, mountain biking and abseiling/rock-climbing
• provide facilities for fishing and water-sports
• allow opportunities for environmental education, fieldwork and conservation in the lo cal area, eg biology and geography studies.
Study Diagram Q12a – Location of Proposed Development; OS Map (Extract 2144/EXP327: Dalmellington), Diagram Q12b, Diagram Q12c, Diagram Q12d and Diagram Q12e before answering this question.
Referring to map evidence from the OS Map extract, and other information from the sources, discuss:
(a) the advantages and disadvantages of the proposed location; and
(b) any possible impacts on the local area and East Ayrshire.
Diagram Q12a : Location of Proposed Development
DalmellingtonSite of proposedOutdoor and EnvironmentalEducation Centre
Loch Doon
Bogton Loch
A713
A713
42
42
52
52
10
00
10
00
10
Page fifteen
Question 12 (continued)
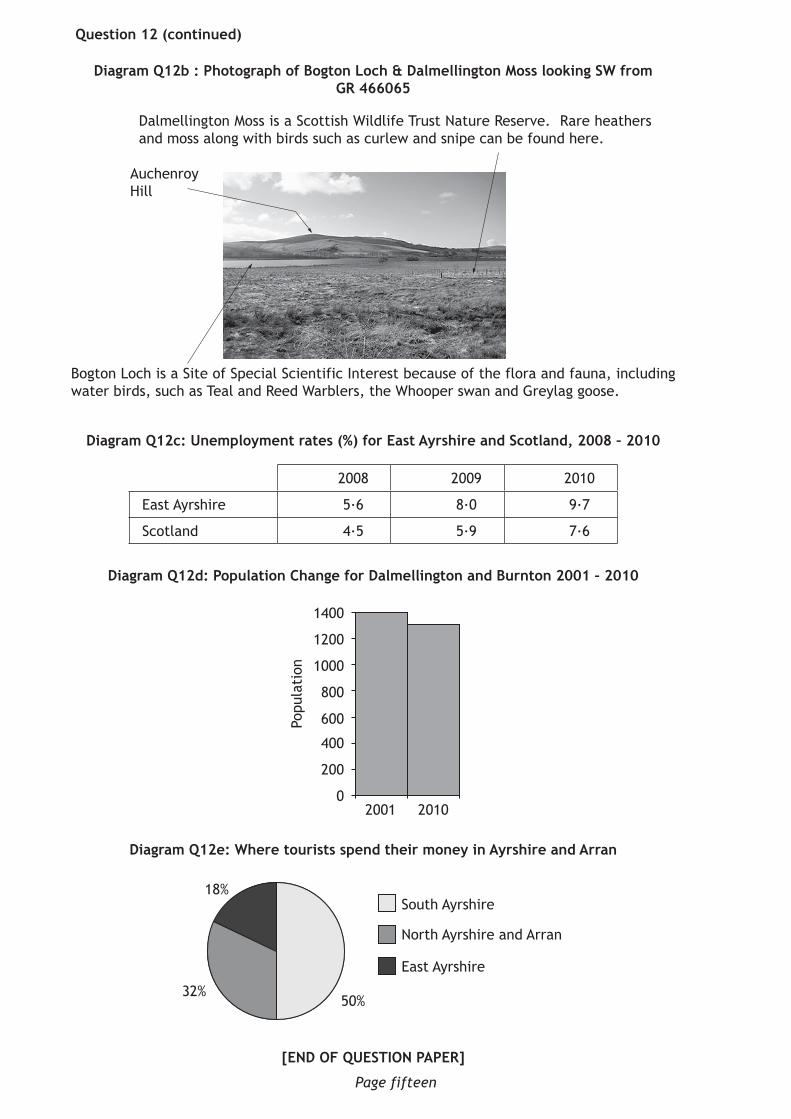
Diagram Q12b : Photograph of Bogton Loch & Dalmellington Moss looking SW from GR 466065
Dalmellington Moss is a Scottish Wildlife Trust Nature Reserve. Rare heathers and moss along with birds such as curlew and snipe can be found here.
AuchenroyHill
Bogton Loch is a Site of Special Scientific Interest because of the flora and fauna, including water birds, such as Teal and Reed Warblers, the Whooper swan and Greylag goose.
Diagram Q12c: Unemployment rates (%) for East Ayrshire and Scotland, 2008 – 2010
2008 2009 2010
East Ayrshire 5·6 8·0 9·7
Scotland 4·5 5·9 7·6
Diagram Q12d: Population Change for Dalmellington and Burnton 2001 – 2010
2001 2010
Popu
lati
on
1400
1200
1000
800
600
400
200
0
Diagram Q12e: Where tourists spend their money in Ayrshire and Arran
Note: The colours used in the printing of this map extract are indicated in the four little boxes at the top of the map extract. Each box should contain a colour; if any does not, the map is incomplete and should be returned to the Invigilator.


![NEW SQA Specimen Question Paper 1 (Non-Calculator) · PDF file[END OF SPECIMEN QUESTION PAPER] Marking Instructions National Quali cations H SPECIMEN ONLY Mathematics Paper 1 (Non-Calculator)](https://static.documents.pub/doc/80x56/5a799de47f8b9a28678c00e0/new-sqa-specimen-question-paper-1-non-calculator-end-of-specimen-question-paper.jpg)
