23
National Rental Affordability Scheme Economic and Taxation Impact Study December 2013

National Rental Affordability Scheme Economic and Taxation Impact Study
December 2013

National Rental Affordability Scheme: Economic and Taxation Impact Study
1
This study was commissioned by NRAS Providers Ltd, a not-for-profit organisation representing NRAS
Approved Participants throughout States and Territories. The report was prepared by Professor
George Earl, Dean of School of Sustainable Development at Bond University, and Isara
Khanjanasthiti, Teaching Fellow and Research Assistant at the School of Sustainable Development.
The information contained in this report has been prepared in a professional manner and using
information available at the date of the report. Neither Bond University nor its employees or
contractors accept any responsibility for any liability of any type arising out of the use of this report
by any party. Any person using the information contained in this report does so at their own risk.
Where necessary a user should obtain relevant professional advice to ensure that the information is
appropriate for their circumstances.

National Rental Affordability Scheme: Economic and Taxation Impact Study
2
Table of Contents
1 Executive Summary ......................................................................................................................... 3 2 Introduction .................................................................................................................................... 5 3 Rental Housing Affordability in Australia – A Snapshot .................................................................. 6 4 Methodology ................................................................................................................................... 7
4.1 Assumptions ............................................................................................................................ 7 4.2 Quantification Approach ......................................................................................................... 9
5 Revenue Generated by NRAS ........................................................................................................ 11 5.1 Introduction .......................................................................................................................... 11 5.2 Findings ................................................................................................................................. 12
6 Employment Generated by NRAS ................................................................................................. 16 6.1 Introduction .......................................................................................................................... 16 6.2 Findings ................................................................................................................................. 17
7 Conclusion ..................................................................................................................................... 21 8 References .................................................................................................................................... 22
List of Tables
Table 1: Average Impact Figures per NRAS Incentive and Bedroom ...................................................... 4
Table 2: NRAS Dwellings and Bedrooms across All States as at June 2013 ............................................ 5
Table 3: Total NRAS Incentives and Bedrooms by State in 2016 ............................................................ 8
Table 4: Median Personal Income by State in 2011 ............................................................................... 8
Table 5: Predominant NRAS Dwelling Type as at June 2013 and Sample Property Types ................... 10
Table 6: Key Revenue Sources from NRAS for Local, State and Federal Government ......................... 11
Table 7: Total Revenue Generated by NRAS ......................................................................................... 12
Table 8: Average Revenue Generated per NRAS Incentive and Bedroom ........................................... 13
Table 9: Gross Revenue Generated by NRAS for Local, State and Federal Government ..................... 14
Table 10: Direct and Indirect Jobs Created by NRAS ............................................................................ 17
Table 11: Average Number of Jobs Created per NRAS Incentive and Bedroom .................................. 18
Table 12: Income Generated by NRAS-Driven Jobs .............................................................................. 19
Table 13: Average Income Generated per NRAS Incentive and Bedroom ........................................... 20
Table 14: Average Impact Figures per NRAS Incentive and Bedroom .................................................. 21
List of Figures
Figure 1: Median Personal Income by State in 2011 .............................................................................. 9
Figure 2: Total Revenue Generated by NRAS........................................................................................ 12
Figure 3: Composition of NRAS-Generated Revenue for Local, State and Federal Government ......... 13
Figure 4: Average Revenue Generated per NRAS Incentive and Bedroom .......................................... 14
Figure 5: Sources of Revenue for State, Local and Federal Government ............................................. 15
Figure 6: Direct and Indirect Jobs Created by NRAS ............................................................................. 17
Figure 7: Average Number of Jobs per NRAS Incentive and Bedroom ................................................. 18
Figure 8: Total Number of Jobs Created by NRAS ................................................................................. 19
Figure 9: Income Generated by NRAS-Driven Jobs per Year ................................................................ 19
Figure 10: Average Income per NRAS Incentive and Bedroom ............................................................ 20
National Rental Affordability Scheme: Economic and Taxation Impact Study
3
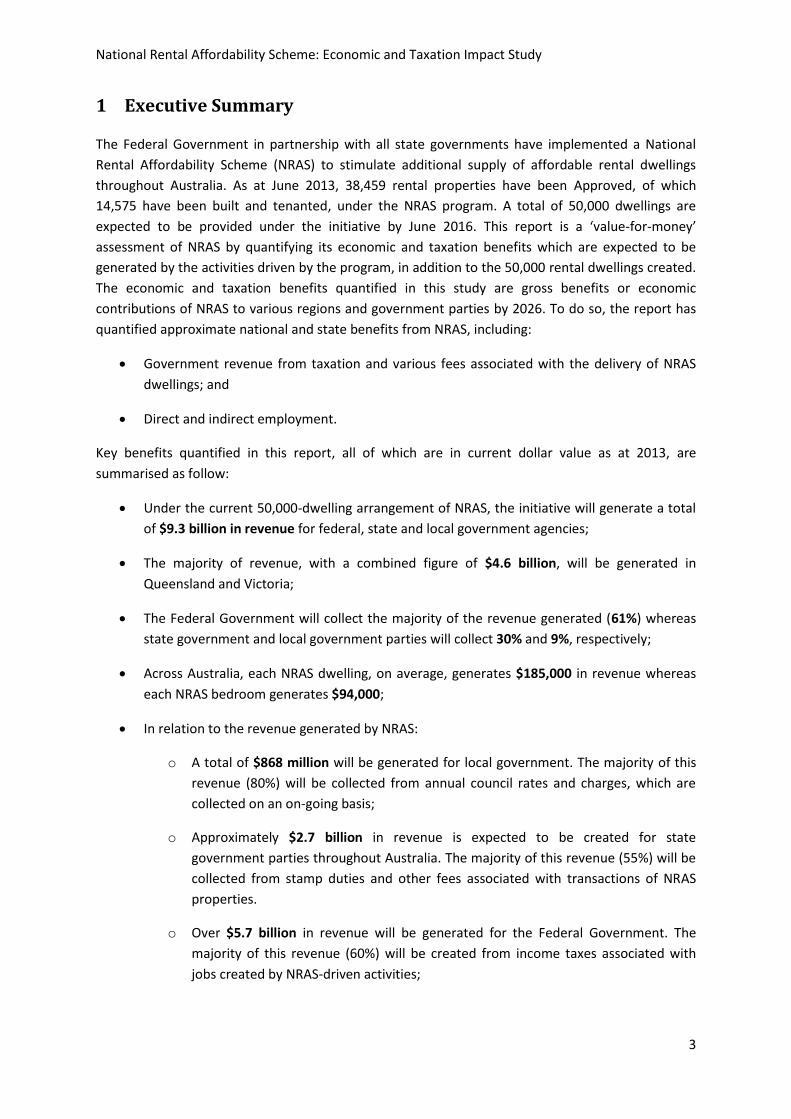
1 Executive Summary
The Federal Government in partnership with all state governments have implemented a National
Rental Affordability Scheme (NRAS) to stimulate additional supply of affordable rental dwellings
throughout Australia. As at June 2013, 38,459 rental properties have been Approved, of which
14,575 have been built and tenanted, under the NRAS program. A total of 50,000 dwellings are
expected to be provided under the initiative by June 2016. This report is a ‘value-for-money’
assessment of NRAS by quantifying its economic and taxation benefits which are expected to be
generated by the activities driven by the program, in addition to the 50,000 rental dwellings created.
The economic and taxation benefits quantified in this study are gross benefits or economic
contributions of NRAS to various regions and government parties by 2026. To do so, the report has
quantified approximate national and state benefits from NRAS, including:
Government revenue from taxation and various fees associated with the delivery of NRAS
dwellings; and
Direct and indirect employment.
Key benefits quantified in this report, all of which are in current dollar value as at 2013, are
summarised as follow:
Under the current 50,000-dwelling arrangement of NRAS, the initiative will generate a total
of $9.3 billion in revenue for federal, state and local government agencies;
The majority of revenue, with a combined figure of $4.6 billion, will be generated in
Queensland and Victoria;
The Federal Government will collect the majority of the revenue generated (61%) whereas
state government and local government parties will collect 30% and 9%, respectively;
Across Australia, each NRAS dwelling, on average, generates $185,000 in revenue whereas
each NRAS bedroom generates $94,000;
In relation to the revenue generated by NRAS:
o A total of $868 million will be generated for local government. The majority of this
revenue (80%) will be collected from annual council rates and charges, which are
collected on an on-going basis;
o Approximately $2.7 billion in revenue is expected to be created for state
government parties throughout Australia. The majority of this revenue (55%) will be
collected from stamp duties and other fees associated with transactions of NRAS
properties.
o Over $5.7 billion in revenue will be generated for the Federal Government. The
majority of this revenue (60%) will be created from income taxes associated with
jobs created by NRAS-driven activities;

National Rental Affordability Scheme: Economic and Taxation Impact Study
4
A total of 329,00 full-time equivalent jobs will be created by NRAS initiative and comprise:
o 121,000 direct jobs in the construction industry, which include 95,253 construction-
related jobs and 25,320 consulting jobs;
o 208,000 indirect jobs in other industries, created through multiplier effects as a
result of income generated by the construction jobs above;
The majority of the jobs will be created in Victoria and Queensland where a total of 171,000
jobs will be generated;
In relation to the average number of jobs created per each NRAS incentive and bedroom:
o Nationally, 7 jobs are created per each incentive whereas 3 jobs are created per
each bedroom;
o Victoria, Tasmania and Northern Territory have the highest number of jobs created
per incentive and bedroom, with 11 jobs per dwelling and 7 jobs per bedroom;
In relation to income generated by NRAS-driven employment:
o A total of $18.9 billion will be generated nationally for the Australian workforce; and
o Each NRAS incentive and bedroom generates $378,000 and $192,000, respectively.
As shown in the key benefits summarised above, the NRAS scheme not only results in additional
supply of affordable rental dwellings, but also generates significant economic and taxation benefits
for the Australian economy. Table 1 below displays the average impact figures per each NRAS
incentive and bedroom.
Table 1: Average Impact Figures per NRAS Incentive and Bedroom1
Impact per Incentive Impact per Bedroom
Government Revenue $185,000 $94,000
Job 7 3
Income $378,000 $192,000
1 More detailed figures by states can be found in Table 8, Table 11 and Table 13.

National Rental Affordability Scheme: Economic and Taxation Impact Study
5
2 Introduction
According to National Housing Supply Council (2012), there is a shortfall of more than 500,000
affordable rental dwellings throughout Australia and this shortage is likely to deepen, implying that
lack of affordable rental housing is becoming an increasingly significant issue. In response to this
growing crisis, the Federal Government, in partnership with all state governments, has implemented
the National Rental Affordability Scheme (NRAS) to stimulate additional supply of affordable rental
dwellings. NRAS dwellings are required to be leased to low and moderate income households at a
rate which is at least 20% below market value. NRAS commenced in July 2008 and is envisaged to
provide additional 50,000 affordable rental dwellings throughout Australia by June 2016 under the
current arrangement. As at June 2013, the number of rental dwellings and bedrooms created under
NRAS are summarised in Table 2 below (FaHCSIA, 2013).
Table 2: NRAS Dwellings and Bedrooms across All States as at June 20132
QLD NSW VIC WA SA TAS NT ACT National
Total Dwellings 10,896 6,512 6,767 5,470 3,741 1,463 1,060 2,550 38,459
National % 28% 17% 18% 14% 10% 4% 3% 7%
Total Bedrooms 27,631 11,155 10,833 9,530 9,007 2,341 1,740 3,689 75,926
National % 36% 15% 14% 13% 12% 3% 2% 5%
This report is a ‘value-for-money’ assessment of the current 50,000-dwelling commitment of the
government parties under the NRAS initiative. The economic and taxation benefits quantified in this
study are gross benefits or “economic contributions” (Watson et al., 2007, p. 2) of NRAS to the
different regions and government parties. Therefore, the objective of this study is to quantify the
national and various state benefits generated by NRAS in both an economic and direct/indirect
taxation context. By doing so, it will articulate the benefits, in current dollar value as at 2013,
derived by the Federal and various state governments in relation to their current and continuing
support of the NRAS initiative.
The report is divided into four sections. First, a quick snapshot of rental housing affordability in
Australia is presented. The report then discusses research methodology employed to quantify
economic and taxation impacts of NRAS. Following this, taxation benefits of various activities
created by NRAS are quantified. Subsequently, economic impacts of NRAS are quantified in terms of
current and projected number of employment created. Finally, the report concludes with key with
potential areas for further study on the economic and taxation impacts of NRAS.
2 The number of dwellings and bedrooms in Table 1 include both allocated incentives and reserved incentives.

National Rental Affordability Scheme: Economic and Taxation Impact Study
6
3 Rental Housing Affordability in Australia – A Snapshot
A suitable or affordable rental can be defined as a rental dwelling that costs no more than 30% of
the household’s income (Australian Bureau of Statistics, 2006). The supply of affordable rentals in
Australia has been in long-term decline due to recent, significant changes in the character of rental
housing sector over the last two decades. The demand for affordable rentals has been driven by
delayed access to home ownership for younger households as well as increases in migration rates,
particularly from international students. The supply of affordable rentals, meanwhile, has been
limited due to greater incentives of small scale investors to invest in dwellings which are already
established, rather than new dwellings (Vivienne et al., 2013). While there is currently a shortfall of
more than 500,000 affordable rentals, it is projected that this figure, based on historic trends in
rental housing demand and supply, is likely to increase (National Housing Supply Council, 2012).
In April 2013, a survey of 56,414 rental properties across Australia by Anglicare Australia revealed
that less than 1% of existing rental dwellings are affordable for low income households, including
those on parenting payment, aged pension, disability support pension or Newstart allowance.
Affordable rentals were particularly scarce in capital cities, and no suitable rental dwelling was
available for Newstart or Youth Allowance recipients in Darwin, Melbourne, Adelaide, Sydney,
Canberra and Perth (Pro Bono Australia, 2013). Additional key findings of the study by Anglicare
Australia (2013) are listed below:
Single person households are primarily disadvantaged in the rental housing market, with less
than 1% of available rentals rated as affordable;
Couple households are also disadvantaged, with approximately 1% of available rentals rated
as suitable; and
Rentals in regional areas are not affordable for households living on a government payment,
with the proportion of suitable rentals ranging from 0.1% to 5.8%.
Regulatory barriers, lack of investment and frictions between landlord and tenants have been cited
as some of the key reasons for the continuous increase in unaffordable rental housing, particularly
the least advantaged groups. As a result, many households are going into debt to pay bills, and basic
necessities such as food are foregone in order to live close to jobs and essential services (Anglicare
Australia, 2013). To this end, additional supply of affordable rental properties is required and NRAS
is one of the major government initiatives to achieve this outcome.

National Rental Affordability Scheme: Economic and Taxation Impact Study
7
4 Methodology
4.1 Assumptions
To quantify economic and taxation impacts of NRAS, the study has integrated the following key
assumptions due to availability of data:
A total of 50,000 NRAS incentives will be provided by June 2016 (the current arrangement as
at December 2013);
The number of additional NRAS dwellings created per annum between June 2013 and 2016
are an average of the total additional NRAS dwellings expected for the period;3
For the purpose of this study,4 38,459 NRAS dwellings were assumed to be provided as at
June 2013; and
All NRAS dwellings, upon the completion of their construction, are sold to investors and fully
leased for ten years at below-market rates;
After ten years of leasing at below market rates, each NRAS dwelling is sold by its investor to
another investor;
The last set of NRAS dwellings of the current 50,000-incentive goal will finish construction
and be sold to investors in 2016. Given the assumption above, these dwellings will be sold in
2026, and therefore the time period considered in this study is from 2013 to 2026.
By 2026, all 50,000 NRAS dwellings will have been sold by investors;
The current tax and regulatory systems associated with property and income at the federal,
state and local government levels will remain unchanged until 2026;
All full-time equivalent, direct and indirect jobs created by NRAS-driven activities continue
for one year;
The current mix of different NRAS dwelling types in each state will continue until the
conclusion of the NRAS initiative. Furthermore, the current proportion of NRAS incentives in
across all states will remain unchanged. Table 3 below illustrates the total number of NRAS
dwellings and bedrooms in 2016, calculated with this assumption.
3 As 38,459 incentives have been allocated or reserved under the scheme as at June 2013, additional 11,541 dwellings are expected by 2016, bringing the total number of incentives to 50,000. Based on this projection, additional 3,847 NRAS properties per annum have been assumed in this study for the time period between 2013 and 2016.
4 Out of the 38,459 allocated or reserved incentives as at June 2013, 14,575 NRAS dwellings have been completed. This study has assumed all 38,459 incentives have been provided as at June 2013. In this approach, the historical trend of the number of allocated and reserved incentives was taken into consideration to project the number of additional NRAS incentives and bedrooms per annum in each state until June 2016.

National Rental Affordability Scheme: Economic and Taxation Impact Study
8
Table 3: Total NRAS Incentives and Bedrooms by State in 2016
Total Incentives Total Bedrooms
QLD 14,166 35,923
VIC 8,798 14,084
NSW 8,466 14,502
WA 7,111 12,390
SA 4,864 11,710
ACT 3,315 4,796
TAS 1,902 3,044
NT 1,378 2,262
National 50,000 98,710
All investors of NRAS dwellings were assumed to:
Be individual investors (i.e. not a corporation or fund) who are Australian permanent
residents or citizens, thereby being eligible for the 50% discount on capital gains tax liability
when selling their NRAS properties;
Be subject to individual income tax rates for 2013-14, as result of the assumption above, for
the entire time period considered in this study;
Invest in only one property (i.e. a NRAS dwelling) in their investment portfolio, in the state
where they principally reside; and
Earn annual income equivalent to the median income within the state of their residence.
The assumption that NRAS investors purchase NRAS dwellings in the state of their principal
residence was incorporated in order to apply the median income of the state to the calculation of
capital gains tax. Although some NRAS dwellings may be purchased by interstate investors, this
assumption is expected to have minimal impact on the relevance of the quantified figures because
the median income figures across all states, with the exception of the ACT figure, do not vary
significantly and are close to the national average figure as shown in Table 4 and Figure 1.
Table 4: Median Personal Income by State in 20115
State Median Income
QLD $56,080
VIC $56,800
NSW $58,080
WA $60,840
SA $53,647
ACT $73,632
TAS $53,513
NT $63,180
National Average $59,472
5 All figures were obtained from Australian Bureau of Statistics’ catalogue 6523.0, “Household Income and Income Distribution, Australia, 2011-12”.

National Rental Affordability Scheme: Economic and Taxation Impact Study
9
Figure 1: Median Personal Income by State in 2011
The median household income figures displayed in Table 4 and Figure 1 above were divided by the
average number of employed person per each household to obtain the median income figure for
each state. The following financial variables were incorporated into the calculation of cash flows
from 2014 to 2026 in this study:
The current inflation rate of 2.2% was assumed as the yearly inflation rate;
The current Reserve Bank of Australia’s cash rate of 2.5% was used as the NPV discount rate;
The average yearly growth rate of house price index in each state between September 2003
and 2013, taken from Australian Bureau of Statistics’ house price indexes (catalogue no.
6416.0), was assumed as the yearly growth rate of dwelling prices;
The average yearly growth rate of median household income, taken from Australian Bureau
of Statistics’ census data, between the census years of 2006 and 2011 in each state, was
assumed as the yearly growth rate of median income; and
No concession was taken into consideration for calculation of taxes and fees.
4.2 Quantification Approach
A single NRAS dwelling was chosen as a sample for each state. The study then undertook an analysis
of economic and taxation impacts generated from various activities associated with the
construction, transactions and rentals of the sample properties. The findings from this analysis were
then divided by the sample properties’ number of bedrooms to calculate NRAS impacts per each
NRAS bedroom. These figures were then multiplied by the total number of NRAS bedrooms in each
respective state to obtain an overall NRAS benefit pertaining to each state. The impact figures at the
state level are then aggregated together to quantify the program’s benefits at the national level.
Inflation is factored into all future NRAS benefits, which are then discounted back into current dollar
0
10
20
30
40
50
60
70
80
Tho
usa
nd
s
National Rental Affordability Scheme: Economic and Taxation Impact Study
10
value as at 2013 using the net present value approach. All financial figures presented in this report
are in net present value and have been rounded.
This quantification method assumes that council regulations applicable to each sample NRAS
property are reflective of council systems across the state in which the property is located.
Furthermore, it was assumed that the sample NRAS properties chosen for this study, along with their
land and construction costs, reflect all NRAS dwellings in their respective state.
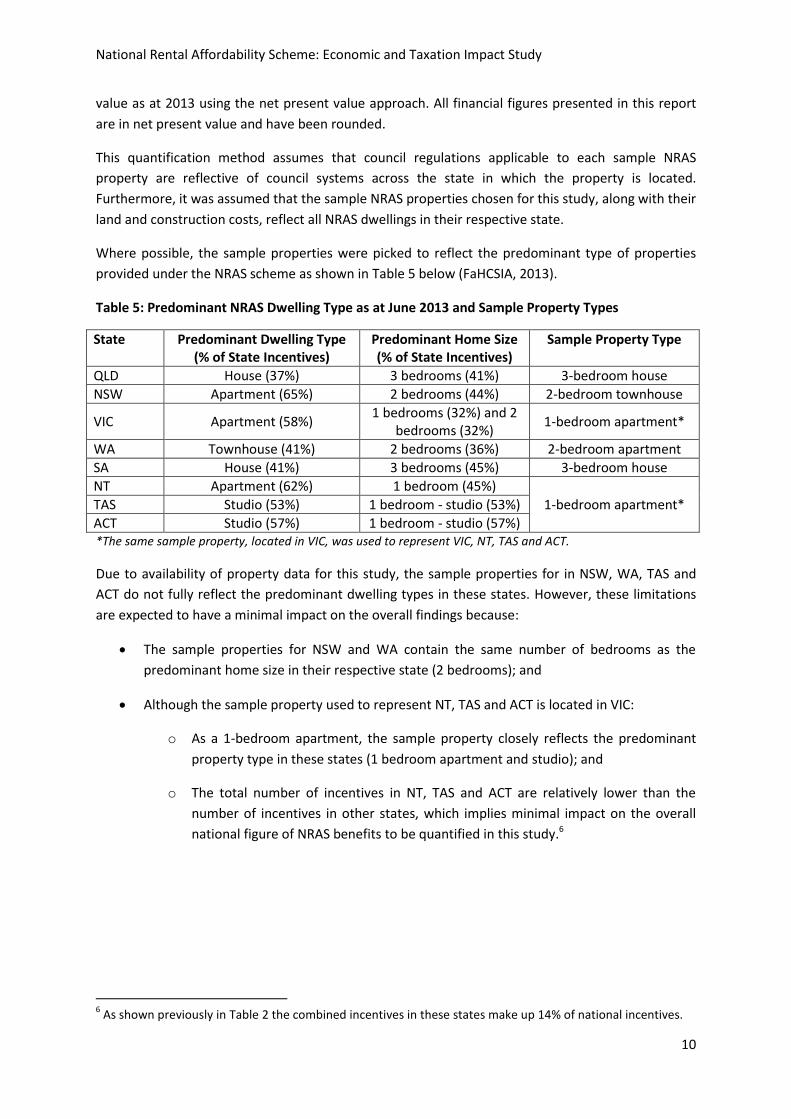
Where possible, the sample properties were picked to reflect the predominant type of properties
provided under the NRAS scheme as shown in Table 5 below (FaHCSIA, 2013).
Table 5: Predominant NRAS Dwelling Type as at June 2013 and Sample Property Types
State Predominant Dwelling Type (% of State Incentives)
Predominant Home Size (% of State Incentives)
Sample Property Type
QLD House (37%) 3 bedrooms (41%) 3-bedroom house
NSW Apartment (65%) 2 bedrooms (44%) 2-bedroom townhouse
VIC Apartment (58%) 1 bedrooms (32%) and 2
bedrooms (32%) 1-bedroom apartment*
WA Townhouse (41%) 2 bedrooms (36%) 2-bedroom apartment
SA House (41%) 3 bedrooms (45%) 3-bedroom house
NT Apartment (62%) 1 bedroom (45%)
1-bedroom apartment* TAS Studio (53%) 1 bedroom - studio (53%)
ACT Studio (57%) 1 bedroom - studio (57%) *The same sample property, located in VIC, was used to represent VIC, NT, TAS and ACT.
Due to availability of property data for this study, the sample properties for in NSW, WA, TAS and
ACT do not fully reflect the predominant dwelling types in these states. However, these limitations
are expected to have a minimal impact on the overall findings because:
The sample properties for NSW and WA contain the same number of bedrooms as the
predominant home size in their respective state (2 bedrooms); and
Although the sample property used to represent NT, TAS and ACT is located in VIC:
o As a 1-bedroom apartment, the sample property closely reflects the predominant
property type in these states (1 bedroom apartment and studio); and
o The total number of incentives in NT, TAS and ACT are relatively lower than the
number of incentives in other states, which implies minimal impact on the overall
national figure of NRAS benefits to be quantified in this study.6
6 As shown previously in Table 2 the combined incentives in these states make up 14% of national incentives.

National Rental Affordability Scheme: Economic and Taxation Impact Study
11
5 Revenue Generated by NRAS
5.1 Introduction
Activities driven by the provision of NRAS dwellings generate taxation and other revenue for
governments at the local, state and national levels. Key revenue sources considered in this study are
outlined in Table 6.
Table 6: Key Revenue Sources from NRAS for Local, State and Federal Government
Government Level Revenue Sources
Local
Infrastructure contributions (headworks charges)
Development application fees
Building application fees
Council rates and charges
State
Transfer (stamp) duty for transaction of land purchase prior to NRAS property development
Transfer (stamp) duty for transaction of NRAS properties
Land tax
Payroll tax
Federal
Income tax generated from direct and indirect jobs created by activities driven by NRAS
GST on construction costs associated with NRAS dwelling provisions
Capital Gains Tax from the sale of NRAS dwellings at the end of their ten-year lease period
Given that regulation and systems vary across states and local government areas, not all of the
above revenue sources for local and state governments may apply to all sample NRAS properties.
Likewise, additional revenue sources may apply to particular sample dwellings. Council rates and
charges as well as land tax are on-going and will continue to be generated beyond the time period
considered in this study (2026).
National Rental Affordability Scheme: Economic and Taxation Impact Study
12
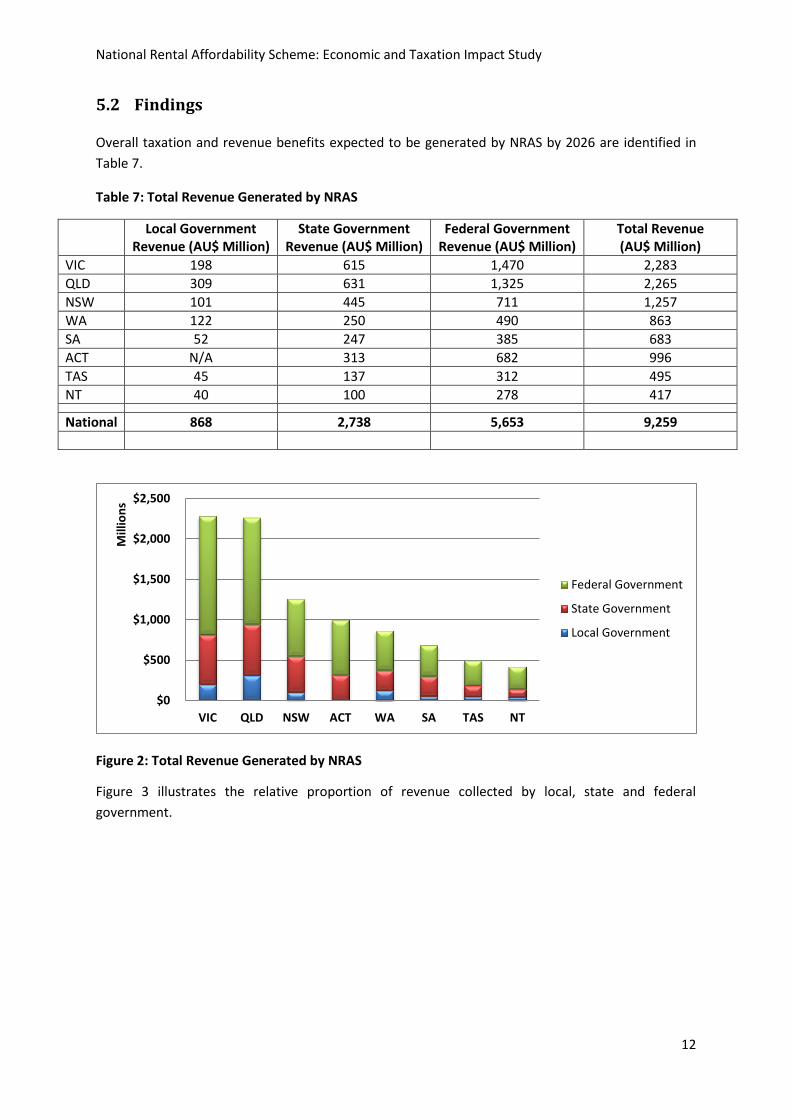
5.2 Findings
Overall taxation and revenue benefits expected to be generated by NRAS by 2026 are identified in
Table 7.
Table 7: Total Revenue Generated by NRAS
Local Government Revenue (AU$ Million)
State Government Revenue (AU$ Million)
Federal Government Revenue (AU$ Million)
Total Revenue (AU$ Million)
VIC 198 615 1,470 2,283
QLD 309 631 1,325 2,265
NSW 101 445 711 1,257
WA 122 250 490 863
SA 52 247 385 683
ACT N/A 313 682 996
TAS 45 137 312 495
NT 40 100 278 417
National 868 2,738 5,653 9,259
Figure 2: Total Revenue Generated by NRAS
Figure 3 illustrates the relative proportion of revenue collected by local, state and federal
government.
$0
$500
$1,000
$1,500
$2,000
$2,500
VIC QLD NSW ACT WA SA TAS NT
Mill
ion
s
Federal Government
State Government
Local Government

National Rental Affordability Scheme: Economic and Taxation Impact Study
13
Figure 3: Composition of NRAS-Generated Revenue for Local, State and Federal Government
The following points could be observed from Table 7, Figure 2 and Figure 3:
Approximately $9.3 billion in revenue will be generated by all economic activities driven by
the NRAS initiative;
The most significant revenue is expected to be created by NRAS activities in VIC and QLD,
where a combined revenue figure of $4.6 billion is projected;
The majority of revenue created by NRAS nationally, approximately $5.7 billion, will be
collected by the Federal Government.
Assuming the current proportion of NRAS dwellings across all states and the existing mix of NRAS
dwelling types in each state, Table 8 and Figure 4 shows the average revenue expected to be
generated per each NRAS incentive and bedroom by 2026.
Table 8: Average Revenue Generated per NRAS Incentive and Bedroom
Average Revenue per Incentive Average Revenue per Bedroom
VIC $256,000 $162,000
QLD $160,000 $63,000
NSW $148,000 $87,000
ACT $300,000 $208,000
WA $121,000 $70,000
SA $141,000 $58,000
TAS $260,000 $163,000
NT $303,000 $184,000
National $185,000 $94,000
9%
30%
61%
LocalGovernment
StateGovernment
FederalGovernment

National Rental Affordability Scheme: Economic and Taxation Impact Study
14
Figure 4: Average Revenue Generated per NRAS Incentive and Bedroom
As shown in Table 8:
On average, each NRAS dwelling created generates approximately $185,000 of revenue;
Each NRAS bedroom created generates around $94,000 of revenue; and
Due to the mix of NRAS dwelling types and relatively high median income figures in these
states, the highest average revenue per each NRAS incentive and bedroom is expected to be
generated in NT and ACT, respectively.
Table 9 and Figure 5 illustrate the relative amount of revenue generated for local, state and federal
government.
Table 9: Gross Revenue Generated by NRAS for Local, State and Federal Government
Revenue Source Amount ($ million)
Local Government
Development Application Fees 27
Infrastructure Contributions 150
Council Rates and Charges 691
State Government
Stamp Duty and Fees from Land Transaction 132
Stamp Duty and Fees from Property Transaction 1,506
Payroll Tax 1,001
Land Tax 44
Other Levies 55
Federal Government
GST from NRAS Dwelling Construction 1,174
Income Tax 3,397
Capital Gains Tax 1,082
Total 9,259
$-
$50
$100
$150
$200
$250
$300
$350
VIC QLD NSW ACT WA SA TAS NT National
Tho
usa
nd
s
Average revenue per incentive Average revenue per bedroom

National Rental Affordability Scheme: Economic and Taxation Impact Study
15
Figure 5: Sources of Revenue for State, Local and Federal Government
The following key points are evident in Table 9 and Figure 5:
The majority of revenue for local councils is from annual rates and charges, which are
collected on an on-going basis;
State government authorities’ primary source of revenue from NRAS is generated from
stamp duties and other fees associated with NRAS dwelling transactions; and
The Federal Government’s revenue is primarily collected from income taxes associated with
NRAS-driven jobs.
3%
17%
80%
DevelopmentApplication Fees
InfrastructureContributions
Council Ratesand Charges
5%
55%
36%
1% 2% Stamp Duty andFees from LandTransaction
Stamp Duty andFees fromPropertyTransaction
Payroll Tax
21%
60%
19% GST from NRASDwellingConstruction
Income Tax
Capital Gains Tax
Local Government State Government
Federal Government

National Rental Affordability Scheme: Economic and Taxation Impact Study
16
6 Employment Generated by NRAS
6.1 Introduction
While the primary goal of NRAS is to increase the supply of affordable rentals, various activities
associated with the provision of such dwellings result in economic benefits in the form of
employment generation. Some of these activities include:
Consultation for planning, designing and obtaining development permit for NRAS dwellings;
Construction of NRAS dwellings;
Transport and logistics; and
Sales of construction materials.
The above activities directly create employment in the construction industry as a result of NRAS
scheme. In addition, indirect employment will be created in other industries through multiplier
effects as a result of flow on purchasing occurring through the economy, stimulated by the income
created as part of the activities above. As noted previously in Section 4.1, all jobs created by NRAS
were assumed to continue for one year and are not permanent.
To quantify the number of direct and indirect jobs created by NRAS, the study applied the labour
coefficients outlined in the Australian Bureau of Statistics’ (1995) publication, “Information Paper
Australian National Accounts Introduction to Input-Output Multipliers – Catalogue No. 5246.0,” to
the total construction value of sample NRAS dwellings. These coefficients are:
10.0090 full-time equivalent jobs created in the construction industry for every one million
dollars of construction activities (direct jobs); and
1.727 full-time equivalent jobs created in other industries for each job created in the
construction industry (indirect jobs).
Following the quantification of jobs created per each NRAS dwelling, the methodology outlined in
Section 4 was then applied to project the number of full-time equivalent jobs created at the state
and national levels.

National Rental Affordability Scheme: Economic and Taxation Impact Study
17
6.2 Findings
Table 10 and Figure 6 display the approximate number of full-time equivalent jobs in the
construction industry (direct jobs) and other industries (indirect jobs) created by NRAS activities.
Table 10: Direct and Indirect Jobs Created by NRAS
State Direct Jobs
Indirect Jobs Total Jobs Construction Consulting
VIC 28,000 7,450 61,000 97,000
QLD 21,000 5,700 47,000 74,000
NSW 12,000 3,100 26,000 41,000
ACT 9,500 2,500 21,000 33,000
SA 7,000 1,900 15,000 24,000
WA 7,000 1,900 15,000 24,000
TAS 6,000 1,600 13,000 21,000
NT 4,500 1,200 9,800 16,000
National 95,000 25,000 208,000 329,000
Figure 6: Direct and Indirect Jobs Created by NRAS
Table 10 and Figure 6 illustrate that:
A total of 329,000 jobs will be created by NRAS by 2016;
The highest number of direct and indirect jobs are concentrated in VIC where approximately
97,000 jobs will be created; and
The majority of jobs created are indirect jobs created through the multiplier effect.
Table 11 and Figure 7 illustrate the average number of jobs created per each NRAS dwelling and
bedroom in different states.
-
10
20
30
40
50
60
70
VIC QLD NSW ACT SA WA TAS NT
Tho
usa
nd
s
Construction Jobs Design/Consulting Jobs Indirect Jobs

National Rental Affordability Scheme: Economic and Taxation Impact Study
18
Table 11: Average Number of Jobs Created per NRAS Incentive and Bedroom
Average Job per Incentive Average Job per Bedroom
VIC 11 7
QLD 5 2
NSW 5 3
WA 5 3
SA 5 2
ACT 7 5
TAS 11 7
NT 11 7
National 7 3
Figure 7: Average Number of Jobs per NRAS Incentive and Bedroom
The following observations could be made from Table 11 and Figure 7:
Nationally, each NRAS property creates additional seven jobs in the construction and other
industries whereas each NRAS bedroom creates 3 jobs;
VIC, TAS and NT have the highest number of jobs created per each NRAS property and
bedroom.
Figure 8 shows the total number of jobs created nationally by NRAS as at 2013 and per year from
2014 to 2016.
0
2
4
6
8
10
12
VIC QLD NSW ACT SA WA TAS NT National
Average Job per Incentive Average Job per Bedroom

National Rental Affordability Scheme: Economic and Taxation Impact Study
19
Figure 8: Total Number of Jobs Created by NRAS
As shown in Figure 8, as at June 2013, a total of 253,000 jobs had been created by the NRAS
initiative. Additional 75,000 jobs, or 25,000 jobs annually, are expected to be created by 2016. Table
12 and Figure 9 display the total NPV of income generated by direct and indirect jobs created by
NRAS. The income figures were quantified by multiplying the number of jobs created in each state to
the median income figure of each state.
Table 12: Income Generated by NRAS-Driven Jobs
Income ($ Billion)
VIC 5.6
QLD 4.3
NSW 2.4
ACT 1.6
SA 1.3
WA 1.5
TAS 1.2
NT 1
National 18.9
Figure 9: Income Generated by NRAS-Driven Jobs per Year
Table 12 and Figure 9 illustrate that a total of $18.9 billion of income will be generated on an annual
basis by NRAS-driven jobs. The majority of the income will be generated in VIC and QLD, with the
253
25 25 25
-
50
100
150
200
250
As at 2013 2014 2015 2016
Tho
usa
nd
s
$-
$1
$2
$3
$4
$5
$6
VIC QLD NSW ACT SA WA TAS NT
Bill
ion
s

National Rental Affordability Scheme: Economic and Taxation Impact Study
20
combined annual income of $9.8 billion. Table 13 and Figure 10 display average income generated
per each NRAS incentive and bedroom.
Table 13: Average Income Generated per NRAS Incentive and Bedroom
Average Income per Incentive Average Income per Bedroom
VIC $640,000 $400,000
QLD $300,000 $118,000
NSW $285,000 $166,000
WA $223,000 $128,000
SA $274,000 $114,000
ACT $459,000 $317,000
TAS $602,000 $376,000
NT $744,000 $454,000
National Average $378,000 $192,000
Figure 10: Average Income per NRAS Incentive and Bedroom
The following observations could be made from Table 13 and Figure 10:
Nationally, each NRAS incentive creates a total of $378,000 in income whereas each NRAS
bedroom generates $192,000 in income for Australian workforce; and
The highest amount of average income is generated in NT where each NRAS incentive and
bedroom creates $744,000 and $454,000, respectively.
$-
$100
$200
$300
$400
$500
$600
$700
$800
Tho
usa
nd
s
Average Income per Incentive Average Income per Bedroom
National Rental Affordability Scheme: Economic and Taxation Impact Study
21
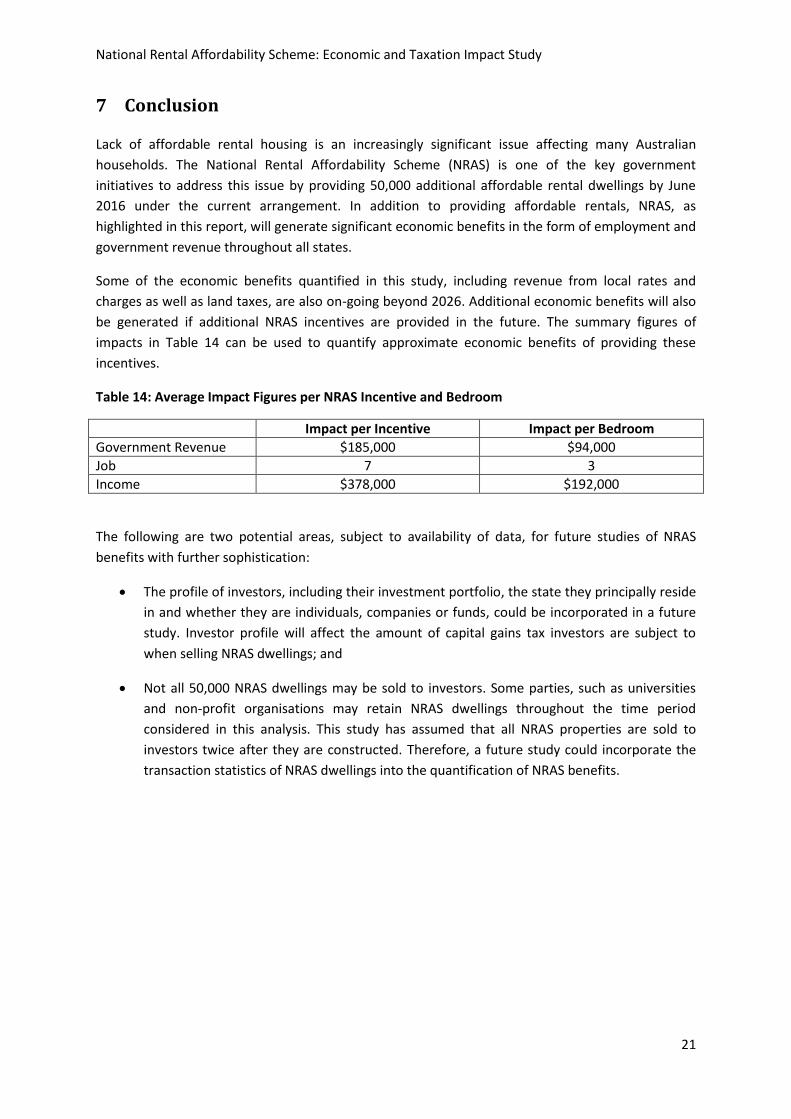
7 Conclusion
Lack of affordable rental housing is an increasingly significant issue affecting many Australian
households. The National Rental Affordability Scheme (NRAS) is one of the key government
initiatives to address this issue by providing 50,000 additional affordable rental dwellings by June
2016 under the current arrangement. In addition to providing affordable rentals, NRAS, as
highlighted in this report, will generate significant economic benefits in the form of employment and
government revenue throughout all states.
Some of the economic benefits quantified in this study, including revenue from local rates and
charges as well as land taxes, are also on-going beyond 2026. Additional economic benefits will also
be generated if additional NRAS incentives are provided in the future. The summary figures of
impacts in Table 14 can be used to quantify approximate economic benefits of providing these
incentives.
Table 14: Average Impact Figures per NRAS Incentive and Bedroom
Impact per Incentive Impact per Bedroom
Government Revenue $185,000 $94,000
Job 7 3
Income $378,000 $192,000
The following are two potential areas, subject to availability of data, for future studies of NRAS
benefits with further sophistication:
The profile of investors, including their investment portfolio, the state they principally reside
in and whether they are individuals, companies or funds, could be incorporated in a future
study. Investor profile will affect the amount of capital gains tax investors are subject to
when selling NRAS dwellings; and
Not all 50,000 NRAS dwellings may be sold to investors. Some parties, such as universities
and non-profit organisations may retain NRAS dwellings throughout the time period
considered in this analysis. This study has assumed that all NRAS properties are sold to
investors twice after they are constructed. Therefore, a future study could incorporate the
transaction statistics of NRAS dwellings into the quantification of NRAS benefits.

National Rental Affordability Scheme: Economic and Taxation Impact Study
22
8 References
Anglicare Australia. (2013). 2013 Anglicare Australia Rental Affordability Snapshot. Retrieved from
http://goo.gl/ulhcVp
Australian Bureau of Statistics. (1995). Information Paper Australian National Accounts Introduction
to Input-Output Multipliers – Catalogue No. 5246.0. Retrieved from http://goo.gl/X860nw
Australian Bureau of Statistics. (2006). 4160.0 - Measuring Wellbeing: Frameworks for Australian
Social Statistics, 2001. Retrieved from http://goo.gl/WbSHbg
Australian Bureau of Statistics. (2013). 6523.0 - Household Income and Income Distribution,
Australia, 2011-12. Retrieved from http://goo.gl/83stE1
FaHCSIA. (2013). National Rental Affordability Scheme Monthly Performance Report – 30 June 2013.
Retrieved from http://goo.gl/B7g0WR
Milligan, V, Yates, J., Wiesel, I. & Pawson, H. (2013). Financing rental housing through institutional
investment - Volume 1: outcomes from an Investigative Panel. Retrieved from http://goo.gl/svhvs7
National Housing Supply Council. (2012). Housing Supply and Affordability Key Indicators 2012.
Canberra: Australian Government.
Pro Bono Australia. (2013). Unaffordable Housing Worsens – Report. Retrieved from
http://goo.gl/cpFfE0
Watson, P., Wilson, J., Thilmany, D. & Winter, S. (2007) Determining Economic Contributions and
Impacts: What is the difference and why do we care? The Journal of Regional Analysis & Policy,
37(2), 1-15. Retrieved from http://goo.gl/Ry9etT


