National Research National Research Council Council Assessment of Research Assessment of Research Doctorate Programs Doctorate Programs Summary of Methodology http://www.nap.edu/catalog.php?reco rd_id=12676 Michigan State University
Transcript
National Research CouncilNational Research Council
Assessment of Research Assessment of Research Doctorate ProgramsDoctorate Programs
• Each field of study had produced at least 500 Ph.D.s in the 5 years prior to 2004-05.
• To be included, each University program must have granted 5 Ph.D. degrees in the 5 years prior to 2005-06.
3
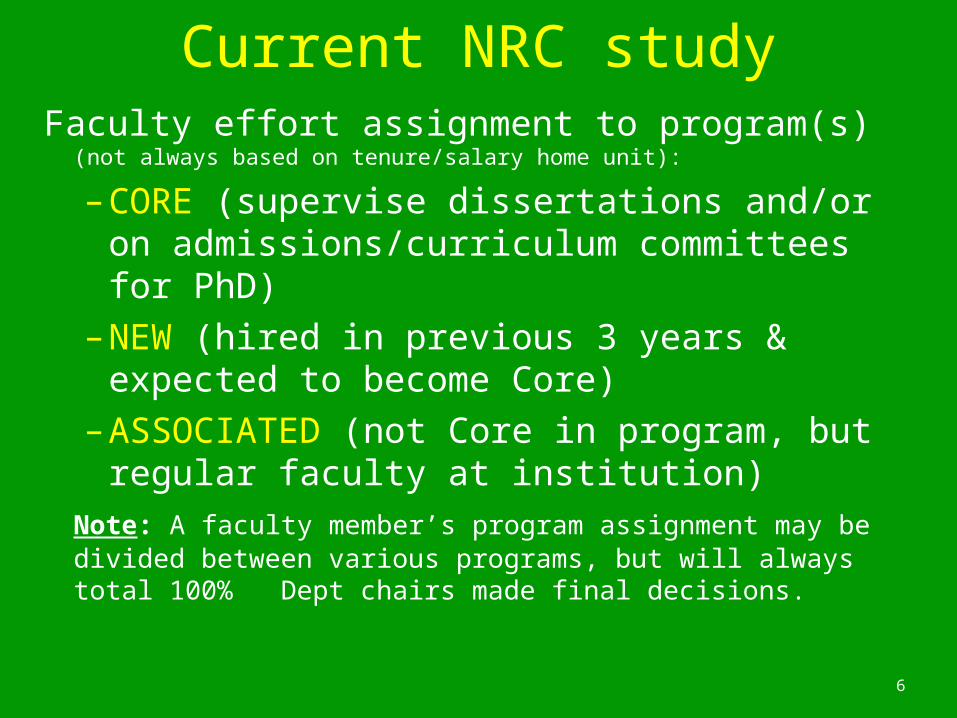
Current NRC study
• The taxonomy of fields was hotly debated. Used CIP codes (US Dept of Ed taxonomy), NSF fields, & info from scholarly societies.
• It is what it is! Not very useful for interdisciplinary programs as faculty effort was sub-divided. Universities use different names for similar programs.
5. Rating Questionnaire: Asked faculty to rate programs in their field
• Raters classified by rank, geographic region, faculty size in program. Each faculty member rated 15 programs with data provided. Not asked about basis for rating.
9
Current NRC study
• In addition to the questionnaires, publications and citations data were collected thru ISI database http://isiwebofknowledge.com/.
• Humanities CVs submitted with faculty questionnaire were used to count books and publications.
• Honors and awards data came from 224 scholarly societies.
10
The 20 Variables (Question G on Faculty Questionnaire)• Publications per Allocated Faculty*, 2001-2006 (going back to 1986 for faculty in
humanities fields)
• Average Citations per Publication (citations in 2001-2006 to articles dating back to 1981—for all fields except the humanities)
• Percent Non-Asian Minority Faculty for Core or New Faculty, 2006**
• Percent Female Faculty for Core or New Faculty, 2006**
• Awards per Allocated Faculty*
• Average GRE, 2004-2006 (Verbal measure for the humanities, Quantitative measure for all other fields)
• Percent students receiving full support in the first year, (fall 2006)
• Percent first year students with external funding, 2006
* Faculty members who served in more than one program were allocated to those programs based on whether they were core in the program and the share of that program of total dissertations supervised. 11
The 20 Variables (continued)• Percent Non-Asian Minority Students, 2006
• Percent Female Students, 2006
• Percent International Students, 2006
• Average annual PhDs graduated 2002 to 2006
• Average completions (8 year completion percentage for humanities fields, 6 years for other fields)
• Time-to-Degree (for Full and Part Time graduates)
• Percent PhDs with definite plans for an academic position, 2001-2005 (including postdoctoral fellowships)
• Student Work Space [1 = 100% of students with workspace, -1 if <100% of students with workspace]
• Health Insurance [1= provides health insurance, -1 = does not provide health insurance]
• Student Activities (number offered from a list of 18)
** “Core” Faculty are those whose primary appointment is in the doctoral program. “New” faculty are faculty with tenure track appointments who were appointed in the past 3 years.
12
2009 NRC Methodology report
MSU task force of statistical/survey experts to study the report and provide input:
Brian Silver -- Director, Center for Statistical Consulting, Political Science
Neal Schmitt -- Chair, Department of Psychology
Les Manderscheid -- Ag, Food and Resource Economics and the Graduate School
Mary Black -- Assistant Director, Office of Planning and Budgets
Kyle Sweitzer -- Data Analyst, Office of Planning and Budgets
CONVENER: Karen Klomparens -- Dean, Graduate School
Methodology was complex and valid, with sources of uncertainty dealt with appropriately.
PROGRAMS WILL PROVIDE FURTHER INTERPRETATION OF THE DATA 13
NRC 2006 Methodology
14
Ranges of overall ratingstwo methods
1. Directly: Faculty chose the most important quality characteristics from Question G
2. Reputational rating: statistically related faculty ratings to the Question G variables.
Combined the direct and reputational weights, rank ordered. Used first and third quartiles of these ratings to yield a RANGE OF RATINGS for each program
15
Additional information• No student outcomes are reflected in the overall
rating, so 3 supplemental measures added
• NRC preparing a way for us to weight variables differently and run own ratings
• Not reporting data with less than 5 per cell• Combined small progs with others to calculate
weights
• Preparing a way for students to use data when considering programs
16
Supplemental RatingsResearch Impact
– Publications/faculty member– Citations/publication– Percent of faculty holding grants– Honors and awards per faculty member
Student Support and Outcomes
– Percent of students having full support in first year– Percent of students with portable fellowships in first year– Percentage of students with RAships– Percentage of students with TAships– Time-to-degree– Percent who complete in 6 years (sciences) or 8 years (humanities)– Placement in an academic position or postdoc after graduation
Source: C. Kuh, NAS
17
Supplemental Ratings (2)Diversity of the Academic Environment
– Percent of students who are female
– Percent of faculty who are female
– Percent of students from underrepresented minority group
– Percent of faculty from underrepresented minority group
– Percent of students who are international
Source: C. Kuh, NAS
18
Ranges of Ratings for a Field
• Programs will be arranged alphabetically and the range of ratings will be given for each.
• Ranges overlap other ranges for most programs. This means that there may be a number of programs of roughly the same quality.
• You should identify those similar programs in discussing the quality of your programs.
Source: C. Kuh, NAS19
What information will I receive about the rating calculation for my programs?
1) A list of the values of variables that your program supplied to the NRC or that was calculated from those variables
2) The normalized values for those variables
3) The median combined coefficient (statistical + direct) for each variable and its standard deviation
4) The range of the normalized variable values
5) The range of the combined effects of the coefficients in the random halves calculation
Source: C. Kuh, NAS 20
21
TABLE 5-1 Data and Coefficient Table for a Program in Economics
Standardized Program Values and Range of Combined Coefficients Institution Name: xxx Program Name: yyy
Publications per Allocated Faculty V1 1.074 2.180 0.118 0.132Cites per Publication V2 1.171 -0.234 0.276 0.307Percent of Faculty with Grants V3 25.50% -0.583 0.084 0.091Percent of Faculty Interdisciplinary V4 5.90% -0.641 n.s.# n.s.#Percent of Non-Asian Minority Faculty V5 7.70% 0.547 n.s.# n.s.#
Percent non-Asian Minority Students V11 10.00% 0.069 n.s.# n.s.#
Percent Female Students V12 44.40% 0.678 -0.038 -0.030Percent International Students V13 53.30% -0.509 n.s.# n.s.#Average PhDs 2002 to 2006 V14 5.4 -.0355 0.120 0.144Percent Completing within 6 years V15 27.60% -0.638 n.s.# n.s.#Time to Degree full and Part time V16 5.67 0.232 -0.028 -0.017Percent students in Academic Positions V17 11.10% -1.405 0.049 0.065
Student Work Space V18 1 1 n.s.# n.s.#Health Insurance V19 1 1 n.s.# n.s.#Number of Student Activities Offered V20 17 0.439 0.026 0.037
Program Program Value Description Variable Value Standardized Minus 1 SD TO Plus 1 SD
*Col 3 is based on data submitted by the program or calculated from these data.+ Col 4 is standardized across all program values in the field, with mean of 0 and variance of 1.** Col 5 is Minus 1 Standard Deviation from the Mean for the combined coefficients for the field as a whole** Col 6 is Plus 1 Standard Deviation from the Mean for the combined coefficients for the field as a whole# n.s. in a cell means the coefficient was not significantly different from 0 at the p=.05 level.
22
23
24
25
Analyzing the data by program
1. Identify variables with the largest contribution. These had the greatest effect on the range of ratings by program.
2. Compare your variable values with programs in other institutions. These will be available in an online database.
3. Consider any additional relevant comments about your program and the NRC methods.
26
Next steps• The data will be made available 24-72 hours before
they are publically released, and programs may review their data during this time. COMMENTS TO KK!
• Additional analyses will be conducted upon release of the data (by CIC, AAU, and by you!)
• This study improved MSU’s ability to have data readily available in a consistent fashion about students and committee memberships. Data collection has expanded to include ALL graduate programs (Master’s and Doctoral) via the GradInfo database.