Ethics and corruption in education National Seminar on: (Baku, Azerbaijan: 21-23 February 2006) ANTI-CORRUPTION ISSUES IN EDUCATION EDUCATION SUPPORT PROGRAM OPEN SOCIETY INSTITUTE The Center for Innovations in Education
Transcript
Ethics and corruption in education
National Seminar on:
(Baku, Azerbaijan: 21-23 February 2006)
ANTI-CORRUPTION ISSUESIN EDUCATION
EDUCATION SUPPORT PROGRAM
OPEN SOCIETY INSTITUTEThe Center for Innovations
in Education
A national Seminar on “Anti-corruption issues in education” was organised jointly by the International Institute for Educational Planning (IIEP), the Open Society Institute (OSI)1 and the Centre for Innovations in Education, from 21 to 23 February 2006 in Baku, Azerbaijan. The major aims of this Seminar were information and awareness building regarding the challenge of improving transparency and accountability in education; exposure to methodologies of successful anti-corruption measures; and the initiation of policy dialogue on anti-corruption in education.
This report includes the various materials that were prepared and used for the Seminar. The appendix contains the list of participants.
1 Education Support Program
1
1
Ethics and corruption in education: overview
Jacques Hallak and Muriel Poisson
“Corruption is a majordrain on the effective useof resources for education
and should bedrastically curbed”.
EFA(Dakar, 2000)
Seminar on: “Transparency, ethics andanti-corruption measures in education”
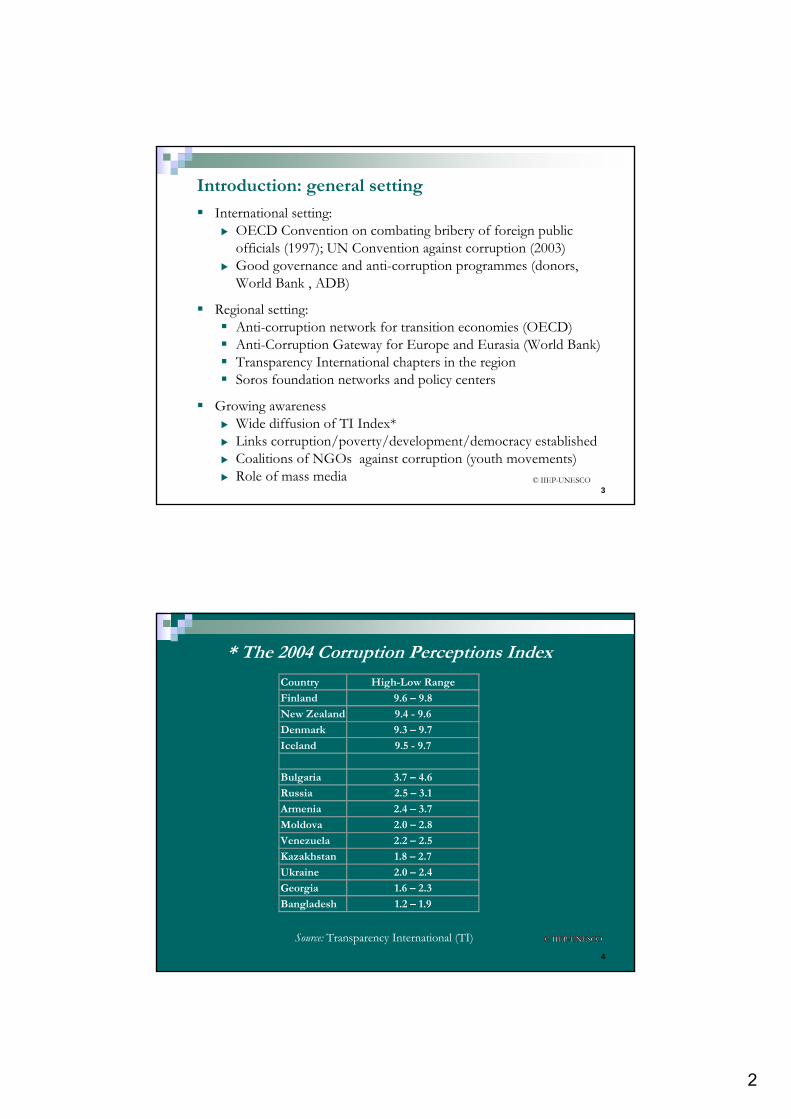
International setting:OECD Convention on combating bribery of foreign public officials (1997); UN Convention against corruption (2003)Good governance and anti-corruption programmes (donors, World Bank , ADB)
Regional setting:Anti-corruption network for transition economies (OECD)Anti-Corruption Gateway for Europe and Eurasia (World Bank)Transparency International chapters in the regionSoros foundation networks and policy centers
Growing awarenessWide diffusion of TI Index*Links corruption/poverty/development/democracy establishedCoalitions of NGOs against corruption (youth movements)Role of mass media
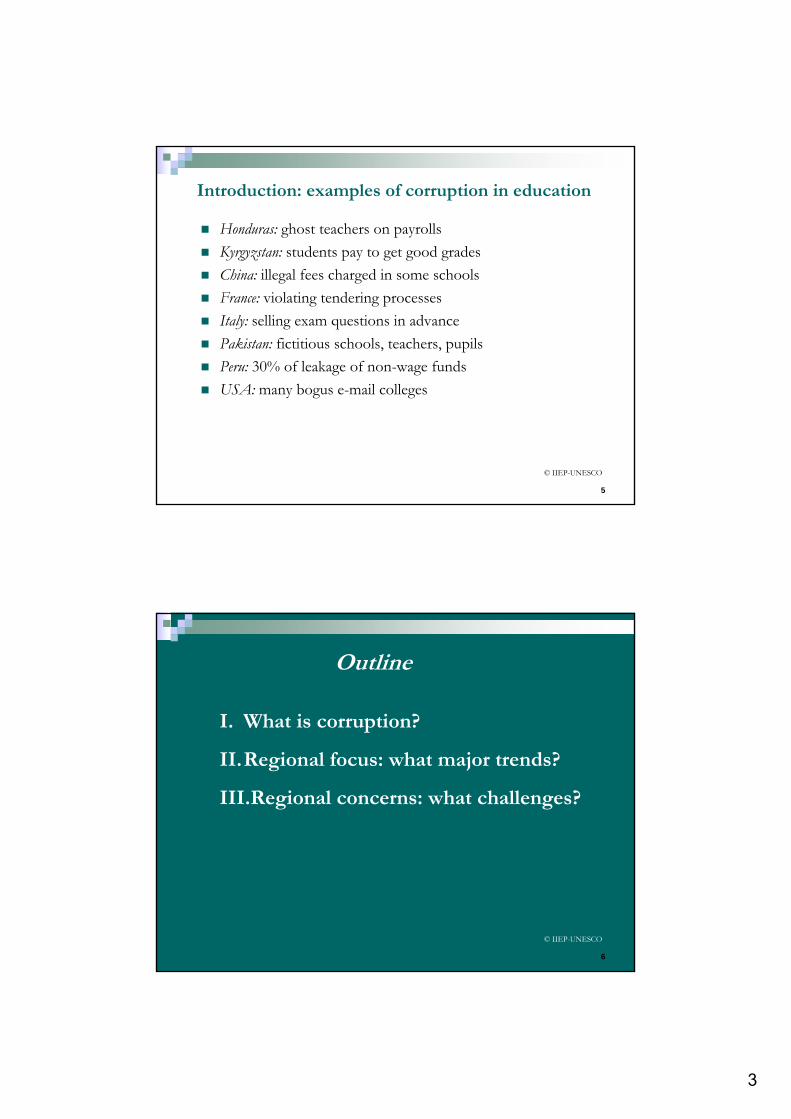
Honduras: ghost teachers on payrollsKyrgyzstan: students pay to get good gradesChina: illegal fees charged in some schoolsFrance: violating tendering processesItaly: selling exam questions in advancePakistan: fictitious schools, teachers, pupilsPeru: 30% of leakage of non-wage fundsUSA: many bogus e-mail colleges
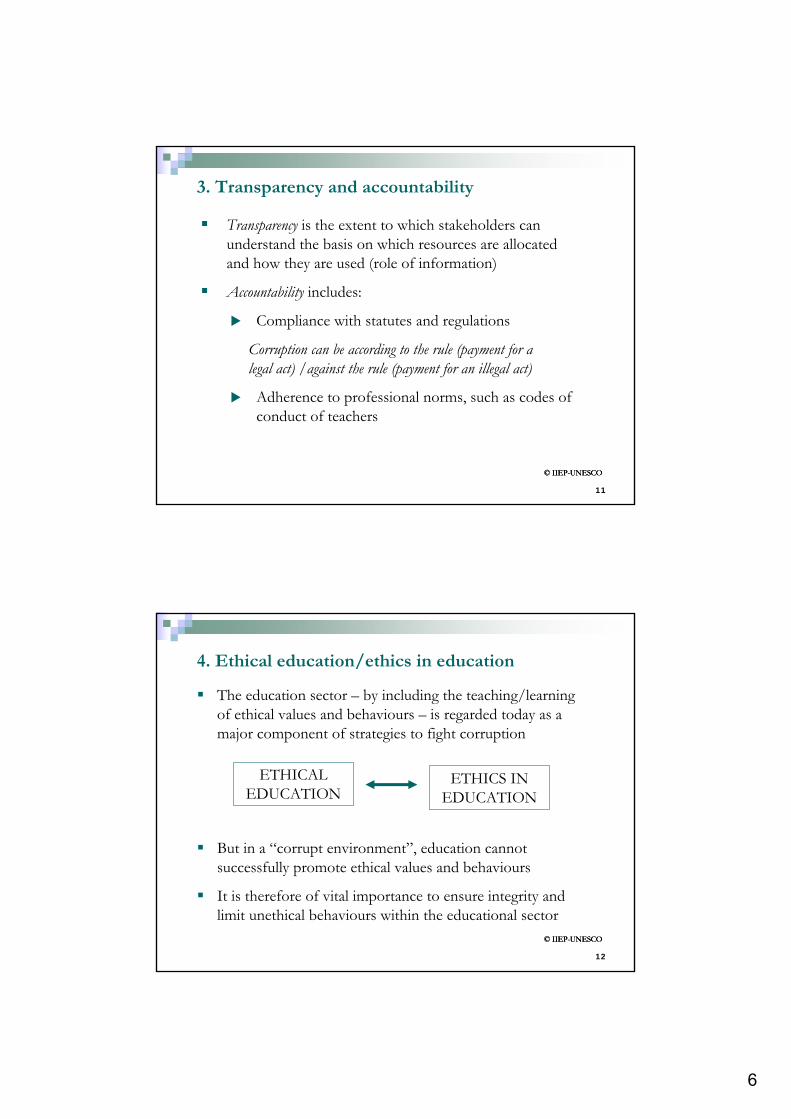
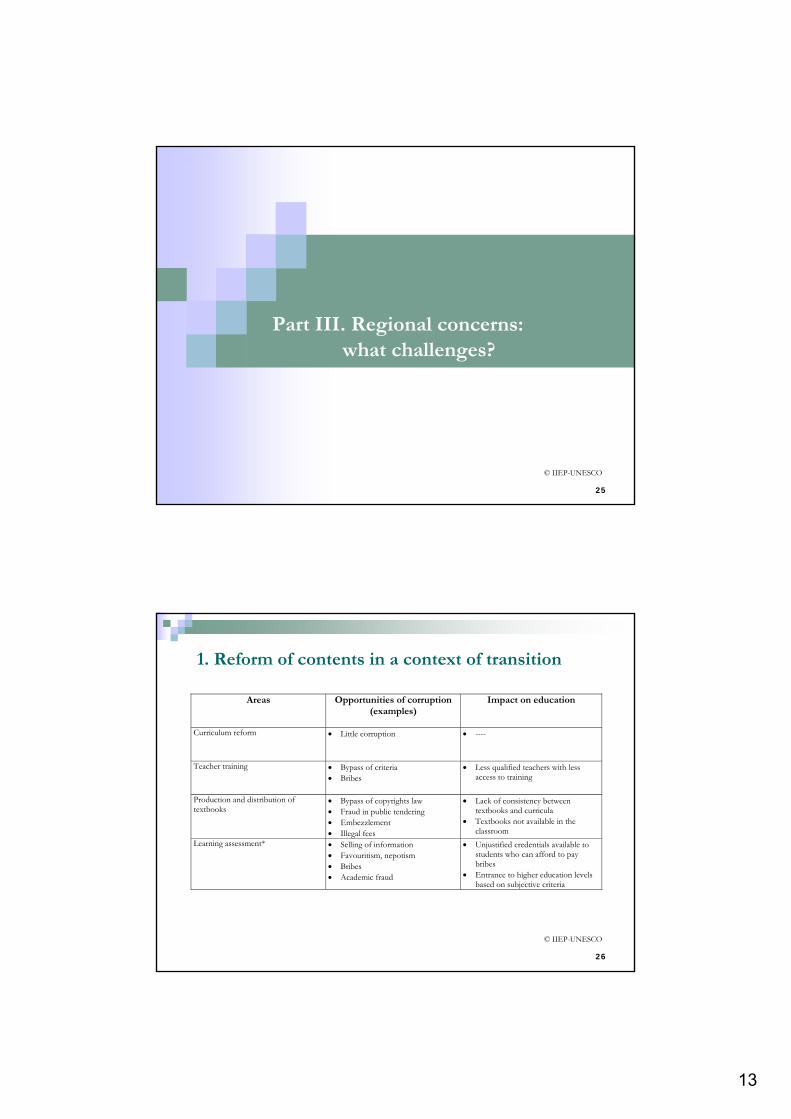
The education sector – by including the teaching/learning of ethical values and behaviours – is regarded today as a major component of strategies to fight corruption
But in a “corrupt environment”, education cannot successfully promote ethical values and behaviours
It is therefore of vital importance to ensure integrity and limit unethical behaviours within the educational sector
* Surveys on textbooks in the PhilippinesSurveys on textbooks conducted by the NAMFREL
Findings:5 pupils had to share one textbook (norm: 1 textbook/child)10,000 textbooks faulty from the publishers, incorrect numbers of textbooks delivered, deadlines not adhered to, delivered textbooks not fulfilling the curriculum
Dissemination of the results through the press:Overpricing decreased significantly and the average price per book fell to less than half37 million textbooks procured within the allocated timeframe of 12 months, instead of the usual 24 months
Textbook monitoring exercise institutionalized within the MOE
MOE’s ranking: from 1 of the 5 most corrupt government agencies to 1 of the 5 least corrupt
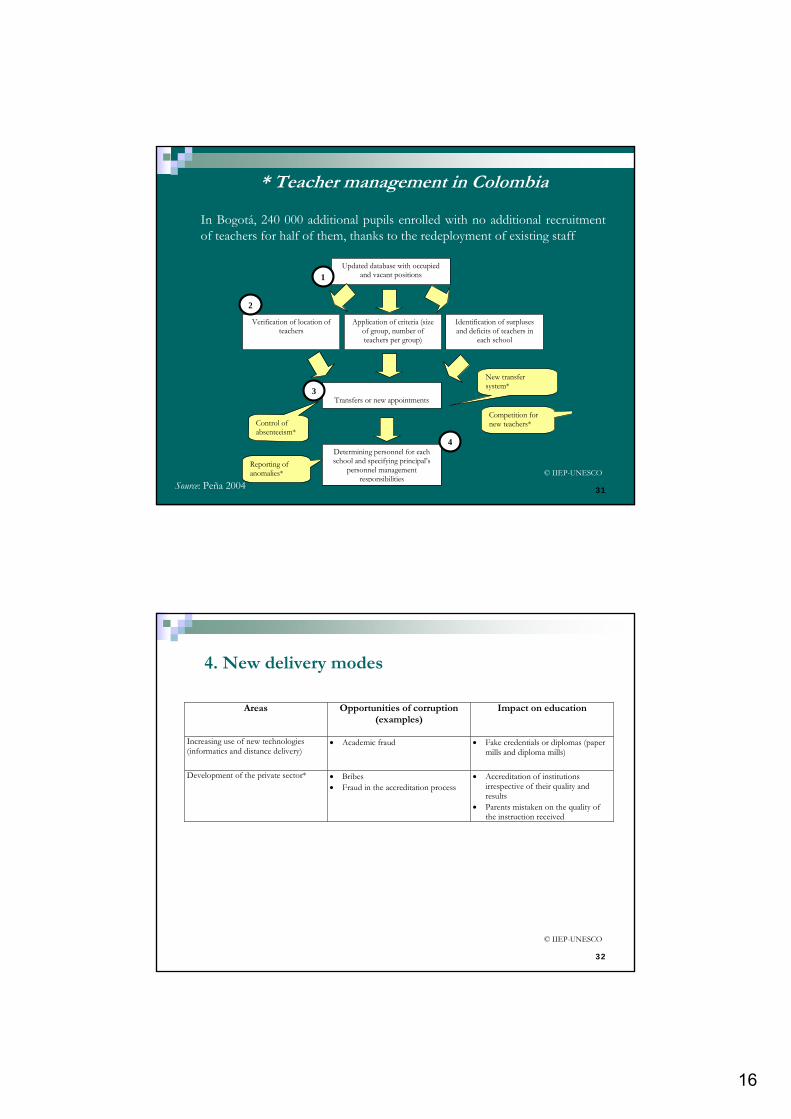
Updated database with occupied and vacant positions
Verification of location of teachers
Application of criteria (size of group, number of teachers per group)
Identification of surpluses and deficits of teachers in
each school
Transfers or new appointments
Determining personnel for each school and specifying principal’s
personnel management responsibilities
New transfer system*
Competition for new teachers* Control of
absenteeism*
Reporting of anomalies*
1
2
3
4
In Bogotá, 240 000 additional pupils enrolled with no additional recruitment of teachers for half of them, thanks to the redeployment of existing staff
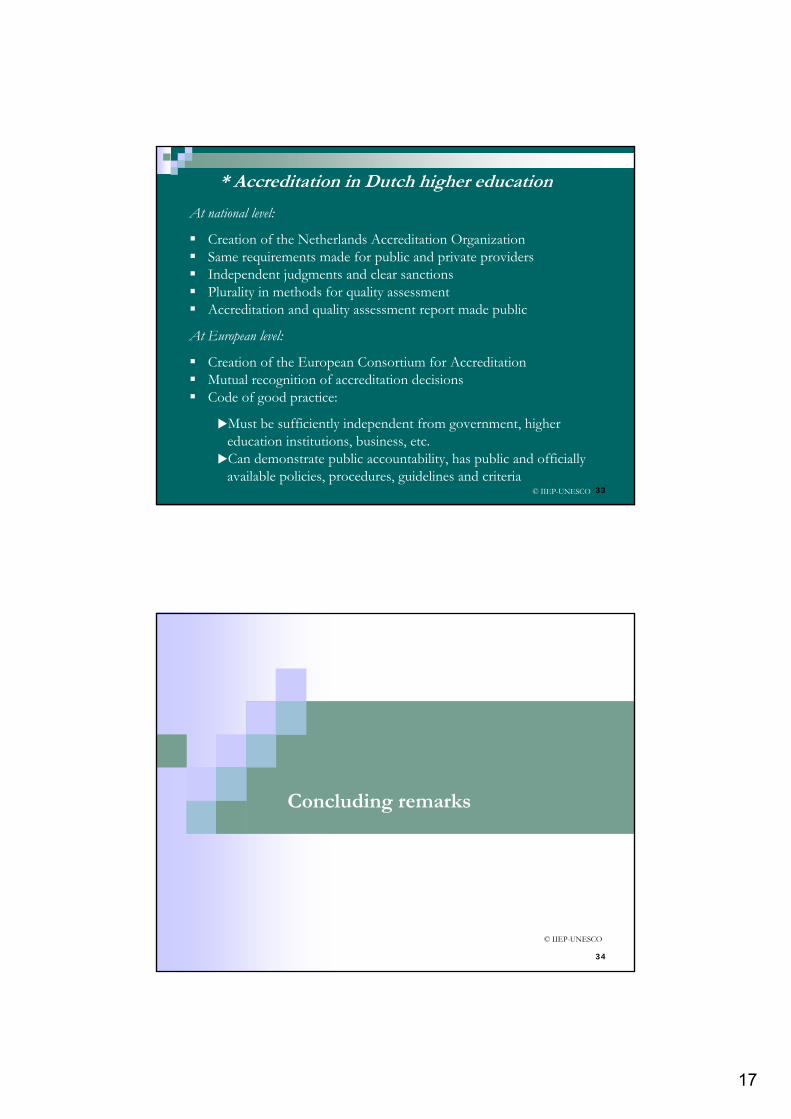
Creation of the Netherlands Accreditation OrganizationSame requirements made for public and private providersIndependent judgments and clear sanctionsPlurality in methods for quality assessmentAccreditation and quality assessment report made public
At European level:
Creation of the European Consortium for AccreditationMutual recognition of accreditation decisionsCode of good practice:
Must be sufficiently independent from government, higher education institutions, business, etc.Can demonstrate public accountability, has public and officiallyavailable policies, procedures, guidelines and criteria
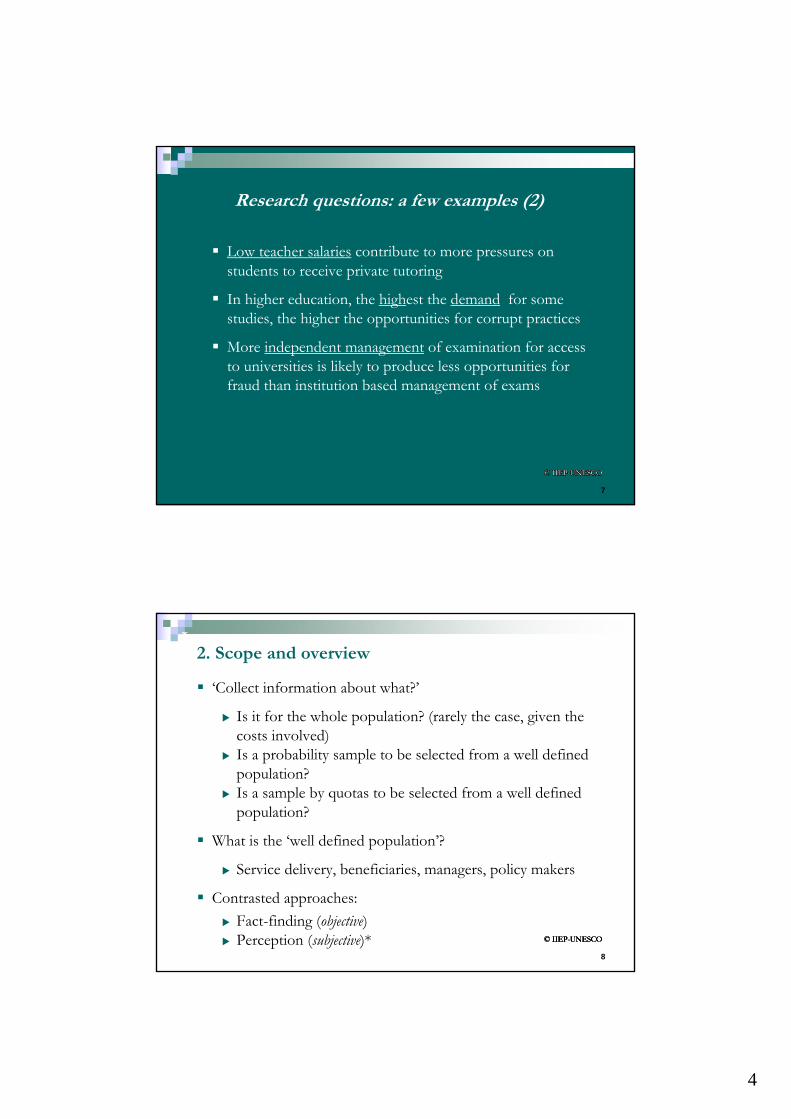
Low teacher salaries contribute to more pressures on students to receive private tutoring
In higher education, the highest the demand for some studies, the higher the opportunities for corrupt practices
More independent management of examination for access to universities is likely to produce less opportunities for fraud than institution based management of exams
Is it for the whole population? (rarely the case, given the costs involved)Is a probability sample to be selected from a well defined population?Is a sample by quotas to be selected from a well defined population?
What is the ‘well defined population’?
Service delivery, beneficiaries, managers, policy makers
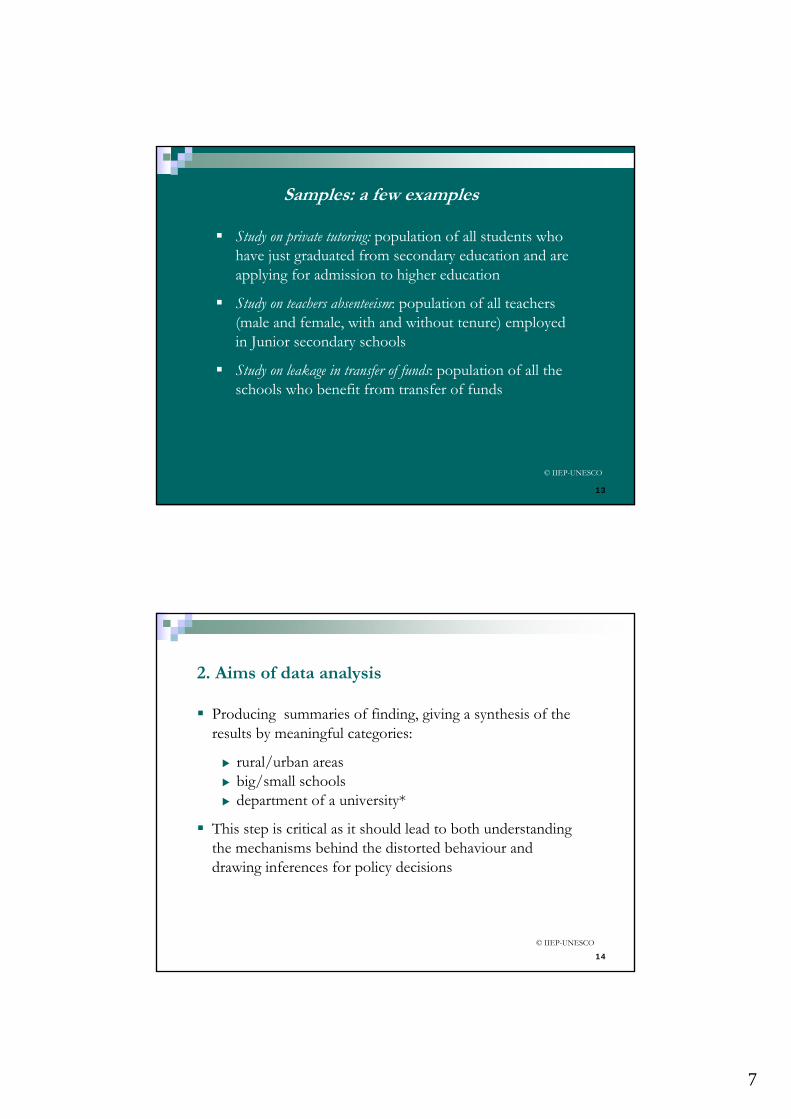
Study on private tutoring: population of all students who have just graduated from secondary education and are applying for admission to higher education
Study on teachers absenteeism: population of all teachers (male and female, with and without tenure) employed in Junior secondary schools
Study on leakage in transfer of funds: population of all the schools who benefit from transfer of funds
Producing summaries of finding, giving a synthesis of the results by meaningful categories:
rural/urban areasbig/small schoolsdepartment of a university*
This step is critical as it should lead to both understanding the mechanisms behind the distorted behaviour and drawing inferences for policy decisions
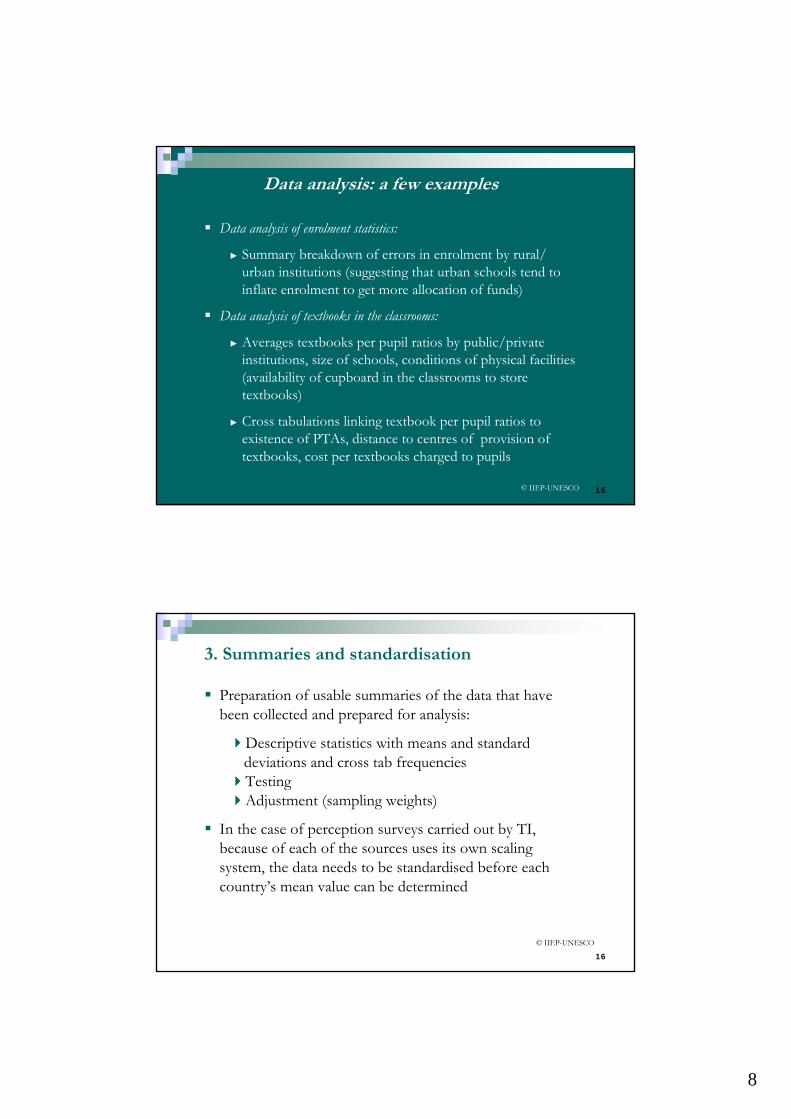
► Summary breakdown of errors in enrolment by rural/ urban institutions (suggesting that urban schools tend to inflate enrolment to get more allocation of funds)
Data analysis of textbooks in the classrooms:
► Averages textbooks per pupil ratios by public/private institutions, size of schools, conditions of physical facilities(availability of cupboard in the classrooms to store textbooks)
► Cross tabulations linking textbook per pupil ratios to existence of PTAs, distance to centres of provision of textbooks, cost per textbooks charged to pupils
Preparation of usable summaries of the data that have been collected and prepared for analysis:
Descriptive statistics with means and standard deviations and cross tab frequenciesTestingAdjustment (sampling weights)
In the case of perception surveys carried out by TI, because of each of the sources uses its own scaling system, the data needs to be standardised before each country’s mean value can be determined
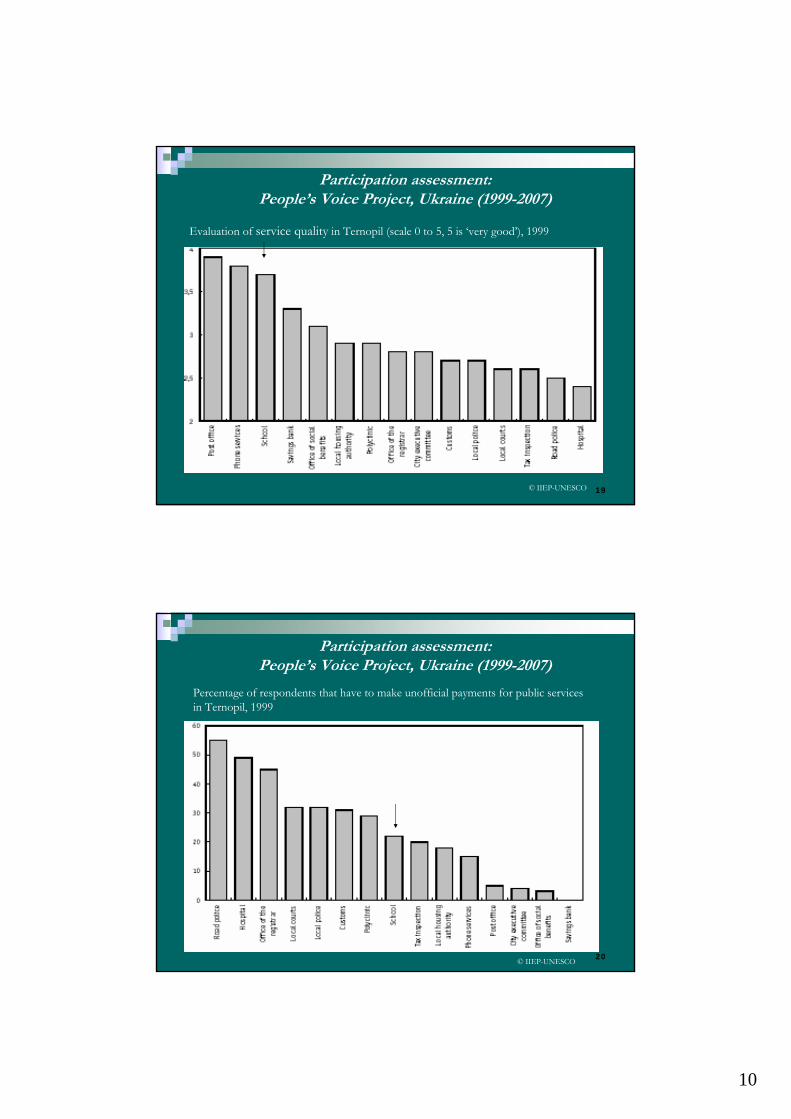
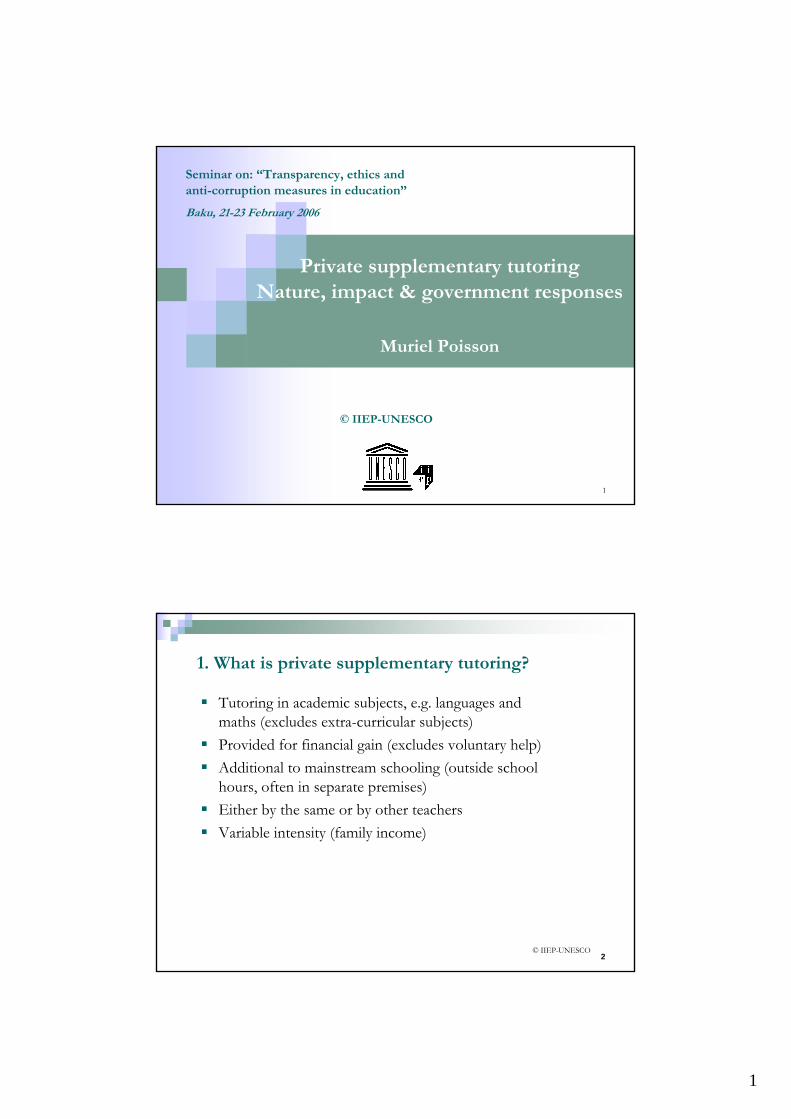
Strategies/tools put in place:Ad hoc education committee of 8- 10 persons, representing both education and the community interests (NGOs, parent council representatives, business leaders..)Public hearings on issues such as education financing, city budget preparation..Public awareness campaignsTraining courses for the local populationReport cards were developed, notably on educational policy in the city of Ternopil
Objectives:
To implement procedures that promote public participation and in that way encourage partnership between civil society and local government to resolve problems related to service delivery
To conduct an analysis of current education policies and to make recommendations on improving their effectiveness
Greater transparency and accessibility to municipal decision-makers
*Carried out by the Ternopil Agency of Urban Development and local stakeholders,including municipal authorities and NGO partners
The survey has been highly valued by local government as it not only gives them a sense of the scope of the problem, but they also begin to understand the need to involve the
general public in the decision-making process
‘Perception’ survey: the project in Ternopil began with the delivery of the Public Service Citizen Satisfaction Survey*, which assesses the quality of local public services, the attitudes of public servant and the perception
Tutoring in academic subjects, e.g. languages and maths (excludes extra-curricular subjects)Provided for financial gain (excludes voluntary help)Additional to mainstream schooling (outside school hours, often in separate premises)Either by the same or by other teachersVariable intensity (family income)
Systems intolerant of slow learnersClassroom teaching inadequate for passing examsControl of student promotion by teachersCompetition among schools (league tables)Evaluation of teachers made through their pupils’ resultsUniversity exams have “a gate-keeping function”
3
5
4. Does monopoly cause illicit behaviour?
Illicit behaviour flourishes when agents:
Have monopoly power over their clientsCan exercise their discretionHave weak accountability
This is true for teachers providing private tutoring to their own pupils
Such teachers are in a position to make more money by:
Failing in their duty in mainstream classesHinting that tutoring ensures the promotion of children
PST beneficial when it helps students understand mainstream lessons
PST harmful when:
Teachers neglect their mainstream dutiesStudents are less interested in mainstream classes or absentPT is examination-oriented, distorting mainstream curriculaPublic facilities are used for private interestsNon-transparent criteria are used for teacher deploymentPressure is exerted on parents to pay for private tuitionCurriculum is taught in a distorted wayPupils who do not attend private tutoring are penalised (including their deliberate failing)
Children submitted to private tutoring work harder than their parentsMany parents see this pressure as beneficialPrivate tutoring helps poor children gain social mobilityPrivate tutoring tends to increase social inequalitiesPrivate tutoring may be imposed on parents by tutors
Private tutoring helps students get higher degrees, and thus higher salaries
Private tutoring helps poorly paid teachers improve their incomes, but, at the same time:
Private tutoring wastes financial and human resources that could be better usedTutoring and cramming stifle creativityThe economic effects of private tutoring are ambiguous
Better use of teachers (remedial courses)Adjustment of wages (decline in enrolment)
Inform parents and beneficiaries:
Government campaign to educate parents on the choice of a tutorial schoolPublicity to warn operators and inform clients on their rights (Hong Kong)
Recognize and regulate private tutoring:
Publication of government laws and regulationsObligation of registration (safety, tax, monitoring)Self-regulatory processes; e.g. tutoring associations (Taiwan)
Toward Assessing Academic Fraudas part of Global Education Corruption
21-22 February, 2006
Baku, Azerbaijan
Toward Assessing Toward Assessing Academic FraudAcademic Fraudas part of Global as part of Global Education CorruptionEducation Corruption
2121--22 February, 2006 22 February, 2006
Baku, AzerbaijanBaku, Azerbaijan
Brian L. HeuserBrian L. HeuserPeabody CollegePeabody CollegeVanderbilt UniversityVanderbilt University
ACADEMIC ETHOS
“I will give you two tests today - one in honesty and the other in trigonometry. I hope that you will do very well on both. But, if you happen to fail one of them,
please let it be the one in trigonometry.”
-Dean Sarratt
ACADEMIC ETHOSACADEMIC ETHOS
““I will give you two tests today I will give you two tests today -- one in one in honesty and the other in trigonometry. I honesty and the other in trigonometry. I hope that you will do very well on both. hope that you will do very well on both. But, if you happen to fail one of them, But, if you happen to fail one of them,
please let it be the one in trigonometry.please let it be the one in trigonometry.””
--Dean Dean SarrattSarratt
2
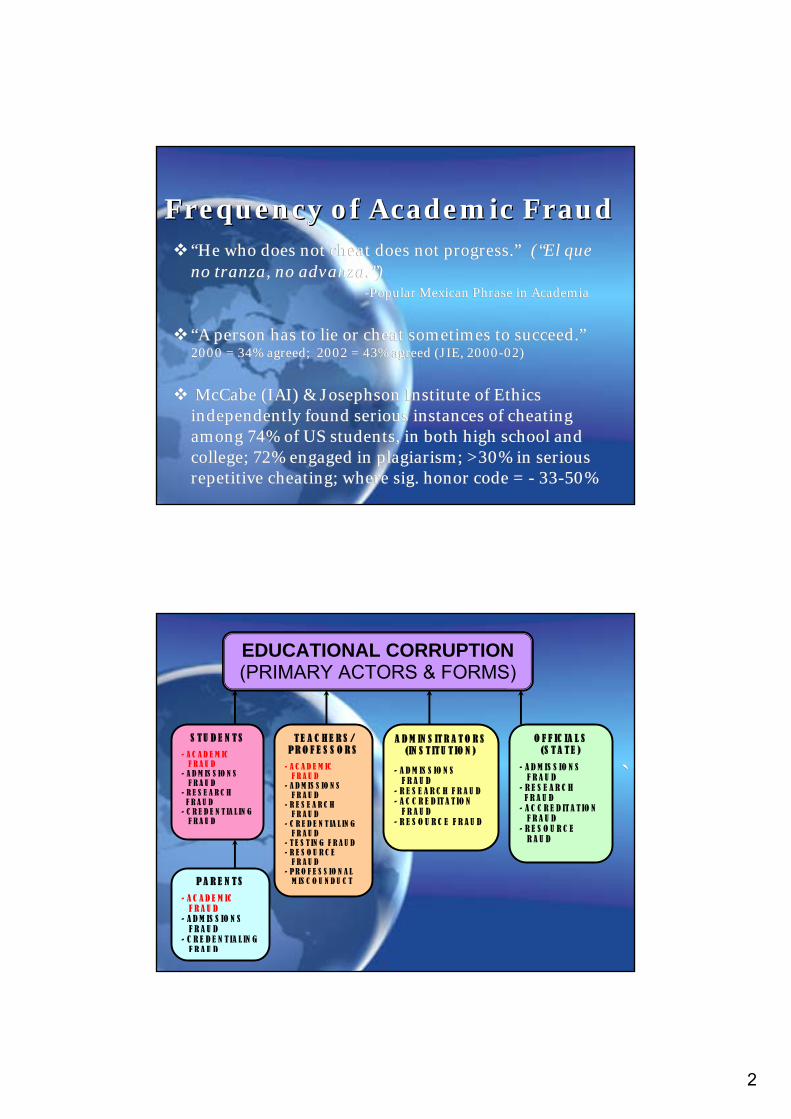
Frequency of Academic FraudFrequency of Academic FraudFrequency of Academic Fraud“He who does not cheat does not progress.” (“El queno tranza, no advanza.”)
-Popular Mexican Phrase in Academia
“A person has to lie or cheat sometimes to succeed.”2000 = 34% agreed; 2002 = 43% agreed (JIE, 2000-02)
McCabe (IAI) & Josephson Institute of Ethics independently found serious instances of cheating among 74% of US students, in both high school and college; 72% engaged in plagiarism; >30% in serious repetitive cheating; where sig. honor code = - 33-50%
“He who does not cheat does not progress.” (“El queno tranza, no advanza.”)
-Popular Mexican Phrase in Academia
“A person has to lie or cheat sometimes to succeed.”2000 = 34% agreed; 2002 = 43% agreed (JIE, 2000-02)
McCabe (IAI) & Josephson Institute of Ethics independently found serious instances of cheating among 74% of US students, in both high school and college; 72% engaged in plagiarism; >30% in serious repetitive cheating; where sig. honor code = - 33-50%
`̀
` EDUCATIONAL CORRUPTION
(PRIMARY ACTORS & FORMS)
S T U D E N T S
- A C A D E M IC F R A U D - A D M IS S IO N S F R A U D - R E S E A R C H F R A U D - C R E D E N T IA L IN G F R A U D
T E A C H E R S / P R O F E S S O R S
- A C A D E M IC F R A U D - A D M IS S IO N S F R A U D - R E S E A R C H F R A U D - C R E D E N T IA L IN G F R A U D - T E S T IN G F R A U D - R E S O U R C E F R A U D - P R O F E S S IO N A L M IS C O U N D U C T
O F F IC IA L S (S T A T E )
- A D M IS S IO N S F R A U D - R E S E A R C H F R A U D - A C C R E D IT A T IO N F R A U D - R E S O U R C E R A U D
A D M IN S IT R A T O R S (IN S T IT U T IO N )
- A D M IS S IO N S F R A U D - R E S E A R C H F R A U D - A C C R E D IT A T IO N F R A U D - R E S O U R C E F R A U D
P A R E N T S
- A C A D E M IC F R A U D - A D M IS S IO N S F R A U D - C R E D E N T IA L IN G F R A U D
3
Primary Categories of Educational CorruptionPrimary Categories of Primary Categories of Educational CorruptionEducational Corruption
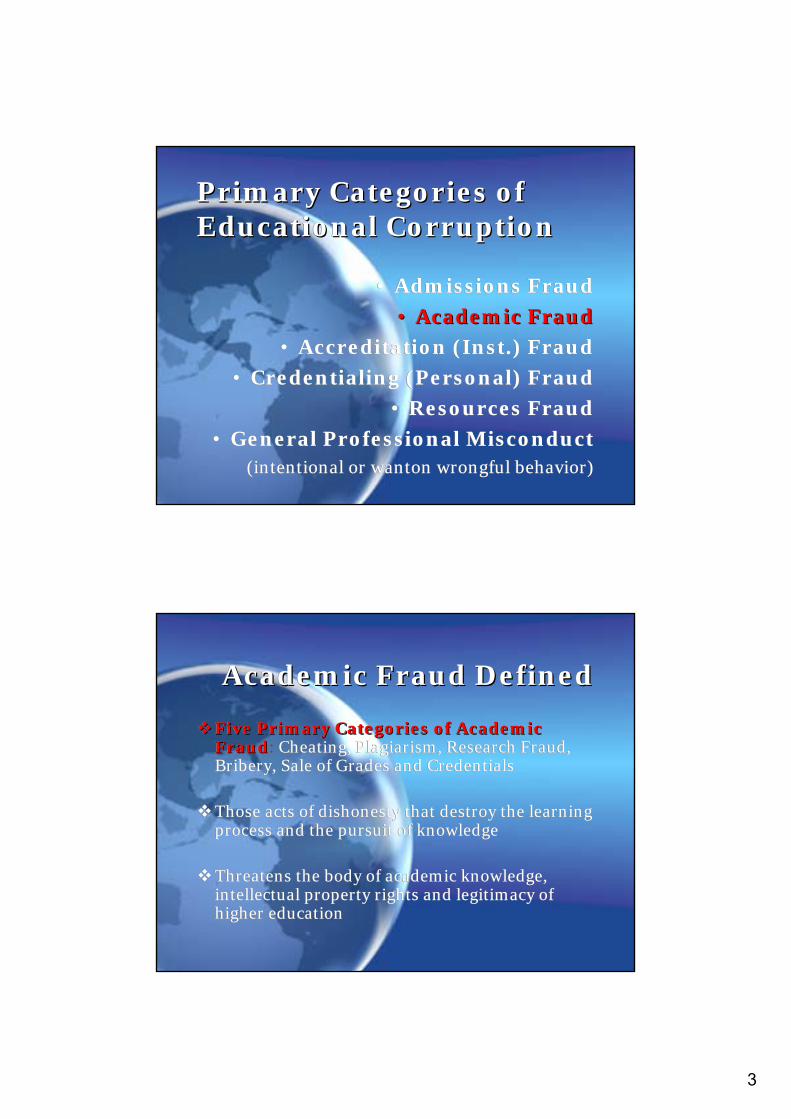
• Admissions Fraud
• Academic Fraud
• Accreditation (Inst.) Fraud
• Credentialing (Personal) Fraud
• Resources Fraud
• General Professional Misconduct(intentional or wanton wrongful behavior)
• Admissions Fraud
•• Academic FraudAcademic Fraud
• Accreditation (Inst.) Fraud
• Credentialing (Personal) Fraud
• Resources Fraud
• General Professional Misconduct(intentional or wanton wrongful behavior)
Academic Fraud DefinedAcademic Fraud DefinedAcademic Fraud Defined
Five Primary Categories of Academic Fraud: Cheating, Plagiarism, Research Fraud, Bribery, Sale of Grades and Credentials
Those acts of dishonesty that destroy the learning process and the pursuit of knowledge
Threatens the body of academic knowledge, intellectual property rights and legitimacy of higher education
Five Primary Categories of Academic Five Primary Categories of Academic FraudFraud: Cheating, Plagiarism, Research Fraud, Bribery, Sale of Grades and Credentials
Those acts of dishonesty that destroy the learning process and the pursuit of knowledge
Threatens the body of academic knowledge, intellectual property rights and legitimacy of higher education
4
Academic Fraud Cont’dAcademic Fraud Cont’d
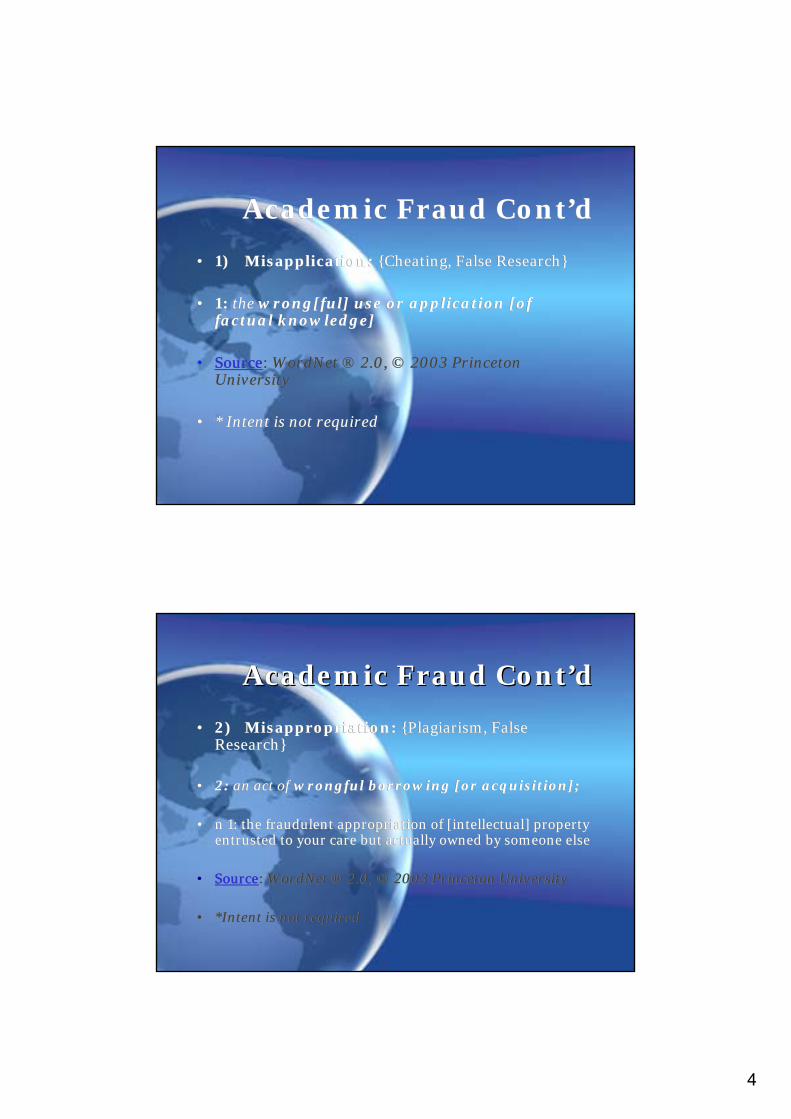
• 1) Misapplication: {Cheating, False Research}
• 1: the wrong[ful] use or application [of factual knowledge]
• 3: the wrongful representation of factual knowledge
• 2: an intentionally or sometimes negligently false representation made verbally, by conduct, or sometimes by nondisclosure or concealment and often for the purpose of deceiving, defrauding, or causing another to rely on it detrimentally;
• 3: the wrongful representation of factual knowledge
• 2: an intentionally or sometimes negligently false representation made verbally, by conduct, or sometimes by nondisclosure or concealment and often for the purpose of deceiving, defrauding, or causing another to rely on it detrimentally;
Challenges of AssessmentChallenges of AssessmentChallenges of Assessment
When asked to anonymously report their levels of drug/alcohol use, 99.7 responded [2650 of 2657]
When asked to anonymously report incidents of date rape, 97.3% responded [2585 of 2657]
When asked to anonymously report the kinds of academic fraud they’ve observed, 43.8% responded [1164 of 2657]
When asked to anonymously report the kinds of academic fraud they personally engaged in, only 17.3% responded! [460 of 2657]
6
A S S E S S I N G
ACADEMIC
FRAUD
ACTUAL
OBSERVED
1) The real level of Compliance with Academic Standards
2) The real rate at which acts of Academic Fraud are engaged in
3) Experienced Rigor of an Academic Code (if one is present)
4) Personal Belief in the Significance of Academic Integrity
1) Includes both that which has been
witnessed and/or experienced (acts of fraud and compliance to standards) 2) May include both that which is witnessed in others and as that which is personally engaged in
3) Includes both acts of fraud and interactions related to integrity
4) Subject to Personal Interpretation of Academic Integrity
Includes: 1) that which respondents are able to
recall and are willing to document when surveyed (acts of fraud and compliance to standards)
2) that which individuals have chosen to report to university officials, either formally or informally.
3) knowledge of academic standards and codes
4) observations and perceptions
1) Perceived level of Compliance with Academic Standards
2) Perceived rate at which acts of
Academic Fraud are engaged in
3) Perceived Rigor of Academic Code (if one is present)
4) Perceived Significance of Forms of Academic Fraud
PERCIEVED
REPORTED
Academic Integrity DefinedAcademic Integrity Defined
Academic Integrity: includes the following 5 elements: Honesty, Trust, Respect, Fairness, Responsibility, Equity (IAI)
Socializes educational constituents to an academic culture of credibility
* “Promotes the learning process and the pursuit of truth.” (IAI)
Academic IntegrityAcademic Integrity:: includes the following 5 elements: Honesty, Trust, Respect, Fairness, Responsibility, Equity (IAI)
Socializes educational constituents to an academic culture of credibility
* “Promotes the learning process and the pursuit of truth.” (IAI)
1
1
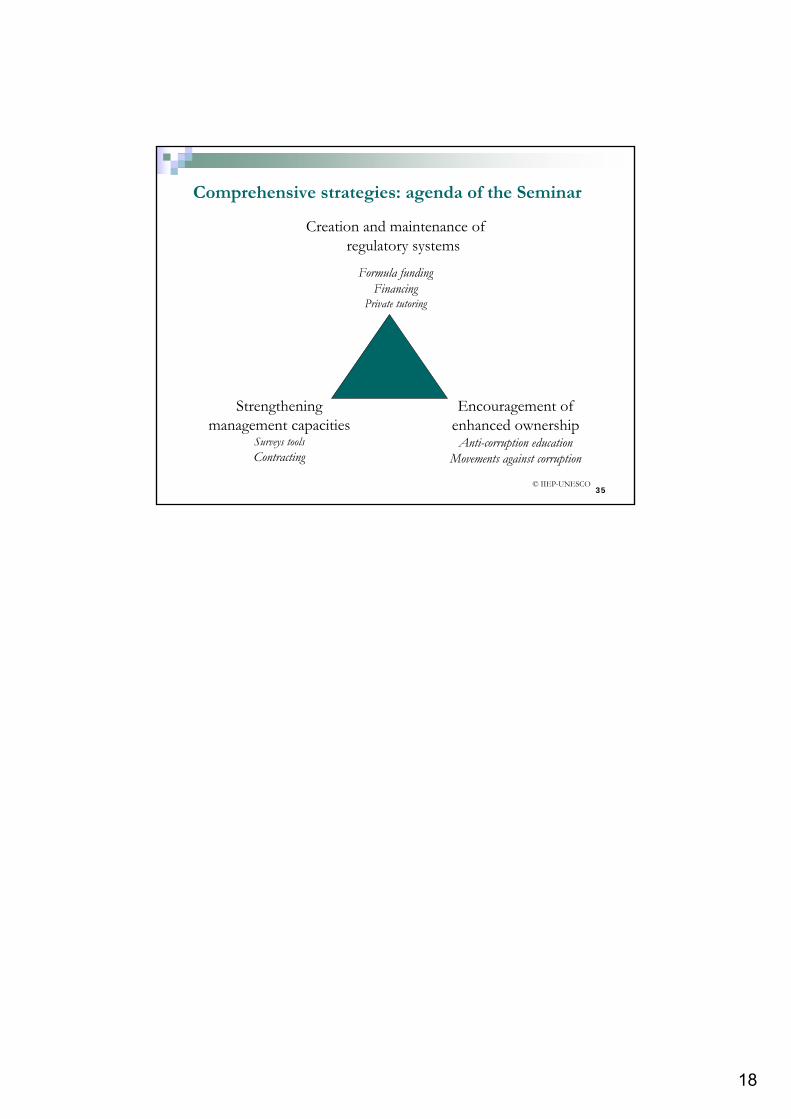
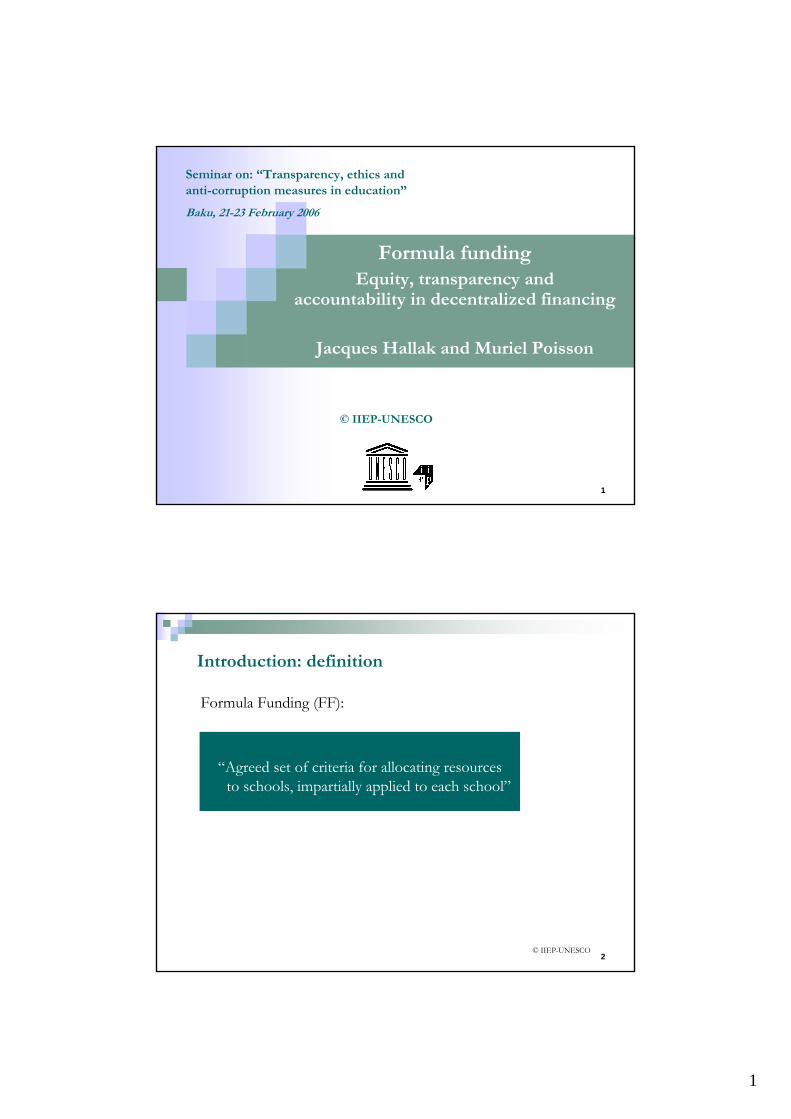
Formula fundingEquity, transparency and
accountability in decentralized financing
Jacques Hallak and Muriel Poisson
Seminar on: “Transparency, ethics andanti-corruption measures in education”
“Agreed set of criteria for allocating resources to schools, impartially applied to each school”
2
3
Introduction: decentralisation & school based management
Better relevance to needs and good governance can be expected by:
getting closer to the userspromoting participation and building ownership
At the same time, the introduction of FF and the delegation of spending decisions can increase the possibility of fraud asmany more people have direct access to funds
This depends obviously on ‘how FF operates in practice’
In the 1960s:Need to address the cases of schools with high concentration of disadvantaged pupilsAllocation of resources (not only funds) according to needs: Head Start in the USA, ZEP in France
In the 1990s:New trends in reforming public education inspired by liberalism/market oriented/democratic social orientationsDemand for more ownership, improved governance, efficiency, equity, freedom of choiceDecentralisation of authority to schools within a centrally determined framework of policies, priorities and standardsNew challenges for countries in transition
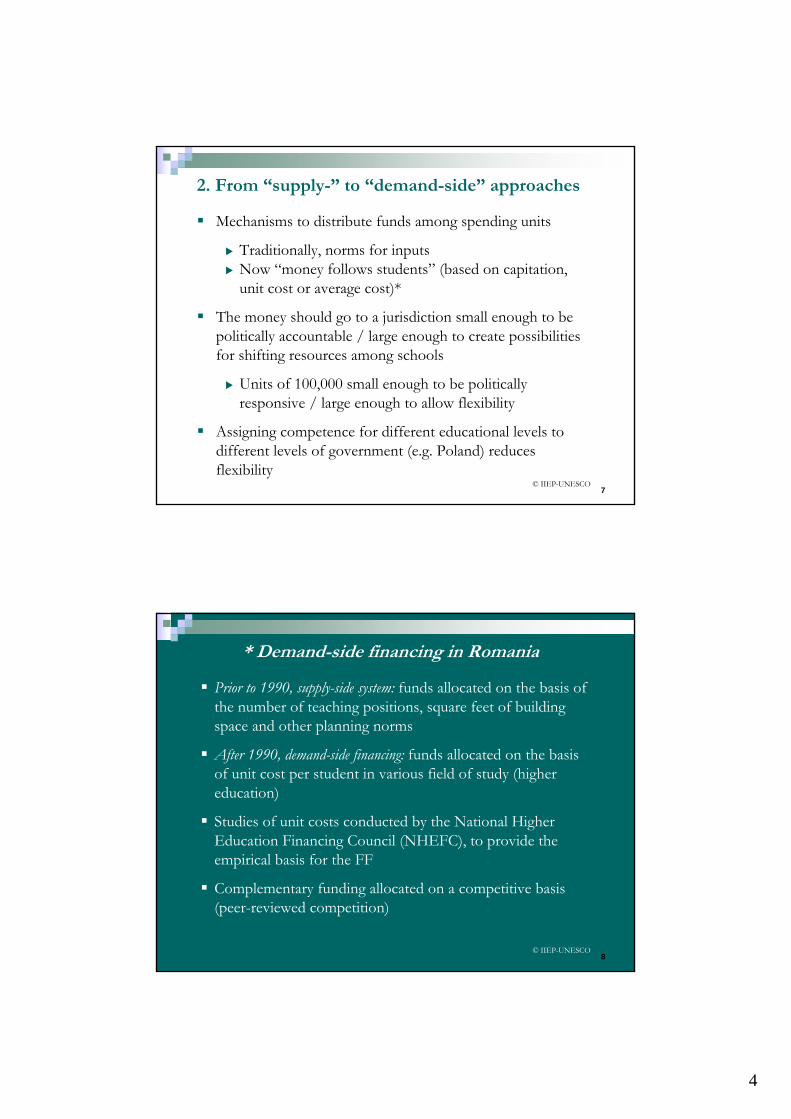
Mechanisms to distribute funds among spending units
Traditionally, norms for inputsNow “money follows students” (based on capitation, unit cost or average cost)*
The money should go to a jurisdiction small enough to be politically accountable / large enough to create possibilities for shifting resources among schools
Units of 100,000 small enough to be politically responsive / large enough to allow flexibility
Assigning competence for different educational levels to different levels of government (e.g. Poland) reduces flexibility
Prior to 1990, supply-side system: funds allocated on the basis of the number of teaching positions, square feet of building space and other planning norms
After 1990, demand-side financing: funds allocated on the basis of unit cost per student in various field of study (higher education)
Studies of unit costs conducted by the National Higher Education Financing Council (NHEFC), to provide the empirical basis for the FF
Complementary funding allocated on a competitive basis (peer-reviewed competition)
Several generations:1st generation: very simple, linked to crude parameters (teacher/pupils ratios): more equality than equity2nd generation: take into account differential needs for learning attainment: more resources to disadvantaged pupils (Australia, France, Indonesia)*3rd generation: comprehensiveness: cost based and built in incentives
Two complementary dimensions:Reliability of indicators used to determine amounts (transparency concern)Compliance in the use of the funds at school level (accountability concern)
Core: 80% of the budgetNeed based: disadvantaged and special learning needsPriority programs: 16 special needs
England (UK):
Pupils number (75%)Students additional needs (5%)Physical conditions (20%)In addition, extra allowances/learning difficulties, using as a proxy Free School Meal (% FSM)
Consistently applied formula determines what each school is allocated: this is known by the school and can be made publicly available
Basic requirements:
A clear explanation and understanding of the formula by all stakeholdersA reliable system of data collection in place on the basis of which amounts of funds are determinedA proper management of funds allocated at school level in place
Allocation by formula requires school level data on all the indicators that are included in the formula
Not to create perverse incentives to schools that encourage them to generate more funds by manipulating the formula
Type of formula Pervasive effects Recommendations
Allocations according to size of schools
Inflation of enrolment figures
• To collect data on enrolment externally
• To check for accuracy externally
Utility costs funded according to past expenditures
No incentive for more efficient use of energy, water and telephones
• To include variables that predict the amount that the school must spend but cannot itself affect (e.g. size and conditions of buildings and climatic variations
Indicators of students’ leaning needs
Incentive to principals to encourage low scores
• Not to use tests administered by the school itself
Data for calculating extra funding collected from the school (socio economic background, poverty, ethnicity, language)
In Australia: data are collected at state level from schools four times a year; it has the most rigorous external check
In UK: data are collected from schools by the annual census; IT management systems complete the forms and submit electronically to the ministry; deliberate misreporting does not seem to be widespread
Example of misreporting: Free School Meals (visit of LEAs auditors and inspectors)
If FF is not to be corrupted, strong data verification procedures and sanctions for deliberate misreporting must be in place
Financial management at school level increases opportunities forcorruption:
Fraudulent use of school money for private gainGraft or bribery in the awarding of contracts
As a result, need for:
Financial regulations: transactions administered either via the public sector treasury (Sweden) or bank accounts, reduces opportunities for personnel to embezzle money (except when treasury does not operate accurately)
Budget scrutiny: the exercise of budget scrutiny at school level is important for minimizing opportunities for corruption
Australia and England have similar budget scrutiny processes, relying on accurate recording and reporting of financial information through computerized accounting software
In Australia, there is a common management system; and TA and training is provided
In UK, with 150 LEAs, this is not the case: each school must buy its training and support
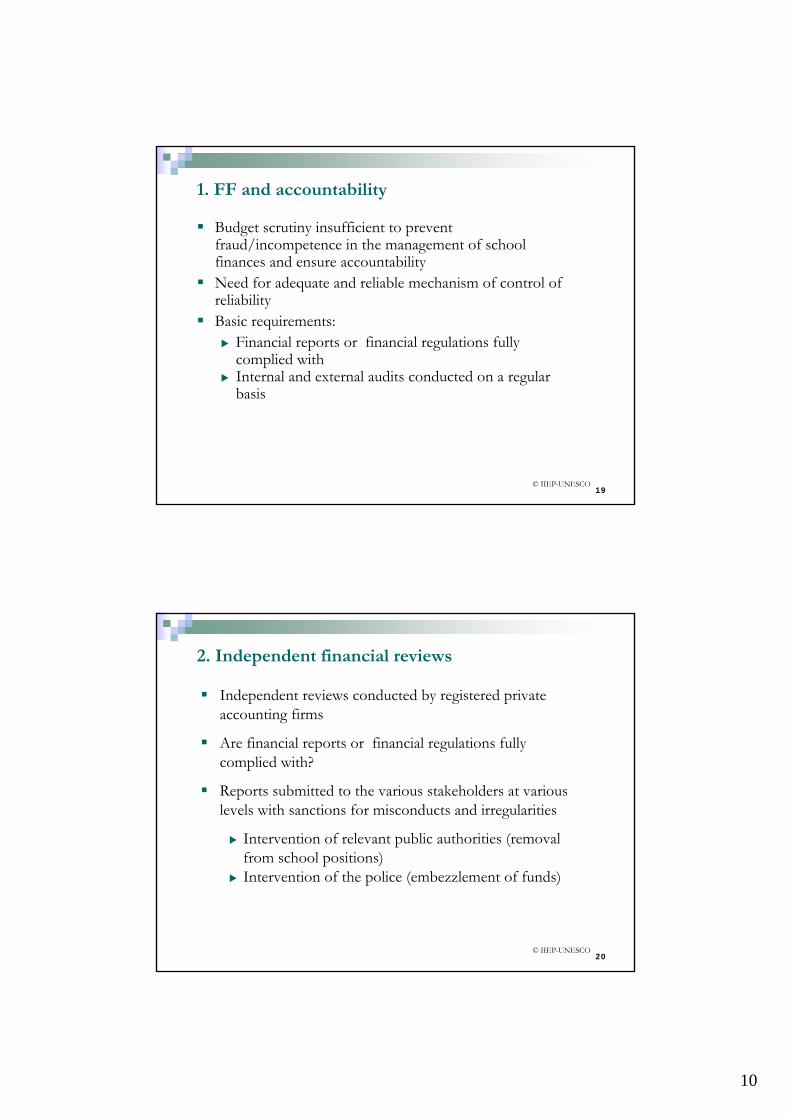
Budget scrutiny insufficient to prevent fraud/incompetence in the management of school finances and ensure accountabilityNeed for adequate and reliable mechanism of control of reliabilityBasic requirements:
Financial reports or financial regulations fully complied withInternal and external audits conducted on a regular basis
The financial regulation of schools is the responsibility of theFinancial Management Unit (FMI), Standards and Accountability Division (SAD) [Department of Education and Training of the Ministry of Finance]
School councils scrutinize and approve the financial accounts on a monthly basis
The Auditor General, under the authority of the Audit Act 1994, has responsibility for the conduct of independent reviews and financial statement audits of public sector agencies, including schools
School level, by a school board memberDistrict or Regional levelCentral govt regulating authority
Internal audits conducted by schools; external audit and audit at a higher level by a central body with responsibility for the probity of the public sector
Audits should check enrolment statistics; that money has been spent for approved purposes; financial regulations are properly observed
Irregular and random audits (or on a sampling basis), given the costs involved
one is performed by the gmina on a routine basis (audit of school accounts once or twice a year)one is undertaken irregularly by Regional Accounting Offices that audit other types of public sector institutionsthe National Chamber of Control conducts independent enquiries (e.g. financing of non public schools)
If it is found that a school’s financial procedures are weak, the school director is required to bring them up to standard
Failure to achieve satisfactory compliance with financial procedures can lead to the dismissal of the school principal
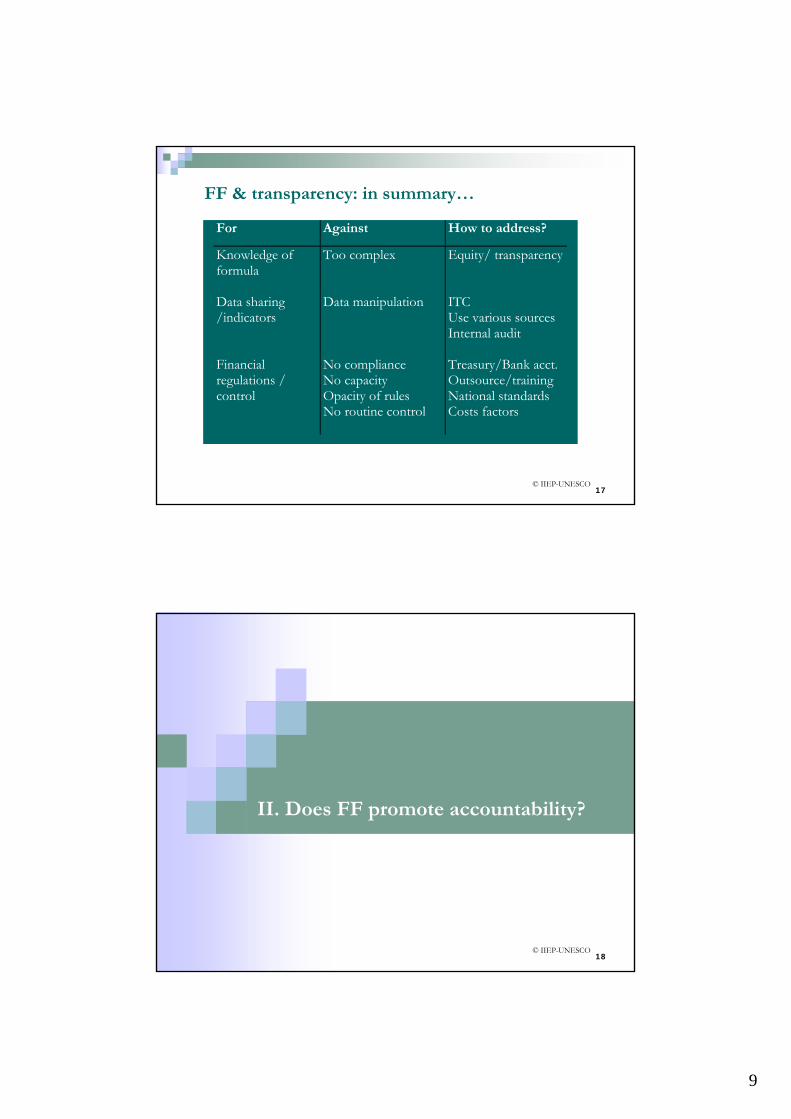
Transparency of formula funding helps avoiding fraud only if formula is simple
Publication of accounts in accessible form is a major factor in reducing fraud
Intensive auditing and monitoring are the greatest deterrent to fraud
Few questions:
Should « money follows students » apply to private and parochial schools as well as to government schools?How much school choice should be permitted?What are the advantages and disadvantages of “paper vouchers”?
Arūnas PlikšnysDirector of General Education Department, Ministry of
Education and Science
2005 1 27-29, Kiev, Ukraine
2
LITHUANIA IN FIGURES 2004/5Population – 3.45 mln.GDP(2003) – 55 359 mln. LTL (15 881 mln. EUR)National budget – 23,1% of GDPFunds allocated to education – 5.29% GDPNational education budget – 3 266,2 mln.LTL(937 mln. EUR)State education budget – 37,1 %Municipal education budget – 62,9%Average teacher’s month salary–1412 LTL(405 EUR)- 2005 09 01
2
3
compulsory education
University College Post–
Cla
sses
secondary 14
Age
19 13 Vocational
18 12 school Gymnasium Secondary school
17 11
16 10
15 9 14 8
13 7 Basic
Adu
lted
ucat
ion
school
12 6
You
th s
choo
l
11 5
10 4 9 3 Primary school
8 2 Classes in kindergarten–schools 7 1
Artg
ymna
sium
6 0
Pre–primary education
5 4 Pre–school education institutions 3
Inst
itutio
nsof
spec
iale
duca
tion
2
1
4
LITHUANIA IN FIGURES 2003School structure – grades 4+(4+2)+2Primary schools (grades 1-4) – 193Basic schools (grades 1-10) – 635Secondary schools (up to grade 12) – 461Gimnasium (grades 9 –12) - 95Number of students – 528 215Number of teachers – 45 500Student/ teacher ratio – 11,8Average class size – 19,4 (city – 23,4, rural –13,9)
3
5
DEVELOPMENT OF FUNDINGAND PAYMENT SYSTEM
Until 1990 03 11 – 18 hours per week per teacher1993-5 teachers’ qualification categories implemented 1996 – coefficients in monthly basic wages1998 – additional hours for preparation, etc. allowed2000 – education portion of municipal budget calculated based upon student population2001 – preparation for “student basket”2002 01 01 – implementation of “student basket” (SB)2005 09 01 – 2012 12 31 - implementation of new payment system for teachers
6
FLAWS OF PRIOR FUNDING ARRANGEMENT
Funding per student varies greatlyNetwork of schools was not at its optimumNearly all funding to salaries and utilitiesMoney was allocated per number of class setsMoney did follow students transferring to new schoolsSchools have no autonomy in planningNon governmental schools receive less and amounts were erratic
4
7
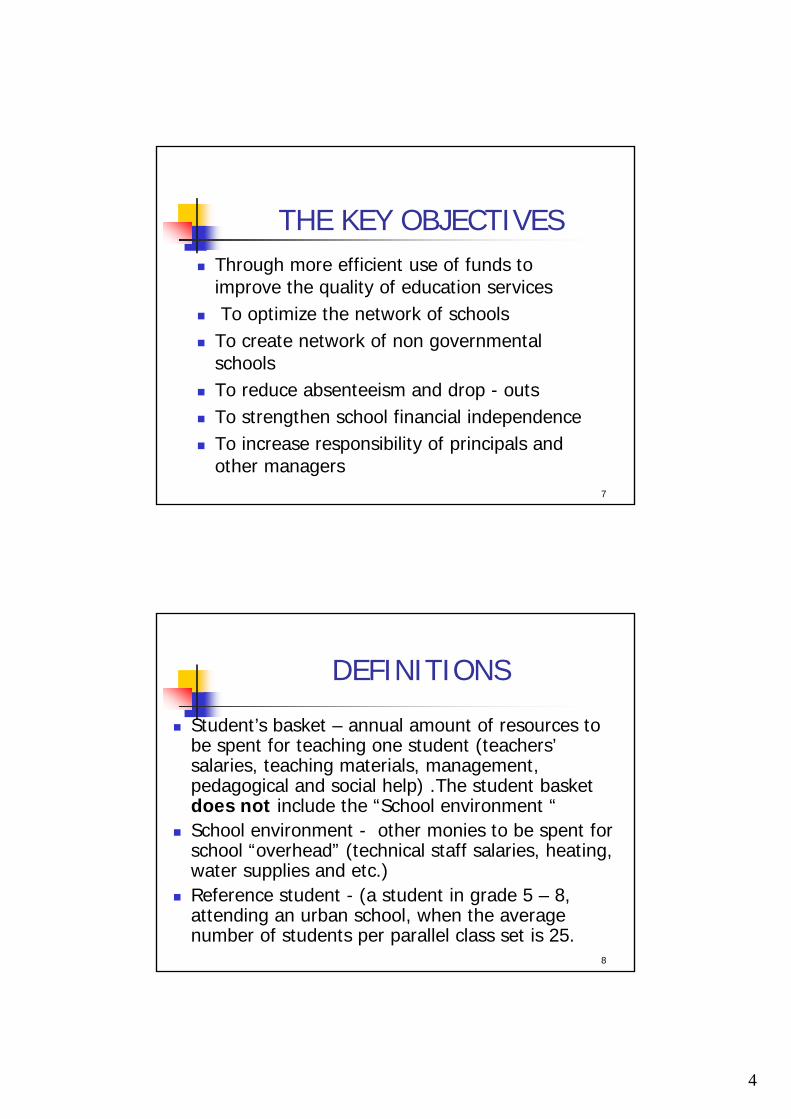
THE KEY OBJECTIVESThrough more efficient use of funds to improve the quality of education services To optimize the network of schools
To create network of non governmental schoolsTo reduce absenteeism and drop - outsTo strengthen school financial independenceTo increase responsibility of principals and other managers
8
DEFINITIONS
Student’s basket – annual amount of resources to be spent for teaching one student (teachers’salaries, teaching materials, management, pedagogical and social help) .The student basket does not include the “School environment “School environment - other monies to be spent for school “overhead” (technical staff salaries, heating, water supplies and etc.)Reference student - (a student in grade 5 – 8, attending an urban school, when the average number of students per parallel class set is 25.
5
9
PRINCIPLES OF FINANCING (1)
School budget: students’ baskets, School environment monies, project funds, donations from sponsorsEvery year, the Parliament shall specify the amount provided for educating one reference student (the student basket). Each school’s allocation of student baskets depends upon its number of reference students.The number of reference students depends upon the number of actual students and supplementary coefficients (urban or rural schools, types and grades in school)
10
PRINCIPLES OF FINANCING (2)
Student’s basket funds shall be used for:
1. Implementation of teaching plan;2. Teachers’ in-service training;3. Textbooks;4. Teaching equipment and materials;5. School management, pedagogical, social
and psychological counseling services.
6
11
PRINCIPLES OF FINANCING (3)
The number of reference students and the size of student’s basket shall be calculated every year using Government approved methodology (11 12 2002 resolution No.1947)The funds for students’ baskets shall be allocated from the state budget to school founders as a special targeted subsidySB for non- governmental schools is allocated via municipality where the school is located
12
PRINCIPLES OF FINANCING (4)
The founder may allocate additional resources.When a student transfers from one school to another the SB moves after him or her.The founder shall allocate resources needed for the School environment through a set procedureSchool environment monies shall be used for: maintenance of buildings, utilities, technical staff salaries, social security insurance for employees and other everyday operating costs
7
13
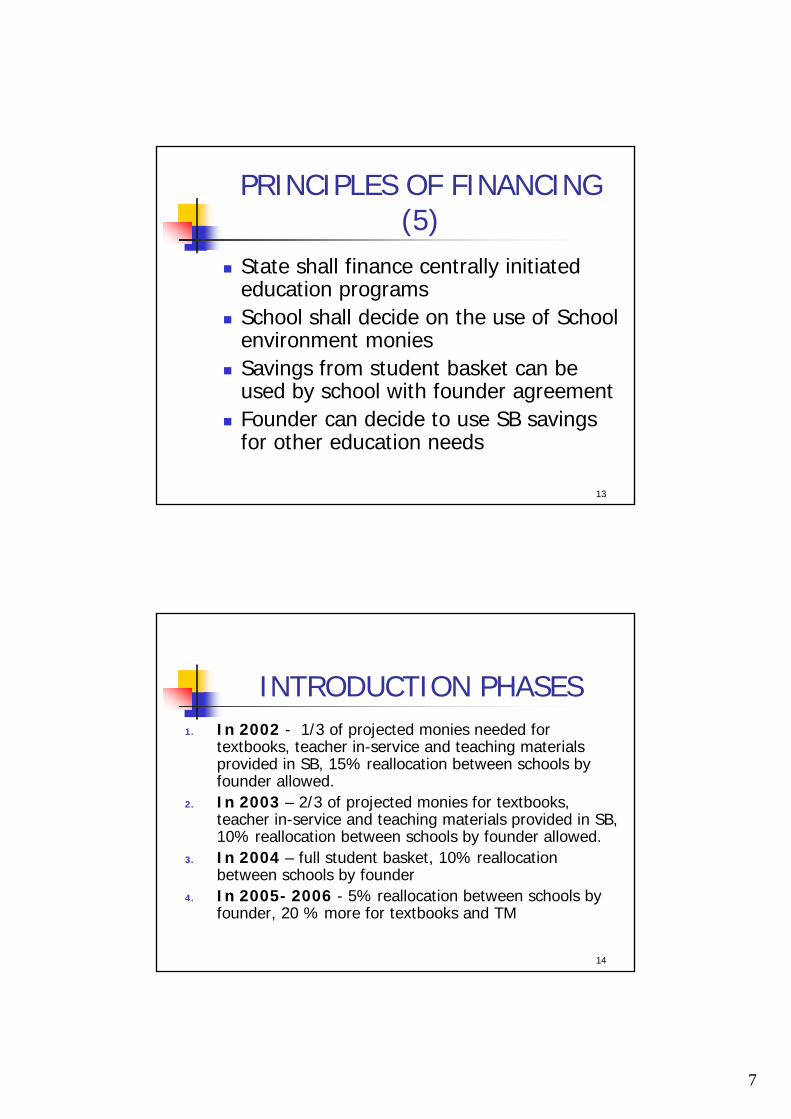
PRINCIPLES OF FINANCING (5)
State shall finance centrally initiated education programsSchool shall decide on the use of School environment moniesSavings from student basket can be used by school with founder agreementFounder can decide to use SB savings for other education needs
14
INTRODUCTION PHASES1. In 2002 - 1/3 of projected monies needed for
textbooks, teacher in-service and teaching materials provided in SB, 15% reallocation between schools by founder allowed.
2. In 2003 – 2/3 of projected monies for textbooks, teacher in-service and teaching materials provided in SB, 10% reallocation between schools by founder allowed.
3. In 2004 – full student basket, 10% reallocation between schools by founder
4. In 2005- 2006 - 5% reallocation between schools by founder, 20 % more for textbooks and TM
8
15
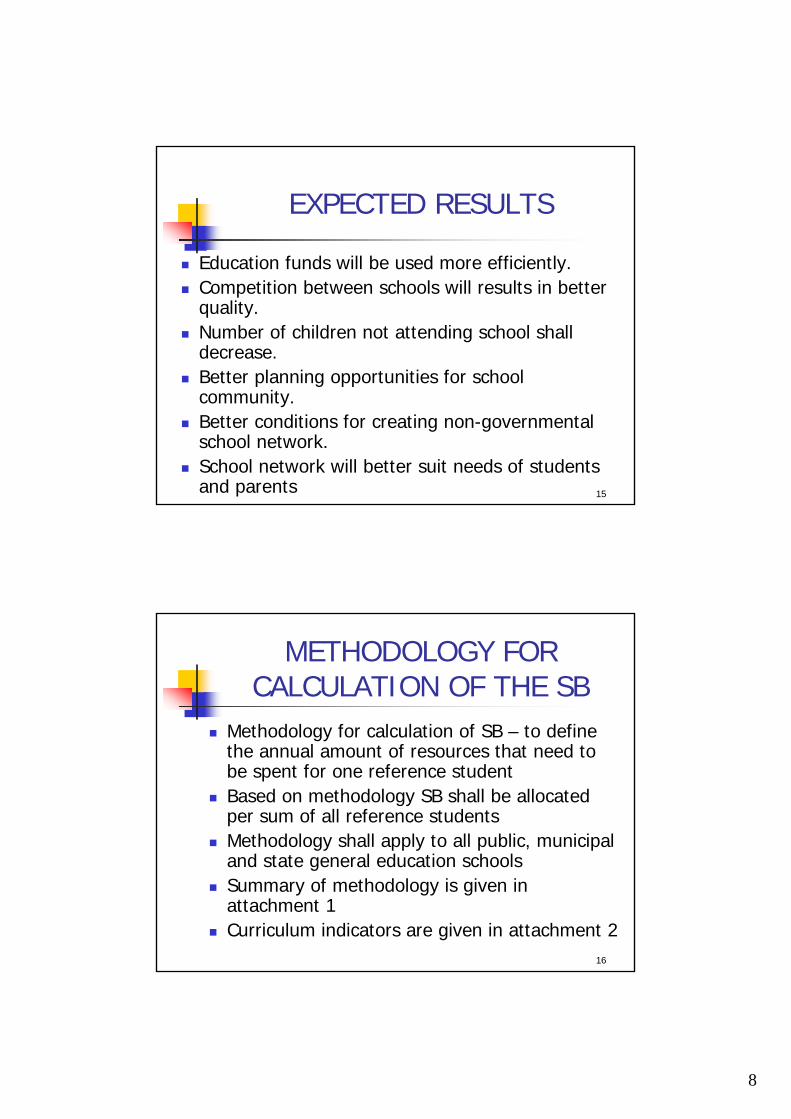
EXPECTED RESULTS
Education funds will be used more efficiently.Competition between schools will results in better quality.Number of children not attending school shall decrease.Better planning opportunities for school community.Better conditions for creating non-governmental school network.School network will better suit needs of students and parents
16
METHODOLOGY FOR CALCULATION OF THE SB
Methodology for calculation of SB – to define the annual amount of resources that need to be spent for one reference studentBased on methodology SB shall be allocated per sum of all reference studentsMethodology shall apply to all public, municipal and state general education schoolsSummary of methodology is given in attachment 1Curriculum indicators are given in attachment 2
9
17
STUDENT’S BASKET 2004The SB shall be calculated as follows:SB=Kb x q x 12 = 1555 LTLKb – base coefficient for calculation of the SB. Kb = 1,234 (attachment 1)q – shall be national base monthly salary (q=105 LTL).12 – the number of months
18
METHODOLOGY FOR REFERENCE STUDENTS (1)
Methodology for calculation of reference students –to define annual amount of resources that need to be spent for 1 student depending on school type, education level (grades 1-4, grades 5-8, grades 9-10, grades 11-12), students with special needs, national minority schools and other indicators.Methodology based on the same principles as student’s basket (see attachment 1) but different coefficients for different average class size
10
19
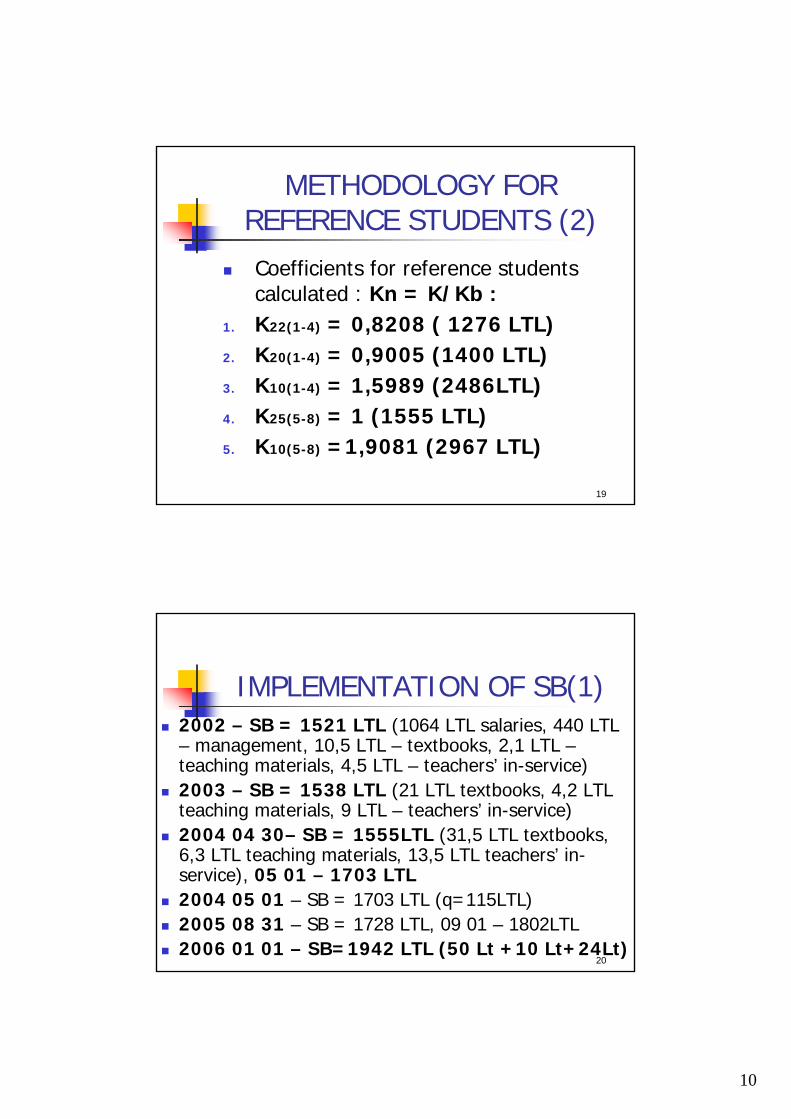
METHODOLOGY FOR REFERENCE STUDENTS (2)Coefficients for reference students calculated : Kn = K/Kb :
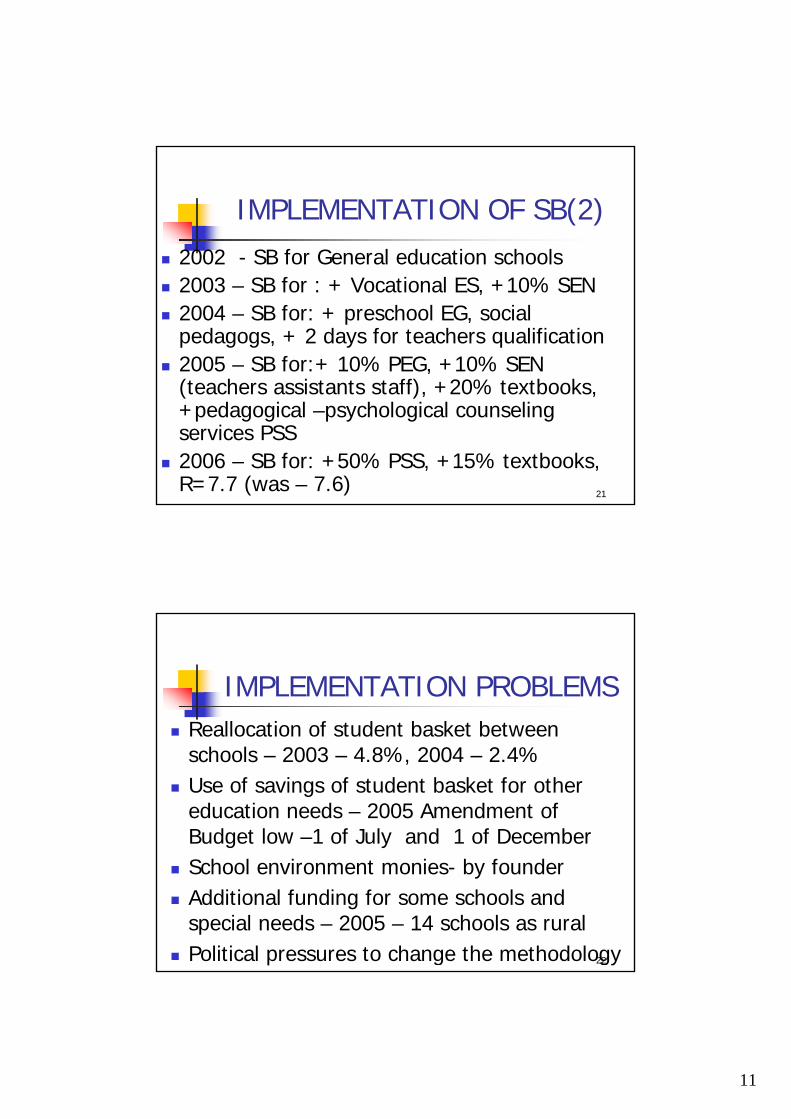
IMPLEMENTATION OF SB(2)2002 - SB for General education schools2003 – SB for : + Vocational ES, +10% SEN2004 – SB for: + preschool EG, social pedagogs, + 2 days for teachers qualification2005 – SB for:+ 10% PEG, +10% SEN (teachers assistants staff), +20% textbooks, +pedagogical –psychological counseling services PSS2006 – SB for: +50% PSS, +15% textbooks, R=7.7 (was – 7.6)
22
IMPLEMENTATION PROBLEMSReallocation of student basket between schools – 2003 – 4.8%, 2004 – 2.4%Use of savings of student basket for other education needs – 2005 Amendment of Budget low –1 of July and 1 of December School environment monies- by founder Additional funding for some schools and special needs – 2005 – 14 schools as rural Political pressures to change the methodology
12
23
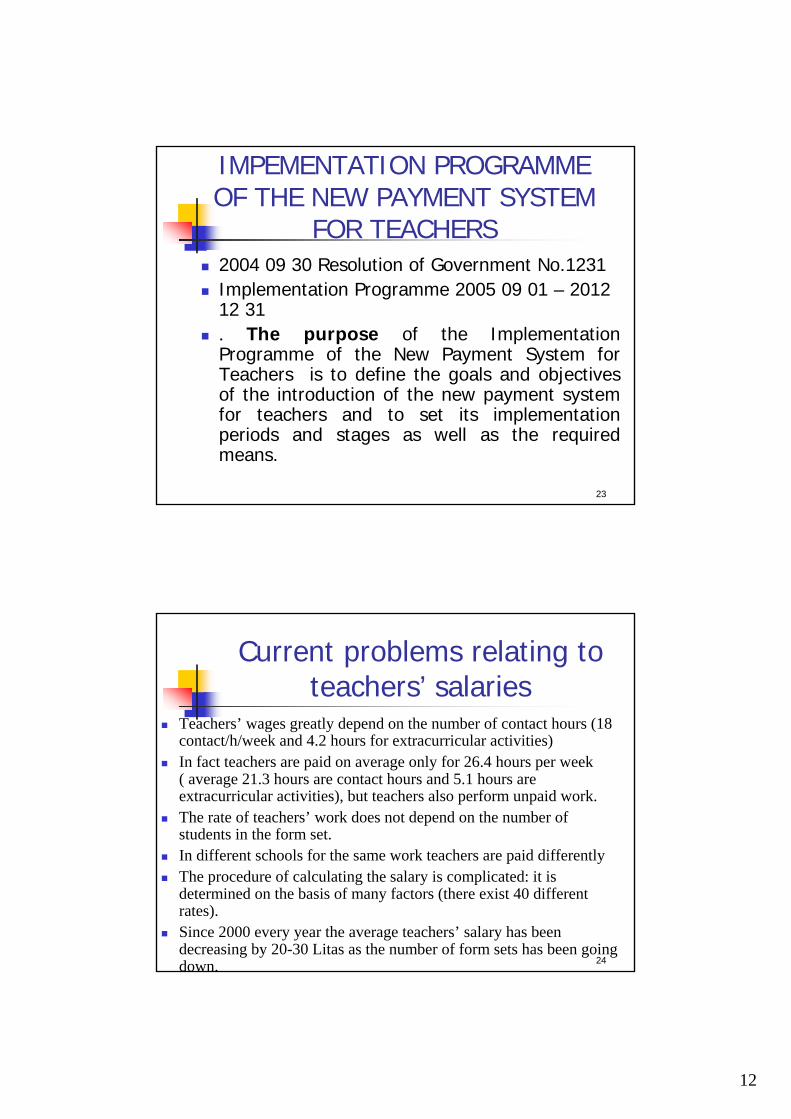
IMPEMENTATION PROGRAMME OF THE NEW PAYMENT SYSTEM
FOR TEACHERS2004 09 30 Resolution of Government No.1231Implementation Programme 2005 09 01 – 2012 12 31. The purpose of the Implementation Programme of the New Payment System for Teachers is to define the goals and objectives of the introduction of the new payment system for teachers and to set its implementation periods and stages as well as the required means.
24
Current problems relating to teachers’ salaries
Teachers’ wages greatly depend on the number of contact hours (18 contact/h/week and 4.2 hours for extracurricular activities)In fact teachers are paid on average only for 26.4 hours per week ( average 21.3 hours are contact hours and 5.1 hours are extracurricular activities), but teachers also perform unpaid work. The rate of teachers’ work does not depend on the number of students in the form set.In different schools for the same work teachers are paid differently The procedure of calculating the salary is complicated: it is determined on the basis of many factors (there exist 40 different rates).Since 2000 every year the average teachers’ salary has been decreasing by 20-30 Litas as the number of form sets has been going down.
13
25
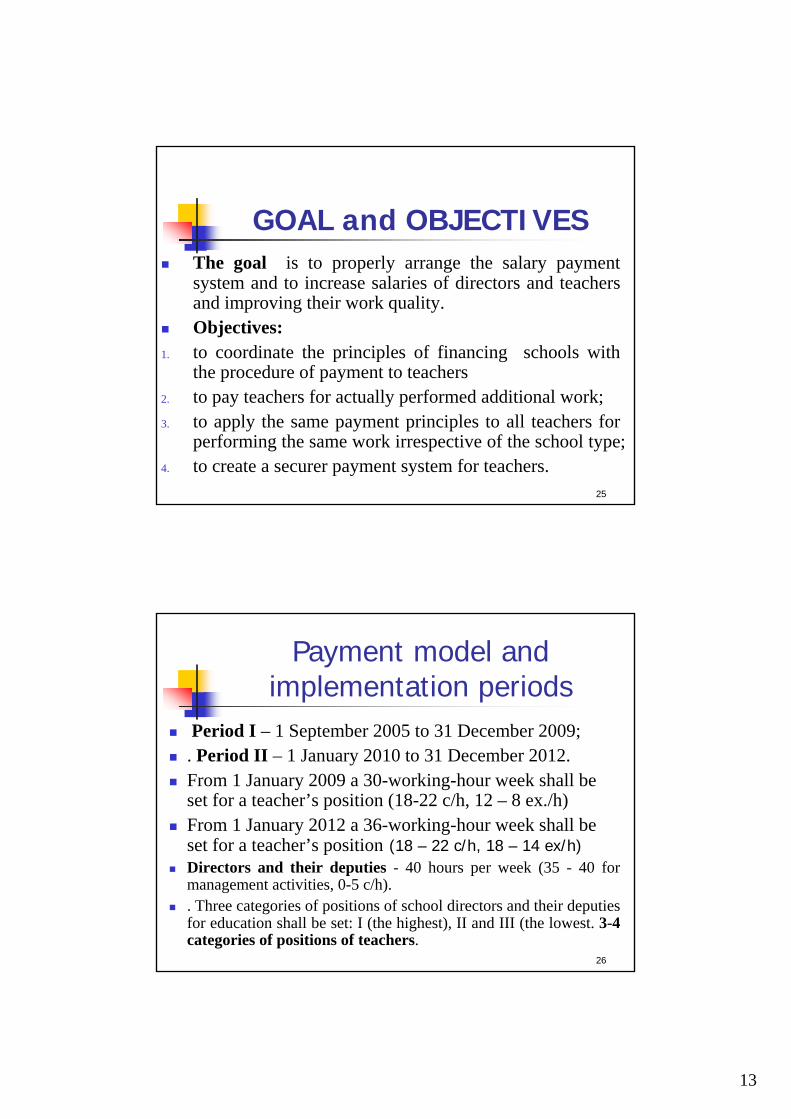
GOAL and OBJECTIVESThe goal is to properly arrange the salary payment system and to increase salaries of directors and teachersand improving their work quality.Objectives:
1. to coordinate the principles of financing schools with the procedure of payment to teachers
2. to pay teachers for actually performed additional work;3. to apply the same payment principles to all teachers for
performing the same work irrespective of the school type;4. to create a securer payment system for teachers.
26
Payment model and implementation periods
Period I – 1 September 2005 to 31 December 2009;. Period II – 1 January 2010 to 31 December 2012.From 1 January 2009 a 30-working-hour week shall be set for a teacher’s position (18-22 c/h, 12 – 8 ex./h) From 1 January 2012 a 36-working-hour week shall be set for a teacher’s position (18 – 22 c/h, 18 – 14 ex/h)Directors and their deputies - 40 hours per week (35 - 40 for management activities, 0-5 c/h).. Three categories of positions of school directors and their deputies for education shall be set: I (the highest), II and III (the lowest. 3-4 categories of positions of teachers.
14
27
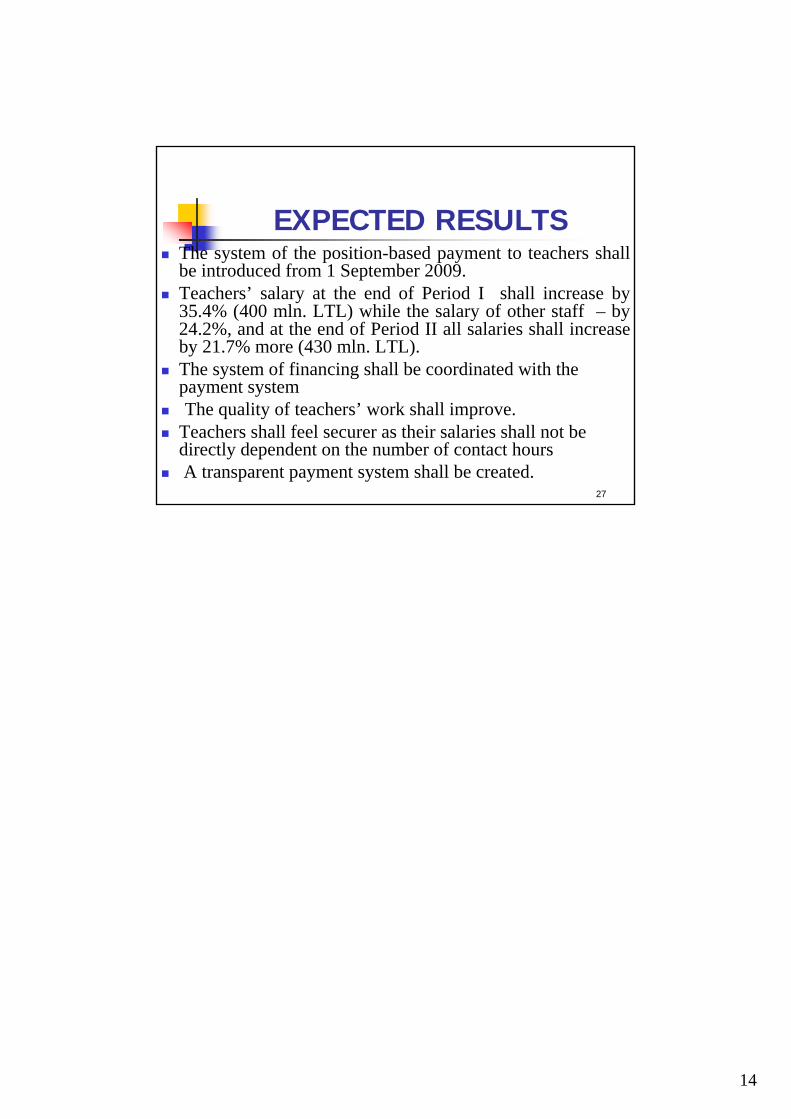
EXPECTED RESULTSThe system of the position-based payment to teachers shall be introduced from 1 September 2009.Teachers’ salary at the end of Period I shall increase by 35.4% (400 mln. LTL) while the salary of other staff – by 24.2%, and at the end of Period II all salaries shall increase by 21.7% more (430 mln. LTL).The system of financing shall be coordinated with the payment systemThe quality of teachers’ work shall improve.
Teachers shall feel securer as their salaries shall not be directly dependent on the number of contact hoursA transparent payment system shall be created.
1
1
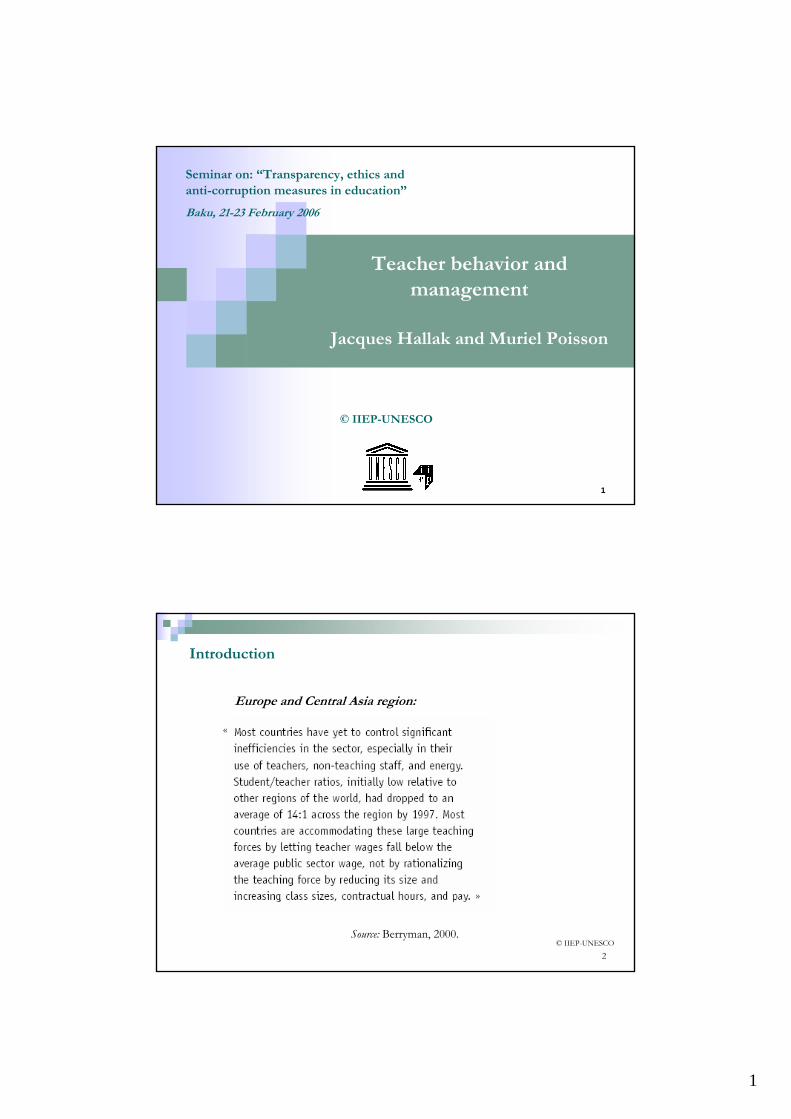
Teacher behavior and management
Jacques Hallak and Muriel Poisson
Seminar on: “Transparency, ethics andanti-corruption measures in education”
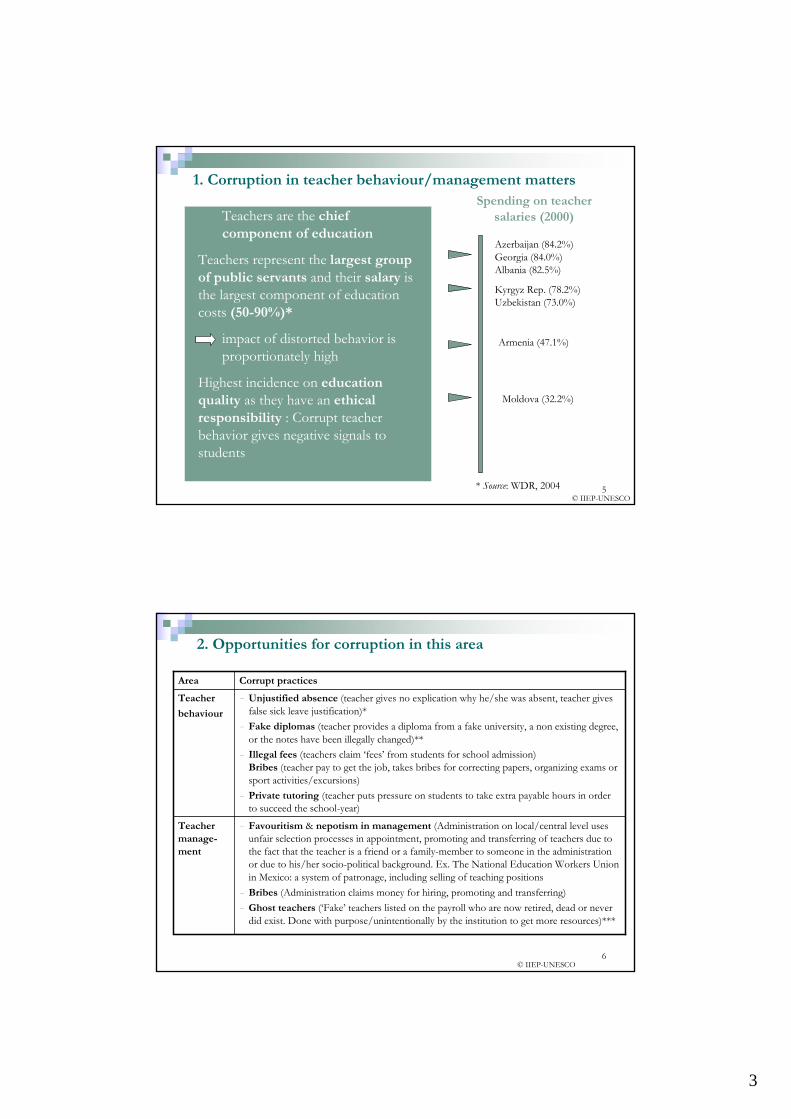
− Favouritism & nepotism in management (Administration on local/central level uses unfair selection processes in appointment, promoting and transferring of teachers due to the fact that the teacher is a friend or a family-member to someone in the administration or due to his/her socio-political background. Ex. The National Education Workers Union in Mexico: a system of patronage, including selling of teaching positions
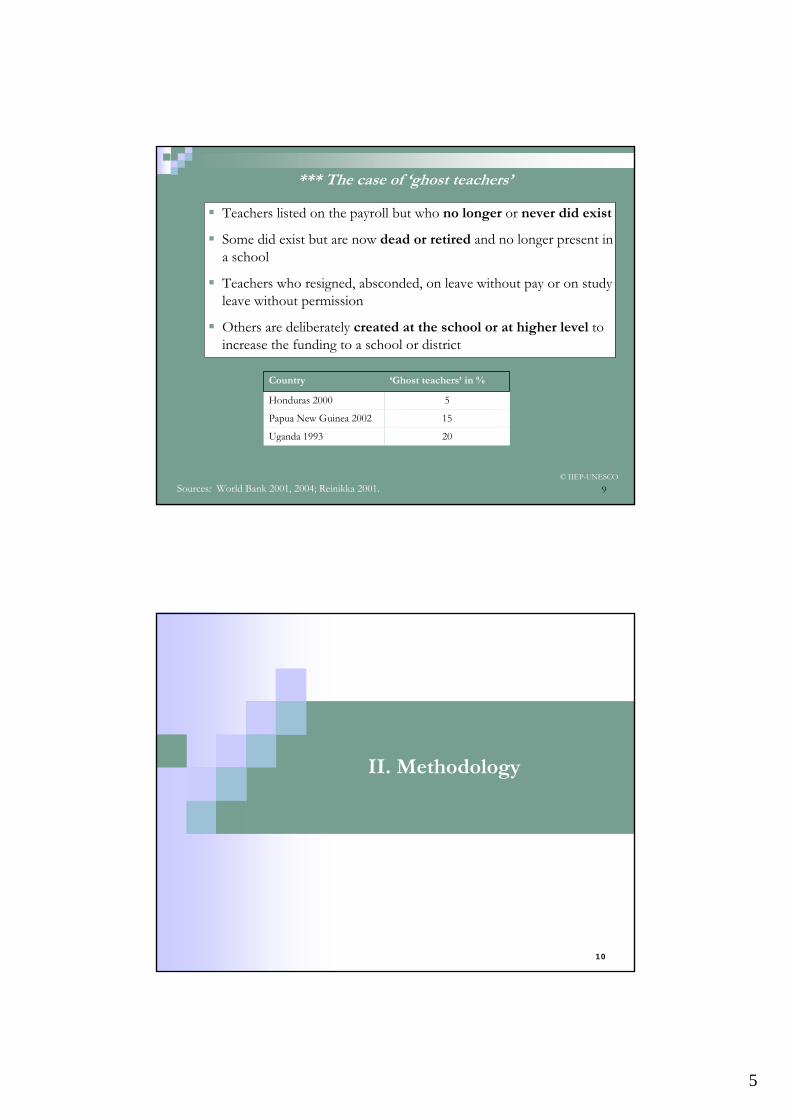
− Bribes (Administration claims money for hiring, promoting and transferring)− Ghost teachers (‘Fake’ teachers listed on the payroll who are now retired, dead or never
did exist. Done with purpose/unintentionally by the institution to get more resources)***
Teachermanage-ment
− Unjustified absence (teacher gives no explication why he/she was absent, teacher gives false sick leave justification)*
− Fake diplomas (teacher provides a diploma from a fake university, a non existing degree, or the notes have been illegally changed)**
− Illegal fees (teachers claim ‘fees’ from students for school admission) Bribes (teacher pay to get the job, takes bribes for correcting papers, organizing exams or sport activities/excursions)
− Private tutoring (teacher puts pressure on students to take extra payable hours in order to succeed the school-year)
Teacher absence has a significant impact on students :
A 10 % increase in teacher absence is associated with a 1.8 % decrease in student attendanceA 20 % decrease in teacher attendance is associated with a 2 % decrease in test scores
15Papua New Guinea
27Uganda
11Peru
19Indonesia
14Ecuador
16Bangladesh
25India
Absence rates (%) in Primary
schools
Country
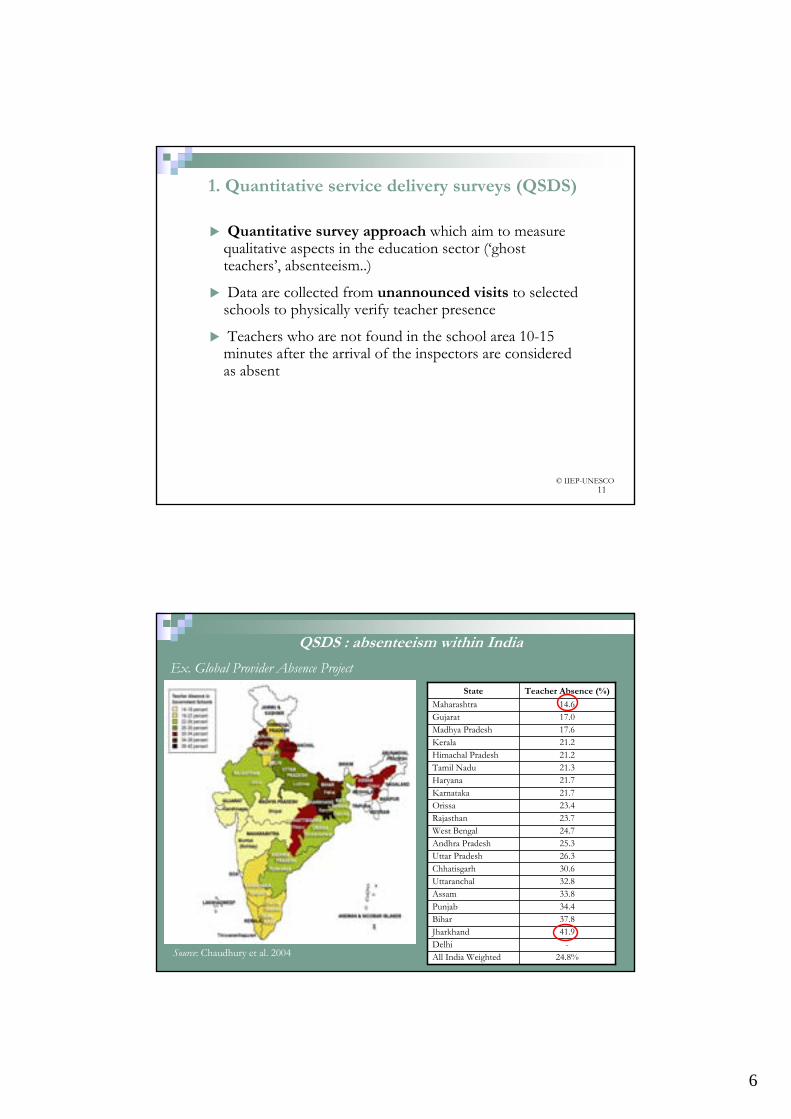
Determination of absence is based on physical verification against names on teacher roster, which includes the entire number of posts approved, both occupied and vacant. Payroll includes only occupied positions
8
** Use of fake diplomas by teachers
At Gwinnett Country school in Liberia, six teachers have been found guilty in having bought their degree
Due to the fake degree they have received a total of $ 29 702 in additional pay, with individual’s amounts ranging from $ 2 300 to $ 7 200
The teachers had obtained their degree from St. Regis University, which claims to be recognized by the government of the African national of Liberia. The University grants master’s degrees and doctorates based on ‘life experience’. A master’s degree costs $ 995 and a doctorate $ 1 500
The teachers, whose names are listed publicly, must pay back the additional pay
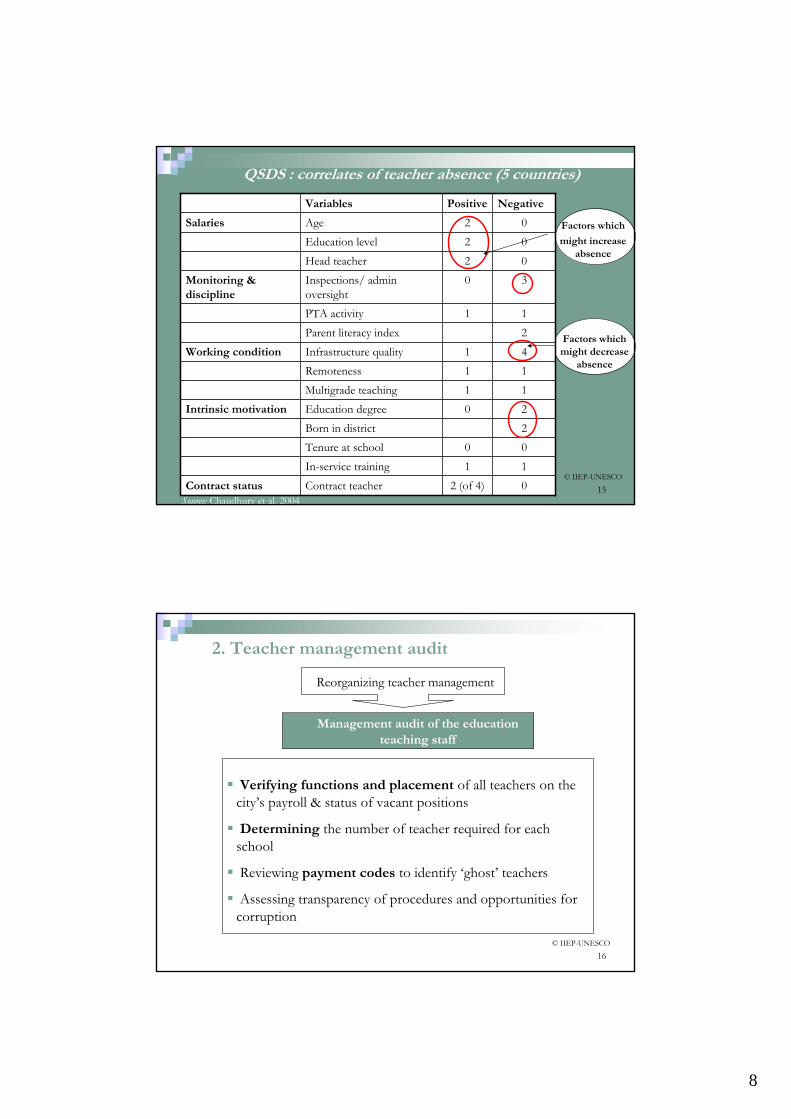
Verifying functions and placement of all teachers on the city’s payroll & status of vacant positions
Determining the number of teacher required for each school
Reviewing payment codes to identify ‘ghost’ teachers
Assessing transparency of procedures and opportunities for corruption
9
17
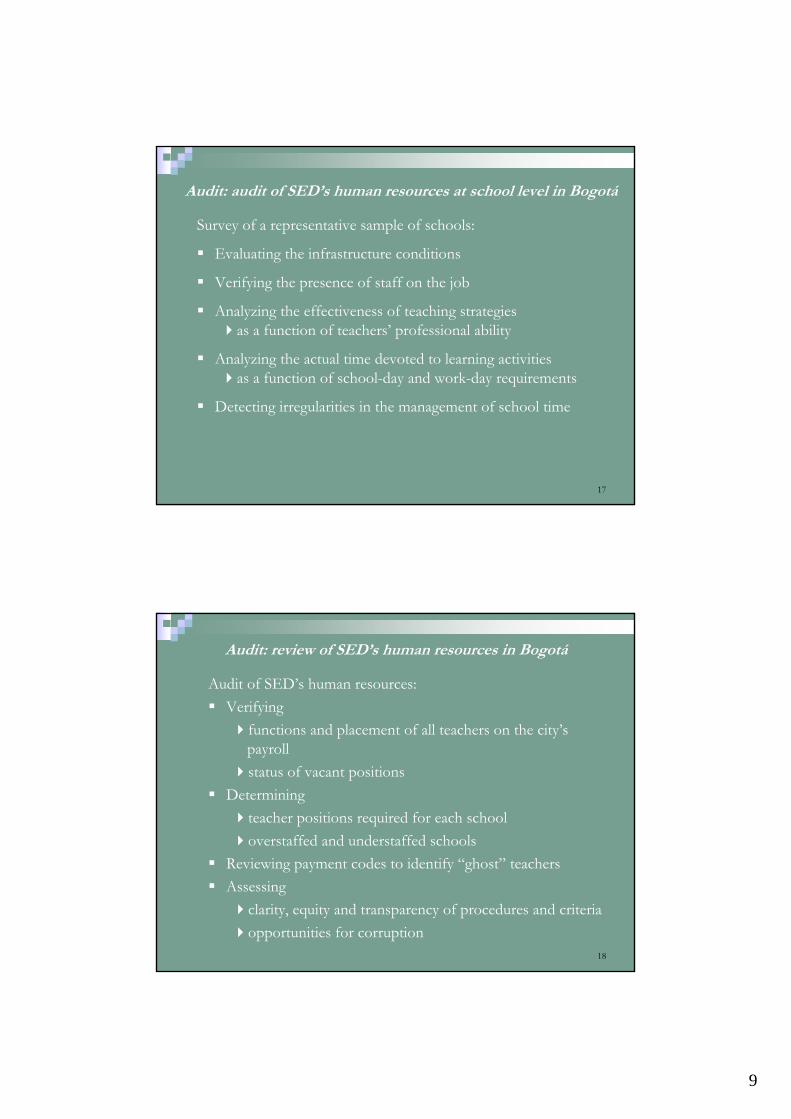
Survey of a representative sample of schools:
Evaluating the infrastructure conditions
Verifying the presence of staff on the job
Analyzing the effectiveness of teaching strategiesas a function of teachers’ professional ability
Analyzing the actual time devoted to learning activitiesas a function of school-day and work-day requirements
Detecting irregularities in the management of school time
Audit: audit of SED’s human resources at school level in Bogotá
18
Audit of SED’s human resources:Verifying
functions and placement of all teachers on the city’s payrollstatus of vacant positions
Determining teacher positions required for each schooloverstaffed and understaffed schools
Reviewing payment codes to identify “ghost” teachersAssessing
clarity, equity and transparency of procedures and criteriaopportunities for corruption
Audit: review of SED’s human resources in Bogotá
10
19
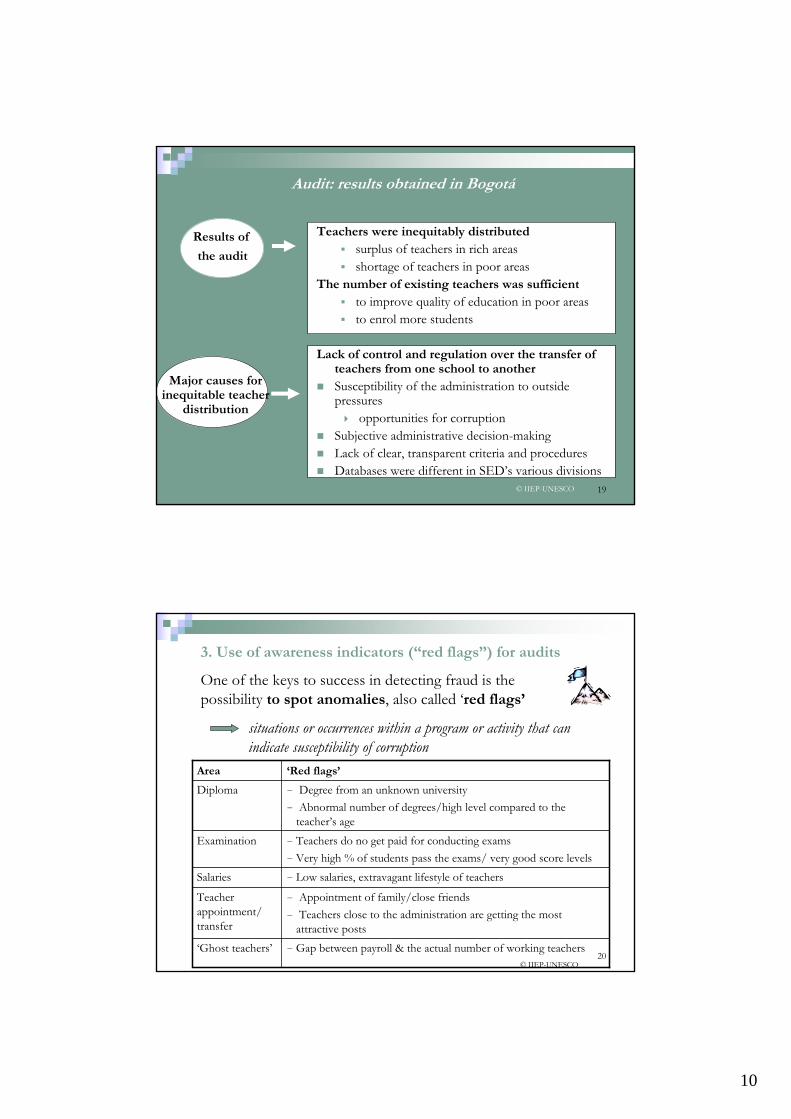
Audit: results obtained in Bogotá
Teachers were inequitably distributedsurplus of teachers in rich areasshortage of teachers in poor areas
The number of existing teachers was sufficientto improve quality of education in poor areasto enrol more students
Lack of control and regulation over the transfer of teachers from one school to anotherSusceptibility of the administration to outside pressures
opportunities for corruptionSubjective administrative decision-makingLack of clear, transparent criteria and proceduresDatabases were different in SED’s various divisions
To organize a nation-wide ‘headcount’ exercise, during which teams physically verify that teachers listed on payroll sheets exist
To ask each teacher to physically travel to one designated location on a particular day
To use a formal administrative act to validate the final list of teachers eligible to receive salaries from the ministry of education
To conduct ‘spot audits’ throughout the year by a professionally reliable group from the central auditors or Ministry inspectorate
To identify cases of double salaries (teachers working part time in different schools), undeclared sick leave (longer duration than the norm of three days), use of fake degrees*
12
23
* How to eliminate the use of fake diplomas ?
Promotions or increase in salary should not take place before a verification of degrees have been done
Verify the validity of degrees with the educational institutions listed as having granted them (accreditation, that the notes has not been changed etc.) when a new teacher is employed
The original diploma should be presented whenever the head master/administration claim so
Prevent such behaviour by informing staff about the consequences of using fake degrees (sanctions like a fine or even dismissal)
24
Hiring of teachers
Done according to common parameters ( Preschool: 25 students per group and 1.0 teacher per group; Primary 35 students per group and 1.1 teachers, Secondary 40 students per group and 1.3 teachers)
Vacant posts are publicised
Selected process contracted to universities to eliminate influence of outside interests
Transfer of teachers
Decided by central personnel office
Transfer requests considered only at end of school year exceptproved illnesses, court orders
Absenteeism
Each school creates monthly records of school employee's daily attendance, to be sent to central level
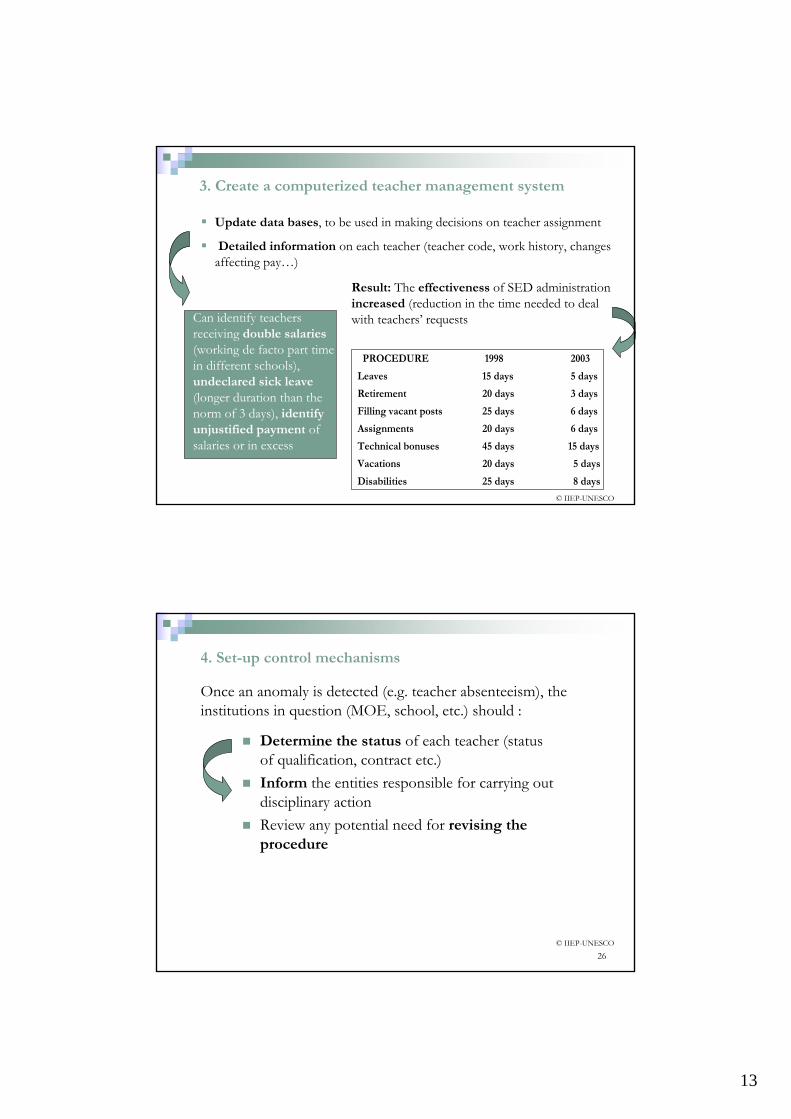
Update data bases, to be used in making decisions on teacher assignment
Detailed information on each teacher (teacher code, work history, changes affecting pay…)
3. Create a computerized teacher management system
Can identify teachers receiving double salaries(working de facto part time in different schools), undeclared sick leave(longer duration than the norm of 3 days), identify unjustified payment of salaries or in excess
Result: The effectiveness of SED administration increased (reduction in the time needed to deal with teachers’ requests
26
4. Set-up control mechanisms
Determine the status of each teacher (status of qualification, contract etc.)Inform the entities responsible for carrying out disciplinary actionReview any potential need for revising the procedure
Once an anomaly is detected (e.g. teacher absenteeism), the institutions in question (MOE, school, etc.) should :
Inform staff (teacher and head master/administration) about the rules & procedures to follow in case of sick leave as well as the consequences (sanctions) if absence is not justified
Make clear that the rules are the same for everybody – even the most qualified and experiences teachers. Rules should be stated in contract + organize ‘awareness’ meetings for ex. twice a year
Improve the infrastructure (covered classrooms/non-mud floors/teacher toilet/electricity/library)
Organize internal and external controls to make sure that the teacher is physically in the classroom, teaching the students (importance of a collective understanding of these procedures, i.e. they are necessary to improve the quality of teaching and not to supervise the teacher ‘non-stop’)
Preventing absence : specification of the area’s features in publication of vacant posts (Ex. from Bogotá, film showing schools in remote areas, to inform the candidates of what they are saying ‘yes’ to)
Build ownership with different stakeholders: teachers’ unions
28
5. In summary: how to improve teacher management ?
Updated database with occupied and vacant
Verification of location of teachers
Application of criteria (size of
group, number of teachers per group)
Identification of surpluses and deficits of teachers in
each school
Transfers or new
appointments
Determining personnel for each school and specifying
principal’s personnel management
responsibilities
New transfer system
Competition for new teachers Control of
absenteeism
Reporting of anomalies
1
2
3
4
In Bogotá, 240 000 additional pupils (33%) enrolled with no additional recruitment of teachers for half of them, thanks to the redeployment of existing staff –1998-2003
Implement multiple strategies to prevent corruption : Implement codes of conduct; use QSDS to detect problems such as ‘ghost teachers’ & absenteeism; finance computerized teacher management system and raise awareness on various aspects of corruption in education
Due to teachers’ considerable salary expenditures and their influential role on the education system, it is crucial to handle corrupt actions in teacher management and teacher behaviour
Hence, the administration as well as students and teachers themselves must be aware of which ‘red flags’ to look for
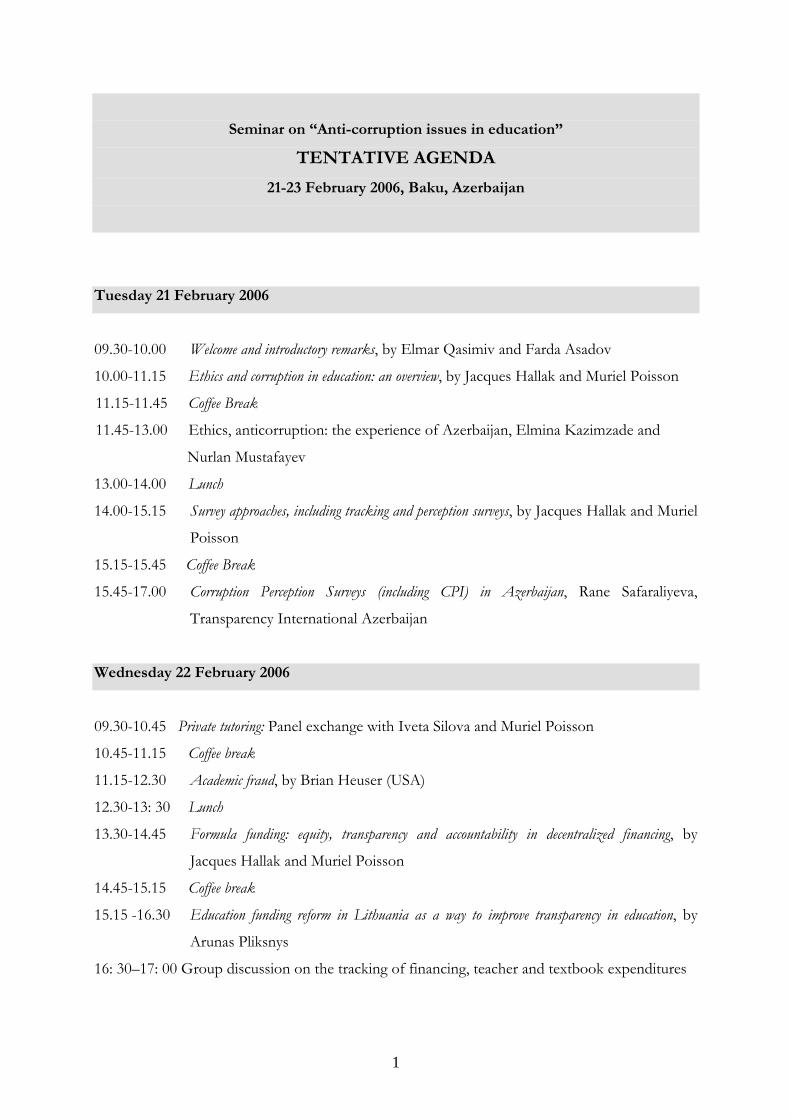
Seminar on “Anti-corruption issues in education”
TENTATIVE AGENDA
21-23 February 2006, Baku, Azerbaijan
Tuesday 21 February 2006
09.30-10.00 Welcome and introductory remarks, by Elmar Qasimiv and Farda Asadov
10.00-11.15 Ethics and corruption in education: an overview, by Jacques Hallak and Muriel Poisson
11.15-11.45 Coffee Break
11.45-13.00 Ethics, anticorruption: the experience of Azerbaijan, Elmina Kazimzade and
Nurlan Mustafayev
13.00-14.00 Lunch
14.00-15.15 Survey approaches, including tracking and perception surveys, by Jacques Hallak and Muriel
Poisson
15.15-15.45 Coffee Break
15.45-17.00 Corruption Perception Surveys (including CPI) in Azerbaijan, Rane Safaraliyeva,
Transparency International Azerbaijan
Wednesday 22 February 2006
09.30-10.45 Private tutoring: Panel exchange with Iveta Silova and Muriel Poisson
10.45-11.15 Coffee break
11.15-12.30 Academic fraud, by Brian Heuser (USA)
12.30-13: 30 Lunch
13.30-14.45 Formula funding: equity, transparency and accountability in decentralized financing, by
Jacques Hallak and Muriel Poisson
14.45-15.15 Coffee break
15.15 -16.30 Education funding reform in Lithuania as a way to improve transparency in education, by
Arunas Pliksnys
16: 30–17: 00 Group discussion on the tracking of financing, teacher and textbook expenditures
1
Thursday 23 February 2006
09.30-10.45 Teacher management and behaviour, by Jacques Hallak and Muriel Poisson
10.45-11.15 Coffee break
11.15-12.30 Movements against corruption: youth, students, NGOs, etc., Panel exchange with OSI-
ESP Budapest expert, Paviz Bargirov and participants
12.30-13.00 Follow-up
Evaluation of the Seminar
2
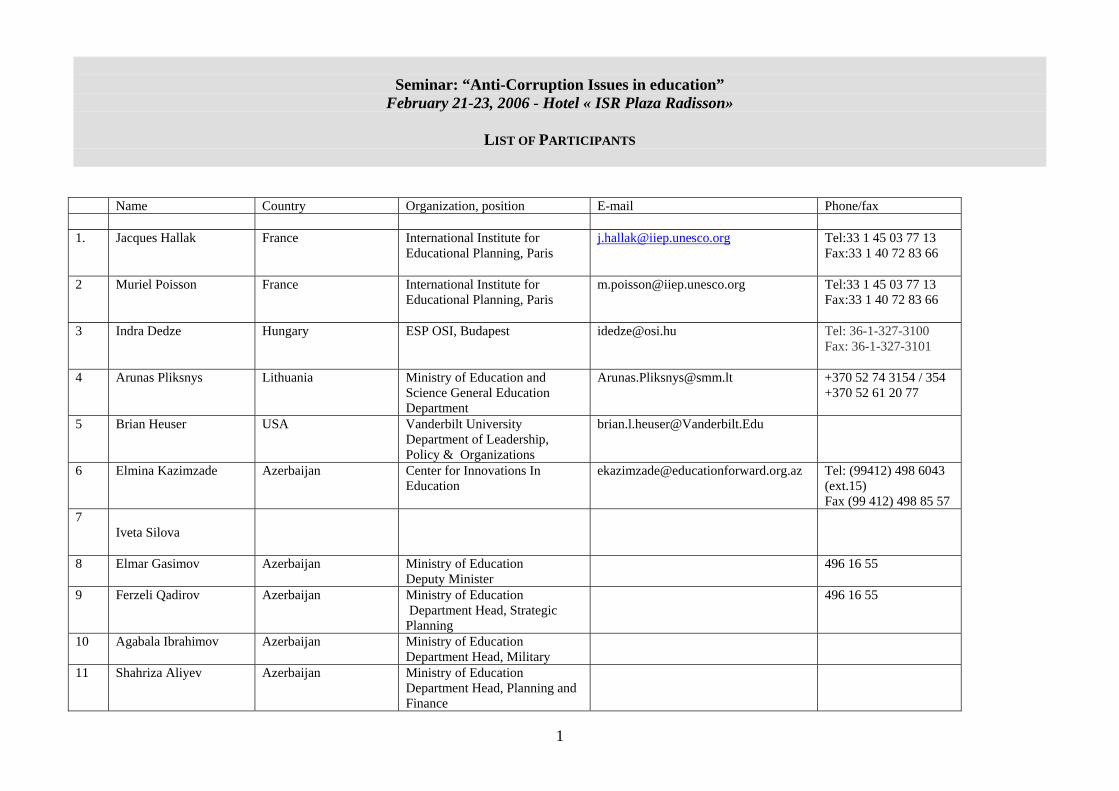
Seminar: “Anti-Corruption Issues in education”
February 21-23, 2006 - Hotel « ISR Plaza Radisson»
LIST OF PARTICIPANTS
Name Country Organization, position E-mail Phone/fax 1. Jacques Hallak
France International Institute for Educational Planning, Paris