36
Volume I Summary Report National Survey of Drinking and Driving Attitudes and Behaviors: 2008
Volume I Summary Report
National Survey of Drinking and Driving
Attitudes and Behaviors:2008

This publication is distributed by the U.S. Department of Transportation, National Highway Traffic Safety Administration, in the interest of information exchange. The opinions, findings, and conclusions expressed in this publication are those of the authors and not necessarily those of the Department of Transportation or the National Highway Traffic Safety Administration. The United States Government assumes no liability for its contents or use thereof. If trade or manufacturers’ names are mentioned, it is only because they are considered essential to the object of the publication and should not be construed as an endorsement. The United States Government does not endorse products or manufacturers.

i
Technical Report Documentation Page
1. Report No. DOT HS 811 342
2. Government Accession No.
3. Recipient’s Catalog No.
4. Title and Subtitle Volume I: Summary Report National Survey of Drinking and Driving Attitudes and Behaviors: 2008
5. Report Date August 2010 6. Performing Organization Code
7. Author(s) Lisa Drew*, Dawn Royal*, Benjamin Moulton, Anne Peterson, Dar Haddix
8. Performing Organization Report No.
9. Performing Organization Name and Address Insight Policy Research 1901 North Moore Street; Suite 601 Arlington, VA 22209 * Gallup, Inc. 901 F Street, NW, Washington DC 20004
10. Work Unit No. (TRAIS)
11. Contract or Grant No. DTNH22-09-C-00120
12. Sponsoring Agency Name and Address U.S. Department of Transportation National Highway Traffic Safety Administration (NHTSA) 1200 New Jersey Avenue, SE Washington, D.C. 20590
13. Type of Report and Period Covered Summary Report Final Report; April 2009-April 2010 14. Sponsoring Agency Code
15. Supplementary Notes Alan Block was the NHTSA COTR 16. Abstract This report presents results from the eighth in a series of national telephone surveys conducted for the National Highway Traffic Safety Administration (NHTSA) to assess current status and trends regarding the public’s attitudes, knowledge, and self-reported behavior related to drinking and driving. This Volume I: Summary Report, presents key results from the survey, including the reported frequency of drinking and driving, perceptions of drinking and driving as a problem, actions taken to prevent drinking and driving, attitudes and experience with enforcement of the drinking and driving laws, and the perceived effectiveness of different intervention strategies. Volume II: Findings Report provides an in-depth analysis of the topics presented in Volume I, in addition to other topics of interest. Volume III: Methodology Report describes the methods used to conduct the interviews and analyze the data, and includes copies of the questionnaires. Twenty percent of the public age 16 and older had in the past year driven a motor vehicle within 2 hours of drinking alcohol, a number largely unchanged from previous survey years. About two-thirds of these drinking-drivers did so in the past 30 days. Computed national estimates showed the public making 85.5 million drinking-driving trips in the past 30 days. Eight percent of the population had ridden in the past year with a driver they thought had consumed too much alcohol to drive safely, with males 21 to 24 (24%) most likely to report this. Thirty percent of drinking-drivers had driven in the past year when they thought they were over the legal limit for alcohol and driving. More than four-fifths (81%) of the public age 16 and older viewed drinking and driving by others as a major safety threat to themselves and their families. One-third (33%) had ridden with a designated driver in the past year. Forty-four percent of drivers had been a designated driver in the past year. About 1% of the population 16 and older had been arrested for a drinking and driving violation in the past 2 years; the percentage was 5% for males 21 to 24. Four in 10 persons (40%) believed the penalties for violating drinking and driving laws should be much more severe, while an additional 26% believed they should be somewhat more severe. Thirty percent had seen a sobriety checkpoint in the past year. There was a preference that sobriety checkpoints be conducted weekly (40%) or monthly (35%). When asked if there was a national minimum drinking age in the United States, 71% said “yes.” Of those who said there was a minimum legal drinking age, 86% correctly identified it as 21. Of eight intervention strategies read to respondents, alcohol interlocks ranked first in the percentage that believed them very effective in reducing or preventing drunk driving (63%), followed by providing alternate ways for people who have had too much to drink to get home, suspending the license of drunk drivers, and impounding or seizing the vehicle of drunk drivers (all at 54%). 17. Key Words Drinking, Driving, Attitudes, DWI, Survey, BAC, Problem Drinkers
18. Distribution Statement This report is available from the National Technical Information Service www.ntis.gov.
19. Security Classif. (of this report) Unclassified
20. Security Classif. (of this page) Unclassified
21. No. of Pages 36
22. Price
Form DOT F 1700.7 (8-72) Reproduction of completed page authorized

ii
iii
Contents Background ..................................................................................................................... v
Section I: 2008 Survey Findings ................................................................................... 1
Drinking and Driving Behaviors ......................................................................... 1
Perceptions of Drinking and Driving as a Problem .......................................... 7
Number of Drinks Before Unsafe to Drive ......................................................... 8
Prevention and Intervention to Reduce Drinking and Driving ........................ 9
Enforcement of Drinking and Driving Laws .................................................... 12
Knowledge of the Minimum Drinking Age and Awareness of BAC Levels
and the Legal BAC Limit ................................................................................... 15
Effectiveness of Strategies to Reduce or Prevent Drunk Driving ................ 17
Section II: Trends, 1993-2008 ...................................................................................... 19
Appendix A: Sample Size Tables ................................................................................ 25

iv
v
Background
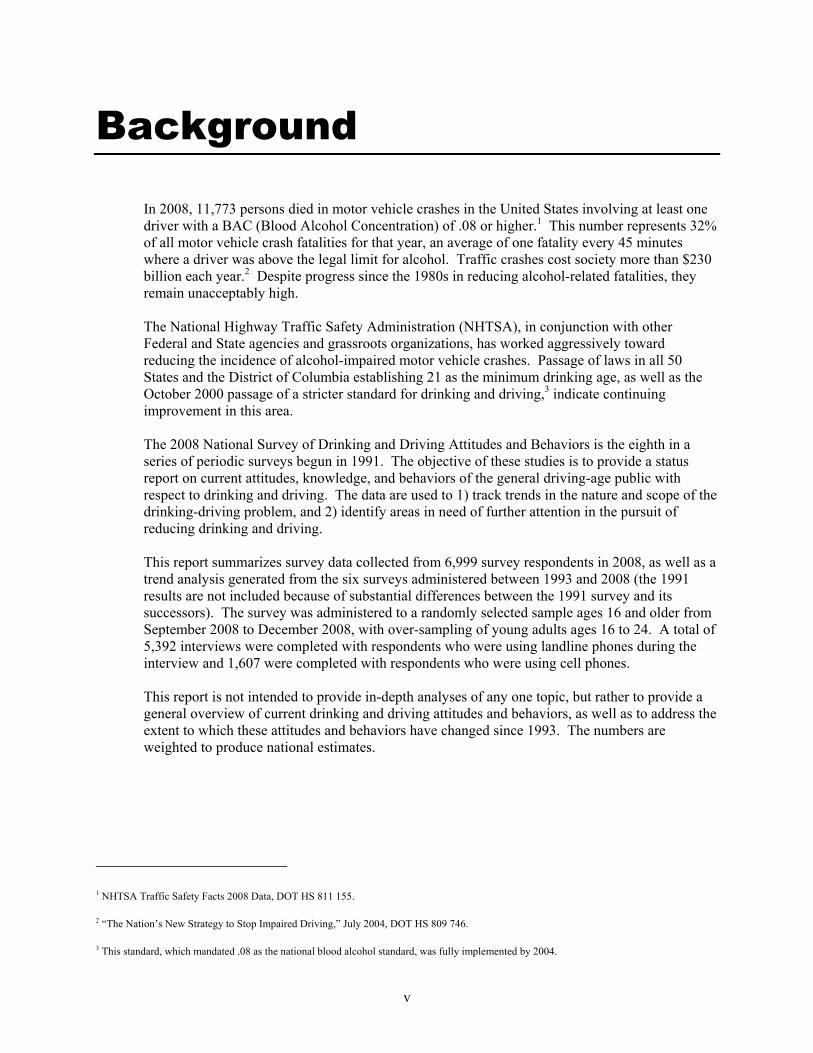
In 2008, 11,773 persons died in motor vehicle crashes in the United States involving at least one driver with a BAC (Blood Alcohol Concentration) of .08 or higher.1 This number represents 32% of all motor vehicle crash fatalities for that year, an average of one fatality every 45 minutes where a driver was above the legal limit for alcohol. Traffic crashes cost society more than $230 billion each year.2 Despite progress since the 1980s in reducing alcohol-related fatalities, they remain unacceptably high. The National Highway Traffic Safety Administration (NHTSA), in conjunction with other Federal and State agencies and grassroots organizations, has worked aggressively toward reducing the incidence of alcohol-impaired motor vehicle crashes. Passage of laws in all 50 States and the District of Columbia establishing 21 as the minimum drinking age, as well as the October 2000 passage of a stricter standard for drinking and driving,3 indicate continuing improvement in this area. The 2008 National Survey of Drinking and Driving Attitudes and Behaviors is the eighth in a series of periodic surveys begun in 1991. The objective of these studies is to provide a status report on current attitudes, knowledge, and behaviors of the general driving-age public with respect to drinking and driving. The data are used to 1) track trends in the nature and scope of the drinking-driving problem, and 2) identify areas in need of further attention in the pursuit of reducing drinking and driving. This report summarizes survey data collected from 6,999 survey respondents in 2008, as well as a trend analysis generated from the six surveys administered between 1993 and 2008 (the 1991 results are not included because of substantial differences between the 1991 survey and its successors). The survey was administered to a randomly selected sample ages 16 and older from September 2008 to December 2008, with over-sampling of young adults ages 16 to 24. A total of 5,392 interviews were completed with respondents who were using landline phones during the interview and 1,607 were completed with respondents who were using cell phones. This report is not intended to provide in-depth analyses of any one topic, but rather to provide a general overview of current drinking and driving attitudes and behaviors, as well as to address the extent to which these attitudes and behaviors have changed since 1993. The numbers are weighted to produce national estimates.
1 NHTSA Traffic Safety Facts 2008 Data, DOT HS 811 155. 2 “The Nation’s New Strategy to Stop Impaired Driving,” July 2004, DOT HS 809 746. 3 This standard, which mandated .08 as the national blood alcohol standard, was fully implemented by 2004.

vi

1
Section I: 2008 Survey Findings Drinking and Driving Behaviors
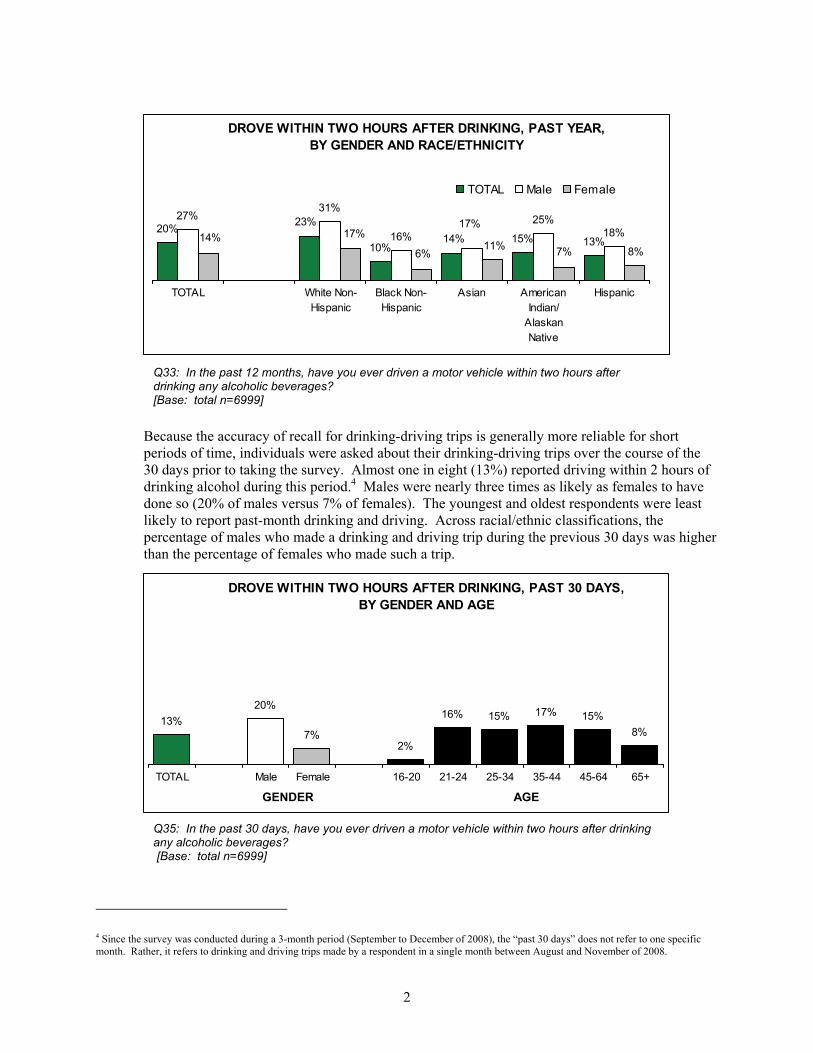
One in five (20%) persons of driving age reported driving a motor vehicle within 2 hours of consuming alcoholic beverages in the past year. These persons are referred to as “drinking-drivers” throughout this report. Twenty-seven percent of males and 14% of females reported at least one drinking-driving trip in the past year.
When examined by race and ethnicity, the percentage of the driving-age public who reported driving a motor vehicle within 2 hours of drinking any alcoholic beverages ranged from 10% of Non-Hispanic Blacks to 23% of Non-Hispanic Whites. The percentage of drinking-drivers was higher among males in all racial/ethnic groups.
Q33: In the past 12 months, have you ever driven a motor vehicle within two hours after drinking any alcoholic beverages? [Base: total n=6999]
6%
25% 24% 26%22%
12%
27%31% 31% 34%
29%
19%20%
8%14%
20% 17% 18% 16%
7%5%
TOTAL 16-20 21-24 25-34 35-44 45-64 65+
TOTAL Male Female
DROVE WITHIN TWO HOURS AFTER DRINKING, PAST YEAR, BY GENDER AND AGE
AGE
2
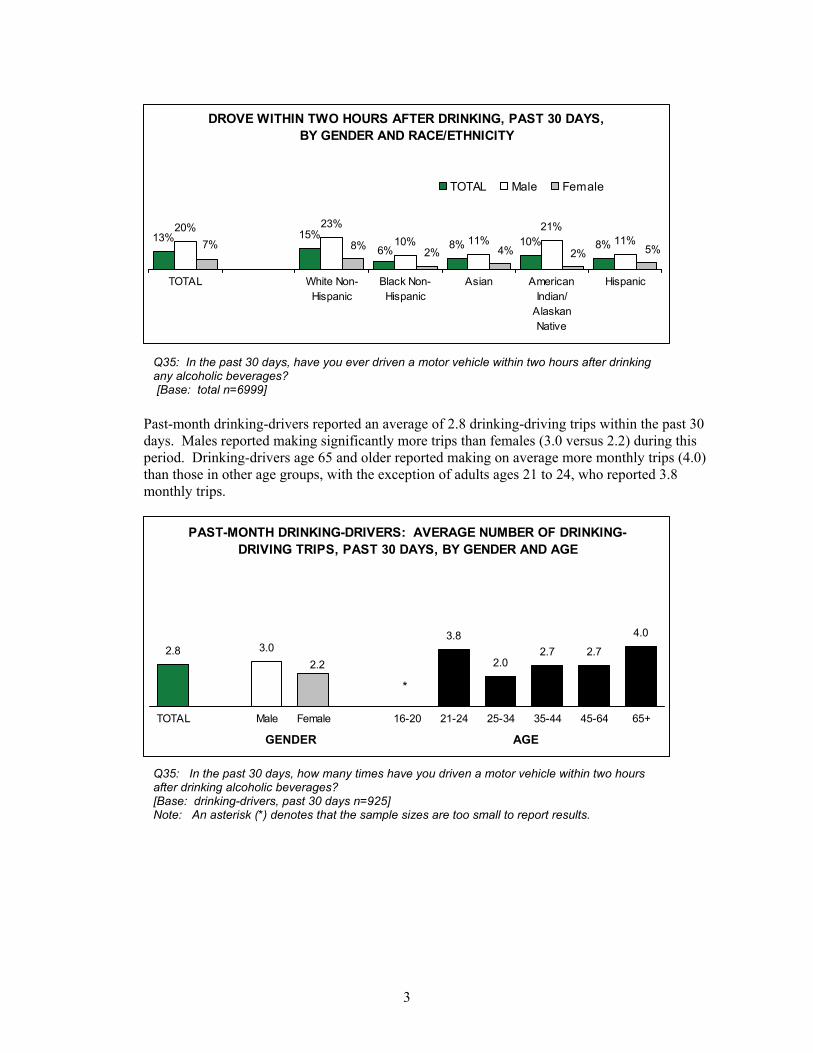
Because the accuracy of recall for drinking-driving trips is generally more reliable for short periods of time, individuals were asked about their drinking-driving trips over the course of the 30 days prior to taking the survey. Almost one in eight (13%) reported driving within 2 hours of drinking alcohol during this period.4 Males were nearly three times as likely as females to have done so (20% of males versus 7% of females). The youngest and oldest respondents were least likely to report past-month drinking and driving. Across racial/ethnic classifications, the percentage of males who made a drinking and driving trip during the previous 30 days was higher than the percentage of females who made such a trip.
4 Since the survey was conducted during a 3-month period (September to December of 2008), the “past 30 days” does not refer to one specific month. Rather, it refers to drinking and driving trips made by a respondent in a single month between August and November of 2008.
Q33: In the past 12 months, have you ever driven a motor vehicle within two hours after drinking any alcoholic beverages? [Base: total n=6999]
Q35: In the past 30 days, have you ever driven a motor vehicle within two hours after drinking any alcoholic beverages? [Base: total n=6999]
20%15% 13%
27%31%
16%25%
18%23%
10%14%
17%14% 17%
6%11% 7% 8%
TOTAL White Non-Hispanic
Black Non-Hispanic
Asian AmericanIndian/
AlaskanNative
Hispanic
TOTAL Male Female
DROVE WITHIN TWO HOURS AFTER DRINKING, PAST YEAR,BY GENDER AND RACE/ETHNICITY
13%20%
7%2%
16% 15% 17% 15%8%
TOTAL Male Female 16-20 21-24 25-34 35-44 45-64 65+
DROVE WITHIN TWO HOURS AFTER DRINKING, PAST 30 DAYS, BY GENDER AND AGE
GENDER AGE
3
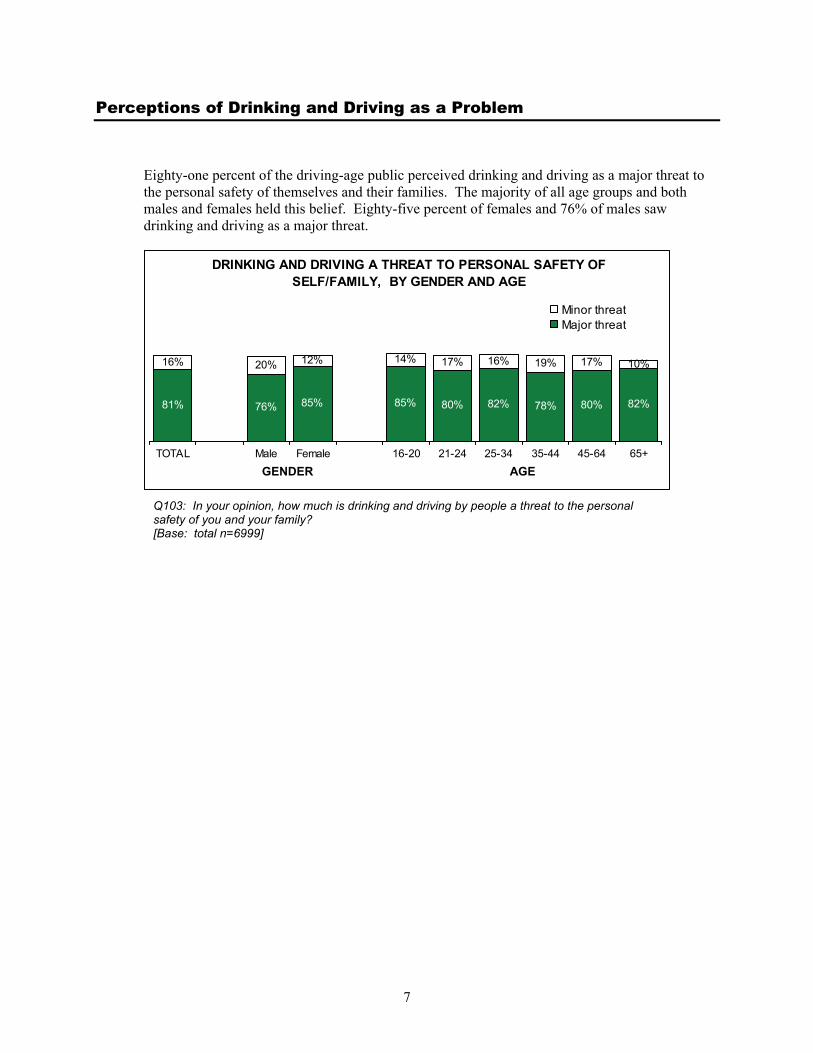
Past-month drinking-drivers reported an average of 2.8 drinking-driving trips within the past 30 days. Males reported making significantly more trips than females (3.0 versus 2.2) during this period. Drinking-drivers age 65 and older reported making on average more monthly trips (4.0) than those in other age groups, with the exception of adults ages 21 to 24, who reported 3.8 monthly trips.
Q35: In the past 30 days, have you ever driven a motor vehicle within two hours after drinking any alcoholic beverages? [Base: total n=6999]
Q35: In the past 30 days, how many times have you driven a motor vehicle within two hours after drinking alcoholic beverages? [Base: drinking-drivers, past 30 days n=925] Note: An asterisk (*) denotes that the sample sizes are too small to report results.
13% 15%8% 10% 8%
20% 23%10% 11%
21%11%
6% 5%2%4%2%8%7%
TOTAL White Non-Hispanic
Black Non-Hispanic
Asian AmericanIndian/
AlaskanNative
Hispanic
TOTAL Male Female
DROVE WITHIN TWO HOURS AFTER DRINKING, PAST 30 DAYS,BY GENDER AND RACE/ETHNICITY
2.8 3.03.8
2.02.7 2.7
4.0
2.2
TOTAL Male Female 16-20 21-24 25-34 35-44 45-64 65+
PAST-MONTH DRINKING-DRIVERS: AVERAGE NUMBER OF DRINKING-DRIVING TRIPS, PAST 30 DAYS, BY GENDER AND AGE
*
GENDER AGE

4
Comparing the proportion of total past-month drinking driving-trips made by each age and gender group to the proportion that each group comprises of the total population, males showed the greatest overrepresentation in drinking-driving. They accounted for 48% of the population age 16 and older, but 78% of past-month drinking-driving trips. Similarly, individuals ages 21 to 24, 35 to 44, and 45 to 64 all accounted for a greater percentage of drinking-driving trips relative to their proportion of the driving-age population.
Q35: In the past 30 days, how many times have you driven a motor vehicle within two hours after drinking alcoholic beverages? [Base: drinking-drivers, past 30 days n=925]
48% 52%
16% 19% 16%
78%
2%12% 14%9%
33%
7%
36%23%
13%22%
Male Female 16-20 21-24 25-34 35-44 45-64 65+
Percent of population 16 and olderPercent of drinking-driving trips
PERCENT OF TOTAL ESTIMATED DRINKING-DRIVING TRIPS, PAST 30 DAYS, BY GENDER AND AGE
GENDER AGE

5
Overall, drinking-drivers made an estimated 85.5 million drinking-driving trips in the past month, with the actual number expected to be somewhere between 74.4 million and 96.6 million at the 95% confidence interval.5 Although they accounted for 48% of the driving-age population, males made about 66.7 million, or 78%, of the total trips. Persons ages 16 to 20 (9% of the driving-age population) made an estimated 1.4 million drinking-driving trips (2% of all trips).
Almost one-third (30%) of drinking-drivers reported that they drove at least once in the past year when they thought they were over the legal limit for alcohol consumption and driving. Males were significantly more likely than females to report this. The proportion of persons who drove when they thought they were over the legal limit declined with age.
5 The survey was administered between August and November 2008.
Q52: About how many times in the PAST 12 MONTHS did you drive when you thought you were over the legal limit for alcohol and driving? [Base: drinking-drivers n=1466]
30% 35%22%
57%50%
42%27% 24%
13%
TOTAL Male Female 16-20 21-24 25-34 35-44 45-64 65+
DROVE WHEN THOUGHT OVER LEGAL LIMIT,PERCENT YES
85.5
66.7
18.8
1.49.9 11.2
20.030.7
11.78.2
0.56.4 7.9
13.7
56.7
74.4
13.523.8
15.123.9
76.6
96.6
13.52.5
14.526.6
37.6
TOTAL Male Female 16-20 21-24 25-34 35-44 45-64 65+
MIL
LIO
NS
TOTAL ESTIMATED DRINKING-DRIVING TRIPS (IN MILLIONS), PAST 30 DAYS, BY GENDER AND AGE
GENDER AGE
GENDER AGE

6
In the past year, approximately one in 12 (8%) persons rode with a driver who they thought may have consumed too much alcohol to drive safely. Approximately equal proportions of males (8%) and females (7%) rode with a potentially unsafe driver. Twenty-four percent of males ages 21 to 24 reported riding with a driver they thought had too much to drink. Twelve percent of Hispanics reported experiencing this situation compared to 7% of Non-Hispanic Whites and Blacks (other groups had small sample sizes).
Q57: In the past 12 months, did you ever ride in a motor vehicle with a driver you thought might have consumed too much alcohol to drive safely? [Base: total n=6999]
Q57: In the past 12 months, did you ever ride in a motor vehicle with a driver you thought might have consumed too much alcohol to drive safely? [Base: total n=6999]
8%12% 11%
4% 2% 3%
24%
10%7%7%7%
11%12%7%
TOTAL 16-20 21-24 25-34 35-44 45-64 65+
MaleFemale
RODE WITH DRIVER WHO MIGHT HAVE HAD TOO MUCH ALCOHOL TO DRIVE SAFELY, PAST YEAR, BY GENDER AND AGE
8% 7% 7%
3%
13%15%
12%
TOTAL White Non-Hispanic
Black Non-Hispanic
Asian AmericanIndian/
AlaskanNative
Haw aiian/Pacif icIslander
Hispanic
RODE WITH DRIVER WHO MIGHT HAVE HAD TOO MUCH ALCOHOL, PAST YEAR, BY RACE/ETHNICITY
AGE
7
Perceptions of Drinking and Driving as a Problem
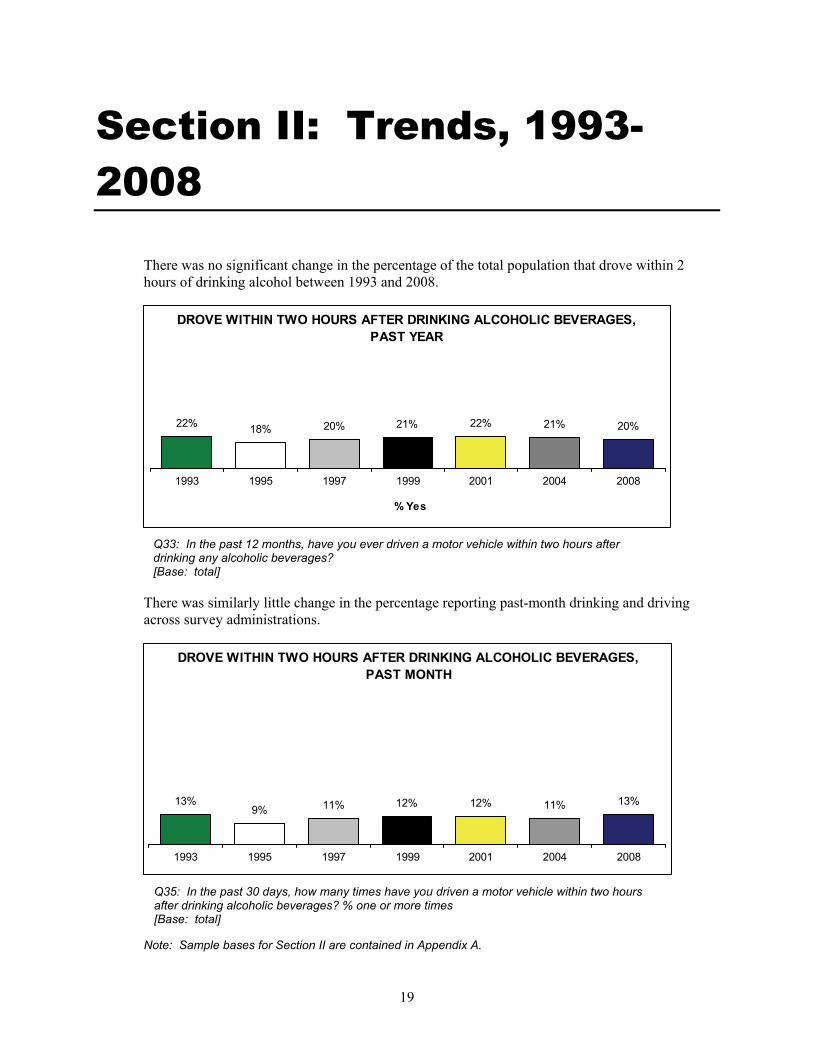
Eighty-one percent of the driving-age public perceived drinking and driving as a major threat to the personal safety of themselves and their families. The majority of all age groups and both males and females held this belief. Eighty-five percent of females and 76% of males saw drinking and driving as a major threat.
Q103: In your opinion, how much is drinking and driving by people a threat to the personal safety of you and your family? [Base: total n=6999]
82%80%78%82%80%85%85%76%81%
10%17%19%16%16% 20% 12% 14% 17%
TOTAL Male Female 16-20 21-24 25-34 35-44 45-64 65+
Minor threatMajor threat
DRINKING AND DRIVING A THREAT TO PERSONAL SAFETY OF SELF/FAMILY, BY GENDER AND AGE
GENDER AGE

8
Number of Drinks Before Unsafe to Drive
Forty percent of drivers who consumed alcohol felt it would be safe for them to have three or more drinks within a 2-hour period before driving, with a portion of that 40% believing they could have five or more drinks. Slightly more than one in four (26%) placed their personal limit (after which it would be unsafe for them to drive) at one or fewer drinks.
Male drivers ages 16 to 24 who drink alcohol reported an ability, on average, to consume 3.8 drinks before it would be unsafe for them to drive, while female drivers of the same age reported being able to consume on average 2.4 drinks. Generally, males perceived their personal limit to be at least one drink more than their female counterparts.
Q31: In your opinion, how many [drinks of alcoholic beverage drunk most often] could you drink in two hours before it would be unsafe for you to drive? [Base: drivers who drink n=4023]
Q31: In your opinion, how many [drinks of alcoholic beverage drunk most often] could you drink in two hours before it would be unsafe for you to drive? [Base: drivers who drink n=4023]
DK3%
5 or more drinks11%
2 drinks31%
1 drink20%
Less than 1 drink6%
3-4 drinks29%
NUMBER OF DRINKS IN TWO HOURS BEFOREUNSAFE TO DRIVE
3.8 3.8 3.53.1
2.42.42.9
2.4 2.1 2.0 2.01.6
16-20 21-24 25-34 35-44 45-64 65+
MaleFemale
AVERAGE NUMBER OF DRINKS IN TWO HOURS BEFORE UNSAFE TO DRIVE, BY GENDER AND AGE
AGE

9
Prevention and Intervention to Reduce Drinking and Driving
Forty-four percent of all past-year drivers who drink avoided driving a motor vehicle at least once because they felt they may have drunk too much to drive safely. Males (50%) were more likely than females (38%) to report having deliberately avoided driving when they thought they had too much to drink. Avoidance of driving after drinking too much was most common among drivers under age 25, and then decreased steadily with age.
Of those who avoided driving after drinking too much, 28% did so by riding with a designated driver while another 26% rode with another driver at the drinking location. About 11% stayed the night to avoid driving after drinking. Staying overnight was the tactic used most frequently by those under age 21 (30%).
Q54: In the past 12 months, have you ever deliberately avoided driving a motor vehicle because you felt you probably had too much to drink to drive safely? [Base: drivers who drink alcohol n=4023]
Q56: On the most recent time that you deliberately avoided driving after drinking, how did you do it? [Base: avoided driving after drinking, past year n=1626]
76% 82%
55%40%
11%
77% 76%
55%41%
27%
5%
50%66%
38%
TOTAL 16-20 21-24 25-34 35-44 45-64 65+
MaleFemale
AVOIDED DRIVING WHEN HAD TOO MUCH TO DRINK TO DRIVE SAFELY, BY GENDER AND AGE
AGE
12%
13%
26%
11%
28%
Stayed overnight
Was home/stayed home
Called a cab or ride
Rode w ith another driver at drinking location
Used a designated driver
ACTIONS TO AVOID DRIVING AFTER DRINKING TOO MUCH TO DRIVE SAFELY

10
Forty-four percent of drivers acted as a designated driver in the past year. Conversely, one in three (33%) persons of driving age rode with a designated driver in the past year. Males (35%) were significantly more likely than females (31%) to report having ridden with a designated driver in the past year. The likelihood of having ridden with a designated driver peaked at ages 21 to 24, then steadily decreased with age.
Q64b: Have you been a designated driver for other passengers in the past year? [Base: drivers n=6432]
Q61: In the past year, have you ridden anywhere with someone else who agreed to be the designated driver? [Base: total n=6999]
44% 42% 45%
72%58%
50%38%
16%
53%
TOTAL Male Female 16-20 21-24 25-34 35-44 45-64 65+
HAVE BEEN DESIGNATED DRIVER IN PAST YEAR, BY GENDER AND AGE
33% 35% 31%
45%
61%
44%35%
27%
12%
TOTAL Male Female 16-20 21-24 25-34 35-44 45-64 65+
RODE WITH DESIGNATED DRIVER IN PAST YEAR, BY GENDER AND AGE
GENDER AGE
GENDER AGE

11
Forty-three percent of all respondents reported having been in a situation in which a friend, family member, or acquaintance had too much to drink to drive safely yet was planning to drive. A greater percentage of males reported being in such a situation compared to females (46% and 39% respectively).
Q96a: Now I’d like to ask you about situations when you were with a friend, family member, or acquaintance who had too much to drink to drive safely, yet was planning on driving? Have you ever been in this type of situation? [Base: total n=6999]
43% 46%39% 36%
51% 48% 51%44%
23%
TOTAL Male Female 16-20 21-24 25-34 35-44 45-64 65+
PERSONS WITH A FRIEND, FAMILY MEMBER, OR ACQUAINTANCE WHO HAD TOO MUCH TO DRINK TO DRIVE SAFELY, PAST YEAR
GENDER AGE

12
Enforcement of Drinking and Driving Laws
About 1% of the driving-age population reported being arrested for a drinking and driving violation in the past 2 years. Of those who were arrested for drinking and driving violations, 97% were arrested one time.
Twelve percent of the driving-age public believed that a driver who had too much to drink to drive safely was “almost certain” to be stopped by the police, and 17% believed that it was “almost certain” that it would result in a motor vehicle crash. Across all age, gender, and racial groups, a greater percentage of individuals were “almost certain” that an accident would occur than were “almost certain” the impaired driver would be stopped by police.
Q113: Have you been arrested for a drinking and driving violation in the past two years? [Base: total n=6999] Note: An asterisk (*) denotes a value less than 0.5%.
Q105b: How likely is it that drivers who have had too much to drink and drive will: A. Get stopped by the police? B. Have an accident? [Base: total n=6999]
12% 10% 13% 12% 16% 15%11% 10% 10%
17% 20% 18% 19% 18% 20%14%
19%14%
TOTAL Male Female 16-20 21-24 25-34 35-44 45-64 65+
Stopped by policeHave an accident
IF DRINKING AND DRIVING, "ALMOST CERTAIN" WILL GET STOPPED BY POLICE, HAVE AN ACCIDENT, BY GENDER AND AGE
GENDER AGE
1% 1%5%
2%2%* ** * 1% * * * *
TOTAL 16-20 21-24 25-34 35-44 45-64 65+
MaleFemale
ARRESTED FOR DRINKING-DRIVING VIOLATION IN PAST TWO YEARS, BY GENDER AND AGE
AGE

13
The driving-age public generally supported increased penalties for violating the drinking and driving laws. Approximately two-thirds (66%) felt that penalties for violators should be more severe, while 28% felt they should stay the same. In contrast, only 43% of drinking-drivers supported more severe penalties.
Q105b: How likely is it that drivers who have had too much to drink and drive will: A. Get stopped by the police? B. Have an accident? [Base: total n=6999]
Q116: In your opinion, should the penalties for violating the drinking and driving laws be…? [Base: total n=6999]
SHOULD PENALTIES FOR VIOLATING DRINKING-DRIVING LAWS BE MORE SEVERE
12% 7%24%
12% 17%29%
17% 12%33%
20% 22%34%
TOTAL White Non-Hispanic
Black Non-Hispanic
Asian American Indian/Alaskan Native
Hispanic
Stopped by police
Have an accident
IF DRINKING AND DRIVING, "ALMOST CERTAIN" WILL GET STOPPED BY POLICE, HAVE AN ACCIDENT, BY RACE/ETHNICITY
DK2%
Stay the same28%
Somew hat more
severe26%
Much more severe40%
Much/ somew hat
less severe
4%

14
Almost one-third (30%) of all respondents reported they had seen a sobriety checkpoint in the past year. Males (35%) were more likely to have reported seeing sobriety checkpoints than females (25%). After age 24, the likelihood of seeing a sobriety checkpoint decreased with age.
Three in four (75%) persons of driving age endorsed weekly or monthly sobriety checkpoints. Only 6% believed that sobriety checkpoints should not be used at all.
Q120: In the past 12 months, have you seen a sobriety checkpoint, where drivers are stopped briefly by police to check for alcohol-impaired driving? [Base: total n=6999]
Q122c.: About how often do you think sobriety checkpoints should be conducted? [Base: total n=6999]
HOW OFTEN SHOULD SOBRIETY CHECKPOINTS BE USED
25%
38% 42%36% 32%
28%
16%
35%30%
TOTAL Male Female 16-20 21-24 25-34 35-44 45-64 65+
HAVE SEEN A SOBRIETY CHECKPOINT, PAST YEAR, BY GENDER AND AGE
GENDER AGE
Don’ t know1 %
Not at all6%
Quarterly11%
M onthly35%
Weekly40%
Once or twice a year
6%

15
Knowledge of the Minimum Drinking Age and Awareness of BAC Levels and the Legal BAC Limit
Seventy-one percent of the driving-age population were aware that there is a minimum legal drinking age (MDA) in the U.S. Eighty-six percent of those who reported awareness of a minimum legal drinking age correctly identified the MDA as 21. There was no significant difference in awareness between males and females. Teenagers and young adults were most likely to be aware of the minimum legal drinking age, with the percentage then declining with age.
Q139a. To your knowledge, is there a national minimum drinking age in the United States? [Base: total n=6999]
71% 70% 72%87% 84%
74%63%
55%
87%
TOTAL Male Female 16-20 21-24 25-34 35-44 45-64 65+
KNOWLEDGE OF THE MINIMUM LEGAL DRINKING AGE, BY GENDER AND AGE
GENDER AGE

16
More than four in five (85%) persons of driving age had heard of blood alcohol concentration (BAC) levels. Males (88%) were somewhat more likely than females (83%) to have heard of BAC levels. Persons age 65 and older were the least likely to have heard of BAC levels (77%).
It would take an average 170-pound male more than four drinks within a 2-hour period to reach a BAC level of .08 (the point at which it is illegal per se to drive), while it would take more than three drinks in 2 hours for an average 137-pound female to reach a .08 BAC level. The data suggested underestimation by the public in the perceived amount of alcohol it would take to reach the legal limit as 31% of males believed it would take four or more beers and 40% of females believed it would take three or more beers.
Q123: The amount of alcohol in a person’s body can be measured in terms of the “Blood Alcohol Concentration,” which is often called the BAC level. Have you ever heard of blood alcohol concentration or BAC levels before today? [Base: total n=6999]
Q126: The legal limit in your state is .08. In your opinion, how many 12 ounce beers would a male/female about your height and weight have to drink in a two-hour period to just reach the legal limit of .08? [Base: total n=6999, male n=3132, female n=3867]
85% 88% 83% 83% 86% 84% 89% 88%77%
TOTAL Male Female 16-20 21-24 25-34 35-44 45-64 65+
HAVE HEARD OF BAC LEVELS
GENDER AGE
13% 17%10%
10% 14% 6%
11% 8% 15%
31% 28%34%
25% 27%24%
TOTAL Male Female
5+ beers4 beers3 beers2 beers<=1 beer
NUMBER OF BEERS NEEDED TO REACH LEGAL LIMIT
GENDER

17
Effectiveness of Strategies to Reduce or Prevent Drunk Driving
The driving-age public was asked to rate the effectiveness of eight specific strategies in reducing or preventing drunk driving. Of the eight strategies rated, a breath-testing device in vehicles to prevent driving if the driver has been drinking ranked highest in the percentage who believed the strategy to be very effective (63%). Fifty-four percent felt that providing people who had too much to drink with an alternate way to get home, suspending the licenses of drunk drivers, and impounding the vehicles of drunk drivers would be very effective. Increasing penalties for hosts whose guests drive away drunk ranked lowest among the eight strategies by both the driving-age population and the subgroup of drinking-drivers (34% and 19%, respectively). The largest gap in perceived effectiveness of a strategy between the general driving population and drinking-drivers was for increasing police and other law-enforcement efforts to arrest drunken drivers (48% versus 31% respectively, a 17-percentage-point difference).
Q139: In your opinion, how effective do you think each of the following strategies would be? [Base: total n=6999, drinking-drivers n=1466]
19%
45%
25%
31%
38%
40%
54%
54%
63%
26%
34%
40%
48%
40%
54%
54%
Increasing penalties for party hosts whose guests drive awaydrunk
Providing people who have had too much to drink an alternateway of getting home other than driving themselves, such as
safe ride or o ther designated driver programs
Increasing the penalties for alcohol servers at licensedestablishments who serve alcohol to drunk patrons
Increasing po lice and other law enforcement efforts to arrestdrunken drivers
M aking treatment for alcoholism and alcohol abuse problemsmore available to people
Suspending the license of drunk drivers
Impounding or seizing the vehicle o f drunk drivers
Requiring a breath testing device in the vehicle that preventsdriving if driver has been drinking
Population 16+
Drinking-drivers
PERCEIVED EFFECTIVENESS OF STRATEGIES, PERCENT WHO SAID "VERY EFFECTIVE," POPULATION 16+ AND DRINKING-DRIVERS

18
19
Section II: Trends, 1993-2008
There was no significant change in the percentage of the total population that drove within 2 hours of drinking alcohol between 1993 and 2008.
There was similarly little change in the percentage reporting past-month drinking and driving across survey administrations. Note: Sample bases for Section II are contained in Appendix A.
Q33: In the past 12 months, have you ever driven a motor vehicle within two hours after drinking any alcoholic beverages? [Base: total]
Q35: In the past 30 days, how many times have you driven a motor vehicle within two hours after drinking alcoholic beverages? % one or more times [Base: total]
22% 18% 20% 21% 22% 21% 20%
1993 1995 1997 1999 2001 2004 2008
DROVE WITHIN TWO HOURS AFTER DRINKING ALCOHOLIC BEVERAGES,PAST YEAR
% Yes
13%9% 11% 12% 11% 13%12%
1993 1995 1997 1999 2001 2004 2008
DROVE WITHIN TWO HOURS AFTER DRINKING ALCOHOLIC BEVERAGES, PAST MONTH

20
The average number of drinks consumed during the most recent drinking-driving occasion declined from 1995 to 1997, but has shown little variation since.
NUMBER OF DRINKS, MOST RECENT DRINKING-DRIVING OCCASION,
BY GENDER AND AGE
Similarly, there has been little change across recent survey administrations in the average number of times drinking-drivers reported that they drove in the past year when they thought they were over the legal limit.
NUMBER OF TIMES DRIVING WHEN THOUGHT ONE WAS
OVER THE LEGAL LIMIT, PAST 12 MONTHS, BY GENDER AND AGE
Year Total Gender Age Male Female 16-20 21-24 25-34 35-44 45-64 65+ 1995 2.9 3.1 2.4 5.0 3.4 3.0 2.8 2.4 2.4 1997 2.5 2.7 2.2 4.6 3.2 2.8 2.3 2.1 1.6 1999 2.7 2.9 2.2 6.3 3.3 3.3 2.6 1.9 1.9 2001 2.6 2.8 2.1 5.1 3.5 2.9 2.5 2.1 1.7 2004 2.5 2.7 2.1 5.0 2.7 2.7 2.6 2.3 1.8 2008 2.5 2.7 2.1 4.9 3.8 2.8 2.5 2.0 .7
Q38: How many drinks did you have on that (most recent) occasion? [Base: drinking-drivers] Note: The question was not asked in 1993, and an outlier of ‘60’ was not included in the calculation of the average for 2008.
Year Total Gender Age Male Female 16-20 21-24 25-34 35-44 45-64 65+ 1999 2.3 3.0 0.8 2.4 2.4 6.0 2.0 0.6 0.3 2001 1.7 1.9 1.1 9.9 3.8 1.9 0.8 1.1 0.3 2004 1.5 1.8 0.8 1.5 1.4 2.1 0.7 2.1 0.2 2008 1.6 2.1 0.6 2.5 2.9 2.3 1.9 0.8 0.7
Q52: About how many times in the PAST 12 MONTHS did you drive when you thought you were OVER THE LEGAL LIMIT FOR ALCOHOL AND DRIVING? That is, the amount of alcohol in your body was greater than the law allows. [Base: drinking-drivers] Note: The question was not asked in 1993 or 1997, and sample sizes were too small to report answers to the question in 1995.

21
There has been fluctuation over the years in the number of drinks that individuals believed they could consume in 2 hours and still safely drive, with the average across drinkers in 2008 edging higher from the 2004 figure.
A significant increase was found in the percentage of drinking-drivers who reported that at least once during the prior year they avoided driving because they felt that they had too much to drink to drive safely. This increase was driven primarily by the increase found among males. No statistically significant change was found for any of the included age groups.
AVOIDED DRIVING BECAUSE FELT THAT ONE HAD
TOO MUCH TO DRINK TO DRIVE SAFELY, PAST 12 MONTHS, BY GENDER AND AGE (IN PERCENTAGES)
Year Total Gender Age Male Female 16-20 21-24 25-34 35-44 45-64 65+ 1993 46% 45% 48% 77% 78% 61% 45% 30% 9% 1995 49% 48% 51% 78% 80% 66% 44% 30% 18% 1997 48% 48% 50% 90% 79% 59% 47% 31% 18% 1999 45% 45% 45% 87% 84% 60% 42% 28% 12% 2001 50% 52% 47% 81% 82% 75% 44% 39% 12% 2004 51% 53% 46% 84% 70% 70% 47% 43% 20% 2008 53% 54% 50% 93% 90% 72% 55% 39% 10%
Q31: How many [drinks of alcoholic beverage drunk most often] could you drink in two hours before it would be unsafe for you to drive? [Base: drivers who drink] Note: Outliers greater than ‘30’ drinks were set to missing.
Q54: In the past 12 months, have you ever deliberately avoided driving a motor vehicle because you felt you probably had too much to drink to drive safely? [Base: drinking-drivers]
3.0 3.32.52.2
2.61.7
2.32.8
1.72.2
2.6
1.62.1
2.51.6
2.63.1
2.0
TOTAL Male Female
1995 1997 1999 2001 2004 2008
AVERAGE NUMBER OF DRINKS IN TWO HOURS BEFORE UNSAFE TO DRIVE, BY GENDER
GENDER

22
The proportion of driving-age persons who reported that at least once in the past year they rode with someone who they thought may have had too much alcohol to drive safely ranged from 12% in 1993 to 8% in 2004 and 2008.
RODE WITH A DRIVER WHO MAY HAVE CONSUMED
TOO MUCH ALCOHOL TO DRIVE SAFELY, BY GENDER AND AGE (IN PERCENTAGES)
Year Total Gender Age Male Female 16-20 21-24 25-34 35-44 45-64 65+ 1993 12% 12% 12% 25% 24% 16% 11% 8% 5% 1995 9% 10% 8% 22% 20% 13% 8% 5% 3% 1997 10% 10% 9% 23% 18% 11% 9% 6% 4% 1999 11% 11% 11% 27% 23% 14% 11% 5% 4% 2001 11% 12% 10% 21% 26% 14% 9% 7% 4% 2004 8% 8% 7% 14% 15% 13% 8% 5% 2% 2008 8% 8% 7% 12% 18% 9% 9% 5% 3%
There was little to no change across survey years in the percentage of those that reported riding with a designated driver.
RODE WITH A DESIGNATED DRIVER IN PAST YEAR, BY GENDER AND AGE
(IN PERCENTAGES)
Q61: In the past 12 months, have you ever ridden anywhere with someone else who agreed to be the designated driver? [Base: total]
Q57: In the past 12 months, did you ever ride in a motor vehicle with a driver you thought might have consumed too much alcohol to drive safely? [Base: total]
Year Total Gender Age Male Female 16-20 21-24 25-34 35-44 45-64 65+ 1993 33% 36% 31% 53% 59% 49% 32% 23% 13% 1995 29% 32% 26% 44% 59% 39% 30% 17% 13% 1997 32% 35% 30% 57% 68% 42% 30% 23% 10% 1999 32% 33% 31% 53% 53% 49% 35% 20% 10% 2001 33% 35% 30% 52% 68% 45% 35% 21% 12% 2004 32% 35% 29% 46% 59% 47% 36% 24% 9% 2008 33% 35% 31% 45% 61% 44% 35% 27% 12%

23
The percentage of the driving-age public who believed that penalties for violating drinking and driving laws should be “much more severe” has gone up and down over the years. There has also been fluctuation in the percentage who believed these penalties should be “somewhat more severe” and a significant increase in recent years in the percentage who believed that drinking and driving penalties should “stay the same.”
BELIEVE THAT THE PENALTIES FOR VIOLATING DRINKING AND DRIVING LAWS SHOULD BE
MORE, OR LESS, SEVERE (IN PERCENTAGES)
Year Much more
severe Somewhat
more severe Somewhat less
severe Much less
severe
Stay the same as they are
now Don’t know/
Refused 1993 38% 33% 2% 1% 23% 3% 1995 47% 25% 2% 1% 21% 4% 1997 44% 31% 2% 0% 22% 0% 1999 43% 30% 3% 1% 21% 2% 2001 43% 27% 3% 1% 24% 2% 2004 44% 26% 3% 1% 25% 2% 2008 40% 26% 3% 1% 28% 2%
Q116: In your opinion, should the penalties for violating drinking and driving laws be…? [Base: total]

24
25
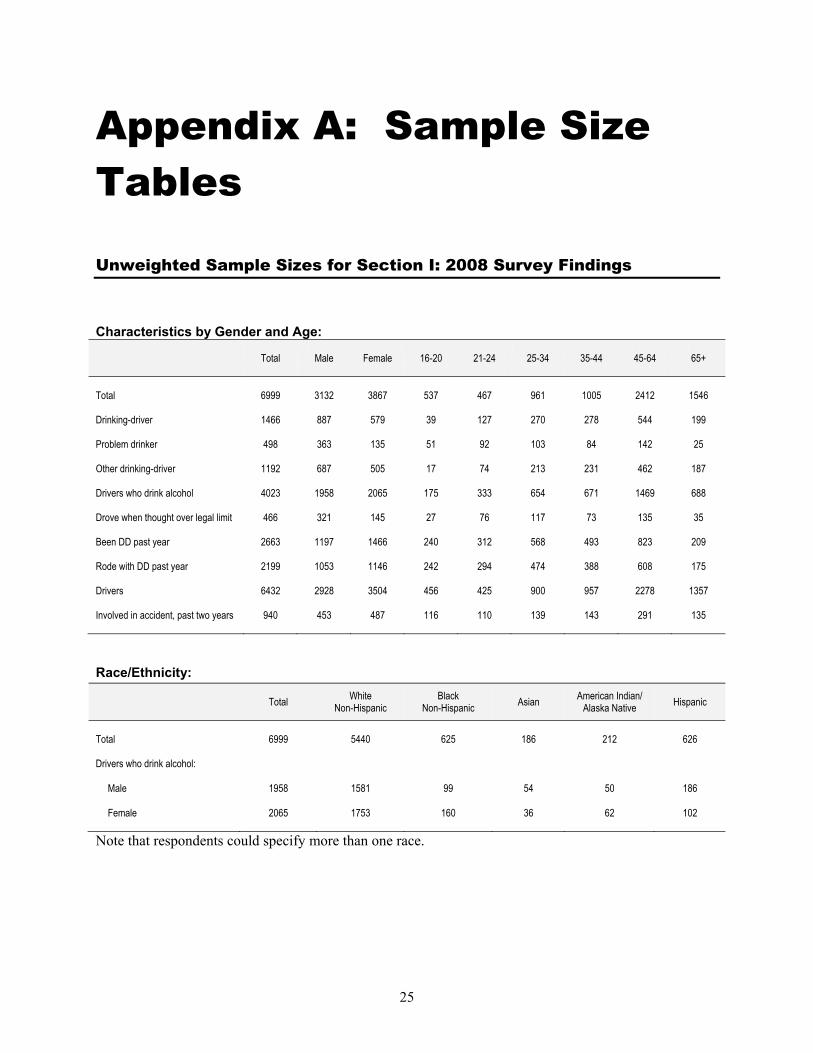
Appendix A: Sample Size Tables Unweighted Sample Sizes for Section I: 2008 Survey Findings Characteristics by Gender and Age:
Total Male Female 16-20 21-24 25-34 35-44 45-64 65+
Total 6999 3132 3867 537 467 961 1005 2412 1546 Drinking-driver 1466 887 579 39 127 270 278 544 199 Problem drinker 498 363 135 51 92 103 84 142 25 Other drinking-driver 1192 687 505 17 74 213 231 462 187 Drivers who drink alcohol 4023 1958 2065 175 333 654 671 1469 688 Drove when thought over legal limit 466 321 145 27 76 117 73 135 35 Been DD past year 2663 1197 1466 240 312 568 493 823 209 Rode with DD past year 2199 1053 1146 242 294 474 388 608 175 Drivers 6432 2928 3504 456 425 900 957 2278 1357 Involved in accident, past two years
940
453
487
116
110
139
143
291
135
Race/Ethnicity:
Note that respondents could specify more than one race.
Total White
Non-Hispanic Black
Non-Hispanic Asian American Indian/ Alaska Native Hispanic
Total 6999 5440 625 186 212 626 Drivers who drink alcohol: Male 1958 1581 99 54 50 186 Female
2065
1753
160
36
62
102

26
Unweighted Sample Sizes for Section II: Trends, 1993-2008
TOTAL
Gender Age Drinking-
drivers Other
drivers who drink
Total drivers
who drink Total
Male
Female
16-20 21-24 25-34 35-44 45-64 65+
1993 4010 1969 2041 617 474 1082 679 738 420 1116 1421 2537
1995 4008 1982 2026 946 212 693 709 911 537 823 1264 2087
1997 4010 1734 2276 282 225 778 895 1159 619 964 1487 2451
1999 5127 2205 2922 318 323 930 1077 1601 863 1155 1875 3030
2001 6002 2607 3395 901 324 1018 1087 1728 944 1300 2188 3488
2004 6049 2592 3457 890 237 829 991 1879 1166 1162 2275 3437
2008 6999 3132 3867 537 467 961 1005 2412 1548 1466 2548 4014
TOTAL: Drank Alcohol Past Year
Gender Age Drinking-
drivers Other
drivers who drink
Total drivers
who drink Total
Male
Female
16-20 21-24 25-34 35-44 45-64 65+
1993 2670 1423 1247 331 367 829 495 455 193 1112 1421 2361
1995 2237 1231 1006 402 153 493 447 529 213 823 1264 2087
1997 2590 1261 1329 149 179 590 643 727 276 964 1487 2451
1999 3156 1501 1655 156 251 662 740 972 366 1155 1875 3030
2001 3634 1742 1892 416 249 774 756 1014 425 1300 2188 3488
2004 3575 1655 1920 376 170 581 677 1220 520 1162 2275 3437
2008 4235 2057 2178 198 356 687 691 1535 730 1466 2548 4014
TOTAL: Drove Within Two Hours of Drinking, Past Year
Gender Age
Total
Male
Female
16-20 21-24 25-34 35-44 45-64 65+
1993 1116 774 342 83 162 397 221 185 68
1995 823 577 246 87 72 208 189 211 56
1997 964 651 313 34 71 252 252 269 79
1999 1155 737 418 33 118 263 318 330 90
2001 1300 823 477 80 99 296 305 395 125
2004 1162 736 426 62 59 210 256 439 128
2008 1466 887 579 39 127 270 278 544 199


DOT HS 811 342August 2010


