NATIONAL ELECTRICITY TARIFF STUDY Final Report November 2001 Prepared for: Prepared by: ELECTRICITY CONTROL BOARD P O Box 2923 Windhoek NAMIBIA Tel +264 (0)61 231 666 Fax +264 (0)61 231 993 in co-operation with: SAD-ELEC (Pty) Ltd and the ECON Centre for Economic Analysis P O Box 1900 Windhoek NAMIBIA Tel +264 (0)61 224 725 Fax +264 (0)61 233 207 email [email protected]
Transcript
NATIONAL ELECTRICITY TARIFF STUDY
Final Report
November 2001
Prepared for:
Prepared by:
ELECTRICITY CONTROL BOARD P O Box 2923 Windhoek NAMIBIA Tel +264 (0)61 231 666 Fax +264 (0)61 231 993
in co-operation with: SAD-ELEC (Pty) Ltd and the ECON Centre for Economic Analysis P O Box 1900 Windhoek NAMIBIA Tel +264 (0)61 224 725 Fax +264 (0)61 233 207 email [email protected]
ELECTRICITY CONTROL BOARD NATIONAL ELECTRICITY TARIFF STUDY - FINAL REPORT
Table of Contents - Page II
EMCON – SAD-ELEC – ECON
Table of Contents
GLOSSARY .................................................................................................... VII EXECUTIVE SUMMARY .................................................................................... I 1 INTRODUCTION .........................................................................................1 1.1 Background ............................................................................... 1 1.2 ECB Consultant team................................................................ 2 1.3 Study methodology.................................................................... 2 SECTION A: EXISTING TARIFFS & NAMPOWER TARIFF PROPOSALS .....3 2 ANALYSIS OF EXISTING DISTRIBUTION TARIFFS.................................4 2.1 Distribution tariff data collection and analysis............................ 4
2.1.1 Tariff structures............................................................... 5 2.1.2 Tariff determination methodologies................................. 6 2.1.3 Sundry tariffs and levies.................................................. 8 2.1.4 Tariff analysis for domestic, business & LPU�s ............... 9
11.6 Treatment of cross-subsidies ................................................ 108 11.6.1 Cross-subsidies between customer categories........... 108 11.6.2 Cross-subsidisation of other municipal services ......... 109
16.3 Walvis Bay information.......................................................... 139 16.3.1 Customer details......................................................... 139
ELECTRICITY CONTROL BOARD NATIONAL ELECTRICITY TARIFF STUDY - FINAL REPORT
Table of Contents - Page VI
EMCON – SAD-ELEC – ECON
16.3.2 Asset valuation ........................................................... 140 16.3.3 Losses, arrears and theft ............................................ 141 16.3.4 Maximum charge ........................................................ 141
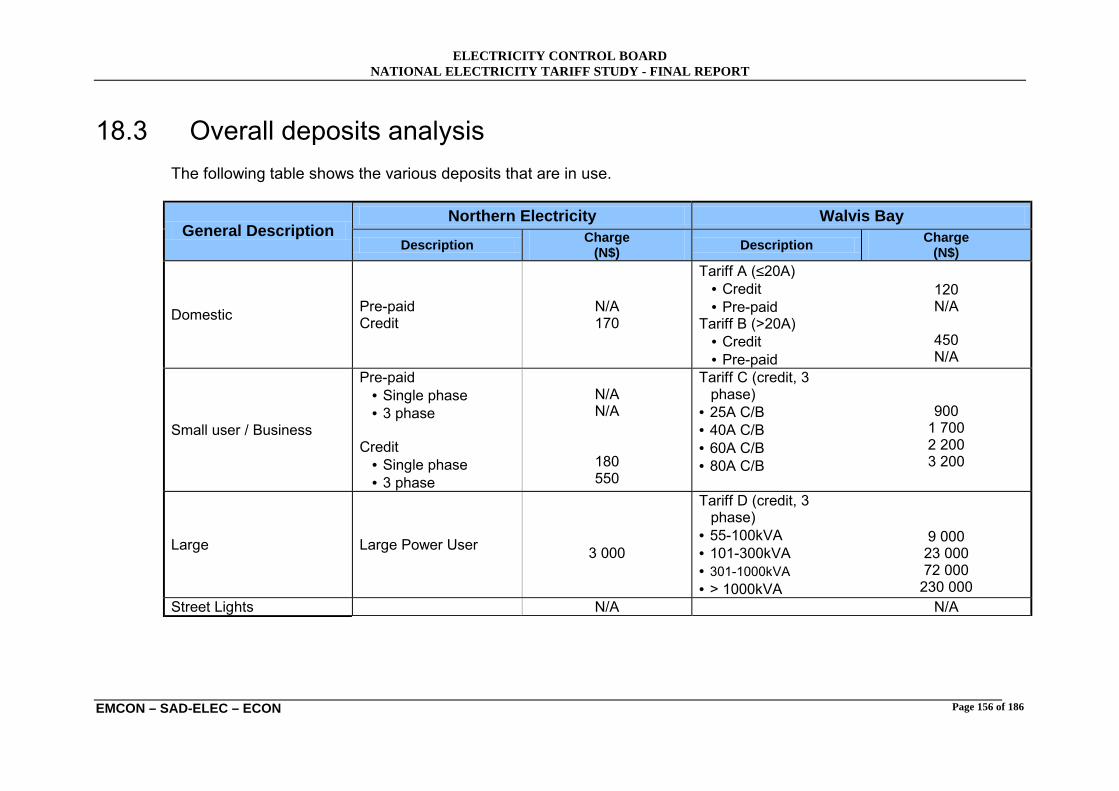
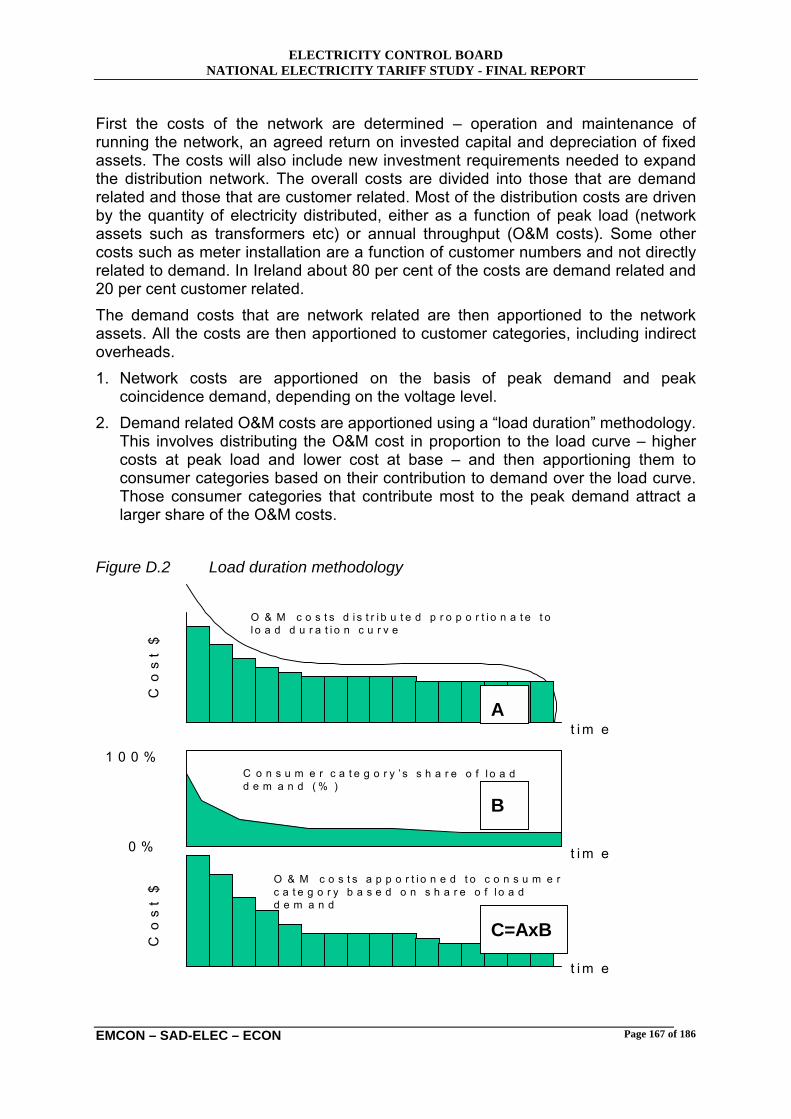
17 DISTRIBUTION TARIFF ANALYSIS: TARIFFS .....................................142 17.1 NamPower tariffs................................................................... 143 17.2 Northern Electricity tariffs ...................................................... 145 17.3 Walvis Bay tariffs................................................................... 146 17.4 Observations ......................................................................... 147 17.5 Recommendations and conclusions...................................... 152 18 DISTRIBUTION TARIFF ANALYSIS: OTHER CHARGES .....................153 18.1 Service fees/charges............................................................. 154 18.2 Connection fees analysis....................................................... 155 18.3 Overall deposits analysis....................................................... 156 APPENDIX A – TERMS OF REFERENCE....................................................157 APPENDIX B –STUDY PHASE ACTIVITIES ................................................160 B.1 Phase 0 ................................................................................... 160 B.2 Phase I .................................................................................... 161 B.3 Phase II ................................................................................... 162 APPENDIX C - STRUCTURE OF THE TARIFF DATABASE .......................164 APPENDIX D - DUOS CHARGES IN IRELAND ...........................................166 APPENDIX E - COINCIDENCE FACTOR .....................................................170 APPENDIX F – DATA REQUIREMENTS FOR THE DISTRIBUTION TARIFF METHODOLOGY ..........................................................................................171 APPENDIX G – TECHNICAL ANNEX: DISTRIBUTION TARIFF METHODOLOGY ..........................................................................................172 G.1 Step 1: Determine cost structure and revenue requirement.... 172 G.2 Step 2: Allocate the costs to customer categories .................. 173 G.3 Step 3: Determine the tariff fees ............................................. 175 G.4 Step 4: Adjust for cross-subsidies........................................... 177 APPENDIX H – WORKSHOP & STAKEHOLDER COMMENTS ..................179
ELECTRICITY CONTROL BOARD NATIONAL ELECTRICITY TARIFF STUDY - FINAL REPORT
Table of Contents - Page VII
EMCON – SAD-ELEC – ECON
Glossary CAPM � capital asset pricing model CB � circuit breaker DUOS � distribution use-of-system ECB � Electricity Control Board of Namibia NCPD � Non-coincidence peak demand LPU � large power user O&M � operation and maintenance POD � point of delivery P-t-P � Point-to-point ROR � rate of return SB � Single Buyer SP � single phase TP � three phase TUOS � transmission use-of-system WACC �weighted average cost of capital
ELECTRICITY CONTROL BOARD NATIONAL ELECTRICITY TARIFF STUDY - FINAL REPORT
Executive Summary - Page i
EMCON – SAD-ELEC – ECON
Executive Summary
Abstract The Electricity Control Board of Namibia wishes to introduce a standardised system of pricing for electricity distributors in Namibia. In this Report we present a review of existing electricity tariffs in Namibia, and develop a tariff methodology based on the principle of cost-reflective pricing.
Background According to the Electricity Act (2000), the Electricity Control Board (ECB) of Namibia is tasked with implementing Government�s policy for the electricity supply industry (ESI), as set out in the White Paper on Energy Policy (1998). An important element of Government�s policy relates to electricity pricing reform. Government�s stated objectives are that electricity tariffs in Namibia should:
• be based on sound economic principles;
• be cost reflective as far as possible;
• reflect long-run marginal cost of supply; and
• give all current ESI participants and potential participants a level playing field. To support the creation of an electricity market in Namibia, in line with Cabinet�s November 2000 decisions on ESI reform, the ECB commissioned a �National Electricity Tariff Study� for Namibia in March 2001. The overall objective of the study has been to �develop a transparent & cost-reflective electricity tariff methodology� for Namibia, with a particular focus on harmonisation of end-user electricity tariffs charged by distributors in the various parts of Namibia.
ELECTRICITY CONTROL BOARD NATIONAL ELECTRICITY TARIFF STUDY - FINAL REPORT
Executive Summary - Page ii
EMCON – SAD-ELEC – ECON
After a tendering process, a consortium of local and international Consultants was selected to undertake the Study, under the overall leadership of the ECB. The consortium has been led by EMCON Consulting Engineers of Windhoek, other consortium members being SAD-ELEC of South Africa and Econ Centre of Economic Analysis of Norway.
The Study was carried out in two phases, with extensive consultation with stakeholders being undertaken during both phases:
Phase 1 was completed by the end of June 2001, and contained a comprehensive mapping of electricity prices and tariffs in existence in Namibia at this stage, also including a review of various proposals made by NamPower for future generation and transmission tariffs, as well as NamPower�s use of extension charges.
Phase 2 of the study focused on analysis of distribution cost of supply principles, and included the development of tariff principles, pricing methodology and proposed tariff structures for retail supply. Phase 2 also included an updated analysis of bulk supply tariffs for generation and transmission, as well as sample cost of supply studies for selected distributors.
As the Tariff Study was commissioned by the ECB, it should be noted that none of the direct and indirect electricity supply industry (ESI) stakeholders, including NamPower, has seen this Final Report before official submission on 22 November 2001. Hence, stakeholders have not been in a position to express support for or reject the recommendations made by the Study. However, NamPower has documented their concerns over some proposals, notably the proposed generation pricing principles and methodology.
The recommendations in the Report reflect solely the views of the ECB Consultants, and are as such not to be interpreted as policies or decisions by the ECB. The ECB is conscious of the various divergent requirements the stakeholders have, and will therefore continue with a consultative process once the Final Report has been released. This consultation process will be to the benefit of all participants in the Namibian ESI.
The active support to the tariff study process by all stakeholders, leading to the formulations of the recommendation in the Report, is herewith acknowledged.
Review of Existing Distribution Pricing Practises Key areas covered in Phase I of the Study included:
• a compilation and analysis of distribution tariffs currently in use in Namibia,
• the population of a tariff database, and
ELECTRICITY CONTROL BOARD NATIONAL ELECTRICITY TARIFF STUDY - FINAL REPORT
Executive Summary - Page iii
EMCON – SAD-ELEC – ECON
• a review of NamPower�s proposed tariff methodology and extension charges.
The Study Team obtained tariff information from most Namibian electricity supply authorities and mines after a request for information letter was issued, and personal discussions were held.
An analysis of the national tariff structures revealed the following:
• a wide variety of individual tariffs and tariff posts are used,
• few supply authorities use documented and coherent methodologies to determine individual tariffs,
• tariff structures often do not reflect newer supply and demand conditions, and are apparently seldom changed,
• a multitude of electricity service-related tariffs and levies are in use,
• there are only few supply authorities that have special tariffs to accommodate the urban and rural poor,
• most supply authorities have a monthly fixed / service charge in use, as well as a maximum demand / capacity charge and energy charge,
• only limited tariff segregation is applied, e.g. no standard, peak, off-peak or time-of-use rates are used, and no seasonal rates are available,
• pre-payment tariffs, if applied, seem to be guided by the local supply authority�s understanding of the customer�s willingness to pay, and are often not obviously correlated to the actual cost of supply,
• customers will in general not be able to distinguish between costs incurred due to the particular supply authority�s tariff setting approach, and the real cost of supply,
• there is no residential geyser control (except central ripple control in a few instances) and/or geyser saving tariffs in place,
• few supply authorities have internal consumption tariffs, which makes the control of losses difficult,
• the sale of electricity is one of the few profitable undertakings of local supply authorities, and is often used to cross-subsidise other essential local authority services.
Using the 2000/2001 electricity tariffs, the following comparisons were made for various types of Namibian distributors:
• A small domestic household with an installed circuit breaker of 15 amp and a monthly consumption of 100 kWh;
• A large domestic consumer with a 60 amp circuit breaker and a consumption of 600 kWh per month;
ELECTRICITY CONTROL BOARD NATIONAL ELECTRICITY TARIFF STUDY - FINAL REPORT
Executive Summary - Page iv
EMCON – SAD-ELEC – ECON
• A small domestic consumption of 100 kWh/month via a pre-payment meter;
• A large domestic consumption of 600 kWh/month via a pre-payment meter;
• Business and light industrial tariffs at a three-phase connection of 3 x 30 amp using an average 2,000 kWh/month; and
• A large power user with 50 kVA maximum demand and a monthly use of 3,000 kWh.
A tariff database of distribution tariffs was compiled comprising the years 1996/1997 to 2000/2001, which enables the rapid analysis by the ECB of additional parameters and charges, and an easy extension as additional information becomes available.
Proposed Distribution Pricing Methodology The ECB wishes to regulate distributors� tariffs for a variety of reasons � to control distributors� income; to improve price signals; and to promote uniform standards in pricing across the ESI. To date there have been no common guidelines or regulations in Namibia to achieve these objectives.
This Tariff Study recommends that an electricity distributor in Namibia be regulated based on its revenue requirement, including a return on assets used for electricity distribution and supply. The revenue requirement will be set on an annual basis by the ECB and will determine the overall level of tariffs. A specific methodology is recommended for determining the revenue requirement of the distributor.
Having established the revenue requirement and hence the price level, the Study makes recommendations on tariff structures to be applied by licensed distributors. These are to be viewed as guidelines, thereby allowing for necessary local adaptation of such structures to meet specific needs and requirements.
Principle Recommendations The two principle aspects to tariff regulation of distribution companies are:
• Control of income, i.e. determination of the allowed revenue that the distributor can earn, and
• Control of tariff structure, i.e. the determination of a tariff schedule to raise this allowable revenue.
It is recommended that the ECB regulates the former, and issue non-mandatory guidelines for the latter.
Pricing Principles The key principles underlying the approach recommended here are:
ELECTRICITY CONTROL BOARD NATIONAL ELECTRICITY TARIFF STUDY - FINAL REPORT
Executive Summary - Page v
EMCON – SAD-ELEC – ECON
• The level of tariffs should be cost reflective, that is, tariffs should generate revenue equal to the costs of the business;
• Where possible, the structure of tariffs should be cost reflective, that is, costs should be allocated to customer groups and expressed as charges based on the underlying cost drivers;
• Where there are no clear cost drivers, costs should be apportioned on the basis of customer numbers or energy consumption, and should be expressed either as a monthly fee or as an energy charge; and
• Cross-subsidies should be targeted as closely as possible through the creation of a special subsidised tariff category, and other customers should carry the costs of this cross-subsidy as a c/kWh charge.
Determining the Revenue Requirement To determine the revenue requirements of a distributor, the cost structure of the distributor must first be determined. The scope of costs should include:
• Power supply costs, generally including the costs of production of electricity and transmission over power lines to load centres;
• Distribution costs, generally including network asset and capital related costs;
• Operation and maintenance costs associated with distribution;
• Distribution losses;
• Overheads attributed to distribution; and
• Customer services, including marketing, billing, other customer services and overheads attributed to retail.
There are various types of non-payment costs that distributors face. These include the cost of arrears (should be reflected in a return on working capital), electricity theft (treated as with technical losses), and bad debts (a separate cost item).
Asset-related costs (depreciation plus return) generally constitute the majority of distribution costs (other than bulk power supply costs). There are various alternative approaches to asset valuation, and it is recommended that a simplified version of the replacement cost approach should be adopted, with the ECB issuing standardised asset price schedules. In calculating the return on the asset base, a real rate of return based on the cost of capital should be applied.
A significant portion of certain distributors� assets may be subsidised by donors/Government, or paid for directly by customers through connection fees. We recommend that depreciation of these assets be included in the revenue
ELECTRICITY CONTROL BOARD NATIONAL ELECTRICITY TARIFF STUDY - FINAL REPORT
Executive Summary - Page vi
EMCON – SAD-ELEC – ECON
requirement, but that the calculation of the allowed return on capital excludes these assets.
There is inevitably a degree of lag in determining the revenue requirement. Accounts are usually only available for two years preceding the year for which prices are being determined. Consequently, the revenue requirement should include an allowance for investments made in year n-2 that were not incorporated in the allowed revenue for year n-1.
No matter how carefully tariffs are set, revenue will never exactly match the allowed revenue due to uncertainty in demand. Consequently, there is a need to adjust the revenue requirement to accommodate a reconciliation amount arising from the previous year.
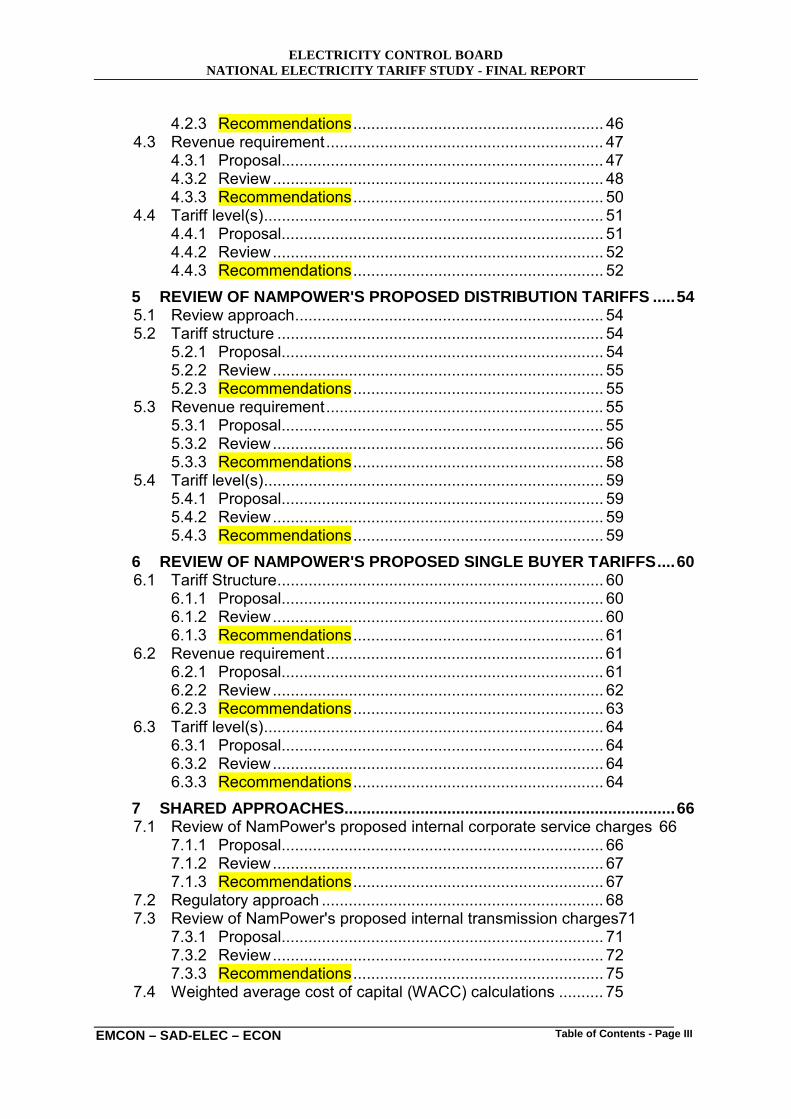
Determining tariff structures There are three steps in the recommended method for determining tariff structures.
• Firstly, the revenue requirement (i.e. costs) must be allocated to customer categories;
• Secondly, the costs thus allocated must be converted into tariffs; and
• Thirdly, any required cross-subsidies must be factored into the tariffs.
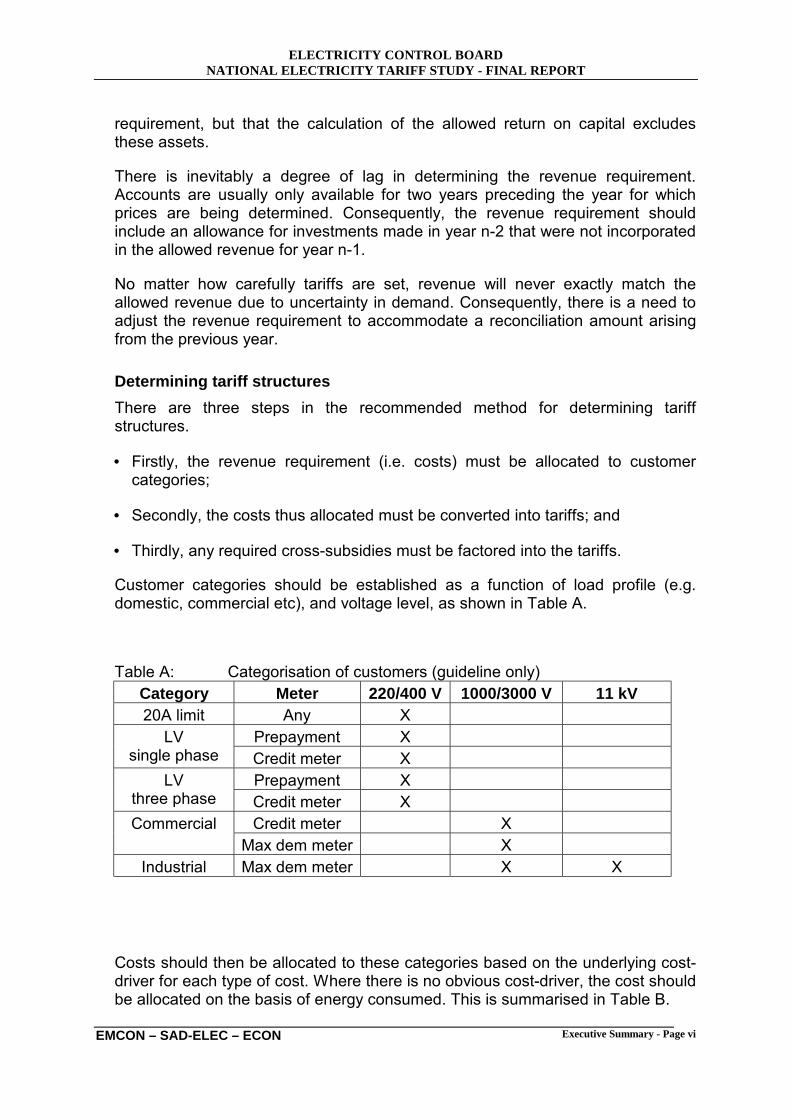
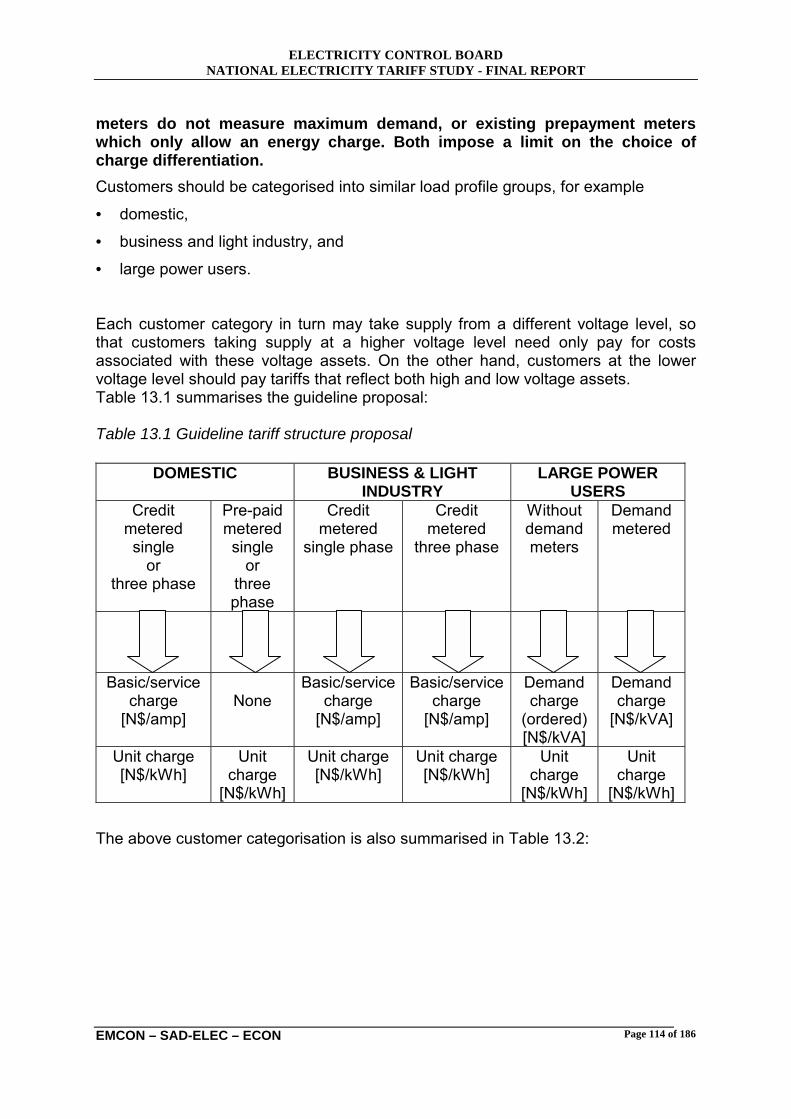
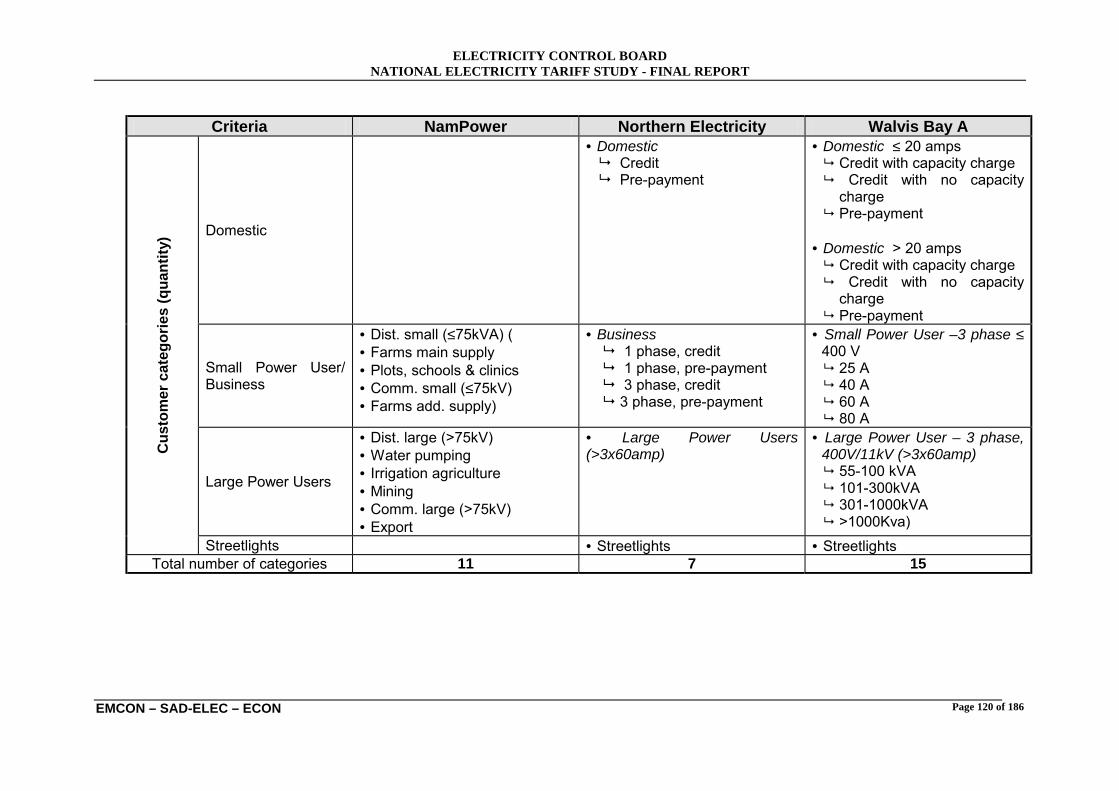
Customer categories should be established as a function of load profile (e.g. domestic, commercial etc), and voltage level, as shown in Table A.
Table A: Categorisation of customers (guideline only) Category Meter 220/400 V 1000/3000 V 11 kV 20A limit Any X
Prepayment X LV single phase Credit meter X
Prepayment X LV three phase Credit meter X
Credit meter X Commercial Max dem meter X
Industrial Max dem meter X X
Costs should then be allocated to these categories based on the underlying cost-driver for each type of cost. Where there is no obvious cost-driver, the cost should be allocated on the basis of energy consumed. This is summarised in Table B.
ELECTRICITY CONTROL BOARD NATIONAL ELECTRICITY TARIFF STUDY - FINAL REPORT
Executive Summary - Page vii
EMCON – SAD-ELEC – ECON
Table B: Cost elements, cost-drivers and allocation parameter Cost element Cost driver Allocation parameter Power supply costs: maximum demand charge
Peak demand on network
Peak-coincident maximum demand of customer category
Power supply costs: energy charge
Energy consumption
Energy consumption of customer category
Distribution losses Energy consumption
Energy consumption of customer category
Network assets: depreciation and return
Peak demand on network
Peak-coincident maximum demand of customer category
Working capital Mostly due to arrears
Average arrears of customer category
Bad-debts No obvious cost driver
Energy consumption of customer category
O&M costs No obvious cost driver
Energy consumption of customer category
Customer services Number of customers
Number of customers
Overhead costs No obvious cost driver
Number of customers
Once the costs have been allocated, these should be expressed as a tariff. There are three types of tariff fees dealt with in this methodology:
• Fixed monthly charges;
• Maximum demand charges; and
• Energy charges.
Table C summarises the recommended approach for each cost element, and notes different approaches based on meter limitations.
ELECTRICITY CONTROL BOARD NATIONAL ELECTRICITY TARIFF STUDY - FINAL REPORT
Executive Summary - Page viii
EMCON – SAD-ELEC – ECON
Table C: Cost elements and tariff charges Tariff form Cost element Customers with
max. demand meter Customers without max. demand meter
Power supply costs: maximum demand charge
N$/kW or N$/kVA c/kWh
Power supply costs: energy charge c/kWh c/kWh
Distribution losses c/kWh c/kWh
Network assets: depreciation and return N$/kW or N$/kVA c/kWh
Working capital c/kWh c/kWh
Bad-debts c/kWh c/kWh
O&M costs c/kWh c/kWh
Customer services N$/month N$/month (or c/kWh
for prepayment meters)
Overhead costs N$/month N$/month (or c/kWh
for prepayment meters)
Cross-subsidies between customers should be limited to one customer category. We recommend that a special customer category be defined for this purpose, and supplied through a current-limited meter and charged through a simple energy tariff. The tariff level for this customer category should be set either by the ECB or the relevant local authority in the distributor�s area.
The cost of the cross-subsidy can be calculated as the difference in expected revenue from the unsubsidised tariff and the subsidised tariff. This cost should then be borne by other tariff categories in proportion to their energy consumption and expressed as a c/kWh charge.
Many municipalities in Namibia use electricity tariffs to raise revenue for other municipal services. We recommend that this implicit tax on electricity be expressed as a separate charge on top of tariffs and regulated not by the ECB but the Minister of Finance or Minister of Regional, Local Government and Housing.
ELECTRICITY CONTROL BOARD NATIONAL ELECTRICITY TARIFF STUDY - FINAL REPORT
Executive Summary - Page ix
EMCON – SAD-ELEC – ECON
Review of NamPower’s Tariff Proposals Generation Electricity regulators around the world face a tough challenge to balance the interest of various stakeholders when they determine price levels for their respective monopoly industries. Generally, customers� harbour expectations of low prices while investors seek a high return on their investments. Various regulatory methods have been developed to assist regulators in managing these conflicting objectives.
The introduction of competition in the generation sector holds the promise that the regulator will be relieved from regulating generators� prices. Rather, it is hoped that an efficient competitive market will determine prices through market principles reflecting supply and demand balances.
However, it is the ECB Consultants� view that effective competition in the Namibian generation sector is at least six to eight years away. Hence, it is recommended that the ECB should consider and adopt regulatory practices that are in line with a monopoly generation sector. There are essentially two widely used cost based methodologies in use to regulate the industry, they are:
• Rate of Return regulation (e.g. Return on Asset), and
• Price Cap or Incentive Regulation (e.g. CPI � X).
Given the early stages of regulatory developments in Namibia we suggest that the ECB should consider the Rate of Return regulation method for generation. The proposed methodology will allow NamPower generators to recover all their costs and make a fair return on its investment.
The scope of generation costs should include:
• Primary energy costs;
• Operation and maintenance costs associated with generation;
• Overheads attributed to generation;
• Use of transmission network costs;
• Depreciation; and
• Return component.
We suggest that the depreciation rate be based on the historic cost asset values, and that the return on NamPower�s generators should be based on the historic
ELECTRICITY CONTROL BOARD NATIONAL ELECTRICITY TARIFF STUDY - FINAL REPORT
Executive Summary - Page x
EMCON – SAD-ELEC – ECON
rather the replacement net book value of the assets. This approach will ensure that NamPower will make a fair return on the investment it has made in its generators. However, industry experts are in agreement that this approach will lead to a large increase in prices when new assets are introduced. The ECB Consultants have recognised this shortcoming and have recommended that prices to consumers will have to be adjusted through a transition period to reflect the higher cost of new capacity in a competitive industry ultimately.
NamPower has proposed an avoided cost approach (sometimes referred to as opportunity cost) to determine the value, and hence price of its generators. The method does not consider the cost of NamPower�s own generators to determine the regulated tariff but rather the costs of other (outside the borders of Namibia) generators. This method, if adopted, will put intense pressure on present prices in Namibia while there is excess capacity in the region. Eskom in South Africa has recently announced that it foresees significant increases in its tariffs, which will result in higher prices if the avoided cost method is adopted.
NamPower�s proposed methodology would be useful to determine the value of NamPower�s generators in a competitive market where customers will have the freedom to buy from any supplier in or outside Namibia, provided that there is sufficient competition between the generators and not merely a selection between monopoly utilities, which is the current Southern African Power Pool arrangement.
ECB Tariff study : Phase 2 ECB / emCON / SAD-ELEC
Comparison of different Generation Price Levels(Prices marked * includes NamPower transmission charges)
0
5
10
15
20
25
Esk om G xM a rgina l
Esk om G xA ve ra ge
Im ports * Historic C ost * A voide d cost * Ne wG e ne rator cost
*
Av
era
ge
Ra
te (
c/k
Wh
) fo
r 2
00
2
ELECTRICITY CONTROL BOARD NATIONAL ELECTRICITY TARIFF STUDY - FINAL REPORT
Executive Summary - Page xi
EMCON – SAD-ELEC – ECON
Namibia will soon introduce a Single Buyer (SB) phase as the first step towards a more competitive market. The SB will provide Namibia with greater flexibility to introduce new entrants while the industry and the region is transforming into a more competitive arrangement. In that context, the ECB Consultants recommend a move away from cost-based regulated prices to market prices over the expected six to eight year period when the existing surplus generation capacity in the southern Africa region is being eroded.
The ECB Consultants have noted NamPower�s objection to the generation tariff methodology proposed in this Study. However, we feel obliged to point out that in our view, to adopt a regulated cost based tariff methodology rather than a market-based approach at this initial stage of reform has been considered and applied by others during the SB phase. Hunt and Shuttleworth for example, in their well-respected book on �Competition and Choice in Electricity�, have noted that:
"The purchasing agency (Single Buyer) can in principle discriminate between generators; …. offering lower prices to lower cost generators, and in this way appropriate the ‘economic rents’ from low-cost sources for which customers have already paid.
For example, in a transition to competition, a regulator may face an industry where low-cost hydro resources have been regulated to provide low-cost power to consumers. A move to market prices would ensure windfall gains to the owners. The regulator can perhaps see virtue in introducing competition, but is unhappy with making some owners millionaires and bankrupting others…. It (SB) could provide existing power at some average of the high and low costs, while purchasing new power at market prices."
The Consultants encourage the ECB to continue with engagements and dialogue to find a balance between the needs of the different stakeholders.
It is recommended that the trading arrangements between the generators and the SB be based on cost reflective tariff structures and levels and should include:
• An availability charge (N$/available MW/week) to cover the generator�s fixed cost. The structure could be enhanced to incentivise the plant personnel to make the plant available when it is needed most.
• An energy charge to cover the generator�s primary energy cost and variable operation and maintenance cost if it is called on to generate. We recommend a simple flat rate structure unless there are large cost differences, which could cause generators dispatch distortions.
• Separate ancillary charges for those services that cause an additional cost when called upon.
ELECTRICITY CONTROL BOARD NATIONAL ELECTRICITY TARIFF STUDY - FINAL REPORT
Executive Summary - Page xii
EMCON – SAD-ELEC – ECON
NamPower has recommended a flat fixed rate for capacity payments. They have also proposed several energy rates for different output levels from the Ruacana power station. In addition they have recommended the introduction of several sets of ancillary services.
Some of these services have been priced in Namibian Dollars and some in US Dollars. Although we foresee the eventual unbundling of ancillary services to participate in the competitive market we would recommend that at the start of the SB phase to unbundled only those services that cause significant additional costs when called upon. However, we do recognise that ancillary service payments can be a powerful motivator and have suggested some ancillary service payments under certain conditions.
Transmission A review of NamPower�s proposed transmission tariffs has shown that there is general agreement on the use of a Rate of Return regulation methodology to determine transmission�s revenue requirement. The ECB Consultants also support the inclusion of the following revenue requirement components:
• Operation and maintenance costs associated with transmission;
• Transmission losses;
• Overheads attributed to transmission;
• Depreciation; and
• Return component.
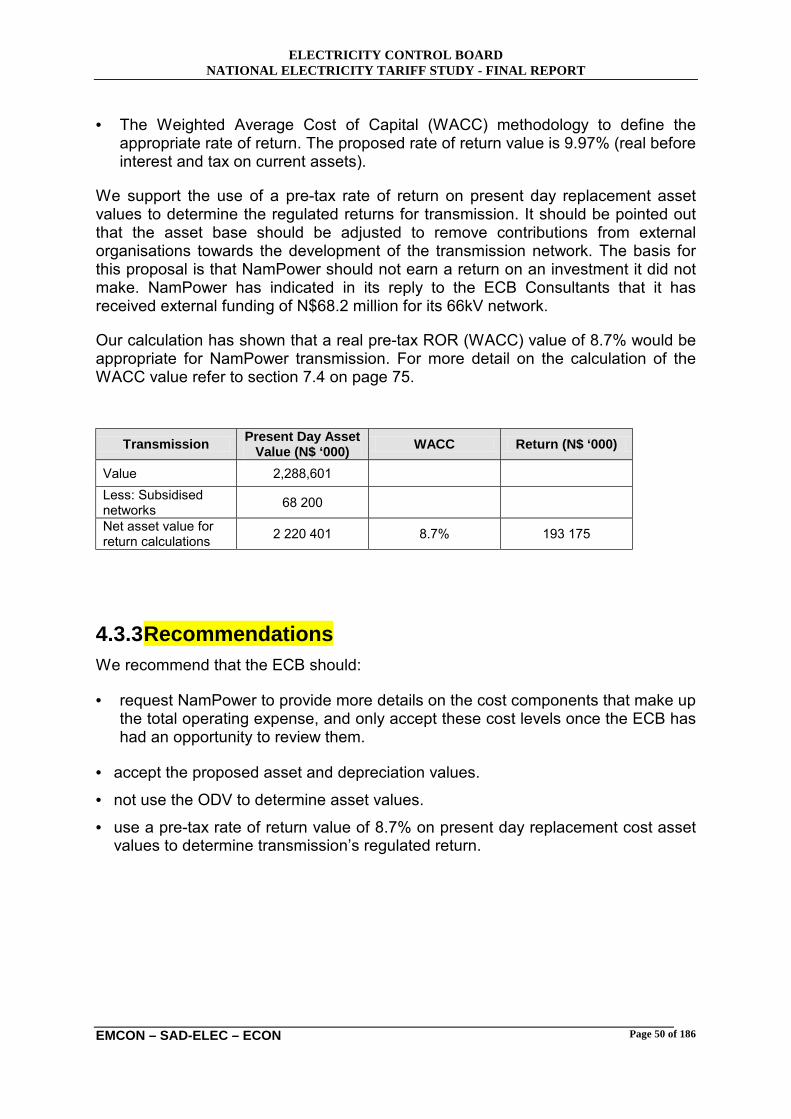
Transmission will remain a monopoly function of the industry and we therefore recommend that the level of depreciation be based on replacement assets. We furthermore recommend that the regulated return be calculated on the net book value of replacement assets excluding any subsidised assets. Our understanding is that NamPower�s proposal supports these principles. The large difference in revenue requirement proposed by NamPower and what the Consultant�s have calculated can mainly be attributed to the subsidised asset portion, which have been excluded from our return calculations.
NamPower has recommended that an optimised asset valuation process be used to determine transmission�s asset value. This methodology excludes any inefficient (or unproductive) transmission assets from the asset base. However, our experience with optimised asset value calculations has been that it is a subjective process susceptible to a variety of assumptions. The process is also quite complex and requires a substantial amount of network modelling. NamPower�s own calculations have not revealed any unproductive assets, and the value of the more complex optimised asset methodology can therefore be
ELECTRICITY CONTROL BOARD NATIONAL ELECTRICITY TARIFF STUDY - FINAL REPORT
Executive Summary - Page xiii
EMCON – SAD-ELEC – ECON
debated. We would not recommend its implementation at this stage of regulatory developments.
NamPower has suggested charging customers for the use of the network using a combination of demand (N$/kVA) and energy (c/kWh) charges. The Consultants� recommendation is to use the tariff structure closest to the cost drivers of the industry. In the case of transmission customers, it is believed that the more appropriate cost driver is kVA, and in the case of generators it is installed capacity (MW). An energy charge, unless it is intended to recover transmission line losses, would encourage the wrong energy consumption behaviour and could result in a distortion of investment decisions.
The ECB consultants have noted NamPower�s concern of the impact of a high demand charge on consumers. Our recommendations have made provision to investigate the desirability of a monthly service charge (N$/month) to reduce the level of demand charges.
Single Buyer
Although NamPower has not finalised their position with regards to the tariff structure and level of the SB, the ECB consultants have supported NamPower�s proposal that the SB�s selling price should include the following components:
• Operation and maintenance costs associated with SB;
• Overheads attributed to transmission;
• Depreciation;
• NamPower�s generation energy purchase cost including transmission wires charges;
• Imported energy purchase cost including transmission wires charges; and
• ECB charge.
We have identified at least three possible tariff structures, which the SB could choose to sell its electricity, these are:
• Flat energy charge;
• Time-of-use differentiated energy charge, or a
• Combination of demand and energy charges.
Our recommendation, to use a combination of demand and energy charges, is based on the fact that it will promote the efficient use of electricity (the time-of-use energy rates could also achieve this) and reduce the financial exposure of the SB.
ELECTRICITY CONTROL BOARD NATIONAL ELECTRICITY TARIFF STUDY - FINAL REPORT
Executive Summary - Page xiv
EMCON – SAD-ELEC – ECON
We do recognise that these proposals will be subject to more debate over the following months as part of the ECB�s project to develop and establish the SB in Namibia.
Shared Approaches
The Report includes a section that deals with those tariff related issues, which are common to the proposals of the respective groups. These include comments and views on:
Allocation of internal transmission charges
In principle we support NamPower�s suggestion to split the charges for the backbone transmission network cost between the producers and consumers. However, we recommend that the producers� share be allocated between the different stations and the import function based on installed capacity, rather than on energy send out.
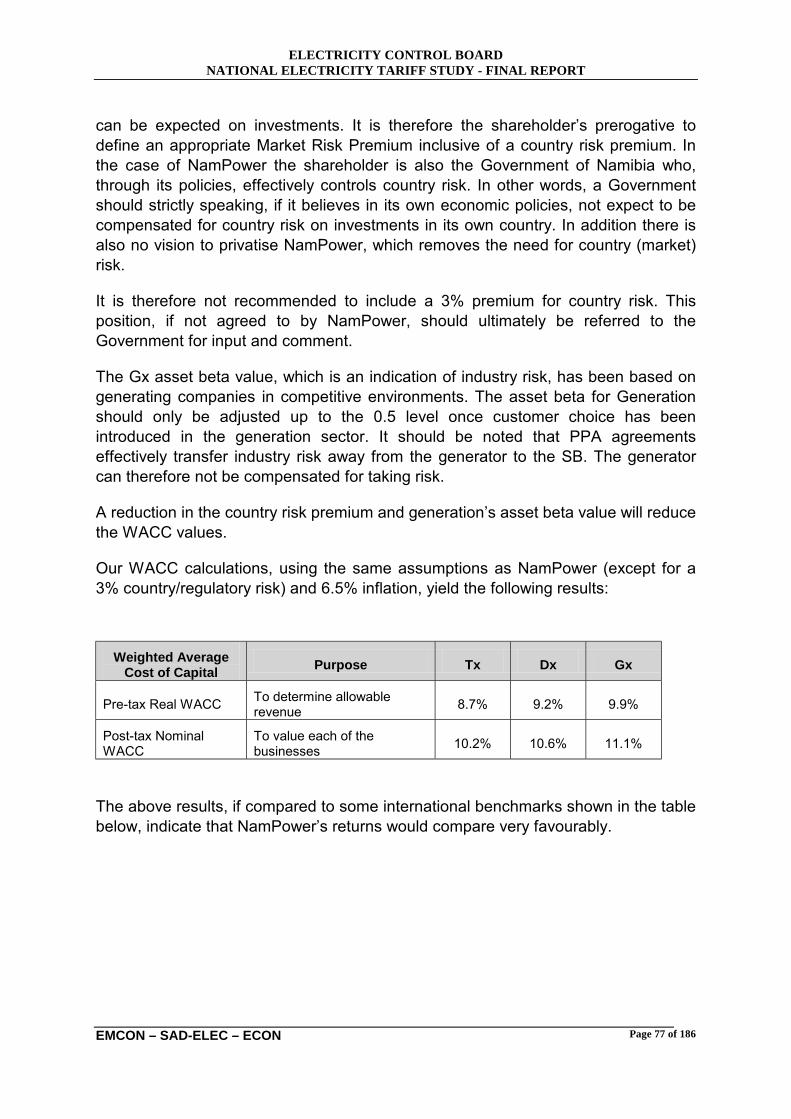
WACC calculations
NamPower has proposed that the Rate of Return values be based on a Weighted Average Cost of Capital (WACC) calculation using the Capital Asset Pricing Model to establish risk adjusted equity returns. We support the model, and its use to determine the appropriate WACC value. However, we are concerned with NamPower�s high assessment of regulatory risk (3% premium) in the Namibian market. We are not convinced that this premium is justified given that NamPower is government owned, and there is no stated intend to privatise the utility. We have excluded the risk premium from our WACC calculations; consequently our return values are slightly lower than those calculated by NamPower. We believe that our proposed WACC values, if compared to other monopoly industries, will provide NamPower with adequate guaranteed levels of return.
Overhead costs
NamPower has indicated that they are still in a process to refine the allocation of overhead costs to the different groups and power stations. A review of the proposed allocation methods could only be made once the work under development has been finalised.
NamPower’s cash reserves
NamPower currently holds short-term investments to the value of approximately N$900 million. The ECB has requested the Consultants to
ELECTRICITY CONTROL BOARD NATIONAL ELECTRICITY TARIFF STUDY - FINAL REPORT
Executive Summary - Page xv
EMCON – SAD-ELEC – ECON
express an opinion on whether this investment or the proceeds of this investment should in any way influence Namibia�s electricity prices.
It has been noted that the cash reserves were allowed to accumulate due to certain historic developments, and that the intent has always been to use the cash to invest in NamPower�s expansion programme and thereby reducing the finance costs. However, NamPower has managed to obtain lower cost financing and hence there was no need to invest the money. The future use of the money has consequently come under debate.
We have identified several potential uses of the money. Each proposal holds different potential benefits for the customers, the Government of Namibia and NamPower. Our recommendation is that the ECB should raise the issue with the Government of Namibia and initiate a discussion with the different parties. In line with corporate governance, the NamPower Board should provide the shareholder with a set of options outlining the strengths and weaknesses of each. The owner will then decide on the appropriate strategy.
Extension Charges
The ECB Consultants have also reviewed the use of existing rental charges to consumers with dedicated circuits. It was found that the present methodology includes a component for depreciation, which is already included in NamPower�s asset base. This could result in customers being over-charged. These charges have also been levied indefinitely. Again this could be seen as unfair because these assets would eventually be paid off at which point the customer should not be required to continue to pay for it.
NamPower has recognised the shortcomings of the current rental charges and have suggested the implementation of Connection Charges. Our understanding is that the charge is designed to recover the interest component of the capital expenditure NamPower had to incur to establish the infrastructure. The charge will not include a component for operation and maintenance or depreciation. This will avoid the unfair practise of double charging.
Cost of Supply Analysis
Four distributors were investigated in more detail to test the proposed distribution tariff methodology. These were: NamPower distribution, Northern Electricity, Walvis Bay and Okahandja. However, due to a lack of substantive information, it was found that a quantitative analysis of Okahandja was not possible within the scope of this Study.
ELECTRICITY CONTROL BOARD NATIONAL ELECTRICITY TARIFF STUDY - FINAL REPORT
Executive Summary - Page xvi
EMCON – SAD-ELEC – ECON
The first step in the analysis process is to define the appropriate financial, technical and customer data sets that are required. The analysis in this Report builds on the pricing methodology developed in the Distribution tariff methodology chapters, and the data sets have been designed to capture the information needed to implement this methodology.
The next step is to match the available information, which was obtained from a data survey, with what is required in the data sets. Whenever the available information was insufficient or incomplete, the distributors were contacted with specific data requests. Sometimes the information was not available, in those cases informed estimates were used to populate the data sets. The information from the various distributors allowed for the opportunity to analyse the proposed tariff structures, revenue requirements (including asset valuations) and customer details.
Once the data sets are populated, a spreadsheet model is used to apply the proposed distribution tariff methodology for each of the distributors. The tariffs calculated in this way were then compared to what the respective distributors have proposed.
Key observations from this analysis are:
• The proposed methodology, as described in the Distribution tariff methodology chapters, can be implemented and applied to calculate cost reflective distribution prices.
• The various distributors keep information in different formats. Reporting arrangements to ECB need to be standardised and information collection managed. This includes maintaining reliable asset registers that reflect replacement costs and expected asset life.
• The distributors have different customer categories, which makes regulation and comparison more complex. Both Northern Electricity�s and Walvis Bay�s customer categories were found to be well aligned with what has been proposed.
• Some distributors have expense categories, which would probably not be allowed as part of their revenue requirement calculations. Finalisation of the NamPower wholesale tariff and a standard rate of return for distributors will have to be determined before final tariff levels can be calculated.
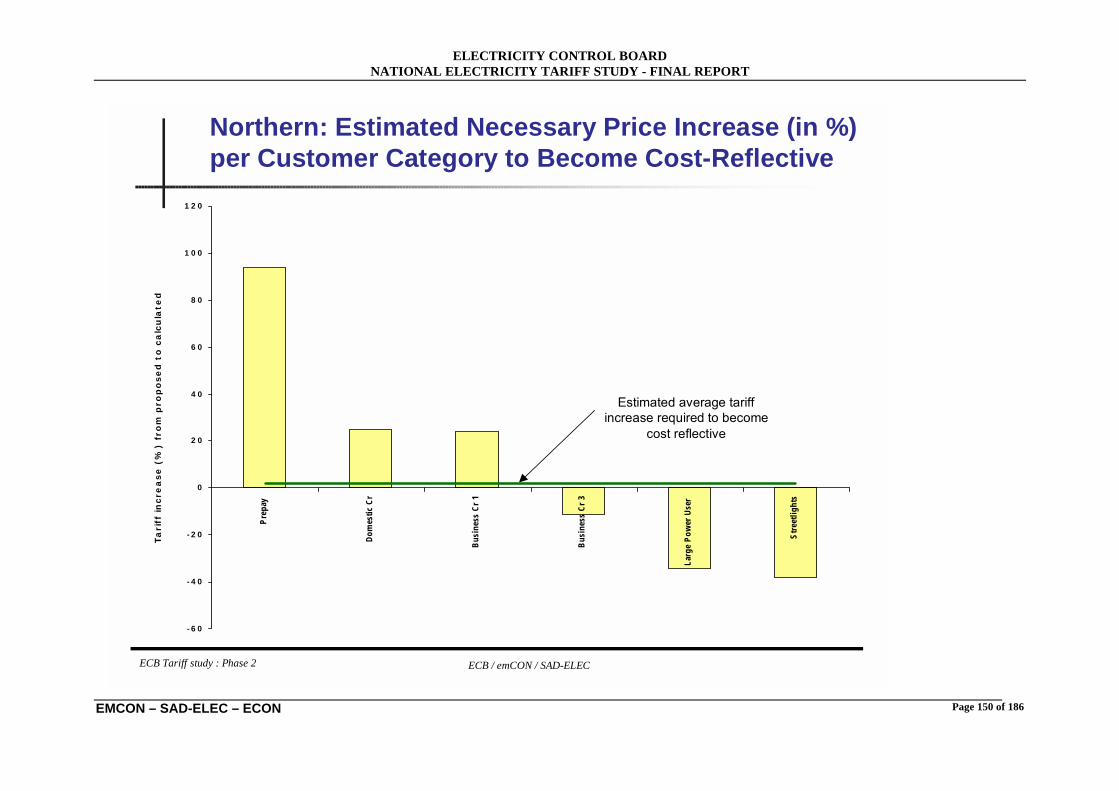
• Based on the results of the cost of supply analysis, both NamPower and Walvis Bay would require large general tariff increases (78% and 20% respectively to achieve a 6% real rate of return). However, a change in the wholesale price of NamPower can significantly change this position. Given the current assumptions, Northern requires no tariff increase to meet a 6% rate of return.
• In the case of Northern Electricity and Walvis Bay, larger customers tend to cross-subsidise smaller customers. In the case of NamPower tariffs, there appears to be no clear trend in the cross-subsidisation between the customer categories, although cross-subsidisation exists.
ELECTRICITY CONTROL BOARD NATIONAL ELECTRICITY TARIFF STUDY - FINAL REPORT
Page 1 of 186
EMCON – SAD-ELEC – ECON
1 Introduction
1.1 Background The Electricity Control Board (ECB) of Namibia has commissioned a Study into electricity pricing in Namibia, the Terms of Reference guiding the Study are found in Appendix A.
One core set of activities in this project is to analyse the current electricity tariffs, and subsequently develop a set of distribution pricing principles and methodology for the country. This Report presents a discussion and review of the current tariff regime, and develops recommendations to distribution pricing. A cost of supply analysis, using the previously developed tariff methodology, is performed using data from certain Namibian electricity distributors.
The present Study was commissioned by the ECB: this Report therefore represents the findings, recommendations and views of the ECB Consultants, and not the ECB. The Report incorporates comments received at and subsequent to the stakeholder workshop held on 14 September 2001. However, stakeholders have not yet been afforded the opportunity to comment on this Final Report, and can therefore not be expected to agree with the recommendations made therein. Discussions held with NamPower on 16 November 2001 have indicated that the corporation supports a different generation pricing methodology than is recommended by the Consultants. This issue will be addressed in the near future through constructive dialogue to formulate mutually acceptable guidelines. The ECB is conscious of the various divergent requirements of stakeholders and has given its commitment to continue the consultative process once the Final Report has been released, to the benefit of all participants of the Namibian electricity supply industry.
ELECTRICITY CONTROL BOARD NATIONAL ELECTRICITY TARIFF STUDY - FINAL REPORT
Page 2 of 186
EMCON – SAD-ELEC – ECON
1.2 ECB Consultant team The Consultant Team undertaking this Study consists of three parties, namely
• the Namibian consultancy EMCON: Ralf Tobich and Detlof von Oertzen, • the South African consultancy SAD-ELEC: Tore Horvei, Maree Roos and
Cosmas Gutu; and • the Norwegian Centre for Economic Analysis, ECON: Mark Davis, Andrew
Ellis and Eivind Magnus. EMCON Consulting Engineers acted as lead Consultant for the purposes of this Study and was responsible for the management of the project.
1.3 Study methodology
The Consultant Team followed a three-phased approach to this Study: • During Phase 0, i.e. the Inception Phase, the exact scope of work and the
Study programme was defined in consultation with the Client. • In Phase I, an analysis of existing Namibian electricity tariffs was
undertaken. The results of Phase I are summarised in the Phase I Report, dated 25 June 2001.
• In Phase II, the development of national distribution tariff principles, pricing methodologies and tariff structures is undertaken.
A detailed description of the activities carried out in the different phases is included in Appendix B.
ELECTRICITY CONTROL BOARD NATIONAL ELECTRICITY TARIFF STUDY - FINAL REPORT
ELECTRICITY CONTROL BOARD NATIONAL ELECTRICITY TARIFF STUDY - FINAL REPORT
Page 4 of 186
EMCON – SAD-ELEC – ECON
2 Analysis of Existing Distribution Tariffs
This chapter provides both a qualitative and quantitative analysis of the electricity tariff structures presently used in Namibia. Section 2.2 presents a description of the tariff database compiled during the Study.
2.1 Distribution tariff data collection and analysis The following electricity supply authorities provided (some) information about their electricity tariff structures:
ELECTRICITY CONTROL BOARD NATIONAL ELECTRICITY TARIFF STUDY - FINAL REPORT
Page 5 of 186
EMCON – SAD-ELEC – ECON
Responding mining houses were:
• Navachab
• Ongopolo
• Rössing
• NAMDEB
The following supply authorities were investigated in greater detail:
• a typical larger urban distributor (Walvis Bay),
• a typical small town distributor (Okahandja),
• a rural distributor (Northern Electricity) and
• the farming sector distributor (NamPower). The most obvious characteristics of the tariff structures received are
• the wide variety of individual tariff schedules,
• the diverse approach to the determination of tariffs, and
• the multitude of other electricity service-related tariffs and levies.
2.1.1 Tariff structures The following table summarises the existing tariff structures:
• Domestic - single phase conventional credit meter o Monthly service charge depending on circuit breaker size [N$] o Basic/service charge [N$] o Unit charge [N$ per kWh]
• Domestic - pre-paid meter – single phase o Unit charge [N$ per kWh]
• Domestic - pre-paid meter with circuit breaker or current limiter o Unit charge depending on CB/CL sizing [N$ per kWh]
• Domestic - pre-paid meter – three phase o Unit charge [N$ per kWh]
ELECTRICITY CONTROL BOARD NATIONAL ELECTRICITY TARIFF STUDY - FINAL REPORT
Page 6 of 186
EMCON – SAD-ELEC – ECON
• Business and Light Industry – single phase o Monthly service charge [N$] o Basic/service charge [N$]
• Business and Light Industry – three phase o Monthly service charge [N$] o Basic/service charge [N$] o Unit charge [N$ per kWh]
• Large Power Users – without demand meters o Monthly service charge [N$] o Demand charge (ordered) [N$ per kVA] o Unit charge [N$ per kWh]
• Large Power Users – with demand meters o Service Fee [N$] o Demand charge [N$ per kVA] o Unit charge [N$ per kWh]
• Streetlights o per light [N$] o Unit charge [per kWh]
2.1.2 Tariff determination methodologies
The submissions by the supply authorities did in most cases not include a description of the methodology used to arrive at a particular tariff rate, and the general tariff structure.
The following observations can be made:
• A cost of supply approach is not the main tariff determination driver for most supply authorities.
• Only a few re-distributors have attempted to accommodate the poor section in society by special tariff structures (i.e. there is no poverty tariff, but provision is sometimes made to accommodate small-scale domestic customers).
• Some re-distributors make use of a basic monthly fixed charge (sometimes referred to as service charge, which can be used to share costs between
ELECTRICITY CONTROL BOARD NATIONAL ELECTRICITY TARIFF STUDY - FINAL REPORT
Page 7 of 186
EMCON – SAD-ELEC – ECON
customers not related to the customer-specific consumption), as well as a maximum demand [N$/kVA] and/or capacity charge [N$/amp] (i.e. a measure of the costs of providing the capacity of supply to the customer) and energy charge [N$/kWh] (i.e. the costs related to the customer-specific energy consumption).
• No time-of-use or seasonal tariffs are applied, some of the larger supply authorities apply demand management practices, such as ripple control systems.
• Pre-payment tariffs, if available, often seem to be guided by the local supply authorities understanding of the customer�s willingness to pay, and are often not obviously correlated to the actual cost of supply.
• Non-tariff charges, also referred to as sundry charges and levies o show a very wide spread, o are often clearly not cost reflective (often too low), o would be difficult to motivate,
• Prices that are not cost-reflective may provide inefficient price signals to customers
• There is no residential geyser control (only via central ripple control) and/or geyser saving tariff in place, even though a hot water storage device contributes between 25% to 50% to a domestic electricity bill.
• In many cases, particularly for the smaller supply authorities, electricity tariffs are simply increased as a function of the annual supply increases, e.g. if the NamPower rates increase by 9% in a particular year, the local authority tariffs are increased correspondingly. One typical signature of this particular practice is if energy charges are specified to an accuracy of four digits, e.g. the cost of one kWh is N$ 0.3125.
• Regional tariff distortions are obvious.
• What is also observed is that a number of supply authorities have made use of consultants at some point in the past to make recommendations with regard to a workable tariff structure. These methodologies are then used to recalculate the annual tariffs, often however the changing client base or new supply conditions are not explicitly taken into account. Particularly in the smaller local authorities this practice results in unrealistic tariff regimes, and both an under- and over-recoveries of cost were encountered.
• Few supply authorities have internal consumption tariffs in place, and the fact that many activities (e.g. street-lighting) are not separately metered, makes it difficult to assess the percentage loss and �in-house� use. This in turn makes it difficult for ECB to set targets to reduce losses.
• Since tariffs are not cost-reflective, the ability to finance network expansion, particularly in rapidly growing centres, will be difficult.
• Another common pricing principle used, particularly by the larger supply authorities, is that the sale of electricity is one of the few profitable
ELECTRICITY CONTROL BOARD NATIONAL ELECTRICITY TARIFF STUDY - FINAL REPORT
Page 8 of 186
EMCON – SAD-ELEC – ECON
undertakings, and is used to cross-subsidise other essential local authority services. This leads to a situation in which the overall budget of a local authority is taken into account when determining the tariffs for a particular year, and only once all capital and recurrent expenditures are estimated, is the actual electricity tariff determined, thereby using these tariffs to balance out budgetary shortfalls.
• The variety and combination of electricity and sundry tariffs make a direct comparison of the various tariff structures difficult. In Phase II of the National Electricity Tariff Study a more standardized and uniform tariff approach was developed to address this observation, guided by the following principles o cost effectiveness and cost-reflectiveness of tariffs, o simplicity of application for the local authorities and re-distributors, o tariff transparency for the customer, o national and regional pricing signals must be readily detectable in the
tariff structure.
2.1.3 Sundry tariffs and levies
The following sundry tariff and levy structures capture most of what is currently applied (Note: not all re-distributors apply all sundry tariffs as listed below):
• Disconnection & Reconnection charges o Connection [N$] o Disconnection [N$] o Temporary disconnection [N$] o Reconnection [N$] o Reconnection after non-payment [N$] o Services after hours [N$] o Overhead connection - 1 phase [N$] o Overhead connection - 2 phase [N$] o Overhead connection - 3 phase [N$] o Cable connection [N$]
• Location & Rectification of Faults o Office hours [N$]
ELECTRICITY CONTROL BOARD NATIONAL ELECTRICITY TARIFF STUDY - FINAL REPORT
Page 9 of 186
EMCON – SAD-ELEC – ECON
o After hours [N$]
• Testing of Meter & Circuit Breaker o Meters [N$] o Circuit breaker [N$] o Special reading of meter [N$]
• Special Fees o Fixed levy: Basic unbuilt erf [N$] o Late fees [interest per month in %], or in [N$] o Replacement of kWh with electricity dispensers [N$]
• Deposits o Domestic/business single phase [N$] o All other consumers - single phase [N$] o All other consumers - three phase up to 60 amp [N$] o All other consumers - three phase above 60 amp [N$] o Business / trading site single phase [N$] o Three phase up to 60 amp per phase [N$] o Above 60 amp per phase [N$]
2.1.4 Tariff analysis for domestic, business & LPU’s This section provides a more quantitative analysis and features on the tariffs collected from supply authorities for the tariff interval 2000/2001:
ELECTRICITY CONTROL BOARD NATIONAL ELECTRICITY TARIFF STUDY - FINAL REPORT
Page 10 of 186
EMCON – SAD-ELEC – ECON
Firstly, a comparison of charges arising from a small domestic connection:
With an installed circuit breaker (CB) of 15 amperes, and a monthly consumption of 100 kWh, the domestic charges will be:
• Average fixed charge is N$ 26.58 ± 11.20,
• Average energy charge per kWh is N$ 0.33 ± 0.07,
• Average total energy charge is N$ 33.02 ± 6.95,
• Average total monthly expenditure is N$ 60.01 ± 12.09.
Domestic comparison: 15 amp CB with 100 kWh monthly consumption
0.0010.0020.0030.0040.0050.0060.0070.0080.0090.00
Swa
kopm
und
Kar
ibib
Nor
ther
nK
atim
aG
root
font
ein
Osh
akat
iO
tavi
Otji
waro
ngo
Out
joR
ehob
oth
Tsum
ebW
indh
oek
Opu
wa
Hen
ties
Oka
kara
raK
horix
asW
alvis
Om
arur
uG
obab
isO
kaha
ndja
Kee
tman
shoo
pU
sako
sLü
derit
zM
arie
ntal
Ara
ndis
Kar
asbu
rgA
rano
sA
roab
Far
mer
sK
alah
ari
Kar
as R
GO
sire
Pow
erO
mah
eke
RC
Nam
Aip
ort
Leon
ard
VC
Ber
seba
VC
Aro
ab V
CTs
es V
C
Town
Cha
rge
[N$]
Energy chargeFixed charge
ELECTRICITY CONTROL BOARD NATIONAL ELECTRICITY TARIFF STUDY - FINAL REPORT
Page 11 of 186
EMCON – SAD-ELEC – ECON
Another very common domestic connection, i.e. using a 25 ampere circuit breaker, and consuming 200 kWh per month, exhibits the following characteristics: The incurred domestic charges can be broken up as follows:
• Average fixed charge is N$ 42.48 ± 18.89,
• Average energy charge per kWh is N$ 0.33 ± 0.07,
• Average total energy charge is N$ 66.04 ± 13.90,
• Average total monthly expenditure is N$ 109.33 ± 19.65.
Domestic consumption: 25 amp CB with 200 kWh monthly consumption
0.0050.00
100.00150.00200.00
Swak
opm
und
Karib
ibNo
rther
nKa
tima
Gro
otfo
ntei
nO
shak
ati
Ota
viO
tjiw
aron
goO
utjo
Reh
obot
hTs
umeb
Win
dhoe
kO
puw
aHe
ntie
sO
kaka
rara
Khor
ixas
Wal
visO
mar
uru
Gob
abis
Oka
hand
jaKe
etm
ansh
ooUs
akos
Lüde
ritz
Mar
ient
alAr
andi
sKa
rasb
urg
Aran
osAr
oab
Kala
hari
Kara
s R
GO
sire
Pow
erO
mah
eke
RC
Nam
Aip
ort
Leon
ard
VCBe
rseb
a VC
Aroa
b VC
Tses
VC
Town
Char
ge [N
$]
Energy chargeFixed charge
ELECTRICITY CONTROL BOARD NATIONAL ELECTRICITY TARIFF STUDY - FINAL REPORT
Page 12 of 186
EMCON – SAD-ELEC – ECON
A larger domestic single-phase circuit breaker at 50 amperes, with a monthly energy consumption of 600 kWh, exhibits the following characteristics: Here, the average charges amount to:
• Average fixed charge is N$ 79.33 ± 42.92,
• Average energy charge per kWh is N$ 0.33 ± 0.07,
• Average total energy charge is N$ 198.12 ± 41.71,
• Average total monthly expenditure is N$ 279.01 ± 46.49.
Domestic consumption: 50 amp CB with 600 kWh monthly consumtion
0.00100.00200.00300.00400.00500.00
Sw
akop
mun
dK
arib
ibN
orth
ern
Kat
ima
Gro
otfo
ntei
nO
shak
ati
Ota
viO
tjiw
aron
goO
utjo
Reh
obot
hTs
umeb
Win
dhoe
kO
puwa
Hen
ties
Oka
kara
raK
horix
asW
alvi
sO
mar
uru
Gob
abis
Oka
hand
jaK
eetm
ansh
ooU
sako
sLü
derit
zM
arie
ntal
Ara
ndis
Kar
asbu
rgA
rano
sA
roab
Kal
ahar
iK
aras
RG
Osi
re P
ower
Om
ahek
e R
CN
am A
ipor
tLe
onar
d V
CB
erse
ba V
CA
roab
VC
Tses
VC
Town
Cha
rge
[N$]
Energy chargeFixed charge
ELECTRICITY CONTROL BOARD NATIONAL ELECTRICITY TARIFF STUDY - FINAL REPORT
Page 13 of 186
EMCON – SAD-ELEC – ECON
Pre-payment meters are enjoying increasing popularity, and a comparison of the charges depending on the consumption, i.e. 100, 200 and 600 kWh reveals: The domestic single-phase pre-payment charges, as a function of the consumption, exhibit the following averages:
• Average total monthly expenditure when consuming 100 kWh/month: N$ 43.52 ± 9.12,
• Average total monthly expenditure when consuming 200 kWh/month: N$ 87.03 ± 18.24,
• Average total monthly expenditure when consuming 600 kWh/month: N$ 261.10 ± 54.72.
Pre-payment charges
0.0050.00
100.00150.00200.00250.00300.00350.00400.00450.00
Swak
opm
und
Karib
ibNo
rther
nKa
tima
Gro
otfo
ntei
nO
shak
ati
Ota
viO
tjiwar
ongo
Out
joR
ehob
oth
Tsum
ebW
indh
oek
Opu
wa
Hent
ies
Oka
kara
raKh
orixa
sW
alvis
Om
arur
uG
obab
isO
kaha
ndja
Keet
man
shoo
pUs
akos
Lüde
ritz
Mar
ient
alAr
andi
sKa
rasb
urg
Aran
osAr
oab
Farm
ers
Kala
hari
Kara
s R
GO
sire
Pow
erO
mah
eke
RC
Nam
Aip
ort
Leon
ard
VCBe
rseb
a VC
Aroa
b VC
Tses
VC
Town
Cha
rge
[N$]
100 kWh200 kWh600 kWh
ELECTRICITY CONTROL BOARD NATIONAL ELECTRICITY TARIFF STUDY - FINAL REPORT
Page 14 of 186
EMCON – SAD-ELEC – ECON
Comparing conventional credit meter charges per kWh to pre-payment charges per kWh one finds:
Conventional vs Pre-paid charge per kWh
0.000.200.400.600.80
Sw
akop
mun
dK
arib
ibN
orth
ern
Kat
ima
Gro
otfo
ntei
nO
shak
ati
Ota
viO
tjiw
aron
goO
utjo
Reh
obot
hTs
umeb
Win
dhoe
kO
puw
aH
entie
sO
kaka
rara
Kho
rixas
Wal
vis
Om
arur
uG
obab
isO
kaha
ndja
Kee
tman
shoo
pU
sako
sLü
derit
zM
arie
ntal
Ara
ndis
Kar
asbu
rgA
rano
sA
roab
Far
mer
sK
alah
ari
Kar
as R
GO
sire
Pow
erO
mah
eke
RC
Nam
Aip
ort
Leon
ard
VCB
erse
ba V
CA
roab
VC
Tses
VC
Town
Cha
rge
[N$]
Conventional kWhPre-paid kWh
ELECTRICITY CONTROL BOARD NATIONAL ELECTRICITY TARIFF STUDY - FINAL REPORT
Page 15 of 186
EMCON – SAD-ELEC – ECON
Comparing domestic circuit breaker charges for 20, 40 and 60 amp respectively finds:
ELECTRICITY CONTROL BOARD NATIONAL ELECTRICITY TARIFF STUDY - FINAL REPORT
Page 16 of 186
EMCON – SAD-ELEC – ECON
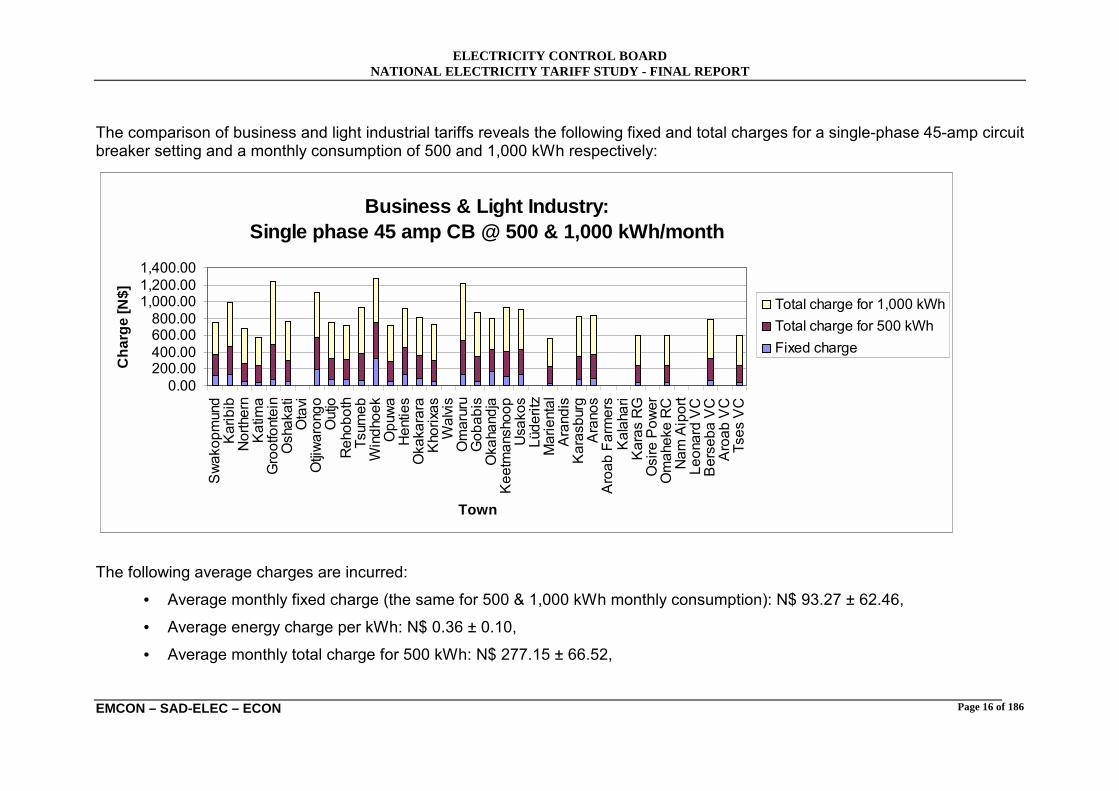
The comparison of business and light industrial tariffs reveals the following fixed and total charges for a single-phase 45-amp circuit breaker setting and a monthly consumption of 500 and 1,000 kWh respectively: The following average charges are incurred:
• Average monthly fixed charge (the same for 500 & 1,000 kWh monthly consumption): N$ 93.27 ± 62.46,
• Average energy charge per kWh: N$ 0.36 ± 0.10,
• Average monthly total charge for 500 kWh: N$ 277.15 ± 66.52,
Business & Light Industry: Single phase 45 amp CB @ 500 & 1,000 kWh/month
0.00200.00400.00600.00800.00
1,000.001,200.001,400.00
Sw
akop
mun
dK
arib
ibN
orth
ern
Kat
ima
Gro
otfo
ntei
nO
shak
ati
Ota
viO
tjiw
aron
goO
utjo
Reh
obot
hTs
umeb
Win
dhoe
kO
puw
aH
entie
sO
kaka
rara
Kho
rixas
Wal
vis
Om
arur
uG
obab
isO
kaha
ndja
Kee
tman
shoo
pU
sako
sLü
derit
zM
arie
ntal
Ara
ndis
Kar
asbu
rgA
rano
sA
roab
Far
mer
sK
alah
ari
Kar
as R
GO
sire
Pow
erO
mah
eke
RC
Nam
Aip
ort
Leon
ard
VC
Ber
seba
VC
Aro
ab V
CTs
es V
C
Town
Cha
rge
[N$]
Total charge for 1,000 kWhTotal charge for 500 kWhFixed charge
ELECTRICITY CONTROL BOARD NATIONAL ELECTRICITY TARIFF STUDY - FINAL REPORT
Page 17 of 186
EMCON – SAD-ELEC – ECON
• which implies that the monthly fixed charge is 32.0% ± 14.5% of the average total monthly charge for a 500 kWh monthly consumption, while the
• Average monthly total charge for 1,000 kWh consumption is: N$ 461.03 ± 98.25,
• which implies that the monthly fixed charge is 22.0% ± 12.2% of the average total monthly charge for a 1,000 kWh monthly consumption.
ELECTRICITY CONTROL BOARD NATIONAL ELECTRICITY TARIFF STUDY - FINAL REPORT
Page 18 of 186
EMCON – SAD-ELEC – ECON
The comparison of business and light industrial tariffs reveals the following fixed and total charges for a 3 x 30 amp circuit breaker setting and a monthly consumption of 2,000 kWh: This implies the following average charges: • Average monthly fixed charge: N$ 247.31 ± 141.03, • Average energy charge per kWh: N$ 0.37 ± 0.12, • Average monthly total charge: N$ 987.71 ± 233.87, • which implies that the monthly fixed charge is 25.5% ± 13.7% of the average total monthly charge.
Business & Light Industry: Three phase 3 x 30 amp @ 2,000 kWh/month
0.00250.00500.00750.00
1,000.001,250.001,500.001,750.002,000.00
Swak
opmu
ndKa
ribib
North
ern
Katim
aGr
ootfo
ntein
Osha
kati
Otav
iOt
jiwar
ongo Ou
tjoRe
hobo
thTs
umeb
Wind
hoek
Opuw
aHe
nties
Okak
arar
aKh
orixa
sW
alvis
Omar
uru
Goba
bis
Okah
andja
Keet
mans
hoop
Usak
osLü
derit
zM
arie
ntal
Aran
disKa
rasb
urg
Aran
osAr
oab
Farm
ers
Kalah
ari
Kara
s RG
Osire
Pow
erOm
ahek
e RC
Nam
Aip
ort
Leon
ard
VCBe
rseb
a VC
Aroa
b VC
Tses
VC
Town
Char
ge [N
$]
Total chargeFixed charge
ELECTRICITY CONTROL BOARD NATIONAL ELECTRICITY TARIFF STUDY - FINAL REPORT
Page 19 of 186
EMCON – SAD-ELEC – ECON
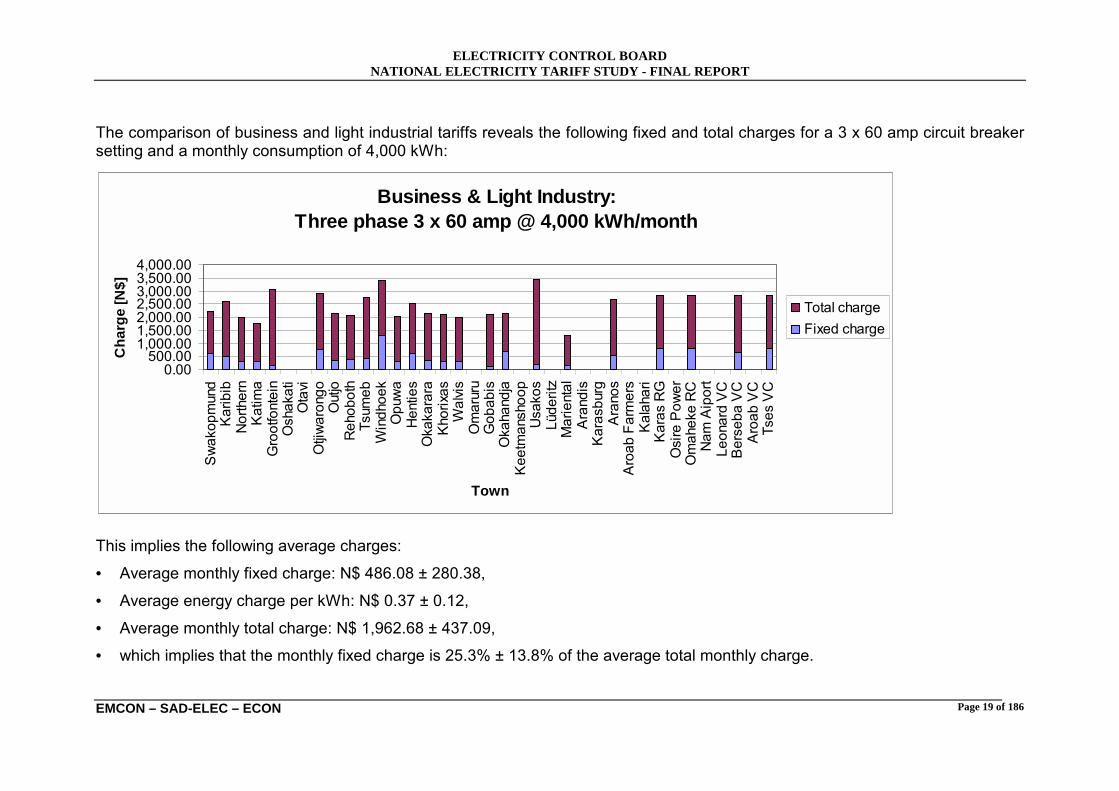
The comparison of business and light industrial tariffs reveals the following fixed and total charges for a 3 x 60 amp circuit breaker setting and a monthly consumption of 4,000 kWh: This implies the following average charges:
• Average monthly fixed charge: N$ 486.08 ± 280.38,
• Average energy charge per kWh: N$ 0.37 ± 0.12,
• Average monthly total charge: N$ 1,962.68 ± 437.09,
• which implies that the monthly fixed charge is 25.3% ± 13.8% of the average total monthly charge.
Business & Light Industry: Three phase 3 x 60 amp @ 4,000 kWh/month
ELECTRICITY CONTROL BOARD NATIONAL ELECTRICITY TARIFF STUDY - FINAL REPORT
Page 20 of 186
EMCON – SAD-ELEC – ECON
The comparison of large power user (demand metered) tariffs reveals the following fixed and total charges for a maximum demand rating of 50 kVA and a monthly consumption of 3,000 kWh: This implies the following average charges:
• Average monthly fixed charge per kVA: N$ 44.38 ± 16.20,
• Average total monthly fixed charge: N$ 2,219.03 ± 809.94,
• Average energy charge per kWh: N$ 0.29 ± 0.09,
• Average monthly basic charge: N$ 89.76 ± 150.32,
• Average monthly total charge: N$ 3,142.25 ± 769.66,
• which implies that the average total monthly fixed charge is 66.6% ± 21.2% of the average monthly total charge.
Large Power User: Max demand 50 kVA @ 3,000 kWh/month
ELECTRICITY CONTROL BOARD NATIONAL ELECTRICITY TARIFF STUDY - FINAL REPORT
Page 21 of 186
EMCON – SAD-ELEC – ECON
The comparison of large power user (demand metered) tariffs reveals the following fixed and total charges for a maximum demand rating of 300 kVA and a monthly consumption of 8,000 kWh: This implies the following average charges: • Average monthly fixed charge per kVA: N$ 44.38 ± 16.20, • Average total monthly fixed charge: N$ 13,314.19 ± 4,859.66, • Average energy charge per kWh: N$ 0.29 ± 0.09, • Average monthly basic charge: N$ 89.76 ± 150.32, • Average monthly total charge: N$ 15,541.76 ± 4,842.40, • which implies that the average total monthly fixed charge is 79.2% ± 22.9% of the average monthly total charge.
Large Power User: Max demand 300 kVA @ 8,000 kWh/month
ELECTRICITY CONTROL BOARD NATIONAL ELECTRICITY TARIFF STUDY - FINAL REPORT
Page 22 of 186
EMCON – SAD-ELEC – ECON
2.2 Distribution tariff database
A MS Excel-based spreadsheet database was constructed for the tariff information received.
Two separate databases are provided with this Report (electronic versions of the databases are contained on CD-ROM attached to this Report). 1. Summary of other Supply Authority Tariffs
Other Supply Authority Tariffs.xls 2. Summary of the Mine, NamPower and Ministry of Regional and Local
Government and Housing tariffs Mine, NamPower & MRLGH Tariffs.xls
The Summary of other Supply Authority Tariffs database has the following structure:
• Worksheet 00-01: for 2000/2001 tariffs
• Worksheet 99-00: for 1999/2000 tariffs
• Worksheet 98-99: for 1998/1999 tariffs
• Worksheet 97-98: for 1997/1998 tariffs
• Worksheet 96-97: for 1996/1997 tariffs
The structure of the worksheets is further discussed in Appendix C.
The Summary of Mine & NamPower Tariffs has the following structure:
• Worksheet NamPower: 1996 to 2001 distribution tariffs
• Worksheet MRLGH: 1996 to 2001 distribution tariffs
• Worksheet Rössing
• Worksheet NAMDEB
• Worksheet Ongopolo: 1996 to 2001 distribution tariffs
• Worksheet Navachab: 1996 to 2001 distribution tariffs
ELECTRICITY CONTROL BOARD NATIONAL ELECTRICITY TARIFF STUDY - FINAL REPORT
Page 23 of 186
EMCON – SAD-ELEC – ECON
3 Review of NamPower's Proposed Generation Tariffs
3.1 Review approach Namibia has identified the need to restructure its electricity industry to encourage more private participation and ultimately introduce competition. The Government of Namibia has adopted the Single Buyer (SB) model as the most appropriate market structure as an interim step towards a more competitive electricity market. However, it is the ECB Consultants� view that effective competition for the supply of Namibia�s electricity needs is probably some six to eight years away. Consequently, the ECB Consultants have recommended that a Cost-Based approach be adopted in the short to medium term to review and regulate Generation tariffs, while the Namibian electricity supply industry is moving towards a competitive market. However, an approach is also outlined for how the cost-based approach can be managed during the period of transition in order to move the industry towards future market based pricing. The review process has been structured into three main components to organise the flow of information and ideas into more manageable sections, they are: ! Tariff Structure ! Revenue Requirements ! Tariff Levels
Each of the three main components are discussed in more detail by:
! reflecting on what NamPower has proposed,
! reviewing and analysing the proposal, and
! formulating a set of recommendations.
ELECTRICITY CONTROL BOARD NATIONAL ELECTRICITY TARIFF STUDY - FINAL REPORT
Page 24 of 186
EMCON – SAD-ELEC – ECON
3.2 Tariff structure 3.2.1 Proposal
Following initial discussions between NamPower and the ECB Consultants it was unclear what tariff structure had been proposed. There were essentially two proposals that emerged from various documents and discussions: ! The Generation tariff structure would consist of an energy charge (c/kWh) only,
and ! The Generation tariff structure will consist of Energy, Capacity and Ancillary
service payments. On 10 September 2001, NamPower tabled a document entitled �NamPower Tariffs� containing detailed proposals for tariff structures and levels. The information in this document formed the basis to review the Generation tariff structures and levels in this section. It should be noted that the information in this document differs considerably from the information on which the Phase 1 interim report of 25 June 2001 was based. The proposed tariff structure for the three generators are summarised in the following table:
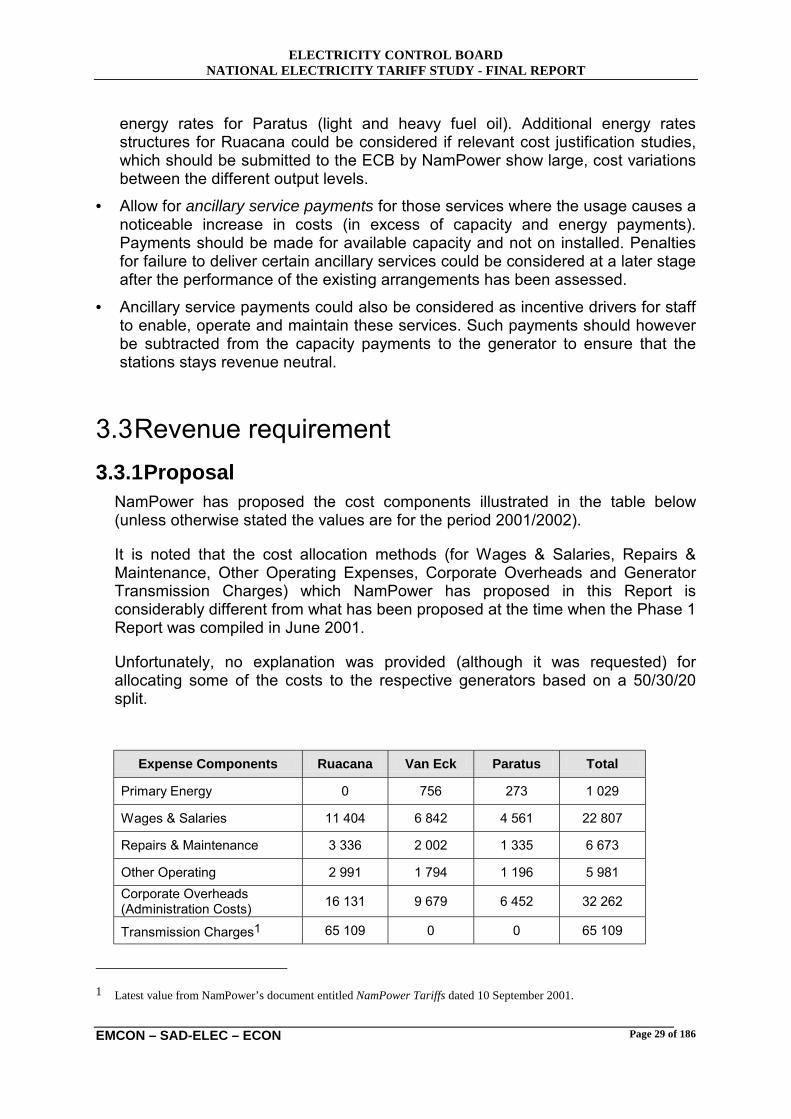
Tariff Component Units Ruacana Van Eck Paratus Capacity N$/kW/week # # # Energy:
Over whole output range c/kWh # Light fuel oil c/kWh # Heavy fuel oil c/kWh # Between 22 MW and 58 MW
c/kWh #
Between 58 MW and 72 MW
c/kWh #
Between 72 MW and 77 MW
c/kWh #
Between 77 MW and 80 MW
c/kWh #
Between 80 MW and 83 MW
c/kWh #
Excess Energy c/kWh #
Constrained-on compensation US$/MWh or c/kWh # # #
3.2.2 Review To ensure that efficient dispatch decisions are made in a SB environment, and that generators can cover their total cost (including a profit), Power Purchase Agreements (PPAs) between the SB and individual generators are required. Such PPAs commonly contain two important commercial drivers:
Energy payment The energy payment reflects the generator�s variable cost (c/kWh). The Single Buyer (SB) compares the variable costs of all the generators and import options to identify the least cost production schedules. Each generator is also compensated at its variable cost for every kilowatt-hour it is requested to generate.
A hydro generator does not consume any significant volumes of primary fuel. Consequently, it has a very low (almost zero) variable cost. This would mean that the SB could minimise the cost of production by calling on the hydro generators to produce at full output all the time. Unfortunately, the output of the hydro generators at Ruacana are restricted by the amount of water flow in the Kunene river. The cost of supply would therefore be minimised if the limited production energy were scheduled in such a way that the purchase cost from other generating sources are minimised. The optimised scheduling of hydro generators can be a complex process and would require the assistance of optimisation software programs.
NamPower has proposed several energy components linked to the output level of Ruacana. The reason for differentiating between the different output levels is stated and is aimed at reflecting the units� different levels of efficiency at different output levels. It is most likely also indicating the preferred operating ranges to avoid problems with cavitation and vibration.
It should be borne in mind that more tariff components will require more complex scheduling optimisation routines, therefore unnecessary tariff components should be avoided. The number of energy components that NamPower has proposed for Ruacana�s energy output appears to be high given the low variable cost of operation of a hydro generator. By way of an example: it is possible to reduce the three proposed energy components over the range 58 MW to 80 MW to one considering that the efficiency differences between these levels are very low. In
ELECTRICITY CONTROL BOARD NATIONAL ELECTRICITY TARIFF STUDY - FINAL REPORT
Page 26 of 186
EMCON – SAD-ELEC – ECON
other words compared to other generating options (local as well as imported) the energy tariff structure for Ruacana�s output could be simplified without compromising scheduling and dispatch efficiency.
The differentiation in the energy tariff for Paratus, depending on whether light or heavy fuel oil is used, is fully supported. Van Eck�s single energy tariff component is also supported.
Capacity payment The purpose of a capacity payment is to ensure that the generator covers all its fixed costs and makes a regulated profit even if it does not get dispatched. Normally, the capacity payment is made to the generator for every kW it has declared available for use (either to generate electricity or to provide ancillary services) over a certain time period.
A system of bonuses and penalties could be introduced to incentivise the generator to increase its availability. Rather than introducing the complex debates of penalties and bonuses, SB�s have successfully employed a mechanism that differentiates the level of the capacity payment depending on time-of-use periods. This creates an additional incentive to the generator to ensure that the unit�s capacity is available when it is most needed by the system. Other mechanisms could also be explored such as linking the level of capacity payment to the real-time costs of imports. This provides an incentive to be available at times when costs of purchases are high.
NamPower has proposed a flat rate to be charged as N$/kW/week. There is no indication how the kW value will be determined. It could either be the installed capacity of the generator or the effective capacity (i.e. the time weighted average available capacity after the influence of planned and unplanned capacity outages and de-ratings). The time period over which the capacity charge is expressed (NamPower has proposed a per week charge) only becomes significant if the payment is differentiated per time-of-use period or when bonuses and penalties are applied.
Ancillary Service Charges In addition to the energy and capacity charges some PPA�s also include payments to the generators for the provision of ancillary services. NamPower has proposed an array of different ancillary services.
Careful consideration should be given to ensure that the incremental value of unpacking the different ancillary services is more than the associated incremental transaction costs. In addition the separate pricing of the service should also be aligned with the other tariff payments such as capacity and energy. It should also be recognised that the provision of ancillary services is subject to the availability of
ELECTRICITY CONTROL BOARD NATIONAL ELECTRICITY TARIFF STUDY - FINAL REPORT
Page 27 of 186
EMCON – SAD-ELEC – ECON
the generator. In other words if the generator is not available (e.g. on planned outage) it is not possible to provide any of the ancillary services.
Furthermore, if a cost based approach is followed to determine the value of capacity and energy payments then a generator�s ancillary service�s rate should be set at a level to off-set any incremental cost to the generator for providing the service. This approach will promote efficient scheduling of ancillary services especially since some of these services could be obtained from the transmission system, from import options or from potentially demand side participation.
For example, the ECB Consultants are not aware that there is a noticeable incremental cost incurred (over and above the capacity and energy cost) to provide spinning reserve, black start-up, voltage control, 12-hour reserves or dynamic capacity. It is therefore not necessary, in our opinion, to unpack these services during the SB phase. If it can be shown that there is a definite incremental cost incurred to provide any of these services then that service should be unpacked, quantified and charged for separately.
Frequency control may cause a slight increase in O&M expenses and separate payment to offset these expenses may be justified. However, a proper cost justification study will have to be performed to determine the level of the payment.
It is acknowledged that these services will carry a market value in a competitive environment and they will have to be unpacked before the generator can take advantage of market opportunities. As pointed out earlier, the ECB Consultants don�t believe that there will be a competitive market in Namibia in the near future.
It is also unclear why NamPower has proposed that the spinning reserve charges are denominated in US$. It is assumed that it maybe linked to payments for spinning reserve in the SAPP. However, this approach is deviating from the principle of cost based tariffs and cannot be supported at this time.
The provision of the majority of the ancillary services causes a negligible increase only in costs (over and above capacity and energy payments) and therefore does not need to be unbundled from a commercial perspective. However, experience has shown that payments (even relatively small ones) for these services can act as a powerful motivator to power station operating and maintenance personnel to ensure that ancillary systems are enabled and capable of performing the required services and that people are trained to maintain and operate them.
This means that ancillary payments could be introduced not only to offset any incremental costs but also as an incentive to provide the service. The introduction of ancillary service payments could be made possible by reducing capacity payments so that the overall payment to the station still remain the same.
The payments should be structured in such a way that they encourage least cost dispatch decisions. In other words, ancillary service payments that are introduced to create an economic incentive should be based on actual capability (e.g. N$/available MW/week or N$/day). This provides a signal to the SB that the
ELECTRICITY CONTROL BOARD NATIONAL ELECTRICITY TARIFF STUDY - FINAL REPORT
Page 28 of 186
EMCON – SAD-ELEC – ECON
payment is independent of the usage of the service and that the usage (incremental) cost is very low. On the other hand, ancillary services that cause a definite increase in cost should be paid for using (if possible) the cost driver (e.g. a N$/MW payment for the actual movement to control frequency).
Constrained on Payments Constrained on payments are typically paid in a competitive market where a scenario could arise where a generator is instructed to produce while prevailing market prices are below what the generator is prepared to sell its energy for. A constrained on payment is made to the generator to ensure that it is not forced to sell its electricity below its asking price. In other words the constrained on payments creates a �willing-buyer-willing-seller� relationship.
If the generator is paid cost reflective capacity, energy and ancillary services rates then the situation that the generator will be forced to sell below his cost could not arise. Therefore, the consultants don�t believe that the trading arrangements during the Single Buyer phase justifies the introduction of constrained on payments.
It is also unclear why the proposed constrained on payment is denominated in US$. Again, the may be related to consistency with provisions in the SAPP agreements to which NamPower is a signatory.
3.2.3 Recommendations We recommend that the ECB should:
• Allow for a capacity payment in the tariff structure. Although NamPower has recommended a flat N$/kW/week, we would, as a minimum, suggest that the payment be made based on available (after outages) and not installed capacity.
• Change the capacity payment structure to encourage the generators to be available during high cost or high demand periods. We believe that this will provide a strong incentive that will reward NamPower for making the generators available to the system when they are needed most. This payment structure will also encourage shorter planned maintenance periods and will inform the timing (when) of the planned outage. This could be achieved by linking the capacity payment to:
o either time-of-use periods (peak, standard, off-peak) or, o indirectly to the real time costs of imports.
• Permit an energy payment (c/kWh) to compensate generators for incurring costs when the generator is asked to produce. We would recommend a simple single energy rate structure for all three generators, although we would support two
ELECTRICITY CONTROL BOARD NATIONAL ELECTRICITY TARIFF STUDY - FINAL REPORT
Page 29 of 186
EMCON – SAD-ELEC – ECON
energy rates for Paratus (light and heavy fuel oil). Additional energy rates structures for Ruacana could be considered if relevant cost justification studies, which should be submitted to the ECB by NamPower show large, cost variations between the different output levels.
• Allow for ancillary service payments for those services where the usage causes a noticeable increase in costs (in excess of capacity and energy payments). Payments should be made for available capacity and not on installed. Penalties for failure to deliver certain ancillary services could be considered at a later stage after the performance of the existing arrangements has been assessed.
• Ancillary service payments could also be considered as incentive drivers for staff to enable, operate and maintain these services. Such payments should however be subtracted from the capacity payments to the generator to ensure that the stations stays revenue neutral.
3.3 Revenue requirement 3.3.1 Proposal
NamPower has proposed the cost components illustrated in the table below (unless otherwise stated the values are for the period 2001/2002).
It is noted that the cost allocation methods (for Wages & Salaries, Repairs & Maintenance, Other Operating Expenses, Corporate Overheads and Generator Transmission Charges) which NamPower has proposed in this Report is considerably different from what has been proposed at the time when the Phase 1 Report was compiled in June 2001.
Unfortunately, no explanation was provided (although it was requested) for allocating some of the costs to the respective generators based on a 50/30/20 split.
3.3.2 Review Our review comments are summarised in the following table:
Proposed Expense
Components
Should Expense be allowed as part of
revenue requirement? Comment on proposed cost
drivers and allocation methods
Primary Energy Yes Although the method is acceptable
the level appears high. See analysis below.
Wages & Salaries Yes No explanation for allocation percentages.
Repairs & Maintenance Yes No explanation for allocation
percentages.
ELECTRICITY CONTROL BOARD NATIONAL ELECTRICITY TARIFF STUDY - FINAL REPORT
Page 31 of 186
EMCON – SAD-ELEC – ECON
Proposed Expense
Components
Should Expense be allowed as part of
revenue requirement? Comment on proposed cost
drivers and allocation methods
Other Operating Yes No explanation for allocation percentages.
Corporate Overh. (Admin Costs) Yes No explanation for allocation
percentages. Transmission Charges Yes. See section 7.3 for more detail
comment.
Depreciation Yes
Historic costs rather than Replacement cost depreciation
values is supported. See section below for more detail discussion.
Return Yes
The proposed avoided cost approach is not supported. See
more detail discussion below and elsewhere in the document.
Net Interest Paid No
Notional Tax No
Dividend Declared No
These cost components are not allowed in the revenue requirement if a pre-tax WACC value is used to
determine the regulated return.
Primary Energy Analysis
Expense Components Ruacana Van Eck Paratus
Primary Energy (N$ �000) 0 756 273 Average energy production (GWh) during 1999 & 2000 1 282 19 1
Calculated unit cost (c/kWh) - 39.8 273.0
Expected unit cost (c/kWh) - 17.52 62.03 Primary Energy values based on expected unit cost for fuel and production levels similar to average of previous two years. (N$ �000)
- 333 62
An analysis of the Primary Energy Budget indicates that the numbers could be overstated, but this is dependent on the assumptions made by NamPower.
2 Based on N$250/ton for coal obtained from NamPower’s annual report, a burn rate of 0.6 kg / kWh and inflation
adjustment.
3 Value obtained from NamPower’s Tariff submission of 10 September 2001.
ELECTRICITY CONTROL BOARD NATIONAL ELECTRICITY TARIFF STUDY - FINAL REPORT
Page 32 of 186
EMCON – SAD-ELEC – ECON
Wages & Salaries
NamPower�s latest allocation proposal (50/30/20) appears to be an interim proposal. A more scientific approach would be to link the Wages & Salaries of each power station to the number of people at the plant. The allocation would look as follow.
NamPower has treated these expenses as two separate components but they could be combined into a single O&M expense category. NamPower has also indicated that the 50/30/20 cost allocation ratio needs to be refined.
Our experience has shown that O&M power station expenditure are linked to a number of drivers, including
• Technology (hydro, coal, oil)
• Size (installed capacity)
• Degree of utilisation (production)
If the specific detail (technology, size and utilisation) of NamPower�s power stations is used to benchmark the O&M expenditure the Consultants power station cost database suggests the following allocation ratios. The exercise also verified that the proposed level of expenditure appears reasonable.
Area Ruacana Van Eck Paratus + KM Total
Benchmark cost allocation ratios 58% 37% 5% 100%
O&M (N$ �000) 7 339 4 682 633 12 6544
Corporate Overheads / Administration Charges
NamPower�s suggested (50/30/20) allocation ratios as previously discussed appears not to be appropriate. Rather it is suggested to base the allocation on the budget expense for each power station. Detail budgets are not available, but based on the
4 This value reflects the combined Repairs & Maintenance and Other Operating expenditures.
ELECTRICITY CONTROL BOARD NATIONAL ELECTRICITY TARIFF STUDY - FINAL REPORT
Page 33 of 186
EMCON – SAD-ELEC – ECON
cost data presented in this document we suggest the following percentages and cost allocations:
The section on the Review of NamPower's proposed internal transmission charges on page 71 provides a more comprehensive review of the proposed charges. The following table shows the results if installed capacity (our recommendation) is used as the cost driver to allocate transmission cost (based on our Tx cost allocation numbers) between the producers.
Allocation Ruacana Van Eck Paratus SB (Import) Total
NamPower�s depreciation values are based on replacement cost depreciation values. Our approach is based on historic cost depreciation values.
Based on the information provided by NamPower the historic cost based asset values (N$ �000) and lifetimes (years) are:
5 Values from NamPower ‘s 2000 Annual Report.
ELECTRICITY CONTROL BOARD NATIONAL ELECTRICITY TARIFF STUDY - FINAL REPORT
Page 34 of 186
EMCON – SAD-ELEC – ECON
Historic Cost Ruacana Van Eck Paratus
Net Book Historic Cost Value 98 268 45 632 32 407
Estimated resale value6 0 0 25 515
Historic Cost Depreciation 4 104 3 061 9
Calculated Remaining Life 24 15 766
Existing age 24 27 25
Total Life 48 42 790
The total life values for Ruacana and Van Eck appear to be quite realistic and the values could therefore be accepted. The total life value for Paratus is problematic, the main problem being the low depreciation value. The replacement asset value calculations (see table below) show a more realistic total life value of 38 years for Paratus. Therefore, it is suggested that the historic cost depreciation of Paratus be adjusted to N$ 530 000 to also reflect a calculated remaining life value of 13 years.
Based on the information provided by NamPower the replacement cost asset values (N$ �000) and lifetimes (years) are:
Replacement Cost Ruacana Van Eck Paratus
Replacement Cost Value 1 233 263 791 821 163 854
Present Day (Net Book) replacement cost value 715 323 211 722 80 800
Replacement Cost depreciation 19 542 19 225 4 175
Estimated resale value 0 0 25 515
Calculated Remaining Life 88 11 13
Existing age 24 27 25
Total Life 112 38 38
The asset and depreciation values result in reasonable total life�s for Van Eck and Paratus. The total life value of 112 years for Ruacana seems extreme and points to a problem with the net book value. The replacement asset value calculations (see table of historic costs above) show a more realistic total life value of 48 years for
6 The 1997 resale value was inflated (7.8% per year) to compensate for inflation.
ELECTRICITY CONTROL BOARD NATIONAL ELECTRICITY TARIFF STUDY - FINAL REPORT
Page 35 of 186
EMCON – SAD-ELEC – ECON
Ruacana. It is suggested that the replacement cost depreciation value be increased to N$29 805 000 to result in a calculated in a total life of 48 years.
Returns
NamPower has proposed an Opportunity Cost (also referred to as Avoidable Cost) based approach to value generation sales and returns. The method assumes that there are no generators in Namibia. The Eskom contract is then used to calculate how much Namibia would pay for this energy from Eskom. NamPower Generation�s revenue is then set equal to this amount. The generators� returns are calculated by subtracting the generators expenses from the revenue.
Our approach to the calculation of NamPower generators� revenue requirement differs from what has been proposed by NamPower. We believe that a cost based approach is appropriate for the following reasons:
• No significant degree of competition is envisaged in the Namibian electricity industry for the next six to eight years (although limited competition exist through NamPower�s trading in the SAPP, including operation in the Short-Term Energy Market (STEP) of the SAPP).
• A CPI-X approach (i.e. incentive-based regulation) would not be appropriate at this early stage of regulatory developments.
• An avoided cost based approach is primarily based on the costs of other generation options and is therefore more appropriate for investment decision comparisons and not to calculate regulated returns. The avoided cost approach would be appropriate to evaluate the PPA price if an IPP wants to sign an off-take agreement with the SB.
We therefore suggest that a cost based valuation process be followed to determine the return requirement of NamPower�s generators, at least until more clarity is available about ESI reform in South Africa and its implications for Namibia. Reference is made to the section on Regulatory approach on page 68 for a more detailed discussion why we recommend that the returns should be calculated on historic asset values rather than replacement cost asset values.
The proposed approach is based on allowed costs and an approved rate of return, which is based on historic cost asset values using a pre-tax real WACC value of 9.9%. For more details on the calculation of the WACC value refer to section 7.4 on page 75.
Only useful assets should be considered for the return calculation. In other words the generator company should not receive a return on its investment for assets which are not required. Surplus capacity is an example of assets which are not deemed useful. All NamPower�s generators fulfil a useful role as provider of electricity and or ancillary services. All the generators should therefore be allowed in the asset values when the returns are calculated.
ELECTRICITY CONTROL BOARD NATIONAL ELECTRICITY TARIFF STUDY - FINAL REPORT
Page 36 of 186
EMCON – SAD-ELEC – ECON
The following table shows the return calculations using a historic cost approach.
Historic Cost Returns Ruacana Van Eck Paratus Total
Net Book Value (N$ �000) 98 268 45 632 32 407 176 307
Allowance should be made for a phasing in of a move from a cost-based approach to prices based on market prices over the period during which this transition is expected to take place in the Namibian and Southern African ESI.
3.3.3 Recommendations We recommend that the ECB should:
• Determine the generator�s revenue requirement inclusive of costs and a regulated return. The following table lists the costs components that should be allowed in determining the generator�s revenue requirement. The table also shows the costs drivers that should be used to allocate common costs to each generator.
ELECTRICITY CONTROL BOARD NATIONAL ELECTRICITY TARIFF STUDY - FINAL REPORT
Page 37 of 186
EMCON – SAD-ELEC – ECON
Recommended Expense Components Recommended Cost Drivers and Allocation
Methods Primary Energy Based on budget production7
Wages & Salaries Number of people
Operating & Maintenance Combination of technology, installed capacity & utilisation
Corporate Overh. (Admin Costs) Based on ratio of budget expenses (primary energy,
Wages and Salaries and Operating & Maintenance) Transmission Charges Installed/Import Capacity
Depreciation8 Historic cost asset values.
Rate of Return9 Based on historic cost depreciated asset value using a pre-tax real WACC
• Use historic asset values over the expected economic life of the generator to calculate the depreciation component.
• Calculate the generator�s return using historic asset values and a pre-tax real rate of return of 9.9%.
• Based on the above recommendations, NamPower�s Revenue requirements are:
Based on historic asset values: Expense Components
Total 70 923 47 204 13 736 131 863 Expected send out (GWh) 1 04510 1911 111 1 065
7 NamPower should provide the latest 2001/2002 budget values and budget production levels from each generator to verify
the cost allocation.
8 These values are based on the historic value of the asset depreciated over its expected economic life.
9 The value is based on the depreciated historic cost book value and a pre-tax, real WACC number.
10 Average production for Ruacana as reflected in Mongula report
11 Production values were taken as the average for 1999 and 2000 from NamPower’s annual report.
ELECTRICITY CONTROL BOARD NATIONAL ELECTRICITY TARIFF STUDY - FINAL REPORT
Page 38 of 186
EMCON – SAD-ELEC – ECON
Expense Components (N$ ‘000) Ruacana Van Eck Paratus Total
Average rate (c/kWh) 6.79 248.4 1 373.6 12.4
• The following two tables show, for comparative purposes, what the revenue requirements and average rates would be for the Replacement cost approach and for NamPower�s proposed avoided cost approach:
Based on replacement asset values Expense Components
ELECTRICITY CONTROL BOARD NATIONAL ELECTRICITY TARIFF STUDY - FINAL REPORT
Page 39 of 186
EMCON – SAD-ELEC – ECON
Comparison of different Generation Price Levels
The following notes should be observed in relation to the above figure:
• The calculations of the historic cost approach and the replacement cost approach illustrates the average cost of NamPower generation, i.e. excluding the impact of (lower cost) import on the total cost of supply in Namibia.
• To be comparable to the calculations of generation costs based on historic costs, replacement cost and NamPower�s proposal, the equivalent cost of import includes both the average import cost itself as well as the charge for use of NamPower�s transmission network in Namibia.
The Eskom Gx marginal cost and the Eskom Gx average cost exclude any cost of transmission and are only included as illustration of prevailing �market� prices in the region (based on Eskom�s internal power pool and Eskom�s average regulated price respectively). These costs are relevant short-term comparisons to the avoided cost illustrated by NamPower�s proposal.
3.4 Tariff level(s) 3.4.1 Proposal NamPower has proposed price levels as summarised in the table below. These prices were published in NamPower�s proposal dated 10 September 2001. It should
0
5
10
15
20
25
Eskom GxMarginal
Eskom GxAverage
Imports Historic CostApproach
Nampower'sProposal
ReplacementCost Approach
Ave
rage
Rat
e (c
/kW
h) f
or 2
002
ELECTRICITY CONTROL BOARD NATIONAL ELECTRICITY TARIFF STUDY - FINAL REPORT
Page 40 of 186
EMCON – SAD-ELEC – ECON
be observed that detailed tariff levels were not available at the time of the submission of the Phase 1 Report in 25 June 2001.
Tariff Component Units Ruacana Van Eck Paratus Capacity N$/kW/week 11.1381 11.1381 11.1381 Energy:
Over whole output range c/kWh 30 Light fuel oil c/kWh 93 Heavy fuel oil c/kWh 46
3.4.2 Review NamPower has not, to our knowledge, submitted a detailed explanation on how the above rates were calculated and what assumptions were made. However, the tariffs should be calculated using the agreed tariff structures, revenue requirements and projected sales and generator performance levels.
A brief analysis of the proposed tariffs indicates that the power stations would exceed their budget sales revenue (which was calculated by NamPower using the avoided cost approach) even before energy sales are included. This indicates either incorrect rates or different assumptions. Furthermore, the 5.9 c/kWh charge for Ruacana�s electricity does not appear to be cost reflective considering that fuel cost is zero. Any rates that are considerably different from the short run marginal cost of
ELECTRICITY CONTROL BOARD NATIONAL ELECTRICITY TARIFF STUDY - FINAL REPORT
Page 41 of 186
EMCON – SAD-ELEC – ECON
the generator could distort dispatch decisions, which would result in higher production costs. It is possible to calculate tariff levels for each of the stations if certain performance assumptions regarding the generators are made. The assumptions are:
Performance Assumptions Ruacana Van Eck Paratus Total
Energy Production (GWh) 1 282 19 1 1 302
Installed Capacity (MW) 249 120 24 393
Plant Availability (%) 90% 80% 90% 87%
The revenue requirements for each of the generators are: Historic cost Revenue Requirement (N$ ‘000) Ruacana Van Eck Paratus Total
Fixed Cost 70 923 46 871 13 674 131 468
Variable Cost
Primary Fuel - 333 62 395
Variable O&M Costs12 909 123 3 1 234
Total (N$/MWh) 909 456 65 1 629
Based on the above information the tariffs can be calculated as follows:
As described earlier, ancillary service payments can be introduced to incentivise the power station personnel. The level of these payments can be set at a level that would be sufficient to motivate the staff. These payments should be offset by an equal reduction in capacity payments.
12 The variable O&M costs have been derived from our generating unit cost database.
ELECTRICITY CONTROL BOARD NATIONAL ELECTRICITY TARIFF STUDY - FINAL REPORT
Page 42 of 186
EMCON – SAD-ELEC – ECON
3.4.3 Recommendations We recommend that the ECB should:
! ensure that all parties agree on the assumptions (sales and performance levels) to be used to convert revenue requirements into rates.
! approach NamPower to update their tariff calculations based on the approved tariff structure and revenue requirement methodology. NamPower should submit detailed explanations and assumptions (including sales and performance levels) that were used to calculate the tariffs.
! review the tariff calculations once these have been updated.
Taking into account that Namibia�s ultimate goal of ESI reform is to liberalise the electricity industry and to allow market forces to set prices in the generation sector the ECB Consultants recognise that prices should, over time, be adjusted to reflect the depletion of the excess generating capacity in the region and the higher cost of new entrants as would be reflected in a competitive market. The reasons why a transition arrangement is required are that: ! This will reduce the anticipated price shock if new generating investment
decisions are made in Namibia. ! A fully competitive industry will provide generators with the opportunity to price
their electricity at market related rates.
ELECTRICITY CONTROL BOARD NATIONAL ELECTRICITY TARIFF STUDY - FINAL REPORT
Page 43 of 186
EMCON – SAD-ELEC – ECON
The present expectation is that the regional surplus of generation capacity will be exhausted over the next 6 to 8 years period. Accordingly, regulated generation prices in Namibia should be allowed to move from the level illustrated by a cost-based regulation on historic assets to the price level of new capacity in a competitive market over time. The calculated value for the average NamPower generation cost based on replacement cost of assets are close to the most recent regional estimates of the market price of new generation capacity (approximately 24 SAc/kWh). Hence, Namibian generation prices would be expected to move towards this level over the period until such new capacity is required. Based on today�s information, this would allow for an annual increase in the regulated cost-based generation cost of x% above the calculated price. The x%-factor can be reviewed regularly (e.g. biannually) to ensure that Namibian generation prices are moving towards the expected future market cost level, taking account of both the expected cost of new capacity and the timeframe when such capacity is needed.
ECB Tariff study : Phase 2 ECB / emCON / SAD-ELEC
Current and Future Generation Prices
0
5
10
15
20
25
2002 2003 2004 2005 2006 2007 2008 2009 2010
Av
era
ge
Re
al
Ra
te (
c/k
Wh
) fo
r 2
00
2
Historic Cost
Replacement Cost
Bridging the Gap (8% real/year)
ELECTRICITY CONTROL BOARD NATIONAL ELECTRICITY TARIFF STUDY - FINAL REPORT
Page 44 of 186
EMCON – SAD-ELEC – ECON
4 Review of NamPower's Proposed Transmission Tariffs
4.1 Review approach Industry experts are generally in agreement that the transmission function will remain a monopoly component even after competition has been introduced in the generation and retail ESI sectors. The regulation of transmission tariffs should therefore be based on recognised monopoly pricing methodologies. Transmission pricing should: ! enable non-discriminatory access to the networks, ! be fair, and ! send signals for the efficient use of the transmission infrastructure. The present review process has been structured in the same way as the Generation tariff review. The basic framework consists of three components to organise the flow of information and ideas into more manageable sections, they are: ! Tariff Structure, ! Revenue Requirements, ! Tariff Levels.
Each of the three main components are discussed in more detail by:
! reflecting on what NamPower has proposed,
! reviewing and analysing the proposal, and
! formulating a set of recommendations.
ELECTRICITY CONTROL BOARD NATIONAL ELECTRICITY TARIFF STUDY - FINAL REPORT
Page 45 of 186
EMCON – SAD-ELEC – ECON
4.2 Tariff structure 4.2.1 Proposal NamPower�s latest transmission tariff proposal is described in the document entitled NamPower Tariffs, dated 10 September 2001.
Our understanding of NamPower�s transmission tariff structure is that Supply Businesses will be charged using a demand component (N$/kVA) and energy component (c/kWh).
It is also proposed that generators and importers be charged for the usage of the transmission network based on energy charges (c/kWh) only.
No mention has been made of any basic or service charges (N$/month). The latest proposal also makes no reference to the use of extension charges for dedicated circuits (N$/annum).
NamPower�s proposed tariff components and structure are:
Tariff Component Unit Loads Generators
Basic/Service N$/month
Demand/Supply N$/kW
Demand N$/kVA #
Energy c/kWh # #
Extension charge N$/annum
Connection charge N$/annum
4.2.2 Review The size and timing of transmission investments are driven by customers� peak demands and generators installed capacities. The degree of energy utilisation (load factor) has a negligible influence over transmission investment decisions and expenditure.
The ECB Consultants believe that transmission tariff structure and components should encourage the efficient use of the transmission infrastructure. The introduction of a transmission energy charge will encourage higher peak demands and lower energy utilisation (load factors). Thus, we do not believe that an energy
ELECTRICITY CONTROL BOARD NATIONAL ELECTRICITY TARIFF STUDY - FINAL REPORT
Page 46 of 186
EMCON – SAD-ELEC – ECON
charge for transmission usage will promote efficient behaviour and usage and can therefore not support it.
We do recognise NamPower�s concern that transmission has, especially after recent investments, sufficient capacity to deal with demand for many years before new investments are required and that a high kVA charge at present may restrict growth.
However, rather than to introduce an energy charge the ECB Consultants prefer the use of a basic charge (N$/month) as a means to reduce the kVA charge, while still recovering sufficient revenues. At least this charge will remove the distortions of an energy charge on the generation sector. By inflating the kVA charge into the future customers will increasingly be exposed to a more cost reflective signal.
The same cost driver and efficiency arguments are also the reasons why we cannot support a pure energy charge to generators and importers for the use of the transmission system. In addition we also don�t believe that it will be perceived as a fair and cost reflective approach.
The principle to split the cost of the Tx backbone between generators and loads is supported. It provides incentives to both producers and consumers to minimize Tx backbone costs. However, there are no geographic differentiation charges. In other words, Tx charges are the same throughout the country, i.e. the postage stamp approach. This approach is simple to implement and politically easier to manage, but it does not provide locational signals to the users of the Tx network.
The current NamPower proposal does not make clear whether Extension (i.e. charge to customers for dedicated circuits) and Connection (i.e. charge to generators for substation) charges will still apply. We would support the use of these charges because it will reduce cross subsidisation and promote cost reflective charges.
It is also significant to note that the proposed structures do not make provision for line losses. The current proposal is to average the line losses to all consumers of electricity. Approximately 10% of production is lost through Tx line losses. This is high (because of the physical and electrical characteristics of Namibia and its particular power system), and consideration should be given to reflect line losses, perhaps on a zonal basis. Line losses could be introduced at the SB level, but we would encourage transmission to take ownership for the management of line losses.
4.2.3 Recommendations We recommend that the ECB should:
• support NamPower�s proposal to split transmission network charges between loads and generators/importers.
• promote the use of Basic or Service charges.
ELECTRICITY CONTROL BOARD NATIONAL ELECTRICITY TARIFF STUDY - FINAL REPORT
Page 47 of 186
EMCON – SAD-ELEC – ECON
• encourage the use of an Extension charge tariff component to charge customers for dedicated circuits.
• introduce an energy component to charge for line losses but not to recover transmission infrastructure costs.
• not adopt NamPower�s proposed transmission tariff components because these are not believed to be cost based and fair, and will certainly not encourage the efficient use of the transmission infrastructure. Our recommendations for the transmission tariff structure are:
Tariff Component Unit Loads Generators
Basic N$/customer/month # #
Demand/Supply N$/kW
Demand N$/kVA # #
Energy (losses only) c/kWh # #
Extension charge N$/annum #
Connection charge N$/annum #
4.3 Revenue requirement 4.3.1 Proposal NamPower has proposed to regulate transmission tariffs using a real pre-tax rate of return based on replacement asset values. Consequently, NamPower proposed the use of the following revenue requirement components and levels.
ELECTRICITY CONTROL BOARD NATIONAL ELECTRICITY TARIFF STUDY - FINAL REPORT
Page 48 of 186
EMCON – SAD-ELEC – ECON
Revenue Requirement Component Expense (N$ ‘000)
Salaries & Wages -
Operating & Maintenance -
Corporate Overheads -
Operating Expense13 71 393
Depreciation 72 377
Return 245 748
Total Revenue Requirement 389 518
4.3.2 Review NamPower�s proposed revenue requirement components are in line with standard pre-tax rate of return regulation methodologies and are fully supported. The following sections provide more detailed comments on the proposed expense levels.
Operating Expense
It is not possible to pass any meaningful comment of the proposed/derived value. It would be more sensible, from a review perspective, to comment on the individual expense components that make up the total operating expense number. These components include Salaries & Wages, Operating & Maintenance Expenditure and Overheads (administration costs). NamPower should be approached again to submit this detail information.
Please refer to the section that deals with Shared Approaches (section 7.1 on page 66) for a review of internal Corporate Overhead charges.
Asset Values and Depreciation
NamPower has proposed to include a depreciation component based replacement value of the assets.
NamPower has provided the following asset life values:
13 NamPower did not submit a projected Profit & Loss statement in the document titled Response to ECB Consultants
Information Request dated 7 August 2001. The number has been obtained in the Transmission Pricing section of NamPower’s document titled NamPower Tariffs dated 10 September 2001 and by subtracting the Single Buyer’s operating expense as shown in the financial statements of 7 August 2001.
ELECTRICITY CONTROL BOARD NATIONAL ELECTRICITY TARIFF STUDY - FINAL REPORT
Page 49 of 186
EMCON – SAD-ELEC – ECON
Life Years
Average Remaining Life 33
Average Life 47
Average Age of Assets 14
NamPower has proposed to use the Optimised Deprival Value (ODV) methodology to determine the replacement cost asset values and depreciation levels. The ODV approach attempts to identify the most efficient asset base to meet the requirements. Asset values in excess of the ODV asset value are then excluded from the return calculations. However, NamPower�s own analysis has not shown any difference between the ODV value and existing asset base. The proposed values are:
NamPower�s annual report reflects a replacement cost asset value of N$ 2 393 108 k and present day value of N$ 2 219 883 k at the end of June 2000. The increase of N$ 68 718 k in present day values over the last financial year seems reasonable in light of NamPower�s transmission construction program.
It is noted that the ODV method is difficult to implement and resource intensive to calculate and verify. It is also considered subjective. Given that NamPower�s own calculations did not identify any non-productive transmission assets, the additional value of the more complex process is questioned.
Return
It is generally accepted that the Transmission function will remain a monopoly activity and that its return should be subject to regulation. NamPower has accepted this principle and has suggested using:
• A real return, before interest and taxes, as a percentage of current net assets, as a yardstick to determine an appropriate level of return.
• The present day replacement cost asset value to calculate the return.
ELECTRICITY CONTROL BOARD NATIONAL ELECTRICITY TARIFF STUDY - FINAL REPORT
Page 50 of 186
EMCON – SAD-ELEC – ECON
• The Weighted Average Cost of Capital (WACC) methodology to define the appropriate rate of return. The proposed rate of return value is 9.97% (real before interest and tax on current assets).
We support the use of a pre-tax rate of return on present day replacement asset values to determine the regulated returns for transmission. It should be pointed out that the asset base should be adjusted to remove contributions from external organisations towards the development of the transmission network. The basis for this proposal is that NamPower should not earn a return on an investment it did not make. NamPower has indicated in its reply to the ECB Consultants that it has received external funding of N$68.2 million for its 66kV network.
Our calculation has shown that a real pre-tax ROR (WACC) value of 8.7% would be appropriate for NamPower transmission. For more detail on the calculation of the WACC value refer to section 7.4 on page 75.
Transmission Present Day Asset Value (N$ ‘000) WACC Return (N$ ‘000)
Value 2,288,601 Less: Subsidised networks 68 200
Net asset value for return calculations 2 220 401 8.7% 193 175
4.3.3 Recommendations We recommend that the ECB should:
• request NamPower to provide more details on the cost components that make up the total operating expense, and only accept these cost levels once the ECB has had an opportunity to review them.
• accept the proposed asset and depreciation values.
• not use the ODV to determine asset values.
• use a pre-tax rate of return value of 8.7% on present day replacement cost asset values to determine transmission�s regulated return.
ELECTRICITY CONTROL BOARD NATIONAL ELECTRICITY TARIFF STUDY - FINAL REPORT
Page 51 of 186
EMCON – SAD-ELEC – ECON
Revenue Requirement Component Expense (N$ ‘000)
Salaries & Wages -
Operating & Maintenance -
Corporate Overheads -
Operating Expense 71 393
Depreciation 72 377
Return 193 175
Total Revenue Requirement 336 945
• update the above values once tariff structures and revenue requirements have been agreed.
We understand from NamPower�s submission that above rates will result in total revenue of N$ 504 490 k14 for transmission, which is in excess of the revenue
14 The number has been obtained in the Transmission Pricing section of NamPower’s document entitled NamPower Tariffs
dated 10 September 2001.
ELECTRICITY CONTROL BOARD NATIONAL ELECTRICITY TARIFF STUDY - FINAL REPORT
Page 52 of 186
EMCON – SAD-ELEC – ECON
requirement of N$336 945 k as calculated by the ECB Consultants, excluding the SB costs. The SB is discussed in more detail in chapter 6.
4.4.2 Review If the revenue (N$ 504 mill) from the above rates is compared with the ECB Consultant�s calculation of transmission�s revenue requirement (N$ 337 mill) it is clear that transmission will over-recover. It would appear that the proposed rates for the loads have been set without recognising the revenue inflow from the generators.
NamPower�s calculation has also ignored any contribution from extension and connection charges.
As discussed in the transmission tariff structure review section we do not recommend an energy charge to recover the cost of network assets. The basis for a level of the energy charge has not been provided.
4.4.3 Recommendations We recommend that the ECB should:
• verify the numbers once all the financial statements and budgets have been finalised.
• Given the revenue requirements as determined in the previous sections we consider the following price levels to be appropriate and sufficient to recover transmission�s revenue requirement:
15 The number has been obtained in the Transmission Pricing section of NamPower’s document entitled NamPower Tariffs
dated 10 September 2001.
ELECTRICITY CONTROL BOARD NATIONAL ELECTRICITY TARIFF STUDY - FINAL REPORT
Page 53 of 186
EMCON – SAD-ELEC – ECON
Tariff Component Unit Loads Generators
Basic/Service N$/customer/month - -
Demand/Supply N$/kW/month - 9.02
Demand N$/kVA 59.18 -
Energy (for 10% losses)
c/kWh 1.0
Extension charge N$/annum ? -
Connection charge N$/annum - 5 590
ELECTRICITY CONTROL BOARD NATIONAL ELECTRICITY TARIFF STUDY - FINAL REPORT
Page 54 of 186
EMCON – SAD-ELEC – ECON
5 Review of NamPower's Proposed Distribution Tariffs
5.1 Review approach The review of NamPower�s distribution tariffs should be read in conjunction with our proposed distribution tariff methodology, and distribution tariff analysis chapters.
The review approach will follow the same format as for generation and transmission, and consists of sections covering Tariff Structure, Revenue Requirement and Price Levels.
5.2 Tariff structure 5.2.1 Proposal NamPower has essentially proposed two tariff structures for distribution customers. The separation between the two tariffs is based on the availability of demand meters at the customer�s premises.
The tariff structure for customers with a demand meter is:
• Basic/Service Charge (N$/month)
• Max demand charge (N$/kW/month or N$/kVA/month)
• Installed Capacity charge
• Energy price (c/kWh)
ELECTRICITY CONTROL BOARD NATIONAL ELECTRICITY TARIFF STUDY - FINAL REPORT
Page 55 of 186
EMCON – SAD-ELEC – ECON
The tariff structure for customers without a demand meter is:
• Basic/Service Charge (N$/month)
• Energy price (c/kWh)
• Installed capacity charge (N$/kVA)
5.2.2 Review The introduction of an installed capacity charge increases the complexity of record keeping and billing because customer installed capacity details must be managed individually. This will no doubt increase the transaction costs. These additional costs should be carefully weighed against the incremental value of introducing the charge. The charge is really only important when the decision to invest is made. Once the investment has been made the charge will remain fixed, similar to the monthly service charge. It is also difficult for customers to respond to this price signal once the investment has been made. In other words, the unbundling of the installed capacity charge will not lead to different consumption behaviour.
It is possible to keep transaction costs low and simplify tariff management, while retaining a degree of cost reflectivity, if customers are grouped into well-defined customer categories. Here, installed capacity is not the only consideration for defining customer categories; the load factor is another important factor, which is frequently used to differentiate between customers and to improve the cost of supply signals. The chapters covering the distribution pricing methodology and guidelines outlines the various steps and considerations needed to define customer categories.
5.2.3 Recommendations We recommend that the ECB should:
• encourage distributors to use the principles outlined in the distribution tariff methodology proposal to define their customer categories.
5.3 Revenue requirement 5.3.1 Proposal NamPower has proposed the following revenue requirement components and cost levels:
ELECTRICITY CONTROL BOARD NATIONAL ELECTRICITY TARIFF STUDY - FINAL REPORT
Page 56 of 186
EMCON – SAD-ELEC – ECON
Description Value (N$ ‘000)
Energy & Tx purchases 62 018
Operating & Maintenance 10 730
Customer Service 3 576
Corporate Overheads 38 246
Depreciation 13 690
ROA 33 300
Other charges (5 996)
Total 155 564
5.3.2 Review The proposed revenue requirement components are in line with standard costs (including a replacement cost depreciation charge) plus a reasonable rate of return based on a replacement cost asset base.
Transmission & Generation costs
The cost of energy purchases was based on NamPower�s 2001/2002 approved tariffs. Distribution�s revenue requirement could be revisited once the costs and tariffs for generation, transmission and the single buyer have been accepted.
O&M, Customer Service and Overheads
The appropriateness of cost levels for Operating & Maintenance, Customer Service and Corporate Overheads are difficult to verify in isolation. These charges should be evaluated once the ring-fencing exercise is complete and the cost allocation to the different groups of the administration costs have been accepted, refer to chapter 7 dealing with Shared Approaches.
Asset Values and Depreciation
Our understanding of NamPower�s distribution assets are reflected in the following table, noting that NamPower has proposed to include a depreciation component based replacement value of the assets.
NamPower has provided the following asset life values:
ELECTRICITY CONTROL BOARD NATIONAL ELECTRICITY TARIFF STUDY - FINAL REPORT
Page 57 of 186
EMCON – SAD-ELEC – ECON
Life Years
Average Remaining Life from calculations 20
Average age from calculations 12
Average expected life of Assets 32
The above values appear to be reasonable.
The above values appear to be consistent with previous submissions.
Return
The adopted approach is very similar to what has been suggested in the Transmission review chapter, i.e. chapter 4. More information about return calculations are provided in the chapters covering the proposed distribution tariff methodology, refer to section B of this Report.
NamPower has suggested using:
• A real return before interest and taxes, on present day asset values excluding subsidised assets.
• The Weighted Average Cost of Capital (WACC) methodology to define the appropriate rate of return. Our suggested rate of return value is 9.2% (real before interest and tax on current assets). NamPower has suggested using a value of 10.97%. For more detail on the calculation of the WACC value refer to section 7.4 on page 75.
Assets Replacement Cost N$ ‘000
June 2001
Present Day Value N$ ‘000
June 2001
Annual Depreciation
N$ ‘000 Calculated
Remaining Life
Total Distribution assets 438 000 285 000 13 690 20
Subsidised assets 113 000 83 000
Net Assets 325 000 202 000
ELECTRICITY CONTROL BOARD NATIONAL ELECTRICITY TARIFF STUDY - FINAL REPORT
Page 58 of 186
EMCON – SAD-ELEC – ECON
Transmission Present Day Asset Value (N$ ‘000) WACC Return (N$ ‘000)
Value 285 000 Less: Subsidised networks 83 000
Net asset value for return calculations 202 000 9.2% 18 584
Based on NamPower�s high (N$33 300 k) return value compared to our calculations we assume that they have not excluded the subsidised assets values from their return calculations. The reasons for excluding these assets are articulated in the chapters dealing with the proposed distribution tariff methodology, refer to section B.
Our suggested revenue requirement components and levels are:
Description Value (N$ ‘000)
Energy & Tx purchases 62 018
Operating & Maintenance 10 730
Customer Service 3 576
Corporate Overheads 38 246
Depreciation 13 690
ROA 18 584
Other charges (5 996)
Total 140 848
5.3.3 Recommendations We recommend that the ECB should:
• accept the proposed revenue requirement components.
• update the cost levels for transmission and energy purchases once the generation, transmission and single buyer tariffs have been confirmed.
• update the distribution tariffs once the ring-fencing results for Operating & Maintenance, Customer Service and Corporate Overheads have stabilised.
• expect that distributors exclude subsidised assets from the rate base when they calculate regulated returns.
• consider a pre-tax real WACC value of 9.2%.
ELECTRICITY CONTROL BOARD NATIONAL ELECTRICITY TARIFF STUDY - FINAL REPORT
Page 59 of 186
EMCON – SAD-ELEC – ECON
5.4 Tariff level(s) 5.4.1 Proposal The average distribution tariff level based on NamPower�s proposal is:
Total Dx revenue requirements (N$ ‘000)
Expected Sales (GWh) Average Rate (c/kWh)
155 564 229 .2 67.8
5.4.2 Review The average distribution tariff level based on NamPower�s proposal is:
A detailed review of the different price components and their levels are provided in the distribution tariff analysis, refer to section C.
5.4.3 Recommendations We recommend that the ECB should:
• establish the regulatory framework and support the proposed distribution pricing methodology.
• allow the distributors to follow the guidelines proposed in this Report in determining their tariff levels.
Total Dx revenue requirements (N$ ‘000)
Expected Sales (GWh) Average Rate (c/kWh)
140 848 229 .2 61.4
ELECTRICITY CONTROL BOARD NATIONAL ELECTRICITY TARIFF STUDY - FINAL REPORT
Page 60 of 186
EMCON – SAD-ELEC – ECON
6 Review of NamPower's Proposed Single Buyer Tariffs
6.1 Tariff Structure 6.1.1 Proposal NamPower has not yet finalised its position on the SB tariff.
6.1.2 Review There are essentially three ways to structure the SB selling tariff, which are:
• as a flat energy charge (c/kWh),
• as a time-of-use energy charge (c/kWh), or
• as a capacity charge (N$/kVA) plus energy charge (c/kWh).
We believe that the latter option is more appropriate for the SB structure. Our reasons include:
• It better reflects the cost of supply and will therefore encourage the efficient use of energy.
• It reduces the financial risk which could arise if the SB purchases capacity and energy from the generators and then has to recover is purchasing cost through energy charges only.
ELECTRICITY CONTROL BOARD NATIONAL ELECTRICITY TARIFF STUDY - FINAL REPORT
Page 61 of 186
EMCON – SAD-ELEC – ECON
6.1.3 Recommendations We recommend that the ECB should:
• note that NamPower�s proposed tariff structure is easy to implement but does not encourage the efficient use of electricity, and would increase the SB�s exposure to financial risk.
• consider that there are several other tariff structure options available which could be employed to sell the SB�s electricity.
• point out that it has initiated a separate project that will concentrate on the establishment of the SB. That project will also address the various trading arrangements as well as their pro�s and con�s. This process will provide more clarity on what the appropriate SB tariff structure should be.
6.2 Revenue requirement 6.2.1 Proposal It has been suggested that the revenue requirement of the SB will consist of three main parts. The first part reflects the operating cost of the SB, the second is for the use of the Tx backbone costs by the import and export functions, and the third set is the costs of the imported energy.
The proposed SB costs are summarised in the following table.
The proposed transmission network charges to be borne by importers are shown below. A more thorough review of these charges are presented in Review of NamPower's proposed internal transmission charges on page 71.
ELECTRICITY CONTROL BOARD NATIONAL ELECTRICITY TARIFF STUDY - FINAL REPORT
Page 62 of 186
EMCON – SAD-ELEC – ECON
Allocation Ruacana Van Eck Paratus SB (Import) Total
% of shared backbone costs (based on production) 16
60% 0% 0% 40% 100%
Tx costs (N$ 000) 59 913 - - 39 942 99 855
Dedicated costs (HV Yard) 5 196 5 196
Total 65 109 - - 39 942 105 051
NamPower has indicated that the average cost of imported electricity is 7.29c/kWh. This equates to N$90 250 k if it is assumed that 1 238 GWh17 would be imported during the period 2001/2002.
6.2.2 Review
Single Buyer Costs
The proposed revenue requirement components are supported. However, it is difficult to benchmark the level of the expenses without a better understanding of the ultimate structure and responsibility of the SB and the definition and content of some of the cost components. It is expected that some of these outstanding issues will be addressed during the ECB initiated SB Market Study to establish the SB.
Energy and Wires Costs
The SB will be responsible to purchase electricity from the NamPower generators. The revenue requirements from these stations have been discussed in detail in the Generation tariff review chapter, refer to chapter 3.
We agree with NamPower�s proposal that the cost of imports consists of two components. The first is purchase cost of the imported electricity, and NamPower�s proposed 7.29 c/kWh appears to be in line with our estimates. The second cost component represents the Tx cost allocated to the importers for the use of the network. See the detail discussion of the review and derivation of these expenses in the section titled Review of NamPower's proposed internal transmission charges on
16 Based on the proposed 60/40 split between Ruacana and the Importers respectively.
17 Import GWh number was estimated by assuming a 2.5% per year growth rate on the total 1999/2000 annual report Units into System number. Allowance was made for production from Ruacana (1 045 GWh - production for typical year) and Van Eck (19 GWh) and Paratus (1 GWh) based on the average production for the 1999 and 2000 as for these two stations as stated in NamPower’s annual report.
ELECTRICITY CONTROL BOARD NATIONAL ELECTRICITY TARIFF STUDY - FINAL REPORT
Page 63 of 186
EMCON – SAD-ELEC – ECON
page 71. In summary we recommend that the SB should be responsible for N$ 51 235 k. Refer to the table below for final Tx cost allocations between the different producers:
Allocation Ruacana Van Eck Paratus SB (Import) Total
As previously discussed we prefer a SB tariff structure that encourages the efficient use of electricity and reduces the exposure to financial risk. This would mean that the SB�s revenue requirement should be split into both fixed and variable components.
It would only be possible to calculate these tariffs once the costs and return methodologies for generation and transmission have been finalised.
6.3.3 Recommendations We recommend that the ECB should:
ELECTRICITY CONTROL BOARD NATIONAL ELECTRICITY TARIFF STUDY - FINAL REPORT
Page 65 of 186
EMCON – SAD-ELEC – ECON
• encourage the development of a SB tariff structure that will promote the efficient use of electricity.
• ensure that the SB project addresses the issue of the SB selling price structure.
• update the SB tariff levels once the principles and methods have been established.
ELECTRICITY CONTROL BOARD NATIONAL ELECTRICITY TARIFF STUDY - FINAL REPORT
Page 66 of 186
EMCON – SAD-ELEC – ECON
7 Shared Approaches
There are a number of NamPower�s positions, which are common to the various Business Units� tariff proposals. Rather than repeat each of the reviews it was decided to centrally capture these.
7.1 Review of NamPower's proposed internal corporate service charges
7.1.1 Proposal NamPower has proposed to allocate the cost of the Corporate Departments to the following groups (Generation, Transmission, Distribution and SB) based on the following percentages19.
Division Generation Transmission Distribution SB
MD Office 28% 40% 25% 7%
Engineering Services 18% 53% 27% 2%
Human Resources 56% 17% 25% 2%
Finance 20% 47% 31% 2%
Marketing 5% 6% 89% 0%
Information Systems 55% 10% 26% 9%
Legal 25% 25% 25% 25%
Investments 9% 23% 53% 15%
19 The proposal has reached the ECB Consultants on 12 November 2001 and there has not been an opportunity to obtain
additional information from NamPower.
ELECTRICITY CONTROL BOARD NATIONAL ELECTRICITY TARIFF STUDY - FINAL REPORT
Page 67 of 186
EMCON – SAD-ELEC – ECON
It has further been proposed to allocate the Generation component of the overhead costs to the different power stations using the following percentages:
Allocation Ruacana Van Eck Paratus Total
Gx�s component of admin costs to be allocated as follows 50% 30% 20% 100%
Unfortunately, NamPower did not provide the methodology and assumptions to explain how these percentages were determined, and no N$ values for the divisions have been submitted.
7.1.2 Review In principle, line groups should pay for the use of Corporate Services. However, from the ECB�s point of view, it is important to ensure that:
• All the overhead functions are necessary to support the line groups in performing their work efficiently.
• All the overhead costs are prudent (in other words that the internal support functions are equal to or better in terms of costs and quality than outside companies).
• The cost of corporate services provided to NamPower Investments (non regulated business) is excluded in the tariff calculations.
Such an assessment can only be made after reviewing the results of a proper benchmarking study, which falls outside the scope of this Study.
Without a comprehensive Activity Based Costing (ABC) system it is difficult to precisely allocate the costs to each of the groups. Such a system came into operation in NamPower from 1 July 2001. This system should improve the accuracy of cost allocation over the next few years
A detailed assessment of NamPower�s proposal can only be completed once NamPower has provided the requested information. However, the 15% investment cost component allocated to the SB appears high.
7.1.3 Recommendations We recommend that the ECB should:
ELECTRICITY CONTROL BOARD NATIONAL ELECTRICITY TARIFF STUDY - FINAL REPORT
Page 68 of 186
EMCON – SAD-ELEC – ECON
• request NamPower to provide an explanation for the methods and assumptions that were used in calculating the percentages for the allocation for corporate overhead costs as well as the cost (N$) values for each division. A brief explanation of the duties of each division would be helpful.
• only consider accepting the proposed values once NamPower has submitted the requested information.
• perform a final review of the proposed methodology and allocation percentages for the stations once more detail information has been received.
• review the results from the ABC accounting system and adjust the allocation between the line groups and the stations accordingly.
• initiate (at a later stage) a benchmarking project to determine whether the price and quality of NamPower�s Corporate services are equal to or better than what could be obtained in the market.
7.2 Regulatory approach This section briefly explores the different regulatory approaches to a cost based regulated (monopoly) business. These approaches are discussed in more detail in the section B, in particular the paragraphs on Asset Valuations, Rate of Return/Cost of Capital and Depreciation Rate.
In summary the approaches are:
! Historic cost valuation using either a nominal or a real Weighted Average Cost of Capital (WACC) return based on either before or after tax values.
! Replacement cost valuation using either a nominal or a real Weighted Average Cost of Capital (WACC) return based on either before or after tax values.
! CPI-X (i.e. a form of incentive based regulation)
! Avoided Costs
The CPI-X approach should at the earliest be considered after the first period of revenue requirements (using either historic- or replacement-cost valuations) have been completed, implemented and reviewed.
The avoided cost approach has been used widely in the electric utility industry to determine the attractiveness of making a particular investment decision. The approach involves considering all the supply and demand options to identify the least cost options to meet the next incremental increase in demand. The least cost options
ELECTRICITY CONTROL BOARD NATIONAL ELECTRICITY TARIFF STUDY - FINAL REPORT
Page 69 of 186
EMCON – SAD-ELEC – ECON
are the used to calculate the avoided cost curve. Other investment options are then evaluated against this curve.
An interesting characteristic of the historic cost based approach (especially in an inflationary environment) is that the facility�s revenue requirement reduces over time in real terms. The main reason for this is that the asset and depreciation values are shown at the time when the asset was built or acquired. In other words there is no inflationary adjustments for the depreciation and ROR components in the revenue calculation. The graph below demonstrates the reduction, in real terms, in the costs of a facility because of the historic cost valuation approach.
It should be noted that the cost structure of a PPA agreement, which has been structured using project finance principles, would show the same declining trend in real terms as that of the historic cost based asset approach.
Therefore, the historic cost valuation would tend to understate the value of the product (if produced from a relatively old facility) compared to what it would cost to produce the same product from a new facility. This would require substantial price hikes at the time when the next investment decision is made. Price increases in the industry will be �choppy� and the size of the real price adjustments can be considerable if periods between investments are long. Refer to the graph below for an illustration of the choppy cost/price requirements in the industry.
ECB Tariff study : Phase 2 ECB / emCON / SAD-ELEC
Real price of Historic Cost Valuation Approach(Illustrative Example)
ELECTRICITY CONTROL BOARD NATIONAL ELECTRICITY TARIFF STUDY - FINAL REPORT
Page 70 of 186
EMCON – SAD-ELEC – ECON
This has prompted several regulators to adopt a replacement cost based approach that removes the inflationary effect on the asset values and smoothes the costs and therefore prices in the industry.
This approach is particularly useful when a single company is responsible to make all future investments. In this case it would make sense to pay the company a rate (based on replacement asset values) to smooth out the fluctuating costs. In other words the company�s financial structure (in particular the level of debt) is used as a �shock absorber � to counteract cost fluctuations.
Maintaining stable prices over time when no generating company holds the obligation to supply is more challenging. This is the situation that is foreseen with the introduction of a SB in Namibia. In such an instance it does not make sense to inflate a generator�s price above its historic cost based valuations if there is no guarantee that the generator will use the �extra� money to off-set future investment costs thereby smoothing prices. In other words when no market player carries the obligation to supply then the prices paid to generators can�t be based on replacement asset valuations.
This raises the problem again that prices to consumers would start to fluctuate if all generators are compensated based on historic cost valuations. A potential solution, at least in principle, is to de-link prices paid to generators and prices paid by consumers. Prices paid the generators should be based on historic cost valuations and prices paid by consumers could be based on replacement asset valuations. The difference in price could be paid over to the entity that holds the obligation to supply in the industry.
ECB Tariff study : Phase 2 ECB / emCON / SAD-ELEC
Real price of Historic Cost Valuation Approach(Illustrative Example)
0 2 4 6 8 10 12 14 16 18 20 22 24 26 28 30 32
Yea r s ince first investm ent
Av
era
ge
Co
st
(c/
kW
h)
Investments
ELECTRICITY CONTROL BOARD NATIONAL ELECTRICITY TARIFF STUDY - FINAL REPORT
Page 71 of 186
EMCON – SAD-ELEC – ECON
7.3 Review of NamPower's proposed internal transmission charges
7.3.1 Proposal The values for internal transmission charges have changed several times while the review has been carried out. It was not always clear to the ECB Consultants whether the changes were due to updated costs or due to methodology changes. Our understanding of what NamPower is proposing, based on information pieces from several document, are outlined in the tables below:
Splitting of Tx Revenue Requirement N$ ‘000
Tx total revenue requirement 389 519
Less: Common service component 50 713
Asset related cost to be recovered 338 806
The asset related cost to be recovered is then split between the different asset parts based replacement cost values:
Asset Parts Replacement cost % Allocation of Tx asset
related cost Regional Areas 1 252 548 39% 131 403
Tx Backbone 1 926 892 60% 202 145
Ruacana 50 127 1.5% 5 258
Total 3 229 56720 100% 338 806
NamPower has further proposed that that generators and loads ( the Tx customers) share the costs of the Transmission backbone cost equally (on a 50/50 basis). In addition, the generators and loads will pay their respective dedicated infrastructure costs. The loads will also be responsible to pay for the Tx common service charge. The proposed charges are:
20 This value is slightly different from the transmission replacement value shown in the transmission review
chapter. We have used the latest values available but it points to inconsistencies in the data sets. This could be attributed to NamPower still refining their costs. Inevitably these differences cause room for errors and should eventually not be tolerated.
ELECTRICITY CONTROL BOARD NATIONAL ELECTRICITY TARIFF STUDY - FINAL REPORT
Page 72 of 186
EMCON – SAD-ELEC – ECON
Cost Component (N$ 000 – ‘01/’02) Generators Loads Total
* There are slight difference between the numbers shown in the above table and those in the table before. Again this could be attributed to data inconsistencies due work in progress situation. Eventually data sets should become more stable and consistent.
In the earlier submissions NamPower indicated that the transmission charges owned by generators should be shared based on a contribution to peak load methodology. Their latest proposal suggests that the cost be allocated on the level of production. Our understanding and interpretation of NamPower�s latest proposal yields the following results:
Allocation Ruacana Van Eck Paratus SB (Import) Total
% of shared backbone costs (based on production) 21
60% 0% 0% 40% 100%
Tx costs (N$ 000) 59 913 - - 39 942 99 855
Dedicated costs (HV Yard) 5 196 5 196
Total 65 109 - - 39 942 105 051
7.3.2 Review It is not clear how NamPower has determined a Common Service charge of N$ 50 713. The suggestion to charge producers (generators and importers) 50% of the Tx backbone costs for the use of the Transmission network is practised elsewhere and
21 Based on the proposed 60/40 split motivated by the energy production between Ruacana and the Importers respectively.
ELECTRICITY CONTROL BOARD NATIONAL ELECTRICITY TARIFF STUDY - FINAL REPORT
Page 73 of 186
EMCON – SAD-ELEC – ECON
is supported. The inclusion of a dedicated infrastructure charge is also supported. The purpose of these charges is to send a price signal to the new generators indicating the cost to integrate them into the system and thereby influencing location decisions.
We would have preferred a proposal whereby producers would pay different costs for the use of the Tx backbone depending not only on their size but also on their geographic position. In our opinion this is an important cost signal given the large distances between generators and loads. This economic signal would provide a benefit to those generators who can position themselves close the load centres. A geographically differentiated Tx backbone charge for generators will improve quality of supply, reduce line losses and promote efficient investment decisions, and potentially avoid/defer large capital investments in the Tx backbone.
If the same methodology is used as suggested by NamPower but with our updated transmission revenue requirement as described in the transmission section then the values are:
Splitting of Tx Revenue Requirement N$ ‘000
Tx total revenue requirement 336 945
Less: Common service component 50 713
Asset related cost to be recovered 286 232
If the asset related costs to be recovered are split in same way as proposed by NamPower then the asset related costs become:
Asset Parts Replacement cost % Allocation of Tx asset related cost
Regional Areas 1 252 548 39% 111 012
Tx Backbone 1 926 892 60% 170 778
Ruacana 50 127 1.5% 4 442
Total 3 229 567 100% 286 232
ELECTRICITY CONTROL BOARD NATIONAL ELECTRICITY TARIFF STUDY - FINAL REPORT
Page 74 of 186
EMCON – SAD-ELEC – ECON
The updated costs allocations are: Cost Component (N$ 000 – ‘01/’02) Generators Loads Total
NamPower�s proposal to split transmission costs between producers based on the production will not result in stable price signals that reflect the cost to integrate these producers into the transmission network. Both Paratus and Van Eck use the network to provide ancillary services and emergency energy when needed. It would therefore appear unfair not to charge them for being fully integrated into the network.
A further concern with the proposed method is that the inter-connectors are presently not fully loaded during peak periods. This would cause NamPower plant to carry a disproportionate percentage of the Tx costs allocated to generators and would distort price signals. The following table that shows how the production percentages could change over the next 2 years highlights this.
Allocation Ruacana Van Eck Paratus SB (Import) Total
Production 2000 (GWh)22 1 396 11 0 785 2 192
% of Total Production 63% .5% 0.0% 36.5% 100.0% Expected Production 2002 (GWh) 1 04510 1911 111 1 23817 2 303
% of Total Production 45.4% .8% 0.0% 53.8% 100.0%
The main cost driver for Tx to integrate a power station into the network is the station�s installed capacity. Therefore, rather than to use the contribution to the system peak demand, which is a volatile definition, it is suggested to link the charge to installed capacity.
22 Production numbers from NamPower’s 2000 annual report.
ELECTRICITY CONTROL BOARD NATIONAL ELECTRICITY TARIFF STUDY - FINAL REPORT
Page 75 of 186
EMCON – SAD-ELEC – ECON
Our proposed transmission network charges, based on installed capacity rather than on contribution to peak demand, taking the updated cost allocations into account (as shown in the previous table) is shown below:
Allocation Ruacana Van Eck Paratus SB (Import) Total
7.3.3 Recommendations We recommend that the ECB should:
• support the proposal to charge producers (generators and importers) for half of the Tx backbone cost.
• enhance the concept of charging producers for the use of the Tx backbone costs; a geographic differentiated charge should be introduced to encourage future generators to locate near load centres.
• verify the values once the financial statements have been finalised.
7.4 Weighted average cost of capital (WACC) calculations
7.4.1 Proposal NamPower has proposed that the Rate of Return (%ROA) be set equal to NamPower�s Weighted Average Cost of Capital (WACC).
ELECTRICITY CONTROL BOARD NATIONAL ELECTRICITY TARIFF STUDY - FINAL REPORT
Page 76 of 186
EMCON – SAD-ELEC – ECON
Where;
Kd = Rf +Dp
Ke = Rf(1-T) + MRP*Be
Be = Ba(1+B/S)
The descriptions of these parameters and there proposed are values are:
Parameters Gx Tx Dx
L = Target debt to equity ratio (1:1) 50% 50% 50%
Rf = Risk free interest rate (taken as SA Government R150 bond rate)
13.87% 13.87% 13.87%
Dp = Debt premium (estimate of what NamPower would have to pay extra)
1.0% 1.0% 1.0%
MRP = Market Risk Premium (This is based on a 7% value in Australia & New Zealand plus a 3% premium for country risk).
10% 10% 10%
B/S = Debt to Equity ratio as implied by L above 50% 50% 50%
T = Corporate tax rate 35% 35% 35%
Ba = Asset Beta 0.5 0.25 0.35
The suggested WACC values are:
Weighted Average
Cost of Capital Purpose Tx Dx Gx
Pre-tax Real WACC To determine allowable revenue 9.97% 10.97% N/A
Post-tax Nominal WACC
To value each of the businesses 11.84% 12.54% 13.75%
7.4.2 Review All the above values and assumptions appear reasonable except for the country risk premium of 3%. Country risk is actually reflected in the risk free rate for the country. We suspect the proposed 3% rate is an allowance for regulatory risk. It should be borne in mind that the WACC value should guide the shareholder on what returns
ELECTRICITY CONTROL BOARD NATIONAL ELECTRICITY TARIFF STUDY - FINAL REPORT
Page 77 of 186
EMCON – SAD-ELEC – ECON
can be expected on investments. It is therefore the shareholder�s prerogative to define an appropriate Market Risk Premium inclusive of a country risk premium. In the case of NamPower the shareholder is also the Government of Namibia who, through its policies, effectively controls country risk. In other words, a Government should strictly speaking, if it believes in its own economic policies, not expect to be compensated for country risk on investments in its own country. In addition there is also no vision to privatise NamPower, which removes the need for country (market) risk.
It is therefore not recommended to include a 3% premium for country risk. This position, if not agreed to by NamPower, should ultimately be referred to the Government for input and comment.
The Gx asset beta value, which is an indication of industry risk, has been based on generating companies in competitive environments. The asset beta for Generation should only be adjusted up to the 0.5 level once customer choice has been introduced in the generation sector. It should be noted that PPA agreements effectively transfer industry risk away from the generator to the SB. The generator can therefore not be compensated for taking risk.
A reduction in the country risk premium and generation�s asset beta value will reduce the WACC values.
Our WACC calculations, using the same assumptions as NamPower (except for a 3% country/regulatory risk) and 6.5% inflation, yield the following results:
Weighted Average Cost of Capital Purpose Tx Dx Gx
Pre-tax Real WACC To determine allowable revenue 8.7% 9.2% 9.9%
Post-tax Nominal WACC
To value each of the businesses 10.2% 10.6% 11.1%
The above results, if compared to some international benchmarks shown in the table below, indicate that NamPower�s returns would compare very favourably.
ELECTRICITY CONTROL BOARD NATIONAL ELECTRICITY TARIFF STUDY - FINAL REPORT
Page 78 of 186
EMCON – SAD-ELEC – ECON
7.4.3 Recommendations We recommend that the ECB should:
• accept the proposed methodologies, but that the market risk premium is lowered from 10% to 7% to exclude the country risk premium.
• use the following values to calculate the regulated returns for each business: Weighted Average
Cost of Capital Purpose Tx Dx Gx
Pre-tax Real WACC To determine allowable revenue 8.7% 9.2% 9.9%
7.5 Taxes 7.5.1 Proposal NamPower has proposed that the tax expenses not be included in the revenue requirement calculations of the Transmission group. However, they did recommend
Regulated Returns for some International Electricity Industries in 2000
Pre-taxNominal8.5Return on net fixed assetsPortugal � Trans
Post-taxReal5.6Return on invested CapitalItaly � Trans
Post-taxReal7.4Return on invested CapitalItaly � Dist
Pre-taxNominal7.0Return on net fixed assetsPortugal � Dist
Post-axNominal4.4Return on capitalJapan
Pre-taxReal6.5Cost of capitalUK � Dist & Trans
Post-taxNominal13.5Return on net fixed assetsHong Kong
Pre-taxReal10 (+-4)Return on net fixed assetsChile - Dist
Pre-taxReal7.0 � 8.2Cost of capitalAustralia
Pre/post-taxReal/ Nominal
Specified Return (%)Return BasisCountry &
Industry
Source: Deutsche Bank
ELECTRICITY CONTROL BOARD NATIONAL ELECTRICITY TARIFF STUDY - FINAL REPORT
Page 79 of 186
EMCON – SAD-ELEC – ECON
that that the official tax rate of 35% be used in determining the Weighted Average Cost of Capital value.
7.5.2 Review Our recommended approach is to regulate returns for Gx, Tx and Dx based on pre-tax rate of return values. Tax expenses are therefore excluded from revenue requirements. A pre-tax rate of return method is preferred because it avoids the complexities of accounting rule changes and the calculation of deferred taxes. A pre-tax return regulation is also more stable and consistent, which adds to investor confidence.
7.5.3 Recommendations We recommend that the ECB should:
• regulate tariffs on a before interest and tax basis. Then the only relevant consideration is to ensure that the correct tax rate is applied for the WACC calculations.
7.6 NamPower cash reserves 7.6.1 Background NamPower currently holds short-term investments to the value of approximately N$ 900 million. The company received $135 million interest on this investment amount in 2000.
The question should be raised how this investment and its proceeds influences the NamPower tariff proposal.
NamPower was able to build this large cash reserve since Namibia obtained its independence. NamPower effectively acquired the electricity assets from South Africa at no cost. However, the electricity prices in Namibia were not lowered to reflect the substantially reduced costs (payment to South Africa for depreciating and finance charges fell away). This created a windfall situation whereby NamPower was able to accumulate cash reserves. The cash therefore came from contributions from the electricity consumers in Namibia.
The intent has always been to utilise the cash to finance NamPower�s future capital expenses. In doing so NamPower finance charges will be kept to a minimum and contribute towards lower overall tariffs.
ELECTRICITY CONTROL BOARD NATIONAL ELECTRICITY TARIFF STUDY - FINAL REPORT
Page 80 of 186
EMCON – SAD-ELEC – ECON
However, the expansion of the 400kV Tx system has shown that other finance options, such as European aid instruments, could under certain circumstances cost less than to use NamPower�s own cash reserves.
Thus, so far nobody (shareholder, customer or NamPower) has gained any substantial benefit from the company�s windfall gains. The challenge is to share the benefit between the stakeholders in fair and equitable way.
7.6.2 Proposal NamPower has argued that this money should be viewed as un-regulated and should be handed over to NamPower Investments where it will be used to invest in �electricity related industries�. This proposal effectively removes any benefit to current or future electricity consumers in Namibia and puts the cash reserves at increased risk compared to a situation where they are invested in the regulated business.
7.6.3 Review This is obviously a complex and political challenge, and the solution will in all likelihood be �negotiated� at a political level.
In summary the main stakeholder views appear to be:
• It could be argued that the electricity consumers have enabled NamPower to accumulate these reserves and they should somehow (via lower tariffs, more infrastructure investments) receive a return. In this case there would be no direct benefit to the shareholder or NamPower.
• The shareholder could argue that this money belongs to him/her and that the shareholder could extract it via a dividend payment. In this event neither the customer nor NamPower will receive any benefit.
• NamPower could argue that they can use the money to invest in new business and maximise the returns. In this proposal there are no direct gains for either the consumer or the shareholder, and funds can leave the regulated environment. However, this strategy is also a shareholder decision, not a management decision.
A possible solution could be to divide the cash reserves equally between the stakeholders (Government & Customer). The consumer�s share of the benefit could be passed on in many different ways. For example
• A once off tariff reduction/rebate.
• Investments in infrastructure (electrification).
ELECTRICITY CONTROL BOARD NATIONAL ELECTRICITY TARIFF STUDY - FINAL REPORT
Page 81 of 186
EMCON – SAD-ELEC – ECON
• Make investments and use the proceeds to subsidise the price to poor rural communities.
• Invest in NamPower Investments.
• A combination of the above.
This proposal creates sufficient flexibility for the Government of Namibia and the representative of the customers to, if they wish, re-invest their share of the reserves into NamPower Investments.
7.6.4 Recommendations We recommend that the ECB should:
• discuss the issue with representatives from Government, NamPower and the customers.
• In line with corporate governance, it is expected that the NamPower Board should make a recommendation to the shareholder for approval / disapproval.
ELECTRICITY CONTROL BOARD NATIONAL ELECTRICITY TARIFF STUDY - FINAL REPORT
Page 82 of 186
EMCON – SAD-ELEC – ECON
8 Review of NamPower's Extension Charges
8.1 Present practice NamPower has been practising a pricing strategy with active use of rental charges, implying that very few customers pay the same price. These charges require NamPower customers to pay for the use of the networks, and include:
• an interest component of 14% of investment cost for the capital outlay,
• a 5% of investment cost operating & maintenance charge which includes depreciation,
• the charge is retained in perpetuity.
8.2 Proposal NamPower has suggested that they wish to move away from present practice. The new Connection charge will apply to new customers and will be calculated on an individual basis, and:
• be based on a 14% annuity charge. Our understanding is that the annuity charge is to recover the interest component of the capital expenditure NamPower had to incur to establish the infrastructure, and
• will not include any O&M or depreciation costs.
8.3 Review The rental charge pricing methodology can be regarded as unfair because customers effectively pay twice for O&M charges, once in the basic cost structure (the circuits were included in the value of the asset base and
ELECTRICITY CONTROL BOARD NATIONAL ELECTRICITY TARIFF STUDY - FINAL REPORT
Page 83 of 186
EMCON – SAD-ELEC – ECON
subsequent return calculations) and secondly in the extension charges (5% of investment costs approximates a separate depreciation charge). The fact that the charge was applied indefinitely is also seen as unjust because the relevant circuits may or may not be replaced at the end of their accounting life. The latest connection charge proposal is a vast improvement on the current practice and will ensure that customers are not over charged.
8.4 Recommendations We recommend that the ECB should:
• accept the new connection charge proposal.
• What should be explored in more detail is whether a standard connection fee (or a number of connection fees for different customers / customer situations) could be introduced instead of a site/customer specific extension charge. There are pros and cons to this approach, but administrative simplicity and transparency are also important, and not only maximum cost-reflectivity.
ELECTRICITY CONTROL BOARD NATIONAL ELECTRICITY TARIFF STUDY - FINAL REPORT
Page 84 of 186
EMCON – SAD-ELEC – ECON
Section B: Proposed Distribution Tariff Methodology
ELECTRICITY CONTROL BOARD NATIONAL ELECTRICITY TARIFF STUDY - FINAL REPORT
E
9 Principles of Distribution Tariffs
This introductory chapter will look at the broad objectives of distribution tariffs, and look at general pricing models and international practice. In the next chapter we explore in more depth the principles behind distribution tariff methodology and some of the issues that need to be considered. We then go on in the subsequent chapter to outline a tariff methodology that is consistent with the regulatory and economic requirements. This is supported by an annex outlining the Irish distribution charges (refer to Appendix D), which have a similar set of criteria and tariff structure.
9.1 Scope of tariffs This Report is intended to develop a general methodology for setting distribution tariffs in Namibia. It is important, therefore, that we are clear about what we mean by distribution.
Distribution is defined as the activities that fall between transmission of electricity and its retail or supply to end-users. In other words, it is the operation of the wires network between the
Figure 9.1 Electricity supply chain
Generation
Page 85 of 186 MCON – SAD-ELEC – ECON
transmission grid and the consumers� meter. The accompanying figure provides a schematic view. Distribution does not include the retail or supply of electricity, which is the marketing and sales side of the electricity business. While competition can occur within retail/supply, it is generally not the case with distribution. Distribution is considered a natural monopoly since it is not desirable to have parallel distribution networks as this leads to a wasteful allocation of limited resources (so called
Supply/retail(large users)
Supply/Retail
Distribution
Transmission
ELECTRICITY CONTROL BOARD NATIONAL ELECTRICITY TARIFF STUDY - FINAL REPORT
Page 86 of 186
EMCON – SAD-ELEC – ECON
inefficient bypass). As a natural monopoly, distribution needs to be regulated. In Namibia it is anticipated that distribution and retail activities will be merged for some time to come. Consequently, distribution tariffs should cover both the distribution and supply/retail elements of the value chain.
End-user tariffs where there is retail competition Where there is competition in supply/retail, it is necessary to have separate tariffs for distribution, the so-called Distribution-Use-of-System (DUOS) charges. The customer then pays two sets of charges:
Power supply charges, which generally reflect the costs of generation, transmission and supply/retail. In some cases (particularly for the largest users), these charges may be further separated. For example, charges levied by the transmission company (for transmission costs) and charges levied by the supply company (for generation and retail).
DUOS charges, to reflect the costs of distribution, including assets, losses, operating and maintenance and any customer services associated with the distribution network.
End-user tariffs where there is no retail competition Where there is no competition in retail, then the customer is just charged by his local distribution company for all elements of the cost chain. In other words, there is just one set of tariffs which covers all cost elements. This is likely to be the case for most consumers in Namibia for some time in the future. Nevertheless, in the interests of transparency as well as in preparation for the future introduction of competition, it is still useful to develop tariffs charged by the distributor that separately reflect the different elements. It is common to have two sets of charges:
Power supply charges, which comprise the costs of generation and transmission, and adjusted for losses across the distribution network.
Distribution charges, which comprise the costs of the distribution network and customer services. In addition, there may be a cross-subsidy adjustment on either or both of the above sets of charges. While tariffs should ultimately be transparent and non-discriminatory, in the short-term they may need to reflect existing cross-subsidisation between high and low voltage consumers. Whether the subsidy is maintained or phased out is a matter of policy. Nevertheless, it is important that the cross-subsidy is handled correctly to minimise the price distortion and allocation of scarce resources and in order to create an awareness amongst consumers regarding the real cost of supply. Such an approach makes it possible to move towards tariff structures compatible with retail competition at some stage in the future. That is, with relatively minor adjustments to the distribution charges (i.e. removing the customer services element that is subject to competition), these can be transformed into DUOS charges.
ELECTRICITY CONTROL BOARD NATIONAL ELECTRICITY TARIFF STUDY - FINAL REPORT
Page 87 of 186
EMCON – SAD-ELEC – ECON
9.2 Scope of regulation In the regulation of electricity tariffs, there are two key components:
Tariff level, i.e. the amount of revenue that the distributor shall generate from tariffs
Tariff structure, i.e. the allocation of costs to different tariff categories and the expression of fees as fixed or marginal charges. The core task in economic regulation is the first of these two, i.e. limiting the level of revenue that the regulated company should receive. Thus, regulation should at least cover tariff levels (or control of revenue). In principle, a regulator can leave tariff structure to the discretion of the regulated company. Regulatory economics concludes that, given a limited income level, a regulated company has incentives itself to develop appropriate tariff structures. In practice, a regulator may intervene to influence tariff structure for a number of reasons. In Namibia, the limited pricing competence in distribution companies, together with the desire for more consistency in distribution pricing, suggests that some form of guidelines, even if these were not binding, would assist distributors.
We recommend that the ECB regulate tariff levels, i.e. the revenue to be received by the distribution companies, and provide non-mandatory guidelines for tariff structures.
The structure of this Report is consistent with this recommendation: Chapter 11 focuses on the first task, i.e. determination of costs and hence
regulation of revenue. Chapter 12 focuses on the second task, i.e. structuring of tariffs given the
level of revenue to be generated by tariffs.
9.3 Regulatory principles �Best practice� states that regulation of a network monopoly should be sustainable, stable, transparent, predictable and cost-reflective. In general, the regulator has four general aims when establishing tariffs. These are:
Protection of consumer interests, both in terms of prices charged and the quality of service;
Ensure non-discrimination between customers or classes of customers in access to the distribution network and services;
Promote efficient competition and prevent misuse of market power, where competition is permitted;
Promote efficiency in distribution and facilitate financial viability of the distribution sector. In applying these broad aims in tariff setting, the key principles are that tariffs should be:
Cost reflective - that they reflect the distribution cost base and do not include costs that are associated with other business activities, such as retail/supply;
ELECTRICITY CONTROL BOARD NATIONAL ELECTRICITY TARIFF STUDY - FINAL REPORT
Page 88 of 186
EMCON – SAD-ELEC – ECON
Non-discriminatory - in that they are applicable to all consumers on an equal basis (although this is not necessarily the most economically efficient solution but it meets the equity requirements of regulators and is easier to police);
Consistent - the methodology is employed across all companies involved in distribution;
Transparent - that it is easy to read and apply, and contains no hidden costs; and
Provide appropriate price signals - since distribution costs are overwhelmingly associated with the network capital costs designed to meet system peak demand, charges should reflect the consumer impact on peak demand requirements.
9.4 Principles of pricing Distribution costs are primarily associated with meeting peak demand rather than total energy consumption. This is because once the wires are in place the only costs are those associated with ensuring the network is kept up and running; there are virtually no costs in moving energy24. The main cost is associated with the investment in the wires and sub-stations, which are designed to meet a given level of electricity demand at any one time. In other words, the wires and sub-stations are sized to meet peak demand, which is why the main costs associated with distribution are those of meeting peak demand. These account for the majority of distribution costs. Distribution charges not only need to recover all the costs associated with distribution, but should, ideally, send the pricing signals compatible with this cost structure. There are three basic methods for setting access charges to networks: Baumol-Willig�s �efficient component pricing rule�; Ramsey pricing; and, the accounting method.
Baumol-Willig’s “efficient component pricing rule” Under this method the access charge is set equal to the direct cost of providing access plus the opportunity cost. The direct cost is the marginal cost of operating the network. The opportunity cost is the cost of providing service facilities that the buyer would have had to make if providing the facilities themselves. This method ensures that the new entrant is at least as efficient as the incumbent, that no cross-subsidisation occurs and that a return is made on the capital costs. However, it can be difficult for the regulator to accurately assess the direct operational cost and the indirect opportunity cost. This methodology has generally not been applied in the electricity sector, but it has been used in the telecommunications industry.
24 The only costs come from energy losses, which are generally very small in relation to other costs.
ELECTRICITY CONTROL BOARD NATIONAL ELECTRICITY TARIFF STUDY - FINAL REPORT
Page 89 of 186
EMCON – SAD-ELEC – ECON
Ramsey pricing Ramsey pricing is an approach to price setting that seeks to maximise total welfare (i.e. total economic benefit) given break-even25 constraints on incumbents. If access charges were set at the short-run marginal cost then they will not necessarily cover the network�s fixed costs. By discriminating between consumers on the basis of willingness to pay some of the consumer surplus can be appropriated by the network operator to meet the fixed costs. The willingness to pay is a function of the elasticity of demand. Ramsey pricing states that the price will exceed marginal cost by an amount that is inversely proportional to elasticity of demand. Economically speaking, Ramsey pricing is the most efficient approach, but regulators rarely implement it. Aside from accurately determining different consumer group's elasticity of demand, there is the wider issue of equality and fairness, since by definition Ramsey pricing is discriminatory. Regulators and legislators tend to base their approach on the basis of the same price for the same service, rather than different prices for the same service. For these reasons, we suggest that Ramsey pricing is not appropriate for Namibia.
Accounting method The accounting method is the most common method used due to its relative ease of implementation. The process involves allocating total costs (including common costs) across different services/facilities. Access prices are then set equal to the incremental cost of providing access plus the �appropriate� share of common costs. Economically this approach does not capture the principle of efficient resource allocation. Nevertheless, it equates to the regulator�s and consumers� idea of equity since all the consumers contribute towards common costs and fulfils the objective of cost-reflectivity. In addition, it is relatively simple, avoiding difficulties in determining optimal mark-up and elasticity and data requirements are relatively straightforward to obtain, refer to Appendix F. Lastly, it is widely implemented in other countries, and hence represents an accepted international practice for pricing.
Recommended pricing principles We recommend distribution prices based on the accounting method, and the approach described in this paper is a form of the accounting method. The key principles underlying the application of the accounting method are:
The level of tariffs should be cost reflective, that is, tariffs should generate revenue equal to the costs of the business;
Where possible, the structure of tariffs should be cost reflective, that is, costs should be allocated to customer groups and expressed as charges based on the underlying cost drivers;
25 Break-even is achieved when the fixed and variable costs of a business activity are met.
ELECTRICITY CONTROL BOARD NATIONAL ELECTRICITY TARIFF STUDY - FINAL REPORT
Page 90 of 186
EMCON – SAD-ELEC – ECON
Where there are no clear cost drivers, costs should be apportioned on the basis of customer numbers or energy consumption, and should be expressed as an energy charge (thereby minimising price distortions).
9.5 International practice for distribution charges Increasingly power supply charges are subject to competition and market pricing. However, the distribution element of costs remains subject to regulation, and regulators around the world may use different approaches to setting distribution charges. In some cases regulators only regulate the overall revenue requirement (i.e. tariff level), leaving the determination of tariff structures to the distributors. In other cases, regulators may control both tariff levels and tariff structures. In this section we give a short overview of international practice in relation to key issues in distribution charges. In addition, we refer to international practice throughout the Report, and have included a more detailed description of the Irish methodology in Appendix D. Although most regulatory systems adopt the accounting method for determining access charges, the actual process and structure can vary. Looking at a number of countries� use-of-system charges we can see that the main features are average cost pricing with two part postage stamp26 tariffs (fixed and demand/energy related charges). European countries cover the broad spectrum of options with some countries at the forefront of change and liberalisation, while others have remained immured to such developments and have only recently begun to open up their markets. Europe therefore provides an interesting range of options.
Cost calculation method Average cost method is most widely used, although combinations of average, incremental and marginal cost methods can also be found (a survey of 23 European countries27 found that only five used an adapted marginal cost approach and the rest used the average cost approach). The costs generally considered are the fixed investment costs (usually historical) and the operation/maintenance of the network plus a rate of return on capital. In some cases metering and invoicing costs are included, whilst elsewhere these are seen as part of the retail/supply business.
Pricing model Postage stamp tariffs are the most widely used (i.e. not distance related). In some instances there is a distance-related component, but these are less common in distribution than transmission networks. In Italy, there is a distance related fee up to
26 Postage stamp tariffs refer to charges that are applied consistently irrespective of location within a distributor.
27 “European Distribution networks and tariffs: Models for the future” UNIPEDE 1999 (Ref: 1998-220-0015)
ELECTRICITY CONTROL BOARD NATIONAL ELECTRICITY TARIFF STUDY - FINAL REPORT
Page 91 of 186
EMCON – SAD-ELEC – ECON
a certain distance of wheeling in distribution networks beyond which the full postage stamp tariff applies. Point-of-connection/delivery model is most widely used for distribution networks (point-to-point models are proposed for Italy, Germany and Slovakia). The point of connection model assumes that supplies enter the distribution network from the transmission network, such that the costs covered by the distribution tariff reflect the network assets between the transmission level and the voltage level (and possibly the regional location) of the off-take point. A point-to-point model reflects the fact that not all supplies will come from the transmission level, but could come from embedded generation within the distribution network. Such supplies may not use some of the higher voltage networks and transformer stations on the distribution network.
Tariff structure There are two aspects to tariff structure:
How tariffs are divided into fixed and variable charges, and whether the variable charges are linked to energy or power.
How tariffs are differentiated among customer groups, with variation by location, voltage level and load profile.
Fixed and variable charges In a number of cases we find tariffs are divided into two parts: fixed charges and demand/energy charges (of the 23 European countries none had only fixed charges, ten were just demand/energy related charges and a similar number fixed and demand/energy related charges).
Differentiation among customer groups In a number of cases there is price differentiation based on the voltage level. It is also quite common for tariffs to vary by region within a country (12 out of 23 European countries have regional differentiation).
Losses Network losses tend to be distributed across the consumer base and added to the demand or energy charge in the distribution use-of-system (DUOS) tariffs. The losses are distributed on the basis of energy consumed. In some instances the losses are distributed on a regional basis.
Embedded generation In most cases there is a connection charge that is paid which includes network reinforcements. For example, in Norway and Sweden the embedded generator also has a power/capacity fee, but where embedded generation helps to reduce system losses it receives a variable/energy cost benefit.
ELECTRICITY CONTROL BOARD NATIONAL ELECTRICITY TARIFF STUDY - FINAL REPORT
Page 92 of 186
EMCON – SAD-ELEC – ECON
10 Tariff Levels: Determining the Revenue Requirement
10.1 General approach Any distribution charging methodology must promote efficiency, be cost reflective, non-discriminatory, consistent, transparent and send the correct price signals and should be easy to apply and control. In addition, it should be in line and not conflict with the transmission use-of-system (TUOS) charges. Where there are cross-subsidisation surcharges, these should be shared across all the networks on an equal basis. Finally, all network operators served by the same transmission network should adopt the same distribution charging methodology. To determine the methodology we need to consider how a number of key issues are to be treated. Firstly there is an issue of exactly what costs should be included. Once the boundaries have been defined, how do we measure the costs? Should a replacement or historical cost approach be adopted? What rate of return is applicable and what rate of depreciation? How do we deal with future investment requirements and over/under recovery of revenues? What type of pricing model should be used and what is the appropriate aggregation of consumers? What is the impact on embedded generation and how do we deal with cross-subsidies? All these issues fall under the following broad headings:
Determining the tariff level Defining the cost base Determining the cost calculations methodology Determining the tariff structure Establishing a pricing model Allocation of costs to consumer categories Determining tariff charges Treatment of cross-subsidies
Before taking a closer look at each of these issues, it should also be noted that implementation can impose additional costs on distributors. In some instances, simple data collection will prove a costly burden to distributors not used to collecting such information. Efficient regulation of the electricity sector dictates the need for consistent tariffs for all distributors and the data collection and tariff formulation will have to be carried out by all distribution network operators. In particular, the cost of
ELECTRICITY CONTROL BOARD NATIONAL ELECTRICITY TARIFF STUDY - FINAL REPORT
Page 93 of 186
EMCON – SAD-ELEC – ECON
metering required for accurate tariff setting can be expensive. However, there are mechanisms available to help estimate peak demand and in addition, new meters could be phased in over time as required. These costs are not insignificant and mechanisms need to be put in place to help ameliorate their impact. For example, the results of load research undertaken by the regulator or other bodies should be made available to distributors in a form that supports tariff formulation. This chapter looks at the first set of issues, i.e. determination of the tariff level or overall revenue requirement of the distribution business. This is the core element of price regulation, i.e. controlling the revenue of the regulated company. Determining the tariff level is essentially about determining the costs in the industry, i.e. setting the revenue requirement that tariffs will be set to meet. There are two steps in this:
defining the costs; and calculating the costs.
10.2 Defining the costs Ideally the costs should be broken down and assigned to the following categories: A: Power supply costs, generally including the costs of production of electricity and transmission over power lines to load centres; B: Distribution costs, generally including
B.1 Network asset and capital related costs; B.2 Operation and maintenance costs associated with distribution; B.3 Distribution losses; and B.4 Overheads attributed to distribution;
C: Customer services, including marketing, billing, other customer services and overheads attributed to retail. Category A costs form the basis of the power supply charge, whereas Category B and C together form the basis of distribution charges. Where there is retail competition, DUOS charges will be based on Category B costs alone. There are two special considerations associated with defining costs. Firstly, there is the question of non-attributable costs (overheads), and secondly there is the question of non-payment and arrears.
Overhead costs Calculation of overhead costs can be complicated where we have a vertically integrated company. For example, if a company is a vertically integrated generation, transmission, distribution and retail/supply business, then how should the corporate overheads be distributed between the various activities? In most instances the distribution is on the basis of the share of attributable costs. If distribution accounts
ELECTRICITY CONTROL BOARD NATIONAL ELECTRICITY TARIFF STUDY - FINAL REPORT
Page 94 of 186
EMCON – SAD-ELEC – ECON
for 40 per cent of the attributable costs, then 40 per cent of the overhead costs are allocated to distribution. However, there is no real logic in allocating overheads on the basis of total attributable costs. The costs could just as well be divided equally between the company�s business activities. Alternatively, international benchmarking could be used to provide an indication of whether the allocation and level of corporate overheads is reasonable.
In the case of a vertically integrated company (e.g. NamPower), we recommend that distribution’s portion of overheads be calculated in proportion to other costs in the company.
Non-payment Arrears may be dealt with through an allowance for working capital in the calculation of the capital base of the company. Arrears may be compensated either by actual (i.e. compensating actual arrears), or by a fixed allowance for arrears (e.g. 60 days receivables). This latter approach takes the form of an incentive � if the distribution company is able to reduce days receivables below the allowance, an additional profit is captured. If not, a loss is incurred. For non-payment, either in the form of electricity theft or bad debts, this can either be accommodated within the allowance for losses, or can be dealt with as a separate adjustment when determining tariffs, or both (i.e. electricity theft forms a part of the loss calculation, and bad-debt forms a separate adjustment).
We recommend that: 1) the cost of arrears is reflected in a return on working capital; 2) electricity theft is incorporated into loss figures; 3) bad-debts are a separate cost item in the revenue requirement.
10.3 Cost calculations Power supply costs are a function of the tariffs levied at the bulk supply level, which would usually reflect both generation and transmission charges. It is usually a fairly straightforward process to determine power supply costs as a function of bulk supply charges. Distribution costs are dominated by asset-related costs, i.e. the depreciation charge and return allowance on assets. Thus, asset valuation and rate determination are critical elements of the pricing methodology. Customer services costs are a relatively small part of the overall cost structure. In the case of a single set of distribution charges covering both distribution and customer service costs, these may be incorporated as an element of distribution costs.
ELECTRICITY CONTROL BOARD NATIONAL ELECTRICITY TARIFF STUDY - FINAL REPORT
Page 95 of 186
EMCON – SAD-ELEC – ECON
10.3.1 Asset valuation method There is no clear-cut answer to this question. There are three generic methods that can be used:
If historical costs are used (i.e. asset values based on the original purchase price) then the data should be easily available and is objective, but it may understate the value in times of inflation and overstate it in times of technical progress. This is an important point in Namibia, due to the limited availability of asset data as well as the effect of high historical rates of inflation. If a replacement cost methodology is used (i.e. the cost of replacing an existing with a new asset) then this overcomes the problem of inflation and captures the technical change. However, determining the replacement cost is less objective and may involve expensive data collection. The replacement cost method makes no assessment of whether there has been an efficient level of investment. There is no penalty for over investment and no incentive to ensure allocative efficiency of investments. A variation of the replacement cost methodology is termed �standardised cost�. Here standard costs are applied to an asset register to determine an estimate of the replacement cost. This variation simplifies implementation of the replacement cost approach. An optimised replacement cost methodology is designed to attempt to address the issue of over investment. In this method an assessment is made of the current cost of building a greenfield optimal system, as if the network were to be rebuilt to optimally meet the demand. This approach is even less objective than the standard replacement cost method, since it requires an assessment of what is an optimal system. The Irish regulator favours the use of the optimised replacement cost method for valuing assets on the grounds that it will provide the network owner with an incentive to undertake efficient investments. This methodology is also used in Australia and New Zealand, but there is concern that unless it is clearly formulated it introduces additional regulatory risks. The use of replacement costs to value installed assets is the most widely used approach internationally. To overcome the problem of locking in inefficient investments, efficiency incentives can be built into the regulatory approach perhaps through the use of a CPI-X price cap. Here care must be taken that this practice does not result in under-investment. It is important that a consistent approach is adopted for future investments and the treatment of these investments at the time of the next regulatory review. The regulator must ensure that capital is used efficiently and that there is no incentive to over, or under, invest.
We recommend that replacement cost approach be used in asset valuation, and that this approach be simplified through the use of standardised values for common categories of assets. The implementation of new distribution prices will certainly require assistance to distributors in valuing assets.
ELECTRICITY CONTROL BOARD NATIONAL ELECTRICITY TARIFF STUDY - FINAL REPORT
Page 96 of 186
EMCON – SAD-ELEC – ECON
10.3.2 Rate of return/cost of capital Given that most of the costs of a network are tied up in the asset base, the asset valuation method and the return on those assets is extremely important in determining the costs that need to be recovered through distribution charges. The choice of asset valuation method will also have a bearing on whether a real or nominal rate of return on capital is employed. If historic costs are used then a nominal rate should be used, but if a replacement cost approach is adopted then a real rate of return should be used. In the replacement cost approach, the asset base is inflated by the current cost, which takes account of inflation. To avoid double counting inflation the real rate of return should be used. As for the rate of return used, regulators normally require a reasonable rate of return on assets to be used, where reasonable is defined as the risk-adjusted return that suppliers of funds to a business require the business to provide. The higher the level of risk the higher the return required. In general, investments in a regulated network are not viewed as risky, and the rate of return is likely to be somewhere between the risk-free value as defined by the long-run government bond rate and the market rate for 100 per cent debt financing. In general, businesses use a combination of debt and equity to finance investments and the appropriate return on capital is the weighted average cost of debt and equity financing. To determine this weighted average a number of regulators28 have used the capital asset pricing model (CAPM), which determines the rate of return as a function of the project risk relative to the aggregate equity market risk. If the risks are the same then the expected return is equal to the expected return on equities. Determining the appropriate level of risk is difficult where the network owner is state-owned and has no track record against which to measure the relative perceived risks. Besides, the new regulatory environment will affect those risks and there is no guarantee that past historic values would be appropriate for the future. The Irish regulator has taken the view that a comparative approach is preferable, relying on evidence for returns in other regulated electricity distribution companies. An alternative approach could be to apply two different rates of return: one for existing assets and the other for new investments. The former would be calculated at the risk free cost of capital while the latter would reflect a weighted average cost of capital. This would preserve the investment incentive since the return on new investments would exceed the existing cost of capital for the network owner. At the same time it would ensure that consumers were not being overcharged for use of historic investments. If the return is applied to assets rather than equity, then interest payments should not be included in the cost base of the distributor.
We recommend that the ECB apply a consistent real return to all distribution companies in Namibia. This should be calculated as the real
28 Australia and the UK for example.
ELECTRICITY CONTROL BOARD NATIONAL ELECTRICITY TARIFF STUDY - FINAL REPORT
Page 97 of 186
EMCON – SAD-ELEC – ECON
return before tax, based on the regulator’s view of the cost of capital, and should be applied to re-valued assets.
10.3.3 Depreciation rate The investment owner must be able to recover the cost of the initial investment over the economic life of the asset. The economic life is a function of the technical life at the time of purchase, technological changes themselves and competition. Competition does not come from alternative distribution networks, but from alternative source of distributed electricity such as off-grid solutions (solar power, fuel cells etc). The depreciation rate should reflect the real economic life of the assets. Depreciation costs of the assets in a given year are added to the costs to be recovered in that year (i.e. the sum of the return on asset and the depreciation). Depreciation can be on a straight-line basis or an accelerated basis. In general, international practice is to depreciate distribution assets over 20-25 years on a straight-line basis, with meters depreciated over 5 years.
We recommend that ECB apply standard depreciation rates based on the economic lifetime of assets.
10.3.4 Subsidised assets The treatment of subsidised assets needs careful consideration. If distribution companies are able to include these assets in their rate base then they will get an income stream that they did not finance. This can be overcome by setting the subsidised asset values to zero, such that no return and no income stream is received from them. The problem with this approach is that the assets are not depreciated either and as a result we can get a sharp step increase in costs when the assets need replacing. Where subsidised assets account for only a small share of the total asset base, then this problem is not significant and is typically the recommended approach. If this is not the case then an alternative approach is required. One alternative is to consider the subsidised assets as zero interest debt. This means the assets do not earn a return but they are depreciated. This still means that the distributor has an income stream that it did not finance, but it should only be sufficient to cover the replacement cost of the asset at the end of its life. However, in the mean time the distributor has no restrictions on what it does with this income and can use it to finance other investments. Consequently, Government subsidies would end up being used to finance other investments. This effectively becomes debt-free financing for the distributor. An alternative approach is for the subsidiser (e.g. the Government) to maintain ownership of the subsidised assets. The Government can then receive the depreciation income from the distributor. This income could then be held as a
ELECTRICITY CONTROL BOARD NATIONAL ELECTRICITY TARIFF STUDY - FINAL REPORT
Page 98 of 186
EMCON – SAD-ELEC – ECON
replacement fund, with interest earned used to subsidise other electrification schemes. Distributors would then apply to the fund when subsidised assets need replacing. A system of only matching part of the replacement costs could be used to phase out the subsidy over the long-term, and the subsidy funds could then be redirected. The regulator would have to ensure that these assets are being dealt with properly and that the Government is receiving the correct payment. This approach can be characterised as distributor management of state assets. It has the disadvantage of requiring fairly sophisticated approach from the state in terms of ownership and financial control associated with distribution assets.
We recommend that subsidised assets owned by the company be included in the company’s asset base for calculation of depreciation, but excluded for the purposes of return calculations.
10.3.5 Future planned investments In a number of countries future investments are not built into the current year�s revenue requirement and distribution charges for any given year only recover the cost of the historical asset base. All assets created in future years will feature in the allocation of the cost at that time. This means that the asset base assessment needs to be repeated every year to ensure that the asset base is brought into line with net investments. There is no efficiency incentive in place to ensure that new investments are appropriate. Under these schemes all future investments will be underwritten by the consumers and recuperated through the distribution charges. New investments are simply added to the cost base. It is important that new investments are only undertaken if they represent the most efficient use of those resources and that the investment is cost effective. Network operators need to be assured that they will get an adequate return on necessary new investments, but at the same time the network operators must not feel that any investment will be underwritten, nor that they will benefit from overestimating and under spending. A balance needs to be achieved and mechanisms put in place to ensure that this is achieved without itself becoming too cumbersome and costly to operate. New investment could be required to get regulatory approval before construction, but this may simply add to the administrative load on both the regulator and distributors. An incentive-based form of regulation is preferable. In a number of cases the CPI-X approach is used to encourage efficient investment (i.e. allowed revenue is increased by the consumer price index minus an efficiency factor X). To accommodate investment needs the allowed revenue can also be indexed to demand (as in Norway where the allowed revenue increases by ½ percent for every 1 percent increase in demand) or to an agreed network investment plan (as in Ireland) or to both (as in the UK). However, there still remains the issue of overestimating forecast capital expenditure (as has occurred in the UK), which would give the network owner an additional revenue stream. This is dealt with at the next review period when network assets would be revised down and consumers benefit from lower tariffs. Although the
ELECTRICITY CONTROL BOARD NATIONAL ELECTRICITY TARIFF STUDY - FINAL REPORT
Page 99 of 186
EMCON – SAD-ELEC – ECON
revenue already acquired by the distribution company is not recuperated, the revenue stream is curtailed for subsequent review periods. The recommended approach here depends on whether the regulatory regime involves annual price revisions (approved by the regulator), or multi-year price caps. In the former case, it would be appropriate to make annual adjustments to the asset base to reflect actual investment, within the framework of an approved investment programme. In the latter case, it would be appropriate to include an allowance for new investment (particularly to accommodate network expansion in an electrification programme), and to adjust the asset base at each multi-year price review.
We recommend that ECB, at present, adopt annual adjustments to prices to reflect investment undertaken in the most recent year for which accounts are available. Adjustments to account for the time lag should be accommodated.
10.3.6 The costs of non-payment There are various categories of non-payment, which can be dealt with in different ways:
Arrears: An allowance for working capital corresponding to arrears can be added to the capital base. The return on this working capital can be taken as the same return level used for the asset cost calculations to define a cost of arrears. This cost can be allocated to each customer category on the basis of arrears per customer category, and defined as a tariff.
Theft: Theft is the energy and power that is consumed but not billed. This is best dealt with as a form of loss and included in the allowance for technical losses. This then affects the power supply charges.
Bad debts: Certain billed energy may never be paid and forms a bad debt, which is incurred annually. The cost of bad debts from the previous year can be added to the revenue requirement. There is no rationale for allocating bad debts to different consumer categories, even if they arise differently from different consumer categories. Hence it is best to add an additional charge per unit of energy billed equal to the total cost of bad debts divided by the total number of units billed and paid.
We recommend that the costs of arrears and bad debts be included in the annual revenue requirement. Theft (i.e. energy unbilled) should be dealt with together with technical losses (see below).
ELECTRICITY CONTROL BOARD NATIONAL ELECTRICITY TARIFF STUDY - FINAL REPORT
Page 100 of 186
EMCON – SAD-ELEC – ECON
10.3.7 Technical losses and theft Technical losses are a function of energy transported, and may vary for each voltage level. There is a choice to base charges on marginal or average losses. Charges based on marginal losses will provide a better price signal, but will over-recover the actual costs of losses (marginal losses being approximately double average losses). Charges based on average losses will be cost-reflective and consistent with the overall approach to reflect average costs. Loss charges will be a function of the costs of power supply, and so it is often simplest to incorporate losses into the power supply charge. Electricity theft represents a form of loss that cannot be attributed to specific customer categories. It is recommended that theft be added to technical losses and so treated in the same manner.
We recommend that power supply charges be adjusted by a factor to account for technical losses and electricity theft. This factor should be based on average losses plus an allowance for theft.
10.3.8 Revenue reconciliation The objective of the tariff system is to meet the costs of running the network and supplying electricity to customers, where the costs include a return on capital employed. The tariffs should be set such that revenue from expected electricity distributed matches the total revenue required. Where this expected revenue does not match the required revenue a process needs to be established to adjust future tariffs to correct for the over/under recovery of costs. To attempt to minimise the under/over recovery and therefore the impact of future tariff levels, consideration should be given to how allowable revenues are divided between fixed and variable components.
We recommend that ECB, at present, adopt annual adjustments to prices to reflect under/over recovery in the preceding period for which accounts are available. Adjustments to account for the time lag should be accommodated.
10.4 Incorporating incentives in regulation The method as outlined above is essentially cost-plus, with little incentive to the distribution companies to improve operations. We believe that this approach is appropriate in the first stage as ECB establishes itself as a regulator, and collects information on the industry. As distributors begin to reform their prices to be consistent with the recommended approach, a subsequent stage can be the gradual introduction of incentive elements to regulation.
ELECTRICITY CONTROL BOARD NATIONAL ELECTRICITY TARIFF STUDY - FINAL REPORT
Page 101 of 186
EMCON – SAD-ELEC – ECON
Regulation can be designed to provide a range of incentives. Several of these are briefly reviewed below.
Incentives to improve operating costs There are a number of ways of providing incentives to improve operating costs, including incentives to reduce losses, theft, arrears and generating operating costs.
Incentives to reduce losses and theft: ECB can set prices based on a target for losses and theft, rather than actual losses and theft. This target can be progressively tightened over time until distributors reach what is regarded as acceptable levels. If a distributor can reduce losses faster than the target, profits will be increased and this should not be taken away through reconciliation adjustments.
Incentives to reduce arrears: As with losses, ECB can base its allowance for a return on working capital through a target number of debtor’s days. If the distributor is able to operate with lower working capital (mainly achieved by reducing arrears), additional profits will be made. The target number of debtor’s days can be gradually tightened over time until acceptable levels are reached.
Incentives to reduce operation costs: ECB can set a target to reduce overall operating costs, in real terms, over time. In cases where a distributor is engaged in electrification, and hence expanding its customer base, any targets for operating costs should take this into account. Again, if the distributor manages to reduce its costs faster than the target, this will increase profits.
Incentives to optimise investment This can be more difficult to implement. At one level, ECB can subject investment plans to scrutiny (so-called prudency reviews) and decide whether these plans are justified, and hence included in the asset base. Similarly, any cost overruns on projects can be scrutinised to decide whether they are justified or not. If not, the cost over-run can be excluded from the asset base. While this review process does act as a powerful incentive to be careful with investment decisions and implementation, it does add considerably to regulatory risk.
An alternative approach can be to factor in a certain level of investment in the tariff calculations. If the distributor is able to maintain operations and meet any special licence conditions with a lower level of investment, then additional profits are earned. This approach is typically based on investment reviews every 3 to 5 years. At each review, the asset base is reset to reflect actual rather than anticipated investment. In this way, companies have incentives to optimise investment, and consumers benefit (after a certain period).
A third option is to index the distributor�s revenue requirement (or a portion thereof) to demand growth. This implicitly assumes that growth in demand requires additional investment, and this is rewarded through the indexing method. The distributor then
ELECTRICITY CONTROL BOARD NATIONAL ELECTRICITY TARIFF STUDY - FINAL REPORT
Page 102 of 186
EMCON – SAD-ELEC – ECON
has an incentive to optimise investment within this predictable tariff adjustment mechanism.
It should be stressed that while providing investment incentives is a powerful regulatory tool, it is a difficult measure to implement successfully. On the one hand, prudency reviews can become very legalistic, expensive and subject to court challenge. On the other hand, setting investment. Setting investment allowances can lead to regulatory �gaming�, where the distributor delays investment, yet still has the investment included in the next investment plan. Indexing the tariff is perhaps the simplest approach, but is best suited to a mature distribution network and not an expanding one.
We recommend that ECB seek to include incentive elements into regulation as a second stage in the development of its regulatory regime. This should be introduced once distributors have become familiar with the proposed method, and have successfully implemented it. By this stage, ECB should have built up a suitable information database to facilitate the design of incentive mechanisms and setting of relevant parameters.
ELECTRICITY CONTROL BOARD NATIONAL ELECTRICITY TARIFF STUDY - FINAL REPORT
Page 103 of 186
EMCON – SAD-ELEC – ECON
11 Tariff Structures: Allocating Costs and Defining Charges There are two generic approaches to structuring tariffs: One approach is to firstly establish tariffs that provide the price signals
that the regulator deems appropriate (e.g. marginal losses). These tariffs will generate a certain level of revenue for the distributor, which in general will be less than the overall revenue requirement. The residual requirement should then be charged to customers as tariffs that minimise distortions on consumption.
The other approach is to take each element of the costs, and allocate it to customers and establish tariffs on the basis of what is considered to be the cost driver for that cost element. Those costs that have no obvious cost driver can be allocated in a way that minimises distortions.
The approach taken here is the second of these two methods. This approach firmly establishes cost-reflectivity as the key principle underlying tariff formulation, while still allowing for special price signals to be included in the tariff system.
11.1 Pricing model The point-of-delivery (POD) pricing model is the preferred model for distribution networks. This is consistent with international practice and is relatively simple, requiring less continuous data collection and analysis than point-to-point (P-t-P) pricing models. The POD model assumes that supplies enter the distribution network from the transmission network, such that the costs covered by the distribution tariff reflect the network assets between the transmission level and the voltage level of the off-take point. A P-t-P model determines the specific assets used in delivery between transmission/embedded generation and the point of delivery. These costs are then recovered from the consumer.
ELECTRICITY CONTROL BOARD NATIONAL ELECTRICITY TARIFF STUDY - FINAL REPORT
Page 104 of 186
EMCON – SAD-ELEC – ECON
In general, there are only a couple of instances when a POD model is not appropriate. When supplies are met from embedded generation that does not require transmission or higher voltage distribution facilities. Another example is when a consumer could have been supplied from the transmission network but for convenience is supplied from the distribution grid and only a small section of the distribution network is required. The former problem can be solved through the embedded power generator's connection charge. Ensuring that the distribution charges do not exceed the cost of installing a dedicated supply line from the transmission network can solve the latter problem. To ensure that there is no incentive to construct a new supply line unnecessarily it may be necessary to introduce a distance-related element into the distribution charges. If the point of delivery was within a certain distance of the transmission network and the consumer could have been supplied from the transmission network, then the distribution costs would have to reflect the opportunity cost of a new line. This can be translated into a coefficient that is applied to the distribution capacity charge. We do not consider distance related adjustments to tariffs in this methodology, purely for reasons of simplifying the presentation.
We recommend the use of a POD pricing model, that is, where all consumers within a category pay the same price regardless of location relative to the transmission substation.
11.2 Definition of customer categories Once the costs have been determined they need to be allocated to consumer categories. The choice of consumer categories is important in ensuring that correct cost signals are sent to the industry and that any cross-subsidisation is kept to a minimum. There are three criteria for the determination of customer categories:
The voltage level at which supply is taken, since losses and infrastructure costs are linked to the configuration of physical assets;
The load profile. If base-load consumers are mixed with peaking consumers then capacity charges are likely to be higher than the costs imposed by the base-load consumers and lower than those imposed by the peaking consumers. Incorrect price signals are sent and economic efficiency suffers as a result.
Meter limitations: The presence of existing meters may limit the form of charges that may be employed. Particular examples include energy meters, which do not measure maximum demand, and prepayment meters, which only allow an energy charge.
Complete dis-aggregation would impose heavy costs in terms of data collection. A trade-off has to be achieved between increased aggregation and cross-subsidisation. It should form the part of the regulatory reviews to ensure that there is no systematic bias against particular activities, nor that there is a serious
ELECTRICITY CONTROL BOARD NATIONAL ELECTRICITY TARIFF STUDY - FINAL REPORT
Page 105 of 186
EMCON – SAD-ELEC – ECON
problem of cross-subsidisation. If this is the case then there is no need for additional dis-aggregation. A pragmatic categorisation of customers should divide customers into similar load profile groups, for example domestic, commercial and industrial. In addition, each customer category may take supply from a different voltage level. This is necessary because customers taking supply at a higher voltage level need only pay for costs associated with these voltage assets. Customers at the lower voltage level should pay tariffs that reflect both high and low voltage assets. Consequently it is appropriate to determine a matrix of categories, as shown in the table below, which shows five different customer categories. Naturally, not all customer categories will take power at more than one voltage level.
The choice of customer categories will depend, to a certain extent, on the exact circumstances of each distributor. We recommend a set of customer categories as defined in Table 11.1. Each distributor may use only a sub-set of these categories, and in some cases may have additional categories.
Table 11.1 Categorisation of customers
Category Meter 220/400 V 1000/3000 V 11 kV 20A limit Any X
Prepayment X LV single phase Credit meter X
Prepayment X LV three phase Credit meter X
Credit meter X Commercial Max dem
meter X
Industrial Max dem meter
X X
11.3 Allocation of costs to customer categories The approach to allocating costs to each customer category will depend on the type of cost being considered. The underlying principle is that costs should be allocated on the basis of the underlying cost-driver. For example, asset-related costs are determined by the maximum-demand for which the network has been designed. Consequently, asset-related costs can be allocated to customer categories on the basis of their contribution to peak-demand on the network, i.e. peak-coincident maximum demand. Where there is no obvious cost-driver (for example overhead costs), costs should be allocated either on the basis of customer number (possibly weighted), or on the basis of energy demand.
ELECTRICITY CONTROL BOARD NATIONAL ELECTRICITY TARIFF STUDY - FINAL REPORT
Page 106 of 186
EMCON – SAD-ELEC – ECON
In theory O&M costs should be apportioned across the system load curve and allocated on the basis of each consumer category's share of the load at any given time. For simplicity the O&M costs can be apportioned in relation to annual electricity consumption.
We recommend that the elements making up distribution costs be allocated to customer groups as shown in Table 11.2.
Table 11.2 Cost elements, cost-drivers and allocation parameter Cost element Cost driver Allocation parameter Power supply costs: maximum demand charge
Peak demand on network
Peak-coincident maximum demand of customer category
Power supply costs: energy charge
Energy consumption Energy consumption of customer category
Distribution losses Energy consumption Energy consumption of customer category
Network assets: depreciation and return
Peak demand on network
Peak-coincident maximum demand of customer category
Working capital Mostly due to arrears Average arrears of customer category
Bad-debts No obvious cost driver
Energy consumption of customer category
O&M costs No obvious cost driver
Energy consumption of customer category
Customer services Number of customers Number of customers Overhead costs No obvious cost
driver Number of customers
The following chapter describes the application of the recommended pricing methodology, and provides details on the recommended cost allocation method.
11.4 Determining tariff charges Having allocated each cost element to a customer category, it is necessary to then express this as a tariff. The choice is usually one of three:
A fixed monthly charge A charge per unit of maximum demand A charge per unit of energy
The criterion used to allocate the cost among the customer categories is usually the best way to express the tariff. For example, if the cost is allocated on the basis of energy, express the tariff as a unit energy charge. If the cost is allocated on the basis of contribution to co-incident peak demand, express the tariff as a maximum demand
ELECTRICITY CONTROL BOARD NATIONAL ELECTRICITY TARIFF STUDY - FINAL REPORT
Page 107 of 186
EMCON – SAD-ELEC – ECON
charge. If the cost is allocated on the basis of customer numbers, express the charge as a fixed monthly charge. Exceptions to this rule may have to be made in certain cases. For example, small consumers will not have maximum demand meters. In this case, all variable tariff elements must be expressed as unit energy charges. Another case may be where the regulator wishes to avoid large fixed charges so that low-income consumers do not face large fixed charges regardless of their consumption.
We recommend that the elements making up distribution costs be structured as tariff charges as shown in Table 11.3.
Table 11.3 Cost elements and tariff charges Tariff form Cost element Customers with
maximum demand meter
Customers without maximum demand
meter Power supply costs: maximum demand charge
N$/kW or N$/kVA c/kWh
Power supply costs: energy charge
c/kWh c/kWh
Distribution losses c/kWh c/kWh Network assets: depreciation and return
N$/kW or N$/kVA c/kWh
Working capital c/kWh c/kWh Bad-debts c/kWh c/kWh O&M costs c/kWh c/kWh Customer services N$/month N$/month (or c/kWh
for prepayment meters)
Overhead costs N$/month N$/month (or c/kWh for prepayment
meters) Again, in the following chapter we will look at ways of structuring the tariff for each element of costs in more detail.
11.5 Sundry tariffs and levies Electricity distributors typically charge a range of fees in addition to standard tariffs. These include charges for meter checks, reconnections, connection fees and so on. With the possible exception of connection fees, these are typically a small portion of the overall revenue of a distributor. Nevertheless, it is important that the distributor
ELECTRICITY CONTROL BOARD NATIONAL ELECTRICITY TARIFF STUDY - FINAL REPORT
Page 108 of 186
EMCON – SAD-ELEC – ECON
does not double-charge for services through special fees, as well as through standard tariffs.
11.5.1 Connection fees If revenue from connection fees is nominal in relation to the overall revenue requirement, they can be treated as described below under �Miscellaneous Charges�. If revenue from connection fees is a significant portion of annual capital invested, then the ECB should deduct this revenue from the asset base used to calculate the return requirement. This is because the customer rather than the distributor has financed the portion of the assets, and hence the distributor should not earn a return on this investment. This treatment is similar to the approach recommended for subsidised assets.
11.5.2 Miscellaneous charges Unless distributors charge unreasonable fees for other services, ECB need not regulate or provide guidelines for these fees. Determination of these fees should be the discretion of the distributor concerned. Nevertheless, the ECB should require the distributors to report on revenue from other charges per customer category, and should ensure that this revenue is deducted from the revenue requirement when standard tariffs are calculated.
We recommend that: 1) connection fees and other charges should be set at the discretion of
the distributor; 2) if connection fees represent a significant portion of annual
investment, this should be deducted from the asset base used to calculate the return on assets;
3) revenue from other charges should be deducted from the revenue requirement used to calculate other charges.
11.6 Treatment of cross-subsidies There are two forms of cross-subsidies in electricity tariffs:
cross-subsidies between customers; and cross-subsidies from electricity consumers to consumers of other
municipal services.
11.6.1 Cross-subsidies between customer categories Cross-subsidisation may be inherent in the existing tariff structure. Cross-subsidies may be retained in the tariff for two reasons: firstly an immediate removal of cross-
ELECTRICITY CONTROL BOARD NATIONAL ELECTRICITY TARIFF STUDY - FINAL REPORT
Page 109 of 186
EMCON – SAD-ELEC – ECON
subsidies may lead to a sudden and socially unacceptable tariff adjustment. Secondly, the regulator or Government may have a social policy to cross-subsidise poor customers. In this case, cross-subsidies may be a feature of electricity tariffs in the long-term. There are three key policy issues to be addressed in determining cross-subsidies:
Who should benefit from the subsidy? It is preferable to target cross-subsidies as closely as possible. This can be difficult to achieve. Options for doing so include restricting the subsidy to a limited number of kWh consumed per month, or defining a special tariff category that low-income consumers qualify for (e.g. a current-limited supply).
How large should the subsidy be? Again, this is a policy issue that needs to be determined by the authorities, i.e. what is the subsidised price that the target group should pay for electricity.
Who should pay for the subsidy? Other consumers will be required to pay for the cross-subsidy. The cost of cross-subsidies can be covered by additional tariffs on other domestic consumers, or on other low-voltage consumers, or on all other consumers. Once the authorities have determined these issues, the cost of the cross subsidy can be determined and allocated to the consumer groups required to cover the charge. We recommend that the cross subsidy charge be allocated on the basis of energy consumed (i.e. the cost of the cross-subsidy is allocated to consumers in proportion to energy consumption) and levied as a charge per kWh. The process can be iterative to check firstly that the resulting tariffs for those paying the cross-subsidy are not excessively high, or that inconsistencies arise as a result.
We recommend that the price paid by low income consumers be determined by the distributor and relevant local authorities themselves rather than the ECB, and that the cost of the resulting cross-subsidy be levied on all other consumers in proportion to their energy consumed. The resulting cross-subsidy charge should be expressed as a charge per kWh of energy consumed.
11.6.2 Cross-subsidisation of other municipal services In Namibia many municipal distributors use revenue from electricity sales to cross-subsidise other municipal services. Clearly, local authorities need to raise revenue in order to pay for the services they provide, and electricity sales represent one way of achieving this. It is useful to see this process not as an element of electricity tariff setting, but as a local authority taxation issue. In order to achieve the objective of transparency in tariffs, it is important that the taxation be separated from the electricity tariff in the tariff methodology.
We recommend that ECB’s regulations and guidelines for distribution tariffs exclude consideration of local authority revenue generation, and
ELECTRICITY CONTROL BOARD NATIONAL ELECTRICITY TARIFF STUDY - FINAL REPORT
Page 110 of 186
EMCON – SAD-ELEC – ECON
that such revenue be generated via a separate tax on electricity tariffs that is regulated by the Minister of Finance. To preserve the price signals associated with maximum demand charges, it is recommended that the local authority tax be levied on energy consumed rather than maximum demand.
ELECTRICITY CONTROL BOARD NATIONAL ELECTRICITY TARIFF STUDY - FINAL REPORT
Page 111 of 186
EMCON – SAD-ELEC – ECON
12 Distribution Tariff Methodology
12.1 Overview This chapter of the Report presents the recommended approach in a single methodology that can be implemented by Namibian distributors. The method is illustrated through an excel spreadsheet that is provided as part of this project, and illustrated in the examples presented in the final chapter. The design of tariffs should ensure that price signals reflect underlying costs and should also provide greater transparency � unbundling of charges and any subsidy surcharges. We should remember that distribution costs are primarily associated with meeting peak demand, which means that the distribution charges should reflect the cost of network capacity and set tariffs on the basis of use of system peak capacity. There are other costs that are a function of energy supplied and these elements of distribution charges should also reflect those costs and price them accordingly. In order to ensure the correct pricing signals a three-part tariff (fixed-, capacity- and energy-charges) plus subsidy surcharge (added to the energy tariff) is the preferred model. Two-part tariffs (fixed-, and energy-charges) can be used for low voltage small electricity consumers who are unable to respond to capacity price signals. It is also possible to use only energy charges for domestic meters on prepayment systems where there are practical problems in implementing fixed monthly charges. For the medium and high voltage large users a three-part tariff is required. The recommended tariff methodology is implemented through the following steps:
Step 1: Determine cost structure and revenue requirement The annual revenue requirement for distributors should be structured in the following cost categories:
Bulk purchase costs. Asset related costs. Working capital. Operating and maintenance costs. Customer service costs.
ELECTRICITY CONTROL BOARD NATIONAL ELECTRICITY TARIFF STUDY - FINAL REPORT
Page 112 of 186
EMCON – SAD-ELEC – ECON
Overhead costs. Bad debts.
In addition, adjustments to the revenue requirement should be made to reflect: Revenue from other charges. Reconciliation adjustment.
Step 2: Allocate the costs to customer categories Customer categories are a function of customer class (e.g. domestic, commercial etc) and voltage at which supply is taken. Cost allocation may be done on the basis of:
Contribution to peak demand on the network Energy consumed Customer numbers (or weighted customer numbers) Arrears
The choice of allocation method should be linked to the cost driver for each category, and where there is no obvious cost driver, costs should be allocated on the basis of energy consumed or customer numbers.
Step 3: Determine the tariffs Once the costs in each category have been allocated to customer categories, they can be structured as tariffs. We deal with three types of charges:
Fixed monthly fees Energy charges Maximum demand charges
In general, the choice of fee type should be linked to the choice of cost allocation method, e.g. if costs are allocated on the basis of energy consumed, then the fee should be expressed as a charge per kWh consumed. There will, however, be restrictions arising from meter technology, e.g. small consumers not having maximum demand meters.
Step 4: Account for cross-subsidies One tariff category may be designated as cross subsidised. In this case, the tariff for this category is best expressed as a c/kWh charge with the charge set by the authority determining the cross-subsidy (either the local authority or the ECB). The lost revenue as a result of this policy should be calculated and allocated to other customer categories on the basis of energy consumed, and expressed as an energy tariff. Details on each of these four steps are provided in Appendix G.
ELECTRICITY CONTROL BOARD NATIONAL ELECTRICITY TARIFF STUDY - FINAL REPORT
Page 113 of 186
EMCON – SAD-ELEC – ECON
13 Proposed Tariff Structures for Retail Supply
13.1 Introduction A tariff structure is the allocation of costs to different tariff categories, and the expression of fees as fixed and/or marginal charges. In a mature electricity supply industry, the regulator can leave the choice of tariff structures to the discretion of the regulated distributors. In Namibia however, the limited human resources and pricing experience in distribution companies, coupled to the desire for more consistency in distribution pricing, suggests that some non-mandatory tariff structure guidelines should be made available by the ECB. These guidelines are intended to assist the distribution companies, while assuring that the structure of tariffs remains largely cost reflective, i.e. that costs are allocated to customer groups and expressed as charges based on the underlying cost drivers. The most important aspects of tariff structures are:
Tariff differentiation among customer groups, with possible variation by location, voltage level and load profile,
Tariff differentiation between fixed and variable charges, The nature of the variable charges, i.e. energy related, or power related.
13.2 Differentiation among customer groups Once costs have been determined they need to be allocated to consumer categories. The particular choice and variation of consumer categories is important in ensuring that correct cost signals are sent to industry and that any cross-subsidisation is kept to a minimum. There are three criteria for the determination of customer categories:
The voltage level at which supply is taken, since losses and infrastructure costs are linked to the configuration of physical assets,
The load profile, i.e. are customers from the base-load or peaking consumers category,
Meter limitations, i.e. what meters are already in operation. Meters may indeed limit the form of charges that may be employed: for example energy
ELECTRICITY CONTROL BOARD NATIONAL ELECTRICITY TARIFF STUDY - FINAL REPORT
Page 114 of 186
EMCON – SAD-ELEC – ECON
meters do not measure maximum demand, or existing prepayment meters which only allow an energy charge. Both impose a limit on the choice of charge differentiation. Customers should be categorised into similar load profile groups, for example
• domestic,
• business and light industry, and
• large power users. Each customer category in turn may take supply from a different voltage level, so that customers taking supply at a higher voltage level need only pay for costs associated with these voltage assets. On the other hand, customers at the lower voltage level should pay tariffs that reflect both high and low voltage assets. Table 13.1 summarises the guideline proposal: Table 13.1 Guideline tariff structure proposal
The above customer categorisation is also summarised in Table 13.2:
DOMESTIC BUSINESS & LIGHT INDUSTRY
LARGE POWER USERS
Credit metered single
or three phase
Pre-paid metered single
or three phase
Credit metered
single phase
Credit metered
three phase
Without demand meters
Demand metered
Basic/service charge
[N$/amp]
None
Basic/service charge
[N$/amp]
Basic/service charge
[N$/amp]
Demand charge
(ordered) [N$/kVA]
Demand charge
[N$/kVA]
Unit charge [N$/kWh]
Unit charge
[N$/kWh]
Unit charge [N$/kWh]
Unit charge [N$/kWh]
Unit charge
[N$/kWh]
Unit charge
[N$/kWh]
ELECTRICITY CONTROL BOARD NATIONAL ELECTRICITY TARIFF STUDY - FINAL REPORT
Page 115 of 186
EMCON – SAD-ELEC – ECON
Table 13.2 Categorisation of customers CATEGORY METER 220/400 V 1000/3000 V 11 kV 20A limit Any X
Prepayment X Low voltage single phase Credit meter X
Prepayment X Low voltage three phase Credit meter X
Credit meter X X Business / Industrial Max dem
meter X X
LPU Max dem meter Credit meter
X X
X X
13.3 Proposed sundry tariffs and levies Electricity distributors typically charge a range of fees in addition to standard tariffs. These include charges for meter testing, connection and reconnections fees and others. With the possible exception of connection fees, sundry tariffs typically represent a small portion of the overall revenue of a distributor only. Nevertheless, it is important to ensure that the distributor does not double-charge for services through sundry tariffs and levies. If revenue from connection fees is nominal in relation to the overall revenue requirement, connection fees can be treated as described further below. However, if revenue from connection fees represents a significant portion of annual capital invested, then the ECB should deduct this revenue from the asset base used to calculate the return requirement. This is because the customer rather than the distributor has financed the portion of the assets paid for by the customer, and hence the distributor should not earn a return on this investment. Unless distributors charge unreasonable fees for other services, the ECB need not regulate them. It is therefore recommended that the determination of sundry fees should be the discretion of the distributor. It should however be noted that the ECB should require the distributors to report on revenue from other charges per customer category, ensuring that this revenue is deducted from the revenue requirement when standard tariffs are calculated. Table 13.3 lists the proposed sundry charges and levies:
ELECTRICITY CONTROL BOARD NATIONAL ELECTRICITY TARIFF STUDY - FINAL REPORT
Page 116 of 186
EMCON – SAD-ELEC – ECON
Table 13.3 proposed sundry charges and levies
Connection, Disconnection
& Reconnection
charges
Location & Rectification
of Faults
Testing of Meter & Circuit Breaker
Special Fees Deposits
• Connection [N$]
• Disconnection
[N$] • Temporary
disconnection [N$]
• Reconnection
[N$] • Reconnection
after non-payment [N$]
• Cable
connection [N$]
• Office hours [N$]
• After hours
[N$]
• Meters [N$]
• Circuit
breaker [N$]
• Fixed levy: basic un-built erven [N$]
• Late fees
[interest per month in %], or a flat-rate in [N$]
• Replacement
of kWh meters with electricity dispensers [N$]
• Domestic/business single phase [N$]
• All other
consumers - single phase [N$]
• Consumers - three
phase up to 60 amp [N$]
• Consumers - three
phase above 60 amp [N$]
• Business / trading
site single phase [N$]
• Business / trading
site three phase up to 60 amp per phase [N$]
• LPU / Business /
trading site above 60 amp per phase [N$]
ELECTRICITY CONTROL BOARD NATIONAL ELECTRICITY TARIFF STUDY - FINAL REPORT
Page 117 of 186
EMCON – SAD-ELEC – ECON
Section C: Cost of Supply Analysis - Selected Distributors
ELECTRICITY CONTROL BOARD NATIONAL ELECTRICITY TARIFF STUDY - FINAL REPORT
Page 118 of 186
EMCON – SAD-ELEC – ECON
14 Distribution Tariff Analysis: Tariff Structures 14.1 Background
In reviewing tariff structures it is important to understand the fundamental design parameters that separate appropriate from inappropriate structure. The Distribution Tariff Methodology chapters (refer to section B) suggest that an efficient distribution tariff structure should group customers into a number of customer categories. The criteria, which are generally used to define customer categories can be summarised as follows: ! Geographic Region ! Size (kV, Phase (1 or3)) ! Payment Method ! Load factor
The motivation behind these criteria is to apportion customers, based on certain cost drivers, into a small and manageable number of customer categories. In addition to the various tariff components are then combined with the different customer categories to complete the distributors tariff structure. The assorted tariff components can be grouped into two categories fixed (does not vary with consumption) and variable (varies with consumption. There is also a specific frequency of payment attached to each of the components as well (yearly, monthly, incident based or once off). The cost-of-supply analysis tools used in this section can be found on the CD-ROM attached to this Report.
ELECTRICITY CONTROL BOARD NATIONAL ELECTRICITY TARIFF STUDY - FINAL REPORT
Page 119 of 186
EMCON – SAD-ELEC – ECON
14.2 Proposal The design components and criteria of customer categories for each of the distributors are compared in the table below:
Criteria NamPower Northern Electricity Walvis Bay A
Geographic Region Not used The tariffs to all of NamPower�s regions are the same (North, South, Central & Erongo)
• Dist. large (>75kV) • Water pumping • Irrigation agriculture • Mining • Comm. large (>75kV) • Export
• Large Power Users (>3x60amp)
• Large Power User – 3 phase, 400V/11kV (>3x60amp)
! 55-100 kVA ! 101-300kVA ! 301-1000kVA ! >1000Kva)
Cus
tom
er c
ateg
orie
s (q
uant
ity)
Streetlights • Streetlights • Streetlights Total number of categories 11 7 15
ELECTRICITY CONTROL BOARD NATIONAL ELECTRICITY TARIFF STUDY - FINAL REPORT
Page 121 of 186
EMCON – SAD-ELEC – ECON
14.3 Review The following observations can be made with regard to the definition of customer categories.
14.3.1 General ! The first observation is that each distributor has its
own unique set of customer categories grouped based on different criteria. This makes the regulation of distribution tariffs considerable more complex for the ECB. Yardstick or benchmark comparisons between distributors are also made much more challenging. This could result in customer confusion.
! None of the distributors differentiate tariffs based on geographic regions.
! The number (1 or 3) of phases, amps and KVA are preferred technical parameters that are used to define customer categories rather than voltage.
14.3.2 NamPower ! Except for the differentiation between large and
small consumers in the commercial and the distribution customer categories, which is based on a cut-off of 75kVA, it is not clear what other technical criteria NamPower has used to define its customer categories. Rather it would appear as if customers have been categorised based on the type of
consumer (e.g. irrigation agriculture). As explained in the distribution tariff methodology chapter, this method of defining customer categories can lead to bias and a high level of cross-subsidisation.
! NamPower has eleven (11) customer categories, which is a high number given that NamPower has no domestic tariffs.
14.3.3 Northern Electricity ! Northern only has eight (8) customer categories,
the fewest of all three distributors. ! The customer category definitions are
uncomplicated.
ELECTRICITY CONTROL BOARD NATIONAL ELECTRICITY TARIFF STUDY - FINAL REPORT
Page 122 of 186
EMCON – SAD-ELEC – ECON
! Northern�s customer categories are generally in line with our recommended customer category definitions.
! Northern is considering the implementation of a TOU tariff without a demand charge to some of the large power users.
14.3.4 Walvis Bay ! Walvis has fifteen (15) customer categories. ! Walvis makes extensive use of circuit breaker size
(amps) and maximum demand (KVA) to differentiate between customer categories.
14.4 Recommendations ! The ECB should consider promoting greater
standardisation of customer categories to reduce administration costs and promote more efficient regulation.
! NamPower should consider defining customer
categories that are based on more cost reflective
methods. This will prevent/reduce tariff bias and will potentially be fairer.
! Walvis could consider a N$/installed amp charge
rather than a capacity charge for each circuit breaker size to reduce the number of customer categories and the costs.
The following table reflects what, in our opinion, could be seen as an efficient generic tariff structure for Namibia:
ELECTRICITY CONTROL BOARD NATIONAL ELECTRICITY TARIFF STUDY - FINAL REPORT
Page 123 of 186
EMCON – SAD-ELEC – ECON
• Domestic - single phase conventional credit meter o Basic/service charge [N$/amp] o Unit charge [N$ per kWh]
• Domestic - pre-paid meter – single and three phase o Unit charge [N$ per kWh]
• Business and Light Industry – single phase
o Basic/service charge [N$/amp] o Unit charge [N$ per kWh]
• Business and Light Industry – three phase o Basic/service charge [N$/amp] o Unit charge [N$ per kWh]
• Large Power Users – without demand meters o Demand charge (ordered) [N$ per kVA] o Unit charge [N$ per kWh]
• Large Power Users – with demand meters o Demand charge [N$ per kVA] o Unit charge [N$ per kWh]
• Streetlights o per light [N$]
o Unit charge [per kWh]
ELECTRICITY CONTROL BOARD NATIONAL ELECTRICITY TARIFF STUDY - FINAL REPORT
Page 124 of 186
EMCON – SAD-ELEC – ECON
15 Distribution Tariff Analysis: Revenue Requirement
15.1 Guideline A critical step in any tariff level calculation is to identify the relevant revenue requirement components and their sizes. The Distribution Tariff Methodology (refer to section B) identifies the following main categories of expenditure.
! Energy purchases:
This cost for purchasing of electricity from the NamPower. The rates for 2001/2002 are:
! Max Demand = N$52.20/kVA
! Energy = 9.77 c/kWh
! Basic Charge = N$130.20/month
! Operating and maintenance costs:
These costs include general O&M costs associated with operating the network.
! Customer service costs:
These costs include costs directly related to customer services, e.g. metering & billing, marketing and so on.
! Overhead costs:
These costs include costs that are not captured into any of the other cost categories. For example the fixed monthly
ELECTRICITY CONTROL BOARD NATIONAL ELECTRICITY TARIFF STUDY - FINAL REPORT
Page 125 of 186
EMCON – SAD-ELEC – ECON
charges levied by the bulk supply authority should be included in this cost category.
! Asset related costs:
These costs include depreciation of re-valued assets, plus real return (real WACC) on re-valued assets.
! Cost of working capital:
These costs include the portion of the capital base not contained in asset values multiplied by the real WACC.
! Bad debts:
These costs include the revenue from the previous year that was written off, and interest on this amount.
! Other charges:
Revenue (or losses) from other charges: e.g. disconnection and reconnection charges, meter testing services and so on.
! Reconciliation adjustment:
This component is to account for over/under recovery in the preceding year & interest on this amount (use nominal WACC).
ELECTRICITY CONTROL BOARD NATIONAL ELECTRICITY TARIFF STUDY - FINAL REPORT
Page 126 of 186
EMCON – SAD-ELEC – ECON
15.2 Proposals The following table lists the proposed revenue requirement components and values as submitted by the distributors for the period 2001/2002.
NamPower29 Northern Electricity30 Walvis Bay Revenue
Requirement Components Description Value
(N$ ‘000) Description Value (N$ ‘000) Description Value
29 NamPower numbers obtained from report titled response to ECB Consultants information request, 9 November 2001.
30 Values from Northern Electricity’s Report titled Tariff Study 2002 dated 14 October 2001.
31 No specific customer services cost was provided. For the purpose of this project it was assumed that the total O&M costs ($8 065k) consisting of; salaries ($5744k), general expenses ($1521k) and repairs and maintenance ($796k) could be split 50/50 between O&M and customer services.
32 Income from other sources such as connection & reconnection charges, meter calibration, availability fees.
ELECTRICITY CONTROL BOARD NATIONAL ELECTRICITY TARIFF STUDY - FINAL REPORT
Page 127 of 186
EMCON – SAD-ELEC – ECON
NamPower29 Northern Electricity30 Walvis Bay Revenue Requirement Components Description Value
(N$ ‘000) Description Value (N$ ‘000) Description Value
(N$ ‘000) Reconciliation
adjustment - - - - - -
Not
Allo
wed
Electrification fund Contributions to community
1 323 951
Capital charges • Redemption • Interest Reserves • Maintenance Funds • Capital
Development Capex
1 756 2 680
103
3 000
1 487
Total 155 564 50 733 74 017
ELECTRICITY CONTROL BOARD NATIONAL ELECTRICITY TARIFF STUDY - FINAL REPORT
Page 128 of 186
EMCON – SAD-ELEC – ECON
15.3 Recommendations The following table shows the recommended revenue requirements and its components for the period 2001/2002.
NamPower33 Northern Electricity34 Walvis Bay Revenue
Requirement Components Description Value
(N$ ‘000) Description Value (N$ ‘000) Description Value
33 Unless otherwise stated, the NamPower numbers were obtained from the response to ECB Consultants information request, 9 November 2001
34 Values from Northern Electricity’s Report titled Tariff Study 2002 dated 14 October 2001.
35 Number produced by spreadsheet model based on NamPower’s information and a real pre-tax ROR of 9.2%
36 Number produced by spreadsheet model based on Walvis’ information and a real pre-tax ROR of 9.2
37 NamPower has in indicated that connection fees make up 7% of its revenues. The value of ($5 996k) has been determined as 7% of $85 652k
ELECTRICITY CONTROL BOARD NATIONAL ELECTRICITY TARIFF STUDY - FINAL REPORT
Page 129 of 186
EMCON – SAD-ELEC – ECON
NamPower33 Northern Electricity34 Walvis Bay Revenue Requirement Components Description Value
(N$ ‘000) Description Value (N$ ‘000) Description Value
(N$ ‘000) Reconciliation
adjustment - - - - - -
Not
Allo
wed
Electrification fund Contributions to community Provision for bad debt
1 323 951
129
Total 140 848 51 763 93 114
15.4 Review The following observations can be made.
15.4.1 General ! The financial information from the three
distributors differs substantially in terms of expense categories and definitions. This will increase the complexity and workload of the ECB who must regulate and approve the distributors� tariffs.
! The ECB should give consideration to
standardise the definitions and reporting format of the financial information. The distribution
licenses and the information in the Distribution Tariff Methodology section could be of assistance.
! Energy purchases is one of the biggest costs for
a distributor. The purchase price from the Single Buyer (including generation and transmission costs) should be finalised before any final decisions and recommendations regarding the financial viability of a distributor can be made.
ELECTRICITY CONTROL BOARD NATIONAL ELECTRICITY TARIFF STUDY - FINAL REPORT
Page 130 of 186
EMCON – SAD-ELEC – ECON
15.4.2 Northern Electricity ! Northern reflects no asset related charges due
to its status as a management contractor with limited own assets. Northern Electricity�s distribution assets are held by Ministry of Regional, Local Government and Housing. However, estimates of asset values were obtained and included for further analysis.
! Northern makes voluntary contributions to an
electrification fund and to the councils, which are not normally part of a distributor�s revenue requirement.
15.4.3 Walvis Bay ! Indicative replacement asset values have been
obtained from Walvis. ! The capital redemption and interest charges
have been disallowed in terms of the revenue requirement process where returns are calculated using Earnings Before Interest and Taxes (EBIT) and current cost asset values.
! Walvis has established maintenance reserve fund. It is unclear what the purpose of this fund is. Until more detail is available the fund will not form part of Walvis� revenue requirement.
! The capital development fund is normally used to partially finance future capital expenditures. Contributions to this fund will probably not form part of Walvis� revenue requirement. A more detail discussion of the treatment of future planned investments can be found in the Distribution Tariff Methodology section, refer to section B. Both these funds are probably intended to finance certain for certain unforeseen events (insurance).
ELECTRICITY CONTROL BOARD NATIONAL ELECTRICITY TARIFF STUDY - FINAL REPORT
Page 131 of 186
EMCON – SAD-ELEC – ECON
15.4.4 Comparisons The fact that distributors have different sizes makes it inappropriate to compare their expenditures. The following table expresses the performance of the distributors either as a percentage or as a unit of send out or unit of customer. These percentage or
unit values removes the size differences and makes comparisons more meaningful. The following table contains some key parameters for 2001/2002.
Criteria NamPower Northern Electricity Walvis Bay
Controllable cost (Allowed cost excl energy purchases & asset related charges) (N$ �000)
The table shows: ! It would appear from these relatively simple comparisons that NamPower is the most expensive distributor based on controllable costs. These comparisons ignore important factors such as customer profiles and size and population density of the region. ! The benchmark unit costs for Northern Electricity and Walvis Bay appear to be fairly on par. Northern has a low cost / customer but Walvis Bay has a lower cost/kWh number. Refer to the graph on the right.
ELECTRICITY CONTROL BOARD NATIONAL ELECTRICITY TARIFF STUDY - FINAL REPORT
Page 133 of 186
EMCON – SAD-ELEC – ECON
16 Distribution Tariff Analysis: Distributor Information
16.1 NamPower information
ELECTRICITY CONTROL BOARD NATIONAL ELECTRICITY TARIFF STUDY - FINAL REPORT
Page 134 of 186
EMCON – SAD-ELEC – ECON
16.1.1 Customer details38 The following table shows the customer details that are required to calculate costs reflective tariffs.
Customer Customer Numbers Expected Annual
Sales (MWh) Expected Avg. Max Demand in
kW or (lf%) Meter Type
≤ 33 kV39 Vn ≤ 33 kV Vn ≤ 33 kV Vn ≤ 33 kV Vn Dist. small (<75kVA) 179 9 247 (7.8%) Energy Farms main supply 1 123 24 443 (8.0%) Energy Plots, schools & clinics 661 25 371 (9.7%) Energy Comm. small (<75kV) 89 4 858 (12.0%) Energy Farms add. supply 183 2 938 (6.1%) Energy Dist. large (>75kV) 69 81 311 29 637 Max.Dem Water pumping 163 24 835 (11.5%) Energy Irrigation agriculture 25 10 878 10 280 Max.Dem Mining 4 9 888 3 859 Max.Dem Comm. large (>75kV) 46 27 775 24 615 Max.Dem Export 3 7 647 1 124 Max.Dem Total 2 545 229 191
38 Unless otherwise stated, the NamPower numbers were obtained from the response to ECB Consultants information request, 11 November 2001.
39 NamPower distribution serves all NamPower’s customers. These customers can be grouped into three groups namely 1) Transmission customers (those customers coupled directly to the transmission system), 2) Primary customers (those distribution customers who take their supply at 66kV and above), and 3) Secondary customers (those who take their supply at 33kV and below). The above numbers only refer to secondary customers.
ELECTRICITY CONTROL BOARD NATIONAL ELECTRICITY TARIFF STUDY - FINAL REPORT
Page 135 of 186
EMCON – SAD-ELEC – ECON
16.1.2 Asset valuation The following table shows the customer details that are required to calculate costs reflective tariffs.
Asset Voltage Level Depreciation40 Replacement
Value40 %
Subsidised40 Average Age41 Investments in
200242 Type 1 ≤ 33 kV 3.13% N$ 438 million 29% 11.2 N$ 0 million Type n
16.1.3 Losses, arrears and theft The following tables show the customer details that are required to calculate costs reflective tariffs.
Average Arrears Technical Losses
Customer Days43 Voltage % Losses Theft % Losses Bad Debt N$ million
All Categories 30
Level 1 12.1%44
Theft 0% Bad Debt N$ 0 million
Level n
40 Derived from information provided by NamPower in response to ECB Consultants information request, 11 November 2001
41 Number calculated using asset life, replacement value and estimated current value of N$ 438 million obtained from NamPower’s response to ECB’s information request dated 11 November . This value has been calculated as follows (Replacement value – Current value)/(3.13% of Replacement value).
42 Assumed that ROR calculations will be done annually and new investments will reflected in the following year’s asset base.
43 Assumed to be 30 days.
44 From report “Response to ECB Consultants Information Request”, 7 August 2001
ELECTRICITY CONTROL BOARD NATIONAL ELECTRICITY TARIFF STUDY - FINAL REPORT
Page 136 of 186
EMCON – SAD-ELEC – ECON
16.2 Northern Electricity information 16.2.1 Customer details45
The following table shows the customer details that are required to calculate costs reflective tariffs.
Customer Customer Numbers Expected Annual
Sales (MWh) Expected Avg. Max Demand in kW/kVA or (lf%)
Meter Type
≤ 33 kV46 Vn ≤ 33 kV Vn ≤ 33 kV Vn ≤ 33 kV Vn 1&3 ph, pre-pay47 11 461 27 040 (2.9%) Energy Dom, 1 ph, credit 713 4 161 (5.0%) Energy Bus, 1 ph, credit 459 2 304 (6.0%) Energy Bus, 3 ph, credit 771 13 826 (6.0%) Energy Large Power User 246 39 616 23 671 Max.Dem Streetlights 85 1 224 (49.8%) Energy
45 Values from Northern Electricity’s Report titled Tariff Study 2002 dated 14 October 2001.
46 NamPower distribution serves all NamPower’s customers. These customers can be grouped into three groups namely 1) Transmission customers (those customers coupled directly to the transmission system), 2) Primary customers (those distribution customers who take their supply at 66kV and above), and 3) Secondary customers (those who take their supply at 33kV and below). The above numbers only refer to secondary customers.
47 Northern cannot charge different rates for single and three phase customers due to technology limitations, the rate is therefore the same for all prepayment customers.
ELECTRICITY CONTROL BOARD NATIONAL ELECTRICITY TARIFF STUDY - FINAL REPORT
Page 137 of 186
EMCON – SAD-ELEC – ECON
16.2.2 Asset valuation The following table shows the details of the asset types that are required to calculate costs reflective tariffs.
Asset Voltage Level Depreciation Replacement Value48
% Subsidised49 Average Age Investments in
2000 Type 1 ≤ 33 kV 5% per year50 N$55.551 million 0% 8 years52 Not used
48 Northern Electricity is a management contractor with limited own assets. Northern Electricity’s distribution assets are held by Ministry Of Regional, Local Government And Housing.
49 Value of 50% recommended by Northern Electricity.
50 This value has been estimated assuming an average asset life of 20 years.
51 An addition component of 25% was added to the existing asset value of N$55.5 million to include the valuation of service connections
52 This value has been calculated as follows (Replacement value – Current value)/(5% of Replacement value). Northern has indicated that the Current value of its assets is N$ 33.48 million. Therefore average age = (55.5-33.48)/(.05*55.5)=8. The calculated age correlates well with the comments from Northern that its assets are generally new and that the average age of the equipment should be below 10 years.
ELECTRICITY CONTROL BOARD NATIONAL ELECTRICITY TARIFF STUDY - FINAL REPORT
Page 138 of 186
EMCON – SAD-ELEC – ECON
16.2.3 Losses, arrears and theft The following tables show the other related information that is required to calculate costs reflective tariffs.
Average Arrears Technical Losses
Customer Days53 Voltage %
Losses54
Non-Technical
losses % Losses Bad Debt N$ million
All Categories 60
Level 1 10%
Per year N$ 0.06
million Level n
Admin errors (3%) & theft
(2%) 2%
53 Assumed to be 60 days.
54 NE has indicated a combined loss value of 12%. This was split between technical (10%) and non-technical (2%).
ELECTRICITY CONTROL BOARD NATIONAL ELECTRICITY TARIFF STUDY - FINAL REPORT
Page 139 of 186
EMCON – SAD-ELEC – ECON
16.3 Walvis Bay information 16.3.1 Customer details
The following table shows the customer details that are required to calculate costs reflective tariffs.
Customer Customer Numbers55
Expected Annual Sales (MWh)
Expected Avg. Max Demand in kW/kVA or (lf%)
Meter Type
≤ 33 kV56 Vn ≤ 33 kV Vn ≤ 33 kV Vn ≤ 33 kV Vn <20A, Dom, prepay -subsidy - - - Prepay <20A, Dom Credit (+basic charge) 692 4 346 (28.4%) Energy <20A, Dom Credit (no basic charge) - - - Energy >20A, Dom Credit (+basic charge) 7 101 45 087 (20.3%) Energy >20A, Dom Credit (no basic charge) - - - Energy >20A, Dom, prepay - - - PrePay 3x25A C/B, Bus, Credit 48 999 (11.5%) Energy 3x40A C/B, Bus, Credit 99 3 504 (12.2%) Energy 3x60A C/B, Bus, Credit 109 4 061 (8.6%) Energy 3x80A C/B, Bus, Credit 105 5 300 (8.7%) Energy 3x55-100kVA, Bus,Credit 40 6 844 2 800 Max.Dem 3x101-300kVA, Bus, Cr 37 15 433 6 734 Max.Dem 3x301-1000kVA, Bus, Cr 12 13 157 5 304 Max.Dem 3x>1000kVA, Bus, Credit 10 40 690 14 020 Max.Dem Streetlights 2 580 3 078 (47.5%) Energy
55 Numbers have been obtained from Walvis E2001-2001.xls file.
56 Walvis does not differentiate its tariffs on voltage levels. The value of 33kV and lower has been used because it is the official definition of the distribution boundary.
ELECTRICITY CONTROL BOARD NATIONAL ELECTRICITY TARIFF STUDY - FINAL REPORT
Page 140 of 186
EMCON – SAD-ELEC – ECON
16.3.2 Asset valuation The following table shows the details of the asset types that are required to calculate costs reflective tariffs.
57 A 20 year life for distribution assets have been assumed
58 A replacement value of $556 million has been obtained from Walvis.
59 A 10% value has been assumed.
60 It is understood that the Walvis Bay distribution assets are quite old and an average age of 15 years have been assumed.
Asset Voltage Level Depreciation%57 Replacement
Value58 %
Subsidised59 Average Age60 Investments in 2001
Type 1 ≤ 33 kV 5% per year $ 556 million 10% 15 years No used
ELECTRICITY CONTROL BOARD NATIONAL ELECTRICITY TARIFF STUDY - FINAL REPORT
Page 141 of 186
EMCON – SAD-ELEC – ECON
16.3.3 Losses, arrears and theft The following tables show additional information that is required to calculate costs reflective tariffs.
Average Arrears Technical Losses61 Customer Days62 Voltage % Losses Theft % Losses Bad Debt N$ million
All Categories 60
≤ 33 kV 5%
Admin & theft 0% Bad debt N$ 0.1
million Level n
16.3.4 Maximum charge
61 Distribution losses percentage obtained from spreadsheet Sales2 in Walvis E2001-2001.xls file.
62 Assumed to be 60 days.
Walvis charges a maximum charge of 50c/kWh for its domestic consumers with a maximum 20-amp circuit breaker. The maximum charge for domestic customers with a circuit breaker of more than 20 amps is 100c/kWh.
ELECTRICITY CONTROL BOARD NATIONAL ELECTRICITY TARIFF STUDY - FINAL REPORT
Page 142 of 186
EMCON – SAD-ELEC – ECON
17 Distribution Tariff Analysis: Tariffs This section compares the existing tariffs of the three distributors against a set of tariffs, which have been calculated using the proposed methodology, which has been described in
the section Distribution tariff methodology, and the information from the surveys.
ELECTRICITY CONTROL BOARD NATIONAL ELECTRICITY TARIFF STUDY - FINAL REPORT
Page 143 of 186
EMCON – SAD-ELEC – ECON
17.1 NamPower tariffs NamPower Calculated
Proposed Tariff Results63 Proposed Tariff Results Customer class
63 These results were not received as part of NamPower’s information packages. The numbers were reversed engineered using customer detail for the period 1999/2000. If these details
are escalated by 10.9% and the above rates are applied then the expected revenues ($85 642k) for 2002 are achieved.
ELECTRICITY CONTROL BOARD NATIONAL ELECTRICITY TARIFF STUDY - FINAL REPORT
64 The proposed NamPower tariffs don’t show any rates for export. An average energy rate was calculated from 2000 data, which was escalated to 2002 using an effective escalation
rate of 10.9%.
ELECTRICITY CONTROL BOARD NATIONAL ELECTRICITY TARIFF STUDY - FINAL REPORT
68 The proposed tariff information from Walvis Bay covered the period 2001/2002.
69 The value in brackets indicate what the basic charge will be if it is expressed as a $/amp rather than a $/month value.
ELECTRICITY CONTROL BOARD NATIONAL ELECTRICITY TARIFF STUDY - FINAL REPORT
Page 147 of 186
EMCON – SAD-ELEC – ECON
ECB Tariff study : Phase 2 ECB / emCON / SAD-ELEC
Average Price Levels
0
1 0
2 0
3 0
4 0
5 0
6 0
7 0
Nam Pow er Northern W alv is
Av
era
ge
Ra
te (
c/k
Wh
) fo
r 2
00
2
P resen t Calculated
17.4 Observations ! The most glaring observation in the case of NamPower and
Walvis is the large increase in the average tariff proposed by the distributor and the average tariff determined through the application of the Distribution tariff methodology (section B), refer to the adjoining graph for comparisons. The reason for this substantial increase is due to the much higher revenue requirement for these two distributors caused by their large distribution infrastructure investments. This, in turn, contributes to huge Network Asset revenue requirements (consisting of depreciation and rate-of-return).
! The graph also shows that the average calculated tariff is very
similar to that which has been proposed by Northern Electricity. ! The information from NamPower and Northern does
not explain in sufficient detail how the proposed tariff levels have been determined. Walvis has provided a partial explanation which can be summarized as follows:
! The basic charge for each customer class has been
calculated using a cost per connection value discounted over 20 years at a discount rate (equal to the interest rate) of 15%. The cost per connections are N$2 000 for domestics, N$5 000 for small power users and N$8 000 for large power users. The
documentation states that they obtained this method and numbers from a workshop, which was held on 20 and 22 November.
ELECTRICITY CONTROL BOARD NATIONAL ELECTRICITY TARIFF STUDY - FINAL REPORT
Page 148 of 186
EMCON – SAD-ELEC – ECON
! In addition to the basic charge Walvis also calculated the purchase cost of electricity for domestic and small power users based on representative maximum demand and energy consumption values. Walvis then added a 13.18% Local Authority Tax to the calculated purchase price which represents the desired revenue from the relevant customer category. This revenue requirement was then somehow split between a fix and variable component.
! For bulk users Walvis has adopted a strategy to keep
the maximum demand charges constant until NamPower�s charge reach that of the bulk consumer group. Once NamPower�s and Walvis� maximum demand charges are the same then Walvis will adjust its maximum demand annually to be the same as NamPower�s. The intent is then to recover Walvis cost through and energy (c/kWh) charge.
! Another general observation is that larger consumers
tend to cross subsidise smaller consumers. The following graphs show that this is particularly the case for Northern and Walvis. This can be observed from the trend that larger consumers� contribution (expressed as a percentage) reduces from the proposed to the calculated tariff scenarios. This is the
reason why smaller customers experience an increase in excess of the average increase. The following graphs show the percentage increase per customer category for each of the distributors.
! NamPower�s information show that cross
subsidization between customer classes is not related to size, rather it appears random and may perhaps be explained by the fact that NamPower�s customer categories are not separated on pure technical considerations as is the case in Northern and Walvis.
! A number of smaller observations can be made with
regards to the differentiation between Basic Customer services charges, Energy charges and Demand charges between the proposed and calculated rates. The most significant of these is that almost all customer classes have relatively low load factors. This creates the opportunity for the distributor to receive a substantial benefit from diversity. This and other considerations would imply that a distributor should take care in calculating the level of the tariff components to ensure cost reflective and efficient pricing.
ELECTRICITY CONTROL BOARD NATIONAL ELECTRICITY TARIFF STUDY - FINAL REPORT
Page 149 of 186
EMCON – SAD-ELEC – ECON
ECB Tariff study : Phase 2 ECB / emCON / SAD-ELEC
NamPower: Estimated Price Increase (in %) per Customer Category to Become Cost-Reflective
-50
0
50
100
150
200Fa
rms
add.
sup
ply
Plot
s, s
choo
ls &
clin
ics
Farm
s m
ain
supp
ly
Dist
. sm
all (
£75k
VA)
Com
m. s
mal
l(£
75kV
)
Min
ing
Com
m. l
arge
(>75
kV)
Wat
er p
umpi
ng
Dist
. lar
ge (>
75kV
)
Expo
rt
Irrig
atio
n ag
ricul
ture
Ta
riff
in
cre
ase
(%
) fr
om
pro
po
sed
to
ca
lcu
late
d
Estimated average tariff increase required to
become cost reflective
ELECTRICITY CONTROL BOARD NATIONAL ELECTRICITY TARIFF STUDY - FINAL REPORT
Page 150 of 186
EMCON – SAD-ELEC – ECON
ECB Tariff study : Phase 2 ECB / emCON / SAD-ELEC
Northern: Estimated Necessary Price Increase (in %) per Customer Category to Become Cost-Reflective
-6 0
-4 0
-2 0
0
2 0
4 0
6 0
8 0
1 0 0
1 2 0
Prep
ay
Dom
estic
Cr
Busi
ness
Cr 1
Busi
ness
Cr 3
Larg
e Po
wer
Use
r
Stre
etlig
hts
Ta
riff
in
cre
as
e (
%)
fro
m p
rop
os
ed
to
ca
lcu
late
d
Estimated average tariff increase required to become
cost reflective
ELECTRICITY CONTROL BOARD NATIONAL ELECTRICITY TARIFF STUDY - FINAL REPORT
Page 151 of 186
EMCON – SAD-ELEC – ECON
ECB Tariff study : Phase 2 ECB / emCON / SAD-ELEC
Walvis: Estimated Necessary Price Increase (in %) per Customer Category to Become Cost-Reflective
-30
-10
10
30
50
70
90
110
130
150St
reet
light
s
<20A
, Cr (
+cap
ch)
>20A
Cre
dit (
+cap
ch)
Cr, 3
ph,
25A
C/B
Cr, 3
ph,
60A
C/B
Cr, 3
ph,
40A
C/B
Cr, 3
ph,
80A
C/B
Cr, 3
ph,
55-
100k
VA
Cr, 3
ph,
101
-300
kVA
Cr, 3
ph,
301
-10
00kV
A
Cr, 3
ph,
> 1
000k
VATa
riff
in
cre
ase
(%
) fr
om
pro
po
sed
to
ca
lcu
late
d
Estimated average tariff increase required to
become cost reflective
ELECTRICITY CONTROL BOARD NATIONAL ELECTRICITY TARIFF STUDY - FINAL REPORT
Page 152 of 186
EMCON – SAD-ELEC – ECON
17.5 Recommendations and conclusions • It is clear that the process described in the
Distribution tariff methodology chapters can be used to calculate cost reflective distribution tariffs. This is achieved by defining an appropriate tariff structure, identifying the relevant revenue requirement components, determining the size of these components and by calculating the tariffs based on certain design criteria.
• However, there are a number of assumptions, which
must be clarified before the tariff level calculations can be calculated. These include the cost of energy purchases (including generation and transmission
costs), reliable assets registers and appropriate asset life estimates. In addition a fair ROR also needs to be specified.
• There are other factors that would influence the tariff
structures and levels and could cause a distributor to move away from pure cost reflective tariffs, such as access to affordable electricity by poorer communities.
ELECTRICITY CONTROL BOARD NATIONAL ELECTRICITY TARIFF STUDY - FINAL REPORT
Page 153 of 186
EMCON – SAD-ELEC – ECON
18 Distribution Tariff Analysis: Other Charges
There are normally a number of smaller charges that a distributor may levy in addition to the energy and customer related charges. These may include connection, re-connection, testing call-out and other related charges. The total monetary value of these charges is normally small in relation to the energy charges. These charges are normally set to recover the cost of the service and should therefore not have a large impact on the calculation of the energy and customer related charges. In some cases these charges act as a signal to encourage or discourage certain behaviour. A good example of such a charge is if a customer�s meter has been tampered with. A high tariff for fixing an installation, which has been tampered with,
will discourage future customers to tamper with their meter installations. In instances where these charges are not small care should be taken to ensure that these charges are fair. In the case of NamPower, its connection charges contribute 7% of the total turnover of the company. NamPower�s connection charges have been discussed in more detail in the Phase 1 Report. Below is a list of these charges and their price levels; no additional information was obtained from NamPower.
ELECTRICITY CONTROL BOARD NATIONAL ELECTRICITY TARIFF STUDY - FINAL REPORT
Page 154 of 186
EMCON – SAD-ELEC – ECON
18.1 Service fees/charges The following table shows the various Service Fees that are in use.
Northern Electricity Walvis Bay General Description
Description Charge (N$) Description Charge
(N$)
Minimum charge per stand Electricity available but not connected 0.08/m2
Disconnection Disconnection 75
Reconnection Reconnection 75 • Normal • Replacement of seal • Re-connect cable
20 80
120 Payment reminder notice Hand delivery 30
Call out fee
Requested by customer incl. • Inspection • Token sales after hours • Fault on customer�s installation
75
Meter test requested by customer.
• 1 Phase • 3 Phase * Fee will be rebated if meter is faulty
150 300 Testing of meters (each) 50
Request for change of tariff
• Credit to pre-payment and vice versa
• Other
600
Actual cost
Meter tampering • First offence • ≥ Second offence
850 Legal action
Ready Board Supply, installs and test 485
ELECTRICITY CONTROL BOARD NATIONAL ELECTRICITY TARIFF STUDY - FINAL REPORT
Page 155 of 186
EMCON – SAD-ELEC – ECON
18.2 Connection fees analysis The following table shows the various Connection Fees that are in use.
Northern Electricity Walvis Bay General Description
Description Charge (N$) Description Charge
(N$)
Domestic Pre-paid Credit
180 2 200
Pre-paid Credit
600 500
Small user / Business
Pre-paid • Single phase • 3 phase Credit • Single phase • 3 phase
2 200 5 500
2 200 4 850
Credit 5 000
Large Large Power User Actual cost Large Power User Actual cost Street Lights Actual cost
ELECTRICITY CONTROL BOARD NATIONAL ELECTRICITY TARIFF STUDY - FINAL REPORT
Page 156 of 186
EMCON – SAD-ELEC – ECON
18.3 Overall deposits analysis The following table shows the various deposits that are in use.
Northern Electricity Walvis Bay General Description
Description Charge (N$) Description Charge
(N$)
Domestic Pre-paid Credit
N/A 170
Tariff A (≤20A) • Credit • Pre-paid Tariff B (>20A) • Credit • Pre-paid
120 N/A
450 N/A
Small user / Business
Pre-paid • Single phase • 3 phase Credit • Single phase • 3 phase
ELECTRICITY CONTROL BOARD NATIONAL ELECTRICITY TARIFF STUDY - FINAL REPORT
Page 157 of 186
EMCON – SAD-ELEC – ECON
Appendix A – Terms of Reference
NATIONAL ELECTRICITY TARIFF STUDY 1. OBJECTIVE To retain consultants who shall conduct a comprehensive and detailed nationwide study of existing electricity tariffs at all levels of the Namibian ESI value chain (generation, transmission, distribution and supply) and design tariff policy and methodologies that enhance the efficient allocation of resources, promote the financial viability of the ESI and are simple to implement. 2. BACKGROUND The Namibian Electricity Supply Industry (ESI) is undergoing fundamental change in terms of its institutional, regulatory and commercial framework. The recently promulgated Electricity Act 2000 (Act 2 of 2000) created an independent regulatory authority - the Electricity Control Board, and makes provision for ring-fencing of generation, transmission and distribution of electricity through a licensing system managed by the Electricity Control Board. At the same time a parallel process of restructuring the distribution segment of the ESI is underway, aimed at optimising the distribution function in the country through the creation of Regional Electricity Distribution (REDs) companies covering larger geographic areas than the existing participants presently cover. It is anticipated that the larger geographic area will allow for a broader customer base and lower cost of service, as well as optimise the use of scarce financial and technical resources. In meeting this challenge and exercising its regulatory functions the Electricity Control Board and the Ministry of Mines & Energy have come to inevitable conclusion that the existing tariff structures in operation at different levels of the Namibian ESI are not conducive to the goals as set out in the Energy Policy White Paper and, in many cases, are not transparent or cost reflective. Furthermore the methodologies used to arrive at tariffs are so opaque that in many cases even the bodies applying them do not clearly understand them.
ELECTRICITY CONTROL BOARD NATIONAL ELECTRICITY TARIFF STUDY - FINAL REPORT
Page 158 of 186
EMCON – SAD-ELEC – ECON
3. SCOPE OF WORK - Phase 1 3 .1 The consultants will be required to examine all existing tariffs in the country, their levels, structure and the methodological principles behind these tariffs. The consultants shall than critically review the tariffs principles and structures/components against international trends and the internal institutional capacities (technology, manpower and financial) of each tariff setting institution in the country. A detailed analysis of the tariff methodologies used by the various tariff-setting institutions shall be required. For the purpose of this study the tariff-setting institutions are as follows:
• NamPower � Large and small customer tariffs, import and export
• Municipal authorities � Residential, commercial and industrial tariffs
• Northern Electricity � Residential, commercial and industrial tariffs
• MRLG&H � Residential and commercial tariffs
3.2 An important deliverable of Phase 1 is an economic comparison of pre-payment metering tariffs versus conventional metering tariffs and a cost-benefit analysis of the two technologies. This is to ensure that pre-payment customers are not over-charged and that the basis of pre-payment tariffs is the same as similar size conventional tariffs. 3.3 Another important deliverable of Phase I is the question of NamPower "extension charges", particularly as they relate to government funded rural electrification assets and infrastructure. The consultants shall be required to make a comprehensive analysis of the underlying principles behind these charges and assess the validity of those principles. 3.4 In the execution of the assignment the consultant shall have access to and make use of previous studies on tariffs, costs of supply, energy pricing and other related information in the possession of the Ministry, Electricity Control Board and/or prospective licensees. 4. SCOPE OF WORK - Phase II 4.1 The consultants shall work with the study co-ordination team to enhance and expand upon the national tariff policy of the Electricity Control Board, based on the Energy Policy White Paper and other relevant policy documents already in existence. Being a national policy it is envisaged that extensive stakeholder inputs will be required in this activity. 4.2 Based on the outcomes of Phase 1 the consultants shall in Phase II work with the client to develop tariffs structures and systems for the different types of licensee (generation, transmission, distribution and import/export). The underlying principles
ELECTRICITY CONTROL BOARD NATIONAL ELECTRICITY TARIFF STUDY - FINAL REPORT
Page 159 of 186
EMCON – SAD-ELEC – ECON
that the consultant should use in devising the new tariff regime for each segment of the ESI value chain are:
• Simple and easy to implement
• Be cost-reflective
• Be transparent, any subsidies, taxes and levies must be up-front and visible
• Must send clear cost signals to consumers
• Must be in line with international best practice 4.3 It is expected the consultants would designate common principles of customer classification according to consumption patterns and contribution to the cost of supply. The classification would follow existing classifications with the proviso that they are adopted (where applicable) by all ESI participants of a particular value chain segment in a uniform manner. Each customer class would have similar tariff components and cost allocation. It should be noted that individual cost of supply studies should be conducted by licensees as part of their license conditions (where this has not already done).
5. REPORTING The Ministry and the Electricity Control Board shall each appoint counterparts to co-ordinate the study together with the Norwegian Energy & Water Administration (NVE). Each completed phase of the study shall be presented and discussed in a workshop with the consultants. The study shall be deemed complete after the client has accepted the Phase II Report. 6. DURATION It is envisaged that the timeframe of Phase 1 shall be 16 weeks from the last week in January 2001 and the Phase II shall be 12 weeks thereafter, with a 2-week interlude between the two phases. 7. LOCAL CONTENT Should the consultant be non-resident in Namibia they would be expected to include Namibians in their project team and/or show proof of skills transfer to local counterparts in the area of electricity pricing. 8. FEES The fees of the selected consultants shall be agreed upon between the client and the consultants based on the content of this ToR, on a suitable basis to be agreed upon with the Electricity Control Board, the Ministry, and NVE.
ELECTRICITY CONTROL BOARD NATIONAL ELECTRICITY TARIFF STUDY - FINAL REPORT
Page 160 of 186
EMCON – SAD-ELEC – ECON
Appendix B –Study Phase Activities
B.1 Phase 0
Phase 0 included the following key activities: • Inception meeting with ECB/MME/NVE (Task 0.1)
The focus in this activity was to initiate the present Study, and find agreement with the Client on the project philosophy, policy, expectations, outputs and final deliverables. o In a meeting held on 13 February 2001 between the Consultant Team and the
Client, suggestions and comments regarding the initial EMCON tariff study proposal were made. These were subsequently incorporated into a revised proposal, submitted on February 20, 2001. This revised proposal was accepted by the Client, and defines the final scope of work of the present Study.
o An Inception meeting was held on 23 March 2001. • Finalisation of scope of work (Task 0.2)
o The revised EMCON Study proposal dated 20 February 2001 was accepted as the final scope of work for this Study.
o A contract agreement including the payment schedule was signed on 29 March 2001.
• Notification of stakeholders (Task 0.3)
o A list of all national stakeholders was compiled by the Consultants, and checked for completeness against the ECB in-house list.
o A letter by the ECB, introducing the Consultant Team, was mailed to all stakeholders on 6 April 2001.
o A letter requesting electricity tariff information was mailed to all municipalities, town councils and other supply authorities and mines dealing in electricity by EMCON on 10 April 2001.
ELECTRICITY CONTROL BOARD NATIONAL ELECTRICITY TARIFF STUDY - FINAL REPORT
Page 161 of 186
EMCON – SAD-ELEC – ECON
o Detailed discussions with sample supply authorities (Walvis Bay as the urban distributor, Okahandja as a typical small town distributor, Northern Electricity as a rural distributor and NamPower as the commercial farm distributor) were held between the end of April and late June 2001.
• Obtain existing tariff studies (Task 0.4)
o A broad literature search and information gathering was undertaken in April 2001 in order to obtain all existing tariff studies relevant to this Study.
o The Ernst & Young Mongula work for NamPower was studied, and several detailed discussions with NamPower were held (10&11 May, 31 May & 1 June, and 22 June 2001).
o Several tariff studies undertaken by/for other supply authorities were obtained.
B.2 Phase I
This phase focused on the collection and analysis of existing electricity tariffs in use in Namibia, and included the following key tasks: • Data gathering (Task 1.1)
o Details of most electricity tariff structures presently existing in Namibia were obtained by way of a questionnaire survey.
o NamPower, the Ministry of Regional and Local Government and Housing, Northern Electricity, the Department of Works, municipalities, town councils, village councils and mines were contacted.
o Telephonic follow-up interviews were conducted on 3 and 23 May 2001. o A faxed reminder to local authorities and distributing authorities was mailed on
23 May 2001. o Four supply authorities were investigated in more detail (Walvis Bay as the
urban distributor, Okahandja as a typical small town distributor, Northern Electricity as a rural distributor and NamPower as the commercial farm distributor).
o Existing tariff structures and cost of supply breakdowns for sample supply authorities were obtained.
o NamPower was visited and interviewed, with special focus on wholesale electricity tariffs for generation and transmission, distribution to commercial farms, and the application of extension charges (10&11 May, 31 May & 1 June, and 22 June 2001).
• Development of tariff data base (Task 1.2)
o A spreadsheet based tariff database was designed, and populated with the collected tariff data.
o Summary statistics were prepared. • Economic comparison between prepayment and credit metered tariffs (Task
1.3) - The final scope of work as per Study proposal excludes this task.
ELECTRICITY CONTROL BOARD NATIONAL ELECTRICITY TARIFF STUDY - FINAL REPORT
Page 162 of 186
EMCON – SAD-ELEC – ECON
• Review of NamPower’s proposed tariff methodology and approach (Task 1.4) o NamPower�s proposed tariff methodology and approach was critically
reviewed, in particular the generation, transmission and end-user tariff methodologies, the asset valuation for transmission and distribution, the capacity payments for generation, the way in which NamPower handles assets subsidised by donor grants and assets paid for by customers.
o Information on NamPower�s extension charges was obtained and analysed, particularly in view of NamPower�s present tariffs as well as their proposed tariff method and approach.
• Phase 1 Report (Task 1.5)
o The methodology and analysis of tariff structures was documented. o The Report was circulated for comment and approval to the Client.
• Workshop (Task 1.6) – took place on 2 July 2001 o The Phase I Report was discussed with the ECB, MME and NVE. o The Client�s comments were recorded and incorporated where applicable into
the Final Phase I Report. o Activities for Phase II of the Study were discussed in light of the Phase I
results.
B.3 Phase II
Phase II of the National Electricity Tariff Study focused on the development of national tariff principles, and includes the following key tasks:
• Analysis of distribution cost of supply for different distributor categories (Task 2.2) This task focused on distribution cost of supply only, as the generation and transmission cost-of-supply principles have been dealt with in the recent E&Y Mongula study undertaken for NamPower (refer to the chapters 3 to 8 in this Report).
• Development of appropriate tariff principles (Task 2.3) Here, tariff principles relevant for the new licensing arrangements in Namibia were developed, which can be translated into an appropriate tariff policy and implemented in future, refer to chapters 9 to 13 in this Report.
• Distribution pricing methodology (Task 2.4) The focus in this task was to develop an appropriate distribution pricing methodology that the ECB can use as a tool to assist distributors with setting their tariffs, refer to chapters 9 to 13 in this Report.
• Development of tariff structures for retail supply (Task 2.5)
ELECTRICITY CONTROL BOARD NATIONAL ELECTRICITY TARIFF STUDY - FINAL REPORT
Page 163 of 186
EMCON – SAD-ELEC – ECON
In this task, the distribution tariffs determined in the distribution pricing methodology (Task 2.4) were moulded into a set of implementable tariff guidelines. Tasks 2.2 to 2.5 constitute the main goal of Phase II of the present Study, i.e. the development of a consistent pricing methodology; refer to chapters 9 to 13 in this Report.
• Stakeholder workshop (Task 2.6) – 14 September 2001 The focus in this task is to present the developed tariff principles, pricing methodologies and tariff structures to stakeholders, for their input and comment. Detailed workshop and stakeholder comments are summarised in Appendix H.
• Finalisation of tariff principles, pricing methodologies and tariff structures (Task 2.7) Here the following were finalised: o tariff principles, o pricing methodologies and tariff structures based on the comments received
from stakeholders with a documented final set of tariff principles, and the o pricing methodologies and tariff structures.
• Report preparation (Task 2.8) – to be completed after 28 September 2001 The focus in this task was to document the agreed on tariff principles, pricing methodologies and tariff structures into a concise Report.
• Presentation of results to ECB/MME/NVE (Task 2.9) Here the project results (Draft Final Phase II Report) were presented to the ECB, MME and NVE, and final inputs for the Report secured.
• Finalisation and hand-over of Final Report (Task 2.10) –22 November 2001 The Final Report of the Study is handed over to the ECB on 22 November 2001. This will be followed by a presentation to the Minister of Mines and Energy, a presentation to the ECB Board, and a press conference, which signals the official end of the National Tariff Study. It is envisaged that an extensive consultation phase with all stakeholders will be entered before the tariff implementation proceeds.
ELECTRICITY CONTROL BOARD NATIONAL ELECTRICITY TARIFF STUDY - FINAL REPORT
Page 164 of 186
EMCON – SAD-ELEC – ECON
Appendix C - Structure of the Tariff Database
Each worksheet has the following identical column structure: • Columns A & B: content description of the particular row • Columns C: circuit breaker or current limiter ampere rating (if any) • Columns D � X: particular town tariffs.
The content of the individual rows is:
• Row 1: counter • Row 2: town name • Row 3: units • Row 4: domestic single phase • Row 5: monthly domestic single phase (SP) service charge • Row 6: monthly domestic SP basic charge • Row 7 - 16: ampere ratings from 15 � 60 amp • Row 17: domestic SP unit charge • Row 18: divider • Row 19: pre-payment SP phase domestic unit charge • Row 20: divider • Row 21: domestic pre-payment unit charge with current limiter • Row 22-30: ampere ratings from 20 - 60 amp • Row 31: divider • Row 32: pre-payment three phase (TP) unit charge • Row 33: divider • Row 34: business and light industry (B&LI) SP section • Row 35: monthly B&LI SP service charge • Row 36: monthly B&LI SP basic charge • Row 37-45: ampere ratings from 20 - 60 amp • Row 46: business & light industry single phase unit charge • Row 47: divider • Row 48: business & light industry three phase (TP) section
ELECTRICITY CONTROL BOARD NATIONAL ELECTRICITY TARIFF STUDY - FINAL REPORT
Page 165 of 186
EMCON – SAD-ELEC – ECON
• Row 49: monthly business & light industry three phase service charge • Row 50: monthly business & light industry three phase basic charge • Row 51-59: ampere ratings from 20 - 60 amp • Row 60: business & light industry three phase unit charge • Row 61: divider • Row 62: Large Power User (LPU) without demand meter • Row 63: monthly LPU service charge • Row 64-66: 3 x 50, 60, 70 circuit breaker amp rating • Row 67: LPU demand charge • Row 68: LPU unit charge • Row 69: divider • Row 70: LPU with demand meter section • Row 71: LPU service fee • Row 72: LPU demand charge • Row 73: LPU unit charge • Row 74: divider • Row 75: streetlight section • Row 76: fee per light for streetlights • Row 77: unit charge for streetlights • Row 78: divider • Row 79: disconnection & reconnection charges • Row 80-89: sundry charges • Row 90: divider • Row 91: location & rectification of faults • Row 92-93: sundry charges • Row 94: divider • Row 95: testing of meters and circuit breaker section • Row 96-98: sundry charges • Row 99: divider • Row 100: special fees section • Row 101-103: sundry charges • Row 104: divider • Row 105: deposit section • Row 106-112: sundry charges • Row 113: divider & last row of database
ELECTRICITY CONTROL BOARD NATIONAL ELECTRICITY TARIFF STUDY - FINAL REPORT
Page 166 of 186
EMCON – SAD-ELEC – ECON
Appendix D - DUOS Charges in Ireland DUOS charges methodology The Irish Electricity Supply Board70, in line with the Irish regulator�s guidelines, has put forward the following DUOS charges and methodology. The regulator adopted a CPI-X approach to regulate distribution and transmission revenues. This means that once a base year set of distribution charges is established they will move in line with consumer price inflation minus the efficiency factor X. The methodology for calculating the initial set of DUOS tariffs is based on the mainstream of international practice. Figure D.1 shows a stylised representation of the methodology for determining DUOS charges or tariffs. It shows how the costs are apportioned to consumer categories that are defined by voltage level and load characteristics. Figure D.1 DUOS charge methodology - Ireland
D ire c t c o s ts- O & M- R e tu rn o n cap ita l- D e p rec ia tion
D e m a n d re la te d- tran s fo rm e r s ta tion s e tc
C u s to m e r re la te d- m e te rs e tc
In d ire c t o v e rh e a d s- co rpo ra te co s ts , p en s io nse tc
A p p o rtio n m en t ton e tw o rk a ss e ts- 3 8 kV , M V & L V
A p p o rtio n m en t toc u s to m er c a te g o rie s-38 kV , L V , M V e tc- ind us tria l, co m m erc ia l, u rb an ru ra l
N e tw o rk re la te d O & M re la te d
70 The Electricity Supply Board is the incumbent monopoly generation, transmission, distribution and supply company in
the Republic of Ireland.
ELECTRICITY CONTROL BOARD NATIONAL ELECTRICITY TARIFF STUDY - FINAL REPORT
EMCON – SAD-ELEC – ECON
First the costs of the network are determined � operation and maintenance of running the network, an agreed return on invested capital and depreciation of fixed assets. The costs will also include new investment requirements needed to expand the distribution network. The overall costs are divided into those that are demand related and those that are customer related. Most of the distribution costs are driven by the quantity of electricity distributed, either as a function of peak load (network assets such as transformers etc) or annual throughput (O&M costs). Some other costs such as meter installation are a function of customer numbers and not directly related to demand. In Ireland about 80 per cent of the costs are demand related and 20 per cent customer related. The demand costs that are network related are then apportioned to the network assets. All the costs are then apportioned to customer categories, including indirect overheads. 1. Network costs are apportioned on the basis of peak demand and peak
coincidence demand, depending on the voltage level. 2. Demand related O&M costs are apportioned using a �load duration� methodology.
This involves distributing the O&M cost in proportion to the load curve � higher costs at peak load and lower cost at base � and then apportioning them to consumer categories based on their contribution to demand over the load curve. Those consumer categories that contribute most to the peak demand attract a larger share of the O&M costs.
Figure D.2 Load duration methodology
O & M c o s t s d i s t r i b u t e d p r o p o r t i o n a t e t ol o a d d u r a t i o n c u r v e
Co
st
$C
os
t $
C o n s u m e r c a t e g o r y � s s h a r e o f d e m a n d ( % )
0 %
1 0 0 %
O & M c o s t s a p p o r t i o n e d t o c a t e g o r y b a s e d o n s h a r e od e m a n d
A t i m e
l o a d
B
t i m e
c o n s u m e rf l o a d
C=AxB
Page 167 of 186
t i m e
ELECTRICITY CONTROL BOARD NATIONAL ELECTRICITY TARIFF STUDY - FINAL REPORT
Page 168 of 186
EMCON – SAD-ELEC – ECON
3. Customer related costs are apportioned to consumer categories on the basis of customer numbers.
4. Indirect overheads are distributed to consumer categories in proportion to their direct costs (the sum of network, O&M and customer related costs).
DUOS tariff design The DUOS tariffs are derived by taking the consumer apportioned network related costs and dividing by the aggregate contracted capacity for the relevant consumer category to produce a capacity charge. The remaining consumer apportioned costs are divided by the total consumption for the relevant consumer category to obtain an energy-related charge.
i
ii capacityAggregate
tsNetworktariffCapacity
cos= where i is the consumer category
i
iiii nconsumptioTotal
OverheadsrelatedConsumerMOtariffEnergy
)&( ++=
In Ireland there is a further differentiation between day and night for the energy-related charges. The nighttime charges only include the residual apportioned O&M costs associated with nighttime, which is divided by the total nighttime consumption for the consumer category. The daytime charges include the residual apportioned O&M costs associated with daytime plus the residual apportioned network costs, which is divided by total daytime consumption for the consumer category. This is the approach used for industrial consumers and medium voltage consumers. Low voltage consumers have a simpler DUOS charge schedule with the total apportioned costs divided by the consumer category's total energy consumption to give an energy-related tariff. In addition to any capacity and energy-related charges, each consumer category has a once-off connection charge (called a standing charge). For new consumers wishing to be connected to the network there are other reinforcement and grid strengthening costs that may have to be included in the DUOS charges. Under the ESB's system the consumer bears 50 per cent of these additional connection charges and the rest are pooled. Embedded generators, however, are required to pay 100 per cent of the connection charges and receive no benefit for reduced losses on the network. They do not have to pay any DUOS charges since these are applicable to electricity existing at end user connections. Finally, the losses on the distribution network are borne by the consumers and are apportioned to each consumer category on the basis of the share of total losses associated with each voltage level and consumer category. Table A.1 indicates what the DUOS tariff schedule looks like for industrial and commercial consumers. The DUOS tariffs for domestic consumers are similarly presented, although there is no contracted capacity component just a standing charge and unit rates.
ELECTRICITY CONTROL BOARD NATIONAL ELECTRICITY TARIFF STUDY - FINAL REPORT
Page 169 of 186
EMCON – SAD-ELEC – ECON
Table D.1 DUOS tariffs for industrial and commercial consumers - Ireland LV MV 38 kV
Looped/ meshed
38 kV Tailed/
radial Standing charge £/customer/mont
h 45.39 144.77 2 426.74 691.25
Contracted capacity
£/kVA/month 1.69 1.06 0.52 0.52
Unit rates p/kWh Day 1.606 0.505 0.110 0.110 p/kWh Night 0.187 0.075 0.007 0.007
Revenue reconciliation The revenue raised from the DUOS tariffs should match the revenue set by the regulator for the period of agreement. The cost base can be reassessed at the end of that agreement and a new agreement established on the basis the underlying costs at that point in time. However, for the period of the agreement a mechanism is required to ensure that revenues are more-or-less in line with underlying costs. The problem arises because the tariffs are based on assumptions concerning the number of consumers and the level of electricity demand. If demand is greater than expected then the cost of distribution are also likely to be higher than anticipated. But if a fixed revenue is set then the higher level of demand must be offset by a lower DUOS charge. However, because of the additional costs incurred in distributing the larger than anticipated level of demand, the distributor is likely to face a revenue shortfall. If the expected throughput on the distribution network is lower than expected then with a fixed revenue model consumers would face higher DUOS tariffs than is justified by underlying costs. Conversely, if the DUOS charge is fixed then the higher throughput on the distribution network will result in higher than anticipated revenues and lower revenues if the throughput is lower than expected. Allowable revenues should reflect the change in throughput on the network. In the Irish system a hybrid approach is used, with allowed distribution revenues in any given year derived as a combination of fixed component independent of throughput and a distribution charge component that is throughput related. By this approach if throughput is greater than expected then revenue will increase but not by as much as under a purely price regulated approach. In Ireland 75 per cent of the allowable revenue is independent of throughput and 25 per cent is throughput related (see adjacent box for details).
Distribution revenue formula:
R F PQ Kt t t t= + −0 75 0 25. . Rt = allowable revenue Ft = component of revenue independent ofthroughput Pt = average distribution charge Qt = actual throughput in year t. K = over- or under-recovery factor from theprevious year.
−+=
−− '
1
'
1 1001
t
ttt Q
QXCPIFF
X = efficiency factor set by regulator Q’
t = projected throughput at the time of theregulatory review
−+= − 10011
XCPIPP tt
ELECTRICITY CONTROL BOARD NATIONAL ELECTRICITY TARIFF STUDY - FINAL REPORT
Page 170 of 186
EMCON – SAD-ELEC – ECON
Appendix E - Coincidence Factor The Barry coincidence factor is an empirical measure of the relationship between a consumer�s load factor and the share of their peak demand that contributes towards the system peak. In general, a consumer�s peak demand is not synchronised with the peak demand on the network. However, the higher the load factor the greater the chance that the consumer�s peak demand will coincide with the system peak. The Barry coincidence factor in combination with the consumer�s peak demand can be used to estimate the consumer�s contribution towards system peak demand. This share is then used to allocate network costs across the consumer groups. The Barry co-incidence factor presented below has been derived for South African electricity consumers. Figure E.1 Barry coincidence factor
0%
20%
40%
60%
80%
100%
0% 20% 40% 60% 80% 100%
Load factor
Bar
ry c
oinc
iden
ce fa
ctor
Barry Factor = ƒ(load factor) Where: Load factor = annual energy consumed /(NCPD x 8760 hours)
ELECTRICITY CONTROL BOARD NATIONAL ELECTRICITY TARIFF STUDY - FINAL REPORT
Page 171 of 186
EMCON – SAD-ELEC – ECON
Appendix F – Data Requirements for the Distribution Tariff Methodology Data requirements to implement the proposed distribution tariff methodology are summarised below:
Revenue requirement information The revenue requirement for the distributor should be expressed as:
Revalued asset values per asset category Each asset category should be associated with a voltage level, or
designated “unassigned” Depreciation rates per asset category. Proportion of assets which were grant funded Real rate of return and inflation assumption O&M costs Customer service costs Overhead costs Working capital Bad debts (from previous financial statements) Revenue from other charges Reconciliation under/over recovery in previous period. Technical losses (per voltage level) and theft
Billing information The following billing and customer information should be provided:
Definition of tariff categories and voltage levels Choice of meter per tariff category Number of customers per customer categories Annual consumption per customer category Average monthly maximum demand (if using a maximum demand meter) Annual load factor
ELECTRICITY CONTROL BOARD NATIONAL ELECTRICITY TARIFF STUDY - FINAL REPORT
Page 172 of 186
EMCON – SAD-ELEC – ECON
Appendix G – Technical Annex: Distribution Tariff Methodology
In this Appendix, details on each of the four steps as per Distribution tariff methodology chapter are provided.
G.1 Step 1: Determine cost structure and revenue requirement Distribution costs should be calculated in the following manner:
Asset related costs: depreciation of revalued assets, plus real return (real WACC) on revalued assets. Asset-related costs should be allocated to each voltage level.
Cost of working capital: the portion of the capital base not contained in asset values multiplied by the real WACC.
Operating and maintenance costs: general O&M costs associated with operating the network
Customer service costs: costs directly related to customer services, e.g. metering & billing, marketing and so on.
Overhead costs: costs not falling into any of the above categories. The fixed monthly charges levied by the bulk supply authority should be included in this cost category.
Bad debts: the revenue from the previous year that was written off, and interest on this amount (use nominal WACC). In addition, adjustments to the revenue requirement should be made to reflect:
Revenue from other charges: e.g. disconnection and reconnection charges, meter testing services and so on.
Reconciliation adjustment to account for over/under recovery in the preceding year and interest on this amount (use nominal WACC).
ELECTRICITY CONTROL BOARD NATIONAL ELECTRICITY TARIFF STUDY - FINAL REPORT
Page 173 of 186
EMCON – SAD-ELEC – ECON
G.2 Step 2: Allocate the costs to customer categories Allocation methods - formulae There are a variety of ways in which costs may be allocated to customer categories. We describe each below.
Allocate by contribution to peak co-incident maximum demand The allocation is undertaken through the following equation:
R RNCPD B
NCPD Bi v vi v i v
i v i vi
,, ,
, ,( )= ×
××∑
Where Ri,v = cost allocated to consumer category i at voltage v Rv = cost element associated with voltage v (for asset related costs �
other costs are not allocated by this method). NCPDi,v = Non-coincidence peak demand of consumer category i at voltage v
(kVA) Bi,v = Barry coincidence factor for consumer i at voltage v
[Bi,v = ƒ(load factor)], refer to Appendix E
Allocate by contribution to energy consumed The allocation is undertaken through the following equation:
Ri,v = R x Ei,v / ∑ Ei,v Where Ri,v = cost allocated to consumer category i at voltage v R = cost element Ei,v = Energy consumed by customer category i at voltage v (kWh)
Allocate by customer numbers The allocation is undertaken through the following equation:
Ri,v = R x Ni,v / ∑ Ni,v Where Ri,v = cost allocated to consumer category i at voltage v R = cost element Ni,v = Number of customers in customer category i at voltage v
Allocate by weighted customer numbers The allocation is undertaken through the following equation:
Ri,v = R x Wi,v x Ni,v / ∑ Ni,v Where Ri,v = cost allocated to consumer category i at voltage v
ELECTRICITY CONTROL BOARD NATIONAL ELECTRICITY TARIFF STUDY - FINAL REPORT
Page 174 of 186
EMCON – SAD-ELEC – ECON
R = cost element Wi,v = Weight attached to customer category i at voltage v Ni,v = Number of customers in customer category i at voltage v
Allocate by arrears The allocation is undertaken through the following equation:
Ri,v = R x (Ai,v x Ci,v) / ∑ (Ai,v x Ci,v) Where Ri,v = cost allocated to consumer category i at voltage v R = cost element Ai,v = Days receivables associated with customer category i at voltage v
(days) Ci,v = Total (of all other) costs allocated to customer category i at voltage v
Allocation method for each cost category The table below summarises the cost allocation method for each cost element. Table G.1 Cost allocation parameter Cost element Maximum
demand Energy Customer
number Arrears
Network assets: depreciation and return X
Working capital X Bad-debts71 X O&M costs X Customer services X Overhead costs X Revenue from other charges
X
Reconciliation amount X Power supply costs: maximum demand charge
Tariff calculated directly from bulk supply tariff
Power supply costs: energy charge
Tariff calculated directly from bulk supply tariff
Distribution losses and theft (non-billed energy)
Included in calculation of power supply costs
71 Strictly speaking these costs should be allocated on the basis of other costs. However, for simplicity we have
recommended that they be allocated on the basis of energy consumed.
ELECTRICITY CONTROL BOARD NATIONAL ELECTRICITY TARIFF STUDY - FINAL REPORT
Page 175 of 186
EMCON – SAD-ELEC – ECON
G.3 Step 3: Determine the tariff fees Power supply charges Power supply charges, incorporating the cost of losses and theft (energy not billed), can de determined from the bulk supply tariffs as follows:
For customers with a maximum demand meter These customers are charged both a maximum demand charge and an energy charge. The maximum demand charge can be calculated as:
PS_MDi,v = Max_Dem / (1 � Lv � Th) Where PS_MDi,v = power supply maximum demand fee charged to consumer category i
at voltage v ($/kW) Max_Dem = maximum demand charge of bulk supply authority ($/kW) Li,v = Percentage losses at voltage v (%) Th = Percentage theft (%) The energy charge can be calculated as:
PS_Eni,v = En / (1 � Lv � Th) Where PS_Eni,v = power supply maximum demand fee charged to consumer category i
at voltage v ($/kW) En = energy charge of bulk supply authority (c/kWh) Li,v = Percentage losses at voltage v (%) Th = Percentage theft (%)
For customers without a maximum demand meter These customers are only charged an energy fee for power supply, which can be calculated as follows:
PS_Eni,v = [ Max_Dem * 12 *100 * LFi,v / (8760) + En ] / (1 � Lv � Th) Where PS_Eni,v = power supply maximum demand fee charged to consumer category i
at voltage v (c/kWh) Max_Dem = maximum demand charge of bulk supply authority ($/kW) En = energy charge of bulk supply authority (c/kWh) LFi,v = load factor for customer category i at voltage v (%) Li,v = Percentage losses at voltage v (%) Th = Percentage theft (%)
ELECTRICITY CONTROL BOARD NATIONAL ELECTRICITY TARIFF STUDY - FINAL REPORT
Page 176 of 186
EMCON – SAD-ELEC – ECON
Dealing with the fixed monthly charges to the bulk supply authority These can be included in the overhead costs of the distribution authority and hence included in the distribution tariffs.
Distribution charges There are three types of charges we deal with in this methodology:
Fixed monthly fees Energy charges Maximum demand charges
Each cost element allocated to each customer category must be expressed as a
Calculation of fixed monthly fee The fixed monthly tariff fee for a particular customer category can be calculated as follows:
Ti,v = Ri,v / (12 * Ni,v) Where Ti,v = monthly fee for consumer category i at voltage v ($/month) Ri,v = costs allocated to consumer category i at voltage v which are
designated to be expressed as a monthly fee ($) Ni,v = Number of customers in customer category i at voltage v
Calculation of energy fee The energy fee (excluding power supply charges) for a particular customer category can be calculated as follows:
Ti,v = Ri,v / (100 * Ei,v) Where Ti,v = energy fee for consumer category i at voltage v (c/kWh) Ri,v = costs allocated to consumer category i at voltage v which are
designated to be expressed as an energy fee ($) Ei,v = annual energy billed to customer category i at voltage v (kWh)
Calculation of maximum demand fee The maximum demand fee (excluding power supply charges) for a particular customer category can be calculated as follows:
Ti,v = Ri,v / (12 * MDi,v) Where Ti,v = maximum demand fee for consumer category i at voltage v Ri,v = costs allocated to consumer category i at voltage v which are
designated to be expressed as a maximum demand fee MDi,v = average monthly maximum demand billed to customer category i at
voltage v (note: this will be less than the annual maximum.
ELECTRICITY CONTROL BOARD NATIONAL ELECTRICITY TARIFF STUDY - FINAL REPORT
Page 177 of 186
EMCON – SAD-ELEC – ECON
Distribution tariff determination method for each cost category The table below summarises the tariff determination method for each cost element. Note that in some cases the optimal fee cannot be charged due to metering restrictions. These are noted in Table G.2 below. Table G.2 Cost allocation parameter Cost element Fixed monthly
fee Energy
fee Maximum demand
Network assets: depreciation and return
X (where no max demand meter)
X (where max
demand meter) Working capital X Bad-debts X O&M costs X Customer services X X
(where pre-payment meter)
Overhead costs X X (where pre-
payment meter)
Revenue from other charges
X
Reconciliation amount X Power supply costs: maximum demand charge
Tariff calculated directly from bulk supply tariff
Power supply costs: energy charge
Tariff calculated directly from bulk supply tariff
Distribution losses and theft (non-billed energy)
Included in calculation of power supply costs
G.4 Step 4: Adjust for cross-subsidies The tariffs calculated above will be cost-reflective for all tariff categories. It is likely that the distributor may wish (or be instructed) to offer subsidised prices to certain categories of consumers. We recommend that cross-subsidies be restricted to low-income domestic consumers, and that a special tariff category be established for these consumers. We further recommend that this category be fitted with a 20A or lower circuit breaker to ensure that only low income households utilise the supply option. The tariff for this category should be expressed as a charge per unit of energy consumed, and hence easily compatible with prepayment meters. The level of the
ELECTRICITY CONTROL BOARD NATIONAL ELECTRICITY TARIFF STUDY - FINAL REPORT
Page 178 of 186
EMCON – SAD-ELEC – ECON
tariff should be set by the competent authority based on their own assessment of what a �fair� tariff for this category should be. The ECB may wish to issue guidelines or regulations for this. The lost revenue due to the subsidised tariff can be easily calculated as:
Lost_Rev = (En_Trf � Sub_Trf) * En_sub / 100 Where Lost_Rev = Revenue lost due to the cross-subsidy ($) En_Trf = unsubsidised tariff (c/kWh) for target customer category Sub_Trf = subsidised tariff (c/kWh) for target customer category En_sub = energy consumption (kWh) of target customer category The lost revenue must then be charged to other tariff categories as an energy charge. It is possible to select the customer categories that pay for the cross-subsidy. We recommend that all other customer categories pay for the cost of the cross-subsidy. This can be calculated as:
Sub_fee = Lost_Rev *100 / ∑ Ei,v Where Sub_fee= cross-subsidy to be charged to those customer categories paying for
the cross-subsidy (c/kWh) Lost_Rev = Revenue lost due to the cross-subsidy ($) Ei,v = energy consumption of customer categories paying for the cross-
subsidy (kWh)
ELECTRICITY CONTROL BOARD NATIONAL ELECTRICITY TARIFF STUDY - FINAL REPORT
Page 179 of 186
EMCON – SAD-ELEC – ECON
Appendix H – Workshop & Stakeholder Comments
TARIFF WORKSHOP & CORRESPONDENCE QUESTIONS AND COMMENTS
1. Selco (van Zyl): Is the value of assets not based on what revenue it can generate?
ANSWER: Not generally, as strategic over- and under-investments can result if revenue generation criteria of assets is the only criteria.
2. Norad (Bjelland): Losses should be limited by incentives.
ANSWER: The ECB will, in time, enter an incentive based regulatory environment, whereby the ECB will put a limit on losses, refer to 10.4 on page 100. Bad debts can be based on last audited accounts, and losses can be capped and brought down to an acceptable level over time.
3. Windhoek (Diener): How do you allow for replacement of subsidized assets?
ANSWER: Through depreciation, allow depreciation on re-valued assets.
4. NamPower (von Seydlitz): How do you ensure that depreciation reserves are not squandered?
ANSWER: Short re-valuation periods, and by requiring that transparent financial statements are available to assess when capital is undermined.
ELECTRICITY CONTROL BOARD NATIONAL ELECTRICITY TARIFF STUDY - FINAL REPORT
Page 180 of 186
EMCON – SAD-ELEC – ECON
5. Henties Bay (Ipinge): Bad debts should not be serviced from subsidized assets.
ANSWER: Adjust revenue requirement through reconciliation from previous period.
6. Walvis Bay (Coeln): Distribution and supply licenses are separate: why use a combined approach here?
ANSWER: Cost elements are easy to split into distribution and retail. Namibian industry is not ready for this, but some supply authorities may already be at this point in time.
7. Swakopmund (Niemand): Holiday resorts are often disadvantaged, as they have to build expensive infrastructure and have little energy sales – how should pricing be done?
ANSWER: The coastal towns have special requirements due to the seasonal inflow of holidaymakers. In such cases it is recommended that a special proposal accompany the licence application, explaining the special circumstances and proposing a tariff mechanism, which can then be considered by the ECB.
8. (?) : How can maximum demand peaks be controlled? Can tariffs be changed on a monthly / seasonal basis?
ANSWER: the revenue reconciliation allowance should take care of seasonal fluctuations.
9. Northern Electricity (Huysen): Don’t over-regulate, as the private sector implements its own efficiency measures.
ANSWER: Agreed, in time there will be a limited number of incentives, refer to section 10.4 on page 100.
10. NamPower (Visser): Where is depreciation allocated?
ANSWER: In re-valued asset costs.
11. (?): ECB needs good database to regulate – does this exist?
ELECTRICITY CONTROL BOARD NATIONAL ELECTRICITY TARIFF STUDY - FINAL REPORT
Page 181 of 186
EMCON – SAD-ELEC – ECON
ANSWER: Not yet, the ECB is in the process of getting a tariff structure in place; a database is part of the future requirements of the ECB.
12. Norad (Bjelland): Should overhead costs be allocated to energy consumption or customer numbers? The latter may distort tariffs.
ANSWER: This issue has been debated at length in the Team, but the actual allocation does not have a large net effect.
13. MME (Hamutwe): Should bad debt be included in working capital?
ANSWER: Adjust revenue requirement through reconciliation from previous period.
14. Walvis Bay (Coeln): The EPZ requires bulk upgrades, but investors want to have infrastructure before they are prepared to invest. How to allocate costs?
ANSWER: It is the prerogative of the licensee to make provision for the expansion of their own assets, and the regular determination of the revenue requirement should enable the regular incorporation of costs due to network expansions.
15. Swakopmund (Niemand): Basic charge should not be based on CB size but energy (c/kWh), because customers change their CB.
ANSWER: Pre-payment meters can be used if basic charges are to be expressed in c/kWh.
16. Swakopmund (Niemand): Prepayment does not take account of network costs in seasonal towns. Therefore propose high pre-payment energy charges e.g. pay 200 units over and above actual consumption.
ANSWER: The unique situation of coastal towns has been the topic of a previous question, where the following recommendation was made: The coastal towns have special requirements due to the seasonal inflow of holidaymakers. In such cases it is recommended that a special proposal accompany the licence application, explaining the special circumstances and proposing a tariff mechanism, which can then be considered by the ECB.
17. Walvis Bay (Coeln): Municipal admin charges: where should they be allocated?
ELECTRICITY CONTROL BOARD NATIONAL ELECTRICITY TARIFF STUDY - FINAL REPORT
Page 182 of 186
EMCON – SAD-ELEC – ECON
ANSWER: This is a difficult question – ring-fencing of business units is one of the ways to properly take admin-charges into account. In general, one should determine the real costs and real revenue requirements, and discuss these with policy makers on local authority level.
18. Northern Electricity (Huysen): How does one deal with pre-payment meters in the business category?
ANSWER: This should be no problem; the standard pre-payment procedure should be used.
19. Northern Electricity (Huysen): What about time-of-use tariffs?
ANSWER: This needs to be taken further up the line to generation, as it crucially depends on the arrangements made by NamPower, Eskom and within the SAPP.
20. NamPower (von Seydlitz): Guidelines should be different for different circumstances – they should not be enforced. Supply authorities must have freedom to address their particular circumstances.
ANSWER: Correct, therefore they are called guidelines.
21. MME (Hamutwe): How are environmental costs as per White Paper allocated?
ANSWER: This is a matter of applying policy, a task resting with the Ministry of Mines and Energy.
22. NamPort: How should the resale of electricity be handled?
ANSWER: If NamPort has been awarded a distribution license, the regulations as per licence application will hold; for the resale of electricity, a price cap of some 5% (cost-plus) has been used in the past.
23. Rössing: The distribution tariff proposals don’t look good for mining.
ANSWER: It should be noted that they are not applicable to large mining operations, such as Rössing or Scorpion, as they are transmission clients; only the smaller mines on distribution systems are affected.
ELECTRICITY CONTROL BOARD NATIONAL ELECTRICITY TARIFF STUDY - FINAL REPORT
Page 183 of 186
EMCON – SAD-ELEC – ECON
24. Selco (van Zyl):
Is the tariff model available for use by stakeholders?
ANSWER: The model developed is not for the determination of tariffs, but as an ECB tool.
In what format must tariff info be provided?
ANSWER: The specific format will be provided by the ECB.
25. NamWater: Same concern as Rössing.
ANSWER: Same answer as to Rössing.
26. (?): How is currency depreciation handled?
ANSWER: The annual revenue requirement contains elements, which are currency dependent. Any currency depreciation is therefore contained in the determination of the revenue requirement, if this exercise is carried out regularly.
27. (?): How are donated assets handled?
ANSWER: The Team’s recommendations are summarised in section 10.3.4 on page 97.
28. MME (Hamutwe): Future investment costs do not warrant efficiencies.
ANSWER: The ECB will identify over-investment. Distributors must become business orientated; a bigger problem is probably under-investment. In general, the recommendations with respect to an incentive based regulatory environment are summarised in section 10.4.
29. Ongopolo (Groenewald):
Ongopolo wishes to use commodity linked pricing, will this be acceptable?
ANSWER: This is acceptable to the ECB.
Can Ongopolo re-apply for a revised sales price due to changing maximum demand costs? ANSWER: Ongopolo is welcome to apply for a tariff revision that takes into account the maximum demand costs.
ELECTRICITY CONTROL BOARD NATIONAL ELECTRICITY TARIFF STUDY - FINAL REPORT
Page 184 of 186
EMCON – SAD-ELEC – ECON
At what stage can a distributor adjust the sales price of electricity? ANSWER: The ECB will issue a directive as to the timing of applications for tariff changes when bulk supply tariffs change.
When can Ongopolo adjust its tariff structures? ANSWER: The ECB will advise all distributors of a date by which the new tariff principles will become applicable.
30. Swakopmund (Niemand):
What is the formula base to be used to determine the asset values?
ANSWER: It has been recommended that the replacement cost approach is used to determine asset values, and that this approach is simplified through the use of standardized values for common categories of assets. This approach takes account of inflation and provides for depreciation. The ECB will propose standardized asset costs, to be used by all distributors for their asset valuation. However, it is the distributors’ responsibility to prepare an inventory of all their distribution network assets, to which the valuation can be applied. ECB will assist smaller distributors with the asset valuation.
Can basic charges be part of the tariff structure, particularly in view of the special circumstances that the holiday town Swakopmund experiences? ANSWER: The ECB is aware of special circumstances prevailing at holiday resorts like Swakopmund, Henties Bay and to a lesser degree Walvis Bay, where electricity consumption is seasonal. Distributors may propose deviations from the tariff structure guidelines to make provision for such special circumstances; however, these must be properly motivated before they are approved by the ECB.
The ECB recommends that Swakopmund Municipality evaluates various options in dealing with this issue, such as charging a higher basic charge for holiday homes using less than, say, 50kWh per month. This may require the introduction of a special tariff category. It is encouraged that the Municipality discusses the implications of the various options with the ECB.
31. Windhoek (Diener):
Only the electricity tariffs of NamPower, Northern Electricity and Walvis Bay were analysed in greater detail, why? ANSWER: The tariffs of all distributors in Namibia were gathered and analysed by the consultants. The Terms of Reference for the study stated, however, that a detailed cost-of-supply analysis is to be done for only four types of distributors, namely a large municipality, a small municipality, a rural distributor and a farm distributor. The respective representatives
ELECTRICITY CONTROL BOARD NATIONAL ELECTRICITY TARIFF STUDY - FINAL REPORT
Page 185 of 186
EMCON – SAD-ELEC – ECON
that were chosen for this exercise are Walvis Bay, Okahandja, Northern Electricity and NamPower.
It is the responsibility of distributors to determine their revenue requirement in terms of the proposed tariff principles, and to motivate an appropriate tariff structure and tariff levels to the ECB. Consultation with customers is also the responsibility of the distributor.
Prepaid step charges have not been addressed in the Tariff study, why? ANSWER: Special arrangements like step charges may be proposed by distributors in their tariff application. If properly motivated the ECB will consider these.
Can the customer categorisation also include an “Investor category”? ANSWER: With the tariff study the ECB is proposing principles and guidelines to be applied when determining tariff levels and tariff structures. Distributors may propose deviations from the tariff structure guidelines to make provision for special circumstances like an investor category; however, these must be properly motivated before being approved by the ECB.
The minimum maximum demand charge that local authorities have to pay to NamPower (i.e. 70% of MD) has not been addressed, why? ANSWER: The ECB will protect distributors against unfair practices through the application of the developed tariff principles.
32. Northern Electricity (Huysen):
It is suggested that connection fees must not be regulated, however, a shortfall of income can easily occur, what should be done about it?
ANSWER: Section 11.6 describes the cross-subsidisation recommendations.
It is not clear how electrification, in particular rural electrification, is to be funded.
ANSWER: It is the responsibility of the Ministry of Mines and Energy, as the line ministry responsible for electrification, to make available funds for rural electrification, the ECB as the regulator is not responsible for the equitable distribution of such funds.
We feel that time of use tariffs can benefit distributors.
ANSWER: This needs to be taken further up the line to generation, as it crucially depends on the arrangements made by NamPower, Eskom and within the SAPP.
ELECTRICITY CONTROL BOARD NATIONAL ELECTRICITY TARIFF STUDY - FINAL REPORT
Page 186 of 186
EMCON – SAD-ELEC – ECON
33. NamPower (Hangala):
The cost element that the existence of the Single Buyer introduces should be known to the ECB.
ANSWER: The ECB is in the process to separately investigate the implementation requirements pertaining to the Single Buyer, NamPower is one of the key stakeholders in this debate, which goes far beyond the present Tariff Study. Also, the Single Buyer cost element forms part of the bulk purchase costs of distributors. The ECB has no objection if this cost element is pertinently shown on the distribution customer account, since this is in the interest of transparency.
The ECB should set clear guidelines on what level of non-technical losses, bad debts and theft are allowable.
ANSWER: The ECB will, in time, enter an incentive based regulatory environment, whereby the ECB will put a limit on losses, refer to 10.4 on page 100. Bad debts can be based on last audited accounts, and losses can be capped and brought down to an acceptable level over time. The ECB will in future issue benchmarks with respect to losses, against which distributor performance will be measured.
The NamPower distribution network has different parameters than those of a dense municipal network, as will be the case for any RED, which may evolve. This should be recognised by the ECB for instance in the acceptance of O&M levels.
ANSWER: In line with the proposed “cost-plus” approach, the ECB will regulate the price levels that are determined by a distributor’s revenue requirement. The revenue requirement in turn is determined by the various cost elements. Distributors are required to motivate these cost elements in a transparent manner so as to provide a full understanding of the principles used, thereby enabling a fair ruling by the ECB.
It is requested that the Study be clearer on incentives given by the ECB. ANSWER: At this initial stage the ECB focuses on getting the tariff determination process off the ground. Incentive-based regulation will be implemented at a later stage, once the distribution pricing teething problems have been overcome.
The re-evaluation of assets each year will put a high burden upon distributors. ANSWER: It has been recommended that the replacement cost approach is used to determine asset values, and that this approach is simplified through the use of standardized values for common categories of assets. The ECB will propose standardized asset costs, to be used by all distributors for their asset valuation. Also, it is the distributors’ responsibility to prepare an inventory of all their distribution network assets, to which the valuation can be applied, and to keep this inventory up to date. The initial work in preparing the inventory may be substantial, but once this is in place, all that is required is maintenance of the inventory. The age of asset components takes care of depreciation, and inflation will be accounted for through the standardized asset costs that will be updated annually. The ECB will assist smaller distributors with the asset valuation.