Submitted September 15, 2014 ASR Analytics, LLC 1389 Canterbury Way Potomac, MD 20854 Federal TIN: 20-1204680 DUNS: 15-108-3305 GSA Schedule #: GS-10F-0062R Submitted to: Shelita Saint-Louis, Contracting Officer Cassandra Sterba, Contract Specialist Acquisition Services Directorate National Business Center Department of the Interior National Telecommunications and Information Administration Broadband Technology Opportunities Program Evaluation Study Order Number D10PD18645 Final Report: Social and Economic Impacts of the Broadband Technology Opportunities Program
Transcript
C1
Submitted September 15, 2014 ASR Analytics, LLC 1389 Canterbury Way Potomac, MD 20854 Federal TIN: 20-1204680 DUNS: 15-108-3305 GSA Schedule #: GS-10F-0062R Submitted to: Shelita Saint-Louis, Contracting Officer Cassandra Sterba, Contract Specialist Acquisition Services Directorate National Business Center Department of the Interior
National Telecommunications and Information Administration
Broadband Technology Opportunities Program Evaluation Study
Order Number D10PD18645
Final Report: Social and Economic Impacts of the Broadband Technology
Opportunities Program
ii
Table of Contents Executive Summary ............................................................................................................................ 1
List of Tables Table 1. Site Visit Summary Statistics ................................................................................................ 7
Table 2. Average BTOP Budgets (Million USD) ............................................................................... 13
Table 3. PCC and SBA Training ....................................................................................................... 14
Table 4. PCCs and Lab Hours .......................................................................................................... 14
Table 17. Training Hour Categorization ............................................................................................ 47
Table 18. PCC and SBA Training Hours .......................................................................................... 48
Table 19. Workforce and Economic Development: Potential Social and Economic Benefits .......... 59
Table 20. PCC Workforce and Economic Development Impacts in the Evaluation Study Sample . 59
Table 21. SBA Workforce and Economic Development Impacts in the Evaluation Study Sample .. 59
Table 22. CCI Workforce and Economic Development Impacts in the Evaluation Study Sample ... 62
Table 23. Education and Training: Potential Social and Economic Benefits .................................... 65
Table 24. PCC Education and Training Impacts in the Evaluation Study Sample ........................... 65
Table 25. SBA Education and Training Impacts in the Evaluation Study Sample ........................... 65
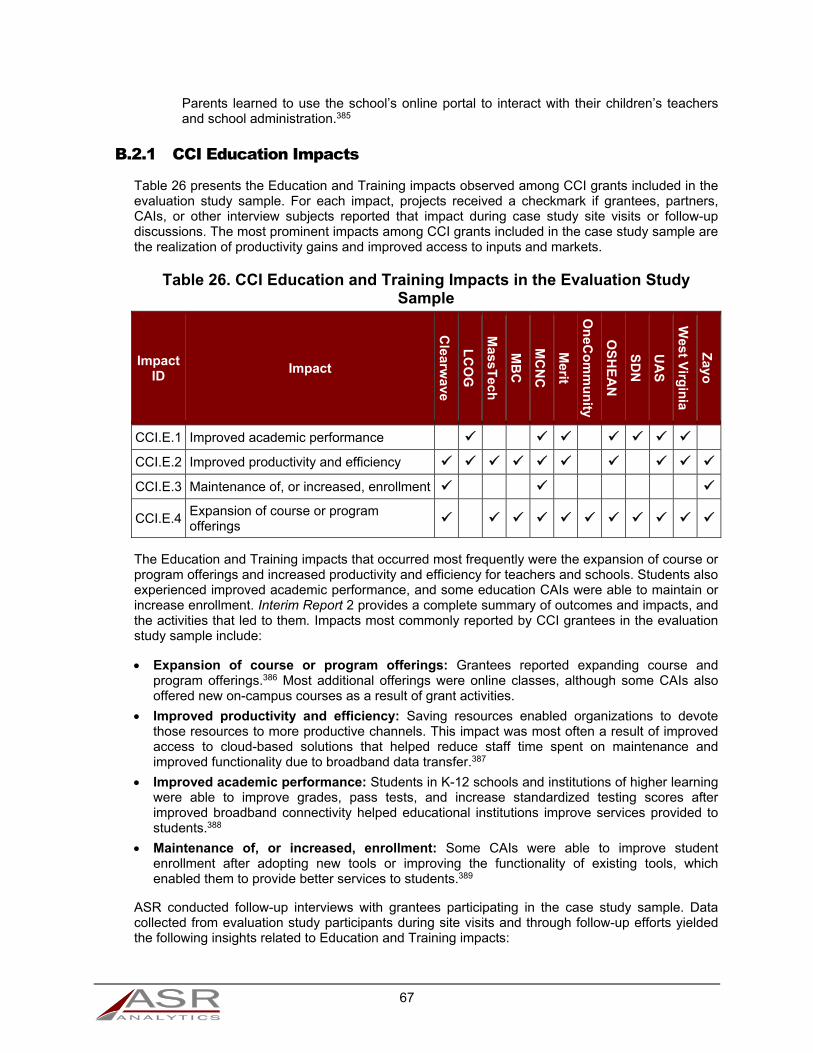
Table 26. CCI Education and Training Impacts in the Evaluation Study Sample ............................ 67
Table 27. Healthcare: Potential Social and Economic Benefits ....................................................... 70
Table 28. PCC Healthcare Impacts in the Evaluation Study Sample ............................................... 70
Table 29. SBA Healthcare Impacts in the Evaluation Study Sample ............................................... 71
Table 30. CCI Healthcare Impacts in the Evaluation Study Sample ................................................ 72
Table 31. Government Services: Potential Social and Economic Benefits ...................................... 75
Table 32. CCI Government Services Impacts in the Evaluation Study Sample ............................... 76
Table 33. Quality of Life/Civic Engagement: Potential Social and Economic Benefits .................... 78
Table 34. PCC Quality of Life Impacts in the Evaluation Study Sample .......................................... 78
v
Table 35. SBA Quality of Life Impacts in the Evaluation Study Sample .......................................... 78
Table 36. Digital Literacy: Potential Social and Economic Benefits ................................................. 82
Table 37. PCC Digital Literacy Impacts in the Evaluation Study Sample ........................................ 82
Table 38. SBA Digital Literacy Impacts in the Evaluation Study Sample ......................................... 83
Table 39. CCI Digital Literacy Impacts in the Evaluation Study Sample .......................................... 84
Table 40. Total Estimated New Internet Job Searchers and Decreased Unemployment Duration (Weeks) Due to PCC Grants ............................................................................................................ 89
Table 41. Total Estimated Number of Individuals Engaged in Any Entrepreneurial Activity through PCC Grants ...................................................................................................................................... 90
Table 42. Total Estimated Number Engaged in Different Entrepreneurial Activities Due to PCC Grants ............................................................................................................................................... 90
Table 43. Total Estimated New Internet Job Searchers and Decreased Unemployment Duration (Weeks) Due to SBA Grants ............................................................................................................. 91
Table 44. Total Estimated Number Engaged in Different Entrepreneurial Activities Due to SBA Grants ............................................................................................................................................... 92
Table 45. Total New Business Subscribers and Years of Business Subscriptions Due to SBA Grants ............................................................................................................................................... 93
Table 46. Characteristics of Selected BTOP CCI Grants and Service Area Counties ..................... 95
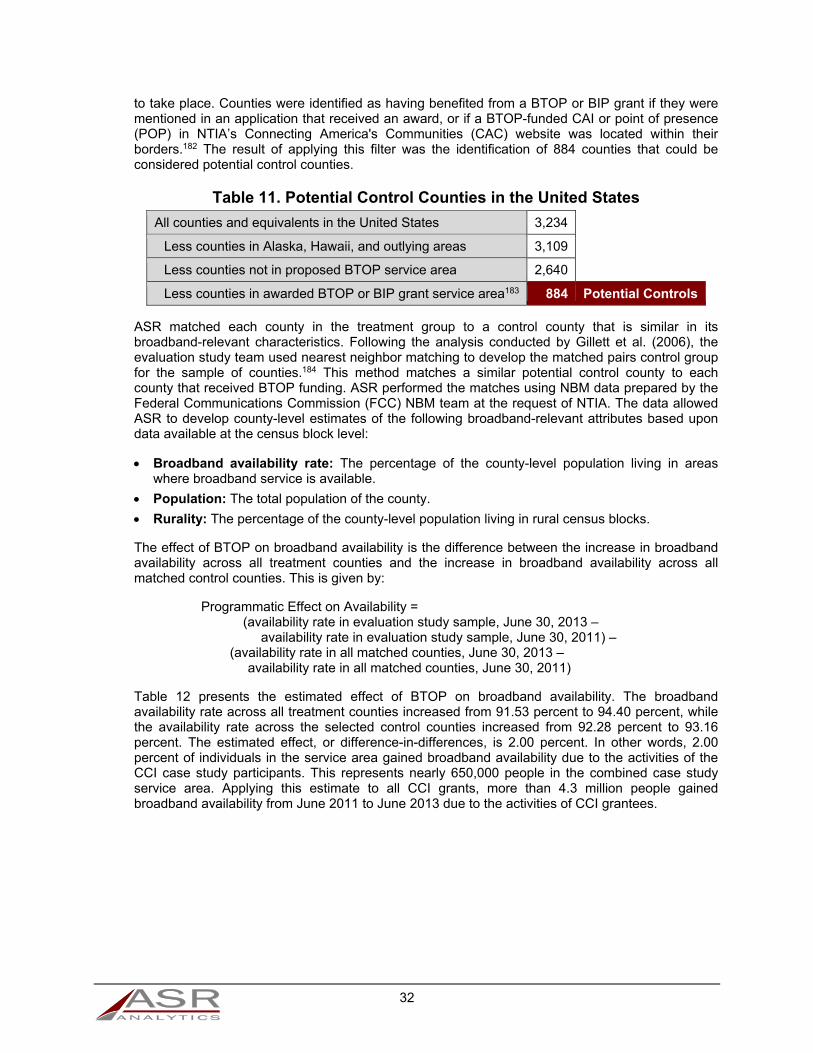
Table 47. Potential Control Counties in the United States ............................................................... 98
Table 48. Census Blocks and Counties with Reported Decreases in the Broadband Availability Rate over the Study Period ............................................................................................................ 100
Table 49. Counties with Reported Decreases in the Broadband Availability Rate over the Study Period.............................................................................................................................................. 101
Table 50. Descriptive Statistics of Matching Variables ................................................................... 102
Table 51. Availability Rates, Differences, and Difference-in-Differences for Matched Pair Groups ........................................................................................................................................................ 104
Table 52. Estimated Total Population with Broadband Availability Due to BTOP .......................... 105
Table 53. Difference-in-Differences Estimates and Lower and Upper Confidence Values for Matched Pair Groups ...................................................................................................................... 107
Table 55. Extrapolated Total Benefit from Increased Output Due to BTOP (Annual, Million USD)110
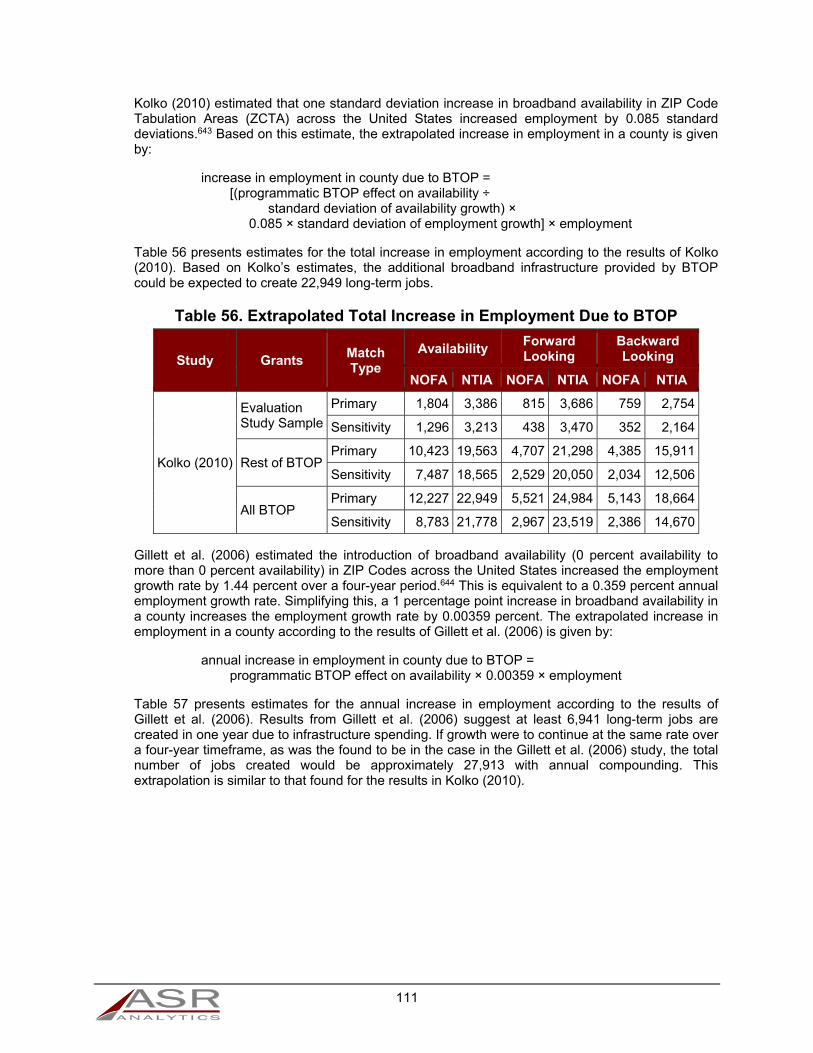
Table 56. Extrapolated Total Increase in Employment Due to BTOP ............................................ 111
Table 57. Extrapolated One-Year Increase in Employment Due to BTOP .................................... 112
Table 58. Extrapolated Total Increase in Income Due to Total Increase in Employment (Annual, Million USD) .................................................................................................................................... 112
Table 59. Extrapolated Total Benefit Due to One-Year Increase in Employment (Million USD) .... 113
Table 60. Extrapolated Total Increased Value to Consumers Due to BTOP (Annual, Million USD) ........................................................................................................................................................ 113
vi
List of Figures Figure 1. Estimated Effect of BTOP on Broadband Availability in the CCI Evaluation Study Sample Service Area for Different Populations of Interest .............................................................................. 4
Figure 2. Evaluation Study Sample Grantee Locations ...................................................................... 8
Figure 3. Total Effect of Economic Impacts: Federal Funding vs. Matching Funding ...................... 17
Figure 4. Cumulative New Fiber Miles Deployed by Quarter, all CCI Projects ................................ 28
Figure 5. Interconnection Points by Quarter, all CCI Projects .......................................................... 29
Figure 6. Cumulative Signed Third-Party Service Provider and Broadband Wholesaler Agreements, all CCI Projects ................................................................................................................................. 30
Figure 7. Estimated Effect of BTOP on Broadband Availability in the CCI Evaluation Study Sample Service Area for Different Populations of Interest ............................................................................ 44
Figure 8. Cumulative PCC Hardware Installations and Upgrades ................................................... 46
Figure 9. Cumulative CCI Community Anchor Institution Connections ............................................ 49
Figure 10. Cumulative New Household Subscribers (SBA Grantees) ............................................. 50
Figure 11. Distribution of Rural Percentage of Population in Treatment and Potential Control Counties ............................................................................................................................................ 99
Figure 12. Number of Different Control Counties Selected for Treatment Counties ...................... 103
Figure 13. Resampled Effect and Confidence Bands for NTIA Broadband Availability ................. 106
Figure 14. Comparison of Estimated Effects with Confidence Intervals ........................................ 106
1
Executive Summary About the Evaluation Study
On September 17, 2010, the National Telecommunications and Information Administration (NTIA) awarded a task order to ASR Analytics, LLC (ASR) to complete an evaluation study of the Broadband Technology Opportunities Program (BTOP).1 The scope of work includes an assessment of the benefits that BTOP grants are having on broadband availability and adoption, and in achieving social and economic benefits in areas served by the grantees.2 ASR is also required to provide NTIA with all data that created a foundation for the analysis and conclusions, as well as all data that could be utilized by future researchers.3 A complete description of the methodology used in the evaluation study is available in the BTOP Evaluation Study Design.4
This Final Report quantitatively and qualitatively assesses the social and economic impact of BTOP grants and discusses how NTIA’s implementation of BTOP has encouraged the fulfillment of the goals of the American Recovery and Reinvestment Act of 2009’s (Recovery Act). The information presented in this Final Report captures the social and economic impacts of the BTOP program in the evaluation study sample. This report is not an evaluation of any grantee, subgrantee, or partner.
Between July 2011 and November 2013, ASR conducted forty-two site visits with twenty-seven different BTOP grantees (the evaluation study sample). NTIA selected grants for inclusion in the case study sample in order to provide a representative sample of grantees, taking into account the wide diversity in types of grants, their objectives, target audiences, types of technology, timing of project milestones and completion schedules, and geographic scope. ASR submitted a case study report after each site visit.
This Final Report summarizes and synthesizes the social and economic impacts presented in the forty-two case study reports, two interim reports, and a short-term economic impacts report accepted by NTIA under this task order. ASR developed its conclusions based on a mixed-methods approach that includes comparative case studies of BTOP-funded projects, input-output analysis of the short-term economic impacts of all BTOP budgetary spending, and a matched-pairs analysis of the counties served by infrastructure grants in the evaluation study sample. Quantitative impact extrapolations presented in this report might be higher or lower than those actually observed in the future. In particular, (1) the longer-term quantitative extrapolations presented here are based on estimates of the effects of broadband on economic conditions as published in the broadband literature, and future impacts might be larger or smaller than those observed in the past; (2) the data used for quantitative extrapolations was assembled using a sample of projects that NTIA chose to provide a broad selection of project goals and management approaches, not to provide a random sample of projects for statistical analysis; and (3) a sensitivity analysis shows a wide range of potential impacts based on methodological and definitional choices. Future researchers should continue to examine the social and economic impacts of the BTOP program in order to better understand its long-term impacts, especially as more data becomes available.
The information presented in this report captures the social and economic impacts of the BTOP program and is not an evaluation of any grantee, subgrantee, or partner.
2
About BTOP
The Recovery Act appropriated $4.7 billion in federal funding to NTIA to implement BTOP and to maintain a nationwide public map of broadband service capability and availability.5 In 2009 and 2010, NTIA invested approximately $4 billion in 233 BTOP projects benefiting every state, as well as five territories and the District of Columbia. NTIA funded three types of projects under BTOP:6
Public Computer Centers (PCC) projects establish new public computer facilities or upgrade existing facilities in order to provide broadband access to the public or to specific vulnerable populations, such as low-income individuals, the unemployed, seniors, children, minorities, and people with disabilities.
Sustainable Broadband Adoption (SBA) projects focus on increasing broadband Internet use and adoption, especially in vulnerable populations where broadband technology has traditionally been underutilized.
Comprehensive Community Infrastructure (CCI) projects deploy new or improved broadband Internet facilities to connect households, businesses, and community anchor institutions (CAI) such as schools, libraries, hospitals, and public safety facilities.
Grantee budgets were composed of both federal funds and non-federal matching funds. NTIA allocated $3.4 billion in federal funding to the BTOP grantees. In addition to these federal funds, grantees obtained a combined $1.2 billion in non-federal matching funding, for a total budget of approximately $4.5 billion.7 NTIA used a portion of Recovery Act funds to develop and maintain a nationwide map containing information on broadband service availability and implement the State Broadband Data Act and the Broadband Data Improvement Act. NTIA defunded nine of the original 233 BTOP grantees for various reasons. These 9 projects had a total value of approximately $183.9 million.8 Additionally, all expenditure and budget figures in this analysis exclude seven public safety grants, at the request of NTIA. These 7 grants total approximately $382 million in Recovery Act funding and an additional $137 million in non-federal matching funding.9
In the last quarter of 2012, BTOP grant award periods began reaching their end dates. As of December 31, 2013, 32 BTOP projects remained in active status.10 As of the same date, NTIA had provided extensions until no later than December 31, 2014 to these grant recipients.11 NTIA reported that CCI projects planned to deploy 115,000 new and upgraded network miles and directly connect or improve existing connections to more than 23,000 CAIs.12 As of December 31, 2013, grantees were responsible for 109,137 miles of fiber infrastructure (including new, upgraded, and leased miles) and had directly connected 21,240 CAIs.13 In addition, CCI grantees had deployed nearly 15,000 interconnection points, and signed more than 800 agreements with third-party service providers and broadband wholesalers.14 Many grantees also cited agreements that were still under negotiation. As the conditions of third-party agreements are confidential, it is not possible for the evaluation study team to estimate how many residential customers could benefit from signed agreements. In addition, the number of customers served by these third parties is not publicly available.
Among the CCI projects in the evaluation study sample, nearly all grantees continue to connect additional CAIs to their networks. Grantees are actively promoting network availability and negotiating with third-party providers to establish interconnection agreements. These efforts have expanded, and are likely to continue to expand, the delivery of affordable and reliable broadband service to residents, businesses, and CAIs in underserved regions.15
NTIA reported that PCC projects had planned to install nearly 41,000 workstations in computer centers throughout the country.16 As of December 31, 2013, PCC projects had created and upgraded 3,300 computer centers, installed more than 46,000 workstations, upgraded more than 2,400 broadband connections, and installed 1,700 wireless broadband connections.17 Among the projects included in the evaluation study sample, the majority of the BTOP-funded computer centers remain operational after the award period. While some grantees are maintaining computer
3
centers at the capacity offered during the award period, others, facing more severe funding limitations, have elected to scale back the delivery of training, to reduce hours of operation, or to transfer computer center management to other community organizations. All grantees in the evaluation study sample continue to offer patrons, to some degree, access to the training programs and resources provided during the award period.18
Many of the SBA programs established, expanded, or supported by BTOP funding will be continued by grantees or project partners after the award period. Some grantees obtained funding from government or nonprofit organizations to support continued or expanded program delivery. Grantees with post-award budgets too small to support the continuation of BTOP project services often transferred program management or resource ownership to partners and community organizations, enabling service delivery to continue to some extent. In some cases, grantees have scaled back program delivery to compensate for reductions in funding. Grantees intend to leverage resources created or enhanced through their BTOP projects in continued efforts to serve target populations.19
Social and Economic Impacts of BTOP Projects
The largest social and economic impacts derived from BTOP were the result of increased broadband availability in areas served by BTOP infrastructure grants. As shown in Section 4.2 and Appendix D, CCI projects increased broadband availability (defined as service with at least 3 Mbps download speed and 768 kbps upload speed) by an estimated 2 percent in the areas served by BTOP CCI grantees from June 2011 to June 2013 over and above changes in broadband availability that were experienced in areas that did not receive BTOP grants for improvements in broadband infrastructure. Other social and economic impacts of CCI projects included benefits to educational institutions, healthcare providers, government entities, communities, and individuals residing in areas with increased broadband service. ASR reviewed the broadband literature and identified articles presenting quantified benefits that might result from the increased broadband availability facilitated by BTOP-funded middle mile infrastructure. Appendix D presents benefit extrapolations in more detail. The most significant impacts estimated for the program as a whole include the following, generally in decreasing order of impact size:20
Increased Economic Output: The largest long-term social or economic impact due to BTOP infrastructure spending is a yearly increase in GDP in the areas served by the new broadband infrastructure. ASR used two studies, Czernich et al. (2011) and LECG Ltd. (2009), to extrapolate the increase in economic output that could be expected in counties receiving BTOP-funded infrastructure.21 For the base case of a 2.0 percent increase in broadband availability, BTOP infrastructure spending could be expected to yield $5.7 billion in increased output annually, using Czernich et al. (2011) as a basis for extrapolation, or $21.0 billion annually using results from LECG Ltd. as the basis for extrapolation.22
Long-Term Increased Levels of Employment: Kolko (2010) and Gillett et al. (2006) provide a basis for estimating the increase in employment due to broadband infrastructure spending.23 Based on Kolko’s estimates, the additional broadband infrastructure provided by BTOP could be expected to create more than 22,000 long-term jobs and generate more than $1 billion in additional household income each year. Results from Gillett et al. (2006) suggest at least 6,900 long-term jobs could be created in the year following the construction of BTOP infrastructure, and potentially each year for at least the next four years due to increasing employment growth in areas with new broadband availability. These employment increases would result in an
BTOP infrastructure spending could be expected to yield $5.7 billion in increased output annually, using Czernich et al. (2011) as a basis for extrapolation, or $21.0 billion annually using results from LECG Ltd. as the basis for extrapolation.
4
increase in household income of more than $300 million for each year employment increases by the estimated amount in newly served areas.24
Value to New Broadband Subscribers: The Allen Consulting Group (2010) finds the value of broadband Internet access to the average American household is about 3.4 percent of average household income.25 Based on the number of households and a 2 percent increase in broadband availability, the estimated value of broadband to new subscribers is approximately $2.6 billion per year.26
Reduced Prices and Improved Service for CAIs: Where available, the evaluation study team collected subscription speed and price data from CAIs connected by projects in the evaluation study sample to quantify improvements resulting from BTOP connections. Representatives of sixty CAIs provided ASR with broadband subscription speed data for eight-six individual sites; forty-seven of these sites also provided pre- and post-BTOP broadband subscription price data. In general, CAIs connected by projects in the evaluation study sample saw a decrease in their monthly Internet subscription costs per Mbps. Community anchor institutions served by BTOP infrastructure experienced a decline in broadband prices of approximately 95 percent, regardless of institution type. As an example of the potential importance of price reductions of this size, K-12 schools connected by BTOP grantees could experience a cost difference of $2 billion annually, or approximately $268,000 per CAI, assuming that existing infrastructure could support this level of service and that the prices per Mbps reported in the evaluation study sample are representative across all K-12 institutions.27
Improved Availability for Those Living in Rural Areas, Seniors, and Those Living in Poverty: As shown in Figure 1, BTOP infrastructure projects led to increases in broadband availability, especially in rural areas and areas where seniors and those living below the poverty line resided. Based on the estimated 2 percent broadband availability increase from BTOP infrastructure projects, more than 4.3 million people across the United States gained broadband availability from June 30, 2011 to June 30, 2013 due to BTOP infrastructure projects.28
Figure 1. Estimated Effect of BTOP on Broadband Availability in the CCI Evaluation Study Sample Service Area for Different Populations of Interest
Improved Job Search Outcomes: In the broadband literature, Internet job searching has been
credited with decreasing job search duration.29 ASR found evidence that users of BTOP PCC and SBA programs experienced improved job search outcomes. Using the estimated effect of Internet job searching on the length of unemployment found in the literature, PCC and SBA programs could be expected to reduce job search times for participants, resulting in $94 million and $190 million of additional income, respectively.30
Short-Term Employment and GDP Increases: Using IMPLAN, the industry-standard software package for measuring short-term economic impacts, ASR estimated that the total budget of
Community anchor institutions served by BTOP infrastructure experienced a decline in broadband prices of approximately 95 percent, regardless of institution type.
5
BTOP was responsible for creating approximately 79,000 year-long jobs. ASR estimates that the total short-term output created by BTOP surpassed $12.9 billion. The IMPLAN results show that every $1 spent by BTOP grantees produced $2.81 in total output.31
Other Impacts: ASR noted social and economic impacts in other areas, including Education and Training, Healthcare, Government Services, Quality Of Life/Civic Engagement, and Digital Literacy. In general, quantitative values could not be placed on these benefits. Section 3 and Appendix B include qualitative descriptions of these impacts.
6
Section 1. Introduction 1.1 About the Evaluation Study
In September 2010, the National Telecommunications and Information Administration (NTIA) selected ASR Analytics, LLC (ASR) to conduct an evaluation of the social and economic impacts of its Broadband Technology Opportunities Program (BTOP) project grants.
This evaluation study had three goals:32
1. Identify the social and economic impacts of the BTOP grants. The Case Studies shall gather evidence from third parties, such as consumers and anchor institutions as to the impact of the project in the community.
2. Identify how the grantee maximized the impact of the BTOP investment. The Case Studies shall identify successful techniques, tools, materials and strategies used to implement the project.
3. Provide data to support the assessment of whether NTIA’s implementation of BTOP has encouraged the fulfillment of ARRA goals.
The information presented in this Final Report captures the social and economic impacts of the BTOP projects in the evaluation study sample. This report is not an evaluation of any grantee, subgrantee, or partner. The centerpiece of this Final Report is an assessment of the benefits that BTOP grant awards have had on broadband availability and adoption and in achieving social and economic benefits in areas served by the grantees.
The analysis presented in this report uses a mixed methods approach that includes comparative case studies of twenty-seven BTOP-funded projects. Case study analysis is a preferred strategy when “how” and “why” questions are raised and, through a mixed methods approach, is a complement to quantitative analysis.33 This approach is useful in understanding new phenomena, as case studies provide contextual information that can frame quantitative results. Case studies are particularly suited to explaining contemporary, complex events because the method depends on in-depth interviews, systematic data analysis, and access to a variety of evidence, including documents, interviews, and observation.34
In this evaluation study, case studies augment quantitative analysis by providing details about BTOP-funded projects and the impacts they produce for the individuals, institutions, and communities they serve. The evaluation study team analyzed qualitative data to describe each grant project, and to summarize the impacts observed within and across cases in the evaluation study sample.35 The detail of case studies allowed the evaluation study team to identify nuances that should be taken into account when drawing conclusions from empirical results. The measures selected to quantify impacts reflect the causal relationships between grant activities and impacts that were reported during case study site visits.
Between July 2011 and November 2013, ASR conducted forty-two site visits with twenty-seven different BTOP grantees (the evaluation study sample). ASR submitted a case study report after each site visit. The results presented in case study reports are primarily qualitative, with quantitative data provided where feasible. Each case study report included the following descriptions:36
How the grantee maximized the impact of the BTOP investment
Successful techniques, tools, materials, and strategies used to implement the project
7
Best practices and evidence from third parties, such as consumers and anchor institutions, as to the impact of the project in the community
The evaluation study team prepared case studies, based on an analysis of activities leading to the acceptance and use of broadband Internet and computer technologies, through field research, interviews, and analysis of secondary sources. The team visited PCC and SBA grantees twice, once early in the project lifecycle to develop a baseline understanding of grant activities (described throughout the report as Round 1), and once near the end of the project lifecycle to better understand outcomes and impacts (described throughout the report as Round 2). The evaluation study team made only one visit to CCI grantees. Most CCI projects were not complete at the time of the site visit.
As shown in Table 1, the evaluation study team performed 413 site visit interviews and focus groups between July 2011 and November 2013. Each site visit included an average of nearly 10 interviews and focus groups with grantee representatives, program staff, partners, and users. The forty-two case study reports ASR delivered to NTIA referenced data from 872 files. Some documents may be referenced in both Round 1 and Round 2 PCC and SBA case study reports.
Table 1. Site Visit Summary Statistics
Project Type Site Visit Dates Total Number ofInterviews andFocus Groups*
Total Number ofFiles Referenced†
PCC and SBA: Round 1 July – December 2011 118 239
PCC and SBA: Round 2 January – June 2013 131 223
CCI June – November 2013 164 410
Total 413 872
* Excludes follow-up conversations † Excludes interview transcripts, site visit notes, and e-mails
During the second quarter of 2014, ASR performed follow-up calls with all twenty-seven grantees in the evaluation study sample to understand the extent to which programs initially funded by BTOP are able to maintain operations without BTOP funds. Grantees also discussed the availability of data collected through existing efforts or new third-party studies. ASR reviewed available third-party studies for information relevant to the measurement of the social and economic impacts of BTOP. Section 3 and Appendix B present summaries of the data collected and the results gathered from these studies.
The evaluation study team also analyzed quantitative data on each of the projects in the evaluation study sample, where possible. BTOP grantees are required to report their project progress to NTIA through the submission of five Performance Progress Reports (PPR) each year: one per calendar quarter and one Annual Progress Report (APR). ASR received PPRs and APRs for all grantees from NTIA each quarter between December 2010 and April 2014. As of April 2014, ASR had obtained 14 sets of quarterly reports and analyzed data from 2,743 PPRs and 891 APRs. This analysis excludes seven public safety grants, which NTIA asked ASR to exclude from the analysis of social and economic impacts.
On May 12, 2014, NTIA provided ASR with census block-level data on broadband availability and population characteristics generated by the National Broadband Map (NBM)/FCC team (described throughout this report as NBM data). The NBM data represent the broadband and population characteristics of all census blocks in the United States on particular dates (described throughout the report as release dates). The NBM data provided to ASR include the June 30, 2011; December 31, 2011; June 30, 2012; December 31, 2012; and June 30, 2013 release dates (the data for a particular release date are referred to as an “NBM release” or “release”). The same broadband and
8
population characteristics are included in every NBM release provided to ASR. This includes the census block identifier; the population and number of housing units in a census block with broadband availability; total population and housing units; census block urban or rural flag; and demographic characteristics (counts of individuals belonging to minority groups, individuals over sixty years of age, and individuals in poverty).
1.2 Projects in the Evaluation Study Sample
NTIA selected grants for inclusions in the case study sample in order to provide a representative sample of grantees, taking into account the wide diversity in types of grants, their objectives, target audiences, types of technology, timing of project milestones and completion schedules, and geographic scope. Logistical considerations, including budget and travel, were also considered in making the final selection of grants. As shown in Figure 2, the twenty-seven grantees in the evaluation study sample are located in twenty different states. This figure does not highlight the grantee service areas, but rather summarizes the geographic diversity of the grants selected.
Figure 2. Evaluation Study Sample Grantee Locations
1.2.1 Selected PCC Grants
Eight PCC grants were selected for inclusion in the evaluation study sample:37
Cambridge Housing Authority (CHA): CHA received $698,924 in BTOP funds and spent $568,652 in matching funds by the close of the award period.38 The project proposed to rehabilitate and improve CHA’s broadband training by reopening and expanding three public computer centers, replacing twenty-four workstations, adding sixteen new workstations, and reinstating CHA’s educational programs.39 CHA met these goals, and established a fourth PCC in a high school. By the end of the award period, CHA had delivered 65,282 hours of training. The majority of this training was in the Education and Training focus area.40
Delaware Division of Libraries (DDL): DDL spent $1,897,099 in federal funds and $1,006,590 in matching funds for the Delaware Library Job/Learning Labs project.41 This project proposed to address the online access needs of economically vulnerable communities in Delaware, with a focus on the unemployed and underemployed who request job-searching assistance from public
9
libraries.42 By the end of the award period, DDL had delivered 51,829 hours of training, with the Workforce and Economic Development focus area receiving the most attention.43
Florida Agricultural and Mechanical University (FAMU): FAMU spent $1,492,862 in BTOP funding and $411,302 in matching funds by March 2014 for the Center for Public Computing and Workforce Development (CPCWD) project.44 This project proposed to provide workforce development opportunities focused on industry certifications, education, customized training, and virtual learning services.45 FAMU had delivered 31,849 hours of training by the end of 2013, the majority of which was in the Workforce and Economic Development focus area.46 NTIA granted FAMU a program extension through September 30, 2014.47
Las Vegas-Clark County Urban League (LVUL): LVUL received $4,680,963 in BTOP funding and $2,236,060 in matching funds for the Nevada Public Computer Centers (NVPCC) project. By the end of the grant period, the project had spent a total of $6,894,214.48 The project proposed to provide access to computers and training to low-income and high-unemployment communities in Clark County, Nevada.49 NVPCC provided 127,509 hours of training, with a focus on Workforce and Economic Development.50
Michigan State University (MSU): MSU spent $6,003,799 in BTOP funding and $1,778,641 in matching funds as of September 30, 2013 for the Evidence Based Computer Center II project.51 The project proposed to expand or create more than 200 computer centers in colleges, public libraries, public housing developments, tribal community centers, and other community support organizations across the State of Michigan and to equip them with about 2,400 computers.52 The MSU project exceeded these goals and delivered a total of 243,554 hours of training, with the highest number of training hours devoted to Digital Literacy.53
South Carolina Technical College System (SCTCS): SCTCS spent $5,903,040 in BTOP funding and $1,710,303 in matching funds for the Reach for Success project.54 The project proposed to make computer centers available to SCTCS students and members of the communities surrounding the technical colleges to increase their employability and to prepare them for successful careers.55 The project provided 160,541 hours of training, mostly within the Education and Training focus area. 56
Technology For All (TFA): TFA is a nonprofit organization that uses technology to create opportunities in low-income communities. TFA spent $9,588,279 in BTOP funding and $2,671,099 in matching funds for the Texas Connects Coalition (TXC2) project. TFA secured and spent an additional $5,792,404 over the course of the project.57 The project proposed to create computer centers and networks that provide access to broadband technology, to promote computer literacy, and to permit digital inclusion for all Texans.58 By the end of the project, TFA delivered 3,705,936 hours of training, primarily in the Digital Literacy focus area.59
WorkForce West Virginia (WFWV): WFWV is a state agency that seeks to increase employment, to improve the quality of the West Virginia workforce, and to enhance job retention and earnings. WFWV spent $1,901,600 in BTOP funding and $568,000 in matching funds to support the One Stop Public Computer Center Modernization project.60 This project proposed to update nineteen employment resource centers across the state.61 By the end of the project, WFWV had improved or established twenty computer centers in employment resource centers, in addition to seventy-five computer centers in other locations, including libraries and veteran support organizations. It also delivered 12,436 hours of training, the majority of which related to Workforce and Economic Development.62
1.2.2 Selected SBA Grants
Seven SBA grants were selected for inclusion in the evaluation study sample:
C.K. Blandin Foundation (C.K. Blandin): C.K. Blandin seeks to strengthen communities in rural Minnesota, especially the Grand Rapids area. C.K. Blandin spent $4,858,219 in BTOP funding and $1,841,927 in matching funds for the Minnesota Intelligent Rural Communities (MIRC) project.63 The MIRC project proposed to create technologically and economically vital rural communities by improving broadband adoption, job growth, and wealth creation
10
opportunities. In addition to mobilizing eight statewide partners, the MIRC project funded eleven Demonstration Communities. Each of the Demonstration Communities independently designed and implemented a range of projects within a geographic area.64 MIRC’s statewide partners delivered 32,730 hours of Digital Literacy and Workforce and Economic Development training by the end of the award period. The project resulted in 56,663 new household broadband subscribers in rural Minnesota.65
California Emerging Technology Fund (CETF): CETF was established in 2005 as a nonprofit corporation by the California Public Utilities Commission. CETF spent $7,251,295 in BTOP funding and $2,109,473 in matching funds for the Broadband Awareness and Adoption (BAA) project.66 The project proposed to facilitate broadband adoption in vulnerable communities in Los Angeles, the Central Valley, Orange County, San Diego, and the Inland Empire.67 CETF delivered 1,193,205 hours of training, with the largest amount of training hours devoted to Digital Literacy. The project resulted in 198,743 new household broadband subscribers in the service area.68
City of Chicago: The City of Chicago spent $7,074,369 in BTOP funding and $1,769,066 in matching funds for the Smart Chicago project.69 The project proposed to improve the quality of life of residents in target communities through digital technology and the Internet by increasing the programmatic depth of existing broadband awareness and adoption efforts.70 The Smart Chicago project delivered 47,762 hours of training, primarily related to Digital Literacy. The project also resulted in 32,163 new household broadband subscribers and 75 new business broadband subscribers.71
Connect Arkansas: Connect Arkansas is a private, nonprofit organization promoting sustainable Internet adoption and economic growth within Arkansas. Connect Arkansas received $3,702,739 in BTOP funding and $1,037,247 in matching funds for the Expanding Broadband Use in Arkansas Through Education project. Connect Arkansas received an extension from NTIA through September 30, 2014, and estimated having spent about 95 percent of the project budget by early 2014.72 The project proposed to improve economic competitiveness, to improve healthcare provision, and to increase technology use among Arkansans.73 By the end of 2013, Connect Arkansas delivered 64,459 hours of training, primarily in the Workforce and Economic Development focus area. The project also produced 145,200 new household broadband subscriptions.74
Foundation for California Community Colleges (FCCC): FCCC provides funding and learning opportunities for students in the California Community College system. FCCC spent $10,944,843 in BTOP funding and $3,375,429 in matching funds for the California Connects project.75 The project proposed to provide access to broadband and training for digital literacy, workforce development, and lifelong learning. Two partners deliver FCCC grant services: the Mathematics, Engineering, Science Achievement (MESA) program, which served first-generation community college students with demonstrated financial need and residents in their communities; and the Great Valley Center (GVC), which offers noncredit courses and workshops for residents of California’s Central Valley.76 These partners delivered 131,445 hours of training, the majority of which was in the Digital Literacy focus area. The FCCC project resulted in 10,791 new household broadband subscriptions.77
Future Generations Graduate School (Future Generations): Future Generations employs community-based approaches to address major social challenges. Future Generations spent $4,461,874 in BTOP funding and $1,262,368 in matching funds for the Equipping West Virginia’s Fire and Rescue Squads project.78 The project proposed to provide broadband access to West Virginians in low-income and rural communities.79 Future Generations established and staffed sixty public computer labs in fire stations and delivered 47,732 hours of training, primarily in the Digital Literacy focus area. Future Generations estimated the project produced 30,629 new household broadband subscriptions.80
Urban Affairs Coalition (UAC): UAC operates and manages a wide range of programs, services, and public policy initiatives that focus on community issues within the Greater Philadelphia, Pennsylvania area. UAC spent $11,804,015 in BTOP funding and $5,269,755 in matching funds for the Freedom Rings project. The project proposed to reduce barriers to
11
broadband adoption through programs for increased access, awareness, and digital literacy training.81 The Freedom Rings project delivered 182,397 hours of training, mostly within the Digital Literacy focus area.82 The project also resulted in 5,276 new household broadband subscribers and 50 new business broadband subscribers.83
1.2.3 Selected CCI Grants
Twelve CCI grants were selected for inclusion in the evaluation study sample:
Clearwave Communications (Clearwave): Clearwave is a facilities-based communications company that offers a range of telecommunications services to business and residential companies. Clearwave spent $31,515,253 in BTOP funding and $23,487,214 in matching funds for the Illinois Broadband Opportunities Partnership (IBOP) – Southern project. Clearwave proposed to deploy a high-speed, fiber-based middle mile network across a twenty-three-county region in southern Illinois to improve broadband access for CAIs in rural and economically distressed communities.84 By the end of the award period, Clearwave had built 749 new miles of fiber infrastructure and had connected 230 CAIs. Between the end of the award period and May 2014, Clearwave connected an additional 110 CAIs.85
Executive Office of the State of West Virginia (West Virginia): West Virginia works to make broadband affordable and accessible to all West Virginians. As of May 2014, West Virginia had spent $126,323,926 in BTOP funding and $33,500,000 in matching funds to expand existing broadband infrastructure and the state’s microwave public safety network. As of September 2013, the project had built 675 miles of fiber.86 By the end of the grant period, West Virginia had connected 1,191 CAIs.87
Lane Council of Governments (LCOG): LCOG is an association of local governments that provides member governments with services that include regional planning, coordination, program development, and service delivery. LCOG spent $8,322,577 in BTOP funding and $2,113,505 in matching funds.88 LCOG proposed to improve a high-speed, fiber-optic backbone and deploy a new fiber-optic network across Lane County, Douglas County, Klamath County, and the Klamath tribal regions in western Oregon. The project also proposed to improve broadband access for CAIs in rural and underserved communities.89 By the end of the award period, LCOG had constructed 104 new miles, had leased 395 miles of fiber, and had connected 139 CAIs.90
Massachusetts Technology Park (MassTech): MassTech, a public agency that fosters economic development in Massachusetts, comprises three divisions, including the Massachusetts Broadband Institute (MBI). MBI works with municipalities and broadband service providers to bridge the digital divide in Massachusetts.91 MassTech spent $45,445,444 in BTOP funding and $36,638,260 in matching funds to implement the MBI: MassBroadband 123 (MB123) project. The project proposed to deploy a high-speed, fiber-based network in western Massachusetts to provide the region with the same broadband connectivity available in the eastern part of the state.92 As of the first quarter of 2014, MB123 had connected 1,238 CAIs and 198 unique locations had subscribed to service.93 The project built 952 miles and leased 236 miles of fiber.94
MCNC: MCNC was founded in 1980 to stimulate economic development through technology research and initiatives. MCNC spent $75,757,289 in BTOP funding and $30,334,680 in matching funds to implement the North Carolina Rural Broadband Initiative project.95 MCNC proposed to expand the network of MCNC’s other CCI project by building 1,300 additional middle miles capable of 100 Gbps and a 3 Mbps wireless network.96 By the end of the award period, MCNC had built 1,301 miles of new fiber, upgraded 60 miles, and leased 336 miles. MCNC also connected 175 CAIs.97
Merit Network, Inc. (Merit): Merit is a nonprofit broadband service provider that manages networks for education and nonprofit institutions throughout the State of Michigan. NTIA awarded Merit $33,289,221 to implement the Rural Education Anchor Community Healthcare Michigan Middle Mile Collaborative (REACH-3MC) project. Merit obtained an additional
12
$8,322,306 in matching funds.98 The project proposed to deploy a high-speed, fiber-based middle mile network through Michigan’s Lower Peninsula to serve community anchor institutions, businesses, and households.99 By the end of the award period, Merit had built 1,010 new miles of fiber, upgraded 34 miles of fiber, and connected 154 CAIs.100
Mid-Atlantic Broadband Communities Corporation (MBC, formerly the Mid-Atlantic Broadband Cooperative): MBC provides telecommunications solutions to isolated rural communities in southern Virginia. MBC spent $15,068,209 in BTOP funding and $4,000,943 in matching funds to implement the Middle Mile Expansion for Southern Virginia project. MBC proposed to expand its existing fiber network to reach K-12 schools, other community anchor institutions, and industrial parks in seventeen counties and five cities in southern Virginia.101 By the end of the award period, MBC had built 428 miles of fiber and connected 118 CAIs.102
OneCommunity: OneCommunity is a nonprofit organization dedicated to accelerating the adoption of information technologies to drive economic development and support health, education, and government services in northeast Ohio. As of September 30, 2013, OneCommunity had spent $42,912,687 in federal funding and $11,792,321 in matching funds to implement the Transforming NE Ohio project. At that time, it projected final project expenditures to be $60,046,431, including $44,684,852 in BTOP funding and $15,361,578 in matching funds.103 The project proposed to build 900 miles of new fiber and leverage its existing network to connect CAIs throughout the twenty counties in northeastern Ohio.104 As of September 30, 2013, OneCommunity had built 993 new miles, upgraded 799 miles, and leased 325 new and 351 existing network miles. OneCommunity also directly connected or improved connections to 960 CAIs.105
OSHEAN: OSHEAN is a consortium of nonprofit organizations that seeks to provide innovative Internet-based technology solutions to its members and their communities. OSHEAN spent $21,739,183 in BTOP funding and $10,737,808 in matching funds to implement the Beacon 2.0 project. The project proposed to expand and upgrade OSHEAN’s Beacon 1.0 project, a 612-mile fiber network initially built in Rhode Island, and to connect up to 50 new CAIs in Rhode Island and Massachusetts.106 OSHEAN upgraded 432 network miles and leased 475 miles. By the end of the award period, OSHEAN had connected 115 CAIs.107 OSHEAN connected an additional 26 CAIs as of May 2014.108
South Dakota Network, LLC (SDN): SDN, owned by seventeen independent telecommunications companies, provides centralized equal access and wholesale long-distance services for its members, state and local government entities, schools, financial institutions, and healthcare providers. SDN spent $20,572,242 in BTOP funding and $5,265,907 in matching funds to implement Project Connect South Dakota.109 SDN proposed to add to its existing fiber-optic network to serve CAIs in rural and underserved areas of the state.110 By the end of the award period, SDN had built 397 new network miles, upgraded 1,804 miles, and connected 638 CAIs.111
University of Arkansas System (UAS): UAS has more than 66,000 students and 17,000 employees distributed across 6 main campuses, a medical school, 2 law schools, and several community colleges.112 UAS spent $102,131,393 in BTOP funding and $26,450,427 in matching funds to implement the Arkansas Healthcare, Higher Education, Public Safety, and Research Integrated Broadband Initiative, later renamed the Arkansas e-Link project. UAS proposed to improve telemedicine opportunities, to extend fiber connections to higher education institutions, and to upgrade existing higher education connections.113 By the end of the award period, UAS had deployed 49 new network miles and leased 716 new and 1,488 existing network miles. UAS had also connected 459 CAIs to the network.114
Zayo Bandwidth, LLC (Zayo): Zayo is a division of the Zayo Group, LLC that provides bandwidth infrastructure services, including dark fiber, Internet Protocol (IP) transport, and carrier-neutral colocation. Zayo spent $19,099,460 in BTOP funding and $9,174,866 in matching funds to implement the Indiana Middle Mile Fiber for Schools, Communities, and Anchor Institutions project.115 Zayo proposed to deploy a 626-mile fiber-optic network to provide connections up to 10 Gbps connections to 21 Ivy Tech campuses.116 Zayo constructed 645 new miles and offered an additional 198 miles as an in-kind contribution. By the end of the award
13
period, the project had connected the twenty-one Ivy Tech campuses and three other institutions of higher learning. Zayo plans to connect three more universities after the award period.117
1.3 BTOP Grantee Descriptive Statistics
Projects in the evaluation study sample are similar in budget size to all projects funded by the BTOP program. Table 2 shows both the average size and combined total of BTOP grants broken out by type (PCC, SBA, or CCI) and by their selection in the evaluation study sample.118 The figures below for “All” include the evaluation study sample projects in their calculations. The average size of PCC grants in the evaluation study sample is $5 million, compared to an average size of $4 million for all PCC grants across BTOP. The average SBA grant in the evaluation study sample has a budget of almost $10 million dollars, compared to $8 million across all of BTOP. The largest difference between the population and the sample is seen within the selection of CCI grants, where the average budget size in the evaluation study grants is $61 million compared to just $36 million across all of BTOP.
Table 2. Average BTOP Budgets (Million USD)
Metric Budget
PCC SBA CCI
StudySample
All Study
SampleAll
StudySample
All
Average
Federal 4.0 3.1 7.2 5.8 45.4 26.7
Match 1.3 1.3 2.3 2.4 15.5 9.2
Total 5.4 4.4 9.5 8.2 60.9 35.9
Total
Federal 32.2 199.2 50.1 250.3 545.0 2,905.7
Match 10.8 84.9 16.2 101.3 185.6 1,005.4
Total 42.9 284.1 66.3 350.6 730.6 3,911.2
Number of grants 8 65 7 43 12 109
Selected grantees’ output with respect to spending is similar to that seen across BTOP as a whole. Table 3 includes total training participants, total training hours, and the ratio of dollars spent by PCC and SBA grantees to the number of training hours administered.119 As of December 31, 2013, grants in the evaluation study sample provided nearly six million hours of training to more than one million training participants. This represents approximately 29 percent of the training hours given by all PCC and SBA grants and 29 percent of all PCC and SBA training participants. PCC evaluation study grants spent approximately $10 for each hour of training administered, compared to almost $25 for all BTOP PCC grants. SBA projects in the evaluation study sample were more representative of all SBA grants for spending per hour of training given. Evaluation study sample SBA grants and all SBA grants spent approximately $38 for each hour of training delivered.
14
Table 3. PCC and SBA Training
Metric
PCC SBA
Study Sample
All Study
Sample All
Total training participants 483,751 2,473,818 819,421 1,956,807
Average number of training participants per grantee 60,469 38,059 117,060 45,507
Total training hours 4,241,155 11,533,901 1,734,035 9,299,758
Average number of training hours per grantee 530,144 177,445 247,719 216,273
Total budget (millions) $43 $284 $66 $351
Average budget (millions) per grantee $5.4 $4.4 $9.5 $8.2
Budget dollars per training hour $10.12 $24.63 $38.26 $37.70
Table 4 summarizes the number of established and improved PCCs, as well as the number of hours those PCCs were open. PCC grants established or improved more than 3,100 PCCs by December 31, 2012.120 PCC grants in the evaluation study sample established or improved 452 of these PCCs, or 14 percent. In total, PCCs were open for an estimated 14,063,780 hours. Evaluation study sample grantees spent approximately $20 per hour for operating time, which was consistent with the cost per hour for all PCC grantees.
Table 4. PCCs and Lab Hours
Activity Evaluation
Study SampleAll
Total budget (millions) $43 $284
New PCCs established 93 656
Existing PCCs improved 359 2,471
Total PCCs 452 3,127
Budget per PCC $94,955 $90,849
Total weekday lab hours (est.) 1,841,537 12,130,206
Total weekend lab hours (est.) 331,376 1,933,574
Total lab hours (est.) 2,172,913 14,063,780
Budget per lab hour (est.) $19.75 $20.20
Table 5 includes information on the number of households that subscribed to broadband as a result of SBA grants. SBA grants in the evaluation study sample were responsible for signing up nearly 335,000 broadband households out of the approximately 736,812 total household broadband subscribers that resulted from all BTOP SBA grants (45 percent). On average, the evaluation study SBA grants spent less than $200 for each household that subscribed to broadband, compared to the average of almost $500 across all SBA grants.121
15
Table 5. SBA Household Connections
Metric Evaluation
Study SampleAll
Household subscribers 334,440 736,812
Dollars spent per household subscriber $198.38 $475.85
The estimated effect of BTOP infrastructure on local broadband availability may over- or understate the long-term impact of BTOP projects. In particular, the data used for the estimations were assembled based on a sample of projects that NTIA chose to provide a broad selection of project goals and management approaches, and not to provide a random sample of projects for a statistical analysis.122 As shown in Table 6, the projects in the sample were nearly twice as large as the average project size. The projects included in the sample represented approximately 11 percent of the projects funded by BTOP and 19 percent of BTOP CCI expenditures.123
Table 6. CCI Projects vs. Sample
Metric Evaluation
Study SampleAll
Average project size (millions) $61 $36
Number of projects 12 109
Total expenditures (millions) $731 $3,911
Percent of CCI projects 11% N/A
Percent of CCI expenditures 19% N/A
As shown in Table 7, CCI grants in the evaluation study sample appear to be similar to grants in the BTOP CCI portfolio as a whole when compared on measures of grant outputs per budgeted dollar: budgeted dollars per new fiber mile, budgeted dollars per CAI connected, and budgeted dollars per signed third-party agreement.124
Table 7. CCI Network Summary
Metric Evaluation
Study SampleAll
Total budgeted (millions) $731 $3,911
New network miles deployed 7,301 42,124
Budgeted dollars per mile $100,074 $92,849
CAIs connected 5,193 21,240
Budgeted dollars per CAI $140,698 $184,141
New agreements signed with last mile and wholesale providers
143 842
Budgeted dollars per agreement (millions) $5.1 $4.6
16
Section 2. Short-Term Economic Impacts BTOP grantees directly and positively affect the economy through the jobs they provide and the salaries, wages, and benefits they pay to their employees. Beyond these direct impacts, grantees generate additional indirect and induced effects on the economy. Indirect impacts include jobs, wages, and output created by the businesses that supply the goods and services to the project. Those receiving wages or salaries generated as indirect impacts then spend money on food, housing, transportation, and goods and services in other sectors. Induced impacts are composed of the spending of these wages and salaries. ASR conducted a short-term economic impacts study using Impact Analysis for Planning (IMPLAN), an input-output model that is widely used in the study of economic impacts, to estimate the direct, indirect, and induced impacts of all BTOP projects. The Short-Term Economic Impacts Report presents the full results of the analysis.125
Grantee expenditures and budget data are publicly available on the BTOP website in PPRs.126 Expenditures and budget figures are broken into federal funds and non-federal matching funds. The following terms, important in understanding the input metrics of the analysis, are used throughout this section:
The total budget of grantees represents all funds (both federal and matching) allocated to all grantees (CCI, PCC, and SBA) for their entire projects. Available data break this figure out further by grant type and dollar type. For example, the federal dollar budget for PCC and SBA grants represents total Recovery Act funding allocated to all PCC and SBA grantees.
Total expenditures of grantees represent all dollars spent (both federal and matching) by all grantees (CCI, PCC, and SBA) through the end of March 31, 2013. Available data break this figure out further by grant type and dollar type. For example, the federal dollar spending of CCI grants represents all Recovery Act funds spent by CCI grantees through March 31, 2013.
ASR used the most recently available data at the time the study was completed, reflecting grantee spending through the end of March 2013. The data show that grantees spent more than $3.8 billion of their total budget. PCC and SBA grantees were responsible for spending approximately $584 million, while CCI grantee spending accounted for the remaining $3.2 billion. With a total budget of $4.6 billion, grantees had a combined $777 million left to spend before the BTOP program’s end on September 30, 2013.127 ASR used budget totals to estimate the total spending expected of all BTOP grantees at the conclusion of the program.
The short-term economic impacts described in this section are quantified using several measures:
Employment figures included in this section represent full-time equivalent (FTE) positions. An FTE is assumed to represent 2,080 hours in a standard year, or a 40-hour workweek.128
Labor income represents all forms of employment income, including wages and benefits, and proprietor income.
Value added is the difference between total output (sales, receipts, and other operating income) and the cost of intermediate inputs (consumption of other goods and services from other industries or imported). This measure is also known as the gross domestic product (GDP).
The total budget of BTOP was responsible for approximately 79,000 year-long jobs. ASR estimates that the total output created by BTOP will surpass $12.9 billion. Every $1 spent by BTOP grantees produced $2.81 in total output.
17
Output represents the value of industry production (sales, receipts, and other operating income).
The total budget of BTOP will be responsible for a total effect on employment of approximately 79,000 year-long jobs. ASR estimates that the total output created by BTOP will surpass $12.9 billion. Every $1 spent by BTOP grantees produced $2.81 in total output. Figure 3 presents the economic impacts of grantees’ total budgets and breaks impacts out into those generated by federal and matching funds. More than 58,600 jobs, 74 percent of all jobs created by grantees’ total budgets, are a result of federal funding. Federal funds created an estimated $9.5 billion in total output, approximately 74 percent of the $12.9 billion in estimated total output generated by grantees’ total budgets.
Figure 3. Total Effect of Economic Impacts: Federal Funding vs. Matching Funding
0
10,000
20,000
30,000
40,000
50,000
60,000
70,000
80,000
90,000
Employment
Jo
bs
$0
$2
$4
$6
$8
$10
$12
$14
Labor Income Value Added Output
Bil
lio
ns
MatchingFunds
FederalFunds
18
Section 3. Intermediate-Term Impacts 3.1 Summary of Observed Intermediate-Term Impacts
This section describes intermediate-term impacts (defined as impacts that occurred during the grant award period) observed at PCC, SBA, and CCI grantee locations during site visits. ASR presents the overall potential benefit to all BTOP grantees where sufficient quantitative material is available to perform an extrapolation of the benefits to the program as a whole. Due to the length of time required to build new broadband infrastructure, the evaluation study team observed relatively fewer intermediate-term benefits for CCI projects. This section describes these impacts where they were reported.
Broadband is a general-purpose technology that has the potential to provide a broad spectrum of benefits. The evaluation study team thoroughly researched the broadband literature, gathering and consolidating descriptions of the likely social and economic impacts of the use of broadband technologies as promoted by BTOP projects. This resulted in six focus area definitions used to classify impacts observed in the evaluation study sample:
Workforce and Economic Development includes activities intended to increase overall employment of the target population, or to assist employed members of that population in finding jobs that offer increased salaries, better benefits, or a more attractive career path, including self-employment.
Education and Training includes activities that lead to a certificate or diploma that would typically be awarded by an educational institution, or that indicates the recipient has received training that is recognized as valuable for career advancement.
Healthcare includes broadband-enabled activities that improve the health of program participants or that of someone else. Activities performed by healthcare institutions as a result of BTOP grants, such as improvements in the provision and administration of healthcare services, are also included in this category.
Government Services identifies how broadband improves services provided by government organizations to the public and includes both the provision and administration of public safety activities.
Quality of Life/Civic Engagement includes activities that create stronger and more integrated communities and those that promote interaction between citizens and their governments.
Digital Literacy is fundamental to all the others. Digital literacy defines a set of skills and abilities that enable an individual to interact with the digital aspects of culture and to maintain a digital identity.
Each focus area comprised multiple potential social or economic impacts, as described in the literature review provided in Interim Report 1.129 To assess the social and economic impacts of the twenty-seven BTOP projects included in the evaluation study sample, the evaluation study team used these focus areas and the impacts they encompassed to classify the data obtained during site visit research. ASR used frequently reported impacts as the starting point for the quantitative estimation of intermediate-term benefits presented in this section.
Obtaining employment, improved productivity and efficiency (for both businesses and school administrators), and increased levels of education were the most frequent impacts.
19
Table 8 summarizes the impacts observed for PCC grants included in the evaluation study sample together with data on the frequency with which they were reported to the evaluation study team. For each impact, projects received a checkmark if grantees, partners, or other interview subjects reported that impact during case study site visits or follow-up discussions. The most frequently observed impacts were individuals obtaining employment, increased levels of education, and general benefits conferred by improved digital literacy.
Table 8. Impacts Observed in PCC Projects in the Evaluation Study Sample
Impact ID
Impact
CH
A
DD
L
FA
MU
LV
UL
MS
U
SC
TC
S
TF
A
WF
WV
Workforce and Economic Development
PCC.W.1 Obtained employment
PCC.W.2 Started or grew businesses
Education and Training
PCC.E.1 Increased levels of education
PCC.E.2 Improved academic performance
Healthcare
PCC.H.1 Improved health
Quality of Life
PCC.Q.1 Obtained legal rights and privileges
PCC.Q.2 Improved social connections
PCC.Q.3 Increased political engagement and civic participation
PCC.Q.4 Increased volunteerism
Digital Literacy
PCC.D.1 Improved social connections
PCC.D.2 General benefits to individuals
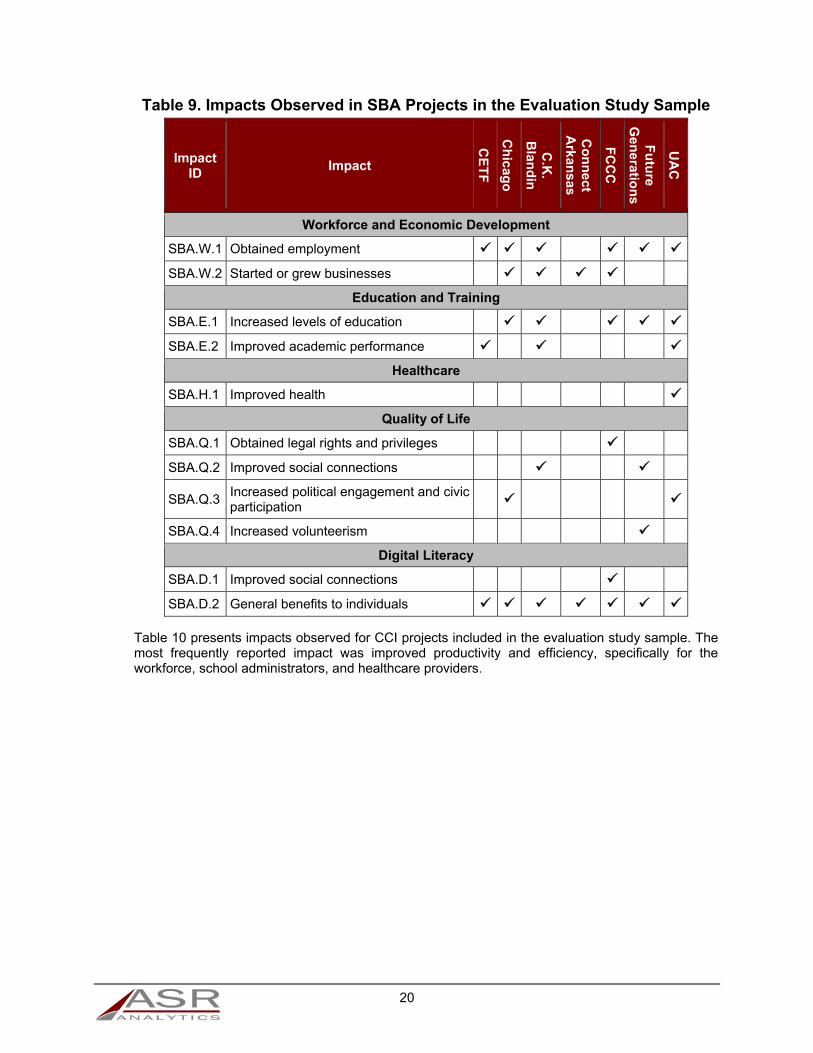
Table 9 presents impacts observed for SBA projects included in the evaluation study sample together with data on the frequency with which they were reported to the evaluation study team. As is the case for PCC grants, the most frequently reported impacts were individuals obtaining employment, increased levels of education, and general digital literacy benefits.
20
Table 9. Impacts Observed in SBA Projects in the Evaluation Study Sample
Impact ID
Impact
CE
TF
Ch
icago
C.K
. B
land
in
Co
nn
ect A
rkansas
FC
CC
Fu
ture
Gen
eration
s
UA
C
Workforce and Economic Development
SBA.W.1 Obtained employment
SBA.W.2 Started or grew businesses
Education and Training
SBA.E.1 Increased levels of education
SBA.E.2 Improved academic performance
Healthcare
SBA.H.1 Improved health
Quality of Life
SBA.Q.1 Obtained legal rights and privileges
SBA.Q.2 Improved social connections
SBA.Q.3 Increased political engagement and civicparticipation
SBA.Q.4 Increased volunteerism
Digital Literacy
SBA.D.1 Improved social connections
SBA.D.2 General benefits to individuals
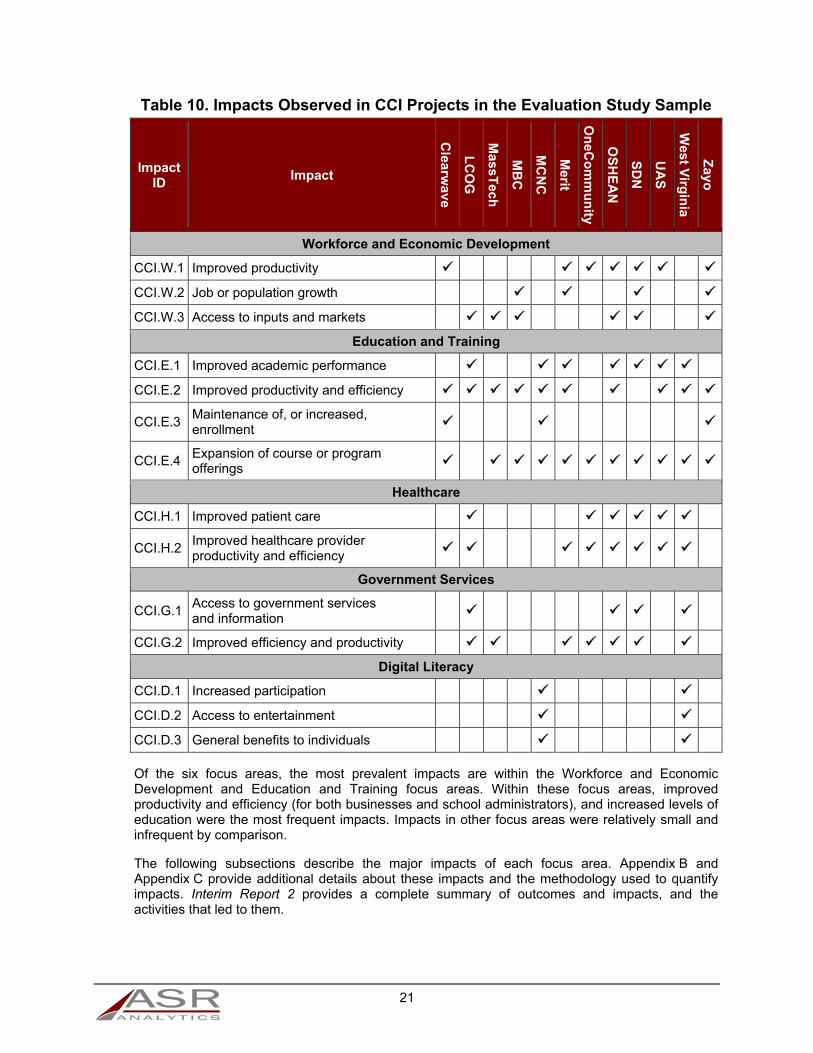
Table 10 presents impacts observed for CCI projects included in the evaluation study sample. The most frequently reported impact was improved productivity and efficiency, specifically for the workforce, school administrators, and healthcare providers.
21
Table 10. Impacts Observed in CCI Projects in the Evaluation Study Sample
Impact ID
Impact
Clearw
ave
LC
OG
MassT
ech
MB
C
MC
NC
Merit
On
eCo
mm
un
ity
OS
HE
AN
SD
N
UA
S
West V
irgin
ia
Zayo
Workforce and Economic Development
CCI.W.1 Improved productivity
CCI.W.2 Job or population growth
CCI.W.3 Access to inputs and markets
Education and Training
CCI.E.1 Improved academic performance
CCI.E.2 Improved productivity and efficiency
CCI.E.3 Maintenance of, or increased, enrollment
CCI.E.4 Expansion of course or program offerings
Healthcare
CCI.H.1 Improved patient care
CCI.H.2 Improved healthcare provider productivity and efficiency
Government Services
CCI.G.1 Access to government services and information
CCI.G.2 Improved efficiency and productivity
Digital Literacy
CCI.D.1 Increased participation
CCI.D.2 Access to entertainment
CCI.D.3 General benefits to individuals
Of the six focus areas, the most prevalent impacts are within the Workforce and Economic Development and Education and Training focus areas. Within these focus areas, improved productivity and efficiency (for both businesses and school administrators), and increased levels of education were the most frequent impacts. Impacts in other focus areas were relatively small and infrequent by comparison.
The following subsections describe the major impacts of each focus area. Appendix B and Appendix C provide additional details about these impacts and the methodology used to quantify impacts. Interim Report 2 provides a complete summary of outcomes and impacts, and the activities that led to them.
22
3.2 Workforce and Economic Development
This focus area includes activities intended to increase overall employment of the target population, or to assist employed members of that population in finding jobs that offer increased salaries, better benefits, or a more attractive career path, including self-employment. Reduced unemployment was the most frequently observed impact among the PCC and SBA grants included in the evaluation study sample.
3.2.1 PCC and SBA
The impacts most commonly observed across PCC and SBA grants in the evaluation study sample include:
Obtained employment: The acquisition of digital literacy skills, development of job readiness skills, the ability to search and apply for jobs online, or a combination of these outcomes resulted in participants obtaining a job or promotion.130 While seven of the eight PCC and six of the seven SBA projects in the evaluation sample reported instances of job seekers obtaining employment, the majority of the projects did not have a mechanism in place to track the number of jobs obtained. Projects that did report the number of jobs obtained relied on patrons to self-report their employment. Based on ASR’s extrapolations, more than 60,000 individuals searched for jobs using BTOP PCCs, resulting in an estimated reduction in unemployment durations of more than 330,000 weeks, equivalent to $94 million in wages and salaries. ASR estimates that new broadband subscriptions reported by SBA grantees could result in more than 100,000 job seekers beginning to search for jobs online, a more effective job-hunting strategy. This could be expected to reduce unemployment durations by an aggregate of more than 600,000 weeks, with a wage and salary value of $190 million. Appendix C provides more detail about each of these extrapolations.
Started or grew businesses: Participants successfully started or improved entrepreneurial endeavors using grant-funded resources. Users learned to implement web-based tools to launch an idea or to improve and grow their independent businesses.131 Participants also increased their client base by developing or enhancing their web presence and using electronic communication tools to interact with current and potential clients.132 Two of the eight PCC projects and four of the seven SBA projects in the evaluation study sample reported impacts related to independent contracting. For all PCC BTOP projects, ASR estimates that more than 25,000 people started a business, more than 26,000 looked for new customers, and nearly 13,000 grew their businesses. For all SBA BTOP projects, ASR estimates that more than 600 people started a business, more than 600 looked for new customers, and more than 300 grew their businesses. In addition, SBA projects resulted in more than 6,400 new business broadband subscriptions, which produced approximately $63 million in productivity benefits for small business subscribers by December 31, 2013. Appendix C provides more detail about each of these extrapolations.
Approximately 60,000 individuals searched for jobs using BTOP PCCs, resulting in an estimated reduction in unemployment durations of more than 330,000 weeks, equivalent to $94 million in wages and salary.
SBA projects resulted in more than 6,400 new business broadband subscriptions, which produced approximately $63 million of productivity benefits for small business broadband subscribers by December 31, 2013.
23
3.2.2 CCI
CCI projects support Workforce and Economic Development activities by providing infrastructure to support the growth of new and existing businesses. Observations reported by interviewees indicated that improved productivity was the most frequently observed impact among the projects included in the evaluation study sample. Several interviewees also reported benefiting from improved access to inputs and markets. Although a short period of time had elapsed since the construction of the grant-funded fiber networks, some interviewees reported instances of communities benefiting from job growth. The impacts most commonly observed across CCI grants in the evaluation study sample include:
Improved productivity: Saving resources enables organizations to devote those resources to more productive channels.133 Strengthening the intellectual capital within an organization improves productivity by enabling employees to perform tasks that are more intensive or to accomplish standardized tasks with fewer resources.134 Improved productivity also includes enabling employees to telecommute in the event of severe weather or other circumstances that would prevent onsite attendance.135
Job or population growth: Businesses that expand operations into new geographic territories or increase production and service delivery create or improve employment opportunities within a community.136 Businesses that improve the range of services offered may hire additional employees to support new company divisions.137 Job growth may be realized within specific industry sectors, such as a community realizing an increase in the number of service jobs.138
Access to inputs and markets: Businesses are able to increase their customer base by expanding operations, offering new products or services, selling at a new price point, or improving the quality of goods and services.139
3.3 Education and Training
This focus area includes activities that lead to a certificate or diploma that would typically be awarded by an educational institution, or that indicates the recipient has received training that is recognized as valuable for career advancement. The Education and Training impact that occurred most frequently was increased levels of education. This impact includes obtaining a Certificate of High School Equivalency and enrolling in or graduating from a degree-conferring program. Grantees also observed cases of improved student performance for K-12 students.
3.3.1 PCC and SBA
The impacts most commonly observed across PCC and SBA grants in the evaluation study sample include:
Increased levels of education: Students obtained a Certificate of High School Equivalency, enrolled in higher education, or graduated from degree-conferring programs.140 Six of the eight PCC and five of the seven SBA projects in the evaluation study sample reported students achieving increased levels of education.
Improved academic performance: Students enrolled in K-12 schools improved their academic performance, with higher grades and class ranking, and attended more challenging classes.141 Three of the eight PCC and three of the seven SBA projects in the evaluation study sample identified this impact.
3.3.2 CCI
The Education and Training impacts that occurred most frequently in CCI grants were the expansion of course or program offerings and increased productivity and efficiency for teachers
24
and schools. Students also experienced improved academic performance, and some schools were able to maintain or increase enrollment. Interim Report 2 provides a complete summary of outcomes and impacts, and the activities that led to them. Impacts most commonly reported by CCI projects in the evaluation study sample include:
Expansion of course or program offerings: Grantees reported expanding course and program offerings.142 Most additional offerings were online classes, although some CAIs also offered new on-campus courses as a result of grant activities.
Improved productivity and efficiency: Saving resources enabled organizations to devote those resources to more productive channels. This impact was most often a result of improved access to cloud-based solutions that helped reduce staff time spent on maintenance and improved functionality to transfer data over a broadband connection.143
Improved academic performance: Students in K-12 schools and institutions of higher learning were able to improve grades, pass tests, and increase standardized testing scores after improved broadband connectivity helped educational institutions enhance services provided to students.144
Maintenance of, or increased, enrollment: Some CAIs were able to increase student enrollment after adopting new tools or by improving the functionality of existing tools, which enabled the provision of better services to students.145
3.4 Healthcare
This focus area includes broadband-enabled activities that improve the health of program participants or individuals with a social connection to program participants. Activities performed by healthcare institutions as a result of BTOP grants, such as improvements in the provision and administration of healthcare services, are also included in this category.
3.4.1 PCC and SBA
Healthcare was not the primary focus of any of the PCC and SBA projects included in the evaluation study sample. Of the fifteen PCC and SBA projects in the evaluation study sample, only one of each type noted major impacts in this focus area. PCC and SBA interviewees most commonly reported participants improving their health by obtaining health-related information online and using digital tools to manage health.146
3.4.2 CCI
Observations reported by interviewees indicated that healthcare providers realized the majority of benefits in the Healthcare focus area for CCI projects. Improved provider productivity and efficiency was the most frequently observed impact among the grants included in the evaluation study sample, although interviewees also reported patients obtaining improved care. These categories are not mutually exclusive. Healthcare activities will result in multiple types of impacts. For example, video consults between staff members in rural clinics and specialists in larger hospitals can increase provider efficiency and improve patient care. CCI projects in the evaluation study sample most commonly reported the following Healthcare Impacts:
Improved healthcare provider productivity and efficiency: Healthcare providers use broadband-enabled technologies to increase the efficiency of internal operations.147 These operations primarily include transferring patient data between facilities, including medical records and radiological images.148 Efficiencies also result from the use of video conferencing between facilities.149 Some healthcare facilities were able to provide the same services with fewer employees or in a shorter amount of time.150
25
Improved patient care: Healthcare providers use broadband-enabled technologies to increase the health of their patients.151 Across CCI projects, this impact was most often observed after CAI activities allowed healthcare providers to improve existing services.152 The adoption of broadband-enabled technologies also facilitates faster and more convenient access to healthcare. For example, patients are able to obtain healthcare services closer to home.153
3.5 Government Services
This focus area identifies how broadband improves services provided by government organizations to the public and includes both the provision and administration of public safety activities. NTIA requested that ASR examine this activity only for CCI projects.
3.5.1 CCI
State and local government agencies received improved broadband connectivity as a result of CCI projects. The increased bandwidth supports the operations and service delivery activities of government administrative offices, courthouses, jails, and public safety agencies. The impacts most often cited by interviewees on site visits include organizational efficiency gains and improved access to government services and information.154 The Government Services impacts most commonly reported by CCI projects in the evaluation study sample include:
Access to government services and information: Web-based information sharing facilitates the increase of online government services and content. By adopting digital information platforms, government organizations enhance the feasibility of submitting forms and applications, and of communicating with agencies, officials, and representatives. Citizens can also use online applications to fill out forms or communicate with public safety agencies.155
Improved efficiency and productivity: Organizations most commonly realized improvements to organizational efficiency as a result of improved communications, web-based information sharing, and resource savings.156 CCI projects increased bandwidth and network redundancy, allowing for the deployment of bandwidth-intensive devices, systems, and applications that streamline daily operations, improving the ability to achieve agency goals or provide services in support of organizational missions. Increased bandwidth also supports the efficient transfer of information and the use of equipment and applications that provide situational awareness critical to ensuring the continuity of services during emergencies.157
3.6 Quality of Life/Civic Engagement
This focus area includes activities that create stronger and more integrated communities and those that promote interaction between citizens and their governments. The impacts most often cited by interviewees on site visits were increased political engagement, civic participation, and volunteerism. Other impacts included improved social connections and obtaining legal rights and privileges, including citizenship.
3.6.1 PCC and SBA
PCC and SBA projects in the evaluation study sample most commonly observed the following impacts:
Increased political engagement and civic participation: Individuals who experienced this impact most often participated in grant-funded training sessions and workshops that provided instruction in how to create media content to address or to increase awareness of a political or civic issue.158 Two of the eight PCC and two of the seven SBA projects in the evaluation study sample noted increased political engagement and civic participation as a result of BTOP.
26
Improved social connections: Individuals and communities were able to improve social connections by interacting online, often in a way that was not possible without broadband. This impact was the result of access to computers through computer centers and new online spaces, including community portals.159 One of the eight PCC projects and two of the seven SBA projects in the evaluation study sample reported improved social connections because of BTOP.
Increased volunteerism: Individuals who started to volunteer or spent more time volunteering were primarily able to do so after completing required training online. Others became more aware of volunteer opportunities in their communities through the Internet.160 Two of the eight PCC projects and one of the seven SBA projects in the evaluation study sample reported increased levels of volunteerism as a result of BTOP.
Obtained legal rights and privileges: This included individuals acquiring citizenship and driver’s licenses, or obtaining pardons after gaining the digital literacy skills to access government information online.161 One of the eight PCC projects and one of the seven SBA projects in the evaluation study sample reported patrons gaining legal rights and privileges as a result of BTOP.
3.6.2 CCI
Many of the CAIs interviewed by the evaluation study team had recently obtained connectivity to new fiber networks, and thus had collected limited data related to Quality of Life/Civic Engagement impacts. Interviewees did report outcomes likely to lead to impacts in the near future. Of these potential benefits, those most often cited by interviewees include increased communications between citizens and government entities, increased political engagement, increased civic participation, and improved social connections.162
3.7 Digital Literacy
This focus area is fundamental to all the others. Digital literacy defines a set of skills and abilities that enable an individual to interact with the digital aspects of culture and to maintain a digital identity. Potential social and economic benefits of improved digital literacy accrue across all of the focus areas, as digital literacy is foundational to the use of broadband.
3.7.1 PCC and SBA
PCC and SBA projects in the evaluation study sample most commonly observed the following Digital Literacy impacts:
General benefits to individuals: While all PCC and SBA projects in the evaluation study sample offered some form of digital literacy training, few had mechanisms in place to measure the benefits realized by participants.163 The broadband literature shows that the acquisition of digital literacy skills can lead to a wide variety of social and economic impacts for individuals.
Improved social connections: Digital literacy skills enabled users to improve social connections. Learning to use a computer and a broadband connection enabled participants to communicate with friends and family via e-mail and social media sites.164 One PCC and one SBA project in the evaluation study sample noted that increased digital literacy improved social connections.
3.7.2 CCI
The most commonly observed impacts resulting from the acquisition of digital literacy skills and broadband access from CCI grants include participants engaging in economic, social, and community life, and accessing a variety of entertainment. Although broadband access and digital
27
literacy skills allow for the realization of numerous benefits, interviewees had limited data related to digital literacy impacts. Impacts most commonly reported by CCI projects in the evaluation study sample include:
Increased participation in everyday economic, social, and community life: Training participants use digital literacy skills and broadband access to interact with peers, family members, and their communities via e-mail, social media, and other interactive platforms.165
Access to entertainment: Digital literacy skills and a reliable broadband connection enable users to access a wide variety of entertainment.166
General benefits to individuals: Although some of the CAIs interviewed offered digital literacy training or resources, few had mechanisms in place to measure the benefits realized by participants. In addition to the impacts described above, interviewees reported outcomes that had not yet directly resulted in impacts, but likely will lead to impacts in the near future.167 The broadband literature shows that the acquisition of digital literacy skills can lead to a range of positive social and economic impacts for individuals.
28
Section 4. Long-Term Impacts This section describes the prospective long-term impacts of BTOP-funded infrastructure investments in the geographic areas they serve. The goal of this analysis is to develop an understanding of the social and economic impacts of the BTOP program that would not have occurred without the investments in broadband infrastructure made by the BTOP program.
4.1 Summary of CCI Outcomes
NTIA initially funded 123 CCI projects throughout the United States. These projects built new infrastructure, created new interconnection points, and signed new agreements with last mile and wholesale providers. Figure 4 displays the number of new miles deployed by all CCI projects.168 As of December 31, 2013, CCI grantees were estimated to have built more than 42,000 miles of new fiber infrastructure and upgraded more than 24,000 miles of fiber. For grantees whose PPR history ended before 2014, PPR accomplishments were carried forward into future quarters. Figures affected by these adjustments are noted with “estimated” below.
Figure 4. Cumulative New Fiber Miles Deployed by Quarter, all CCI Projects
Each of the grantees in the evaluation study sample implemented at least one strategy, and in many cases a combination of strategies, to ensure open access to the BTOP-funded network by third-party service providers. For example, the research and education network and the healthcare network in Arkansas established a partnership to deploy new and upgraded fiber and colocation facilities.169 Merit Network in Michigan offered indefeasible right-of-use agreements to private third-party service providers.170 MassTech fostered competition by helping CAIs compare services and prices offered by third-party providers that use the BTOP-funded network.171 Each of these projects developed policies that promote open access to the grant-funded network by third-party providers
29
to help expand service within unserved and underserved areas. Figure 5 shows that BTOP grantees deployed nearly 15,000 interconnection points to facilitate third-party interconnection.172
Figure 5. Interconnection Points by Quarter, all CCI Projects
Figure 6 displays the number of signed agreements with third-party providers by quarter.173 As of December 31, 2013, CCI grantees had signed more than 800 agreements with third-party service providers and broadband wholesalers. Although the figures reported below are cumulative, some grantees made modifications to the previously reported number of agreements in subsequent quarters. These modifications may result in a reduction in the count of signed agreements from one period to the next. No adjustments were made to previous reporting periods to account for changes made in future reporting periods.
30
Figure 6. Cumulative Signed Third-Party Service Provider and Broadband Wholesaler Agreements, all CCI Projects
The preceding figures taken together illustrate how BTOP grants were responsible for making more fiber-based infrastructure available in their service areas. Through open access policies and network architecture, these projects provided the means for third-party middle mile and last mile providers to use the BTOP-funded infrastructure to expand their future reach into unserved and underserved areas. BTOP infrastructure also provided means for service providers to improve the redundancy of their networks by expanding route diversity to new Internet peering points and improving traffic routing. The increased reliability facilitated by the BTOP infrastructure is a key feature in attracting businesses to the areas served by BTOP infrastructure grants.
There is considerable debate concerning the impact of open access policies on the competiveness of the broadband market.174 Open access is implemented through a wide variety of strategies. “These can range from commercial or voluntary arrangements, between communication operators and third-parties, to regulatory intervention aimed at promoting certain policy objectives, such as expanding broadband availability, increasing competition, or promoting investment that may otherwise not be economic, such as in the case of enabling the establishment and treatment of shared facilities.”175 The impact of open access will be dependent upon how well practices and policies help to reduce the time, cost, and difficulty for last mile providers to interconnect to the network.176 The impact also depends on how well policy mechanisms ensure competitive pricing for wholesale services in situations where a middle mile provider is also a last mile provider.177
As the conditions of third-party agreements are confidential, it is not possible for the evaluation study team to estimate how many residential customers could benefit from signed agreements. The number of customers served by these third parties is not publicly available. Additionally, many grantees cited agreements that were still under negotiation or in the preliminary stages.
4.2 Effect of BTOP on Broadband Availability
This subsection presents the results of a county-level matched pairs analysis comparing changes in the availability of broadband at the county-level between counties that are served by the selected BTOP CCI grants (treatment counties) and similar counties not served by CCI grants (control
31
counties). Matched pairs estimators provide a methodology for comparing the effects of broadband availability in comparable geographic regions. This methodology has been used in previous broadband research, including Gillett et al. (2006) and Stenberg et al. (2009).178 Gillett et al. (2006) found that an increase in broadband availability in an area increases employment, the number of business establishments, and property values in that area.179 Stenberg et al. (2009) found that areas with high broadband availability experienced higher population, employment, and wage growth over time than similar areas with low broadband availability.180
Broadband availability is measured using data from the NBM from June 2011 and June 2013. For each county included in the service area of the twelve CCI grants in the evaluation study sample, ASR selected a comparison county that is similar in initial availability, rurality, and population. In summary, the increase in the availability of residential broadband service with at least 3 Mbps download speed and 768 kbps upload speed between June 2011 and June 2013 was 2.0 percentage points higher in the 408 counties served by the twelve grants in the evaluation study sample than in comparable counties.
The analysis presented here is based on measured levels of broadband availability in the counties served by the twelve CCI projects visited during site visits. NTIA selected these projects for inclusion in the evaluation study at the beginning of the study. ASR examined redacted grant applications, APRs, PPRs, grant fact sheets, and grantee-specific materials to develop a preliminary service area description for each of the twelve projects in the evaluation study sample in order to identify the proposed geographic location served by each of these projects. ASR also included counties containing at least one BTOP-funded CAI. ASR provided each service area description to grantees, who made changes to the list based on the actual results of the project. The confirmed list of counties is included in each of the twelve CCI case study reports. Appendix D lists the counties comprising each service area, the total number of counties included in the treatment area for each grant, and the total for the sample as a whole. ASR identified 408 “treatment” counties that received BTOP-funded middle mile infrastructure.
In order to measure how much of the growth in availability in treatment counties occurred as a result of BTOP, ASR compared availability growth in these counties to availability growth in counties that did not receive BTOP funding. For each treatment county, ASR selected a control county for comparison. These control counties are similar in relevant aspects to the treatment counties in order to provide a baseline against which to judge the impact of the BTOP projects on broadband availability. Table 11 and the paragraphs below summarize each step of the matched pair analysis. Appendix D describes the steps taken to arrive at the population of potential control counties in further detail.
The list of prospective counties began with a complete list of counties and county equivalents in the United States, excluding Alaska, Hawaii, and outlying areas. ASR then researched the proposed service area counties of every submitted BTOP CCI grant application using the Broadband Application Database.181 ASR primarily drew from the Executive Summaries and Public Notice Responses components of the database. In cases where the service area was unclear, the team searched for other sources of publicly available data. The result was a list of 469 counties in the contiguous United States that had not been included in a BTOP application. In order to account for potential differences between applicants and non-applicants, counties that had not been mentioned in an application were removed from the population of potential control counties, leaving 2,640 counties.
The second step in the control county selection process was to remove those counties that had applied for and received a BTOP or Broadband Initiatives Program (BIP) grant. These counties would not be suitable controls because of Recovery Act-sponsored activity that would be expected
BTOP-funded infrastructure contributed to a 2.0 percent increase in the availability of residential broadband in the 408 counties served by the 12 grants in the case study sample between June 2011 and June 2013, over and above changes observed in comparable counties.
32
to take place. Counties were identified as having benefited from a BTOP or BIP grant if they were mentioned in an application that received an award, or if a BTOP-funded CAI or point of presence (POP) in NTIA’s Connecting America's Communities (CAC) website was located within their borders.182 The result of applying this filter was the identification of 884 counties that could be considered potential control counties.
Table 11. Potential Control Counties in the United States
All counties and equivalents in the United States 3,234
Less counties in Alaska, Hawaii, and outlying areas 3,109
Less counties not in proposed BTOP service area 2,640
Less counties in awarded BTOP or BIP grant service area183 884 Potential Controls
ASR matched each county in the treatment group to a control county that is similar in its broadband-relevant characteristics. Following the analysis conducted by Gillett et al. (2006), the evaluation study team used nearest neighbor matching to develop the matched pairs control group for the sample of counties.184 This method matches a similar potential control county to each county that received BTOP funding. ASR performed the matches using NBM data prepared by the Federal Communications Commission (FCC) NBM team at the request of NTIA. The data allowed ASR to develop county-level estimates of the following broadband-relevant attributes based upon data available at the census block level:
Broadband availability rate: The percentage of the county-level population living in areas where broadband service is available.
Population: The total population of the county.
Rurality: The percentage of the county-level population living in rural census blocks.
The effect of BTOP on broadband availability is the difference between the increase in broadband availability across all treatment counties and the increase in broadband availability across all matched control counties. This is given by:
Programmatic Effect on Availability = (availability rate in evaluation study sample, June 30, 2013 –
availability rate in evaluation study sample, June 30, 2011) – (availability rate in all matched counties, June 30, 2013 –
availability rate in all matched counties, June 30, 2011)
Table 12 presents the estimated effect of BTOP on broadband availability. The broadband availability rate across all treatment counties increased from 91.53 percent to 94.40 percent, while the availability rate across the selected control counties increased from 92.28 percent to 93.16 percent. The estimated effect, or difference-in-differences, is 2.00 percent. In other words, 2.00 percent of individuals in the service area gained broadband availability due to the activities of the CCI case study participants. This represents nearly 650,000 people in the combined case study service area. Applying this estimate to all CCI grants, more than 4.3 million people gained broadband availability from June 2011 to June 2013 due to the activities of CCI grantees.
33
Table 12. Estimated BTOP Effect on Broadband Availability
Baseline Availability Treatment
Group ControlGroup
June 30, 2011 91.53% 92.28%
June 30, 2013 94.40% 93.16%
Difference 2.87% 0.88%
Difference-in-differences 2.00%
Other factors could also affect broadband availability in the future. In particular, BTOP middle mile projects and third-party last mile providers have signed more than 800 agreements as of December 31, 2013.185 These agreements could lead to further increases in broadband availability to organizations, communities, households, and individuals. However, the overall benefit of these potential future agreements is not clear, mostly due to non-disclosure agreements signed by BTOP-funded infrastructure managers and third parties that intend to use the infrastructure to distribute broadband services.
ASR used a variety of formulations to assess the robustness of the results to definitions and assumptions. The results presented above are the base case. Appendix D presents a summary of sensitivity analyses addressing definitional assumptions, methodological approaches, and mathematical details of the analysis. ASR estimates the effect of BTOP on broadband availability to range from a 1.04 percent to a 2.00 percent increase based on the definition of broadband as service of 3 Mbps downstream and 768 kbps upstream.186 With broadband defined as service of 768 kbps downstream and 200 kbps upstream, ASR estimates the effect of BTOP on broadband availability to range from a 0.08 percent to a 0.55 percent increase.187 In addition to the variability in these point estimates, each estimate has a confidence interval reflecting statistical variability in the estimators. Appendix D presents information on all point estimates and confidence intervals. The extrapolations presented in this section are based on the estimated effect of BTOP on broadband availability shown above. These extrapolations show a broad range of potential impacts when other estimates for the effect of BTOP on availability are used.188 Measuring the observable impacts of BTOP is a potential avenue for future research as more data become available, and this could narrow the range of potential benefits extrapolated in this study.
4.3 Long-Term Impacts of BTOP CCI Infrastructure
ASR reviewed broadband literature and identified articles presenting quantified benefits that might result from the increased broadband availability facilitated by BTOP-funded middle mile infrastructure. Appendix D discusses these computations in detail. The most significant impacts estimated for the program include the following:
Increased economic output: The largest long-term social or economic impact due to BTOP infrastructure spending is the yearly increase in GDP in the areas served by the new broadband infrastructure. ASR used two studies, Czernich et al. (2011) and LECG Ltd. (2009), to extrapolate the increase in economic output that could be expected in counties receiving BTOP-funded infrastructure.189 For the base case of a 2.0 percent increase in broadband availability, BTOP infrastructure spending could be expected to yield $5.7 to $21.0 billion in increased output annually using results from Czernich et al. (2011) and LECG Ltd. (2009) as the bases for extrapolation, respectively.
Long-term increased levels of employment: Kolko (2010) and Gillett et al. (2006) provide a basis for estimating the long-term increase in employment due to BTOP-funded infrastructure spending.190 Based on Kolko’s estimates, the additional broadband infrastructure provided by BTOP could be expected to create more than 22,000 long-term jobs and generate $1.1 billion in
34
additional household income each year. Results from Gillett et al. (2006) suggest at least 6,900 long-term jobs could be created in the year following the construction of BTOP infrastructure, and potentially each year for at least the next four years due to increasing employment growth in areas with new broadband availability. These employment increases would result in a $328 million increase in household income for each year employment increases by the estimated amount in newly served areas.191
Value to new subscribers: The Allen Consulting Group (2010) finds the value of broadband Internet access to the average American household is about 3.4 percent of average household income.192 Using the base case to determine the number of households adopting broadband, this translates into an estimated value of broadband to new subscribers of $2.6 billion per year.
4.4 Reduction in Broadband Costs
Where available, the evaluation study team collected broadband subscription speed and price data from CAIs connected by projects in the evaluation study sample. Representatives of sixty CAIs provided ASR with broadband subscription speed data for eight-six individual sites. Forty-seven of these sites also provided pre- and post-BTOP broadband subscription price data. On average, CAIs connected by projects in the evaluation study sample saw a substantial decrease in their monthly Internet subscription costs per Mbps. Most of these CAIs took advantage of decreased costs by increasing their monthly subscription speeds.
Table 13 provides a summary of broadband subscriptions for the eighty-six CAIs before and after their respective BTOP connections, organized by institution type. As shown in the table, the median price per Mbps per month varied by institution type, with the lowest prices per Mbps per month paid by universities, colleges, or other postsecondary institutions. Before BTOP, the median price these CAIs paid per Mbps of download speed was $56 per month. After BTOP, the median price per month per Mbps for these CAIs was $2, a 96 percent decrease. Other categories of institutions for which pricing data were available reported similar decreases in price.
ASR used the findings above to extrapolate the effect of BTOP on broadband costs at all CAIs connected by BTOP infrastructure grants. ASR assumes that the median speed and price data collected during the evaluation study are consistent with speeds and prices across all CAIs connected by BTOP within the same category of institution.193 The median collected speeds for Other Community Support and Public Safety institutions led to extrapolated cost differences that were much higher than expected given ASR’s observation of institutions in these categories. Therefore, ASR used a post-BTOP speed of 100 Mbps for these categories.194 No Public Safety institutions connected by evaluation study grantees shared price data with ASR. Therefore, ASR used the overall median price per Mbps for these institutions. ASR estimated the total number of CAIs in each category of institution using grantee-reported PPR data.195
ASR then developed estimates of the cost of equivalent service in the absence of the BTOP infrastructure investment. Subtracting the reported post-BTOP costs results in an estimate of broadband costs that would have had to be incurred to reach the level of service provided by the BTOP infrastructure. ASR estimated the per-CAI cost difference by multiplying the change in speeds by the change in price per Mbps. For all categories of CAI except Public Safety and Other Community Support, the per-CAI cost difference is given by the formula below:
per-CAI cost difference = (category median post-BTOP speed – category median pre-BTOP speed) × (category median pre-BTOP price per Mbps per month – category median post-BTOP price per Mbps per month) × 12
For Other Community Support CAIs, the per-CAI cost difference is given by the formula below:
per-CAI cost difference = (100 Mbps – category median pre-BTOP speed) × (category median pre-BTOP price per Mbps per month – category median post-BTOP price per Mbps per month) × 12
For Public Safety CAIs, the per-CAI cost difference is given by the formula below:
per-CAI cost difference = (100 Mbps – category median pre-BTOP speed) × (overall median pre-BTOP price per Mbps per month – overall median post-BTOP price per Mbps per month) × 12
ASR then extrapolated the total cost difference due to CCI grants by multiplying the per-CAI cost difference by the estimated number of CAIs, as given by:
total cost difference = per-CAI cost difference × number of CAIs in category
As shown in Table 14, K-12 Schools connected by BTOP grantees subscribing to median post-BTOP levels of service could be expected to receive services that, absent BTOP, would have cost an extra $2 billion annually. Overall, connected CAIs are expected to receive services that would have cost an additional $5.0 billion annually, more than $236,000 per CAI.
Schools (K-12) connected by BTOP grantees could be expected to experience a cost difference of $2 billion annually, or approximately $268,000 per CAI.
36
Table 14. Annual Extrapolated CAI Cost Differences, all CCI Projects
Institution Type Percent ofAll CAIs
Numberof CAIs
Total CostDifference(Millions)
Per CAI Cost Difference
School (K-12) 36% 7,726 $2,072 $268,136
University, College, or Other Postsecondary
7% 1,498 $928 $619,477
Medical/Healthcare 12% 2,640 $1,104 $418,112
Library 7% 1,515 $67 $44,540
Other Community Support 23% 4,951 $471 $95,087
Public Safety 14% 2,910 $374 $128,574
All institutions 21,240 $5,016 $236,151
It is important to note that the prospective cost savings calculation displayed in Table 14 assumes that the median level of service post-BTOP could have been obtained using the technologies available pre-BTOP and that discounted pricing for high bandwidth users is not included. In addition, if existing technology was capable of supporting faster service, CAIs did not choose to subscribe to it, indicating that the CAIs found that larger amounts of broadband capacity were not worth the additional marginal expenditure at prevailing prices. This means the value to the CAIs would be less than the $5 billion figure shown above.
37
Section 5. Sustainability 5.1 Introduction
In late April 2014, ASR contacted all twenty-seven grantees in the evaluation study sample. The evaluation study team created semi-structured interview questions for each grantee based on the earlier case study reports, the most recently available APRs and PPRs, and information available on public websites. The evaluation study team focused on understanding the scope of impacts achieved during the grant award period and if the projects would be able to continue operating without BTOP funds. This section describes the sustainability of all projects in the evaluation study sample.
5.2 Summary
Among the grants included in the evaluation study sample, the majority of the computer centers remain operational after the award period. While some grantees maintain computer centers at the capacity offered during the award period, others, facing more severe funding limitations, elected to scale back the delivery of training, reduce hours of operation, or transfer computer center management to other community organizations. All grantees in the evaluation study sample continue to offer patrons, to some degree, access to the training programs and resources provided during the award period.
Many of the SBA grant programs established, expanded, or supported by BTOP funding were sustained by grantees or project partners after the BTOP award period. Some grantees, including C.K. Blandin and the City of Chicago, obtained funding from government or nonprofit organizations to support continued or expanded program delivery. Grantees with post-award budgets too small to support the continuation of BTOP project services often opted to transfer program management or resource ownership to partners or community organizations to continue service delivery in some capacity. In some cases, organizations scaled back program delivery to compensate for reductions in funding. Grantees leverage resources created or enhanced through their BTOP projects in continued efforts to serve target populations.
Among the CCI projects in the evaluation study sample, nearly all grantees continue to connect additional CAIs to their networks. Grantees actively promote network availability and negotiate with third-party providers to establish interconnection agreements. These efforts have expanded, and will continue to expand, the delivery of affordable and reliable broadband service to residents, businesses, and CAIs in underserved regions.
5.3 PCC
Cambridge Housing Authority (CHA): All four computer centers established or upgraded through the BTOP grant remained operational post award period. Funding limitations forced CHA to discontinue open lab access and Strictly Computers courses in order to maintain the computer centers for use in the Gateways Adult Education, Work Force, and Parents ROCK programs. The Gateways program recently received a grant to expand English for speakers of other languages (ESOL) instruction to reach a wider range of immigrant clients. This effort will use the Gateways digital curriculum developed under the BTOP grant and two BTOP-funded computer centers. Although CHA anticipates encountering continued budgetary challenges in the next fiscal year, it is optimistic about its ability to maintain computer center services.196
38
Delaware Division of Libraries (DDL): Financial support provided by the Delaware Department of State enabled DDL to maintain the four BTOP-funded Job Centers with contract staff post award period. This funding also sustains the majority of services offered during the grant period, including facilitated lab access, Certificate of High School Equivalency programs, ESOL training, and access to LearningExpress software. Since the end of the award period, DDL expanded the Job Centers, rebranded as Inspiration Spaces, using grant-funded video conferencing capabilities to offer a wider range of programming to libraries statewide. In addition to facilitated open lab access, Inspiration Space programming will include employment-related activities, digital literacy courses, entrepreneurship training, Makerspace programs, and training and workshops related to healthcare and financial management.197
Florida Agricultural and Mechanical University (FAMU): NTIA granted FAMU a program extension through September 30, 2014. In preparation for the end of the award period, the FAMU project team met with the new FAMU president to discuss the continuation of funding. Additionally, FAMU plans to explore other grant opportunities to sustain the operation of current computer center activities.198
Las Vegas-Clark County Urban League (LVUL): Since the end of the award period, LVUL scaled back the delivery of training at computer centers and placed greater emphasis on employment-related activities. LVUL established partnerships with other organizations, including Workforce Connections, to support continued operations at some computer centers, and transferred the operation of remaining computer centers to the City of Las Vegas.199
Michigan State University (MSU): The majority of the computer centers that received BTOP funds are located in libraries and remained operational post award period. Libraries used internal funding and in-house staff to continue training activities. LearningExpress Library, an online educational and career training program funded through the grant, requires no maintenance costs. LearningExpress is available 24/7 and is accessible from any computer with an Internet connection.200
South Carolina Technical College System (SCTCS): As of May 2014, all seventy-one computer centers across sixteen college campuses established or upgraded through the BTOP grant remained operational. During the award period, some locations, such as Midlands Technical College, used BTOP funding to purchase equipment but trained staff with their own funds. For these locations, the funding required to maintain computer centers at full capacity is equivalent to that required during the grant period. As a result, training delivery remained comparable to the level offered during the award period. Computer centers that used BTOP funding to pay trainers during the award period have decreased the delivery of training since the conclusion of the award period. SCTCS continued to hold job fairs and operate Kids College, which offers science, technology, engineering, and mathematics courses to students ages seven to sixteen.201
Technology For All (TFA): The BTOP grant established twenty-six and improved an additional sixty-eight computer centers, all of which remained operational after the award period. Austin Free-Net (AFN) continued to provide A+ certification training for computer technicians, although Houston Community College now funds the program. TFA also implemented a Houston-based program to train parents of high school students to use an online portal for communication with teachers and school administrators.202
WorkForce West Virginia (WFWV): All activities previously funded by BTOP and provided by WFWV continued post-award. WFWV funds the broadband connectivity at the WorkForce centers. Training activities, such as Basic Computer Skills, Online Job Search, Résumé Writing, WorkKeys, and Strategic Planning in Occupational Knowledge for Employment and Success continued as part of the day-to-day responsibilities of center personnel. WFWV installed all remaining workstations at National Guard, Veterans Assistance, and Operation Welcome Home locations. WFWV seeks to transfer ownership of the BTOP workstations to the library system, and it is working with the Library Commission to accomplish this.203
39
5.4 SBA
C.K. Blandin Foundation (C.K. Blandin): Since the end of the award period, C.K. Blandin pledged $3 million to fund projects throughout rural Minnesota similar to Demonstration Community projects. Some statewide partners also continued or expanded activities offered through the grant. For example, PCs for People expanded from distributing about 1,000 computers per year before MIRC to more than 7,000 in 2013, in large part as a result of capacity building during the BTOP award period. The MIRC project increased statewide awareness of broadband’s role in economic development and, as a result, the grantee anticipates that the State of Minnesota will provide funding for additional broadband initiatives in the future.204
California Emerging Technology Fund (CETF): CETF is scheduled to terminate its charter in 2017. The last round of grant funding, called CETF 3.0, will focus on sustainable broadband adoption among the populations least likely to use broadband. These efforts build on the BAA BTOP project efforts and involve all but three of the project participants. The three that are not included are Dewey Square, which increased its involvement in healthcare issues; AccessNow, which discontinued Computer Help Days; and the Center for Accessible Technology (CforAT), whose programs established with BTOP funding have rapidly expanded. CETF secured $10 million in funding after the award period, including $5 million in internal funding. CETF is also participating in a $5 million state-funded program component to promote broadband adoption in affordable housing, delivered in conjunction with a $20 million program component to provide broadband access in public housing.205
City of Chicago (Chicago): After the award period, Chicago maintained or expanded nearly all of its training and support services by obtaining additional funding from the city government and grants from nonprofit organizations, and by involving volunteer trainers from AmeriCorps. Chicago and its partners are in the process of extending the programming deployed through the BTOP grant to five new neighborhoods over a three-year period. The project solicits funding from local and national foundation donors.206
Connect Arkansas: To support the continuation of grant-funded programs, Connect Arkansas obtained funding for the 2013–2014 fiscal year through the State’s General Improvement Fund. This funding complements remaining BTOP funds available through the extended award end date of September 30, 2014. Connect Arkansas adjusted the delivery of programs and services to compensate for changes in funding availability. With the exception of the Broadband Incentive Program and Senior Citizen Digital Literacy Training, the programs and services delivered during the award period remained operation, although partners independently manage the Y.E.S. 2.0 business plan competition, Small Business Training, and the University of Arkansas for Medical Sciences (UAMS) telehealth awareness and training program. To sustain the Entrepreneurship Curriculum in the absence of grant funding, rather than continue to deliver instruction onsite to classrooms across the state, Connect Arkansas will make the program available for teachers to download and deliver independently to students. Connect Arkansas expects to receive state funding to support program delivery in the 2014–2015 fiscal year.207
Foundation for California Community Colleges (FCCC): FCCC helped program partner Great Valley Center (GVC) obtain a grant to continue training activities offered through the BTOP project. GVC scaled back its training offerings to include only those that were available before the grant. During the award period, GVC rewrote these training programs, resulting in a more robust curriculum than offered before the BTOP grant. The MESA program operated before the grant and has reverted to pre-grant operations, eliminating the distribution of laptops.208
Future Generations Graduate School (Future Generations): After the award period, Future Generations provided the volunteer fire departments hosting computer centers with full ownership of grant-funded equipment. As of May 2014, more than two-thirds of the sixty computer centers established through the grant reported continuing to use the equipment in some capacity. Future Generations donated some of the project’s excess supply of refurbished
40
computers to veteran support organizations, helping to establish two new computer centers for veterans, which remained operational post award period. In partnership with Frontier and the West Virginia Parks Association, Future Generations used content created during the award period to deliver a statewide broadband adoption and awareness campaign.209
Urban Affairs Coalition (UAC): Since the end of the award period, UAC maintained the broadband marketing and awareness campaigns and the digital literacy program, but scaled back the delivery of training. In some cases, training requires a fee, with price dependent on a patron’s income level. UAC maintained its partnership with Mobile Citizen to offer a low-cost Internet service option, but increased rates to compensate for the exhaustion of BTOP funding, which had subsidized the cost of Internet modems.210
5.5 CCI
Clearwave Communications (Clearwave): Clearwave continued to implement its business plan, completing connections to approximately 110 new CAIs after the BTOP grant closeout, in addition to the 230 CAIs connected during the grant period. Establishing these connections improves the economic feasibility of connecting additional business customers to the network by increasing businesses’ proximity to a served location. Clearwave completed six interconnection agreements during the grant period, and signed four more since grant closeout. Clearwave has not publicly announced with whom the specific agreements were signed. Clearwave also built an additional nine miles of fiber, for a total of 749 miles of fiber built, exceeding the 740 planned fiber miles.211
Executive Office of West Virginia (West Virginia): As of May 2014, West Virginia had not signed any long-term agreements with last mile providers. One provider entered a testing agreement with West Virginia to use the state’s microwave tower network.212 The provider will determine, based on performance during a trial period, if it would like to enter into a long-term agreement. West Virginia connected an additional 94 CAIs since the site visit, bringing the total number of connected CAIs to 1,191. Upon completing these connections, West Virginia’s budget will not support the connection of additional CAIs to the network.213 Many of the public safety institutions connected during the award period plan to use their grant-provided connections and equipment to participate in FCC’s Next Generation 9-1-1 Initiative.
Lane Council of Governments (LCOG): LCOG continued to provide organizational management for the use of the BTOP-funded fiber, and its three partner providers continue to offer service to CAIs post award period. LCOG signed two additional interconnection agreements and two peering agreements, and is working to attract more providers to increase broadband availability in the service area, bring in revenue to support its Internet exchange, and provide peering options for the providers that interconnect with the network.214
Massachusetts Technology Park (MassTech): MassTech completed its project in early 2014. Axia continued to sign agreements with providers to offer service to CAIs, businesses, and residential customers post award period. As of May 2014, thirty-three providers signed letters of intent to use the network. Axia completed nineteen interconnection agreements with providers and will continue working to connect new CAIs. In addition, MBI plans to provide additional technical assistance to towns and the Commonwealth of Massachusetts is expected to fund at least $50 million for last mile networks in the service area.215
MCNC: Since the site visit, MCNC signed an agreement with one additional provider, resulting in eight agreements with third-party providers and totaling nearly $11 million in sales. As of May 2014, MCNC stated that deployment by these third-party providers was just starting to occur. MCNC observed a 60 to 65 percent annual growth in demand for bandwidth by its users. Nearly 60 percent of the school districts connected during the award period have upgraded their connection at least once. Three hospital consortia have connected to North Carolina Research and Education Network (NCREN) since the site visit, and MCNC expects to connect additional hospitals in the future. MCNC stated that its network infrastructure is sufficient to support the growing bandwidth needs of its current users and to accommodate future users.216
41
Merit Network, Inc. (Merit): Merit used grant funds to expand its backbone to provide infrastructure and services to third-party middle mile and last mile providers. In addition to the three signed agreements with subrecipients, Merit signed three interconnection agreements with other service providers after the award period. Sixty-six additional CAIs paid for connections to the network. In response to the increased infrastructure availability in Michigan, broadband costs to customers have declined, and Merit plans to lower its subscription prices to CAIs substantially in early 2015.217
Mid-Atlantic Broadband Communities Corporation (MBC): MBC stated that it has sixty active interconnection agreements with third-party providers.218 The average agreement term for these providers is three years. MBC attracts new users to the network through its Silicon Valley office, which opened in 2013. The office is responsible for marketing the MBC network, including infrastructure put in place with BTOP funds, to technology companies through the GoSoVa initiative. GoSoVa is an economic development initiative led by MBC that focuses on bringing new business to southern Virginia by raising awareness of MBC’s open access network.219
OneCommunity: As a network operator, OneCommunity planned for sustainability by designing a fiber route that would ensure that construction costs were low enough so that providers could afford to connect to the network. OneCommunity’s network design facilitates providers’ ability to connect and expand the delivery of service to underserved areas, enabling OneCommunity to earn the revenue necessary to maintain the network. OneCommunity signed fifteen agreements with third-party providers and reported that less than 50 percent of network capacity is in use. Expanding network capacity will require OneCommunity to purchase new equipment. OneCommunity continued to connect CAIs to its network and to promote the network’s availability to providers post award period.220
OSHEAN: During the award period, OSHEAN connected many of the service area’s large CAIs and opted to shift focus to connect smaller nonprofits to its network post award period. Since the end of the award period, OSHEAN connected an additional twenty-six CAIs to the network, including thirteen higher education institutions, six government agencies, five K-12 schools, one healthcare facility, and one nonprofit organization.221 The Beacon 2.0 network is sustainable, as advances in fiber-optic technology have increased the efficiency of fiber strands, allowing OSHEAN, which presently operates 10 Gbps per strand of lit fiber, to light remaining dark fiber strands at 100 Gbps. As of May 2014, OSHEAN had not signed any interconnection agreements with third-party providers but will continue to offer providers the opportunity to establish agreements. By connecting additional CAIs to the Beacon 2.0 network, OSHEAN is able to lower bandwidth prices for all members. OSHEAN noted that, in response to the Beacon 2.0 network, providers serving CAIs in Rhode Island have made substantial reductions in pricing to remain competitive.222
South Dakota Network, LLC (SDN): SDN and its member companies continue to use the BTOP-funded fiber to meet growing bandwidth demand from CAIs post award period. Member companies also serve businesses, and some planned to build fiber to the premises (FTTP) residential networks using the middle mile fiber. Nine interconnection points are strategically located around South Dakota to meet any demand that may arise from other providers, although SDN reported that the low population density of its service area remains a significant deterrent for new providers.223
University of Arkansas (UAS): The BTOP grant allowed UAS to expand its network enough to accommodate future demand. UAS stated that it expects member costs to decrease because of economies of scale, as some connected CAIs want to connect additional satellite sites. Because UAS’s business plan does not include offering wholesale services to last mile providers, it had not signed any last mile agreements as of May 2014.224
Zayo Bandwidth, LLC (Zayo): As of May 2014, Zayo had signed 78 interconnection agreements, comprising 149 orders with 56 different customers, and had 25 orders in negotiation. The network’s proximity to providers made interconnection cost-effective and enabled these providers to expand market presence or access new markets.225 As a result, Zayo noted that average prices for higher tiers of Internet service had leveled in the rural
42
commercial markets. Providers purchasing dark fiber leases signed agreements with Zayo early in the award period. Since then, the majority of Zayo’s agreements involved ISPs interested in lit service. Zayo employs in-house capacity planners to develop fiber management strategies and determine the cost effectiveness of upgrading equipment to increase bandwidth availability.226 Zayo has not connected any additional CAIs since the site visit, although I-Light and Zayo are finalizing an agreement to connect three universities.227
43
Section 6. Progress towards Recovery Act Goals The Recovery Act instructed NTIA to implement BTOP to promote five core purposes:228
1. Provide access to broadband service to consumers residing in unserved areas of the country.
2. Provide improved access to broadband service to consumers residing in underserved areas of the country.
3. Provide broadband education, awareness, training, access, equipment, and support to
a. schools, libraries, medical and healthcare providers, community colleges and other institutions of higher learning, and other community support organizations;
b. organizations and agencies that provide outreach, access, equipment, and support services to facilitate greater use of broadband services by vulnerable populations (e.g., low-income, unemployed, seniors);
c. job-creating strategic facilities located in state- or federally designated economic development zones.
4. Improve access to, and use of, broadband service by public safety agencies.
5. Stimulate the demand for broadband, economic growth, and job creation.
This section summarizes findings from the evaluation study team’s forty-two site visits and grantee-reported data describing how BTOP grantees encouraged the fulfillment of these Recovery Act goals.229 The evaluation study team found evidence that grantees supported each of these goals, although not all grantees supported all five goals. In general, PCC and SBA projects in the evaluation study sample discussed supporting unserved and underserved populations and providing education, awareness, access, equipment, training, and support to CAIs. PCC and SBA grantees focused less on demand for broadband, economic growth, and job creation and provided little evidence of supporting public safety agencies. CCI projects in the evaluation study sample described supporting all five goals, with the fewest activities described as providing broadband education, awareness, training, access, equipment, and support to CAIs.
In order to better understand the impact of the BTOP program, the evaluation study team reviewed the BTOP application database and identified grant applications that did not receive funding but were similar in scope and geography to each of the PCC and SBA grants included in the sample.230 Matches were based on similarities in applicant organization type (e.g., housing authorities), geographic characteristics (e.g., urban/rural distinction), project focus (e.g., assisting unemployed populations), and the amount of the funding requested. The evaluation study team conducted Internet research on grant applicants and partners to determine the extent to which these organizations were able to implement the activities proposed in the BTOP applications.
Among the fifteen matched projects, about one-third achieved outcomes similar to those outlined in their rejected applications. In these cases, the applicant organizations were able to obtain funding either through another grant or by establishing partnerships with corporations or community-based entities. Nearly an equivalent number of rejected projects did not come to fruition. However, these applicants continue to work toward organizational goals, which often include objectives related to improving access to broadband technologies. Among the remaining third of matched projects, there is no evidence available to suggest that applicants support efforts similar to those described in BTOP applications.
44
6.1 Improve Access to Unserved and Underserved Areas of the Country
The first two goals of the Recovery Act encourage improved access for unserved and underserved areas:231
Provide access to broadband service to consumers residing in unserved areas of the country.
Provide improved access to broadband service to consumers residing in underserved areas of the country.
Section 4 and Appendix D describe the estimated effect of BTOP on broadband availability in more detail, including the development of difference-in-differences estimators of changes to broadband availability, which form the basis for Figure 7, below. Figure 7 displays the estimated effect of BTOP on broadband availability with respect to populations of interest within the evaluation study sample for the June 30, 2011 and June 30, 2013 NBM releases.232 The populations are ordered with the evaluation study sample population first, followed by the populations of interest in descending order of the estimated effect of BTOP. BTOP CCI projects led to increases in broadband availability, especially in rural areas, and in areas where seniors and those living below the poverty line resided.
Figure 7. Estimated Effect of BTOP on Broadband Availability in the CCI Evaluation Study Sample Service Area for Different Populations of Interest
6.2 Broadband Education, Awareness, Training, Access, Equipment, and Support
Most closely aligned with PCC and SBA grants, the next Recovery Act goal is for grantees to provide broadband education, awareness, training, access, equipment, and support to:
1. schools, libraries, medical and healthcare providers, community colleges and other institutions of higher learning, and other community support organizations;
2. organizations and agencies that provide outreach, access, equipment, and support services to facilitate greater use of broadband services by vulnerable populations (e.g., low-income, unemployed, seniors);
3. job-creating strategic facilities located in state- or federally designated economic development zones.
PCC projects created and upgraded more than 3,000 computer centers as of December 31, 2013. Table 15 summarizes the new and upgraded computer centers by type.233 PCC projects in the
45
evaluation study sample created or upgraded 540 of 3,305 computer centers, representing more than 16 percent of all computer centers. Libraries house the largest number of PCCs (64 percent), followed by other governmental community support facilities (12 percent).
Table 15. New and Upgraded PCCs
Institution Type Evaluation
Study Sample All
Schools (K-12) 1 118
Libraries 289 2,120
Community Colleges 50 120
Universities and Colleges 1 8
Medical or Healthcare Facilities 1 62
Public Safety Entities 0 4
Job Training and/or Economic Development Institutions 32 163
Other Community Support (Governmental) 74 410
Other Community Support (Non-Governmental) 92 300
Total 540 3,305
In addition to creating and upgrading computer centers, PCC projects upgraded broadband connectivity and established wireless connectivity in computer centers. Figure 8 displays the hardware installations and upgrades completed by PCC projects as of December 31, 2013.234 PCC projects installed more than 46,000 workstations, upgraded more than 2,400 broadband connections, and installed 1,700 wireless broadband connections. Although the figures reported below are cumulative, some grantees made modifications to previously reported installations and upgrades in subsequent quarters. These modifications may result in the downward trends between quarters seen below. No adjustments were made to previous reporting periods to account for changes made in future reporting periods.
46
Figure 8. Cumulative PCC Hardware Installations and Upgrades
The CAC provides data on each location where programs have been offered under SBA programs. Table 16 presents all SBA institutions by type as defined by NTIA in the CAC.235 SBA programs were offered at nonprofit institutions more than any other location type. SBA grants in the evaluation study sample held activities at 725 different locations, representing nearly 22 percent of all locations used by BTOP SBA grantees.
47
Table 16. SBA Institutions
Institution Type Evaluation
Study SampleAll
Community-Based Organization 81 190
Community College 59 104
For-Profit Organization 14 25
Government Facility 83 134
Institution of Higher Education 17 92
Library 40 349
Medical or Healthcare Provider 6 370
Nonprofit Organization 256 854
Public Housing 9 134
Public Safety 50 56
School (K-12) 108 615
Tribal 1 339
Other 1 87
All institutions 725 3,349
PCC and SBA projects performed a variety of training activities. Grantees reported training hours annually to NTIA. ASR categorized these training hours into the focus areas described in Section 3. Table 17 summarizes the training categories available to grantees and the focus area used in this analysis.
Table 17. Training Hour Categorization
Annual Training Data Focus Area
Basic Internet and Computer Use Digital Literacy
Certification Programs Education and Training
College Preparatory Training Education and Training
ESL Education and Training
GED Education and Training
Multimedia Digital Literacy
Office Skills Workforce and Economic Development
ASR reviewed all annual training data reported by grantees in the “Other” category to determine if any of the trainings could be re-categorized into one of the focus areas, including the Healthcare or Quality of Life/Civic Engagement focus areas. ASR then reviewed the training activities reported in the last available PPR for each grantee and determined if any of these activities could be classified as Healthcare or Quality of Life/Civic Engagement. Hours identified as Healthcare and Quality of Life/Civic Engagement were then added to the respective focus area total and removed from the “Other” total. After this process, some “Other” training hours remained and could not be categorized into a focus area. These hours remain classified as “Other.” Trainings reported as
48
“Open Lab Access” cannot be categorized to an individual focus area and are included in the table below for reference.
Table 18 presents the total training hours provided by all PCC and SBA projects through the end of 2013.236 A training hour is defined as one hour of instruction provided to one participant, so that the number of training hours per activity is the number of participants times the length of the activity in hours. PCC and SBA projects provided more than 20 million hours of training. For both PCC and SBA grants, Digital Literacy encompassed the largest portion of training hours provided, 45 percent and 63 percent, respectively. SBA projects had a larger focus on Healthcare-related training, administering more than 2 million hours by the end of 2013. PCC projects focused on Education and Training-related activities, administering nearly 2.8 million hours by the end of 2013.
Table 18. PCC and SBA Training Hours
Focus Area PCC SBA Total
Workforce and Economic Development 2,067,847 362,593 2,430,440
Education and Training 2,798,246 701,815 3,500,061
Healthcare 713 2,226,264 2,226,977
Quality of Life/Civic Engagement 4,175 9,013 13,188
Digital Literacy 5,231,319 5,901,255 11,132,574
Other 1,431,601 98,818 1,530,419
Total 11,533,901 9,299,758 20,833,659
Open Lab Access 974,721 3,607 978,328
6.3 Public Safety Agencies
The fourth goal of the Recovery Act is to improve access to, and use of, broadband service by public safety agencies. With the exception of the Future Generations SBA grant, the SBA and PCC grants in the evaluation study sample did not implement programs or engage in activities in support of public safety initiatives. Several public safety institutions did receive computer centers, and more than fifty public safety institutions participated in SBA activities. However, these represent a small fraction of the overall PCC and SBA effort.
Conversely, each of the CCI grants in the evaluation study sample supported public safety activities, with the exception of Zayo Bandwidth’s Indiana Middle Mile Fiber for Schools, Communities, and Anchor Institutions project. As of December 31, 2013, 8,802 public safety entities, 16 percent of the 54,995 connected CAIs, were capable of receiving service as a result of BTOP CCI projects.237 Appendix B describes the impacts observed at the public safety institutions the evaluation study team interviewed during site visits.
6.4 Demand for Broadband, Economic Growth, and Job Creation
The final Recovery Act goal is to stimulate the demand for broadband, economic growth, and job creation. The central activities of PCC and SBA grants are intended to spur economic development and job creation by providing computer and broadband-based technology training and support at the individual level. Implementation of each project results in job creation to the extent that staff members are required to operate facilities and carry out grant activities, such as equipment distribution, outreach and awareness campaigns, training, and support.
49
CCI projects spur short-term demand for construction jobs and related employment to design and build the networks. Section 2 summarizes the short-term economic impacts described in the Short-Term Economic Impacts Report.238
6.4.1 Demand for Broadband
BTOP CCI grantees provided broadband connections to CAIs throughout their service areas. CAIs included K-12 schools, community colleges, other institutions of higher education, public housing, libraries, medical and healthcare providers, other community support organizations, public safety institutions, and other government facilities. Section 3 and Appendix B discuss the wide-ranging impacts for service area residents in more detail.
Figure 9 displays the number of CAIs connected by CCI grantees from the third quarter of 2010 through December 31, 2013.239 CCI projects were successful in connecting more than 21,000 CAIs during this time. Seventy-four CCI projects had completed their project activities by December 31, 2013.240
Figure 9. Cumulative CCI Community Anchor Institution Connections
BTOP SBA projects reported the results of activities intended to increase broadband adoption among households and businesses. Figure 10 presents the cumulative number of household subscribers as a result of SBA projects.241 SBA projects reported nearly 740,000 household broadband subscriptions by December 31, 2013.
50
Figure 10. Cumulative New Household Subscribers (SBA Grantees)
In addition to the household subscriptions presented in Figure 10 above, nearly 6,500 businesses subscribed to broadband by December 31, 2013 due to SBA grant efforts.242
6.4.2 Economic Growth and Job Creation
All three BTOP project types spur economic growth. PCC and SBA grants fostered economic growth by promoting broadband adoption, generating impacts at the individual level, such as training a skilled workforce. In general, PCC and SBA grants hired staff to coordinate project activities, and to provide training and technical support to patrons. Both PCC and SBA projects also hired staff or established partnerships to provide equipment maintenance and to develop educational materials for outreach and awareness campaigns.
CCI projects spur economic growth by promoting broadband availability through the provision of broadband infrastructure. This approach helps communities to attract and retain businesses, and supports online entrepreneurship and the growth of existing small businesses. Direct job creation from CCI projects came primarily from consultants and contractors hired to design, build, operate, and maintain the network infrastructure.
Section 2 summarizes the short-term direct, indirect, and induced job creation resulting from BTOP spending and Section 4 summarizes the long-term economic impacts of CCI projects.
51
Section 7. Best Practices Each of the forty-two case study reports the evaluation study team developed included a section describing the grantee’s successful tools, techniques, and strategies. In total, the evaluation study team described more than 400 of these items. The evaluation study team analyzed and synthesized these topics, along with discussions about sustainability from follow-up conversations, to describe the best practices and challenges included in this section.
7.1 PCC and SBA
7.1.1 Instructional Methods and Techniques Tailoring course material: PCC and SBA grantees found that patrons receiving training,
especially training in digital literacy, responded best to tailored courses that addressed specific tasks and goals, rather than general curricula about broadband technology. Teaching students how to perform specific tasks, such as signing up for a broadband connection or searching for a job online, resulted in greater student motivation and achievement.243 Curricula should be tailored, as needed, to meet the expectations of the community it serves.244
Understanding specific needs: Several grantees reported using entry interviews or surveys to gather information about new broadband users’ specific interests in order to recommend appropriate courses or to tailor course content to their needs.245 Some PCC and SBA grantees did not anticipate the low levels of adoption readiness of some patrons, especially speakers of a language other than English and those with low levels of literacy. Often, instructors used a modified curriculum or instructional approach to address these challenges.246
Offering support and encouragement: PCC and SBA programs commonly mentioned activities intended to support and encourage students. PCC and SBA grantees reported that both the modification of course content based on student progress, along with feedback, helped to increase or retain student interest.247 Personal interactions with instructors, including reminders to students of upcoming classes, follow-up communication with students who miss a class, and quarterly correspondence with students to track progress, were all cited as activities that improve class attendance and student retention.248 Some grantees employed tangible rewards to increase student participation and retention. Examples of this included earning netbooks or computers and graduation ceremonies or certificates for passing curriculum components.249
Building on BTOP programs: Some grantees discussed continuing activities or strategies that they piloted during the BTOP award period, while others adjusted processes to be more effective. One grantee saw the need for continued professional development training for staff in order to implement more effective digital literacy programs.250 Developing an online software-based course allowed another grantee to continue digital literacy training without funding additional staff time.251
7.1.2 Outreach and Communication Engaging the community: PCC and SBA grantees described how community engagement
improved project outcomes.252 One grantee noted that the most critical success factor for the program was the presence of engaged local leadership.253 Each community has different needs, and devolving administration to the community level helps to improve interest in the program and increases successful outcomes.254 Situating broadband adoption in the context of community development can engage more people and organizations, and can help to ensure that the engagement continues into the future.255 At the same time, community partners should
52
be chosen carefully so that their interests are aligned with those of the program.256 Teachers should also possess some familiarity with the background of the program’s target population.257
Using traditional means of communication for outreach, instead of a website or e-mail: Grantees reported that postal mail, telephone calls, 1-800 numbers, door-to-door outreach, and radio broadcasts resulted in successful engagement with prospective patrons, as many did not have Internet access at home.258 Word-of-mouth and the use of community members to promote awareness are important aspects of communication.259
7.1.3 Organizational Strategies Leveraging, improving, and sustaining partnerships: Many PCC and SBA grantees
described partners as essential to the success of their projects. Partners helped grantees implement projects that were larger in scope and complexity than those the grantees could have completed independently.260 Grantees found that established partners, especially those with whom they had pre-existing relationships, were the most valuable additions to the project team.261 PCC and SBA grantees found that relationships with partners provided not only resources and capabilities for the project, but also resulted in referring patrons to other partner activities.262 PCC and SBA grantees often stated that managing and improving partner relationships took significant effort, and that it was especially important to maintain strong lines of communication.263 One grantee reported that contractors that perceived their relationship with the grant as a partnership continued to deliver services after the grant period, whereas those who viewed the relationship as a vendor-customer arrangement did not.264 Another project created a collaborative organization to foster continued partnerships beyond the award period.265
Connecting to brick-and-mortar locations: Grantees reported that broadband training complements other services, such as job training and social service assistance, which might be offered in the same location as the computer lab. Colocation with other services that offer referrals and tie-ins to the activities of the organization hosting the computer center were used to increase the relevance of the broadband training offered.266 Outreach events held at familiar brick-and-mortar locations provide a place for social connection.267 Outreach events may also be held at PCCs, especially to increase awareness.268 Transferring ownership of equipment to these organizations also helped ensure future maintenance and use past the grant period.269 One grantee noted that locating PCCs close to the target population helped them to become more engaged online, including taking more distance learning classes.270
7.1.4 Technological Implementation Paying attention to privacy, security, and data storage: Grantees reported that patrons were
concerned about losing their data or passwords, as are many computer users. Computer centers took steps to address these concerns in order to increase the level of confidence patrons would have in using the computer center. Specific activities included establishing a centralized e-mail account for online password resets, providing secure storage of usernames and passwords in written form, centralized password management for all centers in the grantee’s network, the use of server backups to preserve patrons’ work, and attention to computer security settings to protect personal information.271
Standardizing hardware purchases and planning for flexible use: Standardization of equipment facilitates a consistent user experience, improves outcomes, facilitates maintenance, and reduces costs.272 Using laptops or all-in-one workstations increases program flexibility and allows for easier relocation of computers.273 Grantees also reported that mobile labs can help to reach community members and that hardware other than computer workstations, such as teleconferencing equipment, is helpful to achieve program goals.274
Collecting Data: Several grantees noted in follow-up calls that implementing the BTOP grants encouraged them to implement more rigorous and standardized data collection policies that they will continue to use after the award period. 275
53
7.1.5 Challenges Broadband availability affects project success: Broadband connectivity was not always
available at host sites. This made instruction more difficult.276 In one project, restrictive contracts prevented training locations from subscribing to bandwidth adequate to implement programs.277 Grantees used wireless hotspots to support projects in areas with no wired broadband service.278 The cost of broadband made a home connection unaffordable for some, especially those affected by the economic downturn.279 Some potential broadband subscribers in the target population were disqualified from low-cost subscription programs due to ISP restrictions.280 Local ISPs were seen as potentially helpful partners, although successful cooperation to achieve program goals was mixed.281
Reporting project results requires extensive data management: Grantees reported that accurately capturing information about the impacts of their activities was an ongoing challenge. Challenges in this area resulted in a quantitative view of program impacts limited largely to information captured in PPRs and other reports to NTIA. Five aspects of data gathering and management were especially challenging:
o The definition of program goals and activities defined by grantees, at times, did not align with terms used by NTIA. For example, one grantee developed goals using different definitions for average users per week, number of users trained, and training hours. This resulted in training targets that were over- or understated versus the capabilities developed by the grantees.282
o An estimate of broadband subscriptions resulting from project activities was especially difficult to obtain.283
o Data gathering methodologies were difficult to implement and maintain throughout the life of the project. PCC and SBA grantees reported using off-the-shelf tools, Excel templates, online database tools, and paper reports to capture data. While grantees eventually settled on a reporting methodology, what worked for one grantee was unhelpful to another.284
o The gathering of data on the population served was problematic. Members of the vulnerable populations targeted by projects were unlikely to complete mandatory surveys, limiting the comprehensiveness of data obtained using these methods.285
o Some grantees reported that they were not able to collect detailed impact data because of human subject research restrictions that prevented gathering longitudinal data on individuals and surveying minors at all.286
Lack of funding sources to continue operations after the grant period: Four grantees reported that some activities performed during the award period were unsustainable after the award period. These included hiring adequate staff for open lab hours or training and maintaining equipment.287
7.2 CCI
CCI projects offered fewer examples of best practices than PCC and SBA projects, although these best practices were widely shared across grantees. All grantees in the sample had some experience in the telecommunications space. Many of the factors that contributed to project success were continuations of proven business models as applied to the construction of infrastructure and are not included here. The best practices below summarize how these grantees rapidly built the BTOP-funded network in a compressed timeframe. Challenges with Environmental Assessments were the major hurdle to overcome in meeting this schedule, as described by several grantees.
7.2.1 Outreach and Communication Explaining the benefits of broadband: Grantees leveraged existing relationships with
potential CAIs, elected officials, and community leaders to identify potential CAIs and to
54
promote the benefits of the BTOP-funded projects.288 Some grantees developed estimates of the benefits of broadband use, potential cost savings, and return on investment to inform potential CAIs of the benefits of the project.289 Grantees reported that public events, CAI networking, and educational meetings were useful in educating potential users on the benefits of broadband.290
Publicizing open access: In addition to outreach to CAIs, some grantees stressed the importance of communicating with companies or the public to develop support for open access. Two grantees market to companies looking to build new locations, such as data centers, to promote economic development in their regions.291
7.2.2 Services Offered Collaborative planning with partners and subscribers: Grantees planned network
infrastructure to take into account the location of CAIs and businesses that could potentially use the network.292 This meant including ISPs in the planning and development of the network.293 Grantees also facilitated matching between ISPs and CAIs, which provided CAIs with more information regarding broadband subscribership choices.294 Several grantees used interconnection and fiber swap agreements to increase the scope and utility of the BTOP-funded infrastructure.295
Flexible and dynamic bandwidth allocation: Some grantees took steps to help CAIs to understand their broadband needs better and to increase their level of service as their needs grow.296 These grantees connected CAIs using technologies that allow for instantaneous bandwidth increases for specific events or when needs increase.297 One grantee gave existing customers access to 1 Gbps bandwidth for a trial period in order to help customers determine bandwidth needs.298
Ensuring reasonable pricing for CAIs: Several grantees worked with CAIs to help provide them the bandwidth within the budget they had. These practices extended past the initial bandwidth allocation to accommodate future demand.299 Two grantees offer opportunities for CAIs to increase bandwidth without incurring additional costs.300
7.2.3 Challenges Environmental Assessments: At least half of the grantees in the evaluation study sample did
not clearly understand or plan for the required Environmental Assessment when they initially developed their project plans. This resulted in unexpected costs and project delays of up to one year.301
Unexpected delays and costs for aerial fiber deployment: Some grantees reported difficulty obtaining timely permits from utility pole owners, which delayed project progress.302 In some cases, pole owners received more requests for permits than they were able to handle, impeding the approval process.303 In other cases, grantees had to work with pole owners to develop alternate routes, which required submission of route change requests to NTIA for approval.304 Aerial fiber deployment also generated unanticipated expenses in some cases.305 For example, Merit modified its network route to accommodate underground construction restrictions and incurred expenses to replace a larger number of poles than expected.306
55
Appendix A. Qualitative Data Analysis Methodology This appendix describes the methodology used to obtain and analyze qualitative information on the twenty-seven projects include in the evaluation study sample. The technology used by the evaluation study team evolved over the course of the project. In particular, the second round of case studies relied on computer-assisted qualitative data analysis software to support content analysis. The overall case study methodology was substantially similar for both rounds of case studies.
A.1 Case Study Methodology
Each site visit followed the process described below:
1. ASR conducted an initial planning call with the grantee to discuss the goals of the site visit and to develop a site visit itinerary based on the type of information that would be gathered during the site visit.
2. ASR performed preliminary interviews with the main stakeholders of each selected BTOP project. This included project leaders, staff, partners, and users (individuals in the case of PCC and SBA grants and CAIs in the case of CCI grants) responsible for different aspects of the project. ASR also examined data from the grantees, including PPRs, PPR attachments, and other materials.
3. ASR reviewed and coded documents using MAXQDA, a qualitative data analysis application. The coding taxonomy focused on the activities, outcomes, and expected impacts of project activities. The assembled documents were later augmented with material gathered during site visits.
4. An interview guide template was completed and customized for each grantee based on the results of queries against the coded documents. This resulted in a unique interview guide for each grantee. Each interview guide reflected information obtained from research documents or earlier case study research. During the second round of site visits, ASR included follow-up questions related to data gathered during the first round site visit.
5. ASR provided the customized interview guide to NTIA and the grantee before the site visit. ASR stressed to the grantee that this was not a survey, but a guide to assist the grantees in scheduling meetings, and a starting point for conversations with individuals and groups that would be able to address topics included in the interview guide.
6. Two to three members of the ASR team conducted the site visit. Three teams worked concurrently in order to complete work in a timely fashion.
7. ASR recorded all interviews, unless an interview subject requested otherwise. ASR provided all interview recordings to a professional transcription firm. The transcription firm signed a nondisclosure agreement to protect the contents of the audio recordings.
A.2 Data Analysis
After the site visit, the following activities took place:
56
1. Coders reviewed site visit transcripts and materials provided by the grantee, and applied codes from the taxonomy using MAXQDA. ASR revised the coding taxonomy as necessary in order to clarify and refine the application of codes, and to account for different document structure in PCC, SBA, and CCI case study reports. Key codes remained the same throughout the revisions, facilitating synthesis across grants. Revisions were made to the taxonomy as coding took place based on consultations among the site visit teams.
2. The following definitions were used:
a. Activity: Actions performed or products created that reach targeted participants or populations. Activities lead to outcomes. Examples include workshops, meetings, development of products, training, counseling, assessments, and media outreach. While some CCI grantees performed some of these activities, examples of CCI-specific activities include the upgrade and construction of fiber and wireless networks.
b. Outcome: Changes or benefits for individuals, families, groups, businesses, organizations, and communities. Outcomes include short-term results, defined as changes in awareness, knowledge, attitudes, skills, opinions, aspirations, or motivations, and medium-term results, defined as changes in behavior, practice, decision-making, policies, or social action.
c. Impact: Long-term changes in a condition, including social, economic, civic, or environmental.
d. Broadband: High-speed wireline or fixed wireless Internet service that has two-way data transmission with advertised speeds of at least 768 kbps upstream (upload) and at least 3 Mbps downstream (download).
e. Vulnerable Population: Groups that have historically lower rates of broadband adoption, including low-income individuals, the unemployed, seniors, children, minorities, and people with disabilities.
3. Two researchers performed quality control checks of the coding. One researcher double-coded a 10 percent sample of each transcript and reviewed intercoder agreement.307 In documents where intercoder agreement was less than 70 percent, the research teams met to analyze each coding decision in the 10 percent sample.308 This served a dual purpose of recoding the sample for accuracy and refining the coders’ understanding of the coding scheme. The original coder then recoded the entire document, and the quality control check was performed again. ASR provided additional training if inconsistencies occurred.
4. The evaluation study team used MAXQDA to identify common features in case studies and to prepare text for analysis. Responses and grantee-provided data were categorized by focus area, as described in Section 3, and activities, outcomes, and impacts were identified, compared, and contrasted across projects to develop an understanding of common features, as well as features that were unique to particular cases.
5. The site visit team wrote the first draft of the case study site visit report based on text selected from coded documents, their understanding of the project, and their experience during the site visit. ASR created case study reports using a standardized format to facilitate comparison across cases.
6. NTIA provided the project’s participants with draft reports and tentative analysis and encouraged feedback on themes and conclusions as a form of “member check.”309 A member check is a technique designed to improve the accuracy of the information provided through the interviews and field visits. This provided an opportunity to correct errors, summarize findings, and clear up any misunderstandings.310 NTIA also made comments on the draft case study reports and incorporated insights from grantees into their feedback. ASR documented all comments received and their disposition.
7. ASR combined interview responses and grantee-provided data from all case study reports from both the first and second round of case study site visits to develop Interim Report 2. The focus of Interim Report 2 was the identification of social and economic impacts, and identification of the linkages between these impacts and their antecedent program outcomes and BTOP-funded program activities. Interim Report 2 documents the analysis performed and the results obtained for that deliverable.
57
8. Results presented in Interim Report 2 guided the development of quantitative measures of social and economic impacts discussed in this Final Report.
A.3 Validity and Reliability
The evaluation study team implemented several practices to monitor the quality of the content analysis used to produce the content for the case studies. Content analysis is a widely used technique in qualitative research.
The data were checked for accuracy and matched to reality through “triangulation” protocols to validate observations and to find convergence across and among data sources, researchers, methods, and complementary and overlapping interpretations of the same phenomena.311
ASR assessed the reliability of the coding for the content analysis formally. The project’s researchers worked in pairs and compared and crosschecked each other’s findings, as well as observed and examined the same empirical data.
The draft case study report was reviewed by a professional editing firm (under a nondisclosure agreement with ASR) or internal editor, the team lead, and in most cases members of the Academic Advisory Committee.312 Each case study report was reviewed by several members of the ASR team holding a Ph.D.
ASR developed all case study reports using the same interview protocol, coding scheme, and software tools. As a result, the evaluation study team was able to identify patterns across cases while accounting for contextual differences.
58
Appendix B. Qualitative Intermediate-Term Impacts This appendix describes the social and economic impacts discussed in Interim Report 2, supplemented by new information from follow-up phone calls with grantees about impacts since the site visits and any results from third-party evaluations. The social and economic benefits of BTOP projects were categorized into six focus area categories:
Workforce and Economic Development includes activities intended to increase overall employment of the target population or to assist employed members of that population in finding jobs that offer increased salaries, better benefits, or a more attractive career path, including self-employment.
Education and Training includes activities that lead to a certificate or diploma that would typically be awarded by an educational institution or that indicates the recipient has received training that is recognized as valuable for career advancement.
Healthcare includes broadband-enabled activities that improve the health of program participants or that of someone else. Activities performed by healthcare institutions as a result of BTOP grants, such as improvements in the provision and administration of healthcare services, are also included in this category.
Government Services identifies how broadband improves services provided by government organizations to the public and includes both the provision and administration of public safety activities.
Quality of Life/Civic Engagement includes activities that create stronger and more integrated communities and those that promote interaction between citizens and their governments.
Digital Literacy is fundamental to all the others. Digital literacy defines a set of skills and abilities that enable an individual to interact with the digital aspects of culture and to maintain a digital identity.
To assess the social and economic impacts of the twenty-seven BTOP projects included in the evaluation study sample, ASR identified focus area impacts described in site visit interviews, grantee reported data, and other sources of information on each of the selected BTOP projects. ASR used reported impacts to guide the quantitative estimation of intermediate-term benefits presented in Section 3. The following subsections explore the impacts reported most frequently for PCC, SBA, and CCI grants, and provide examples of these impacts as reported to the evaluation study team.
B.1 Workforce and Economic Development
This section describes the Workforce and Economic Development impacts of the BTOP projects in the evaluation study sample. This focus area includes activities intended to increase overall employment of the target population, or to assist employed members of that population in finding jobs that offer increased salaries, better benefits, or a more attractive career path, including self-employment. Workforce and Economic Development activities can be performed for one’s own benefit, or they may be done on behalf of another person to assist with their employment situation. In order for project activities to be included in the Workforce and Economic Development focus area, it must be the intention of the grantee to assist members of the workforce in improving their employment outcomes, and project resources must be devoted to this purpose.
59
Table 19 presents potential social and economic impacts related to Workforce and Economic Development defined in Interim Report 1, organized as benefits to job seekers, rural areas, and businesses.
Table 19. Workforce and Economic Development: Potential Social and Economic Benefits
Benefits to Job Seekers
Reduced unemployment313 Improved job matches, resulting in increased productivity314 Fewer geographic boundaries on job search315 Independent contracting feasible as a career alternative in remote locations316
Benefits to Rural Areas
Broadband allows rural areas to compete for low- and high-end service jobs, the area of highest economic growth317
Improved access to inputs and markets, especially in rural areas318 Increased telework opportunities, especially for rural areas319 Increased job and population growth320
Benefits to Businesses
Improved recognition of local business through websites and social networking321 Increased productivity of commercial subscribers322
As shown in Table 20 and Table 21, thirteen of the fifteen PCC and SBA grants included in the sample reported incidents of patrons or participants obtaining employment as a result of grant-funded services or resources.
Table 20. PCC Workforce and Economic Development Impacts in the Evaluation Study Sample
Impact ID
Impact
CH
A
DD
L
FA
MU
LV
UL
MS
U
SC
TC
S
TF
A
WF
WV
PCC.W.1 Obtained employment
PCC.W.2 Started or grew businesses
Table 21. SBA Workforce and Economic Development Impacts in the Evaluation Study Sample
Impact ID
Impact
CE
TF
Ch
icago
C.K
. B
land
in
Co
nn
ect A
rkansas
FC
CC
Fu
ture
Gen
eration
s
UA
C
SBA.W.1 Obtained employment
SBA.W.2 Started or grew businesses
60
Interviewees reported that job seekers realized the majority of Workforce and Economic Development benefits. Of the benefits highlighted in the table above, reduced unemployment was the most frequently observed impact among the PCC and SBA grants included in the evaluation study sample. Other benefits in the table above occurred but were not directly associated with an observed impact. Interim Report 2 provides a complete summary of outcomes and impacts, and the activities that led to them. The impacts most commonly observed across PCC and SBA grants in the evaluation study sample include:
Obtained employment: The acquisition of digital literacy skills, development of job readiness skills, the ability to search and apply for jobs online, or a combination of these outcomes resulted in participants obtaining a job or promotion.323 While several projects included in the evaluation study sample reported instances of job seekers obtaining employment, the majority of the projects did not have a mechanism in place to track the number of jobs obtained. Projects that did report the number of jobs obtained relied on patrons to self-report their employment. Reported impacts will, therefore, likely understate the total number of jobs obtained, as some newly employed patrons may not return to grant-funded sites to report their employment.
Started or grew businesses: Training programs for businesses promoted the usefulness of Internet-based technologies to improve operational efficiency and to grow customer bases. Entrepreneurs and small business owners benefited from gaining the knowledge necessary to leverage Internet-based resources, such as websites and social media networks, to enhance their marketing platforms.324 Participants successfully started or improved entrepreneurial endeavors using grant-funded resources. Users learned to implement web-based tools to launch an idea or to improve and grow their independent business.325 Participants increased their client base by developing or enhancing their web presence and using electronic communication tools to interact with current and potential clients.326
ASR conducted follow-up interviews with grantees participating in the case study sample. Data collected from evaluation study participants during site visits and through follow-up efforts yielded the following insights related to Workforce and Economic Development impacts:
Obtained employment
o Delaware Division of Libraries (DDL): DDL Job Centers reported that throughout the award period, spanning July 2011 through September 30, 2013, patrons obtained 585 job offers as a result of grant-funded resources and services.327 Patrons’ acquisition of employment was a result of access to computers and broadband to facilitate job searching, independent learning, and, in some cases, digital literacy skills.328 DDL, which obtained state funding to maintain the grant-funded Job Centers, reported that since the end of the award period, a minimum of 260 patrons reported obtaining job offers.329
o Technology For All (TFA): The project assisted job seekers in obtaining employment by providing access to computers and Internet-based resources and by offering guidance in searching and applying for jobs. TFA supplemented the provision of these resources by offering workforce and digital literacy training programs. As of April 25, 2013, TFA staff reported that 802 patrons of Haven for Hope, which offers resources for the homeless, had obtained employment. TFA partners estimated that 25 to 30 percent of job seekers using PCCs obtained at least short-term employment.330 TFA did not have any new data to provide during the follow-up interview.
o City of Chicago: Grant-funded programs offer digital literacy training and one-on-one employment and financial counseling programs. Program staff estimated that enrollees who completed digital literacy courses exhibited a job placement rate 13 percentage points higher than attendees who did not participate in the training. In 2011 and 2012, grant programs placed 1,118 employment counseling enrollees in jobs.331 The grantee did not collect any additional data related to job placement outcomes.332
61
Started or grew businesses
o C.K. Blandin Foundation (C.K. Blandin): C.K. Blandin’s project partner University of Minnesota Extension (UME) offered training to entrepreneurs and small businesses, providing 306 workshops to 2,082 unique businesses and 4,206 attendees during the grant period. Staff members reported that the training increased the percentage of businesses that had a digital presence, and that participating businesses increased their digital presence at a greater rate than those that did not participate. UME did not continue to offer these training courses after the grant period. Instead, it incorporated business technology use into its other community planning activities.333 Minnesota Renewable Energy Marketplace (MNREM), a project partner, provided training and assistance to small businesses, primarily in the renewable energy sector, on the use of Internet-based technologies. MNREM reported that business owners were able to develop the skills to improve their business operations, and some small business owners found part-time contracting work.334 MNREM is no longer operating.335
o City of Chicago: The City of Chicago’s Smart Communities program created the Business Resource Network (BRN), an initiative designed to help local businesses become sustainable, profitable entities by providing them with free access to broadband, business software, and technology workshops. BRNs offered technology consulting services to support small and medium-size businesses in the Smart Communities. As of December 2012, BRN consultants provided technology assessments for 461 community businesses in the service area, resulting in 335 technology action plans focused on adopting digital technologies and implementing online marketing strategies. BRNs distributed 100 desktop computers to business owners who completed BRN training. Some entrepreneurs established their businesses by leveraging the support of BRNs and other grant-funded services.336 Chicago did not provide any new data regarding these activities during the follow-up interview.
o Florida Agricultural and Mechanical University (FAMU): The grantee provided small and minority businesses with workforce training focused on industry certifications and virtual learning. FAMU also delivered a Construction Management Development Program to small and disadvantaged businesses. Upon completion, participants earned a certification of proficiency, enabling businesses to participate in the Florida Department of Transportation Bond Guarantee Program.337 As of June 2013, ten business owners in three Florida counties had completed the training. One participant reported obtaining a contract with the state upon receiving a small business designation because of grant-funded activities. FAMU did not provide more recent data related to participants or certifications awarded during the follow-up interview.338
B.1.1 CCI Workforce and Economic Development Impacts
Table 22 presents the CCI grants with observed Workforce and Economic Development impacts. For each impact, projects received a checkmark if grantees, partners, CAIs, or other interview subjects reported that impact during case study site visits or follow-up discussions. The most prominent impacts among CCI grants included in the case study sample include the realization of productivity gains and improved access to inputs and markets.
62
Table 22. CCI Workforce and Economic Development Impacts in the Evaluation Study Sample
Impact ID
Impact
Clearw
ave
LC
OG
MassT
ech
MB
C
MC
NC
Merit
On
eCo
mm
un
ity
OS
HE
AN
SD
N
UA
S
West V
irgin
ia
Zayo
CCI.W.1 Improved productivity
CCI.W.2 Job or population growth
CCI.W.3 Access to inputs and markets
CCI projects support Workforce and Economic Development activities by providing infrastructure to support the growth of new and existing businesses. Observations reported by interviewees indicated improved productivity was the most frequently observed impact among the projects included in the evaluation study sample. Several interviewees also reported benefiting from improved access to inputs and markets. Although only a short period had elapsed since the construction of the grant-funded fiber networks, some interviewees reported instances of communities benefiting from job growth. The impacts most commonly observed across CCI grants in the evaluation study sample include:
Improved productivity: Saving resources enables organizations to devote those resources to more productive channels.339 Strengthening the intellectual capital within an organization improves productivity by enabling employees to accomplish more challenging tasks or accomplish similar tasks with fewer resources.340 Improved productivity also includes enabling employees to telecommute in the event of severe weather or other circumstances that would prevent onsite attendance.341
Job or population growth: Businesses that expand operations into new geographic territories or increase production and service delivery create or improve employment opportunities within a community.342 Businesses that improve the range of services offered may hire additional employees to support new company divisions.343 Job growth may be realized within specific industry sectors, such as a community realizing an increase in the number of service jobs.344
Access to inputs and markets: Businesses are able to increase their customer base by expanding operations, offering new products or services, selling at a new price point, or improving the quality of goods and services.345
ASR conducted follow-up interviews with grantees participating in the case study sample. Data collected from evaluation study participants during site visits and through follow-up efforts yielded the following insights related to Workforce and Economic Development impacts:
Improved productivity
o Zayo Bandwidth, LLC (Zayo): Improved network connectivity enables the Utilities District of Western Indiana (UDWI), a customer of Zayo, to realize a substantial improvement in the capabilities of its meter-reading system. Before connecting to fiber, employees required thirty seconds to read an individual meter and twelve hours to complete a full meter data collection. It now takes less than two seconds to read an individual meter and four hours to complete a full meter data collection.346 Zayo reported that UDWI is seeking fiber connectivity for its substations to improve operational efficiency at these facilities. However, the investment required to build out to the rural substation locations is cost prohibitive for UDWI. Zayo actively examines opportunities that could lower construction costs and facilitate the build to UDWI substations.347
63
o Merit Network, Inc. (Merit): South Central Michigan Works! (SCMW) promotes employment by helping job seekers find jobs and by working with businesses to ensure an adequately skilled workforce. SCMW serves more than 800 employers comprising two-thirds of the employers in Lenawee, Hillsdale, and Jackson Counties. Employers encourage employees to take SCMW's free computer classes to acquire digital skills, thereby increasing workplace productivity. The improved connectivity allows SCMW to offer these classes more efficiently to more students.348 For example, it has reduced the time it takes to complete SCMW’s Basic Internet Navigation class from 70 minutes to 45 minutes because of faster page loads and quicker access to data. SCMW is also planning to expand its offerings to include more online content for its students and has been able to make better and more frequent use of online content for its in-house staff training as well.349
Job and population growth
o Mid-Atlantic Broadband Communities Corporation (MBC): ICF International (ICF), a government and private sector consulting firm, recently opened a new facility in Martinsville, VA, largely because of MBC’s fiber network, which offers a high degree of reliability. Broadband connectivity is crucial for ICF, whose business needs include high-quality, high-capacity bandwidth and near 100 percent network reliability.350 ICF commenced a major telephony upgrade involving the construction of a new call center for managing market research. ICF customer service operations created 539 permanent jobs.351 MBC did not provide new information relating to ICF during the follow-up interview, but gave evidence of similar impacts that have occurred. On April 30, 2014, Virginia’s governor announced that the Corsi Group, a manufacturer of cabinetry, will be opening a new facility in Charlotte County, creating 110 new jobs.352 MBC stated that its network, extended to Charlotte County through the BTOP grant, was a decisive factor in site selection for the new facility.353
o Merit Network, Inc. (Merit): MiSpot is an ISP that provides fixed wireless services to several areas in the northern half of the Lower Peninsula of Michigan. The increased access to middle mile fiber in its service area has allowed MiSpot to expand its business, and it has grown from four to nineteen employees.354 MiSpot’s parent company has also added several employees to provide technical support for MiSpot’s networking equipment.355
Access to inputs and markets
o Mid-Atlantic Broadband Communities Corporation (MBC): The high degree of reliability offered by MBC has enabled ICF to shift to 24/7 operations, resulting in the acquisition of new business contracts. ICF interviewees stated that they could not have acquired these contracts before transitioning to twenty-four-hour operations. This represents an expansion into new markets for ICF, which typically manages federal government contracts.356 MBC did not have any updated information available related to ICF’s expansion.357
o MBC: Shentel uses the MBC network to provide last mile broadband service in rural markets where it did not previously have a presence. A representative of Shentel remarked that MBC’s network reliability and wholesale pricing are significantly better than those of incumbent middle mile carriers. The lower prices MBC offered to Shentel result in lower retail prices for its customers, making Internet access available and affordable in rural markets.358 MBC did not have any additional information available related to Shentel’s pricing or customers in rural markets.359
o MCNC: The expansion of the North Carolina Research and Education Network (NCREN) represents an affordable transport option for third-party providers. MCNC stated that a provider in a small city in northeastern North Carolina was not able to expand its citywide footprint because it could not find affordably priced transport services before the grant. After NCREN expanded to this area through the BTOP grant, the provider was able to use NCREN for transport services and expand its footprint.360
64
B.1.2 Third-Party Studies Mid-Atlantic Broadband Communities Corporation (MBC): MBC did not commission a
formal study of its BTOP grant. However, it is planning to launch a pilot program using network infrastructure put in place through the grant. MBC’s Giga Trial will provide twenty businesses in the Martinsville, Virginia area with an individual 1 Gbps direct connection to the Internet with no latency. MBC will observe network utilization by the businesses during a one-year period.361
City of Chicago (Chicago): Dr. Karen Mossberger of Arizona State University and Dr. Caroline Tolbert and Christopher Anderson, both of the University of Iowa, evaluated the project. The evaluation study found that the rate of increase in online job searches in the grant’s service area was 11 percentage points greater than in the rest of Chicago. The study did not determine whether this outcome translated into higher rates of job placement, but noted that further investigation is necessary to determine how the outcomes presented in the study will impact the participating communities over time.362
Urban Affairs Coalition (UAC): UAC partnered with the Open Technology Institute to conduct a partner-driven evaluation of both the PCC and SBA grants conducted under the Freedom Rings Partnership. The evaluation study, which concluded in January 2013, found that 60 percent of exit survey respondents at PCC locations credited the computer lab with helping them find a job. The study also found that PCC locations helped some participants keep their job skills current. 363
B.2 Education and Training
This section describes the Education and Training impacts of the BTOP projects in the evaluation study sample. This focus area includes activities that lead to a certificate or diploma that would typically be awarded by an educational institution, or that indicates the recipient has received training that is recognized as valuable for career advancement. Examples of certificates or diplomas include the following: community college degrees, four-year college degrees, advanced degrees, general equivalency degrees, certifications in advanced software technologies such as network engineering, and other licenses or certifications that reflect knowledge of a particular subject at a level that would typically be taught at an educational institution.
The evaluation study team gathered data related to focus area impacts from evaluation study participants during site visits. The following subsections present a summary of the social and economic benefits described in case study reports.
Table 23 presents the potential social and economic benefits related to Education and Training identified in literature and defined in Interim Report 1:
65
Table 23. Education and Training: Potential Social and Economic Benefits
Benefits to Students
Improved student performance364 Improved educational resources for nontraditional or disabled students and students in
geographically remote areas or poor districts365 Increased levels of education366 More personalized educational activities367 Increased student-teacher engagement through social networking368
Benefits to Teachers
Increased teacher productivity369
Benefits to School Districts
Increased school enrollment rates370 Improved interaction among students, parents, teachers, and school administrators371 Lower-cost, more effective training of workers372
Table 24 and Table 25 present the PCC and SBA grants that observed Education and Training impacts. For each impact, projects received a checkmark if grantees, partners, or other interview subjects reported that impact during case study site visits or follow-up discussions. Eleven of the fifteen PCC and SBA grants reported examples of patrons or participants obtaining increased levels of education as a result of grant-funded services or resources.
Table 24. PCC Education and Training Impacts in the Evaluation Study Sample
Impact ID
Impact
CH
A
DD
L
FA
MU
LV
UL
MS
U
SC
TC
S
TF
A
WF
WV
PCC.E.1 Increased levels of education
PCC.E.2 Improved academic performance
Table 25. SBA Education and Training Impacts in the Evaluation Study Sample
Impact ID
Impact
CE
TF
Ch
icago
C.K
. B
land
in
Co
nn
ect A
rkansas
FC
CC
Fu
ture
Gen
eration
s
UA
C
SBA.E.1 Increased levels of education
SBA.E.2 Improved academic performance
The Education and Training impact that occurred most frequently was increased levels of education. This impact included obtaining a Certificate of High School Equivalency or certification and enrolling in or graduating from a degree-conferring program. Grantees also observed cases of
66
improved student performance for K-12 students. Other benefits in the table above occurred but were not directly associated with an observed impact. For example, a grant activity improved educational resources for students in a small, rural school, but it is not known whether these students used the resources to improve academic performance or graduate.373 Interim Report 2 provides a complete summary of outcomes and impacts, and the activities that led to them. Education and Training impacts most commonly observed across PCC and SBA grants in the evaluation study sample include:
Increased levels of education: Students obtained a Certificate of High School Equivalency or other certifications, enrolled in higher education, or graduated from degree-conferring programs.374
Improved academic performance: Students enrolled in K-12 schools improved their academic performance, raising grades and class ranking or taking more challenging classes.375
ASR conducted follow-up interviews with grantees participating in the case study sample. Data collected from evaluation study participants during site visits and through follow-up efforts yielded the following insights related to Education and Training impacts:
Increased levels of education
o Foundation for California Community Colleges (FCCC): Community college students participated in grant-funded education training on Microsoft software. After gaining skills in software applications including Word, Excel, Outlook, PowerPoint, and Access, students passed 1,382 Microsoft certification exams as of June 2013.376
o Urban Affairs Coalition (UAC): Public housing residents who completed eight hours of digital literacy training were eligible to receive a free netbook. The training and free netbook program helped residents gain digital literacy skills that enabled them to enroll at a local community college. By the end of June 2013, 150 graduates of the program registered for credit classes at Community College of Philadelphia.377
o Florida Agricultural and Mechanical University (FAMU): The grantee provided opportunities for students to receive technology training through volunteer and internship programs. Several students completed an internship program and gained technology skills that helped them get accepted to college with a major in audio and video engineering.378 In June 2014, FAMU plans to offer the Professional Opportunities Program for the third consecutive summer.379
o Delaware Division of Libraries (DDL): The grantee collaborated with other organizations to provide education training to those seeking a high school diploma. DDL staff members estimated that, by September 2013, as many as fifty users obtained a high school diploma after gaining the necessary skills through the training.380 DDL continued to provide training to support diploma seekers after the award period. However, DDL discontinued data collection efforts related to this service.381
Improved academic performance
o C.K. Blandin Foundation (C.K. Blandin): A parent who received a home computer reported that her son has improved his grades using the educational games available. In another Demonstration Community, a school district was able to purchase forty iPads for teacher and student use in K-12 classrooms. Teachers reported that students were more engaged and that student performance increased significantly when students received access to the iPads.382 C.K. Blandin continued to fund Demonstration Community projects after the grant period.383
o Technology For All (TFA): During an eight-week course, Austin Free-Net (AFN) conducted training in six Austin Independent School District schools, serving more than eighty parents who, through an eight-week course, gained the computer skills necessary to improve educational achievement for their children.384 TFA recently launched a similar program with a Houston High School and provided training to approximately 300 parents.
67
Parents learned to use the school’s online portal to interact with their children’s teachers and school administration.385
B.2.1 CCI Education Impacts
Table 26 presents the Education and Training impacts observed among CCI grants included in the evaluation study sample. For each impact, projects received a checkmark if grantees, partners, CAIs, or other interview subjects reported that impact during case study site visits or follow-up discussions. The most prominent impacts among CCI grants included in the case study sample are the realization of productivity gains and improved access to inputs and markets.
Table 26. CCI Education and Training Impacts in the Evaluation Study Sample
Impact ID
Impact C
learwave
LC
OG
MassT
ech
MB
C
MC
NC
Merit
On
eCo
mm
un
ity
OS
HE
AN
SD
N
UA
S
West V
irgin
ia
Zayo
CCI.E.1 Improved academic performance
CCI.E.2 Improved productivity and efficiency
CCI.E.3 Maintenance of, or increased, enrollment
CCI.E.4 Expansion of course or program offerings
The Education and Training impacts that occurred most frequently were the expansion of course or program offerings and increased productivity and efficiency for teachers and schools. Students also experienced improved academic performance, and some education CAIs were able to maintain or increase enrollment. Interim Report 2 provides a complete summary of outcomes and impacts, and the activities that led to them. Impacts most commonly reported by CCI grantees in the evaluation study sample include:
Expansion of course or program offerings: Grantees reported expanding course and program offerings.386 Most additional offerings were online classes, although some CAIs also offered new on-campus courses as a result of grant activities.
Improved productivity and efficiency: Saving resources enabled organizations to devote those resources to more productive channels. This impact was most often a result of improved access to cloud-based solutions that helped reduce staff time spent on maintenance and improved functionality due to broadband data transfer.387
Improved academic performance: Students in K-12 schools and institutions of higher learning were able to improve grades, pass tests, and increase standardized testing scores after improved broadband connectivity helped educational institutions improve services provided to students.388
Maintenance of, or increased, enrollment: Some CAIs were able to improve student enrollment after adopting new tools or improving the functionality of existing tools, which enabled them to provide better services to students.389
ASR conducted follow-up interviews with grantees participating in the case study sample. Data collected from evaluation study participants during site visits and through follow-up efforts yielded the following insights related to Education and Training impacts:
68
Expansion of course or program offerings
o OSHEAN: Increased capacity and access to affordable bandwidth through the new Beacon 2.0 network has facilitated the growth of the Community College of Rhode Island’s (CCRI) distance education program. CCRI reported that enrollment in the program increased by 112 percent between the fall 2012 and fall 2013 semesters. Without the improved broadband capacity, CCRI would not have been able to support the increase in students participating in distance education. As of September 2013, CCRI did not offer full degree programs via distance education, although many degree programs offered hybrid instruction options. CCRI is working toward developing the distance education program to offer associate degree programs remotely.390
o MCNC: University of North Carolina at Pembroke (UNCP) is the third largest provider of online education in the UNC system by number of courses offered. UNCP offers a business entrepreneurship degree taught entirely online. Some onsite classes engage in interactive video communication with Richmond Community College and other community colleges for collaborative distance learning activities. While UNCP had capacity that was adequate to support online instruction, grant-funded connections to NCREN made partnerships with community colleges possible.391
Improved productivity and efficiency
o Executive Office of the State of West Virginia (West Virginia): The fiber connection between the National Radio Astronomy Observatory (NRAO) in Green Bank, West Virginia and West Virginia University (WVU) in Morgantown, West Virginia provided by the grant has improved NRAO’s data-sharing capabilities and reduced research costs. Before the grant, the broadband connection serving NRAO was so limited that it could not support the transmission of datasets between NRAO telescopes and WVU. Datasets had to be saved on physical storage devices and driven from Green Bank to Morgantown. This resulted in data collection delays of a week or more and required weekly travel of nearly 250 miles. NRAO’s new fiber connection allows for the digital transmission of datasets, saving an estimated $250,000 per year in travel and data storage costs.392 West Virginia did not have any updated data related to the cost savings or other benefits associated with NRAO’s connection.393
o MCNC: Lee County Schools’ (LCS) connection to the NCREN has resulted in time savings for both technical and instructional staff. Increased bandwidth has facilitated the use of cloud-based applications, which eliminates the need for installing software on students’ devices. As a result, technical staff are free to support instructional activities. A representative of LCS also expressed that the reliability of the new connection eliminates the need for teachers to spend extra time writing backup lesson plans in case their Internet-dependent plans cannot be used because of broadband service interruptions.394 MCNC did not have any additional information related to benefits realized by LCS faculty or administration.395
Improved academic performance
o MCNC: Mooresville Graded School District (MGSD) administration believes its one-to-one computing initiative, supported by grant-funded connections to NCREN, has had significant impacts on student retention and performance. The graduation rate in MGSD increased from 80 percent in 2008 to 93 percent in 2013, the second-highest district graduation rate in the state. In addition, attendance rates have risen, standardized test scores have improved in every subject, and teachers reported that students are more engaged.396
o Lane Council of Governments (LCOG): Since connecting to the new fiber network funded by the BTOP grant, Days Creek has been able to offer additional support for struggling middle school students. It has a four-day school week, with students who need extra help with schoolwork also attending on Fridays. This supplemental program is largely dependent on web content, including Achieve 3,000, which provides individualized instruction online for struggling students. The high school uses Assessment and Learning in Knowledge Spaces, a math tool that helps students track progress and assessment.
69
Days Creek staff members reported that test scores have greatly improved because of this expanded educational opportunity.397
Maintenance of, or increased, enrollment
o Clearwave: Southern Illinois University (SIU), a Clearwave customer, was not able to offer online programs to the extent that it wanted because of bandwidth constraints. The Clearwave connection has alleviated these constraints and allows SIU to maintain enrollment without having to bring students to one campus.398 Clearwave did not have any additional information available related to enrollment at SIU.399
B.2.2 Third-Party Studies C.K. Blandin Foundation (C.K. Blandin): As part of its grant funding, C.K. Blandin worked
with the Intelligent Community Forum to measure progress in the Demonstration Communities from 2010 to 2012. One indicator included measures of educational attainment, computers per student in schools, and degrees issued per capita. The final study found that the average student-to-PC ratio in the Demonstration Communities decreased from 3 to 1 in 2010 to 2.81 to 1 in 2012. The Intelligent Community Forum also found that more than 90 percent of schools provided in-house training for teachers. Overall, the average score in Demonstration Communities increased by 5 percent for this indicator.400
Urban Affairs Coalition (UAC): The evaluation of the Freedom Rings Partnership collected optional exit surveys from participants who had completed training sessions. The evaluation found that 68 percent of survey respondents who completed SBA education training sessions for educational purposes said that training helped connect them with educational opportunities.401
Cambridge Housing Authority (CHA): CHA recently conducted an extensive survey of the Work Force program, capturing both qualitative and quantitative measures of success. The survey achieved nearly a 50 percent response rate from students and graduates that participated in the program between 2003 and 2013. Students in the Work Force program use PCC resources to complete homework and school assignments, search and apply for college and scholarships, and participate in structured educational activities. CHA indicated that the PCCs are integral components of the Work Force program, supporting its mission to help low-income teens residing in Cambridge Public Housing achieve long-term success.402 Findings from the most recent survey show a 95 percent college matriculation rate for the Class of 2013, and over 85 percent matriculation average over the past ten years.403
B.3 Healthcare
This subsection describes the Healthcare impacts of the BTOP projects in the evaluation study sample. This focus area includes broadband-enabled activities undertaken by PCC and SBA projects to improve their own health or that of someone else. This definition includes not only sophisticated tasks, such as viewing one’s medical records online, but also more common activities that might not involve a medical provider at all. In order for a program activity to be considered a Healthcare component of the project, it must be the grantee’s intention that the activity result in improved participation in self-care or care of others as a result of an individual’s participation. Activities performed by healthcare institutions are intended to increase elements of the provision and administration of healthcare services.
The evaluation study team gathered data related to focus area impacts from evaluation study participants during site visits. The following subsections present a summary of the social and economic benefits described in case study reports.
Table 27 presents the potential social and economic benefits related to Healthcare identified in literature and defined in Interim Report 1:
70
Table 27. Healthcare: Potential Social and Economic Benefits
Benefits to Patients
Improved patient information resulting from ease of accessibility, interactive features, and anonymity404
Improved patient choice of provider and treatment options405 Improved treatment outcomes for physical and mental illness406
Lower patient cost in time and transportation vs. telephone calls or face-to-face visits407 Improved patient care seeking408 More effective health promotion and disease prevention programs409 Faster, more accurate prescriptions410 Improved patient access to healthcare records and test results411 Reduction in duplicative paperwork and tests412 Improved ongoing care413 Improved patient outcomes by providing daily monitoring414 Reduced home care costs by reducing the number of unnecessary in-home visits415 Reduced hospital length of stay416 Improved privacy and convenience in obtaining prescription medication or ordering
medications417 Greater availability of drugs for shut-in people, those who live far from a pharmacy, or those
in rural areas with limited pharmacy options418 Improved access to written product information419 Reduced cost of online prescription drugs420 Reduced drug interactions resulting from multiple prescriptions from different providers421 Improved patient-to-patient networking and support422
Benefits to Healthcare Providers
Cost savings from reduced unnecessary face-to-face time between health professionals and the “worried well”423
More convenient access to medical care because of asynchronous communications424 More complete medical records at lower cost425 Improved patient-provider relationship building426
Rapid information sharing among all healthcare providers for the same patient427
Improved appointment and treatment scheduling428 Improved range of health services429
Table 28 and Table 29 present the PCC and SBA grants that observed Healthcare impacts. For each impact, projects received a checkmark if grantees, partners, or other interview subjects reported that impact during case study site visits or follow-up discussions. Among those included in the evaluation study sample, one PCC grant and one SBA grant reported incidents of patrons or participants improving their health as a result of grant-funded services or resources.
Table 28. PCC Healthcare Impacts in the Evaluation Study Sample
Impact ID
Impact
CH
A
DD
L
FA
MU
LV
UL
MS
U
SC
TC
S
TF
A
WF
WV
PCC.H.1 Improved health
71
Table 29. SBA Healthcare Impacts in the Evaluation Study Sample
Impact ID
Impact
CE
TF
Ch
icago
C.K
. B
land
in
Co
nn
ect A
rkansas
FC
CC
Fu
ture
Gen
eration
s
UA
C
SBA.H.1 Improved health
Healthcare was not the primary focus of any of the PCC and SBA grants included in the evaluation study sample. Of the benefits highlighted in the table above, few grantees reported impacts or collected data related to patient health and well-being. PCC and SBA grantees in the evaluation study sample most commonly reported the following impact:
Improved health: Using computers with broadband access to obtain health-related information and access to digital tools to manage heath enabled some participants to improve their health.430
ASR conducted follow-up interviews with grantees participating in the case study sample. Data collected from evaluation study participants during site visits and through follow-up efforts yielded the following insights related to Healthcare impacts:
Improved health
o Florida Agricultural and Mechanical University (FAMU): The Bond Community Health Center’s Men’s Health Program used the Center for Public Computing and Workforce Development (CPCWD) to access the My Fitness Pal website and mobile application to promote healthier, more active lifestyles among uninsured or underinsured men. Participants used the CPCWD computers to access online resources and receive training to use the technology to track caloric intake and exercise. The men learned healthier eating habits and developed exercise routines. The program manager reported that some participants lost weight and improved their health through the program.431
o Urban Affairs Coalition (UAC): Patrons improved their ability to care for themselves or family members suffering from a health-related issue. Social service organizations participating as project partners offered patrons access to health information online. Trainers assisted computer center patrons in locating reliable healthcare information online and suggested additional health and social services available through partner organizations.432 As of May 2014, UAC continued to support these activities.433
B.3.1 CCI Healthcare Impacts
Table 30 presents the Healthcare impacts observed among CCI grants included in the evaluation study sample. For each impact, projects received a checkmark if grantees, partners, CAIs, or other interview subjects reported that impact during case study site visits or follow-up discussions. At least half of the CCI grants included in the sample reported providers realizing productivity gains, patients realizing improved health and care, or both impacts.
72
Table 30. CCI Healthcare Impacts in the Evaluation Study Sample
Impact ID
Impact
Clearw
ave
LC
OG
MassT
ech
MB
C
MC
NC
Merit
On
eCo
mm
un
ity
OS
HE
AN
SD
N
UA
S
West V
irgin
ia
Zayo
CCI.H.1 Improved patient care
CCI.H.2 Improved healthcare providerproductivity and efficiency
Observations reported by interviewees indicated that healthcare providers realized the majority of benefits in the Healthcare focus area for CCI projects. Improved provider productivity and efficiency was the most frequently observed impact among the grants included in the evaluation study sample, although interviewees also reported patients obtaining improved care. These categories are not mutually exclusive. Many healthcare activities will result in multiple types of impacts. For example, video consults between staff members in rural clinics and specialists in larger hospitals can increase provider efficiency and improve patient care. CCI grantees in the evaluation study sample most commonly reported the following Healthcare Impacts:
Improved healthcare provider productivity and efficiency: Healthcare providers use broadband-enabled technologies to increase the efficiency of internal operations.434 These operations primarily include transferring patient data between facilities, including medical records and radiological images.435 Efficiencies also result from the use of video conferencing between facilities.436 Some healthcare facilities were able to provide the same services with fewer employees or in a shorter time.437
Improved patient care: Healthcare providers use broadband-enabled technologies to increase the health of their patients.438 Across CCI projects, this impact was most often observed after CAI activities allowed healthcare providers to improve existing services.439 The adoption of broadband-enabled technologies also facilitates faster and more convenient access to healthcare. For example, patients are now able to obtain healthcare services closer to home.440
ASR conducted follow-up interviews with grantees participating in the case study sample. Data collected from evaluation study participants during site visits and through follow-up efforts yielded the following insights related to Healthcare impacts:
Improved healthcare provider productivity and efficiency
o Executive Office of the State of West Virginia (West Virginia): The West Virginia state trauma network includes five medical command centers. When a trauma incident occurs, paramedics relay patient information to a doctor at the medical command center. The doctor gives the paramedic directions for stabilizing the patient, including any drugs to administer. The command center also relies on feedback from paramedics to determine where to transport the patient. Before BTOP, these communications traveled on a microwave system. The new network, which is a dual microwave and fiber system, can accommodate more data, which has resulted in faster, clearer communications between command centers and those in the field.441
o OSHEAN: Connection to the network enables the CharterCARE health system to implement new applications, such as teleconferencing, telemedicine, and, in the future, virtual intensive care unit (ICU) services. CharterCARE explained that inpatient volumes are declining, and sharing staff across facilities is a cost-effective response to reduced resource needs. The ability to share pertinent data, such as records and radiology results, among locations facilitates the sharing of staff.442 OSHEAN noted the potential for
73
CharterCARE to realize additional efficiency gains from a network-enabled resiliency solution. CharterCARE operates seventeen applications it deems critical in the event of an onsite disaster. Its Beacon 2.0 network connection enables CharterCARE to host these applications remotely in the Safe Harbor data center, which, OSHEAN notes, will restore ChaterCARE’s critical applications in less than 25 minutes in a disaster environment.443
o OneCommunity: The increased bandwidth provided by OneCommunity supports Magruder Hospital’s electronic medical record (EMR) system. The EMR system helps Magruder Hospital to improve patient safety and timeliness of treatment. The EMR system has improved the functionality of Magruder’s prescription system by reducing the time between the issuing of a prescription and the dispensing of medication from two-and-a-half hours to five minutes. The EMR system includes automated dispensing cabinets that increase the accuracy of prescriptions.444
Improved patient care
o University of Arkansas System (UAS): The Arkansas Stroke Assistance through Virtual Emergency Support (AR SAVES) program provides remote consultations for emergency room (ER) patients exhibiting stroke symptoms. AR SAVES links forty hospitals to neurologists at UAMS and at St. Edward Mercy Medical Center in Fort Smith, twenty-four hours a day. The neurologist can evaluate the patient and determine whether it is safe to administer tPA, a clot-busting drug. Administering the drug as soon as possible minimizes the side effects of stroke. The window of time for administering the drug is often missed when patients at a rural hospital must be transported to a larger facility that is equipped to evaluate stroke victims. AR SAVES reduces the need for transfers and allows patients to receive tPA in a shorter time. As a result, the chances of recovery are significantly improved, as is quality of life post-stroke. While the AR SAVES program operated before the Arkansas e-Link initiative, enhancements to the network and the distribution of teleconference-enabling units among hospitals enabled the AR SAVES program to grow. In fiscal year 2013 alone, 594 patients were seen through AR SAVES and 151 doses of tPA were administered. This accounts for more than a third of all AR SAVES consults and more than 62 percent of tPA doses administered since the program’s inception in 2008.445
o Lane Council of Governments (LCOG): Connections to the grant-funded fiber allow PeaceHealth, a nonprofit healthcare system, to support telehealth initiatives that use mobile video conferencing carts at remote locations. These include interpretive services for non-English speakers and people with disabilities, and tele-stroke applications. For example, the PeaceHealth medical center in Florence, Oregon is piloting a tele-stroke program to provide on-call support and e-consults between doctors at the clinic and neurology specialists. These consultations can decrease the diagnosis time and provide faster access to treatment, which can save lives.446 After the grant period, at least one new clinic planned to pay for a fiber connection to access the services that PeaceHealth provides using the network.447
o UAS: The project enabled a healthcare provider to implement telemedicine practices at twelve of its sixteen sites. Telemedicine activities have significantly increased access to mental and behavioral healthcare for the rural, impoverished region that has had difficulty attracting doctors. Using telemedicine equipment to conduct patient sessions gives doctors more time to see patients, as they do not have to travel. Eliminating the need for patient travel minimizes the number of missed appointments and instances of discontinued care.448 UAS expects to connect more healthcare providers to the network in the future, extending these benefits to a wider population.449
B.3.2 Third-Party Studies City of Chicago (Chicago): The evaluation of Chicago’s project reported that Internet use for
finding health information in the grant’s service area increased by 18 percentage points, compared to 7 percentage points for other Chicago communities.450 The study did not evaluate the extent to which the increase in Internet use for health purposes affected health outcomes.
74
B.4 Government Services
This subsection describes the Government Services impacts of the BTOP projects in the evaluation study sample. This focus area identifies how broadband improves services provided by government organizations to the public and includes both the provision and administration of public safety activities. Examples of public safety agencies include law enforcement agencies, fire departments, and emergency medical services (EMS). Some potential government service impacts include enhanced government efficiency, improved ability to save lives and reduce injuries, prevention of criminal activity, and improved information sharing between citizens and public safety entities.
The evaluation study team gathered data related to focus area impacts from evaluation study participants during site visits. The following subsections present a summary of the social and economic benefits described in case study reports.
B.4.1 Government Services Potential Benefits
Table 31 presents the potential social and economic benefits related to Government Services identified in literature. The evaluation study team analyzed CCI grant activities within the Government Services focus area. PCC and SBA projects were not included in the identification of Government Services impacts.
75
Table 31. Government Services: Potential Social and Economic Benefits
Benefits to Government Agencies
The use of broadband at all levels of government allows government entities to deliver services more efficiently. Intranet systems enable the secure and rapid exchange of information among government agencies. Governments are also able to store and safeguard massive quantities of data. By streamlining in-house operations with the use of broadband-supported tools, governments realize greater internal efficiency and productivity.451
Public safety entities, including police, fire, and emergency medical personnel, can reduce response times and improve the quality of services they provide with the use of broadband-supported applications and equipment.452
Law enforcement, investigative, and intelligence agencies may use broadband for incident prevention. Security and surveillance activities enabled by broadband, such as those that use global positioning system (GPS) technologies, reduce costs, counteract crime and acts of terror, save lives, and avoid injuries.453
Broadband connectivity helps to preserve continuity of government operations in the wake of disasters or epidemics.454
Broadband capabilities reduce the need to travel by providing telework opportunities or online services.455
Benefits to the Public
Broadband improves the relationship between governments and their constituents. Diffusion of online information engages citizens and enhances transparency of government agencies.456
Online tools allow government entities to offer better customer service and support.457 The availability of online government or social services increases accessibility for disabled
citizens.458 Communication supported by broadband allows for greater information sharing between
public safety entities and citizens.459
B.4.2 CCI Government Services Impacts
Table 32 presents the Government Services impacts observed among CCI grants included in the evaluation study sample. For each impact, projects received a checkmark if grantees, partners, CAIs, or other interview subjects reported that impact during case study site visits or follow-up discussions. The most frequent impact reported among CCI grants was improved efficiency and productivity.
76
Table 32. CCI Government Services Impacts in the Evaluation Study Sample
Impact ID
Impact
Clearw
ave
LC
OG
MassT
ech
MB
C
MC
NC
Merit
On
eCo
mm
un
ity
OS
HE
AN
SD
N
UA
S
West V
irgin
ia
Zayo
CCI.G.1 Access to government services and information
CCI.G.2 Improved efficiency and productivity
State and local government agencies received improved connectivity as a result of the CCI projects. The increased bandwidth supported operations and service delivery activities of government administrative offices, courthouses, jails, and public safety agencies. The impacts most often cited by interviewees on site visits include organizational efficiency gains and improved access to government services and information.460 The Government Services impacts most commonly reported by CCI grantees in the evaluation study sample include:
Access to government services and information: Web-based information sharing facilitates the increase of online government services and content. By adopting digital information platforms, government organizations enhance the feasibility of submitting forms and applications, and communicating with agencies, officials, and representatives. Citizens can also use online applications to fill out forms or communicate with public safety agencies.461
Improved efficiency and productivity: Organizations most commonly realized improvements to organizational efficiency as a result of improved communication, web-based information sharing, and resource savings.462 CCI projects increased bandwidth and network redundancy, allowing for the deployment of bandwidth-intensive devices, systems, and applications that streamline daily operations, improving the ability to achieve agency goals or provide services in support of organizational missions. Increased bandwidth also supports the efficient transfer of information and the use of equipment and applications that provide situational awareness critical to ensuring the continuity of services during emergencies.463
ASR conducted follow-up interviews with grantees participating in the case study sample. Data collected from evaluation study participants during site visits and through follow-up efforts yielded the following insights related to Government Services impacts:
Access to government services and information
o South Dakota Network, LLC (SDN): The increased network capacity and direct access at many government facilities has enabled more efficient government services, including Women, Infants, and Children (WIC), Supplemental Nutrition Assistance Program (SNAP), and Temporary Assistance for Needy Families (TANF). It allows the government to offer services consistently across the state, whether residents live in urban or rural areas.464
o OSHEAN: The Emergency Operations Center in Providence, Rhode Island is connected to BTOP-funded fiber. It houses a studio to conduct press conferences with television and radio news channels, helping to ensure that accurate information is released to the public. Media representatives are able to remain within this facility during emergencies to ensure that information is immediately disseminated to the public as it is released.465 After the award period, OSHEAN established Beacon 2.0 connections for two Rhode Island Secretary of State facilities, and noted the agency has since realized drastic improvements in the functionality of its website. While OSHEAN does not currently collect any relevant metrics, it noted that enhanced network connectivity significantly improves state agencies’ ability to provide access to government information and services.466
77
Improved efficiency and productivity
o OneCommunity: Cuyahoga County uses its fiber network and the affordability of service through OneCommunity to provide connectivity to support emergency services, including police headquarters, dispatchers, the Federal Bureau of Investigation (FBI), the Cleveland Regional Transit Authority, and police vehicles. The Cuyahoga Regional Information Services emergency system equips public safety vehicles with computers and license plate scanners, enabling law enforcement officers to access criminal records while on patrol.467
o OSHEAN: The Providence Department of Public Safety’s Emergency Operations Center uses the Beacon 2.0 network to communicate with the Providence Department of Public Works (DPW), which was connected to fiber through the project. Connecting to fiber improved the DPW’s ability to deploy resources. The DPW central office is able to communicate with trucks and vendors in the field in real time, improving awareness of blockages and resources in the field. For example, an internal map analyzes GPS data from trucks and reports the time elapsed since a plow last cleared a particular street. Emergency and rescue services use this information to devise response strategies, such as determining the route a fire truck should take. Real time data sharing was not possible before obtaining the fiber connection.468 Similarly, OSHEAN reported recently establishing a network connection for the Rhode Island Emergency Management Agency (RIEMA). Connecting to the Beacon 2.0 network will enable RIEMA to connect to the state data center, improve communication and sharing with other state agencies on the network, and improve RIEMA’s situational awareness for emergency response.469
o Executive Office of the State of West Virginia (West Virginia): The project expanded the state’s radio network by adding twelve new towers and funding upgrades to the existing tower sites. These additions and upgrades enabled the deployment of a new type of technology for radio communications that is more reliable and easier to manage remotely. Before the grant, if microwave communications were severed, public safety microwave tower sites remained out of service until a tower crew made repairs, taking up to eighteen hours in severe cases. The new grant-funded, IP-based system reroutes traffic during outages, eliminating downtime during repairs. The State Interoperable Radio Network (SIRN) connections enabled more robust, reliable communication during storms. Additionally, each tower site has two dishes for redundancy in case one falls out of alignment. SIRN was relied upon for response efforts following a severe land storm in July 2012 and the after-effects of Hurricane Sandy in October 2012. SIRN representatives reported that the network functioned smoothly through both storms and no tower outages occurred.470 West Virginia did not provide any additional information about SIRN functionality during severe weather in the follow-up interview.471
B.4.3 Third-Party Studies
None of the third-party studies provided to the evaluation study team discussed impacts related to Government Services.
B.5 Quality of Life/Civic Engagement
This subsection describes the Quality of Life/Civic Engagement impacts of the BTOP projects in the evaluation study sample. This focus area includes those activities that create stronger and more integrated communities, and those that promote interaction between citizens and their governments. Measuring the impact of broadband on quality of life has been difficult to achieve in some cases. The Pew Internet and American Life Project and the Monitor Institute noted that several of the indicators for measuring citizens’ sense of how their community information system is performing, and their overall satisfaction with their community, are difficult to measure and assess independently without complicated and expensive methodologies.472 Specific areas noted as difficult to measure, among others, are the availability of quality of life information from community organizations, and effective opportunities for citizens to have their voices heard.473
78
The evaluation study team gathered data related to focus area impacts from grantees in the evaluation study sample during site visits. The following subsections present a summary of the social and economic benefits described in case study reports.
Table 33 presents the potential social and economic benefits related to Quality of Life/Civic Engagement identified in literature and defined in Interim Report 1:
Table 33. Quality of Life/Civic Engagement: Potential Social and Economic Benefits
Improved communication between citizens and government entities474 Lowering the effective cost of civic engagement and community participation475 Increased political engagement and civic participation476 Increased volunteerism477 Improved social connections, especially in rural communities478
Table 34 and Table 35 present the Quality of Life impacts observed among PCC and SBA grants included in the evaluation study sample. For each impact, projects received a checkmark if grantees, partners, or other interview subjects reported that impact during case study site visits or follow-up discussions. PCC and SBA grants realized a similar distribution of Quality of Life impacts.
Table 34. PCC Quality of Life Impacts in the Evaluation Study Sample
Impact ID
Impact
CH
A
DD
L
FA
MU
LV
UL
MS
U
SC
TC
S
TF
A
WF
WV
PCC.Q.1 Obtained legal rights and privileges
PCC.Q.2 Improved social connections
PCC.Q.3 Increased political engagement and civic participation
PCC.Q.4 Increased volunteerism
Table 35. SBA Quality of Life Impacts in the Evaluation Study Sample
Impact ID
Impact
CE
TF
Ch
icago
C.K
. B
land
in
Co
nn
ect A
rkansas
FC
CC
Fu
ture
Gen
eration
s
UA
C
SBA.Q.1 Obtained legal rights and privileges
SBA.Q.2 Improved social connections
SBA.Q.3 Increased political engagement and civicparticipation
SBA.Q.4 Increased volunteerism
Of the potential benefits defined above, the impacts most often cited by interviewees on site visits were increased political engagement, civic participation, and volunteerism. Other impacts included improved social connections and obtaining legal rights and privileges, including citizenship. Other benefits in the table above occurred but were not directly associated with an observed impact. For a complete summary of outcomes and impacts, and the activities that led to them, see Interim
79
Report 2. PCC and SBA grantees in the evaluation study sample most commonly observed the following impacts:
Obtained legal rights and privileges: This included individuals acquiring citizenship, driver’s licenses, or pardons after gaining the digital literacy skills to access government information online.479
Improved social connections: Individuals and communities were able to improve social connections by interacting online, often in a way that was not possible without broadband. This impact was the result of access to computers through computer centers and new online spaces, including community portals.480
Increased political engagement and civic participation: Individuals who experienced this impact most often participated in grant-funded training sessions and workshops that taught them how to create media content to address or to raise awareness of a political or civic issue.481
Increased volunteerism: Individuals who started to volunteer or spent more time volunteering were primarily able to do so after completing required training online. Others became more aware of volunteer opportunities in their communities through the Internet.482
ASR conducted follow-up interviews with grantees participating in the evaluation study sample. Data collected from evaluation study participants during site visits and through follow-up efforts yielded the following insights related to Quality of Life/Civic Engagement impacts:
Obtained legal rights and privileges
o Foundation for California Community Colleges (FCCC): Some students who participated in digital literacy training went on to acquire United States citizenship after applying and studying online.483 FCCC did not provide any additional information regarding digital literacy training participants that acquired citizenship during the follow up interview.484
o Delaware Division of Libraries (DDL): The Advancement through Pardons and Expungement (APEX) program used Job Centers to help patrons complete the pardon and expungement process. As of May 15, 2013, eighteen clients had obtained pardons after receiving help. Obtaining a pardon restores a client’s civil rights, including the right to vote and hold public office.485 DDL continues to support APEX programming at the Job Centers.486
Improved social connections
o C.K. Blandin Foundation (C.K. Blandin): Projects facilitated development of a computer center that makes computers accessible to people with disabilities. According to a staff member, the adaptive equipment, for example virtual keyboards at the computer center, allows users with disabilities to integrate more fully into the general community using online resources.487
o Future Generations Graduate School (Future Generations): A young boy used a computer center to communicate with his brother receiving cancer treatment in a different city. The boy receiving treatment was able to stay in contact with his mother and brother when he was unable to see them for extended periods.488
Increased political engagement and civic participation
o Urban Affairs Coalition (UAC): Through structured training courses, participants learned to create community forums, radio broadcasts, commercials, television shows, and blogs that raise awareness of issues relevant to minorities, immigrants, youth, and the working poor. One group of participants organized the “Fight for Driver’s Licenses” project to address a 2010 amendment to Pennsylvania state law prohibiting individuals from obtaining a driver’s license using a tax identification number. Members of a radio program helped document and collect thousands of testimonials about how this issue affected
80
Pennsylvania residents.489 Training courses are still offered, although the frequency has decreased after the award period.490
o City of Chicago: Individuals who participated in civic engagement training lobbied the Illinois General Assembly using digital tools. Participants engaged legislators by contacting them via online faxing, e-mail, Facebook, and Twitter.491 The grantee did not provide any updated information regarding participants’ use of digital tools to communicate with legislators during the follow up interview.492
Increased volunteerism
o Future Generations: Computer centers facilitated access to required firefighter training courses, reducing the time and effort necessary to participate as a volunteer. Volunteer firefighters stated that access to online training in the computer centers helped to recruit additional volunteers.493 After the award period, BTOP-funded computer labs continue to facilitate volunteer firefighters’ ability to earn or maintain certifications required to serve in the State of West Virginia. More than one-third of the sixty grant-funded computer labs report that volunteer firefighters continue to use the equipment to complete training to earn or maintain required certifications. More than two-thirds of the sixty labs report that, after the award period, the department’s’ volunteer firefighters continue to access the equipment for training or personal use.494
o Cambridge Housing Authority (CHA): Parents who participated in educational training became more engaged in reading with their children and assisting with homework. According to interviewees, parents are actively volunteering in their children’s classrooms and in other community events.495 CHA reported that program instructors continue to observe parent participants volunteering in their children’s classrooms and with other community organizations.496
B.5.1 CCI Quality of Life/Civic Engagement Potential Future Impacts
Many of the CAIs interviewed by the evaluation study team had recently obtained connectivity to new fiber networks, and thus had collected limited data related to Quality of Life/Civic Engagement impacts. Interviewees did report outcomes likely to lead to impacts in the near future. Of these potential benefits, those most often cited by grantees in the evaluation study sample include increased communication between citizens and government entities, increased political engagement, increased civic participation, and improved social connections.497 Projects that achieved similar outcomes, but did not collect quantitative or qualitative data related to impacts, include those described below. These potential impacts are not included in the analysis above and they may or may not occur.
South Dakota Network, LLC (SDN): Madison Public Library staff members are preparing to help patrons understand and sign up for healthcare under the Affordable Care Act (ACA). They also used the connection to obtain training and access webinars on how the ACA will affect libraries and their patrons.498 Library staff members who completed the training program may help patrons apply for healthcare through the ACA. Guidance provided by trained staff members is also likely to improve the effectiveness of patrons’ online communication with government entities.499
Merit Network, Inc. (Merit): Increased bandwidth allows the Houghton Lake Public Library to enhance the programs and services it offers to patrons. For example, it plans to offer another For Kids by Kids project, incorporating videos of students talking about their favorite aspect of the Houghton Lake community. The provision of this service may improve social connections among participants.500
Massachusetts Technology Park (MassTech): DSCI, the service provider for Massachusetts’s voter registration system, plans to use the grant-funded network to provide connectivity to sites in western Massachusetts. The network is expected to help DSCI deliver voter registration services more efficiently.501 Improving voter registration services could help increase political engagement and civic participation in the affected communities.502
81
B.5.2 Third-Party Studies
None of the third-party studies provided to the evaluation study team discussed impacts related to Quality of Life/Civic Engagement.
B.6 Digital Literacy
This subsection describes the Digital Literacy impacts of the BTOP projects in the evaluation study sample. This focus area is fundamental to all the others. “Digital Literacy” defines a set of skills and abilities that enable an individual to interact with the digital aspects of culture, and to maintain a digital identity. In the National Broadband Plan, the FCC defines digital literacy as “the skills needed to use information and communications technology to find, evaluate, create, and communicate information.”503 Digital literacy has become increasingly important in obtaining an education, searching for employment, learning job-related skills, accessing government information, and more.504
The evaluation study team gathered data related to focus area impacts from evaluation study participants during site visits. The following subsections present a summary of the social and economic benefits described in case study reports.
Access to broadband enables users to engage in a wide range of digital literacy activities, generating benefits to individuals, businesses, and communities. Possessing the skills necessary to complete basic digital functions, such as using a computer with a modern operating system, using e-mail, and obtaining information using Internet search tools, enhances an individual’s ability to realize the benefits of broadband connectivity.
Table 36 presents the potential social and economic benefits related to Digital Literacy identified in literature and defined in Interim Report 1:
82
Table 36. Digital Literacy: Potential Social and Economic Benefits
Benefits to Individuals
Increased job opportunities505 Increased employment opportunities due to telework506 Higher pay507 Increased economic security508 Recruitment of job seekers, especially in rural areas509 Increased access to and quality of healthcare510 Availability of a wide variety of entertainment511 Increased participation in everyday economic, social, and community life512 Improved social connections to existing friends and acquaintances and creation of new
relationships based on common interests513 Improved social integration of minority populations514 More positive attitudes toward aging, and higher levels of perceived social support and
connectivity among seniors515 Lower prices for online purchases516 Improved variety of items available for purchase517 Better purchasing decisions based on online information518 Savings in time and money for online vs. paper-based activities519 Improved connectivity for social or political action520 Increased transparency of public agencies521 Access to improved government services522 Lifelong learning opportunities523 Improved family connections524
Benefits to Communities
Attracts business to a community525 Attracts tourists to an area and increases length of stay526
Benefits to Businesses
Offers businesses an advertising and awareness platform527 Offers businesses access to world markets528
Table 37 and Table 38 present the Digital Literacy impacts observed among PCC and SBA grants included in the evaluation study sample. For each impact, projects received a checkmark if grantees, partners, or other interview subjects reported that impact during case study site visits or follow-up discussions. All PCC and SBA grants reported individuals participating in grant-funded programs attaining Digital Literacy benefits identified in the literature.
Table 37. PCC Digital Literacy Impacts in the Evaluation Study Sample
Impact ID
Impact
CH
A
DD
L
FA
MU
LV
UL
MS
U
SC
TC
S
TF
A
WF
WV
PCC.D.1 Improved social connections
PCC.D.2 General benefits to individuals
83
Table 38. SBA Digital Literacy Impacts in the Evaluation Study Sample
Impact ID
Impact
CE
TF
Ch
icago
C.K
. B
land
in
Co
nn
ect A
rkansas
FC
CC
Fu
ture
Gen
eration
s
UA
C
SBA.D.1 Improved social connections
SBA.D.2 General benefits to individuals
Potential social and economic benefits of improved digital literacy accrue across all of the focus areas, as digital literacy is foundational to the use of broadband. The most commonly observed impacts resulting from the acquisition of digital literacy skills include participants obtaining a job or a promotion. Grantees also reported instances of digital literacy skills improving social connections and enabling lifelong learning opportunities for trainees. PCC and SBA grantees in the evaluation study sample most commonly observed the following Digital Literacy impacts:
Improved social connections: Digital literacy skills enabled users to realize improved social connections. These connections include relationships with family and friends, minority social integration, and senior social participation. Learning to use a computer and a broadband connection enabled participants to communicate with friends and family via e-mail and social media sites.529
Benefits to individuals: While all PCC and SBA projects in the evaluation study sample offered some form of digital literacy training, few had mechanisms in place to measure the benefits realized by participants.530 As outlined in Table 36, research has shown that the acquisition of digital literacy skills can lead to a wide variety of positive social and economic impacts for individuals.
ASR conducted follow-up interviews with grantees participating in the evaluation study sample. Data collected from evaluation study participants during site visits and through follow-up efforts yielded the following insights related to Digital Literacy impacts:
Improved social connections
o Cambridge Housing Authority (CHA): Participants learned to use the Internet to connect to their families, to their communities, to their native countries, and to information about their interests and goals, including reading online news or job searching. Students learned to use the Internet to save money communicating with relatives, which is of particular importance to students, as many are speaking with those in their native countries via telephone.531 CHA reported that computer lab users continue to connect with family and friends, although they do not collect data related to the number of patrons engaging in this activity or the amount of money they may have saved.532
o Foundation for California Community Colleges (FCCC): After completing digital literacy training, many trainees turned to web-based tools as their primary means of maintaining social connections. According to student trainers, most of the trainees continued to use their Skype or social media accounts after training. Trainers also reported similar impacts regarding Gmail accounts, which trainees established during training.533 During a follow-up interview, FCCC stated that this was the most common outcome of digital literacy training and the most significant driver for home broadband adoption.534
General benefits to individuals
o Technology For All (TFA): Computer centers helped individuals transition to more permanent housing. Staff used the grant-funded computers to train patrons in personal financial management skills and to search for housing. TFA staff reported that, since 2010,
84
more than 1,000 people had found permanent housing using grant-funded equipment and services.535
o C.K. Blandin Foundation (C.K. Blandin): Project partners reported that students in the digital literacy training sessions were able to continue their education successfully after completing the class. For example, two students who were struggling in community college attended a digital literacy class, and were then able to go back to school and complete their classes. These students graduated in spring 2013 with associate degrees.536 The grantee reported that the Minnesota Department of Employment and Economic Development’s online digital literacy training was still in use after the grant period.537
o Foundation for California Community Colleges (FCCC): FCCC used leftover funding to launch a pilot program with partner CLEAR that distributed 880 Mobile Citizen 4G hotspots. The hotspots were primarily distributed among former California Connects participants, including digital literacy trainees and community college students. The pilot program provided three months of free wireless broadband service. FCCC stated that participants in the pilot reported using the broadband service to maintain social relationships, perform academic research, apply for jobs, and purchase health insurance coverage on the government-run Health Insurance Marketplace.538
B.6.1 CCI Digital Literacy Impacts
Table 39 presents the Digital Literacy impacts observed among CCI grants included in the evaluation study sample. For each impact, projects received a checkmark if grantees, partners, CAIs, or other interview subjects reported that impact during case study site visits or follow-up discussions. Among CCI grants in the evaluation study sample, MCNC and West Virginia observed impacts related to Digital Literacy.
Table 39. CCI Digital Literacy Impacts in the Evaluation Study Sample
Impact ID
Impact
Clearw
ave
LC
OG
MassT
ech
MB
C
MC
NC
Merit
On
eCo
mm
un
ity
OS
HE
AN
SD
N
UA
S
West V
irgin
ia
Zayo
CCI.D.1 Increased participation
CCI.D.2 Access to entertainment
CCI.D.3 General benefits to individuals
Potential social and economic benefits of improved digital literacy accrue across all of the focus areas, as digital literacy is foundational to the use of broadband. The most commonly observed impacts resulting from the acquisition of digital literacy skills and broadband access include participants engaging in economic, social, and community life, and accessing a variety of entertainment. Although broadband access and digital literacy skills allow for the realization of numerous benefits, interviewees had limited data related to digital literacy impacts. Impacts most commonly reported by CCI grantees in the evaluation study sample include:
Increased participation in everyday economic, social, and community life: Training participants use digital literacy skills and broadband access to interact with peers, family members, and their communities via e-mail, social media, and other interactive platforms.539
Access to entertainment: Digital literacy skills and a reliable broadband connection enable users to access a wide variety of entertainment.540
85
General benefits to individuals: Although some of the CAIs interviewed offered digital literacy training or resources, few had mechanisms in place to measure the benefits realized by participants. In addition to the impacts described above, interviewees reported outcomes that had not yet directly resulted in impacts, but likely will lead to impacts in the near future.541
ASR conducted follow-up interviews with grantees participating in the evaluation study sample. Data collected from evaluation study participants during site visits and through follow-up efforts yielded the following insights related to Digital Literacy impacts:
Increased participation in everyday economic, social, and community life
o MCNC: Digital literacy initiatives in higher education focus on providing access rather than training. This is largely accomplished by the provision of public computer labs and wireless networks. College representatives remarked that a great deal of traffic on these networks is related to personal use, including social media, e-mail, and entertainment. Nearly all reported an upward trend in wireless network utilization, which they attributed to the increasing popularity of mobile devices. Connecting to the NCREN has allowed these institutions to obtain greater bandwidth to accommodate increased levels of traffic that they may not have been able to afford otherwise. This is particularly true for colleges in rural areas where Internet providers are scarce.542
Access to entertainment
o Executive Office of the State of West Virginia (West Virginia): Improved library connections have led to an expansion of services. Both libraries the evaluation study team visited are members of the West Virginia Digital Entertainment Library Initiative, a consortium of ten libraries that share digital materials for circulation. Each library invested $10,000 worth of content, totaling 35,000 items available for checkout. Bridgeport Public Library (BPL) has doubled the number of online research databases and added Zinio, an online magazine subscription service, and Freegal, a free music download service. Kanawha County Public Library (KCPL) also purchased a license for Freegal that was implemented in October 2013. Bandwidth constraints existing before the grant-funded upgrade would have limited the use of these services.543
General benefits to individuals
o MCNC: Lee County Schools (LCS) has emphasized digital literacy development among instructional staff since the deployment of its one-to-one laptop program. Teachers completed fourteen hours of staff training. Teachers are also required to participate in monthly technology training.544
o West Virginia: BPL and the KCPL offer one-on-one training ranging from device usage, including iPad, Kindle, and Nook, to software usage, such as Microsoft Word, Excel, and Publisher. BPL stated that its wireless network has improved significantly because of the grant and it is considering purchasing laptops to hold group training sessions.545
B.6.2 Third-Party Studies Foundation for California Community Colleges (FCCC): FCCC completed an evaluation
study of its CLEAR Mobile Citizen pilot program. The study sought to answer whether the pilot was successful in stimulating broadband subscriptions and, if so, what price subscribers would be willing to pay. The study found that the majority of pilot participants became broadband subscribers after the three-month program period.546 The study also determined that pilot participants would be willing to pay an average maximum price of $15 per month for broadband service. The cost of broadband service for Mobile Citizen hotspots is $15 per month.547
City of Chicago (Chicago): Project evaluators found that the increase in residential broadband adoption between 2008 and 2013 in the grant’s service area exceeded that in the rest of Chicago by 9 percentage points.548 Although the BTOP award period had not begun as of the first wave of data, the study found that the impact on broadband adoption could be attributed to increases between 2011 and 2013, by which time grant programming had been deployed. The
86
study also found that using the Internet to obtain transportation information increased by 11 percentage points more in the service area compared to other Chicago neighborhoods, suggesting time savings and more efficient planning for transit riders.
Connect Arkansas:
o Connect Arkansas continued its state resident survey efforts to capture trends in broadband adoption decisions. Survey responses collected in 2013 indicate that 80 percent of Arkansans use the Internet in some capacity, an increase of 2 percentage points from 2012 and 4 percentage points higher than 2011.549 The survey found that factors such as education, income, and age continue to drive disparities in broadband adoption decisions. In 2013, there was a difference between respondents with less than a high school education who access broadband at home and respondents with a college education of 56 percentage points. A gap of 42 percentage points exists between those who earn less than $25,000 annually and those who earn more than $100,000. Survey results also suggest a gap of 26 percentage points between those in the eighteen to thirty-four age bracket and those older than sixty-five. 550 Thirty-five percent of respondents cite relevance as the reason they do not use the Internet, which is consistent with results from 2012.551
o Connect Arkansas hired a third party to implement a second instance of the Computers 4 Kids follow-up participant survey. Survey results indicate that course satisfaction levels remain above 90 percent, and that 96 percent of the 300 respondents believe the instructor provided the information necessary to independently operate a refurbished computer.552 Results also suggest that after learning the educational benefits of broadband, obtaining basic digital literacy skills, and a free computer, the majority of participants subscribed to broadband service at home.553 The most recent iteration of the survey found that 65 percent of respondents now subscribe to service at home, an increase of 3 percentage points since the first implementation of the survey.554
87
Appendix C. Quantitative Intermediate-Term Impacts
C.1 Introduction
Intermediate-term impacts are economic or social impacts that were observed during the study period within the geographic area designated for the case study sample of grants. This study distinguishes between short-term effects, which are primarily due to expenditures on inputs, and intermediate-term effects, which are caused by the outputs of the projects.
The evaluation study team examined the benefits described in Section 3.1 and reviewed methods to quantify the impacts observed for the evaluation study sample and extrapolate the results to BTOP as a whole. This section includes the most meaningful of these quantifications and extrapolations.
C.2 Obtained Employment (Impact ID: PCC.W.1)
Kuhn and Mansour (2013) estimated that unemployment durations are 24 percent shorter for Internet job searchers than offline job searchers.555 PCC grantees offer patrons the opportunity to search for jobs online on their own (during open lab time) and during job-search-related training programs. ASR used Kuhn and Mansour’s findings to estimate the impact of shortened unemployment durations for PCC patrons. The total unemployment reduction (given in weeks) for all PCC grants is given by:
total reduction in unemployment duration (weeks) = ∑ new Internet job searchers due to PCC grant × average unemployment duration (weeks) × 0.237
Grantees reported average weekly users across all locations in PPRs.556 Benefits accrue only to users of certain location categories. The 2011 and 2012 CAC datasets contain average weekly users for included PCC locations.557 ASR used CAC data to determine the grant-wide percentage of users that visit applicable PCC locations.558 ASR multiplied the grant-wide percentage of users of applicable locations by the PPR average weekly users data to estimate the average number of users of applicable sites for each quarter.
Weekly user figures are not representative of unique users, as an individual may visit a PCC multiple times. A 2010 study on public computer use at U.S. public libraries surveyed users to determine the frequency at which they used library computers.559 Becker et al. (2010) reported that 23 percent of users of library computers used a library computer “every day or most days,” 24 percent used “at least once a week,” 20 percent used “about one to three times a month,” 20 percent used “several times a year,” and 13 percent used “about once a year.”560 ASR assumed that these user groups visited daily, weekly, monthly, quarterly, and yearly (five times per week, once per week, once per month, once per quarter, and once per year, respectively). Under this framework, the number of unique users is the sum of daily, weekly, monthly, quarterly, and yearly users. Total users is given by:
By substituting user groups for the percentages listed above, unique users is given by:
unique users = total users ÷ (75.61 × years)
ASR used this formula with the average number of users of applicable sites for each quarter derived from PPR and CAC data. ASR first calculated the total number of applicable users per quarter by multiplying the weekly applicable users by thirteen. Next, ASR aggregated the quarter applicable users total to the grant applicable users total. ASR then estimated total unique users by dividing the grant total by 75.61 times the number of years from the first PPR with user data to the last PPR with user data. The number of years was determined individually for each grant.
Not every unique PCC user can be assumed to be an unemployed Internet job searcher. To estimate the portion of unique PCC users who are unemployed, ASR assumes that both the labor force participation rate and unemployment rate of a particular grant’s unique users equals that of the grant’s service area population. For PCC grants in the evaluation study sample, ASR used the grantee-approved service areas defined in Interim Report 1.561 ASR approximated the service areas for all other PCC grantees by using CAC location data.562 Each PCC location in CAC was geocoded to determine the county in which it is located. A PCC grantee’s service area is composed of all counties where a location was reported in CAC.563
ASR used Bureau of Labor Statistics (BLS) Local Area Unemployment Statistics (LAUS) in order to calculate both the labor force participation rate and unemployment rate for each PCC grant’s service area.564 ASR assumes that all unemployed PCC users previously searched for a job offline only and, as a result of PCC grants, now search for employment online. ASR used the following calculation to estimate new unemployed Internet job searchers among each PCC grant’s unique users:
new Internet job searchers among PCC weekly users = unique PCC users × labor force participation rate × unemployment rate
In addition to weekly PCC users, some PCC grantees provided job-search-specific training. PCC grantees reported cumulative training participants in quarterly PPRs. ASR manually reviewed all reported PCC trainings in order to identify those specific to job search. Training titles and descriptions were reviewed to identify those that mentioned online employment search skills and resources. ASR assumes that each participant of a job-search training is an unemployed job searcher who, as a result of the PCC training, begins to search for employment online. ASR assumed that job-search training attendees are unique. Attendees were added to the new Internet job searchers calculated from weekly PCC users above to estimate a PCC grant’s total number of new Internet job searchers:
new Internet job searchers due to PCC grant = new Internet job searchers among PCC weekly users + PCC job-search training attendees
After estimating the number of new Internet job searchers resulting from a PCC grant, the evaluation study team used state-level unemployment duration data published by the United States Department of Labor (DOL) to estimate the decrease in unemployment duration.565 ASR uses the average unemployment duration in a state to characterize the length of spells of unemployment for individuals in PCC service areas within that state. The estimated total decrease in time spent unemployed as a result of a PCC grant is calculated with the equation:
89
reduction in unemployment duration due to PCC grant (weeks) = new Internet job searchers due to PCC grant × average unemployment duration (weeks) × 0.237
This figure is summed over all PCC grants in order to estimate the total decrease in unemployment as a result of PCC grants.
Table 40 below presents the estimated totals of new Internet job searchers as a result of PCC average weekly users and job-search training attendees, and the decrease in time spent unemployed due to PCC grants. PCC average weekly users and job-search training attendees’ data were retrieved from PPRs.566 The evaluation study PCC grants aided nearly 9,000 unemployed job searchers with the skills and facilities to conduct online employment searches. Across all of BTOP, PCC grants facilitated online job searching for nearly 60,000 individuals. These activities resulted in reduction in unemployment duration of more than 330,000 weeks.
Table 40. Total Estimated New Internet Job Searchers and Decreased Unemployment Duration (Weeks) Due to PCC Grants
Measure Estimate
New Internet job searchers 59,792
Decreased duration 331,796
To estimate the economic benefit of decreased unemployment durations due to PCC grants, the evaluation study team multiplied a grant’s projected total decrease in unemployment duration by the full-time minimum weekly wage in the grant’s respective service area. ASR used state-level and national minimum wages published by the DOL to determine service-area minimum wages.567 ASR used the following calculation to estimate each grant’s dollar impact of decreased unemployment duration and sum these figures across all PCC grants, estimating the total dollar value across BTOP:
total benefit of decreased unemployment duration due to PCC grants = ∑ reduction in unemployment duration due to PCC grant (weeks) × (minimum wage × 40)
PCC grants in the evaluation study sample generated an estimated $17 million of additional wages due to decreased unemployment duration. Across all of BTOP, the reduction in unemployment duration resulted in an estimated $94 million of additional wages for service area residents.
C.3 Started or Grew Businesses (Impact ID: PCC.W.2)
PCC grantees noted that users and training participants engaged in entrepreneurial activities.568 In 2010, 7 percent of public-access computer users at public libraries across the United States engaged in “activities related to starting or managing a business of their own.”569 Additionally, 3.3 percent started a business using the library computers and 3.5 percent looked for new customers.570 Nearly half of those who looked for new customers, 1.7 percent of all users, grew their businesses.571
The evaluation study team estimated the number of users and training attendees who engaged in entrepreneurial activities, started a new business, looked for new customers, and grew their businesses according to the figures above. This requires the assumption that the rates reported above for libraries across the United States are representative of usage patterns at applicable PCC locations and among training program participants. The number of PCC users and training attendees who engaged in entrepreneurial activities is estimated by:
90
engaged in entrepreneurial activities through PCC grant = (unique PCC users × 0.07) + PCC entrepreneurial training attendees
This figure is summed over all PCC grants in order to estimate the total number of individuals engaged in entrepreneurial activities through PCC grants.
Table 41 presents the estimated totals of unique PCC users, entrepreneurship training attendees, and estimated individuals engaging in an entrepreneurial activity through a PCC grant. ASR estimated the number of unique PCC users using the same methodology described in Appendix C.2 above. ASR retrieved PCC users and entrepreneurship training attendee data from PPRs.572
Table 41. Total Estimated Number of Individuals Engaged in Any Entrepreneurial Activity through PCC Grants
Estimate Total
Unique users 746,698
Entrepreneurship trainees 1,186
Engaged in entrepreneurial activities 53,455
Based on the estimates of the number engaged in entrepreneurial activities, ASR estimated the number starting a business, the number looking for new customers, and the number who grew their businesses by applying the Becker et al. (2010) figures to the estimated number of users engaged in entrepreneurial activities.573 Table 42 below presents the estimated number of users and training attendees engaged in these different types of entrepreneurial activities.
Table 42. Total Estimated Number Engaged in Different Entrepreneurial Activities Due to PCC Grants
Estimate Total
Started a business 25,200
Looked for new customers 26,727
Grew their business 12,982
C.4 Obtained Employment (Impact ID: SBA.W.1)
Kuhn and Mansour (2013) estimated that unemployment durations are 24 percent shorter for Internet job searchers than offline job searchers.574 SBA grantees offer job-search-related training opportunities. In addition, SBA grantees create new home broadband subscriptions, enabling new Internet job searching in the home. ASR used Kuhn and Mansour’s findings to estimate the impact of shortened unemployment durations for SBA training attendees and new subscribers. The total unemployment reduction (given in weeks) as a result of all SBA grants is given by:
total reduction in unemployment duration (weeks) = ∑ new Internet job searchers due to SBA grant × average unemployment duration (weeks) × 0.237
ASR assumes that all SBA job-search-related training participants are unique and are new Internet job searchers. SBA grantees report cumulative training participants in quarterly PPRs.575 ASR identified job-search-related SBA training activities reported in the most recent PPR for each grantee. Training titles and descriptions were reviewed to identify those that mentioned online employment search skills and resources. Each participant of a job-search-related training is assumed to start searching for employment using the Internet because of the training.
91
In addition to training participants, SBA grantees report the cumulative number of new households subscribing to the Internet as a result of grant activities.576 Not every SBA household member can be assumed to be an unemployed Internet job searcher. To estimate new Internet job searchers from subscribing households, ASR uses the average household size, the labor force participation rate, and the unemployment rate for the grant service area to describe new household subscribers.
To carry out the assumptions above, service areas were determined for every BTOP SBA grant. ASR used the grantee-approved service areas defined in Interim Report 1 for SBA grants in the evaluation study sample.577 ASR estimated the service areas for all SBA grantees not in the evaluation study using CAC data.578 Each SBA program location in CAC was geocoded to determine the county in which it is located. An SBA grantee’s service area is composed of all counties where a location was reported in the CAC.579
ASR used Census Bureau data for average household size and BLS LAUS for both the labor force participation rate and unemployment rate in an SBA grant’s service area.580 ASR assumes that all new subscribers that were unemployed previously searched for jobs offline only and, as a result of SBA grants, now search for employment online. ASR uses the following calculation to estimate each SBA grant’s total new Internet job searchers:
new Internet job searchers due to SBA grant = (new households subscribing due to SBA grant × average household size × labor force participation rate × unemployment rate) + SBA job-search training attendees
After estimating the number of new Internet job searchers resulting from an SBA grant, the evaluation study team used state-level unemployment duration data published by DOL to estimate the decrease in unemployment duration.581 ASR uses the average unemployment duration in a state to characterize the length of spells of unemployment for individuals in SBA service areas within that state. ASR estimated the annual total decrease in time spent unemployed as a result of an SBA grant using the equation below:
reduction in unemployment duration due to SBA grant (weeks) = new Internet job searchers due to SBA grant × average unemployment duration (weeks) × 0.237
This figure is summed over all SBA grants in order to estimate the annual total decrease in unemployment duration as a result of SBA grants.
Table 43 below presents the estimated totals of new Internet job searchers as a result of new household subscribers and job-search training attendees, and the decrease in time spent unemployed due to SBA grants. New household subscribers and job-search training attendees’ data were retrieved from PPRs.582 The evaluation study SBA grants aided more than 50,000 unemployed job searchers with the skills or access to conduct online employment searches. Across all of BTOP, SBA grants facilitated online job searching for more than 100,000 individuals. These activities resulted in reduction in unemployment duration of more than 600,000 weeks.
Table 43. Total Estimated New Internet Job Searchers and Decreased Unemployment Duration (Weeks) Due to SBA Grants
Measure Estimate
New Internet job searchers 104,259
Decreased duration 626,980
To estimate the economic benefit of decreased unemployment durations due to SBA grants, the evaluation study team multiplied a grant’s projected total decrease in unemployment duration by the full-time minimum weekly wage in the grant’s respective service area. ASR used state-level and
92
national minimum wages published by the DOL to determine service-area minimum wages.583 ASR used the following calculation to estimate each grant’s dollar impact of decreased unemployment duration and sum these figures across all SBA grants, estimating the total dollar value across BTOP:
total benefit of decreased unemployment duration due to SBA grants = ∑ total reduction in unemployment duration (weeks) × (minimum wage × 40)
SBA grants in the evaluation study sample generated an estimated $94 million of additional wages due to decreased unemployment duration. Across all of BTOP, the reduction in unemployment duration resulted in an estimated $190 million of additional wages for service area residents.
C.5 Started or Grew Businesses (Impact ID: SBA.W.2)
SBA grantees noted that training participants engaged in entrepreneurial activities.584 Becker et al. (2010) found that 7 percent of public-access computer users at public libraries across the United States engaged in “activities related to starting or managing a business of their own.”585 Additionally, 3.3 percent started a business using the library computers and 3.5 percent looked for new customers.586 Nearly half of those who looked for new customers, 1.7 percent, grew their business.587
The evaluation study team used entrepreneurial training attendance data reported by grantees as the number of people engaged in entrepreneurial activities due to SBA grants. The team then applied the figures reported by Becker et al. (2010) to estimate the total number of training program participants starting a business, looking for new customers, and growing their business.588 This requires the assumption that the rates reported above for libraries across the United States are identical to those for SBA training program attendees.
Table 44 below presents the estimated number of training attendees engaged in different types of entrepreneurial activities. ASR retrieved SBA entrepreneurship training data from PPRs.589
Table 44. Total Estimated Number Engaged in Different Entrepreneurial Activities Due to SBA Grants
Estimate Total
Engaged in entrepreneurial activities(entrepreneurship training attendees)
1,342
Started a business 633
Looked for new customers 671
Grew their business 326
C.5.1 (SBA.W.2) Business Productivity Gains
Grimes, Ren, and Stevens (2009) estimated that broadband adoption by a firm increases the firm’s productivity by 7.6 percent to 13 percent.590 SBA grantees report the cumulative number of new business broadband subscriptions due to grant activities in quarterly PPRs.591 ASR uses the following equation to estimate the economic benefits resulting from productivity gains realized by new business broadband subscriptions due to SBA grants:
economic value of productivity gains due to SBA grants = years of new business broadband subscriptions due to SBA grants × business size × 0.076
93
ASR calculated the number of years of subscription due to an SBA grant by multiplying the quarterly number of subscribers by the years from the end of the reporting quarter through the end of 2013. The total years of business subscriptions resulting from an SBA grant is calculated using the following, where the quarterly figure for each active quarter of the grant is summed:
years of new business broadband subscriptions due to SBA grant = ∑ new business broadband subscriptions resulting from SBA grant in the quarter × years until December 31, 2013
This figure is summed over all SBA grants in order to estimate the total years of new business broadband subscriptions due to SBA grants.
Table 45 presents the total numbers of new business broadband subscribers and the years of service they receive due to SBA grants. SBA grants in the evaluation study sample generated more than 3,000 years of new business subscriptions by the end of 2013. Across all of BTOP, SBA grantees were responsible for an estimated 14,714 years of new business Internet subscription by the end of 2013.
Table 45. Total New Business Subscribers and Years of Business Subscriptions Due to SBA Grants
Measure Total
Business subscribers 6,484
Years of business subscriptions 14,714
For the purposes of this analysis, ASR assumed that new business broadband subscribers due to SBA grants qualify as small business entities according to the Small Business Administration (SBA). A report written for the SBA Office of Advocacy notes that the majority of small business entities in the United States are nonfarm sole proprietorships with average annual receipts of $56,416.592 ASR assumes all new business broadband subscribers due to SBA to be this size, and estimates the economic benefit generated by SBA grants due to new business broadband subscriptions with the equation below:
economic value of productivity gains due to SBA grants = years of new business broadband subscriptions due to SBA grants × $56,416 × 0.076
SBA grants in the evaluation study generated an estimated $13 million in benefits due to productivity gains realized by new business broadband subscriptions generated by SBA grant activities. Across all of BTOP, SBA grants generated an estimated $63 million in economic benefit.
94
Appendix D. Long-Term Quantitative Analysis Methodology and Data This section describes ASR’s methodology for estimating the long-term social and economic impacts of selected CCI case study grants. This analysis uses publicly available data sources related to broadband availability to project the impacts expected because of BTOP CCI grants. Collectively, the case study site visits and statistical analyses provide information on changes in the social and economic conditions that could be expected in the communities in which grant activities occurred.
As described in the Study Design, an effective and well-established way to develop estimates of the effects of programs such as BTOP is the use of matched pairs analysis. ASR has developed a matched pairs analysis framework that compares changes in the availability of broadband at the county level between counties served by a selected BTOP CCI grant (treatment counties) and similar counties (control counties). By examining the differences in availability across a large number of treatment-control pairs, it is possible to develop an estimate of the increase in broadband availability, if any, in treatment counties that can be ascribed to BTOP. In other words, the matched pairs analysis provides a means to examine what might have occurred “but for” the BTOP program.
The National Broadband Map (NBM) measures broadband availability. The NBM shows the level of service offered by all participating broadband Internet Service Providers (ISP) at a particular point in time.593 At NTIA’s request, the NBM team provided ASR with block-level broadband coverage for the June 30, 2011 and June 30, 2013 NBM releases.594 These data were provided for two definitions of broadband: wireline or fixed wireless Internet service offering download rates of at least 3 Mbps and upload rates of 768 kbps; and wireline or fixed wireless Internet service offering download rates of at least 768 kbps and upload rates of at least 200 kbps. The data enumerate the number of individuals with broadband service available to them on June 30, 2011 and on June 30, 2013 for every census block in the United States.
D.1 Identifying Counties Receiving Broadband Due to BTOP CCI Projects
The analysis presented here is based on measured levels of broadband availability in the counties served by the twelve CCI grants included in the evaluation study, as selected by NTIA at the beginning of the project. ASR examined redacted grant applications, APRs, PPRs, grant fact sheets, and grantee-specific materials to develop a preliminary service area description for each of the twelve projects in the evaluation study sample in order to identify the proposed geographic location served by each of the grants in the sample. Each service area description was provided to grantees, who made changes to the list based on the actual results of the project. The confirmed list of counties is included in each of the twelve CCI case study reports. Table 46 lists selected evaluation study CCI grants, the counties included in each grant’s service area (including counties added due to the presence of CAIs), the total number of counties in each grant’s service area, and the total land area, population, and population without broadband availability of each grant’s service area.595 Total number of counties, land area, population, and population without availability for the evaluation study sample as a whole are also included.
95
Table 46. Characteristics of Selected BTOP CCI Grants and Service Area Counties
Allen, Bartholomew, Dearborn, Delaware, Elkhart, Fayette, Grant, Howard, Jefferson, Kosciusko, Lake, LaPorte, Madison, Monroe, Porter, Sullivan, Vanderburgh, White Added due to connected CAI:Gibson, Johnson, Marion, Tippecanoe, Wabash
23 9,703 3,653,508 89,868
Total 408 260,861 31,961,430 2,708,290
98
D.2 Selecting Control Counties
In order to measure how much of the growth in availability within these counties occurred as a result of BTOP, ASR compared availability growth to that of counties that did not receive BTOP funding. Each county in the treatment group, shown in Table 46, requires a control county for comparison. These control counties should be similar to the treatment counties in order to provide a baseline against which to judge the impact on availability of the BTOP projects. Table 47 shows the steps taken to arrive at the population of potential control counties. Each step is also described below.
ASR began the search for control counties with the complete list of counties and county equivalents in the United States, excluding Alaska and Hawaii. ASR then researched the proposed service area counties of every submitted application for BTOP CCI grants using the Broadband Application Database.597 ASR primarily drew from the Executive Summaries and Public Notice Responses components of the database. In cases where the service area was unclear, the team searched for other sources of publicly available data. The result was a list of 469 counties in the contiguous United States that had not been included in a BTOP application. In order to account for potential differences between applicants and non-applicants, counties that had not been mentioned in an application were removed from the population of potential control counties, leaving 2,640 counties.
The second step in the control county selection process was to remove those counties that had applied for and received a BTOP or Broadband Initiatives Program (BIP) grant. These counties would not be suitable controls because of BTOP-sponsored activity that would be expected to take place. As shown in Table 47, 1,749 counties were rejected for this reason. Counties were identified as having benefited from a BTOP or BIP grant if they were mentioned in an application that received an award, or if a CAI or point of presence (POP) in the CAC was located within their borders.598 The result of applying this filter was the identification of 884 counties that could be potential control counties.
Table 47. Potential Control Counties in the United States
All counties and equivalents in the United States 3,234
Less counties in Alaska, Hawaii, and outlying areas 3,109
Less counties not in proposed BTOP service area 2,640
Less counties in awarded BTOP or BIP grant service area599 884 Potential Controls
Each county in the treatment group must be matched to a control county that is similar in its broadband-relevant characteristics. Following Gillett et al. (2006), the evaluation study team used nearest neighbor matching to develop the control group for the matched pairs samples of counties.600 This method finds a similar county for each geographic area that received BTOP funding. The following variables were used to match treatment and control counties:
Broadband Availability: Broadband is wireline or fixed wireless Internet service that is capable of providing certain download and upload speed thresholds. Based on direction from NTIA, ASR used speed thresholds of 3 Mbps downstream and 768 kbps upstream as the baseline for this analysis.601 The data provided by the NBM team allow ASR to calculate the broadband availability rate as the ratio of the population with broadband availability to the total population, for any geographic area comprising one or more census blocks.
Population: The data provided by the FCC include census block populations.602 The evaluation study team aggregated these data to calculate the total county population.
99
Rurality: Rural areas are more likely to have lower levels of broadband availability, all other things being equal.603 The NBM data include a block-level urban/rural flag.604 The evaluation study team calculated the county-level rural population percentage as the sum of the populations of rural blocks in a county divided by the sum of the populations of all blocks in the county. A substantial number of counties are completely rural, with the other counties exhibiting a distribution of rurality values centered near 50 percent. Figure 11 illustrates the distribution of the percentage of population in a county living in a rural area, computed as the population-weighted average of census block-level rurality statistics.605
Figure 11. Distribution of Rural Percentage of Population in Treatment and Potential Control Counties
ASR matched treatment counties to controls on the values of broadband availability, natural logarithm of population, rural percentage of population, and a rural county binary variable using restricted nearest neighbor matching.606 Matches were subject to the following restrictions:
1. Completely rural counties match only to completely rural counties, and counties with a rural population less than 100 percent match only to counties with a rural population less than 100 percent.
2. Broadband availability in the selected control county must be within 1 percentage point of broadband availability in the treatment county. If no matches are possible, this restriction loosens by a factor of 1.1 (e.g., 1 percentage point, 1.1 percentage points, 1.21 percentage points, and so on) until a match is found.
3. The value of the log of population of the treatment county must be within one-half of a standard deviation of the log of population of the value of the treatment county.607
D.3 Developing Sensitivity Analysis Control Groups
In order to test the sensitivity of the results presented above to methodological assumptions and data issues, ASR developed additional sets of control counties based on alternative assumptions and definitions:
Broadband Definition: As described above, ASR developed county-level measures of broadband availability based on census block-level data from the NBM and defining broadband
100
to be wireline or fixed wireless Internet service offering download rates of at least 3 Mbps and upload rates of at least 768 kbps. ASR also estimated the effect of BTOP and projected long-term benefits according to the definition of broadband delineated in the Notice of Funds Availability (NOFA): wireline or fixed wireless Internet service of 768 kbps or higher downstream and 200 kbps or higher upstream.608 Throughout the remainder of this document, these definitions will be referred to as the “NTIA definition” and “NOFA definition” of broadband, respectively. Uses of the terms “NTIA broadband” and “NOFA broadband” refer to Internet services that meet the respective definitions.
Matching Criteria: The matching criteria used above are based on characteristics of the counties served by BTOP grants. According to the Economics and Statistics Administration (ESA) and NTIA, certain vulnerable populations are less likely to have adopted broadband, or are more likely to benefit from it.609 Based on the NOFA and a review of the broadband literature, the evaluation study team identified four measures of vulnerable populations as discussed in Interim Report 1: those in poverty, individuals sixty-five years of age or older, minorities, and those who speak languages other than English in the home.610 In order to examine the sensitivity of the effects of BTOP and the projected long-term benefits to the matching specification, the evaluation study team performed a second round of matching. ASR used demographic information about vulnerable populations in the calculations of similarity between treatment and control counties. The evaluation study team used the following county-level measurements of these vulnerable populations: percentage of the population in poverty, percentage of population sixty years of age and older, minority percentage of population, and percentage of population that speak languages other than English in the home.611 The FCC NBM team provided census block-level data on the population over sixty years old, the minority population, and the population in poverty.612 ASR uses data from the American Community Survey 2006-2010 for estimates of the percentage of population speaking a language other than English.613
Availability Rates: An analysis of the data provided to the evaluation study team showed that some census blocks or counties show a decrease in broadband availability based on both the NOFA and NTIA definitions of broadband. Table 48 summarizes the census blocks, populated census blocks, and counties in the contiguous United States in which the broadband availability rate decreased from the June 30, 2011 release to the June 30, 2013 release.614 Under the NOFA definition, 1.5 percent of census blocks (2.7 percent of populated census blocks) and 55 percent of counties show decreases in the availability rate. Under the NTIA definition, 2.1 percent of census blocks (3.8 percent of populated census blocks) and 45 percent of counties show decreases in the availability rate.
Table 48. Census Blocks and Counties with Reported Decreases in the Broadband Availability Rate over the Study Period
Description Census Blocks Populated Blocks Counties
N % N % N %
Total 11,007,989 100.00% 6,166,982 100.00% 3,109 100.00%
NO
FA
Decrease in availability rate 166,657 1.51% 166,657 2.70% 1,695 54.52%
There are several possible explanations for decreases in the availability rate:
Population may have increased faster (or decreased more slowly) in census blocks without broadband availability than in areas with broadband availability
The physical infrastructure that carried broadband no longer functions
There is physical infrastructure to carry broadband service, but no provider to offer it
Availability was either incorrectly reported for this area in the June 30, 2011 release or not reported in the June 30, 2013 release
ASR cannot definitively state which of the above is the case for any of the census blocks where a decrease in the availability rate was reported. Therefore, the evaluation study team developed two data adjustments. ASR applied the adjustments at the census block level. Each adjustment applies to only one release, altering the data in blocks with observed decreases so that there is no change in availability. The adjustments are as follows:
Forward looking: When the availability rate in a census block is higher in 2011 than in 2013, the 2011 availability rate is lowered to equal that of 2013.
Backward looking: When the availability rate in a census block is lower in 2013 than in 2011, the 2013 availability rate is raised to equal that of 2011.
Both of these adjustments reduce the number of census blocks with decreasing availability rates to zero. However, the adjustments do not eliminate all decreases in the broadband availability rate at the county level, because population shifts could still result in compositional changes that cause reduced availability. Table 49 reports the number and percentage of the 3,109 counties in the contiguous United States by decreases in the broadband availability rate according to unadjusted and adjusted census block data. The two adjustment procedures lower the percentage of counties with decreases in the broadband availability rate from 55 and 45 percent for the NOFA and NTIA definitions, respectively, to about 3 to 4 percent.
Table 49. Counties with Reported Decreases in the Broadband Availability Rate over the Study Period
ASR’s methodology for matching treatment counties to control counties for sensitivity analysis was the same nearest neighbor matching algorithm described above. Matches are divided into two groups:
1. Primary: matches based on values of broadband availability, population, and rurality
2. Sensitivity: matches based on values of broadband availability, population, rurality, and vulnerable populations
102
Since values of the availability rate depend on the definition of broadband, ASR performs primary and sensitivity matches using data on two different definitions of broadband:
1. NOFA: broadband means providing two-way data transmission with advertised speeds of at least 768 kilobits per second (kbps) downstream and at least 200 kbps upstream to end users, or providing sufficient capacity in a middle mile project to support the provision of broadband service to end users.615
2. NTIA: at least 3 Mbps downstream and 768 kbps upstream
Matches were also performed for the base, forward looking, and backward looking methods of handling broadband availability. The matches for the base and backward looking methodologies are the same by construction. Table 50 summarizes the matching results for treatment and control counties. ASR performed twelve rounds of matching in total, with base and backward looking results consolidated, as they produce identical matches.
Table 50. Descriptive Statistics of Matching Variables
Characteristic Statistic
Base and Backward Looking Forward Looking
TreatmentPrimaryControl
SensitivityControl
TreatmentPrimary Control
SensitivityControl
NO
FA
Availability Mean 90.22% 90.26% 90.23% 85.67% 85.79% 85.77%
Median 94.56% 94.71% 94.33% 90.03% 90.29% 90.06%
Rurality Mean 60.25% 59.73% 60.47% 60.25% 60.25% 60.84%
Median 61.10% 60.96% 62.39% 61.10% 61.69% 63.36%
Minority Mean 16.36% 15.58% 16.36% 15.22%
Median 9.62% 8.84% 9.62% 8.97%
Over 60 Years Old
Mean 25.92% 25.39% 25.92% 25.46%
Median 25.50% 24.81% 25.50% 24.63%
Poverty Mean 17.79% 17.07% 17.79% 17.11%
Median 17.28% 16.31% 17.28% 16.25%
Non-English Mean 1.95% 2.03% 1.95% 2.12%
Median 1.22% 1.43% 1.22% 1.46%
NT
IA
Availability Mean 73.17% 73.10% 73.10% 68.49% 68.53% 68.52%
Median 82.85% 82.79% 82.88% 77.19% 77.72% 77.16%
Rurality Mean 60.25% 61.46% 62.16% 60.25% 60.88% 62.80%
Median 61.10% 65.27% 66.08% 61.10% 61.01% 64.16%
Minority Mean 16.36% 15.59% 16.36% 16.06%
Median 9.62% 10.90% 9.62% 10.12%
Over 60 Years Old
Mean 25.92% 25.26% 25.92% 25.19%
Median 25.50% 24.44% 25.50% 24.37%
Poverty Mean 17.79% 16.87% 17.79% 17.23%
Median 17.28% 16.18% 17.28% 16.41%
Non-English Mean 1.95% 2.09% 1.95% 2.05%
Median 1.22% 1.46% 1.22% 1.33%
103
Figure 12 summarizes the number of different control counties identified for each treatment county for each definition of broadband. Since there are four rounds of matching for each definition, a treatment county can be matched to anywhere from one to four different control counties. The figures illustrate the matches’ high sensitivity to the specification used. For the NOFA and NTIA definitions, only 1.5 percent and 6.4 percent of the treatment counties, respectively, are matched to the same control county for all four specifications. More than two-thirds are matched to three or four different controls under each definition.
Figure 12. Number of Different Control Counties Selected for Treatment Counties
D.5 Difference-in-Differences Estimates
The effect of BTOP on broadband availability in a treatment county, as described above, is the difference between the increase in broadband availability in the treatment county and the increase in broadband availability in its matched control county. This calculation is referred to as the difference-in-differences method. The difference-in-differences method can be used on any group of one or more treatment counties. To estimate the programmatic effect of BTOP, ASR uses the difference-in-differences method on the entire 408 county evaluation study sample. Formally, this is given by:
Programmatic Effect on Availability = (availability rate in evaluation study sample, June 30, 2013 –
availability rate in evaluation study sample, June 30, 2011) – (availability rate in all matched counties, June 30, 2013 –
availability rate in all matched counties, June 30, 2011)
The availability rate in the evaluation study sample is the sum of the populations with broadband availability of all census blocks in the 408 county evaluation study sample divided by the sum of the total populations of all census blocks in the sample. The availability rate in all matched counties is the sum of all blocks’ broadband populations divided by the sum of all total populations for the selected control counties. Table 51 presents the availability rates, differences, and difference-in-differences for the matched pair groups.
104
Table 51. Availability Rates, Differences, and Difference-in-Differences for Matched Pair Groups
Definition Match Group Release AvailabilityForward Looking
BackwardLooking
NOFA
Primary
Treatment
2011 96.71% 95.25% 96.71%
2013 96.53% 96.53% 97.98%
Difference -0.18% 1.28% 1.26%
Control
2011 96.79% 95.51% 96.79%
2013 96.06% 96.55% 97.87%
Difference -0.73% 1.04% 1.08%
Difference-in-Differences 0.55% 0.24% 0.18%
Sensitivity
Treatment
2011 96.71% 95.25% 96.71%
2013 96.53% 96.53% 97.98%
Difference -0.18% 1.28% 1.26%
Control
2011 96.50% 95.14% 96.50%
2013 95.92% 96.29% 97.68%
Difference -0.57% 1.15% 1.18%
Difference-in-Differences 0.39% 0.13% 0.08%
NTIA
Primary
Treatment
2011 91.53% 89.72% 91.53%
2013 94.40% 94.40% 96.19%
Difference 2.87% 4.68% 4.66%
Control
2011 92.28% 90.57% 92.28%
2013 93.16% 93.41% 95.62%
Difference 0.88% 2.84% 3.34%
Difference-in-Differences 2.00% 1.84% 1.32%
Sensitivity
Treatment
2011 91.53% 89.72% 91.53%
2013 94.40% 94.40% 96.19%
Difference 2.87% 4.68% 4.66%
Control
2011 91.77% 89.53% 91.77%
2013 92.75% 92.48% 95.39%
Difference 0.98% 2.95% 3.62%
Difference-in-Differences 1.89% 1.73% 1.04%
ASR estimated the total individuals that gain broadband availability due to BTOP by multiplying the difference-in-differences estimate for the sample group of counties (the 408 case study grant service area counties) by the total populations of the sample counties, the service area counties of grants outside of the sample, and the total population served by BTOP. Table 52 presents the estimated total populations in the case study service areas, the service areas of other CCI grants,
105
and the service areas of all CCI grants that received broadband availability due to BTOP for the twelve treatment effect scenarios.
Table 52. Estimated Total Population with Broadband Availability Due to BTOP
Definition Match Type Grants AvailabilityForward Looking
BackwardLooking
NOFA
Primary
Evaluation Study Sample 176,402 78,944 58,873
Rest of BTOP 1,009,800 451,906 337,014
All BTOP 1,186,202 530,850 395,887
Sensitivity
Evaluation Study Sample 126,713 42,423 27,306
Rest of BTOP 725,358 242,845 156,311
All BTOP 852,071 285,268 183,617
NTIA
Primary
Evaluation Study Sample 645,510 594,469 428,691
Rest of BTOP 3,695,167 3,402,993 2,454,009
All BTOP 4,340,677 3,997,462 2,882,700
Sensitivity
Evaluation Study Sample 612,576 559,618 336,942
Rest of BTOP 3,506,641 3,203,486 1,928,799
All BTOP 4,119,217 3,763,104 2,265,742
D.6 Developing Confidence Intervals
ASR examined the precision of the difference-in-differences estimate shown above through resampling the 408 matched treatment-to-control pairs. Resampling was performed by making 408 random selections from the matched pairs results for the counties in the sample. An individual pair can be selected more than once or not at all. The difference-in-differences estimator is then estimated for this randomly selected group. This is repeated many times, yielding many values for the effect. ASR uses these values to calculate a confidence interval for each effect. A wide confidence interval indicates that the effect is sensitive to the inclusion or exclusion of particular matched pairs, while a narrow confidence interval is evidence that the effect is more robust across matched pairs of counties.
Figure 13 summarizes the results of the resampling method with 1,000 replications for the base case: the effect of BTOP on the NTIA definition of broadband using primary matching results and the unadjusted availability data. The results were used to calculate a 95 percent confidence interval. Figure 13 shows the distribution of the replications, the estimated effect, and upper and lower confidence values. The estimated BTOP effect in the base case is 2.00 percent with a 95 percent confidence interval of 1.15 percent to 2.78 percent. None of the replications resulted in a BTOP effect of zero or less.
106
Figure 13. Resampled Effect and Confidence Bands for NTIA Broadband Availability
Figure 14 presents confidence bands for the baseline estimate of the BTOP effect and corresponding sensitivity analysis estimates. While all of the estimates are positive, the lower confidence limits for the primary backward looking, sensitivity forward looking, and sensitivity backward looking estimates for the NOFA definition of broadband are negative. The difference between the lowest and highest estimates of the effect of BTOP on NOFA broadband is 0.47 percentage points, compared to a difference of 1.07 percentage points between the lowest lower confidence limit (-0.16 percent) and the highest upper confidence limit (0.91 percent). For the NTIA definition of broadband, all estimates and all lower confidence limits are positive, providing evidence of a positive effect of BTOP on NTIA broadband availability using the base specification.
Figure 14. Comparison of Estimated Effects with Confidence Intervals
107
As shown in Figure 14, the estimated effect of the BTOP program on residential availability depends most heavily on the definition of broadband used during the estimation process, and then on the data management methodology used to address apparent decreases in broadband availability. Matching criteria and results do not appear to play a large role in the overall estimate of the effects of BTOP infrastructure investment. Table 53 displays the numeric values for the estimated level of broadband availability change and the lower and upper 95 percent confidence limits for each of the sensitivity analysis cases.
Table 53. Difference-in-Differences Estimates and Lower and Upper Confidence Values for Matched Pair Groups
The matched pairs methodology described above draws on the methodology presented in ASR’s Study Design prepared in 2011.616 As part of the study design, ASR conducted a review of the current literature surrounding the social and economic impacts of broadband technologies. ASR reviewed more than 500 articles in academic literature, technical publications, and other sources. Two years have passed since the conclusion of those efforts, and additional research continues to be published. In order to maintain an up-to-date source of literature, ASR conducted a review of new literature. The review focused on comparing the current methodologies in measuring the longitudinal impacts of broadband technologies with those used in leading research. As a result of this review, sources have been added to support broadband benefits found in the first review.
From this literature review, ASR determined which of the identified benefits can be quantified using the estimates in the relevant literature. These benefits fall in the focus areas of Workforce and Economic Development, Healthcare, and Digital Literacy. Table 54 includes the list of benefits that ASR considered as potentially quantifiable and candidates for longitudinal analysis.
Table 54. Quantified Broadband Benefits
Source Benefit
Workforce and Economic Development
Crandall, Lehr, and Litan (2007)617
A 1 percentage point increase in broadband availability in a state will increase employment by 0.2 to 0.3 percent per year.
Kolko (2010)618 A one‐standard‐deviation change in broadband availability corresponds to a 0.085 standard deviation change in employment.
Czernich et al. (2011)619 The introduction of broadband increases GDP per capita 2.7 to 3.9 percent.
108
Source Benefit
A.T. Kearney (2011)620 An estimated increase in wages of $111 per month exists for workers who upgrade Information and Communications Technology (ICT) skills.
Kuhn and Mansour (2013)621
Internet searchers’ unemployment durations are about 25 percent shorter than comparable workers who search offline only.
Gillett et al. (2006)622 The introduction of any broadband to a ZIP Code (from no broadband to at least 1 broadband line) increases the employment growth rate by 1.4 percent.
Grimes (2009)623 Broadband adoption by a firm boosts firm productivity by 7 to 10 percent.
LECG Ltd (2009)624 An increase of 1 broadband line per 100 individuals will increase productivity by 0.1 percent.
Dolton and Pelkonen (2007)625
Workers with ICT skills have an estimated wage premium of 3 to 10 percent.
Matthews and Williams (2005)626
The ability to telecommute saves an average of one hour of commute time per employee.
Goss and Phillips (2002)627
Internet users were paid approximately 14 percent more than nonusers in 2001.
DiMaggio and Bonikowski (2010)628
Individuals who use the Internet at home and work make $1.40 more per hour than non-users. Individuals who use the Internet at work but not at home make $0.88 more than non-users. Finally, individuals who use the Internet at home but not at work make $0.52 more than non-users.
Healthcare
Connected Nation (2008)629
By accessing health information online, 35 percent of new broadband users save an estimated $217 per year on healthcare expenditures.
Digital Impact Group and Econsult Corporation (2010)630
Increased Internet use by obese persons to obtain health information results in 61 percent of them changing lifestyle habits that save $1,500 per person in healthcare services.
Baker, Rideout, Gertler, and Raube (2005)631
Doctors who see patients online rather than in the office can save an average of $1.71 per patient per month.
Klersy et al. (2011)632 Remote monitoring programs reduce the incidence rate for all hospitalizations of heart disease patients from 1.051 per patient per year to 0.894.
Ford and Ford (2009)633 Spending time online can reduce depression by 20 percent for senior citizens.
Young et al. (2011)634 Tele-ICU coverage was associated with a reduction in ICU length of stay of 1.26 days.
Digital Literacy
PriceWaterhouseCoopers (2009)635
Online shopping has the potential to offer an estimated savings of 557 UK pounds per year with respect to time, travel, and other costs, when compared to traditional shopping.
109
Source Benefit
A.T. Kearney (2011)636 E-mail, instant messaging, and other Internet connectivity tools allowed for an average monthly saving of 57 Australian dollars (corresponds to $59 US) per household on local and international calls.
SQW Consulting (2008)637 Broadband enables users to search and compare products online, which could result in a weekly saving of £14.60 ($23.23) per household.
The Allen Consulting Group (2010)638
Households with an Internet connection benefit approximately $150 (Australian) per week by saving time through remote work/education, information resources, and online shopping.
ASR examined the feasibility of performing quantitative extrapolations of BTOP benefits using the estimate shown in Table 54, above. The largest and most robust estimates, especially those corroborated by more than one study, are presented in the body of this report.
D.8 Long-Term Impact of BTOP CCI Infrastructure on GDP
The largest long-term social or economic impact due to BTOP infrastructure spending is the increase in GDP in the areas served by the new broadband infrastructure. ASR used two studies, Czernich et al. (2011) and LECG Ltd. (2009), to extrapolate the increase in economic output that could be expected in counties receiving BTOP-funded infrastructure. Table 55 presents estimates of increased GDP for each of the twelve sensitivity analysis samples described above. For the base case of a 2.00 percent increase in broadband availability, BTOP infrastructure spending could be expected to yield $5.7 to $21.0 billion in increased output using results from Czernich et al. (2011) and LECG Ltd. (2009) as the bases for extrapolation, respectively. By definition, these are changes in the level of GDP, so any economic benefit due to increased GDP would occur each year. Other sets of assumptions produce correspondingly different levels of output increase due to BTOP infrastructure spending.
110
Table 55. Extrapolated Total Benefit from Increased Output Due to BTOP (Annual, Million USD)
Study Grants Match TypeAvailability
Forward Looking
Backward Looking
NOFA NTIA NOFA NTIA NOFA NTIA
Czernich et al. (2011)
Evaluation Study Sample
Primary 206 755 92 695 69 501
Sensitivity 148 717 50 655 32 394
Rest of BTOPPrimary 1,340 4,903 600 4,516 447 3,256
Sensitivity 963 4,653 322 4,251 207 2,559
All BTOP Primary 1,546 5,659 692 5,211 516 3,758
Sensitivity 1,111 5,370 372 4,906 239 2,954
LECG Ltd. (2009)
Evaluation Study Sample
Primary 764 2,797 342 2,576 255 1,857
Sensitivity 549 2,654 184 2,425 118 1,460
Rest of BTOPPrimary 4,963 18,161 2,221 16,725 1,656 12,061
Sensitivity 3,565 17,234 1,194 15,744 768 9,479
All BTOP Primary 5,727 20,957 2,563 19,300 1,911 13,918
Sensitivity 4,114 19,888 1,377 18,169 887 10,939
Czernich et al. (2011) estimated the introduction of broadband availability in twenty Organisation for Economic Co-operation and Development (OECD) countries increased GDP by 2.7 to 3.9 percent.639 Using this estimate, census blocks with no broadband availability that later received availability would experience an increase in GDP. If 1 percent of the population in a county resided in such census blocks, county GDP could be expected to increase by 0.027 percent.640
LECG Ltd. (2009) estimated that a 1 percentage point increase in broadband availability raised productivity by 0.1 percent in countries with medium to high levels of information and communications technology.641
For both of these studies, the increase in GDP due to the increase in broadband availability attributable to BTOP is given by:
increase in GDP due to BTOP = programmatic BTOP effect on availability × study coefficient × ∑ Gross County Products for BTOP counties
The evaluation study team used 2011 county-level decompositions of Gross State Product (GSP) to extrapolate the effects of BTOP on output.642 ASR applied the estimated programmatic effects of BTOP on availability and the study coefficients to extrapolate the benefits of BTOP. ASR made extrapolations for BTOP counties in the evaluation study sample and for all BTOP counties.
D.9 Long-Term Impact of BTOP CCI Infrastructure on Employment
Increased GDP is typically associated with increased levels of employment. Kolko (2010) and Gillett et al. (2006) provide a basis for estimating the long-term increase in employment due to BTOP-funded infrastructure spending.
111
Kolko (2010) estimated that one standard deviation increase in broadband availability in ZIP Code Tabulation Areas (ZCTA) across the United States increased employment by 0.085 standard deviations.643 Based on this estimate, the extrapolated increase in employment in a county is given by:
increase in employment in county due to BTOP = [(programmatic BTOP effect on availability ÷ standard deviation of availability growth) × 0.085 × standard deviation of employment growth] × employment
Table 56 presents estimates for the total increase in employment according to the results of Kolko (2010). Based on Kolko’s estimates, the additional broadband infrastructure provided by BTOP could be expected to create 22,949 long-term jobs.
Table 56. Extrapolated Total Increase in Employment Due to BTOP
Study Grants Match Type
Availability Forward Looking
Backward Looking
NOFA NTIA NOFA NTIA NOFA NTIA
Kolko (2010)
Evaluation Study Sample
Primary 1,804 3,386 815 3,686 759 2,754
Sensitivity 1,296 3,213 438 3,470 352 2,164
Rest of BTOP Primary 10,423 19,563 4,707 21,298 4,385 15,911
Gillett et al. (2006) estimated the introduction of broadband availability (0 percent availability to more than 0 percent availability) in ZIP Codes across the United States increased the employment growth rate by 1.44 percent over a four-year period.644 This is equivalent to a 0.359 percent annual employment growth rate. Simplifying this, a 1 percentage point increase in broadband availability in a county increases the employment growth rate by 0.00359 percent. The extrapolated increase in employment in a county according to the results of Gillett et al. (2006) is given by:
annual increase in employment in county due to BTOP = programmatic BTOP effect on availability × 0.00359 × employment
Table 57 presents estimates for the annual increase in employment according to the results of Gillett et al. (2006). Results from Gillett et al. (2006) suggest at least 6,941 long-term jobs are created in one year due to infrastructure spending. If growth were to continue at the same rate over a four-year timeframe, as was the found to be in the case in the Gillett et al. (2006) study, the total number of jobs created would be approximately 27,913 with annual compounding. This extrapolation is similar to that found for the results in Kolko (2010).
112
Table 57. Extrapolated One-Year Increase in Employment Due to BTOP
Study Grants Match Type
Availability Forward Looking
BackwardLooking
NOFA NTIA NOFA NTIA NOFA NTIA
Gillett et al. (2006)
Evaluation Study Sample
Primary 280 1,024 125 943 93 680
Sensitivity 201 972 67 888 43 535
Rest of BTOPPrimary 1,617 5,917 724 5,449 540 3,929
Sensitivity 1,161 5,615 389 5,130 250 3,088
All BTOP Primary 1,897 6,941 849 6,392 633 4,610
Sensitivity 1,362 6,587 456 6,017 294 3,623
After extrapolating the increase in employment, the evaluation study team extrapolated the economic benefit of BTOP in a county due to increased employment using the following formula:
economic benefit of increased employment in county due to BTOP = increase in employment in county due to BTOP × average annual wage
The evaluation study team used employment data published by BLS to extrapolate increases in employment.645 ASR estimated the standard deviations of availability growth and employment growth as the standard deviations of the changes from June 30, 2011 to June 30, 2013 and 2011 to 2012, respectively, for all available counties in the United States. ASR applied the estimated effects of BTOP on availability and the study coefficients to extrapolate the county-level increases in employment due to BTOP. Totals for the evaluation study sample, grants not in the study sample, and all grants are aggregations of individual county extrapolations.
ASR multiplied county-level increases in employment due to BTOP by county-level average annual wage data published by BLS to extrapolate additional household income due to BTOP.646 Table 58 presents extrapolated economic benefits based on the total increase in employment suggested by Kolko (2010).
Table 58. Extrapolated Total Increase in Income Due to Total Increase in Employment (Annual, Million USD)
Study Grants Match Type
Availability Forward Looking
BackwardLooking
NOFA NTIA NOFA NTIA NOFA NTIA
Kolko (2010)
Evaluation Study Sample
Primary 75 141 34 154 32 115
Sensitivity 54 134 18 145 15 90
Rest of BTOPPrimary 502 942 227 1,026 211 766
Sensitivity 361 894 122 966 98 602
All BTOP Primary 577 1,084 261 1,180 243 881
Sensitivity 415 1,028 140 1,111 113 693
For the base case, additional employment could be expected to generate $1.1 billion in additional household income based on the results of Kolko (2010). By definition, this is a change in the level of income, so any economic benefit would reoccur each year.
113
Table 59 presents extrapolated economic benefits based on the annual increase in employment suggested by Gillett et al. (2006).
Table 59. Extrapolated Total Benefit Due to One-Year Increase in Employment (Million USD)
Study Grants Match Type
AvailabilityForward Looking
BackwardLooking
NOFA NTIA NOFA NTIA NOFA NTIA
Gillett et al. (2006)
Evaluation Study Sample
Primary 12 43 5 39 4 28
Sensitivity 8 41 3 37 2 22
Rest of BTOPPrimary 78 285 35 263 26 189
Sensitivity 56 271 19 247 12 149
All BTOP Primary 90 328 40 302 30 218
Sensitivity 64 311 22 284 14 171
For the base case, each year of increased employment could be expected to generate at least $328 million in additional household income per year. This increase in income would recur each year. Also, if growth were continue over a longer timeframe, each year of growth could be expected to increase income by an additional $328 million, not including increases due to compounding growth rates. If growth were to continue over a four-year period, the overall increase in yearly income in the areas with newly available broadband service could be expected to be approximately $1.3 billion per year at the end of the fourth year. This is similar to the estimate based on the work of Kolko (2010), above.
D.10 Value to New Subscribers
The Allen Consulting Group (2010) finds the value of broadband Internet access to the average American household is about 3.4 percent of average household income.647 Table 60 below presents projected economic benefits using the BTOP effects estimated above. For the base case, the estimated annual value of broadband to new subscribers is approximately $2.6 billion.
Table 60. Extrapolated Total Increased Value to Consumers Due to BTOP (Annual, Million USD)
Grants Match Type
Availability Forward Looking
Backward Looking
NOFA NTIA NOFA NTIA NOFA NTIA
Evaluation Study Sample
Primary 95 347 48 363 32 230
Sensitivity 68 329 26 341 15 181
Rest of BTOP Primary 628 2,298 315 2,373 210 1,526
Sensitivity 451 2,181 169 2,234 97 1,200
All BTOP Primary 723 2,645 363 2,735 241 1,757
Sensitivity 519 2,510 195 2,575 112 1,381
ASR extrapolated the economic benefit in a county based on new household broadband subscriptions due to BTOP using the following formula:
114
increased value to consumers in county due to BTOP = (programmatic BTOP effect on availability × rate of adoption for households with availability × households) × average household income × 0.034
ASR calculated the rate of adoption for households with availability using the June 30, 2011 household broadband adoption levels published by the FCC and household availability rates included in the NBM.648 The FCC publishes adoption levels as ranges; ASR used the midpoint of the published range. Using these data, the household adoption rate is given by:
rate of adoption for households with availability = household adoption level midpoint ÷ household availability rate
The rate of adoption for households with availability is capped at 100 percent. ASR obtained household count data from the NBM and used data published by the Census Bureau, including household adoption rates and household income measures, to extrapolate the increased value to consumers due to BTOP.649
115
Notes
1 National Telecommunications and Information Administration, “BTOP Evaluation Study,” Program Reports, 2013, http://www2.ntia.doc.gov/BTOP-Reports#evaluation.
2 National Telecommunications and Information Administration, “Statement of Work for Broadband Technology Opportunities Program (BTOP) Evaluation Study,” July 26, 2010, http://www2.ntia.doc.gov/files/btop_sow.pdf.
3 National Telecommunications and Information Administration, “Statement of Work for Broadband Technology Opportunities Program (BTOP) Evaluation Study.”
4 ASR Analytics, BTOP Evaluation Study Design (Potomac, MD, January 30, 2012), http://www.ntia.doc.gov/files/ntia/publications/study_design_order_number_d10pd18645_-_revised_2012-01-30.pdf.
5 National Telecommunications and Information Administration, “About,” BroadbandUSA: Connecting America’s Communities (Washington, DC, June 11, 2012), http://www2.ntia.doc.gov/about.
6 National Telecommunications and Information Administration, “About.”
7 NTIA requested that ASR exclude public safety grants from this evaluation study. These figures exclude seven public safety grants and nine terminated, declined, withdrawn, or otherwise defunded grants. Excluded public safety grants represent $519 million in additional total budget ($382 million federal plus $137 million matching). Defunded grants represent $235 in additional total budget ($183 million federal plus $53 million matching).
National Telecommunications and Information Administration, “Post-Award Monitoring Database,” April 11, 2014.
8 National Telecommunications and Information Administration, Broadband Technology Opportunities Program (BTOP) Quarterly Program Status Report, February 12, 2014, http://www.ntia.doc.gov/files/ntia/publications/ntia_btop_19th_quarterly_report.pdf.
9 National Telecommunications and Information Administration, “Post-Award Monitoring Database.”
10 National Telecommunications and Information Administration, Broadband Technology Opportunities Program (BTOP) Quarterly Program Status Report, May 2014, http://www.ntia.doc.gov/files/ntia/publications/ntia_btop_20th_qtrly_report.pdf.
11 National Telecommunications and Information Administration, Broadband Technology Opportunities Program (BTOP) Quarterly Program Status Report, February 12, 2014.
12 National Telecommunications and Information Administration, Broadband Technology Opportunities Program (BTOP) Quarterly Program Status Report, May 2014.
13 National Telecommunications and Information Administration, “Post-Award Monitoring Database.”
14 National Telecommunications and Information Administration, “Post-Award Monitoring Database.”
15 Section 5 contains additional sustainability information for each project in the evaluation study sample.
116
16 National Telecommunications and Information Administration, Broadband Technology Opportunities Program (BTOP) Quarterly Program Status Report, February 12, 2014.
17 National Telecommunications and Information Administration, “Post-Award Monitoring Database.”
18 Section 5 contains additional sustainability information for each project in the evaluation study sample.
19 Section 5 contains additional sustainability information for each project in the evaluation study sample.
20 These impacts are not necessarily additive.
21 Nina Czernich et al., “Broadband Infrastructure and Economic Growth,” The Economic Journal 121, no. 552 (May 12, 2011): 505–532, doi:10.1111/j.1468-0297.2011.02420.x.
LECG Ltd., Economic Impact of Broadband: An Empirical Study (London, UK, February 22, 2009), http://www.connectivityscorecard.org/images/uploads/media/Report_BroadbandStudy_LECG_March6.pdf.
22 See Appendix D for a detailed explanation of this calculation.
23 Jed Kolko, Broadband and Local Growth, August 21, 2010, http://ssrn.com/abstract=1680597.
Sharon E. Gillett et al., Measuring Broadband’s Economic Impact, National Technical Assistance, Training, Research, and Evaluation Project #99-07-13829 (Washington, DC: United States Department of Commerce, February 28, 2006), http://cfp.mit.edu/publications/CFP_Papers/Measuring_bb_econ_impact-final.pdf.
24 See Appendix D for a detailed explanation of this calculation.
25 See Appendix D for a detailed explanation of this calculation.
The Allen Consulting Group, Quantifying the Possible Economic Gains of Getting More Australian Households Online, November 2010, 25, http://www.acilallen.com.au/cms_files/acgquantifyingonline2010.pdf.
26 See Appendix D for a detailed explanation of this calculation.
27 See Appendix D for a detailed explanation of this calculation.
28 See Appendix D for a detailed explanation of this calculation.
29 Peter Kuhn and Hani Mansour, “Is Internet Job Search Still Ineffective?,” Forthcoming in The Economic Journal (December 2013), doi:10.1111/ecoj.12119.
30 See Appendix D for a detailed explanation of this calculation.
Kuhn and Mansour, “Is Internet Job Search Still Ineffective?”.
31 See Section 2 for a detailed explanation of this calculation
32 National Telecommunications and Information Administration, “Statement of Work for Broadband Technology Opportunities Program (BTOP) Evaluation Study.”
33 Robert K Yin, Case Study Research: Design and Methods, 4th ed. (Los Angeles, CA: SAGE Publications, 2009).
34 Yin, Case Study Research: Design and Methods.
Kathleen M. Eisenhardt, “Building Theories from Case Study Research,” The Academy of Management Review 14, no. 4 (1989): 532–550.
117
35 For more detail about specific grant contexts, please see individual case study reports and Interim Report 2.
36 National Telecommunications and Information Administration, “Statement of Work for Broadband Technology Opportunities Program (BTOP) Evaluation Study.”
37 This report uses six focus areas to classify impacts observed in the evaluation study sample. Section 3.1 provides definitions of the focus areas.
38 Representative of Cambridge Housing Authority, “Telephone Interview,” April 29, 2014.
39 ASR Analytics, Cambridge Housing Authority Public Computer Center Round 2, Broadband Technology Opportunities Program Evaluation Study (Order Number D10PD18645) (Potomac, MD, July 10, 2013).
40 National Telecommunications and Information Administration, “Post-Award Monitoring Database.”
41 Representatives of the Delaware Division of Libraries, “Telephone Interview,” April 30, 2014.
42 ASR Analytics, Delaware Department of State (Delaware Division of Libraries) Public Computer Center Round 2, Broadband Technology Opportunities Program Evaluation Study (Order Number D10PD18645) (Potomac, MD, December 19, 2013).
43 National Telecommunications and Information Administration, “Post-Award Monitoring Database.”
44 Representatives of Florida Agricultural and Mechanical University, “Telephone Interview,” May 01, 2014.
45 ASR Analytics, Florida Agricultural and Mechanical University Public Computer Center Round 2, Broadband Technology Opportunities Program Evaluation Study (Order Number D10PD18645) (Potomac, MD, September 13, 2013).
46 National Telecommunications and Information Administration, “Post-Award Monitoring Database.”
47 Representatives of Florida Agricultural and Mechanical University, “Telephone Interview.”
48 Representatives of Las Vegas Urban League, “Telephone Interview,” April 28, 2014.
49 ASR Analytics, Las Vegas-Clark County Urban League Public Computer Center Round 2, Broadband Technology Opportunities Program Evaluation Study (Order Number D10PD18645) (Potomac, MD, August 01, 2013).
50 National Telecommunications and Information Administration, “Post-Award Monitoring Database.”
51 Representative of Michigan State University, “E-Mail Communication,” April 30, 2014.
52 ASR Analytics, Michigan State University Public Computer Center Round 2, Broadband Technology Opportunities Program Evaluation Study (Order Number D10PD18645) (Potomac, MD, August 29, 2013).
53 National Telecommunications and Information Administration, “Post-Award Monitoring Database.”
54 Representatives of South Carolina Technical College System, “Telephone Interview,” April 30, 2014.
118
55 ASR Analytics, South Carolina State Board for Technical and Comprehensive Education Public Computer Center Round 2, Broadband Technology Opportunities Program Evaluation Study (Order Number D10PD18645) (Potomac, MD, September 11, 2013).
56 National Telecommunications and Information Administration, “Post-Award Monitoring Database.”
57 Representatives of Technology For All, “Telephone Interview,” April 29, 2014.
58 ASR Analytics, Technology For All, Inc. Public Computer Center Round 2, Broadband Technology Opportunities Program Evaluation Study (Order Number D10PD18645) (Potomac, MD, September 16, 2013).
59 National Telecommunications and Information Administration, “Post-Award Monitoring Database.”
60 Representatives of WorkForce West Virginia, “Telephone Interview,” April 30, 2014.
61 ASR Analytics, WorkForce West Virginia Public Computer Center Round 2, Broadband Technology Opportunities Program Evaluation Study (Order Number D10PD18645) (Potomac, MD, September 23, 2013).
62 National Telecommunications and Information Administration, “Post-Award Monitoring Database.”
63 Representatives of C.K. Blandin Foundation, “Telephone Interview,” April 29, 2014. Representatives of C.K. Blandin Foundation, “Telephone Interview.”
64 ASR Analytics, C.K. Blandin Foundation Sustainable Broadband Adoption Round 2, Broadband Technology Opportunities Program Evaluation Study (Order Number D10PD18645) (Potomac, MD, August 15, 2013).
65 National Telecommunications and Information Administration, “Post-Award Monitoring Database.”
66 National Telecommunications and Information Administration, “Post-Award Monitoring Database.”
67 ASR Analytics, California Emerging Technology Fund Sustainable Broadband Adoption Round 2, Broadband Technology Opportunities Program Evaluation Study (Order Number D10PD18645) (Potomac, MD, September 09, 2013).
68 National Telecommunications and Information Administration, “Post-Award Monitoring Database.”
69 National Telecommunications and Information Administration, “Post-Award Monitoring Database.”
70 ASR Analytics, Smart Chicago Sustainable Broadband Adoption Round 2, Broadband Technology Opportunities Program Evaluation Study (Order Number D10PD18645) (Potomac, MD, July 10, 2013).
71 National Telecommunications and Information Administration, “Post-Award Monitoring Database.”
72 Representative of Connect Arkansas, “Telephone Interview,” May 01, 2014.
73 ASR Analytics, Connect Arkansas Sustainable Broadband Adoption Round 2, Broadband Technology Opportunities Program Evaluation Study (Order Number D10PD18645) (Potomac, MD, September 10, 2013).
119
74 National Telecommunications and Information Administration, “Post-Award Monitoring Database.”
75 Representatives of Foundation for California Community Colleges, “Telephone Interview,” April 28, 2014.
76 ASR Analytics, Foundation for California Community Colleges Sustainable Broadband Adoption Round 2, Broadband Technology Opportunities Program Evaluation Study (Order Number D10PD18645) (Potomac, MD, September 12, 2013).
77 National Telecommunications and Information Administration, “Post-Award Monitoring Database.”
78 Representatives of Future Generations Graduate School, “Telephone Interview,” May 05, 2014.
79 ASR Analytics, Future Generations Sustainable Broadband Adoption Round 2, Broadband Technology Opportunities Program Evaluation Study (Order Number D10PD18645) (Potomac, MD, August 08, 2013).
80 National Telecommunications and Information Administration, “Post-Award Monitoring Database.”
81 ASR Analytics, Urban Affairs Coalition Sustainable Broadband Adoption Round 2, Broadband Technology Opportunities Program Evaluation Study (Order Number D10PD18645) (Potomac, MD, September 10, 2013).
82 National Telecommunications and Information Administration, “Post-Award Monitoring Database.”
83 National Telecommunications and Information Administration, “Post-Award Monitoring Database.”
84 ASR Analytics, Clearwave Communications Comprehensive Community Infrastructure, Broadband Technology Opportunities Program Evaluation Study (Order Number D10PD18645) (Potomac, MD, December 03, 2013).
85 Representatives of Clearwave, “Telephone Interview,” April 29, 2014.
86 National Telecommunications and Information Administration, “Post-Award Monitoring Database.”
87 ASR Analytics, Executive Office of the State of West Virginia Comprehensive Community Infrastructure, Broadband Technology Opportunities Program Evaluation Study (Order Number D10PD18645) (Potomac, MD, March 25, 2014).
Representatives of the Executive Office of the State of West Virginia, “E-Mail Communication,” May 15, 2014.
88 Representatives of Lane Council of Governments, “Telephone Interview,” April 28, 2014.
89 ASR Analytics, Lane Council of Governments Comprehensive Community Infrastructure, Broadband Technology Opportunities Program Evaluation Study (Order Number D10PD18645) (Potomac, MD, April 04, 2014).
90 Representatives of Lane Council of Governments, “Telephone Interview.”
91 ASR Analytics, Massachusetts Technology Park Comprehensive Community Infrastructure, Broadband Technology Opportunities Program Evaluation Study (Order Number D10PD18645) (Potomac, MD, March 19, 2014).
92 ASR Analytics, Massachusetts Technology Park Comprehensive Community Infrastructure.
120
93 Representatives of the Massachusetts Broadband Initiative, “Telephone Interview,” May 02, 2014.
94 Representatives of the Massachusetts Broadband Initiative, “Telephone Interview.”
95 Representatives of MCNC, “Telephone Interview,” April 29, 2014.
96 ASR Analytics, MCNC Comprehensive Community Infrastructure, Broadband Technology Opportunities Program Evaluation Study (Order Number D10PD18645) (Potomac, MD, March 04, 2014).
97 National Telecommunications and Information Administration, “Post-Award Monitoring Database.”
98 Representatives of Merit Network Inc., “Telephone Interview,” May 01, 2014.
99 ASR Analytics, Merit Network, Inc. Comprehensive Community Infrastructure, Broadband Technology Opportunities Program Evaluation Study (Order Number D10PD18645) (Potomac, MD, March 04, 2014).
100 National Telecommunications and Information Administration, “Post-Award Monitoring Database.”
101 ASR Analytics, Mid-Atlantic Broadband Cooperative Comprehensive Community Infrastructure, Broadband Technology Opportunities Program Evaluation Study (Order Number D10PD18645) (Potomac, MD, February 06, 2014).
102 National Telecommunications and Information Administration, “Post-Award Monitoring Database.”
103 National Telecommunications and Information Administration, “Post-Award Monitoring Database.”
104 ASR Analytics, OneCommunity Comprehensive Community Infrastructure, Broadband Technology Opportunities Program Evaluation Study (Order Number D10PD18645) (Potomac, MD, April 21, 2014).
105 National Telecommunications and Information Administration, “Post-Award Monitoring Database.”
106 ASR Analytics, OSHEAN, Inc. Comprehensive Community Infrastructure, Broadband Technology Opportunities Program Evaluation Study (Order Number D10PD18645) (Potomac, MD, March 10, 2014).
107 National Telecommunications and Information Administration, “Post-Award Monitoring Database.”
108 Representative of OSHEAN, “E-Mail Communication,” May 09, 2014.
109 Representatives of South Dakota Network, “Telephone Interview,” April 30, 2014.
110 ASR Analytics, South Dakota Network Comprehensive Community Infrastructure, Broadband Technology Opportunities Program Evaluation Study (Order Number D10PD18645) (Potomac, MD, February 05, 2014).
111 Representatives of South Dakota Network, “Telephone Interview.”
112 ASR Analytics, University of Arkansas System Comprehensive Community Infrastructure, Broadband Technology Opportunities Program Evaluation Study (Order Number D10PD18645) (Potomac, MD, March 11, 2014).
121
113 ASR Analytics, University of Arkansas System Comprehensive Community Infrastructure.
114 Representatives of the University of Arkansas System, “Telephone Interview,” May 02, 2014.
115 Representative of Zayo Group, “Telephone Interview,” April 29, 2014.
116 ASR Analytics, Zayo Group Comprehensive Community Infrastructure, Broadband Technology Opportunities Program Evaluation Study (Order Number D10PD18645) (Potomac, MD, February 06, 2014).
117 Representative of Zayo Group, “Telephone Interview.”
118 These figures exclude seven public safety grants and nine terminated, declined, withdrawn, or otherwise defunded grants.
National Telecommunications and Information Administration, “Post-Award Monitoring Database.”
119 National Telecommunications and Information Administration, “Post-Award Monitoring Database.”
120 National Telecommunications and Information Administration, “NTIA’s BTOP Map,” Connecting America’s Communities (Washington, DC, August 15, 2013), http://www2.ntia.doc.gov/BTOPmap/.
National Telecommunications and Information Administration, “Post-Award Monitoring Database.”
121 New household subscriptions reported by California Emerging Technology Fund (CETF) make up 59 percent of new household subscriptions reported by all evaluation study SBA grantees. Dollars spent per household subscriber for the evaluation study grants excluding CETF was $420.
122 The current NTIA definition of broadband exceeds that used by earlier research. Whether this higher level of broadband performance provides additional benefits of the NOFA definition could be the subject of future research.
123 This table excludes defunded and public safety network grants.
National Telecommunications and Information Administration, “Post-Award Monitoring Database.”
124 National Telecommunications and Information Administration, “Post-Award Monitoring Database.”
125 ASR Analytics, Short-Term Economic Impacts Report, Broadband Technology Opportunities Program Evaluation Study (Order Number D10PD18645) (Potomac, MD, September 30, 2013), http://www2.ntia.doc.gov/files/short-term_economic_impacts_report.pdf.
126 For more information, visit http://www2.ntia.doc.gov.
127 BTOP recipients were required to complete their projects by September 30, 2013, expending all Recovery Act funds by that time. However, NTIA has provided no-cost project extensions beyond this date to some recipients.
128 All jobs figures included in this report represent full-time equivalent (FTE) positions. IMPLAN generates employment estimates including all full-time, part-time, and temporary employment. IMPLAN employment estimates do not indicate the number of hours worked or the portion that is full- or part-time. In order to standardize job estimates, ASR used additional IMPLAN data to convert original employment estimates to FTEs. An FTE is assumed to represent 2,080 hours in a standard year, or a 40-hour workweek.
129 ASR Analytics, Progress towards BTOP Goals: Interim Report on PCC and SBA Case Studies, Broadband Technology Opportunities Program Evaluation Study (Order Number D10PD18645) (Potomac, MD, October 15, 2012), http://www.ntia.doc.gov/report/2012/progress-towards-btop-goals-interim-report-pcc-and-sba-case-studies.
122
130 ASR Analytics, WorkForce West Virginia Public Computer Center Round 2, 11.
ASR Analytics, WorkForce West Virginia Public Computer Center Round 2, 12.
164 ASR Analytics, Cambridge Housing Authority Public Computer Center Round 2, 9.
ASR Analytics, Foundation for California Community Colleges Sustainable Broadband Adoption Round 2, 16.
165 ASR Analytics, MCNC Comprehensive Community Infrastructure, 20.
ASR Analytics, Executive Office of the State of West Virginia Comprehensive Community Infrastructure, 23.
166 ASR Analytics, MCNC Comprehensive Community Infrastructure, 21.
ASR Analytics, Executive Office of the State of West Virginia Comprehensive Community Infrastructure, 23.
128
167 ASR Analytics, MCNC Comprehensive Community Infrastructure, 19.
ASR Analytics, Executive Office of the State of West Virginia Comprehensive Community Infrastructure, 23.
168 This figure excludes public safety and defunded grants.
National Telecommunications and Information Administration, “Post-Award Monitoring Database.”
169 ASR Analytics, University of Arkansas System Comprehensive Community Infrastructure, 24.
170 ASR Analytics, Merit Network, Inc. Comprehensive Community Infrastructure, 26.
171 ASR Analytics, Massachusetts Technology Park Comprehensive Community Infrastructure, 27.
172 This figure excludes public safety and defunded grants.
National Telecommunications and Information Administration, “Post-Award Monitoring Database.”
173 This figure excludes public safety and defunded grants.
National Telecommunications and Information Administration, “Post-Award Monitoring Database.”
174 Jonathan E. Nuechterlein and Philip J. Weiser, Digital Crossroads: American Telecommunications Policy in the Internet Age (Cambridge, MA: The MIT Press, 2005).
175 OECD, “Broadband Networks and Open Access,” OECD Digital Economy Papers no. 218 (March 04, 2013): 6.
176 William H. Lehr, Marvin Sirbu, and Sharon Gillett, “Broadband Open Access: Lessons from Municipal Network Case Studies,” 2008.
177 Lehr, Sirbu, and Gillett, “Broadband Open Access: Lessons from Municipal Network Case Studies.”
178 Gillett et al., Measuring Broadband’s Economic Impact.
Peter Stenberg et al., Broadband Internet’s Value for Rural America, ERR-78 (United States Department of Agriculture Economic Research Service, August 2009), http://www.ers.usda.gov/publications/err-economic-research-report/err78.aspx.
179 Gillett et al., Measuring Broadband’s Economic Impact.
180 Stenberg et al., Broadband Internet’s Value for Rural America.
181 National Telecommunications and Information Administration, “Application Search,” Broadband USA, 2014, http://www.ntia.doc.gov/legacy/broadbandgrants/applications/results.htm.
National Telecommunications and Information Administration, “Application Search.”
182 CAIs, POPs, or both were redacted from the CAC for several grantees. ASR used CAI and POP locations listed in APR/PPR attachments for these grantees to define the grantee service areas, where necessary.
National Telecommunications and Information Administration, “NTIA’s BTOP Map.”
National Telecommunications and Information Administration, “Post-Award Monitoring Database.”
United States Census Bureau, “2010 TIGER/Line® Shapefiles” (Washington, DC, June 19, 2012), http://www.census.gov/geo/www/cob/cbf_counties.html.
183 1,269 counties fell within the service area of an awarded BTOP grant only, 183 fell within a BIP service area only, and 292 fell within both a BTOP and BIP service area, for a total of 1,744 counties.
129
184 Gillett et al., Measuring Broadband’s Economic Impact.
185 National Telecommunications and Information Administration, “Post-Award Monitoring Database.”
186 In Appendix D, the broadband speed thresholds 3 Mbps downstream and 768 kbps upstream are used for the “NTIA” definition of broadband. Table 51 presents six different estimates of the effect of BTOP on broadband, when computed using this definition. The range of 1.04 percent to 2.00 percent represents the minimum and maximum of these six estimates.
187 In Appendix D, the broadband speed thresholds 768 kbps downstream and 200 kbps upstream are used for the “NOFA” definition of broadband. Table 51 presents six different estimates of the effect of BTOP on broadband, when computed using this definition. The range of 0.08 percent to 0.55 percent represents the minimum and maximum of these six estimates.
188 Appendix D presents extrapolations for the full range of each potential impact.
189 LECG Ltd., Economic Impact of Broadband: An Empirical Study.
190 Kolko, Broadband and Local Growth.
Gillett et al., Measuring Broadband’s Economic Impact.
191 See Appendix D for a detailed explanation of this calculation.
192 See Appendix D for a detailed explanation of this calculation.
Allen Consulting Group, Quantifying the Possible Economic Gains of Getting More Australian Households Online, 25.
193 ASR used the median instead of the mean when measuring the average speed and price changes across connected CAIs. This is due to outlying observations in the speed and pricing change data for some institution types.
194 ASR selected 100 Mbps because it is the median of all collected speeds for all institutions of the following types: Schools (K-12), Medical/Healthcare, and Library.
195 National Telecommunications and Information Administration, “Post-Award Monitoring Database.”
196 Representative of Cambridge Housing Authority, “Telephone Interview.”
197 Representatives of the Delaware Division of Libraries, “Telephone Interview.”
198 Representatives of Florida Agricultural and Mechanical University, “Telephone Interview.”
199 Representatives of Las Vegas Urban League, “Telephone Interview.”
200 Representatives of Michigan State University, “Telephone Interview,” April 30, 2014.
201 Representatives of South Carolina Technical College System, “Telephone Interview.”
202 Representatives of Technology For All, “Telephone Interview.”
203 Representatives of WorkForce West Virginia, “Telephone Interview.”
204 Representatives of C.K. Blandin Foundation, “Telephone Interview.”
205 Representatives of the California Emerging Technology Fund, “Telephone Interview,” May 01, 2014.
206 Representatives of the City of Chicago et al., “Telephone Interview,” April 30, 2014.
207 Representative of Connect Arkansas, “Telephone Interview.”
130
208 Representatives of Foundation for California Community Colleges, “Telephone Interview.”
209 Representatives of Future Generations Graduate School, “Telephone Interview.”
210 Representatives of Urban Affairs Coalition, “Telephone Interview,” April 30, 2014.
211 Representatives of Clearwave, “Telephone Interview.”
212 Representatives of the Executive Office of the State of West Virginia, “Telephone Interview,” April 29, 2014.
213 Representatives of the Executive Office of the State of West Virginia, “E-Mail Communication.”
214 Representatives of Lane Council of Governments, “Telephone Interview.”
215 Representatives of the Massachusetts Broadband Initiative, “Telephone Interview.”
216 Representatives of MCNC, “Telephone Interview.”
217 Representatives of Merit Network Inc., “Telephone Interview.”
218 Representatives of Mid-Atlantic Broadband Communities Corporation, “Telephone Interview,” May 01, 2014.
220 Representative of OneCommunity, “Telephone Interview,” May 01, 2014.
221 Representative of OSHEAN, “E-Mail Communication.” Representative of OSHEAN, “E-Mail Communication.”
222 Representatives of OSHEAN, “Telephone Interview,” April 30, 2014.
223 Representatives of South Dakota Network, “Telephone Interview.”
224 Representatives of the University of Arkansas System, “Telephone Interview.”
225 Representative of Zayo Group, “Telephone Interview.”
226 Representative of Zayo Group, “Telephone Interview.”
227 Representative of Zayo Group, “Telephone Interview.”
228 ASR Analytics, BTOP Evaluation Study Design.
Rural Utilities Service and National Telecommunications and Information Administration, “Broadband Initiatives Program & Broadband Technology Opportunities Program,” Federal Register 74, no. 130 (July 09, 2009): 33104–34, http://www.gpo.gov/fdsys/pkg/FR-2009-07-09/pdf/FR-2009-07-09.pdf.
229 Grantee award periods started to end in the last quarter of 2012. Grantees no longer submitted quarterly reports to NTIA after the end of their award period. In these cases, accomplishments reported in the grant’s last PPR were carried forward by ASR into in subsequent quarters. These instances are noted with “estimated” in the figures presented throughout this section.
230 National Telecommunications and Information Administration, “Application Search.”
231 The NOFA includes the following definitions:
A proposed funded service area may qualify as underserved for last mile projects if at least one of the following factors is met, though the presumption will be that more than one factor is present: 1. No more than 50 percent of the households in the proposed funded service area have access to facilities-based, terrestrial broadband service at greater than the minimum broadband transmission speed (set forth in the definition of broadband above); 2. No fixed or
131
mobile broadband service provider advertises broadband transmission speeds of at least three megabits per second (‘‘Mbps’’) downstream in the proposed funded service area; or 3. The rate of broadband subscribership for the proposed funded service area is 40 percent of households or less. A proposed funded service area may qualify as underserved for Middle Mile projects if one interconnection point terminates in a proposed funded service area that qualifies as unserved or underserved for Last Mile projects.
Unserved area means a proposed funded service area, composed of one or more contiguous census blocks, where at least 90 percent of households in the proposed funded service area lack access to facilities-based, terrestrial broadband service, either fixed or mobile, at the minimum broadband transmission speed (set forth in the definition of broadband above).
National Telecommunications and Information Administration, “Broadband Technology Opportunities Program Notices” (Washington, DC, January 22, 2010), http://www.ntia.doc.gov/files/ntia/publications/fr_btopnofa_100115_0.pdf.
232 National Telecommunications and Information Administration and Federal Communications Commission, “State Broadband Initiative,” May 12, 2014.
United States Census Bureau, “2006-2010 ACS 5-Year Summary File,” American Community Survey (Washington, DC, December 08, 2011), http://www.census.gov/acs/www/data_documentation/2010_release/.
233 National Telecommunications and Information Administration, “Post-Award Monitoring Database.”
234 National Telecommunications and Information Administration, “Post-Award Monitoring Database.”
235 National Telecommunications and Information Administration, “NTIA’s BTOP Map.”
236 National Telecommunications and Information Administration, “Post-Award Monitoring Database.”
237 This includes connected anchors plus those passed by a network.
National Telecommunications and Information Administration, “Post-Award Monitoring Database.”
238 ASR Analytics, Short-Term Economic Impacts Report.
239 This figure excludes public safety and defunded grants.
National Telecommunications and Information Administration, “Post-Award Monitoring Database.”
240 National Telecommunications and Information Administration, “Post-Award Monitoring Database.”
241 National Telecommunications and Information Administration, “Post-Award Monitoring Database.”
242 National Telecommunications and Information Administration, “Post-Award Monitoring Database.”
243 ASR Analytics, California Emerging Technology Fund Sustainable Broadband Adoption Round 2, 35.
ASR Analytics, Cambridge Housing Authority Public Computer Center Round 2, 23.
132
ASR Analytics, “Cambridge Housing Authority Community Computer Centers Public Computer Centers (PCC),” Broadband Technology Opportunities Program Evaluation Study (Order Number D10PD18645) (Potomac, MD, June 18, 2012), 33.
ASR Analytics, C.K. Blandin Foundation Sustainable Broadband Adoption Round 2, 29.
ASR Analytics, “Connect Arkansas Expanding Broadband Use in Arkansas through Education Sustainable Broadband Adoption (SBA),” Broadband Technology Opportunities Program Evaluation Study (Order Number D10PD18645) (Potomac, MD, June 18, 2012), 41.
ASR Analytics, Delaware Department of State (Delaware Division of Libraries) Public Computer Center Round 2, 28.
ASR Analytics, Foundation for California Community Colleges Sustainable Broadband Adoption Round 2, 23.
ASR Analytics, Future Generations Sustainable Broadband Adoption Round 2, 31.
ASR Analytics, Las Vegas-Clark County Urban League Public Computer Center Round 2, 24.
ASR Analytics, Smart Chicago Sustainable Broadband Adoption Round 2, 33.
ASR Analytics, “Technology For All, Inc.: Texas Connects Coalition Public Computer Center (PCC),” Broadband Technology Opportunities Program Evaluation Study (Order Number D10PD18645) (Potomac, MD, June 18, 2012), 36.
ASR Analytics, Technology For All, Inc. Public Computer Center Round 2, 23.
244 ASR Analytics, “California Emerging Technology Fund: Broadband Awareness and Adoption Sustainable Broadband Adoption (SBA),” Broadband Technology Opportunities Program Evaluation Study (Order Number D10PD18645) (Potomac, MD, June 18, 2012), 61.
245 ASR Analytics, Smart Chicago Sustainable Broadband Adoption Round 2, 33.
ASR Analytics, Technology For All, Inc. Public Computer Center Round 2, 23.
246 ASR Analytics, “Cambridge Housing Authority Community Computer Centers Public Computer Centers (PCC),” 33.
ASR Analytics, Cambridge Housing Authority Public Computer Center Round 2, 24.
ASR Analytics, C.K. Blandin Foundation Sustainable Broadband Adoption Round 2, 30.
ASR Analytics, Foundation for California Community Colleges Sustainable Broadband Adoption Round 2, 23.
ASR Analytics, WorkForce West Virginia Public Computer Center Round 2, 28.
ASR Analytics, C.K. Blandin Foundation Sustainable Broadband Adoption Round 2, 29.
134
ASR Analytics, “Technology For All, Inc.: Texas Connects Coalition Public Computer Center (PCC),” 36.
ASR Analytics, Smart Chicago Sustainable Broadband Adoption Round 2, 34.
ASR Analytics, South Carolina State Board for Technical and Comprehensive Education Public Computer Center Round 2, 21.
255 Representatives of C.K. Blandin Foundation, “Telephone Interview.”
256 ASR Analytics, “Foundation for California Community Colleges: California Connects Sustainable Broadband Adoption (SBA),” Broadband Technology Opportunities Program Evaluation Study (Order Number D10PD18645) (Potomac, MD, June 18, 2012), 33.
ASR Analytics, Future Generations Sustainable Broadband Adoption Round 2, 32.
257 ASR Analytics, “Cambridge Housing Authority Community Computer Centers Public Computer Centers (PCC),” 33.
ASR Analytics, Cambridge Housing Authority Public Computer Center Round 2, 23.
ASR Analytics, Smart Chicago Sustainable Broadband Adoption Round 2, 33.
ASR Analytics, “Foundation for California Community Colleges: California Connects Sustainable Broadband Adoption (SBA),” 33.
258 ASR Analytics, “California Emerging Technology Fund: Broadband Awareness and Adoption Sustainable Broadband Adoption (SBA),” 61.
ASR Analytics, “Cambridge Housing Authority Community Computer Centers Public Computer Centers (PCC),” 33.
ASR Analytics, C.K. Blandin Foundation Sustainable Broadband Adoption Round 2, 30.
ASR Analytics, “Connect Arkansas Expanding Broadband Use in Arkansas through Education Sustainable Broadband Adoption (SBA),” 41.
ASR Analytics, “Foundation for California Community Colleges: California Connects Sustainable Broadband Adoption (SBA),” 33.
ASR Analytics, Foundation for California Community Colleges Sustainable Broadband Adoption Round 2, 23.
260 ASR Analytics, “California Emerging Technology Fund: Broadband Awareness and Adoption Sustainable Broadband Adoption (SBA),” 60.
135
ASR Analytics, C.K. Blandin Foundation Sustainable Broadband Adoption Round 2, 29.
ASR Analytics, “Florida A&M University: The FAMU Center for Public Computing and Workforce Development Public Computer Center (PCC),” Broadband Technology Opportunities Program Evaluation Study (Order Number D10PD18645) (Potomac, MD, June 18, 2012), 32.
ASR Analytics, “Foundation for California Community Colleges: California Connects Sustainable Broadband Adoption (SBA),” 33.
ASR Analytics, Smart Chicago Sustainable Broadband Adoption Round 2, 34.
Representatives of Technology For All, “Telephone Interview.”
262 ASR Analytics, Florida Agricultural and Mechanical University Public Computer Center Round 2, 23.
ASR Analytics, “Future Generations Graduate School: Equipping West Virginia’s Fire and Rescue Squads with Technology and Training to Serve Communities Sustainable Broadband Adoption (SBA),” Broadband Technology Opportunities Program Evaluation Study (Order Number D10PD18645) (Potomac, MD, June 18, 2012), 47.
ASR Analytics, Smart Chicago Sustainable Broadband Adoption Round 2, 33.
ASR Analytics, WorkForce West Virginia Public Computer Center Round 2, 28.
263 ASR Analytics, C.K. Blandin Foundation Sustainable Broadband Adoption Round 2, 29.
ASR Analytics, California Emerging Technology Fund Sustainable Broadband Adoption Round 2, 35.
ASR Analytics, “Foundation for California Community Colleges: California Connects Sustainable Broadband Adoption (SBA),” 33.
ASR Analytics, “Las Vegas Clark County Urban League: Access to Computer Technology and Instruction in Online Networking (ACTION) Public Computer Center (PCC),” Broadband Technology Opportunities Program Evaluation Study (Order Number D10PD18645) (Potomac, MD, June 18, 2012), 40.
ASR Analytics, “SC State Board for Technical and Comprehensive Education: Reach for Success Public Computer Centers (PCC),” Broadband Technology Opportunities Program Evaluation Study (Order Number D10PD18645) (Potomac, MD, June 18, 2012), 37.
267 ASR Analytics, Cambridge Housing Authority Public Computer Center Round 2, 24.
136
ASR Analytics, California Emerging Technology Fund Sustainable Broadband Adoption Round 2, 36.
ASR Analytics, “Connect Arkansas Expanding Broadband Use in Arkansas through Education Sustainable Broadband Adoption (SBA),” 40.
ASR Analytics, “Delaware Division of Libraries: Job/Learning Labs Public Computer Center (PCC),” Broadband Technology Opportunities Program Evaluation Study (Order Number D10PD18645) (Potomac, MD, June 18, 2012), 47.
ASR Analytics, “Las Vegas Clark County Urban League: Access to Computer Technology and Instruction in Online Networking (ACTION) Public Computer Center (PCC),” 41.
ASR Analytics, Technology For All, Inc. Public Computer Center Round 2, 23.
269 Representatives of WorkForce West Virginia, “Telephone Interview.”
270 Representatives of South Carolina Technical College System, “Telephone Interview.”
271 ASR Analytics, Cambridge Housing Authority Public Computer Center Round 2, 23.
ASR Analytics, Delaware Department of State (Delaware Division of Libraries) Public Computer Center Round 2, 5, 28.
ASR Analytics, “Future Generations Graduate School: Equipping West Virginia’s Fire and Rescue Squads with Technology and Training to Serve Communities Sustainable Broadband Adoption (SBA),” 47.
ASR Analytics, Smart Chicago Sustainable Broadband Adoption Round 2, 34.
ASR Analytics, Technology For All, Inc. Public Computer Center Round 2, 24, 35.
272 ASR Analytics, “Cambridge Housing Authority Community Computer Centers Public Computer Centers (PCC),” 33.
ASR Analytics, C.K. Blandin Foundation Sustainable Broadband Adoption Round 2, 30.
ASR Analytics, “Las Vegas Clark County Urban League: Access to Computer Technology and Instruction in Online Networking (ACTION) Public Computer Center (PCC),” 41.
ASR Analytics, “Michigan State University: Evidence Based Computer Centers II Public Computer Centers (PCC),” Broadband Technology Opportunities Program Evaluation Study (Order Number D10PD18645) (Potomac, MD, June 18, 2012), 23.
ASR Analytics, Michigan State University Public Computer Center Round 2, 26.
ASR Analytics, “SC State Board for Technical and Comprehensive Education: Reach for Success Public Computer Centers (PCC),” 37.
ASR Analytics, South Carolina State Board for Technical and Comprehensive Education Public Computer Center Round 2, 21.
ASR Analytics, “Technology For All, Inc.: Texas Connects Coalition Public Computer Center (PCC),” 36.
ASR Analytics, “WorkForce West Virginia: One-Stop Public Computer Center Modernization Public Computer Center (PCC),” Broadband Technology Opportunities Program Evaluation Study (Order Number D10PD18645) (Potomac, MD, June 18, 2012), 25.
ASR Analytics, WorkForce West Virginia Public Computer Center Round 2, 28.
137
273 ASR Analytics, “Cambridge Housing Authority Community Computer Centers Public Computer Centers (PCC),” 33.
ASR Analytics, Cambridge Housing Authority Public Computer Center Round 2, 23.
ASR Analytics, WorkForce West Virginia Public Computer Center Round 2, 28.
274 ASR Analytics, “California Emerging Technology Fund: Broadband Awareness and Adoption Sustainable Broadband Adoption (SBA),” 61.
ASR Analytics, Florida Agricultural and Mechanical University Public Computer Center Round 2, 23.
ASR Analytics, “SC State Board for Technical and Comprehensive Education: Reach for Success Public Computer Centers (PCC),” 38.
ASR Analytics, “WorkForce West Virginia: One-Stop Public Computer Center Modernization Public Computer Center (PCC),” 26.
275 Representatives of South Carolina Technical College System, “Telephone Interview.”
Representatives of Technology For All, “Telephone Interview.”
Representatives of Urban Affairs Coalition, “Telephone Interview.”
Representatives of the City of Chicago et al., “Telephone Interview.”
276 ASR Analytics, “City of Chicago: Smart Chicago Sustainable Broadband Adoption (SBA),” Broadband Technology Opportunities Program Evaluation Study (Order Number D10PD18645) (Potomac, MD, June 18, 2012), 53.
ASR Analytics, “Connect Arkansas Expanding Broadband Use in Arkansas through Education Sustainable Broadband Adoption (SBA),” 40.
ASR Analytics, “Foundation for California Community Colleges: California Connects Sustainable Broadband Adoption (SBA),” 33.
ASR Analytics, “Future Generations Graduate School: Equipping West Virginia’s Fire and Rescue Squads with Technology and Training to Serve Communities Sustainable Broadband Adoption (SBA),” 46.
ASR Analytics, South Carolina State Board for Technical and Comprehensive Education Public Computer Center Round 2, 21.
ASR Analytics, “Technology For All, Inc.: Texas Connects Coalition Public Computer Center (PCC),” 36.
277 Representatives of Florida Agricultural and Mechanical University, “Telephone Interview.”
278 ASR Analytics, “California Emerging Technology Fund: Broadband Awareness and Adoption Sustainable Broadband Adoption (SBA),” 37, 46, 54; ASR Analytics, California Emerging Technology Fund Sustainable Broadband Adoption Round 2, 36.
ASR Analytics, “Connect Arkansas Expanding Broadband Use in Arkansas through Education Sustainable Broadband Adoption (SBA),” 41.
279 ASR Analytics, “California Emerging Technology Fund: Broadband Awareness and Adoption Sustainable Broadband Adoption (SBA),” 61.
ASR Analytics, “City of Chicago: Smart Chicago Sustainable Broadband Adoption (SBA),” 53.
280 Representatives of Urban Affairs Coalition, “Telephone Interview.”
138
281 ASR Analytics, California Emerging Technology Fund Sustainable Broadband Adoption Round 2, 35.
ASR Analytics, C.K. Blandin Foundation Sustainable Broadband Adoption Round 2, 30.
ASR Analytics, “Future Generations Graduate School: Equipping West Virginia’s Fire and Rescue Squads with Technology and Training to Serve Communities Sustainable Broadband Adoption (SBA),” 46.
ASR Analytics, “Las Vegas Clark County Urban League: Access to Computer Technology and Instruction in Online Networking (ACTION) Public Computer Center (PCC),” 40.
ASR Analytics, WorkForce West Virginia Public Computer Center Round 2, 28.
282 ASR Analytics, “Technology For All, Inc.: Texas Connects Coalition Public Computer Center (PCC),” 35.
283 ASR Analytics, “California Emerging Technology Fund: Broadband Awareness and Adoption Sustainable Broadband Adoption (SBA),” 61.
ASR Analytics, “City of Chicago: Smart Chicago Sustainable Broadband Adoption (SBA),” 53.
ASR Analytics, “Delaware Division of Libraries: Job/Learning Labs Public Computer Center (PCC),” 46.
ASR Analytics, Delaware Department of State (Delaware Division of Libraries) Public Computer Center Round 2, 29.
ASR Analytics, “Future Generations Graduate School: Equipping West Virginia’s Fire and Rescue Squads with Technology and Training to Serve Communities Sustainable Broadband Adoption (SBA),” 46.
ASR Analytics, Future Generations Sustainable Broadband Adoption Round 2, 32.
ASR Analytics, Las Vegas-Clark County Urban League Public Computer Center Round 2, 24.
ASR Analytics, “Michigan State University: Evidence Based Computer Centers II Public Computer Centers (PCC),” 23.
ASR Analytics, South Carolina State Board for Technical and Comprehensive Education Public Computer Center Round 2, 21.
ASR Analytics, Smart Chicago Sustainable Broadband Adoption Round 2, 35.
ASR Analytics, Technology For All, Inc. Public Computer Center Round 2, 24.
284 ASR Analytics, “City of Chicago: Smart Chicago Sustainable Broadband Adoption (SBA),” 53.
ASR Analytics, “Delaware Division of Libraries: Job/Learning Labs Public Computer Center (PCC),” 47.
ASR Analytics, Foundation for California Community Colleges Sustainable Broadband Adoption Round 2, 23.
ASR Analytics, “SC State Board for Technical and Comprehensive Education: Reach for Success Public Computer Centers (PCC),” 37.
ASR Analytics, Technology For All, Inc. Public Computer Center Round 2, 24.
285 ASR Analytics, “California Emerging Technology Fund: Broadband Awareness and Adoption Sustainable Broadband Adoption (SBA),” 61.
139
ASR Analytics, Smart Chicago Sustainable Broadband Adoption Round 2, 35.
ASR Analytics, Technology For All, Inc. Public Computer Center Round 2, 24.
286 ASR Analytics, WorkForce West Virginia Public Computer Center Round 2, 40.
ASR Analytics, Las Vegas-Clark County Urban League Public Computer Center Round 2, 24.
Representatives of Chicago Smart Communities, “Interview with Authors,” February 28, 2013.
287 Representatives of Las Vegas Urban League, “Telephone Interview.”
Representatives of Michigan State University, “Telephone Interview.”
Representatives of Future Generations Graduate School, “Telephone Interview.”
Representative of Cambridge Housing Authority, “Telephone Interview.”
288 ASR Analytics, Clearwave Communications Comprehensive Community Infrastructure, 28.
ASR Analytics, South Dakota Network Comprehensive Community Infrastructure, 29.
ASR Analytics, University of Arkansas System Comprehensive Community Infrastructure, 28.
ASR Analytics, Zayo Group Comprehensive Community Infrastructure, 26.
289 ASR Analytics, Clearwave Communications Comprehensive Community Infrastructure, 28.
ASR Analytics, Massachusetts Technology Park Comprehensive Community Infrastructure, 29.
ASR Analytics, University of Arkansas System Comprehensive Community Infrastructure, 28.
290 ASR Analytics, Clearwave Communications Comprehensive Community Infrastructure, 28.
ASR Analytics, Massachusetts Technology Park Comprehensive Community Infrastructure, 29.
ASR Analytics, Mid-Atlantic Broadband Cooperative Comprehensive Community Infrastructure, 21.
ASR Analytics, Merit Network, Inc. Comprehensive Community Infrastructure, 28.
ASR Analytics, University of Arkansas System Comprehensive Community Infrastructure, 28.
Representatives of OSHEAN, “Telephone Interview.”
291 Representatives of Merit Network Inc., “Telephone Interview.”
Representatives of Mid-Atlantic Broadband Communities Corporation, “Telephone Interview.”
292 ASR Analytics, Mid-Atlantic Broadband Cooperative Comprehensive Community Infrastructure, 22.
ASR Analytics, OneCommunity Comprehensive Community Infrastructure, 27.
293 ASR Analytics, Lane Council of Governments Comprehensive Community Infrastructure, 26.
ASR Analytics, MCNC Comprehensive Community Infrastructure, 25.
ASR Analytics, Merit Network, Inc. Comprehensive Community Infrastructure, 28.
ASR Analytics, OSHEAN, Inc. Comprehensive Community Infrastructure, 28.
ASR Analytics, South Dakota Network Comprehensive Community Infrastructure, 28.
ASR Analytics, Zayo Group Comprehensive Community Infrastructure, 27.
294 ASR Analytics, Massachusetts Technology Park Comprehensive Community Infrastructure, 29.
ASR Analytics, Mid-Atlantic Broadband Cooperative Comprehensive Community Infrastructure, 22.
140
ASR Analytics, Merit Network, Inc. Comprehensive Community Infrastructure, 28.
ASR Analytics, Zayo Group Comprehensive Community Infrastructure, 27.
295 ASR Analytics, Clearwave Communications Comprehensive Community Infrastructure, 28.
ASR Analytics, Lane Council of Governments Comprehensive Community Infrastructure, 25.
ASR Analytics, Mid-Atlantic Broadband Cooperative Comprehensive Community Infrastructure, 21.
ASR Analytics, OneCommunity Comprehensive Community Infrastructure, 27.
296 ASR Analytics, Clearwave Communications Comprehensive Community Infrastructure, 28.
ASR Analytics, Merit Network, Inc. Comprehensive Community Infrastructure, 29.
Representatives of OSHEAN, “Telephone Interview.”
297 ASR Analytics, Clearwave Communications Comprehensive Community Infrastructure, 28.
ASR Analytics, Merit Network, Inc. Comprehensive Community Infrastructure, 16.
ASR Analytics, MCNC Comprehensive Community Infrastructure, 3.
ASR Analytics, South Dakota Network Comprehensive Community Infrastructure, 16.
298 ASR Analytics, Merit Network, Inc. Comprehensive Community Infrastructure, 29.
299 Representative of Zayo Group, “Telephone Interview.”
Representatives of Merit Network Inc., “Telephone Interview.”
Representative of OneCommunity, “Telephone Interview.”
Representatives of MCNC, “Telephone Interview.”
300 Representatives of MCNC, “Telephone Interview.”
Representative of Zayo Group, “Telephone Interview.”
301 ASR Analytics, Clearwave Communications Comprehensive Community Infrastructure, 24.
ASR Analytics, Executive Office of the State of West Virginia Comprehensive Community Infrastructure, 26.
ASR Analytics, Lane Council of Governments Comprehensive Community Infrastructure, 26.
ASR Analytics, Massachusetts Technology Park Comprehensive Community Infrastructure, 29.
ASR Analytics, Merit Network, Inc. Comprehensive Community Infrastructure, 29.
ASR Analytics, University of Arkansas System Comprehensive Community Infrastructure, 28.
302 ASR Analytics, Merit Network, Inc. Comprehensive Community Infrastructure, 25.
ASR Analytics, OneCommunity Comprehensive Community Infrastructure, 26.
303 ASR Analytics, OneCommunity Comprehensive Community Infrastructure, 26.
304 ASR Analytics, Merit Network, Inc. Comprehensive Community Infrastructure, 25.
305 ASR Analytics, Merit Network, Inc. Comprehensive Community Infrastructure, 25.
ASR Analytics, OneCommunity Comprehensive Community Infrastructure, 26.
306 ASR Analytics, Merit Network, Inc. Comprehensive Community Infrastructure, 25.
141
307 Matthew Lombard, Jennifer Snyder-Duch, and Cheryl Campanella Bracken, “Content Analysis in Mass Communication: Assessment and Reporting of Intercoder Reliability,” Human Communication Research 28, no. 4 (2002): 587–604.
308 Intercoder agreement is defined as the number of codes that both researchers applied to the same segment of text (with flexibility in where the segment began and ended) divided by the total number of codes applied to the 10 percent sample.
309 J W Creswell and V L Plano Clark, Designing and Conducting Mixed Methods Research (Thousand Oaks, CA: SAGE Publications, 2007).
310 Yvonna S Lincoln and Egon G Guba, Naturalistic Inquiry (Beverly Hills, CA: SAGE Publications, 1985).
311 Norman K Denzin and Yvonna S Lincoln, Collecting and Interpreting Qualitative Materials, ed. Norman K Denzin and Yvonna S Lincoln, 3rd ed. (Thousand Oaks, CA: SAGE Publications, 2008).
312 ASR’s Academic Advisory Committee includes several highly regarded academics with experience in the areas of economic development and econometric estimation techniques.
313 Robert W. Crandall, William H. Lehr, and Robert E. Litan, The Effects of Broadband Deployment on Output and Employment: A Cross-Sectional Analysis of U.S. Data, Issues in Economic Policy, Issues in Economic Policy (Washington, DC: The Brookings Institution, July 2007), http://www.brookings.edu/research/papers/2007/06/labor-crandall.
Kolko, Broadband and Local Growth, 19.
Krishna Jayakar and Eun-A Park, “Broadband Availability and Employment: An Analysis of County-Level Data from the National Broadband Map,” Journal of Information Policy 3 (2013): 181–200, http://jip.vmhost.psu.edu/ojs/index.php/jip/article/viewArticle/121.
314 Roger Perez, “The Advantages of Internet Job Searching,” Livestrong, August 09, 2010, http://www.livestrong.com/article/199545-the-advantages-of-internet-job-searching/.
Robert D. Atkinson et al., The Internet Economy 25 Years After .com: Transforming Commerce & Life (Washington, DC: Information Technology and Innovation Foundation, March 15, 2010), http://www.itif.org/publications/internet-economy-25-years-after-com.
Atkinson et al., The Internet Economy 25 Years After .com: Transforming Commerce & Life.
Michael Ann Dean, “Using the Internet in the Job Search,” in Employment Options for Foreign Service Family Members (Washington, DC: Family Liaison Office, United States Department of State, 2001), 31–48, http://www.state.gov/m/dghr/flo/c21652.htm.
Ibrahim Kholilul Rohman and Erik Bohlin, “Impact of Broadband Speed on Household Income: Comparing OECD and BIC” (2013), http://www.econstor.eu/handle/10419/88531.
315 Dean, “Using the Internet in the Job Search.”
316 USDA Economic Research Service, “Rural Digital Economy: Online Activities,” Briefing Rooms, August 13, 2009, http://ers.usda.gov/Briefing/Telecom/demandservice.htm.
317 USDA Economic Research Service, “Rural Digital Economy: Online Activities.”
318 USDA Economic Research Service, “Rural Digital Economy: Online Activities.”
Business Link, “Benefits of Selling Online,” Create an Online Shop, August 28, 2012, http://www.businesslink.gov.uk/bdotg/action/detail?itemId=1073792461&type=RESOURCES.
James Prieger, “The Broadband Digital Divide and the Economic Benefits of Mobile Broadband for Rural Areas” (2012), http://papers.ssrn.com/sol3/papers.cfm?abstract_id=2258112.
142
319 Stenberg et al., Broadband Internet’s Value for Rural America.
320 Stenberg et al., Broadband Internet’s Value for Rural America.
Larry F. Darby, Joseph P. Jr. Fuhr, and Stephen B. Pociask, The Internet Ecosystem: Employment Impacts of National Broadband Policy (Washington, DC: The American Consumer Institute, January 28, 2010), http://www.theamericanconsumer.org/wp-content/uploads/2010/01/aci-jobs-study-final1.pdf.
321 Business Link, “Advantages and Disadvantages of Using Social Media,” Online Business Networking and Social Networking, August 28, 2012, http://www.businesslink.gov.uk/bdotg/action/detail?itemId=1081912566&type=RESOURCES.
322 Mark L. Burton and Michael J. Hicks, The Residential and Commercial Benefits of Rural Broadband: Evidence from Central Appalachia (Huntington, WV: Center for Business and Economic Research Marshall University, July 2005), http://www.marshall.edu/cber/research/broadband/Final Rural Broadband July 2005.pdf.
LECG Ltd., Economic Impact of Broadband: An Empirical Study.
Arthur Grimes, Cleo Ren, and Phillip Stevens, “The Need for Speed: Impacts of Internet Connectivity on Firm Productivity” (2009), http://papers.ssrn.com/sol3/papers.cfm?abstract_id=1604247.
323 ASR Analytics, WorkForce West Virginia Public Computer Center Round 2, 11.
ASR Analytics, Technology For All, Inc. Public Computer Center Round 2, 9.
ASR Analytics, South Carolina State Board for Technical and Comprehensive Education Public Computer Center Round 2, 10.
ASR Analytics, Michigan State University Public Computer Center Round 2, 12.
ASR Analytics, Las Vegas-Clark County Urban League Public Computer Center Round 2, 10.
ASR Analytics, Future Generations Sustainable Broadband Adoption Round 2, 13.
ASR Analytics, Foundation for California Community Colleges Sustainable Broadband Adoption Round 2, 13.
ASR Analytics, Florida Agricultural and Mechanical University Public Computer Center Round 2, 8.
ASR Analytics, Delaware Department of State (Delaware Division of Libraries) Public Computer Center Round 2, 7.
ASR Analytics, C.K. Blandin Foundation Sustainable Broadband Adoption Round 2, 8.
ASR Analytics, Smart Chicago Sustainable Broadband Adoption Round 2, 16.
ASR Analytics, California Emerging Technology Fund Sustainable Broadband Adoption Round 2, 14.
324 ASR Analytics, Foundation for California Community Colleges Sustainable Broadband Adoption Round 2, 13.
ASR Analytics, C.K. Blandin Foundation Sustainable Broadband Adoption Round 2, 9.
ASR Analytics, Smart Chicago Sustainable Broadband Adoption Round 2, 16.
ASR Analytics, Florida Agricultural and Mechanical University Public Computer Center Round 2, 8.
143
325 ASR Analytics, Michigan State University Public Computer Center Round 2, 12.
ASR Analytics, Florida Agricultural and Mechanical University Public Computer Center Round 2, 8.
ASR Analytics, C.K. Blandin Foundation Sustainable Broadband Adoption Round 2, 8.
326 ASR Analytics, Foundation for California Community Colleges Sustainable Broadband Adoption Round 2, 13.
ASR Analytics, Florida Agricultural and Mechanical University Public Computer Center Round 2, 8.
ASR Analytics, Connect Arkansas Sustainable Broadband Adoption Round 2, 8.
327 Representatives of the Delaware Division of Libraries, “Telephone Interview.”
328 ASR Analytics, Delaware Department of State (Delaware Division of Libraries) Public Computer Center, Broadband Technology Opportunities Program Evaluation Study (Order Number D10PD18645), December 19, 2013, 7.
329 Representatives of the Delaware Division of Libraries, “Telephone Interview.”
Representatives of the Delaware Division of Libraries, “Telephone Interview.”
330 ASR Analytics, Technology For All, Inc. Public Computer Center, Broadband Technology Opportunities Program Evaluation Study (Order Number D10PD18645), September 16, 2013, 9.
331 ASR Analytics, Smart Chicago Sustainable Broadband Adoption Round 2, 16.
332 Representatives of the City of Chicago et al., “Telephone Interview.”
333 Representatives of C.K. Blandin Foundation, “Telephone Interview.”
334 ASR Analytics, C.K. Blandin Foundation Sustainable Broadband Adoption, Broadband Technology Opportunities Program Evaluation Study (Order Number D10PD18645), August 15, 2013, 9.
335 Representatives of C.K. Blandin Foundation, “Telephone Interview.”
336 ASR Analytics, Smart Chicago Sustainable Broadband Adoption, Broadband Technology Opportunities Program Evaluation Study (Order Number D10PD18645), July 2013, 17.
337 Florida Department of Transportation and Construction Estimating Institute, “Construction Management Development and Bond Guarantee Program: Working with the Florida Department of Transportation,” accessed May 06, 2014, http://www.dot.state.fl.us/equalopportunityoffice/BDISS/CEI_CMDP_BGP_Brochure.pdf.
338 Representatives of Florida Agricultural and Mechanical University, “Telephone Interview.”
339 ASR Analytics, Clearwave Communications Comprehensive Community Infrastructure, 19.
ASR Analytics, Merit Network, Inc. Comprehensive Community Infrastructure, 16.
ASR Analytics, OneCommunity Comprehensive Community Infrastructure, 18.
ASR Analytics, OSHEAN, Inc. Comprehensive Community Infrastructure, 18.
ASR Analytics, South Dakota Network Comprehensive Community Infrastructure, 21.
ASR Analytics, Zayo Group Comprehensive Community Infrastructure, 19.
340 ASR Analytics, University of Arkansas System Comprehensive Community Infrastructure, 20.
ASR Analytics, Clearwave Communications Comprehensive Community Infrastructure, 19.
ASR Analytics, Merit Network, Inc. Comprehensive Community Infrastructure, 17.
144
ASR Analytics, Zayo Group Comprehensive Community Infrastructure, 18.
341 ASR Analytics, OSHEAN, Inc. Comprehensive Community Infrastructure, 19.
342 ASR Analytics, Mid-Atlantic Broadband Cooperative Comprehensive Community Infrastructure, 15.
ASR Analytics, Merit Network, Inc. Comprehensive Community Infrastructure, 16.
ASR Analytics, South Dakota Network Comprehensive Community Infrastructure, 21.
ASR Analytics, Zayo Group Comprehensive Community Infrastructure, 19.
343 ASR Analytics, Merit Network, Inc. Comprehensive Community Infrastructure, 17.
344 ASR Analytics, Mid-Atlantic Broadband Cooperative Comprehensive Community Infrastructure, 16.
345 ASR Analytics, Lane Council of Governments Comprehensive Community Infrastructure, 18.
ASR Analytics, Mid-Atlantic Broadband Cooperative Comprehensive Community Infrastructure, 15.
ASR Analytics, Massachusetts Technology Park Comprehensive Community Infrastructure, 21.
ASR Analytics, OSHEAN, Inc. Comprehensive Community Infrastructure, 19.
ASR Analytics, South Dakota Network Comprehensive Community Infrastructure, 22.
ASR Analytics, Zayo Group Comprehensive Community Infrastructure, 19.
346 ASR Analytics, Zayo Group Comprehensive Community Infrastructure, 19.
347 Representative of Zayo Group, “Telephone Interview.”
348 ASR Analytics, Merit Network, Inc. Comprehensive Community Infrastructure, 17.
349 Representatives of Merit Network Inc., “Telephone Interview.”
350 ASR Analytics, Mid-Atlantic Broadband Cooperative Comprehensive Community Infrastructure, 15.
351 ASR Analytics, Mid-Atlantic Broadband Cooperative Comprehensive Community Infrastructure, 16.
352 Office of Governor Terry McAuliffe press release, “Governor McAuliffe Announces 110 New Jobs for Charlotte County,” April 30, 2014, http://www.mbc-va.com/news/details/id/51/governor-mcauliffe-announces-110-new-job.
353 Representatives of Mid-Atlantic Broadband Communities Corporation, “Telephone Interview.”
354 Representatives of Merit Network Inc., “Telephone Interview.”
355 ASR Analytics, Merit Network, Inc. Comprehensive Community Infrastructure, 16.
356 ASR Analytics, Mid-Atlantic Broadband Cooperative Comprehensive Community Infrastructure, 16.
357 Representatives of Mid-Atlantic Broadband Communities Corporation, “Telephone Interview.”
358 ASR Analytics, Mid-Atlantic Broadband Cooperative Comprehensive Community Infrastructure, 15.
359 Representatives of Mid-Atlantic Broadband Communities Corporation, “Telephone Interview.”
360 Representatives of MCNC, “Telephone Interview.”
145
361 Representatives of Mid-Atlantic Broadband Communities Corporation, “Telephone Interview.”
362 Karen Mossberger, Caroline Tolbert, and Christopher Anderson, Measuring Change in Internet Use and Broadband Adoption: Comparing BTOP Smart Communities and Other Chicago Neighborhoods, 2014.
363 Seeta Gangadharan, Kistine Carolan, and Kayshin Chan, KEYSPOT Model: A Home Away from Home: An Evaluation of the Philadelphia Freedom Rings Partnership, 2013.
364 Jörg Wittwer and Martin Senkbeil, “Is Students’ Computer Use at Home Related to Their Mathematical Performance at School?,” Computers & Education 50, no. 4 (May 2008): 1558–1571, doi:10.1016/j.compedu.2007.03.001.
Barbara Means et al., Evaluation of Evidence-Based Practices in Online Learning: A Meta-Analysis and Review of Online Learning Studies (Washington, DC: United States Department of Education, September 2010), http://www2.ed.gov/rschstat/eval/tech/evidence-based-practices/finalreport.pdf.
Means et al., Evaluation of Evidence-Based Practices in Online Learning: A Meta-Analysis and Review of Online Learning Studies.
Juan Moran et al., “Technology and Reading Performance in the Middle-School Grades: A Meta-Analysis with Recommendations for Policy and Practice,” Journal of Literacy Research 40, no. 1 (January 2008): 6–58, doi:10.1080/10862960802070483.
Shapley Research Associates and Texas Center for Educational Research, Final Outcomes for a Four–Year Study (2004–05 to 2007–08), Evaluation of the Texas Technology Immersion Pilot (eTxTIP), January 2009, http://www.tcer.org/research/etxtip/.
Gil Valentine et al., Children and Young People’s Home Use of ICT for Educational Purposes: The Impact on Attainment at Key Stages 1-4, RB672, August 2005, https://www.education.gov.uk/publications/RSG/Parentscarersandfamilies/Page12/RB672.
Mizuko Ito et al., Living and Learning with New Media Summary of Findings from the Digital Youth Project, The John D. and Catherine T. MacArthur Foundation Reports on Digital Media and Learning, November 2008, http://digitalyouth.ischool.berkeley.edu/files/report/digitalyouth-WhitePaper.pdf.
Don Passey et al., The Motivational Effect of ICT on Pupils, RR523 (Lancaster, UK: University of Lancaster, April 2004), https://www.education.gov.uk/publications/RSG/ICTSCH/Page1/RR523.
British Educational Communications and Technology Agency, Extending Opportunity: Final Report of the Minister’s Taskforce on Home Access to Technology (Coventry, UK, July 2008), http://dera.ioe.ac.uk/8285/.
Nancy Protheroe, “Technology and Student Achievement,” Principal, November 2005, http://www.naesp.org/resources/2/Principal/2005/N-Dp46.pdf.
Marie Hyland et al., “Are Classroom Internet Use and Academic Performance Higher after Government Broadband Subsidies to Primary Schools?” (2013), http://www.econstor.eu/handle/10419/88520.
365 Carly Shuler, Pockets of Potential: Using Mobile Technologies to Promote Children’s Learning (New York, NY: The Joan Gans Cooney Center, January 2009), http://joanganzcooneycenter.org/Reports-23.html.
Communications Workers of America, Speed Matters: Benefits of Broadband (Washington, DC, 2009), http://files.cwa-union.org/speedmatters/CWA_Benefits_of_Broadbandr_2010.pdf.
146
Scott M. Andes and Daniel D. Castro, Opportunities and Innovations in the Mobile Broadband Economy, The Information Technology and Innovation Foundation, 2010, http://www.itif.org/files/2010-mobile-innovations.pdf.
Linda Ann Hulbert and Regina C. McBride, “Utilizing Videoconferencing in Library Education: A Team Teaching Approach,” Journal of Education for Library and Information Science 45, no. 1 (2004): 25–35, http://www.jstor.org/stable/40323919.
Communications Workers of America, Speed Matters: Benefits of Broadband.
366 Robert LaRose et al., Closing the Rural Broadband Gap, Final Technical Report, November 30, 2008, https://www.msu.edu/~larose/ruralbb/.
Julius Genachowski, “Broadband: Our Enduring Engine for Prosperity and Opportunity,” in NARUC Conference (Washington, DC, 2010), http://hraunfoss.fcc.gov/edocs_public/attachmatch/DOC-296262A1.pdf.
Robert W. Fairlie and Samantha H. Grunberg, “Access to Technology and the Transfer Function of Community Colleges: Evidence from a Field Experiment” (2013), https://www.econstor.eu/dspace/bitstream/10419/90111/1/dp7764.pdf.
367 Ruth H. Moody and Michael P. Bobic, “Teaching the Net Generation without Leaving the Rest of Us Behind: How Technology in the Classroom Influences Student Composition,” Politics & Policy 39, no. 2 (April 29, 2011): 169–194, doi:10.1111/j.1747-1346.2011.00287.x.
Joanne Gikas and Michael M. Grant, “Mobile Computing Devices in Higher Education: Student Perspectives on Learning with Cellphones, Smartphones & Social Media,” Internet and Higher Education 19 (2013): 18–26, https://www.academia.edu/3748701/Mobile_Computing_Devices_in_Higher_Education_Student_Perspectives_on_Learning_with_Cellphones_Smartphones_and_Social_Media.
Darrell M. West, “Mobile Learning: Transforming Education, Engaging Students, and Improving Outcomes” (2013), http://safeschooluniversity.com/pdfs/issues/eLearning/motivation/MobileLearning.pdf.
Bradford S. Bell and Jessica E. Federman, “E-Learning in Postsecondary Education,” The Future of Children 23, no. 1 (2013), http://futureofchildren.org/futureofchildren/publications/docs/23_01_08.pdf.
368 Susan Stansberry and Stephoni Case, “26B-E: Teaching with Facebook as a Learning Management System (TED),” in Annual Meeting of the AECT Convention (Hyatt Regency Orange County, Anaheim, CA: Association for Educational Communications and Technology, 2010), http://convention2.allacademic.com/one/aect/aect10/index.php?click_key=1&cmd=Multi+Search+Search+Load+Publication&publication_id=430535&PHPSESSID=jgkifdqag6qgtckajo0k657jc7.
369 Jessica Briskin et al., “26B-K: Smart Apps: An Analysis of Educational Applications Available on Smartphones and the Implications for Mobile Learning (D&D),” in Annual Meeting of the AECT Convention (Hyatt Regency Orange County, Anaheim, CA: Association for Educational Communications and Technology, 2010), http://convention2.allacademic.com/one/aect/aect10/index.php?click_key=1&cmd=Multi+Search+Search+Load+Publication&publication_id=430393&PHPSESSID=jgkifdqag6qgtckajo0k657jc7.
370 Robert W. Fairlie, The Effects of Home Computers on School Enrollment, Working Paper, September 2003, http://cjtc.ucsc.edu/docs/r_schoolcomp6.pdf.
371 South Dakota Bureau of Information and Telecommunications, “Broadband Benefits for Rural Areas,” February 01, 2011, http://broadband.sd.gov/Benefits-Rural.aspx.
147
372 Robert D. Atkinson and Daniel D. Castro, Digital Quality of Life: Understanding the Personal and Social Benefits of the Information Technology Revolution (Washington, DC: Information Technology and Information Foundation, October 01, 2008), http://www.itif.org/files/DQOL.pdf.
IBM Learning Solutions, IBM’s Learning Transformation Story (Somers, NY: IBM Global Services, June 2004), http://www-304.ibm.com/easyaccess/fileserve?contentid=183268.
373 ASR Analytics, C.K. Blandin Foundation Sustainable Broadband Adoption Round 2, 11.
374 ASR Analytics, Technology For All, Inc. Public Computer Center Round 2, 10.
ASR Analytics, C.K. Blandin Foundation Sustainable Broadband Adoption Round 2, 11.
ASR Analytics, Florida Agricultural and Mechanical University Public Computer Center Round 2, 10.
ASR Analytics, Foundation for California Community Colleges Sustainable Broadband Adoption Round 2, 6.
ASR Analytics, Las Vegas-Clark County Urban League Public Computer Center Round 2, 10.
ASR Analytics, South Carolina State Board for Technical and Comprehensive Education Public Computer Center Round 2, 6.
378 ASR Analytics, Florida Agricultural and Mechanical University Public Computer Center Round 2, 25.
379 Representatives of Florida Agricultural and Mechanical University, “Telephone Interview.”
380 ASR Analytics, Delaware Department of State (Delaware Division of Libraries) Public Computer Center Round 2, 14.
381 Representatives of the Delaware Division of Libraries, “Telephone Interview.”
382 ASR Analytics, C.K. Blandin Foundation Sustainable Broadband Adoption Round 2, 12.
383 Representatives of C.K. Blandin Foundation, “Telephone Interview.”
148
384 ASR Analytics, Technology For All, Inc. Public Computer Center Round 2, 12.
385 Representatives of Technology For All, “Telephone Interview.”
386 ASR Analytics, University of Arkansas System Comprehensive Community Infrastructure, 26.
ASR Analytics, Clearwave Communications Comprehensive Community Infrastructure, 13.
ASR Analytics, Mid-Atlantic Broadband Cooperative Comprehensive Community Infrastructure, 13.
ASR Analytics, MCNC Comprehensive Community Infrastructure, 14.
ASR Analytics, Merit Network, Inc. Comprehensive Community Infrastructure, 13.
ASR Analytics, Massachusetts Technology Park Comprehensive Community Infrastructure, 17.
ASR Analytics, OneCommunity Comprehensive Community Infrastructure, 13.
ASR Analytics, OSHEAN, Inc. Comprehensive Community Infrastructure, 13.
ASR Analytics, South Dakota Network Comprehensive Community Infrastructure, 12.
ASR Analytics, Executive Office of the State of West Virginia Comprehensive Community Infrastructure, 14.
ASR Analytics, Zayo Group Comprehensive Community Infrastructure, 13.
387 ASR Analytics, University of Arkansas System Comprehensive Community Infrastructure, 28.
ASR Analytics, Clearwave Communications Comprehensive Community Infrastructure, 14.
ASR Analytics, Lane Council of Governments Comprehensive Community Infrastructure, 14.
ASR Analytics, Mid-Atlantic Broadband Cooperative Comprehensive Community Infrastructure, 14.
ASR Analytics, MCNC Comprehensive Community Infrastructure, 14.
ASR Analytics, Merit Network, Inc. Comprehensive Community Infrastructure, 14.
ASR Analytics, OSHEAN, Inc. Comprehensive Community Infrastructure, 15.
ASR Analytics, Executive Office of the State of West Virginia Comprehensive Community Infrastructure, 14.
ASR Analytics, Zayo Group Comprehensive Community Infrastructure, 16.
388 ASR Analytics, University of Arkansas System Comprehensive Community Infrastructure, 28.
ASR Analytics, Lane Council of Governments Comprehensive Community Infrastructure, 14.
ASR Analytics, MCNC Comprehensive Community Infrastructure, 13.
ASR Analytics, Merit Network, Inc. Comprehensive Community Infrastructure, 14.
ASR Analytics, OSHEAN, Inc. Comprehensive Community Infrastructure, 14.
ASR Analytics, South Dakota Network Comprehensive Community Infrastructure, 14.
ASR Analytics, Executive Office of the State of West Virginia Comprehensive Community Infrastructure, 15.
389 ASR Analytics, Clearwave Communications Comprehensive Community Infrastructure, 13.
ASR Analytics, MCNC Comprehensive Community Infrastructure, 13.
ASR Analytics, Zayo Group Comprehensive Community Infrastructure, 13.
149
390 ASR Analytics, OSHEAN, Inc. Comprehensive Community Infrastructure, 13.
391 ASR Analytics, MCNC Comprehensive Community Infrastructure, 14.
392 ASR Analytics, Executive Office of the State of West Virginia Comprehensive Community Infrastructure, 15.
393 Representatives of the Executive Office of the State of West Virginia, “Telephone Interview.”
394 ASR Analytics, MCNC Comprehensive Community Infrastructure, 14.
395 Representatives of MCNC, “Telephone Interview.”
396 ASR Analytics, MCNC Comprehensive Community Infrastructure, 14.
397 ASR Analytics, Lane Council of Governments Comprehensive Community Infrastructure, 14.
398 ASR Analytics, Clearwave Communications Comprehensive Community Infrastructure, 13.
399 Representatives of Clearwave, “Telephone Interview.”
400 Robert Bell, Partners In Progress: The Final Report on the MIRC Demonstration Communities 2010-2012, 2013, www.intelligentcommunity.org.
401 Gangadharan, Carolan, and Chan, KEYSPOT Model: A Home Away from Home: An Evaluation of the Philadelphia Freedom Rings Partnership.
402 Representative of Cambridge Housing Authority, “Telephone Interview.”
403 Representative of Cambridge Housing Authority, “E-Mail Communication,” May 02, 2014.
404 Ingrida Lusis and Pam Mason, Paradigm Shift: The New World of Hearing Health Care Delivery, 2012.
Wen-ying Sylvia Chou et al., “Web 2.0 for Health Promotion: Reviewing the Current Evidence,” American Journal of Public Health 103, no. 1 (2013), http://ajph.aphapublications.org/doi/pdf/10.2105/AJPH.2012.301071.
405 David McDaid and A-La Park, Online Health: Untangling the Web, 2010.
406 Y. Zhou et al., “Improved Quality at Kaiser Permanente through Email between Physicians and Patients.,” Health Affairs 7 (2009): 1370–1375.
George Lauer, “Seniors Who Use Internet Could Reap Health Benefits, Studies Show,” December 01, 2009, http://www.ihealthbeat.org/features/2009/seniors-who-use-internet-could-reap-health-benefits-studies-show.aspx.
Brian Whiteacre and Lara Brooks, “Do Broadband Adoption Rates Impact a Community’s Health?,” Behaviour & Information Technology (2013).
407 Cheryl A. Moyer, “Online Patient-Provider Communication: How Will It Fit?,” The Electronic Journal of Communication 17, no. 3 & 4 (2007), http://www.cios.org/EJCPUBLIC/017/3/01732.HTML.
408 C.B. White et al., “A Content Analysis of E-Mail Communication Between Patients and Their Providers: Patients Get the Message,” Journal of the American Medical Informatics Association 11, no. 4 (2004): 260–267.
409 Moyer, “Online Patient-Provider Communication: How Will It Fit?”.
410 HealthIT.gov, “Benefits of Health IT,” August 28, 2012, http://www.healthit.gov/patients-families/health-it-makes-health-care-convenient.
150
411 HealthIT.gov, “Benefits of Health IT.”
412 HealthIT.gov, “Benefits of Health IT.”
413 HealthIT.gov, “Benefits of Health IT.”
414 South Dakota Bureau of Information and Telecommunications, “Broadband Benefits for Rural Areas.”
415 South Dakota Bureau of Information and Telecommunications, “Broadband Benefits for Rural Areas.”
416 South Dakota Bureau of Information and Telecommunications, “Broadband Benefits for Rural Areas.”
417 John Henkel, “Buying Drugs Online: It’s Convenient and Private, but Beware of ‘Rogue Sites,’” November 10, 2011, http://www.fda.gov/Drugs/EmergencyPreparedness/BioterrorismandDrugPreparedness/ucm137269.htm.
418 Henkel, “Buying Drugs Online: It’s Convenient and Private, but Beware of ‘Rogue Sites.’”
419 Henkel, “Buying Drugs Online: It’s Convenient and Private, but Beware of ‘Rogue Sites.’”
420 Stephen Miller, “Online Tools Help Consumers Make Cost-Effective Decisions on Drugs, Routine Care” (Alexandria, VA: Society for Human Resource Management, November 23, 2010), http://www.shrm.org/hrdisciplines/benefits/Articles/Pages/CostTools.aspx.
421 Broadband for America, “Health Care” (Washington, DC, 2011), http://www.broadbandforamerica.com/benefits/healthcare.
422 Broadband for America, “Health Care.”
423 Jagjit Singh Bhatia and Sagri Sharma, “Telemedicine Endurance - Empowering Care Recipients in Asian Telemedicine Setup,” Studies in Health Technology and Informatics 137 (January 2008): 17–25, http://booksonline.iospress.nl/Content/View.aspx?piid=9181.
McDaid and Park, Online Health: Untangling the Web.
424 Moyer, “Online Patient-Provider Communication: How Will It Fit?”.
425 Moyer, “Online Patient-Provider Communication: How Will It Fit?”.
426 Audiey C. Kao et al., “The Relationship Between Method of Physician Payment and Patient Trust,” JAMA: The Journal of the American Medical Association 280, no. 19 (November 18, 1998): 1708–1714, doi:10.1001/jama.280.19.1708.
Audiey C. Kao et al., “Patients’ Trust in Their Physicians: Effects of Choice, Continuity, and Payment Method,” Journal of General Internal Medicine 13, no. 10 (October 1998): 681–686, http://www.ncbi.nlm.nih.gov/pmc/articles/PMC1500897/.
427 HealthIT.gov, “Benefits of Health IT.”
428 HealthIT.gov, “Benefits of Health IT.”
429 South Dakota Bureau of Information and Telecommunications, “Broadband Benefits for Rural Areas.”
430 ASR Analytics, Florida Agricultural and Mechanical University Public Computer Center Round 2, 14.
433 Representatives of Urban Affairs Coalition, “Telephone Interview.”
434 ASR Analytics, University of Arkansas System Comprehensive Community Infrastructure, 21.
ASR Analytics, Clearwave Communications Comprehensive Community Infrastructure, 18.
ASR Analytics, Lane Council of Governments Comprehensive Community Infrastructure, 10.
ASR Analytics, Merit Network, Inc. Comprehensive Community Infrastructure, 20.
ASR Analytics, OneCommunity Comprehensive Community Infrastructure, 16.
ASR Analytics, OSHEAN, Inc. Comprehensive Community Infrastructure, 18.
ASR Analytics, South Dakota Network Comprehensive Community Infrastructure, 19.
ASR Analytics, Executive Office of the State of West Virginia Comprehensive Community Infrastructure, 21.
435 ASR Analytics, University of Arkansas System Comprehensive Community Infrastructure, 22.
ASR Analytics, Clearwave Communications Comprehensive Community Infrastructure, 18.
ASR Analytics, Lane Council of Governments Comprehensive Community Infrastructure, 10.
ASR Analytics, Merit Network, Inc. Comprehensive Community Infrastructure, 20.
ASR Analytics, OneCommunity Comprehensive Community Infrastructure, 16.
ASR Analytics, OSHEAN, Inc. Comprehensive Community Infrastructure, 18.
ASR Analytics, South Dakota Network Comprehensive Community Infrastructure, 19.
ASR Analytics, Executive Office of the State of West Virginia Comprehensive Community Infrastructure, 21.
436 ASR Analytics, University of Arkansas System Comprehensive Community Infrastructure, 21.
ASR Analytics, Merit Network, Inc. Comprehensive Community Infrastructure, 20.
ASR Analytics, OneCommunity Comprehensive Community Infrastructure, 16.
ASR Analytics, Executive Office of the State of West Virginia Comprehensive Community Infrastructure, 21.
437 ASR Analytics, OSHEAN, Inc. Comprehensive Community Infrastructure, 18.
ASR Analytics, OneCommunity Comprehensive Community Infrastructure, 15.
438 ASR Analytics, University of Arkansas System Comprehensive Community Infrastructure, 23.
ASR Analytics, Lane Council of Governments Comprehensive Community Infrastructure, 17.
ASR Analytics, OneCommunity Comprehensive Community Infrastructure, 14.
ASR Analytics, OSHEAN, Inc. Comprehensive Community Infrastructure, 17.
ASR Analytics, South Dakota Network Comprehensive Community Infrastructure, 18.
ASR Analytics, Executive Office of the State of West Virginia Comprehensive Community Infrastructure, 20.
152
439 ASR Analytics, University of Arkansas System Comprehensive Community Infrastructure, 23.
ASR Analytics, Lane Council of Governments Comprehensive Community Infrastructure, 17.
ASR Analytics, OneCommunity Comprehensive Community Infrastructure, 14.
ASR Analytics, OSHEAN, Inc. Comprehensive Community Infrastructure, 17.
ASR Analytics, South Dakota Network Comprehensive Community Infrastructure, 18.
ASR Analytics, Executive Office of the State of West Virginia Comprehensive Community Infrastructure, 20.
440 ASR Analytics, University of Arkansas System Comprehensive Community Infrastructure, 19.
ASR Analytics, South Dakota Network Comprehensive Community Infrastructure, 18.
441 ASR Analytics, Executive Office of the State of West Virginia Comprehensive Community Infrastructure, 21.
442 ASR Analytics, OSHEAN, Inc. Comprehensive Community Infrastructure, 18.
443 Representatives of OSHEAN, “Telephone Interview.”
444 ASR Analytics, OneCommunity Comprehensive Community Infrastructure, 16.
445 ASR Analytics, University of Arkansas System Comprehensive Community Infrastructure, 15.
446 ASR Analytics, Lane Council of Governments Comprehensive Community Infrastructure, 18.
447 Representatives of Lane Council of Governments, “Telephone Interview.”
448 ASR Analytics, University of Arkansas System Comprehensive Community Infrastructure, 15.
449 Representatives of the University of Arkansas System, “Telephone Interview.”
450 Mossberger, Tolbert, and Anderson, Measuring Change in Internet Use and Broadband Adoption: Comparing BTOP Smart Communities and Other Chicago Neighborhoods.
451 Columbia Telecommunications Corporation, Benefits Beyond the Balance Sheet: Quantifying the Business Case for Fiber-to-the-Premises in Seattle, 2009, http://www.seattle.gov/broadband/docs/SeattleFTTNBenefits_091109.pdf.
Federal Communications Commission, Connecting America: The National Broadband Plan, 2010, http://www.broadband.gov/plan/.
Marlies Van der Wee et al., “Identifying and Quantifying the Indirect Benefits of Broadband Networks: A Bottom-up Approach,” in Moving Forward with Future Technologies: Opening a Platform for All, 2012, https://biblio.ugent.be/input/download?func=downloadFile&recordOId=3259119&fileOId=3259120.
452 Federal Communications Commission, Connecting America: The National Broadband Plan.
Van der Wee et al., “Identifying and Quantifying the Indirect Benefits of Broadband Networks: A Bottom-up Approach.”
453 Atkinson and Castro, Digital Quality of Life: Understanding the Personal and Social Benefits of the Information Technology Revolution.
Columbia Telecommunications Corporation, Benefits Beyond the Balance Sheet: Quantifying the Business Case for Fiber-to-the-Premises in Seattle.
Federal Communications Commission, Connecting America: The National Broadband Plan.
153
Jonathan Rintels, An Action Plan for America Using Technology and Innovation to Address Our Nation’s Critical Challenges - A Report for the New Administration from the Benton Foundation, 2008, http://benton.org/sites/benton.org/files/Benton_Foundation_Action_Plan.pdf.
454 Rintels, An Action Plan for America Using Technology and Innovation to Address Our Nation’s Critical Challenges - A Report for the New Administration from the Benton Foundation.
455 Columbia Telecommunications Corporation, Benefits Beyond the Balance Sheet: Quantifying the Business Case for Fiber-to-the-Premises in Seattle.
Federal Communications Commission, Connecting America: The National Broadband Plan.
IBM, “IBM Survey Reveals New Type of Energy Concern,” IBM News Room (Armonk, NY, August 25, 2011), http://www-03.ibm.com/press/us/en/pressrelease/35271.wss.
Van der Wee et al., “Identifying and Quantifying the Indirect Benefits of Broadband Networks: A Bottom-up Approach.”
456 Atkinson and Castro, Digital Quality of Life: Understanding the Personal and Social Benefits of the Information Technology Revolution.
Federal Communications Commission, Connecting America: The National Broadband Plan.
457 Sean Williams, “Fiber Broadband : A Foundation for Social and Economic Growth” (2013): 67–75.
458 Federal Communications Commission, Connecting America: The National Broadband Plan.
459 Atkinson and Castro, Digital Quality of Life: Understanding the Personal and Social Benefits of the Information Technology Revolution.
Columbia Telecommunications Corporation, Benefits Beyond the Balance Sheet: Quantifying the Business Case for Fiber-to-the-Premises in Seattle.
460 ASR Analytics, Lane Council of Governments Comprehensive Community Infrastructure, 15.
ASR Analytics, Merit Network, Inc. Comprehensive Community Infrastructure, 21.
ASR Analytics, OneCommunity Comprehensive Community Infrastructure, 20.
ASR Analytics, OSHEAN, Inc. Comprehensive Community Infrastructure, 21.
ASR Analytics, South Dakota Network Comprehensive Community Infrastructure, 16.
ASR Analytics, Executive Office of the State of West Virginia Comprehensive Community Infrastructure, 17.
461 ASR Analytics, Lane Council of Governments Comprehensive Community Infrastructure, 16.
ASR Analytics, OSHEAN, Inc. Comprehensive Community Infrastructure, 21.
ASR Analytics, South Dakota Network Comprehensive Community Infrastructure, 16.
ASR Analytics, Executive Office of the State of West Virginia Comprehensive Community Infrastructure, 19.
462 ASR Analytics, Lane Council of Governments Comprehensive Community Infrastructure, 15.
ASR Analytics, Merit Network, Inc. Comprehensive Community Infrastructure, 21.
ASR Analytics, OneCommunity Comprehensive Community Infrastructure, 20.
ASR Analytics, OSHEAN, Inc. Comprehensive Community Infrastructure, 21.
154
ASR Analytics, South Dakota Network Comprehensive Community Infrastructure, 16.
ASR Analytics, Executive Office of the State of West Virginia Comprehensive Community Infrastructure, 17.
463 ASR Analytics, OSHEAN, Inc. Comprehensive Community Infrastructure, 21.
ASR Analytics, Executive Office of the State of West Virginia Comprehensive Community Infrastructure, 17.
ASR Analytics, Massachusetts Technology Park Comprehensive Community Infrastructure, 16.
464 ASR Analytics, South Dakota Network Comprehensive Community Infrastructure, 19.
465 ASR Analytics, OSHEAN, Inc. Comprehensive Community Infrastructure, 22.
466 Representatives of OSHEAN, “Telephone Interview.”
467 ASR Analytics, OneCommunity Comprehensive Community Infrastructure, 23.
468 ASR Analytics, OSHEAN, Inc. Comprehensive Community Infrastructure, 25.
469 Representatives of OSHEAN, “Telephone Interview.”
470 ASR Analytics, Executive Office of the State of West Virginia Comprehensive Community Infrastructure, 23.
471 Representatives of the Executive Office of the State of West Virginia, “E-Mail Communication.”
472 Lee Rainie et al., How the Public Perceives Community Information Systems, Internet and American Life Project (Washington, DC: Pew Research Center, March 01, 2011), http://pewinternet.org/Reports/2011/08-Community-Information-Systems.aspx.
473 Rainie et al., How the Public Perceives Community Information Systems.
474 Gro Sandkjaer Hanssen, “E-Communication: Strengthening the Ties between Councillors and Citizens in Norwegian Local Government?,” Scandinavian Political Studies 31, no. 3 (September 2008): 333–361, doi:10.1111/j.1467-9477.2008.00209.x.
475 James Prieger, The Economic Benefits of Mobile Broadband, School of Public Policy Working Papers (Malibu, CA: Pepperdine University, May 15, 2012), http://digitalcommons.pepperdine.edu/sppworkingpapers/38.
476 Hernando Rojas and Eulalia Puig-i-Abril, “Mobilizers Mobilized: Information, Expression, Mobilization and Participation in the Digital Age,” Journal of Computer-Mediated Communication 14, no. 4 (July 2009): 902–927, doi:10.1111/j.1083-6101.2009.01475.x.
Darrell M. West, Ten Facts about Mobile Broadband (Washington, DC: The Brookings Institution, December 08, 2011), http://www.brookings.edu/research/papers/2011/12/08-mobile-broadband-west.
Michael J. Stern, Alison E. Adams, and Jeffrey Boase, “Rural Community Participation, Social Networks, and Broadband Use: Examples from Localized and National Survey Data,” Agricultural and Resource Economics Review 40, no. 2 (August 2011): 158–171, http://purl.umn.edu/117769.
Stern, Adams, and Boase, “Rural Community Participation, Social Networks, and Broadband Use: Examples from Localized and National Survey Data.”
Shelley Boulianne, “Does Internet Use Affect Engagement? A Meta-Analysis of Research,” Political Communication 26, no. 2 (May 11, 2009): 193–211, doi:10.1080/10584600902854363.
155
Jessica Lavariega Manforti and Jose Marichal, “The Role of Digital Skills in the Formation Trust and Efficacy Among Latinos,” in Western Political Science Association Annual Conference (San Antonio, TX, 2011), http://papers.ssrn.com/sol3/papers.cfm?abstract_id=1767233.
Namsu Park, Kerk F. Kee, and Sebastián Valenzuela, “Being Immersed in Social Networking Environment: Facebook Groups, Uses and Gratifications, and Social Outcomes.,” CyberPsychology & Behavior 12, no. 6 (December 2009): 729–33, doi:10.1089/cpb.2009.0003.
Josh Pasek, Building Social Capital in Young People: The Role of Mass Media and Life Outlook, Working Paper, 2009, http://umich.academia.edu/JoshPasek/Papers/97408/Building_Social_Capital_in_Young_People_The_Role_of_Mass_Media_and_Life_Outlook.
Marko M. Skoric and Grace Kwan, “Do Facebook and Video Games Promote Political Participation Among Youth? Evidence from Singapore,” Journal of E-Democracy and Open Government 3, no. 1 (2011): 70–79, http://www.jedem.org/article/view/49.
Marta Cantijoch, David Cutts, and Rachel Gibson, “Internet Use and Political Engagement: The Role of E-Campaigning as a Pathway to Online Political Participation” (2013), https://escholarship.org/uc/item/538243k2.
Filipe Campante, Ruben Durante, and Francesco Sobbrio, “Politics 2.0: The Multifaceted Effect of Broadband Internet on Political Participation” (2013), http://www.iae.csic.es/investigatorsMaterial/a13174085038513.pdf.
477 Lee Rainie, Kristen Purcell, and Aaron Smith, The Social Side of the Internet, Internet and American Life Project (Washington, DC: Pew Research Center, January 18, 2011), http://pewinternet.org/Reports/2011/The-Social-Side-of-the-Internet.aspx.
478 LaRose et al., Closing the Rural Broadband Gap, Final Technical Report.
479 ASR Analytics, Delaware Department of State (Delaware Division of Libraries) Public Computer Center Round 2, 16.
ASR Analytics, Foundation for California Community Colleges Sustainable Broadband Adoption Round 2, 14.
480 ASR Analytics, Cambridge Housing Authority Public Computer Center Round 2, 9.
ASR Analytics, C.K. Blandin Foundation Sustainable Broadband Adoption Round 2, 12.
ASR Analytics, Future Generations Sustainable Broadband Adoption Round 2, 20.
481 ASR Analytics, Smart Chicago Sustainable Broadband Adoption Round 2, 21.
ASR Analytics, Michigan State University Public Computer Center Round 2, 12.
ASR Analytics, Technology For All, Inc. Public Computer Center Round 2, 12.
490 Representatives of Urban Affairs Coalition, “Telephone Interview.”
491 ASR Analytics, Smart Chicago Sustainable Broadband Adoption Round 2, 21.
492 Representatives of the City of Chicago et al., “Telephone Interview.”
493 ASR Analytics, Future Generations Sustainable Broadband Adoption, 14.
494 Representatives of Future Generations Graduate School, “Telephone Interview.”
495 ASR Analytics, Cambridge Housing Authority Public Computer Center Round 2, 12.
496 Representative of Cambridge Housing Authority, “Telephone Interview.”
497 ASR Analytics, Merit Network, Inc. Comprehensive Community Infrastructure, 23.
ASR Analytics, OneCommunity Comprehensive Community Infrastructure, 21.
ASR Analytics, South Dakota Network Comprehensive Community Infrastructure, 23.
ASR Analytics, Clearwave Communications Comprehensive Community Infrastructure, 21.
498 ASR Analytics, South Dakota Network Comprehensive Community Infrastructure, 23.
499 Hanssen, “E-Communication: Strengthening the Ties between Councillors and Citizens in Norwegian Local Government?”.
500 LaRose et al., Closing the Rural Broadband Gap, Final Technical Report.
501 ASR Analytics, Massachusetts Technology Park Comprehensive Community Infrastructure, 27.
502 Rojas and Puig-i-Abril, “Mobilizers Mobilized: Information, Expression, Mobilization and Participation in the Digital Age.”
West, Ten Facts about Mobile Broadband.
Stern, Adams, and Boase, “Rural Community Participation, Social Networks, and Broadband Use: Examples from Localized and National Survey Data.”
Boulianne, “Does Internet Use Affect Engagement? A Meta-Analysis of Research.”
Manforti and Marichal, “The Role of Digital Skills in the Formation Trust and Efficacy Among Latinos.”
Park, Kee, and Valenzuela, “Being Immersed in Social Networking Environment: Facebook Groups, Uses and Gratifications, and Social Outcomes.”
Pasek, Building Social Capital in Young People: The Role of Mass Media and Life Outlook.
Skoric and Kwan, “Do Facebook and Video Games Promote Political Participation Among Youth? Evidence from Singapore.”
Cantijoch, Cutts, and Gibson, “Internet Use and Political Engagement: The Role of E-Campaigning as a Pathway to Online Political Participation.”
157
Campante, Durante, and Sobbrio, “Politics 2.0: The Multifaceted Effect of Broadband Internet on Political Participation.”
503 Federal Communications Commission, Connecting America: The National Broadband Plan.
504 Julius Genachowski, “Remarks on Broadband Adoption,” 2011, http://www.fcc.gov/document/chairman-genachowski-broadband-adoption.
Judy Hoffman et al., Libraries Connect Communities: Public Library Funding & Technology Access Study 2010-2011 (Digital supplement of American Libraries magazine, June 2011), http://www.ala.org/research/initiatives/plftas/2010_2011.
Carlos A. Manjarrez and Kyle Schoembs, Who’s in the Queue? A Demographic Analysis of Public Access Computer Users and Uses in U.S. Public Libraries, Research Brief Series, No. 4 (IMLS-2011-RB-04) (Washington, DC: Institute of Museum and Library Services, June 2011), http://www.imls.gov/assets/1/AssetManager/Brief2011_04.pdf.
George S. Ford, Internet Use and Labor Market Participation: Additional Insights from New and Old Data, Phoenix Center Perspectives 11-04 (Phoenix Center for Advanced Legal and Economic Policy Studies, August 18, 2011), http://www.phoenix-center.org/perspectives/Perspective11-04Final.pdf.
Common Sense Media, Digital Literacy and Citizenship in the 21st Century: Educating, Empowering, and Protecting America’s Kids (San Francisco, CA, March 2011).
505 Maria E. Wynne and Lane F. Cooper, Power Up: The Campaign for Digital Inclusion (Office of Economic Development and Innovation, Microsoft Corporation, June 2007), http://www.digitalaccess.org/pdf/White_Paper.pdf.
506 Atkinson and Castro, Digital Quality of Life: Understanding the Personal and Social Benefits of the Information Technology Revolution.
507 Alexander J.A.M. van Deursen, “Internet Skills: Vital Assets in an Information Society” (Enschede, The Netherlands: University of Twente, November 01, 2010), doi:10.3990/1.9789036530866.
508 Wynne and Cooper, Power Up: The Campaign for Digital Inclusion.
509 State of Michigan, “The Benefits of Broadband,” August 27, 2012, http://michigan.gov/broadband/0,1607,7-250-48184_48185---,00.html.
510 State of Michigan, “The Benefits of Broadband.”
511 State of Michigan, “The Benefits of Broadband.”
512 Andrew Scarvell, “Digital Literacy and Awareness in Australia’ S New Global Frontier,” in First Media and Information Literacy Forum (Fez, Morocco: UNESCO, 2011), http://scarvell.net/andrew/blog/?page_id=15.
513 Kirsti Ala-Mutka, Learning in Informal Online Networks and Communities (Seville, Spain: Institute for Prospective Technological Studies, 2010), http://ipts.jrc.ec.europa.eu/publications/pub.cfm?id=3059.
514 Christine Redecker, Alexandra Haché, and Clara Centeno, Using Information and Communication Technologies to Promote Education and Employment Opportunities for Immigrants and Ethnic Minorities (Seville, Spain: Institute for Prospective Technological Studies, May 2010), http://ipts.jrc.ec.europa.eu/publications/pub.cfm?id=3219.
158
515 Michael J. Cody et al., “Silver Surfers: Training and Evaluating Internet Use among Older Adult Learners,” Communication Education 48, no. 4 (October 1999): 269–286, doi:10.1080/03634529909379178.
516 Sven Lindmark, Web 2.0: Where Does Europe Stand? (Seville, Spain: The Institute for Prospective Technological Studies, 2009), http://ipts.jrc.ec.europa.eu/publications/pub.cfm?id=2539.
517 Atkinson and Castro, Digital Quality of Life: Understanding the Personal and Social Benefits of the Information Technology Revolution.
518 Atkinson and Castro, Digital Quality of Life: Understanding the Personal and Social Benefits of the Information Technology Revolution.
519 Communications Workers of America, Speed Matters: Benefits of Broadband.
520 Kirsti Ala-Mutka et al., “The Socio-Economic Impact of Social Computing,” in Proceedings of a Validation and Policy Options Workshop, ed. Yves Punie (Seville, Spain: Institute for Prospective Technological Studies, 2008), doi:10.2791/55459.
521 David Osimo, Web 2 .0 in Government: Why and How? (Seville, Spain: Institute for Prospective Technological Studies, 2008), http://ipts.jrc.ec.europa.eu/publications/pub.cfm?id=1565.
522 A.J.A.M. van Deursen and J.A.G.M. van Dijk, “Improving Digital Skills for the Use of Online Public Information and Services,” Government Information Quarterly 26, no. 2 (April 2009): 333–340, doi:10.1016/j.giq.2008.11.002.
Osimo, Web 2 .0 in Government: Why and How?.
523 Osimo, Web 2 .0 in Government: Why and How?.
524 Communications Workers of America, Speed Matters: Benefits of Broadband.
525 State of Michigan, “The Benefits of Broadband.”
526 State of Michigan, “The Benefits of Broadband.”
527 State of Michigan, “The Benefits of Broadband.”
528 Atkinson and Castro, Digital Quality of Life: Understanding the Personal and Social Benefits of the Information Technology Revolution.
529 ASR Analytics, Cambridge Housing Authority Public Computer Center Round 2, 9.
ASR Analytics, Foundation for California Community Colleges Sustainable Broadband Adoption Round 2, 16.
530 ASR Analytics, Cambridge Housing Authority Public Computer Center Round 2, 8.
ASR Analytics, California Emerging Technology Fund Sustainable Broadband Adoption Round 2, 11.
ASR Analytics, Smart Chicago Sustainable Broadband Adoption Round 2, 12.
ASR Analytics, C.K. Blandin Foundation Sustainable Broadband Adoption Round 2, 10.
ASR Analytics, Connect Arkansas Sustainable Broadband Adoption Round 2, 11.
ASR Analytics, Delaware Department of State (Delaware Division of Libraries) Public Computer Center Round 2, 13.
ASR Analytics, Florida Agricultural and Mechanical University Public Computer Center Round 2, 12.
159
ASR Analytics, Foundation for California Community Colleges Sustainable Broadband Adoption Round 2, 8.
ASR Analytics, Future Generations Sustainable Broadband Adoption Round 2, 10.
ASR Analytics, Las Vegas-Clark County Urban League Public Computer Center Round 2, 8.
ASR Analytics, Michigan State University Public Computer Center Round 2, 9.
ASR Analytics, South Carolina State Board for Technical and Comprehensive Education Public Computer Center Round 2, 9.
ASR Analytics, Technology For All, Inc. Public Computer Center Round 2, 8.
ASR Analytics, WorkForce West Virginia Public Computer Center Round 2, 12.
531 ASR Analytics, Cambridge Housing Authority Public Computer Center Round 2, 9.
532 Representative of Cambridge Housing Authority, “Telephone Interview.”
533 ASR Analytics, Foundation for California Community Colleges Sustainable Broadband Adoption Round 2, 8.
534 Representatives of Foundation for California Community Colleges, “Telephone Interview.”
535 ASR Analytics, Technology For All, Inc. Public Computer Center Round 2, 8.
536 ASR Analytics, C.K. Blandin Foundation Sustainable Broadband Adoption Round 2, 11.
537 Representatives of C.K. Blandin Foundation, “Telephone Interview.”
538 Representatives of Foundation for California Community Colleges, “Telephone Interview.”
539 ASR Analytics, MCNC Comprehensive Community Infrastructure, 20.
ASR Analytics, Executive Office of the State of West Virginia Comprehensive Community Infrastructure, 23.
540 ASR Analytics, MCNC Comprehensive Community Infrastructure, 21.
ASR Analytics, Executive Office of the State of West Virginia Comprehensive Community Infrastructure, 23.
541 ASR Analytics, MCNC Comprehensive Community Infrastructure, 19.
ASR Analytics, Executive Office of the State of West Virginia Comprehensive Community Infrastructure, 23.
542 ASR Analytics, MCNC Comprehensive Community Infrastructure, 20.
543 ASR Analytics, Executive Office of the State of West Virginia Comprehensive Community Infrastructure, 24.
544 ASR Analytics, MCNC Comprehensive Community Infrastructure, 19.
545 ASR Analytics, Executive Office of the State of West Virginia Comprehensive Community Infrastructure, 23.
546 Representatives of Foundation for California Community Colleges, “Telephone Interview.”
547 Representatives of Foundation for California Community Colleges, “Telephone Interview.”
160
548 Mossberger, Tolbert, and Anderson, Measuring Change in Internet Use and Broadband Adoption: Comparing BTOP Smart Communities and Other Chicago Neighborhoods.
549 Clint Reed and Impact Management Group, Arkansas Statewide Survey Executive Summary, December 10, 2013, http://www.connect-arkansas.org/sites/default/files/BroadbandSurveyResults2013.pdf.
555 The coefficient is statistically significant at the 5 percent level.
Kuhn and Mansour, “Is Internet Job Search Still Ineffective?,” 29.
556 National Telecommunications and Information Administration, “Post-Award Monitoring Database.”
557 National Telecommunications and Information Administration, “NTIA’s BTOP Map.”
558 Applicable PCC locations are those categorized as Community Based Organization, Library, Non-Profit Organization, Public Housing, or Tribal in the CAC data. Categories in the CAC that are not applicable are Unreported, Community College, Institution of Higher Education, For-Profit Organization, Government Facility, Medical or Healthcare Provider, Public Safety, and School (K-12).
559 Samantha Becker et al., Opportunity for All: How the American Public Benefits from Internet Access at U.S. Libraries (Washington, DC: Institute of Museum and Library Services, March 2010), http://www.gatesfoundation.org/learning/Pages/us-libraries-report-opportunity-for-all.aspx.
560 Becker et al., Opportunity for All: How the American Public Benefits from Internet Access at U.S. Libraries, 37.
561 ASR Analytics, Progress towards BTOP Goals: Interim Report on PCC and SBA Case Studies.
562 National Telecommunications and Information Administration, “NTIA’s BTOP Map.”
563 Several PCC grantees did not have any locations listed in the CAC. For each of these grantees, ASR reviewed publically available project applications to determine county-level service areas. Grantee applications are available at the following: http://www2.ntia.doc.gov/.
564 United States Bureau of Labor Statistics, “Local Area Unemployment Statistics” (Washington, DC, April 01, 2014), http://www.bls.gov/lau/.
565 United States Department of Labor and United States Bureau of Labor Statistics, Geographic Profile of Employment and Unemployment, 2011, Bulletin 2774 (Washington, DC, September 2012), http://www.bls.gov/opub/gp/pdf/gp11full.pdf.
566 National Telecommunications and Information Administration, “Post-Award Monitoring Database.”
161
567 United States Department of Labor, “Changes in Basic Minimum Wages in Non-Farm Employment Under State Law: Selected Years 1968 to 2013,” Wage and Hour Division (WHD) (Washington, DC, December 2013), http://www.dol.gov/whd/state/stateMinWageHis.htm.
568 ASR Analytics, Michigan State University Public Computer Center Round 2, 12.
ASR Analytics, Florida Agricultural and Mechanical University Public Computer Center Round 2, 8.
569 Becker et al., Opportunity for All: How the American Public Benefits from Internet Access at U.S. Libraries, 71.
570 Becker et al., Opportunity for All: How the American Public Benefits from Internet Access at U.S. Libraries, A3.38–9.
571 Becker et al., Opportunity for All: How the American Public Benefits from Internet Access at U.S. Libraries, A3.40.
572 A full description of the methodology used to calculate unique users is provided in ASR Analytics, Deliverable P: Raw Data Delivery, Broadband Technology Opportunities Program Evaluation Study (Order Number D10PD18645) (Potomac, MD).
National Telecommunications and Information Administration, “Post-Award Monitoring Database.”
573 Becker et al., Opportunity for All: How the American Public Benefits from Internet Access at U.S. Libraries.
574 The coefficient is statistically significant at the 5 percent level.
Kuhn and Mansour, “Is Internet Job Search Still Ineffective?,” 29.
575 National Telecommunications and Information Administration, “Post-Award Monitoring Database.”
576 National Telecommunications and Information Administration, “Post-Award Monitoring Database.”
577 ASR Analytics, Progress towards BTOP Goals: Interim Report on PCC and SBA Case Studies.
578 National Telecommunications and Information Administration, “NTIA’s BTOP Map.”
579 Several PCC grantees did not have any locations listed in the CAC. For each of these grantees, ASR reviewed publically available project applications to determine county-level service areas. Grantee applications are available at the following: http://www2.ntia.doc.gov/.
580 United States Census Bureau, “2005-2009 ACS 5-Year Summary File,” American Community Survey (Washington, DC, December 14, 2010), http://www.census.gov/acs/www/data_documentation/2009_release/.
United States Bureau of Labor Statistics, “Local Area Unemployment Statistics.”
581 United States Department of Labor and United States Bureau of Labor Statistics, Geographic Profile of Employment and Unemployment, 2011.
582 National Telecommunications and Information Administration, “Post-Award Monitoring Database.”
583 United States Department of Labor, “Changes in Basic Minimum Wages in Non-Farm Employment Under State Law: Selected Years 1968 to 2013.”
584 ASR Analytics, C.K. Blandin Foundation Sustainable Broadband Adoption Round 2, 8.
162
ASR Analytics, Foundation for California Community Colleges Sustainable Broadband Adoption Round 2, 13.
ASR Analytics, Connect Arkansas Sustainable Broadband Adoption Round 2, 8.
585 Becker et al., Opportunity for All: How the American Public Benefits from Internet Access at U.S. Libraries, 71.
586 Becker et al., Opportunity for All: How the American Public Benefits from Internet Access at U.S. Libraries, A3.38–9.
587 Becker et al., Opportunity for All: How the American Public Benefits from Internet Access at U.S. Libraries, A3.40.
588 Becker et al., Opportunity for All: How the American Public Benefits from Internet Access at U.S. Libraries.
589 A full description of the methodology used to calculate unique users is provided in ASR Analytics, Deliverable P: Raw Data Delivery.
National Telecommunications and Information Administration, “Post-Award Monitoring Database.”
590 Grimes, Ren, and Stevens (2009) estimated twelve specifications of the effect of connectivity on firm productivity. Estimated productivity increases due to broadband adoption ranged from 7.6 percent to 13 percent. All twelve estimates of the effect of broadband adoption were statistically significant at the 5 percent level.
Grimes, Ren, and Stevens, “The Need for Speed: Impacts of Internet Connectivity on Firm Productivity,” 33.
591 National Telecommunications and Information Administration, “Post-Award Monitoring Database.”
592 Quantria Strategies LLC, Effective Federal Income Tax Rates Faced By Small Businesses in the United States (Cheverly, MD, MD: United States Small Business Administration Office of Advocacy, April 2009), http://www.sba.gov/advocacy/effective-federal-income-tax-rates-faced-small-businesses-united-states.
593 Data are collected by State Broadband Initiative (SBI) grantees for all fifty states, the District of Columbia, and other United States territories. SBI grantees collected data from about 3,400 broadband providers out of the more than 4,600 contacted.
National Telecommunications and Information Administration and Federal Communications Commission, “Technical Overview,” National Broadband Map (Washington, DC, April 25, 2014), http://www.broadbandmap.gov/about/technical-overview.
594 National Telecommunications and Information Administration and Federal Communications Commission, “State Broadband Initiative.”
595 United States Census Bureau, “2010 TIGER/Line® Shapefiles.”
National Telecommunications and Information Administration and Federal Communications Commission, “State Broadband Initiative.”
596 Suffolk County, Massachusetts was removed from the service area because it contained no connected CAIs and is different from the listed counties in size and demographic makeup.
597 National Telecommunications and Information Administration, “Application Search.”
163
598 CAIs, POPs, or both were redacted from the CAC for several grantees. ASR used CAI and POP locations listed in APR/PPR attachments for these grantees to define the grantee service areas, where necessary.
National Telecommunications and Information Administration, “NTIA’s BTOP Map.”
National Telecommunications and Information Administration, “Post-Award Monitoring Database.”
United States Census Bureau, “2010 TIGER/Line® Shapefiles.”
599 1,269 counties fell within the service area of an awarded BTOP grant only, 183 fell within a BIP service area only, and 292 fell within both a BTOP and BIP service area, for a total of 1,744 unique counties.
600 Gillett et al., Measuring Broadband’s Economic Impact.
601 NTIA requested that the evaluation study team use this definition, which is different from the definition used in the NOFA: advertised speeds of at least 768 kbps downstream and at least 200 kbps upstream.
National Telecommunications and Information Administration, “Broadband Technology Opportunities Program Notices.”
602 National Telecommunications and Information Administration and Federal Communications Commission, “State Broadband Initiative.”
603 Stenberg et al., Broadband Internet’s Value for Rural America.
604 National Telecommunications and Information Administration and Federal Communications Commission, “State Broadband Initiative.”
605 National Telecommunications and Information Administration and Federal Communications Commission, “State Broadband Initiative.”
606 As implemented in the Match function in the Matching package for R.
Gillett et al., Measuring Broadband’s Economic Impact.
Jasjeet S. Sekhon, “Multivariate and Propensity Score Matching Software with Automated Balance Optimization: The Matching Package for R,” Journal of Statistical Software 42, no. 7 (June 2011).
R Development Core Team, R: A Language and Environment for Statistical Computing (Vienna, Austria, 2012), http://www.r-project.org/.
607 The natural logarithm of population was used because the untransformed population is very non-normally distributed.
608 Based on a review of the literature, ASR requested broadband populations based on a speed threshold of 200 kbps downstream and upstream. Data on these speed thresholds were not collected for the NBM.
National Telecommunications and Information Administration, “Broadband Technology Opportunities Program Notices.”
609 Economics and Statistics Administration and National Telecommunications and Information Administration, Exploring the Digital Nation: Computer and Internet Use at Home (United States Department of Commerce, November 09, 2011), http://www.ntia.doc.gov/report/2011/exploring-digital-nation-computer-and-internet-use-home.
610 ASR Analytics, Progress towards BTOP Goals: Interim Report on PCC and SBA Case Studies.
164
National Telecommunications and Information Administration, “Broadband Technology Opportunities Program Notices.”
611 In Interim Report 1 and Interim Report 2, the elderly population was composed of those sixty-five years old or older. The FCC NBM team provided data to ASR on an elderly population composed of those over sixty years of age. Therefore, ASR uses this age cutoff to define the elderly population in the Final Report.
ASR Analytics, Progress towards BTOP Goals: Interim Report on PCC and SBA Case Studies.
ASR Analytics, Progress towards BTOP Goals: Second Interim Report on CCI, PCC, and SBA Case Studies, Broadband Technology Opportunities Program Evaluation Study (Order Number D10PD18645) (Potomac, MD, 2014).
National Telecommunications and Information Administration and Federal Communications Commission, “State Broadband Initiative.”
612 National Telecommunications and Information Administration and Federal Communications Commission, “State Broadband Initiative.”
613 United States Census Bureau, “2006-2010 ACS 5-Year Summary File.”
614 National Telecommunications and Information Administration and Federal Communications Commission, “State Broadband Initiative.”
615 National Telecommunications and Information Administration, “Broadband Technology Opportunities Program Notices,” 3797.
616 ASR Analytics, BTOP Evaluation Study Design.
617 Crandall, Lehr, and Litan, The Effects of Broadband Deployment on Output and Employment: A Cross-Sectional Analysis of U.S. Data.
618 Kolko, Broadband and Local Growth, 19.
619 Czernich et al., “Broadband Infrastructure and Economic Growth,” 521.
620 A.T. Kearney, Assessing the Economic Benefits of Digital Inclusion, 2011, http://www.infoxchange.net.au/sites/default/files/Assessing the economic benefits of digital inclusion_0.pdf.
621 Kuhn and Mansour, “Is Internet Job Search Still Ineffective?”.
622 Gillett et al., Measuring Broadband’s Economic Impact.
623 Grimes, Ren, and Stevens, “The Need for Speed: Impacts of Internet Connectivity on Firm Productivity.”
624 LECG Ltd., Economic Impact of Broadband: An Empirical Study, 36–7.
625 Peter Dolton and Panu Pelkonen, The Impact of Computer Use, Computer Skills and Computer Use Intensity: Evidence from WERS 2004 (London, August 2007), http://eprints.lse.ac.uk/19389/.
626 H. Scott Matthews and Eric Williams, “Telework Adoption and Energy Use in Building and Transport Sectors in the United States and Japan,” Journal of Infrastructure Systems 11, no. 1 (March 2005): 21–30, doi:10.1061/(ASCE)1076-0342(2005)11:1(21).
627 Ernest P. Goss and Joseph M. Phillips, “How Information Technology Affects Wages: Evidence Using Internet Usage as a Proxy for IT Skills,” Journal of Labor Research 23, no. 3 (September 2002): 463–474, doi:10.1007/s12122-002-1047-x.
165
628 P. DiMaggio and B. Bonikowski, “Make Money Surfing the Web? The Impact of Internet Use on the Earnings of U.S. Workers,” American Sociological Review 73, no. 2 (April 01, 2008): 227–250, doi:10.1177/000312240807300203.
629 Connected Nation, The Economic Impact of Stimulating Broadband Nationally (Washington, DC, February 21, 2008), 17, http://www.connectednation.org/_documents/connected_nation_eis_study_full_report_02212008.pdf.
630 Digital Impact Group, “The Economic Impact of Digital Exclusion” 19104, no. 215 (2010), http://www.econsult.com/articles/030810_costofexclusion.pdf.
631 Laurence Baker et al., “Effect of an Internet-Based System for Doctor-Patient Communication on Health Care Spending,” Journal of the American Medical Informatics Association 12, no. 5 (2005): 530–6, doi:10.1197/jamia.M1778.
632 Catherine Klersy et al., “Economic Impact of Remote Patient Monitoring: An Integrated Economic Model Derived from a Meta-Analysis of Randomized Controlled Trials in Heart Failure,” European Journal of Heart Failure 13, no. 4 (April 2011): 450–9, doi:10.1093/eurjhf/hfq232.
633 George S. Ford and Sherry G. Ford, Internet Use and Depression Among the Elderly, Phoenix Center Policy Paper, October 2009, 23, http://www.phoenix-center.org/pcpp/PCPP38Final.pdf.
634 Lance Brendan Young et al., “Impact of Telemedicine Intensive Care Unit Coverage on Patient Outcomes: A Systematic Review and Meta-Analysis,” Archives of Internal Medicine 171, no. 6 (March 28, 2011): 498–506, doi:10.1001/archinternmed.2011.61.
635 PriceWaterhouseCoopers, Champion for Digital Inclusion: The Economic Case for Digital Inclusion, October 2009, http://www.parliamentandinternet.org.uk/uploads/Final_report.pdf.
636 A.T. Kearney, Assessing the Economic Benefits of Digital Inclusion.
637 SQW Consulting, Broadband in the Home: An Analysis of the Financial Costs and Benefits, Final Report to the Post Office, September 18, 2008, http://www.sqw.co.uk/files/8713/8712/1234/83.pdf.
638 Allen Consulting Group, Quantifying the Possible Economic Gains of Getting More Australian Households Online, 25.
639 Czernich et al., “Broadband Infrastructure and Economic Growth,” 524.
640 Czernich et al. (2011) estimated three specifications of the effect of broadband introduction on GDP. The estimated effects ranged from 2.7 percent to 3.9 percent. All three effects were statistically significant at the 1 percent level.
Czernich et al., “Broadband Infrastructure and Economic Growth,” 521.
641 The coefficient is statistically significant at the 5 percent level.
LECG Ltd., Economic Impact of Broadband: An Empirical Study, 36–7.
642 A full description of the method used to decompose output to the county level is provided in ASR Analytics, Deliverable P: Raw Data Delivery.
United States Bureau of Economic Analysis, “Gross Domestic Product by State,” Regional Economic Accounts (Washington, DC, April 01, 2014), http://www.bea.gov/regional/index.htm.
United States Bureau of Economic Analysis, “State Quarterly Personal Income,” Regional Economic Accounts (Washington, DC, April 01, 2014), http://www.bea.gov/regional/index.htm.
166
United States Bureau of Economic Analysis, “Local Area Personal Income,” Regional Economic Accounts (Washington, DC, April 01, 2014), http://www.bea.gov/regional/index.htm.
United States Census Bureau, “County Business Patterns” (Washington, DC, April 01, 2014), http://www.census.gov/econ/cbp/.
643 This estimate is statistically significant at the 1 percent level.
Kolko, Broadband and Local Growth, 38.
644 The coefficient is statistically significant at the 10 percent level, with a p-value of 5.2 percent.
Gillett et al., Measuring Broadband’s Economic Impact.
645 United States Bureau of Labor Statistics, “Local Area Unemployment Statistics.”
646 United States Bureau of Labor Statistics, “Local Area Unemployment Statistics.”
647 The Allen Consulting Group (2010) estimated the average value of a broadband Internet connection to an Australian household to be A$148 per week. The Allen Consulting Group (2010) also states that United States Internet users spend about half the time online that Australian Internet users spend online. Therefore, ASR used half of the estimated benefit to Australians. According to the Australian Bureau of Statistics (2011), average weekly gross household income from wages and salaries in Australia was A$2,173 in 2009 to 2010. The percent of income value was computed as (148 × 0.5) ÷ 2173.
Allen Consulting Group, Quantifying the Possible Economic Gains of Getting More Australian Households Online, 25.
Australian Bureau of Statistics, Household Income and Income Distribution, Australia, 2009-10 (Canberra, ACT, August 30, 2011), 26, http://www.abs.gov.au/AUSSTATS/[email protected]/Lookup/6523.0Main+Features12009-10.
648 Federal Communications Commission, “Census Tract Information Mapped for Internet Access Services Faster than 200 Kbps in at Least One Direction,” Local Telephone Competition and Broadband Deployment (Washington, DC, March 04, 2014), http://transition.fcc.gov/wcb/iatd/comp.html.
National Telecommunications and Information Administration and Federal Communications Commission, “State Broadband Initiative.”
649 National Telecommunications and Information Administration and Federal Communications Commission, “State Broadband Initiative.”
Federal Communications Commission, “Census Tract Information Mapped for Internet Access Services Faster than 200 Kbps in at Least One Direction.”
United States Census Bureau, “2006-2010 ACS 5-Year Summary File.”
167
Glossary Acronym Definition
ACA Affordable Care Act
ACS American Community Survey
AFN Austin Free-Net
APEX Advancement through Pardons and Expungement
APR Annual Performance Progress Report
AR SAVES Arkansas Stroke Assistance through Virtual Emergency Support
ASR ASR Analytics, LLC
BAA Broadband Awareness and Adoption
BEA United States Bureau of Economic Analysis
BIP Broadband Initiatives Program
BLS Bureau of Labor Statistics
BPL Bridgeport Public Library
BRN Business Resource Network
BTOP Broadband Technology Opportunities Program
C.K. Blandin C.K. Blandin Foundation
CAC Connecting America’s Communities
CAI Community Anchor Institution
CCI Comprehensive Community Infrastructure
CCRI Community College of Rhode Island
CETF California Emerging Technology Fund
CforAT Center for Accessible Technology
CHA Cambridge Housing Authority
Clearwave Clearwave Communications
CPCWD Center for Public Computing and Workforce Development
DDL Delaware Division of Libraries
DPW Providence Department of Public Works
EMR Electronic Medical Record
EMS Emergency Medical Service
ER Emergency Room
ESA Economics and Statistics Administration
FAMU Florida Agricultural and Mechanical University
168
Acronym Definition
FBI Federal Bureau of Investigation
FCC Federal Communications Commission
FCCC Foundation for California Community Colleges
FTE Full-Time Equivalent
FTTP Fiber to the Premises
Future Generations Future Generations Graduate School
Gbps Gigabits per second
GDP Gross Domestic Product
GPS Global Positioning System
GSP Gross State Product
GVC Great Valley Center
IBOP Illinois Broadband Opportunities Partnership
ICF ICF International
ICU Intensive Care Unit
IMPLAN Impact Analysis for Planning
IP Internet Protocol
ISP Internet Service Provider
kbps Kilobits per second
KCPL Kanawha County Public Library
LAUS Local Area Unemployment Statistics
LCOG Lane Council of Governments
LCS Lee County Schools
LVUL Las Vegas-Clark County Urban League
MassTech Massachusetts Technology Park
MBC Mid-Atlantic Broadband Communities Corporation
NCREN North Carolina Research and Education Network
NOFA Notice of Funds Availability
NRAO National Radio Astronomy Observatory
NTIA National Telecommunications and Information Administration
NVPCC Nevada Public Computer Centers
OECD Organisation for Economic Co-operation and Development
PCC Public Computer Centers
POP Point of Presence
PPR Quarterly Performance Progress Report
REACH-3MC Rural Education Anchor Community Healthcare Michigan Middle Mile Collaborative
Recovery Act American Recovery and Reinvestment Act of 2009
RIEMA Rhode Island Emergency Management Agency
SBA Small Business Administration
SBA Sustainable Broadband Adoption
SCMW South Central Michigan Works!
SCTCS South Carolina Technical College System
SDN South Dakota Network, LLC
SIRN State Interoperable Radio Network
SIU Southern Illinois University
SNAP Supplemental Nutrition Assistance Program
TANF Temporary Assistance for Needy Families
TFA Technology For All
TXC2 Texas Connects Coalition
UAC Urban Affairs Coalition
UAMS University of Arkansas for Medical Sciences
UAS University of Arkansas System
UDWI Utilities District of Western Indiana
UME University of Minnesota Extension
UNC University of North Carolina
UNCP University of North Carolina at Pembroke
USD United States Dollar
USDA United States Department of Agriculture
West Virginia Executive Office of the State of West Virginia
WFWV WorkForce West Virginia
170
Acronym Definition
WIC Women, Infants, and Children
WVU West Virginia University
Zayo Zayo Bandwidth, LLC
ZCTA ZIP Code Tabulation Area
171
Bibliography A.T. Kearney. Assessing the Economic Benefits of Digital Inclusion, 2011.
http://www.infoxchange.net.au/sites/default/files/Assessing the economic benefits of digital inclusion_0.pdf.
Ala-Mutka, Kirsti. Learning in Informal Online Networks and Communities. Seville, Spain: Institute for Prospective Technological Studies, 2010. http://ipts.jrc.ec.europa.eu/publications/pub.cfm?id=3059.
Ala-Mutka, Kirsti, Marcelino Cabrera, Romina Cachia, Clara Centeno, Sven Lindmark, David Osimo, Rukiye Ozcivelek, et al. “The Socio-Economic Impact of Social Computing.” In Proceedings of a Validation and Policy Options Workshop, edited by Yves Punie. Seville, Spain: Institute for Prospective Technological Studies, 2008. doi:10.2791/55459.
Allen Consulting Group, The. Quantifying the Possible Economic Gains of Getting More Australian Households Online, November 2010. http://www.acilallen.com.au/cms_files/acgquantifyingonline2010.pdf.
Andes, Scott M., and Daniel D. Castro. Opportunities and Innovations in the Mobile Broadband Economy. The Information Technology and Innovation Foundation, 2010. http://www.itif.org/files/2010-mobile-innovations.pdf.
ASR Analytics. BTOP Evaluation Study Design. Potomac, MD, January 30, 2012. http://www.ntia.doc.gov/files/ntia/publications/study_design_order_number_d10pd18645_-_revised_2012-01-30.pdf.
———. C.K. Blandin Foundation Sustainable Broadband Adoption Round 2. Broadband Technology Opportunities Program Evaluation Study (Order Number D10PD18645). Potomac, MD, August 15, 2013.
———. “C.K. Blandin Foundation: Minnesota Intelligent Rural Communities Sustainable Broadband Adoption (SBA).” Broadband Technology Opportunities Program Evaluation Study (Order Number D10PD18645). Potomac, MD, June 18, 2012.
———. California Emerging Technology Fund Sustainable Broadband Adoption Round 2. Broadband Technology Opportunities Program Evaluation Study (Order Number D10PD18645). Potomac, MD, September 09, 2013.
———. “California Emerging Technology Fund: Broadband Awareness and Adoption Sustainable Broadband Adoption (SBA).” Broadband Technology Opportunities Program Evaluation Study (Order Number D10PD18645). Potomac, MD, June 18, 2012.
———. “Cambridge Housing Authority Community Computer Centers Public Computer Centers (PCC).” Broadband Technology Opportunities Program Evaluation Study (Order Number D10PD18645). Potomac, MD, June 18, 2012.
172
———. Cambridge Housing Authority Public Computer Center Round 2. Broadband Technology Opportunities Program Evaluation Study (Order Number D10PD18645). Potomac, MD, July 10, 2013.
———. “City of Chicago: Smart Chicago Sustainable Broadband Adoption (SBA).” Broadband Technology Opportunities Program Evaluation Study (Order Number D10PD18645). Potomac, MD, June 18, 2012.
———. Clearwave Communications Comprehensive Community Infrastructure. Broadband Technology Opportunities Program Evaluation Study (Order Number D10PD18645). Potomac, MD, December 03, 2013.
———. “Connect Arkansas Expanding Broadband Use in Arkansas through Education Sustainable Broadband Adoption (SBA).” Broadband Technology Opportunities Program Evaluation Study (Order Number D10PD18645). Potomac, MD, June 18, 2012.
———. Connect Arkansas Sustainable Broadband Adoption Round 2. Broadband Technology Opportunities Program Evaluation Study (Order Number D10PD18645). Potomac, MD, September 10, 2013.
———. Delaware Department of State (Delaware Division of Libraries) Public Computer Center Round 2. Broadband Technology Opportunities Program Evaluation Study (Order Number D10PD18645). Potomac, MD, December 19, 2013.
———. “Delaware Division of Libraries: Job/Learning Labs Public Computer Center (PCC).” Broadband Technology Opportunities Program Evaluation Study (Order Number D10PD18645). Potomac, MD, June 18, 2012.
———. Deliverable P: Raw Data Delivery. Broadband Technology Opportunities Program Evaluation Study (Order Number D10PD18645). Potomac, MD, forthcoming.
———. Executive Office of the State of West Virginia Comprehensive Community Infrastructure. Broadband Technology Opportunities Program Evaluation Study (Order Number D10PD18645). Potomac, MD, March 25, 2014.
———. “Florida A&M University: The FAMU Center for Public Computing and Workforce Development Public Computer Center (PCC).” Broadband Technology Opportunities Program Evaluation Study (Order Number D10PD18645). Potomac, MD, June 18, 2012.
———. Florida Agricultural and Mechanical University Public Computer Center Round 2. Broadband Technology Opportunities Program Evaluation Study (Order Number D10PD18645). Potomac, MD, September 13, 2013.
———. Foundation for California Community Colleges Sustainable Broadband Adoption Round 2. Broadband Technology Opportunities Program Evaluation Study (Order Number D10PD18645). Potomac, MD, September 12, 2013.
———. “Foundation for California Community Colleges: California Connects Sustainable Broadband Adoption (SBA).” Broadband Technology Opportunities Program Evaluation Study (Order Number D10PD18645). Potomac, MD, June 18, 2012.
———. “Future Generations Graduate School: Equipping West Virginia’s Fire and Rescue Squads with Technology and Training to Serve Communities Sustainable Broadband Adoption
173
(SBA).” Broadband Technology Opportunities Program Evaluation Study (Order Number D10PD18645). Potomac, MD, June 18, 2012.
———. Future Generations Sustainable Broadband Adoption Round 2. Broadband Technology Opportunities Program Evaluation Study (Order Number D10PD18645). Potomac, MD, August 08, 2013.
———. Lane Council of Governments Comprehensive Community Infrastructure. Broadband Technology Opportunities Program Evaluation Study (Order Number D10PD18645). Potomac, MD, April 04, 2014.
———. “Las Vegas Clark County Urban League: Access to Computer Technology and Instruction in Online Networking (ACTION) Public Computer Center (PCC).” Broadband Technology Opportunities Program Evaluation Study (Order Number D10PD18645). Potomac, MD, June 18, 2012.
———. Las Vegas-Clark County Urban League Public Computer Center Round 2. Broadband Technology Opportunities Program Evaluation Study (Order Number D10PD18645). Potomac, MD, August 01, 2013.
———. Massachusetts Technology Park Comprehensive Community Infrastructure. Broadband Technology Opportunities Program Evaluation Study (Order Number D10PD18645). Potomac, MD, March 19, 2014.
———. MCNC Comprehensive Community Infrastructure. Broadband Technology Opportunities Program Evaluation Study (Order Number D10PD18645). Potomac, MD, March 04, 2014.
———. Merit Network, Inc. Comprehensive Community Infrastructure. Broadband Technology Opportunities Program Evaluation Study (Order Number D10PD18645). Potomac, MD, March 04, 2014.
———. Michigan State University Public Computer Center Round 2. Broadband Technology Opportunities Program Evaluation Study (Order Number D10PD18645). Potomac, MD, August 29, 2013.
———. “Michigan State University: Evidence Based Computer Centers II Public Computer Centers (PCC).” Broadband Technology Opportunities Program Evaluation Study (Order Number D10PD18645). Potomac, MD, June 18, 2012.
———. Mid-Atlantic Broadband Cooperative Comprehensive Community Infrastructure. Broadband Technology Opportunities Program Evaluation Study (Order Number D10PD18645). Potomac, MD, February 06, 2014.
———. OneCommunity Comprehensive Community Infrastructure. Broadband Technology Opportunities Program Evaluation Study (Order Number D10PD18645). Potomac, MD, April 21, 2014.
———. OSHEAN, Inc. Comprehensive Community Infrastructure. Broadband Technology Opportunities Program Evaluation Study (Order Number D10PD18645). Potomac, MD, March 10, 2014.
———. Progress towards BTOP Goals: Interim Report on PCC and SBA Case Studies. Broadband Technology Opportunities Program Evaluation Study (Order Number D10PD18645).
174
Potomac, MD, October 15, 2012. http://www.ntia.doc.gov/report/2012/progress-towards-btop-goals-interim-report-pcc-and-sba-case-studies.
———. Progress towards BTOP Goals: Second Interim Report on CCI, PCC, and SBA Case Studies. Broadband Technology Opportunities Program Evaluation Study (Order Number D10PD18645). Potomac, MD, 2014.
———. “SC State Board for Technical and Comprehensive Education: Reach for Success Public Computer Centers (PCC).” Broadband Technology Opportunities Program Evaluation Study (Order Number D10PD18645). Potomac, MD, June 18, 2012.
———. Short-Term Economic Impacts Report. Broadband Technology Opportunities Program Evaluation Study (Order Number D10PD18645). Potomac, MD, September 30, 2013. http://www2.ntia.doc.gov/files/short-term_economic_impacts_report.pdf.
———. Smart Chicago Sustainable Broadband Adoption Round 2. Broadband Technology Opportunities Program Evaluation Study (Order Number D10PD18645). Potomac, MD, July 10, 2013.
———. South Carolina State Board for Technical and Comprehensive Education Public Computer Center Round 2. Broadband Technology Opportunities Program Evaluation Study (Order Number D10PD18645). Potomac, MD, September 11, 2013.
———. South Dakota Network Comprehensive Community Infrastructure. Broadband Technology Opportunities Program Evaluation Study (Order Number D10PD18645). Potomac, MD, February 05, 2014.
———. Technology For All, Inc. Public Computer Center Round 2. Broadband Technology Opportunities Program Evaluation Study (Order Number D10PD18645). Potomac, MD, September 16, 2013.
———. “Technology For All, Inc.: Texas Connects Coalition Public Computer Center (PCC).” Broadband Technology Opportunities Program Evaluation Study (Order Number D10PD18645). Potomac, MD, June 18, 2012.
———. University of Arkansas System Comprehensive Community Infrastructure. Broadband Technology Opportunities Program Evaluation Study (Order Number D10PD18645). Potomac, MD, March 11, 2014.
———. Urban Affairs Coalition Sustainable Broadband Adoption Round 2. Broadband Technology Opportunities Program Evaluation Study (Order Number D10PD18645). Potomac, MD, September 10, 2013.
———. “Urban Affairs Coalition: Freedom Rings Sustainable Broadband Adoption (SBA).” Broadband Technology Opportunities Program Evaluation Study (Order Number D10PD18645). Potomac, MD, June 18, 2012.
———. WorkForce West Virginia Public Computer Center Round 2. Broadband Technology Opportunities Program Evaluation Study (Order Number D10PD18645). Potomac, MD, September 23, 2013.
175
———. “WorkForce West Virginia: One-Stop Public Computer Center Modernization Public Computer Center (PCC).” Broadband Technology Opportunities Program Evaluation Study (Order Number D10PD18645). Potomac, MD, June 18, 2012.
———. Zayo Group Comprehensive Community Infrastructure. Broadband Technology Opportunities Program Evaluation Study (Order Number D10PD18645). Potomac, MD, February 06, 2014.
Atkinson, Robert D., and Daniel D. Castro. Digital Quality of Life: Understanding the Personal and Social Benefits of the Information Technology Revolution. Washington, DC: Information Technology and Information Foundation, October 01, 2008. http://www.itif.org/files/DQOL.pdf.
Atkinson, Robert D., Stephen J. Ezell, Scott M. Andes, Daniel D. Castro, and Richard Bennett. The Internet Economy 25 Years After .com: Transforming Commerce & Life. Washington, DC: Information Technology and Innovation Foundation, March 15, 2010. http://www.itif.org/publications/internet-economy-25-years-after-com.
Australian Bureau of Statistics. Household Income and Income Distribution, Australia, 2009-10. Canberra, ACT, August 30, 2011. http://www.abs.gov.au/AUSSTATS/[email protected]/Lookup/6523.0Main+Features12009-10.
Baker, Laurence, Jeffrey Rideout, Paul Gertler, and Kristiana Raube. “Effect of an Internet-Based System for Doctor-Patient Communication on Health Care Spending.” Journal of the American Medical Informatics Association 12, no. 5 (2005): 530–6. doi:10.1197/jamia.M1778.
Becker, Samantha, Michael D. Crandall, Karen E. Fisher, Bo Kinney, Carol Landry, and Anita Rocha. Opportunity for All: How the American Public Benefits from Internet Access at U.S. Libraries. Washington, DC: Institute of Museum and Library Services, March 2010. http://www.gatesfoundation.org/learning/Pages/us-libraries-report-opportunity-for-all.aspx.
Bell, Bradford S., and Jessica E. Federman. “E-Learning in Postsecondary Education.” The Future of Children 23, no. 1 (2013). http://futureofchildren.org/futureofchildren/publications/docs/23_01_08.pdf.
Bell, Robert. Partners In Progress: The Final Report on the MIRC Demonstration Communities 2010-2012, 2013. www.intelligentcommunity.org.
Bhatia, Jagjit Singh, and Sagri Sharma. “Telemedicine Endurance - Empowering Care Recipients in Asian Telemedicine Setup.” Studies in Health Technology and Informatics 137 (January 2008): 17–25. http://booksonline.iospress.nl/Content/View.aspx?piid=9181.
Boulianne, Shelley. “Does Internet Use Affect Engagement? A Meta-Analysis of Research.” Political Communication 26, no. 2 (May 11, 2009): 193–211. doi:10.1080/10584600902854363.
Briskin, Jessica, Michael Montalto-Rook, Tutaleni I. Asino, and Yaozu Dong. “26B-K: Smart Apps: An Analysis of Educational Applications Available on Smartphones and the Implications for Mobile Learning (D&D).” In Annual Meeting of the AECT Convention. Hyatt Regency Orange County, Anaheim, CA: Association for Educational Communications and Technology, 2010. http://convention2.allacademic.com/one/aect/aect10/index.php?click_key=1&cmd=Multi+Search+Search+Load+Publication&publication_id=430393&PHPSESSID=jgkifdqag6qgtckajo0k657jc7.
176
British Educational Communications and Technology Agency. Extending Opportunity: Final Report of the Minister’s Taskforce on Home Access to Technology. Coventry, UK, July 2008. http://dera.ioe.ac.uk/8285/.
Broadband for America. “Health Care.” Washington, DC, 2011. http://www.broadbandforamerica.com/benefits/healthcare.
Burton, Mark L., and Michael J. Hicks. The Residential and Commercial Benefits of Rural Broadband: Evidence from Central Appalachia. Huntington, WV: Center for Business and Economic Research Marshall University, July 2005. http://www.marshall.edu/cber/research/broadband/Final Rural Broadband July 2005.pdf.
Business Link. “Advantages and Disadvantages of Using Social Media.” Online Business Networking and Social Networking, August 28, 2012. http://www.businesslink.gov.uk/bdotg/action/detail?itemId=1081912566&type=RESOURCES.
———. “Benefits of Selling Online.” Create an Online Shop, August 28, 2012. http://www.businesslink.gov.uk/bdotg/action/detail?itemId=1073792461&type=RESOURCES.
Campante, Filipe, Ruben Durante, and Francesco Sobbrio. “Politics 2.0: The Multifaceted Effect of Broadband Internet on Political Participation” (2013). http://www.iae.csic.es/investigatorsMaterial/a13174085038513.pdf.
Cantijoch, Marta, David Cutts, and Rachel Gibson. “Internet Use and Political Engagement: The Role of E-Campaigning as a Pathway to Online Political Participation” (2013). https://escholarship.org/uc/item/538243k2.
Chou, Wen-ying Sylvia, Abby Prestin, Claire Lyons, and Kuang-yi Wen. “Web 2.0 for Health Promotion: Reviewing the Current Evidence.” American Journal of Public Health 103, no. 1 (2013). http://ajph.aphapublications.org/doi/pdf/10.2105/AJPH.2012.301071.
Cody, Michael J., Deborah Dunn, Shari Hoppin, and Pamela Wendt. “Silver Surfers: Training and Evaluating Internet Use among Older Adult Learners.” Communication Education 48, no. 4 (October 1999): 269–286. doi:10.1080/03634529909379178.
Columbia Telecommunications Corporation. Benefits Beyond the Balance Sheet: Quantifying the Business Case for Fiber-to-the-Premises in Seattle, 2009. http://www.seattle.gov/broadband/docs/SeattleFTTNBenefits_091109.pdf.
Common Sense Media. Digital Literacy and Citizenship in the 21st Century: Educating, Empowering, and Protecting America’s Kids. San Francisco, CA, March 2011.
Communications Workers of America. Speed Matters: Benefits of Broadband. Washington, DC, 2009. http://files.cwa-union.org/speedmatters/CWA_Benefits_of_Broadbandr_2010.pdf.
Connected Nation. The Economic Impact of Stimulating Broadband Nationally. Washington, DC, February 21, 2008. http://www.connectednation.org/_documents/connected_nation_eis_study_full_report_02212008.pdf.
Crandall, Robert W., William H. Lehr, and Robert E. Litan. The Effects of Broadband Deployment on Output and Employment: A Cross-Sectional Analysis of U.S. Data. Issues in Economic
177
Policy. Issues in Economic Policy. Washington, DC: The Brookings Institution, July 2007. http://www.brookings.edu/research/papers/2007/06/labor-crandall.
Creswell, J W, and V L Plano Clark. Designing and Conducting Mixed Methods Research. Thousand Oaks, CA: SAGE Publications, 2007.
Czernich, Nina, Oliver Falck, Tobias Kretschmer, and Ludger Woessmann. “Broadband Infrastructure and Economic Growth.” The Economic Journal 121, no. 552 (May 12, 2011): 505–532. doi:10.1111/j.1468-0297.2011.02420.x.
Darby, Larry F., Joseph P. Jr. Fuhr, and Stephen B. Pociask. The Internet Ecosystem: Employment Impacts of National Broadband Policy. Washington, DC: The American Consumer Institute, January 28, 2010. http://www.theamericanconsumer.org/wp-content/uploads/2010/01/aci-jobs-study-final1.pdf.
Dean, Michael Ann. “Using the Internet in the Job Search.” In Employment Options for Foreign Service Family Members, 31–48. Washington, DC: Family Liaison Office, United States Department of State, 2001. http://www.state.gov/m/dghr/flo/c21652.htm.
Denzin, Norman K, and Yvonna S Lincoln. Collecting and Interpreting Qualitative Materials. Edited by Norman K Denzin and Yvonna S Lincoln. 3rd ed. Thousand Oaks, CA: SAGE Publications, 2008.
Digital Impact Group. “The Economic Impact of Digital Exclusion” 19104, no. 215 (2010). http://www.econsult.com/articles/030810_costofexclusion.pdf.
DiMaggio, P., and B. Bonikowski. “Make Money Surfing the Web? The Impact of Internet Use on the Earnings of U.S. Workers.” American Sociological Review 73, no. 2 (April 01, 2008): 227–250. doi:10.1177/000312240807300203.
Dolton, Peter, and Panu Pelkonen. The Impact of Computer Use, Computer Skills and Computer Use Intensity: Evidence from WERS 2004. London, August 2007. http://eprints.lse.ac.uk/19389/.
Economics and Statistics Administration, and National Telecommunications and Information Administration. Exploring the Digital Nation: Computer and Internet Use at Home. United States Department of Commerce, November 09, 2011. http://www.ntia.doc.gov/report/2011/exploring-digital-nation-computer-and-internet-use-home.
Eisenhardt, Kathleen M. “Building Theories from Case Study Research.” The Academy of Management Review 14, no. 4 (1989): 532–550.
Fairlie, Robert W. The Effects of Home Computers on School Enrollment. Working Paper, September 2003. http://cjtc.ucsc.edu/docs/r_schoolcomp6.pdf.
Fairlie, Robert W., and Samantha H. Grunberg. “Access to Technology and the Transfer Function of Community Colleges: Evidence from a Field Experiment” (2013). https://www.econstor.eu/dspace/bitstream/10419/90111/1/dp7764.pdf.
Federal Communications Commission. “Census Tract Information Mapped for Internet Access Services Faster than 200 Kbps in at Least One Direction.” Local Telephone Competition and Broadband Deployment. Washington, DC, March 04, 2014. http://transition.fcc.gov/wcb/iatd/comp.html.
178
———. Connecting America: The National Broadband Plan, 2010. http://www.broadband.gov/plan/.
Florida Department of Transportation and Construction Estimating Institute. “Construction Management Development and Bond Guarantee Program: Working with the Florida Department of Transportation.” Accessed May 06, 2014. http://www.dot.state.fl.us/equalopportunityoffice/BDISS/CEI_CMDP_BGP_Brochure.pdf.
Ford, George S. Internet Use and Labor Market Participation: Additional Insights from New and Old Data. Phoenix Center Perspectives 11-04. Phoenix Center for Advanced Legal and Economic Policy Studies, August 18, 2011. http://www.phoenix-center.org/perspectives/Perspective11-04Final.pdf.
Ford, George S., and Sherry G. Ford. Internet Use and Depression Among the Elderly. Phoenix Center Policy Paper, October 2009. http://www.phoenix-center.org/pcpp/PCPP38Final.pdf.
Gangadharan Ph.D., Seeta, Kistine Carolan MSS, and Kayshin Chan MPH. KEYSPOT Model: A Home Away from Home: An Evaluation of the Philadelphia Freedom Rings Partnership, 2013.
Genachowski, Julius. “Broadband: Our Enduring Engine for Prosperity and Opportunity.” In NARUC Conference. Washington, DC, 2010. http://hraunfoss.fcc.gov/edocs_public/attachmatch/DOC-296262A1.pdf.
———. “Remarks on Broadband Adoption,” 2011. http://www.fcc.gov/document/chairman-genachowski-broadband-adoption.
Gikas, Joanne, and Michael M. Grant. “Mobile Computing Devices in Higher Education: Student Perspectives on Learning with Cellphones, Smartphones & Social Media.” Internet and Higher Education 19 (2013): 18–26. https://www.academia.edu/3748701/Mobile_Computing_Devices_in_Higher_Education_Student_Perspectives_on_Learning_with_Cellphones_Smartphones_and_Social_Media.
Gillett, Sharon E., William H. Lehr, Carlos A. Osorio, and Marvin A. Sirbu. Measuring Broadband’s Economic Impact. National Technical Assistance, Training, Research, and Evaluation Project #99-07-13829. Washington, DC: United States Department of Commerce, February 28, 2006. http://cfp.mit.edu/publications/CFP_Papers/Measuring_bb_econ_impact-final.pdf.
Goss, Ernest P., and Joseph M. Phillips. “How Information Technology Affects Wages: Evidence Using Internet Usage as a Proxy for IT Skills.” Journal of Labor Research 23, no. 3 (September 2002): 463–474. doi:10.1007/s12122-002-1047-x.
Grimes, Arthur, Cleo Ren, and Phillip Stevens. “The Need for Speed: Impacts of Internet Connectivity on Firm Productivity” (2009). http://papers.ssrn.com/sol3/papers.cfm?abstract_id=1604247.
Hanssen, Gro Sandkjaer. “E-Communication: Strengthening the Ties between Councillors and Citizens in Norwegian Local Government?” Scandinavian Political Studies 31, no. 3 (September 2008): 333–361. doi:10.1111/j.1467-9477.2008.00209.x.
HealthIT.gov. “Benefits of Health IT,” August 28, 2012. http://www.healthit.gov/patients-families/health-it-makes-health-care-convenient.
179
Henkel, John. “Buying Drugs Online: It’s Convenient and Private, but Beware of ‘Rogue Sites,’” November 10, 2011. http://www.fda.gov/Drugs/EmergencyPreparedness/BioterrorismandDrugPreparedness/ucm137269.htm.
Hoffman, Judy, John Carlo Bertot, Denise M. Davis, and Larra Clark. Libraries Connect Communities: Public Library Funding & Technology Access Study 2010-2011. Digital supplement of American Libraries magazine, June 2011. http://www.ala.org/research/initiatives/plftas/2010_2011.
Hulbert, Linda Ann, and Regina C. McBride. “Utilizing Videoconferencing in Library Education: A Team Teaching Approach.” Journal of Education for Library and Information Science 45, no. 1 (2004): 25–35. http://www.jstor.org/stable/40323919.
Hyland, Marie, Richard Layte, Sean Lyons, Selina McCoy, and Mary Silles. “Are Classroom Internet Use and Academic Performance Higher after Government Broadband Subsidies to Primary Schools?” (2013). http://www.econstor.eu/handle/10419/88520.
IBM. “IBM Survey Reveals New Type of Energy Concern.” IBM News Room. Armonk, NY, August 25, 2011. http://www-03.ibm.com/press/us/en/pressrelease/35271.wss.
IBM Learning Solutions. IBM’s Learning Transformation Story. Somers, NY: IBM Global Services, June 2004. http://www-304.ibm.com/easyaccess/fileserve?contentid=183268.
Ito, Mizuko, Heather Horst, Matteo Brittanit, Danah Boyd, Becky Herr-Stephenson, Patricia G. Lange, C.J. Pascoe, and Laura Robinson. Living and Learning with New Media Summary of Findings from the Digital Youth Project. The John D. and Catherine T. MacArthur Foundation Reports on Digital Media and Learning, November 2008. http://digitalyouth.ischool.berkeley.edu/files/report/digitalyouth-WhitePaper.pdf.
Jayakar, Krishna, and Eun-A Park. “Broadband Availability and Employment: An Analysis of County-Level Data from the National Broadband Map.” Journal of Information Policy 3 (2013): 181–200. http://jip.vmhost.psu.edu/ojs/index.php/jip/article/viewArticle/121.
Kao, Audiey C., Diane C. Green, Nancy A. Davis, Jeffrey P. Koplan, and Paul D. Cleary. “Patients’ Trust in Their Physicians: Effects of Choice, Continuity, and Payment Method.” Journal of General Internal Medicine 13, no. 10 (October 1998): 681–686. http://www.ncbi.nlm.nih.gov/pmc/articles/PMC1500897/.
Kao, Audiey C., Diane C. Green, Alan M. Zaslavsky, Jeffrey P. Koplan, and Paul D. Cleary. “The Relationship Between Method of Physician Payment and Patient Trust.” JAMA: The Journal of the American Medical Association 280, no. 19 (November 18, 1998): 1708–1714. doi:10.1001/jama.280.19.1708.
Klersy, Catherine, Annalisa De Silvestri, Gabriella Gabutti, Arturo Raisaro, Moreno Curti, François Regoli, and Angelo Auricchio. “Economic Impact of Remote Patient Monitoring: An Integrated Economic Model Derived from a Meta-Analysis of Randomized Controlled Trials in Heart Failure.” European Journal of Heart Failure 13, no. 4 (April 2011): 450–9. doi:10.1093/eurjhf/hfq232.
Kolko, Jed. Broadband and Local Growth, August 21, 2010. http://ssrn.com/abstract=1680597.
180
Kuhn, Peter, and Hani Mansour. “Is Internet Job Search Still Ineffective?” Forthcoming in The Economic Journal (December 2013). doi:10.1111/ecoj.12119.
LaRose, Robert, Jennifer L. Gregg, Sharon Stover, Joseph Straubhaar, and Nobuya Inagaki. Closing the Rural Broadband Gap, Final Technical Report, November 30, 2008. https://www.msu.edu/~larose/ruralbb/.
Lauer, George. “Seniors Who Use Internet Could Reap Health Benefits, Studies Show,” December 01, 2009. http://www.ihealthbeat.org/features/2009/seniors-who-use-internet-could-reap-health-benefits-studies-show.aspx.
LECG Ltd. Economic Impact of Broadband: An Empirical Study. London, UK, February 22, 2009. http://www.connectivityscorecard.org/images/uploads/media/Report_BroadbandStudy_LECG_March6.pdf.
Lehr, William H., Marvin Sirbu, and Sharon Gillett. “Broadband Open Access: Lessons from Municipal Network Case Studies,” 2008.
Lincoln, Yvonna S, and Egon G Guba. Naturalistic Inquiry. Beverly Hills, CA: SAGE Publications, 1985.
Lindmark, Sven. Web 2.0: Where Does Europe Stand? Seville, Spain: The Institute for Prospective Technological Studies, 2009. http://ipts.jrc.ec.europa.eu/publications/pub.cfm?id=2539.
Lombard, Matthew, Jennifer Snyder-Duch, and Cheryl Campanella Bracken. “Content Analysis in Mass Communication: Assessment and Reporting of Intercoder Reliability.” Human Communication Research 28, no. 4 (2002): 587–604.
Lusis, Ingrida, and Pam Mason. Paradigm Shift: The New World of Hearing Health Care Delivery, 2012.
Manforti, Jessica Lavariega, and Jose Marichal. “The Role of Digital Skills in the Formation Trust and Efficacy Among Latinos.” In Western Political Science Association Annual Conference. San Antonio, TX, 2011. http://papers.ssrn.com/sol3/papers.cfm?abstract_id=1767233.
Manjarrez, Carlos A., and Kyle Schoembs. Who’s in the Queue? A Demographic Analysis of Public Access Computer Users and Uses in U.S. Public Libraries. Research Brief Series, No. 4 (IMLS-2011-RB-04). Washington, DC: Institute of Museum and Library Services, June 2011. http://www.imls.gov/assets/1/AssetManager/Brief2011_04.pdf.
Matthews, H. Scott, and Eric Williams. “Telework Adoption and Energy Use in Building and Transport Sectors in the United States and Japan.” Journal of Infrastructure Systems 11, no. 1 (March 2005): 21–30. doi:10.1061/(ASCE)1076-0342(2005)11:1(21).
McDaid, David, and A-La Park. Online Health: Untangling the Web, 2010.
Means, Barbara, Yukie Toyama, Robert Murphy, Marianne Bakia, and Karla Jones. Evaluation of Evidence-Based Practices in Online Learning: A Meta-Analysis and Review of Online Learning Studies. Washington, DC: United States Department of Education, September 2010. http://www2.ed.gov/rschstat/eval/tech/evidence-based-practices/finalreport.pdf.
181
Miller, Stephen. “Online Tools Help Consumers Make Cost-Effective Decisions on Drugs, Routine Care.” Alexandria, VA: Society for Human Resource Management, November 23, 2010. http://www.shrm.org/hrdisciplines/benefits/Articles/Pages/CostTools.aspx.
Moody, Ruth H., and Michael P. Bobic. “Teaching the Net Generation without Leaving the Rest of Us Behind: How Technology in the Classroom Influences Student Composition.” Politics & Policy 39, no. 2 (April 29, 2011): 169–194. doi:10.1111/j.1747-1346.2011.00287.x.
Moran, Juan, Richard Ferdig, P. David Pearson, James Wardrop, and Robert Blomeyer. “Technology and Reading Performance in the Middle-School Grades: A Meta-Analysis with Recommendations for Policy and Practice.” Journal of Literacy Research 40, no. 1 (January 2008): 6–58. doi:10.1080/10862960802070483.
Mossberger, Karen, Caroline Tolbert, and Christopher Anderson. Measuring Change in Internet Use and Broadband Adoption: Comparing BTOP Smart Communities and Other Chicago Neighborhoods, 2014.
Moyer, Cheryl A. “Online Patient-Provider Communication: How Will It Fit?” The Electronic Journal of Communication 17, no. 3 & 4 (2007). http://www.cios.org/EJCPUBLIC/017/3/01732.HTML.
National Telecommunications and Information Administration. “About.” BroadbandUSA: Connecting America’s Communities. Washington, DC, June 11, 2012. http://www2.ntia.doc.gov/about.
———. “Application Search.” Broadband USA, 2014. http://www.ntia.doc.gov/legacy/broadbandgrants/applications/results.htm.
———. Broadband Technology Opportunities Program (BTOP) Quarterly Program Status Report, February 12, 2014. http://www.ntia.doc.gov/files/ntia/publications/ntia_btop_19th_quarterly_report.pdf.
———. Broadband Technology Opportunities Program (BTOP) Quarterly Program Status Report, May 2014. http://www.ntia.doc.gov/files/ntia/publications/ntia_btop_20th_qtrly_report.pdf.
———. “Broadband Technology Opportunities Program Notices.” Washington, DC, January 22, 2010. http://www.ntia.doc.gov/files/ntia/publications/fr_btopnofa_100115_0.pdf.
———. “BTOP Evaluation Study.” Program Reports, 2013. http://www2.ntia.doc.gov/BTOP-Reports#evaluation.
———. “Post-Award Monitoring Database,” April 11, 2014.
———. “Statement of Work for Broadband Technology Opportunities Program (BTOP) Evaluation Study,” July 26, 2010. http://www2.ntia.doc.gov/files/btop_sow.pdf.
National Telecommunications and Information Administration, and Federal Communications Commission. “State Broadband Initiative,” May 12, 2014.
———. “Technical Overview.” National Broadband Map. Washington, DC, April 25, 2014. http://www.broadbandmap.gov/about/technical-overview.
182
Nuechterlein, Jonathan E., and Philip J. Weiser. Digital Crossroads: American Telecommunications Policy in the Internet Age. Cambridge, MA: The MIT Press, 2005.
OECD. “Broadband Networks and Open Access.” OECD Digital Economy Papers no. 218 (March 04, 2013).
Office of Governor Terry McAuliffe press release. “Governor McAuliffe Announces 110 New Jobs for Charlotte County,” April 30, 2014. http://www.mbc-va.com/news/details/id/51/governor-mcauliffe-announces-110-new-job.
Osimo, David. Web 2 .0 in Government: Why and How? Seville, Spain: Institute for Prospective Technological Studies, 2008. http://ipts.jrc.ec.europa.eu/publications/pub.cfm?id=1565.
Park, Namsu, Kerk F. Kee, and Sebastián Valenzuela. “Being Immersed in Social Networking Environment: Facebook Groups, Uses and Gratifications, and Social Outcomes.” CyberPsychology & Behavior 12, no. 6 (December 2009): 729–33. doi:10.1089/cpb.2009.0003.
Pasek, Josh. Building Social Capital in Young People: The Role of Mass Media and Life Outlook. Working Paper, 2009. http://umich.academia.edu/JoshPasek/Papers/97408/Building_Social_Capital_in_Young_People_The_Role_of_Mass_Media_and_Life_Outlook.
Passey, Don, Colin Rogers, Joan Machell, and Gilly McHugh. The Motivational Effect of ICT on Pupils. RR523. Lancaster, UK: University of Lancaster, April 2004. https://www.education.gov.uk/publications/RSG/ICTSCH/Page1/RR523.
Perez, Roger. “The Advantages of Internet Job Searching.” Livestrong, August 09, 2010. http://www.livestrong.com/article/199545-the-advantages-of-internet-job-searching/.
PriceWaterhouseCoopers. Champion for Digital Inclusion: The Economic Case for Digital Inclusion, October 2009. http://www.parliamentandinternet.org.uk/uploads/Final_report.pdf.
Prieger, James. “The Broadband Digital Divide and the Economic Benefits of Mobile Broadband for Rural Areas” (2012). http://papers.ssrn.com/sol3/papers.cfm?abstract_id=2258112.
———. The Economic Benefits of Mobile Broadband. School of Public Policy Working Papers. Malibu, CA: Pepperdine University, May 15, 2012. http://digitalcommons.pepperdine.edu/sppworkingpapers/38.
Protheroe, Nancy. “Technology and Student Achievement.” Principal, November 2005. http://www.naesp.org/resources/2/Principal/2005/N-Dp46.pdf.
Quantria Strategies LLC. Effective Federal Income Tax Rates Faced By Small Businesses in the United States. Cheverly, MD, MD: United States Small Business Administration Office of Advocacy, April 2009. http://www.sba.gov/advocacy/effective-federal-income-tax-rates-faced-small-businesses-united-states.
R Development Core Team. R: A Language and Environment for Statistical Computing. Vienna, Austria, 2012. http://www.r-project.org/.
Rainie, Lee, Kristen Purcell, Tony Siesfeld, and Mayur Patel. How the Public Perceives Community Information Systems. Internet and American Life Project. Washington, DC: Pew Research
183
Center, March 01, 2011. http://pewinternet.org/Reports/2011/08-Community-Information-Systems.aspx.
Rainie, Lee, Kristen Purcell, and Aaron Smith. The Social Side of the Internet. Internet and American Life Project. Washington, DC: Pew Research Center, January 18, 2011. http://pewinternet.org/Reports/2011/The-Social-Side-of-the-Internet.aspx.
Redecker, Christine, Alexandra Haché, and Clara Centeno. Using Information and Communication Technologies to Promote Education and Employment Opportunities for Immigrants and Ethnic Minorities. Seville, Spain: Institute for Prospective Technological Studies, May 2010. http://ipts.jrc.ec.europa.eu/publications/pub.cfm?id=3219.
Reed, Clint, and Impact Management Group. Arkansas Statewide Survey Executive Summary, December 10, 2013. http://www.connect-arkansas.org/sites/default/files/BroadbandSurveyResults2013.pdf.
Representative of Cambridge Housing Authority. “E-Mail Communication,” May 02, 2014.
———. “Telephone Interview,” April 29, 2014.
Representative of Connect Arkansas. “E-Mail Communication,” May 23, 2014.
———. “Telephone Interview,” May 01, 2014.
Representative of Michigan State University. “E-Mail Communication,” April 30, 2014.
Representative of OneCommunity. “Telephone Interview,” May 01, 2014.
Representative of OSHEAN. “E-Mail Communication,” May 09, 2014.
Representative of Zayo Group. “Telephone Interview,” April 29, 2014.
Representatives of C.K. Blandin Foundation. “Telephone Interview,” April 29, 2014.
Representatives of Chicago Smart Communities. “Interview with Authors,” February 28, 2013.
Representatives of Clearwave. “Telephone Interview,” April 29, 2014.
Representatives of Florida Agricultural and Mechanical University. “Telephone Interview,” May 01, 2014.
Representatives of Foundation for California Community Colleges. “Telephone Interview,” April 28, 2014.
Representatives of Future Generations Graduate School. “Telephone Interview,” May 05, 2014.
Representatives of Lane Council of Governments. “Telephone Interview,” April 28, 2014.
Representatives of Las Vegas Urban League. “Telephone Interview,” April 28, 2014.
184
Representatives of MCNC. “Telephone Interview,” April 29, 2014.
Representatives of Merit Network Inc. “Telephone Interview,” May 01, 2014.
Representatives of Michigan State University. “Telephone Interview,” April 30, 2014.
Representatives of Mid-Atlantic Broadband Communities Corporation. “Telephone Interview,” May 01, 2014.
Representatives of OSHEAN. “Telephone Interview,” April 30, 2014.
Representatives of South Carolina Technical College System. “Telephone Interview,” April 30, 2014.
Representatives of South Dakota Network. “Telephone Interview,” April 30, 2014.
Representatives of Technology For All. “Telephone Interview,” April 29, 2014.
Representatives of the California Emerging Technology Fund. “Telephone Interview,” May 01, 2014.
Representatives of the City of Chicago, Representatives of LISC/Chicago, Representatives of Chicago Public Library, and Representatives of Chicago Community Trust. “Telephone Interview,” April 30, 2014.
Representatives of the Delaware Division of Libraries. “Telephone Interview,” April 30, 2014.
Representatives of the Executive Office of the State of West Virginia. “E-Mail Communication,” May 15, 2014.
———. “Telephone Interview,” April 29, 2014.
Representatives of the Massachusetts Broadband Initiative. “Telephone Interview,” May 02, 2014.
Representatives of the University of Arkansas System. “Telephone Interview,” May 02, 2014.
Representatives of Urban Affairs Coalition. “Telephone Interview,” April 30, 2014.
Representatives of WorkForce West Virginia. “Telephone Interview,” April 30, 2014.
Rintels, Jonathan. An Action Plan for America Using Technology and Innovation to Address Our Nation’s Critical Challenges - A Report for the New Administration from the Benton Foundation, 2008. http://benton.org/sites/benton.org/files/Benton_Foundation_Action_Plan.pdf.
Rohman, Ibrahim Kholilul, and Erik Bohlin. “Impact of Broadband Speed on Household Income: Comparing OECD and BIC” (2013). http://www.econstor.eu/handle/10419/88531.
Rojas, Hernando, and Eulalia Puig-i-Abril. “Mobilizers Mobilized: Information, Expression, Mobilization and Participation in the Digital Age.” Journal of Computer-Mediated Communication 14, no. 4 (July 2009): 902–927. doi:10.1111/j.1083-6101.2009.01475.x.
185
Rural Utilities Service, and National Telecommunications and Information Administration. “Broadband Initiatives Program & Broadband Technology Opportunities Program.” Federal Register 74, no. 130 (July 09, 2009): 33104–34. http://www.gpo.gov/fdsys/pkg/FR-2009-07-09/pdf/FR-2009-07-09.pdf.
Scarvell, Andrew. “Digital Literacy and Awareness in Australia’ S New Global Frontier.” In First Media and Information Literacy Forum. Fez, Morocco: UNESCO, 2011. http://scarvell.net/andrew/blog/?page_id=15.
Sekhon, Jasjeet S. “Multivariate and Propensity Score Matching Software with Automated Balance Optimization: The Matching Package for R.” Journal of Statistical Software 42, no. 7 (June 2011).
Shapley Research Associates, and Texas Center for Educational Research. Final Outcomes for a Four–Year Study (2004–05 to 2007–08). Evaluation of the Texas Technology Immersion Pilot (eTxTIP), January 2009. http://www.tcer.org/research/etxtip/.
Shuler, Carly. Pockets of Potential: Using Mobile Technologies to Promote Children’s Learning. New York, NY: The Joan Gans Cooney Center, January 2009. http://joanganzcooneycenter.org/Reports-23.html.
Skoric, Marko M., and Grace Kwan. “Do Facebook and Video Games Promote Political Participation Among Youth? Evidence from Singapore.” Journal of E-Democracy and Open Government 3, no. 1 (2011): 70–79. http://www.jedem.org/article/view/49.
South Dakota Bureau of Information and Telecommunications. “Broadband Benefits for Rural Areas,” February 01, 2011. http://broadband.sd.gov/Benefits-Rural.aspx.
SQW Consulting. Broadband in the Home: An Analysis of the Financial Costs and Benefits. Final Report to the Post Office, September 18, 2008. http://www.sqw.co.uk/files/8713/8712/1234/83.pdf.
Stansberry, Susan, and Stephoni Case. “26B-E: Teaching with Facebook as a Learning Management System (TED).” In Annual Meeting of the AECT Convention. Hyatt Regency Orange County, Anaheim, CA: Association for Educational Communications and Technology, 2010. http://convention2.allacademic.com/one/aect/aect10/index.php?click_key=1&cmd=Multi+Search+Search+Load+Publication&publication_id=430535&PHPSESSID=jgkifdqag6qgtckajo0k657jc7.
State of Michigan. “The Benefits of Broadband,” August 27, 2012. http://michigan.gov/broadband/0,1607,7-250-48184_48185---,00.html.
Stenberg, Peter, Mitchell Morehart, Stephen Vogel, John Cromartie, Vince Breneman, and Dennis Brown. Broadband Internet’s Value for Rural America. ERR-78. United States Department of Agriculture Economic Research Service, August 2009. http://www.ers.usda.gov/publications/err-economic-research-report/err78.aspx.
Stern, Michael J., Alison E. Adams, and Jeffrey Boase. “Rural Community Participation, Social Networks, and Broadband Use: Examples from Localized and National Survey Data.” Agricultural and Resource Economics Review 40, no. 2 (August 2011): 158–171. http://purl.umn.edu/117769.
186
United States Bureau of Economic Analysis. “Gross Domestic Product by State.” Regional Economic Accounts. Washington, DC, April 01, 2014. http://www.bea.gov/regional/index.htm.
———. “Local Area Personal Income.” Regional Economic Accounts. Washington, DC, April 01, 2014. http://www.bea.gov/regional/index.htm.
———. “State Quarterly Personal Income.” Regional Economic Accounts. Washington, DC, April 01, 2014. http://www.bea.gov/regional/index.htm.
United States Bureau of Labor Statistics. “Local Area Unemployment Statistics.” Washington, DC, April 01, 2014. http://www.bls.gov/lau/.
United States Census Bureau. “2005-2009 ACS 5-Year Summary File.” American Community Survey. Washington, DC, December 14, 2010. http://www.census.gov/acs/www/data_documentation/2009_release/.
———. “2006-2010 ACS 5-Year Summary File.” American Community Survey. Washington, DC, December 08, 2011. http://www.census.gov/acs/www/data_documentation/2010_release/.
———. “2010 TIGER/Line® Shapefiles.” Washington, DC, June 19, 2012. http://www.census.gov/geo/www/cob/cbf_counties.html.
———. “County Business Patterns.” Washington, DC, April 01, 2014. http://www.census.gov/econ/cbp/.
United States Department of Labor. “Changes in Basic Minimum Wages in Non-Farm Employment Under State Law: Selected Years 1968 to 2013.” Wage and Hour Division (WHD). Washington, DC, December 2013. http://www.dol.gov/whd/state/stateMinWageHis.htm.
United States Department of Labor, and United States Bureau of Labor Statistics. Geographic Profile of Employment and Unemployment, 2011. Bulletin 2774. Washington, DC, September 2012. http://www.bls.gov/opub/gp/pdf/gp11full.pdf.
USDA Economic Research Service. “Rural Digital Economy: Online Activities.” Briefing Rooms, August 13, 2009. http://ers.usda.gov/Briefing/Telecom/demandservice.htm.
Valentine, Gil, Jackie Marsh, Charles Pattie, and BMRB. Children and Young People’s Home Use of ICT for Educational Purposes: The Impact on Attainment at Key Stages 1-4. RB672, August 2005. https://www.education.gov.uk/publications/RSG/Parentscarersandfamilies/Page12/RB672.
Van der Wee, Marlies, Menno Driesse, Bernd Vandersteegen, Pierre Van Wijnsberge, Sofie Verbrugge, Bert Sadowski, and Mario Pickavet. “Identifying and Quantifying the Indirect Benefits of Broadband Networks: A Bottom-up Approach.” In Moving Forward with Future Technologies: Opening a Platform for All, 2012. https://biblio.ugent.be/input/download?func=downloadFile&recordOId=3259119&fileOId=3259120.
Van Deursen, A.J.A.M., and J.A.G.M. van Dijk. “Improving Digital Skills for the Use of Online Public Information and Services.” Government Information Quarterly 26, no. 2 (April 2009): 333–340. doi:10.1016/j.giq.2008.11.002.
187
Van Deursen, Alexander J.A.M. “Internet Skills: Vital Assets in an Information Society.” Enschede, The Netherlands: University of Twente, November 01, 2010. doi:10.3990/1.9789036530866.
West, Darrell M. “Mobile Learning: Transforming Education, Engaging Students, and Improving Outcomes” (2013). http://safeschooluniversity.com/pdfs/issues/eLearning/motivation/MobileLearning.pdf.
———. Ten Facts about Mobile Broadband. Washington, DC: The Brookings Institution, December 08, 2011. http://www.brookings.edu/research/papers/2011/12/08-mobile-broadband-west.
White, C.B., C.A. Moyer, D.T. Stern, and S.J. Katz. “A Content Analysis of E-Mail Communication Between Patients and Their Providers: Patients Get the Message.” Journal of the American Medical Informatics Association 11, no. 4 (2004): 260–267.
Whiteacre, Brian, and Lara Brooks. “Do Broadband Adoption Rates Impact a Community’s Health?” Behaviour & Information Technology (2013).
Williams, Sean. “Fiber Broadband : A Foundation for Social and Economic Growth” (2013): 67–75.
Wittwer, Jörg, and Martin Senkbeil. “Is Students’ Computer Use at Home Related to Their Mathematical Performance at School?” Computers & Education 50, no. 4 (May 2008): 1558–1571. doi:10.1016/j.compedu.2007.03.001.
Wynne, Maria E., and Lane F. Cooper. Power Up: The Campaign for Digital Inclusion. Office of Economic Development and Innovation, Microsoft Corporation, June 2007. http://www.digitalaccess.org/pdf/White_Paper.pdf.
Yin, Robert K. Case Study Research: Design and Methods. 4th ed. Los Angeles, CA: SAGE Publications, 2009.
Young, Lance Brendan, Paul S. Chan, Xin Lu, Brahmajee K. Nallamothu, Comilla Sasson, and Peter M. Cram. “Impact of Telemedicine Intensive Care Unit Coverage on Patient Outcomes: A Systematic Review and Meta-Analysis.” Archives of Internal Medicine 171, no. 6 (March 28, 2011): 498–506. doi:10.1001/archinternmed.2011.61.
Zhou, Y., M. Kanter, J. Wang, and T. Garrido. “Improved Quality at Kaiser Permanente through Email between Physicians and Patients.” Health Affairs 7 (2009): 1370–1375.