21
National VMT Development Procedure Highway Information Seminar October 22 - 25, 2012 Patrick Zhang, PE [email protected] , 202-366-1941 Office of Highway Policy Information, FHWA
| Date post: | 27-Dec-2015 |
| Category: |
Documents |
| Upload: | alexander-hopkins |
| View: | 216 times |
| Download: | 0 times |

National VMT Development Procedure
Highway Information SeminarOctober 22 - 25, 2012Patrick Zhang, [email protected] , 202-366-1941Office of Highway Policy Information, FHWA

Objective
To illustrate how national vehicle miles travelled data are developed and the criticalness of State submitted data

What National VMT Is About
The National VMT data has four key components:
VMT by roadway functional class and vehicle type National registered vehicles by six vehicle types, National total fuel consumed Fuel efficiency - MPG for each of the six vehicle groups
National VMT data are often referred to as VM-1 data because the table has all the information is named VM-1.
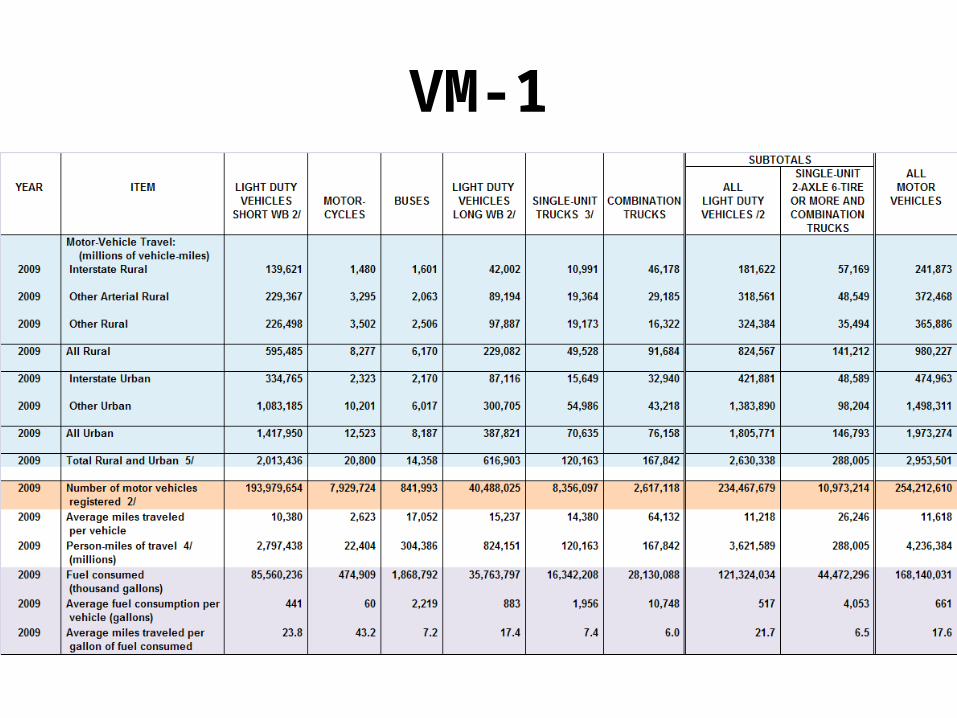
VM-1

Data Sources
1. VMT: Highway Performance Monitoring System (HPMS) from States
2. Registered Vehicles – from States
3. Fuel consumption - from States
4. Fuel efficiency – Modeling
5.

VMT
1. HPMS Statewide Summaries for rural collectors and locals.
2. HPMS Urban Summaries3. AADT x length
VM-2 table:VMT by 14 roadway types and by states
+ VM-4 table:Vehicle Summary Data by 6 vehicle types and
6 roadway types
Merger roadway
types
VMTBy 6 roadway
types and by 6 vehicle types

7
Vehicle Miles Travelled by Roadway Types Data Sources
1: HPMS Statewide Summaries – daily VMT for rural minor collectors, rural locals, and small urban locals
2: HPMS Urban Area Summaries – urban local daily VMT
3: All Others – AADT x length of roadway segment
State total = 1 + 2 + 3
VM-2 table

Sample VM-2 (portion)

VM-4 Table
• VM-4 Table is created using Vehicle Summary Data
• Vehicle Summary Data contains 6 Vehicle Types and 6 Roadway types
• Vehicle Summary Data are in the format of Percentages on each of 6 roadway types
• Total of percentages on each roadway is 100%

10
A Sample Vehicle Summary Data

Roadway Types Merges
VM-4 VM-2Interstate (1) InterstateOther Arterial (2) PA - Other Freeways +
(3) PA – Other + (4) Minor Arterial
Other Urban (rural) (5) Major Collector + (6) Minor Collector + (7) Local

VMT by Vehicle Calculations
Vehicle VMT (on a roadway)
= % (on a roadway) * VMT (of a roadway)

13
How to Calculate Vehicle VMT
• Vehicle VMT (roadtype) = Veh% x VMT (roadtype) Veh% is the Vehicle Summary Data• Example:
• A stable Veh% is essential to produce stable Vehicle VMTs
16941 Rural Interstate VMT
X times the percentages
MotorCyclePassenger
Car Light Truck Bus Single UnitCombination
Truck Total0.49% 62.82% 19.50% 0.21% 3.90% 13.08% 100.00%
Rural Interstate VMT by Vehicle Types83.0 10642.3 3303.5 35.6 660.7 2215.9 16941

Vehicles
• # of vehicle is imported from MV-1 table (include Motorcycles)
• 4 Vehicle types are split using Polk data (Light Duty Vehicle short wheel and long wheel base, Single Unit Truck, Combination Truck)
• VMT per vehicle is calculated• Fuel consumed per vehicle is calculated

New VM-1 Vehicle classification
• Light Duty Vehicle Short WB:wheelbases <= 121 inches.
• Light Duty Vehicle Long WB:wheelbases > 121 inches.
• Most of car, van, small SVU, mini pickups belong to Light Duty Vehicle Short WB
• Large passenger car (0.7%), vans (21.0%), pickup trucks (83.4%), and sport/utility vehicles (8.5%) belong to Light Duty Vehicle Long WB in 2008.

Fuel Consumption

Fuel Efficiency
• Vehicle Stock Model to approximately estimate MPG by vehicle types
• Optimization tech to finalize the MPGtotal fuel = total fuel consumed

Stock ModelThe vehicle stock model can be expressed mathematically as:
yy
yfy
y yfy
f
MPG
PopVMT
PopVMTMPGVeh _
ftypefuelandyyearmodelforoperationincarsofnumberPop
ftypefuelandyyearmodelforMPGfleetcarMPG
yyearmodelforvehicleperVMTaverageannualVMT
yf
yf
y
Where

MPG Model
2
1
12
tvf
tvf
VSvf
VSvf
v f MPG
MPG
MPG
MPGMinimize
tvf
tvf MPGMPG
tf
h
tvhf
vFuelTotal
VMTtoSubject
tvfMPG
:
ftypefuelfornconsumptiofueltotalyearcurrentFuelTotal
ftypefuelandvvehicleforMPGmodelstockvehicleMPG
ftypefuelandvvehicleforMPGyearpreviousMGT
ftypefuelandvvehicleforMPGyearcurrent
ftypefuelandhclasshighwayvtypevehicleforVMTyearcurrentVMT
tf
VSvf
tvf
tvhf
1
tvfMPG
Where

References
Annual Vehicle Miles Travelled and Related Data -- Procedures Used to Derive Data Elements Contained in Highway Statistics Table VM-1 for Years 2009 and after and 2007 and 2008 Historical Data http://www.fhwa.dot.gov/ohim/vm1_methodology_2007.pdf

Questions?


