Page 1
National Tracking Poll #210636June 04-07, 2021
Crosstabulation Results
Methodology:This poll was conducted between June 4-June 7, 2021 among a sample of 1990 Registered Voters.The interviews were conducted online and the data were weighted to approximate a target sampleof Registered Voters based on gender, age, educational attainment, race, 2020 presidential vote, andregion. Results from the full survey have a margin of error of plus or minus 2 percentage points.
Page 2
Table Index
1 Table P1: Now, generally speaking, would you say that things in the country are going in theright direction, or have they pretty seriously gotten off on the wrong track? . . . . . . . . . . 8
2 Table nr2b: Do you approve or disapprove of the job Joe Biden is doing as President? . . . . 12
3 Table nr2bNET: Do you approve or disapprove of the job Joe Biden is doing as President? . . 15
4 Table P3: Now, thinking about your vote, what would you say is the top set of issues on yourmind when you cast your vote for federal offices such as U.S. Senate or Congress? . . . . . . . 18
5 Table POL1_1: Who do you trust more to handle each of the following issues? The economy 23
6 Table POL1_2: Who do you trust more to handle each of the following issues? Jobs . . . . . 27
7 Table POL1_3: Who do you trust more to handle each of the following issues? Health care . 31
8 Table POL1_4: Who do you trust more to handle each of the following issues? Immigration 35
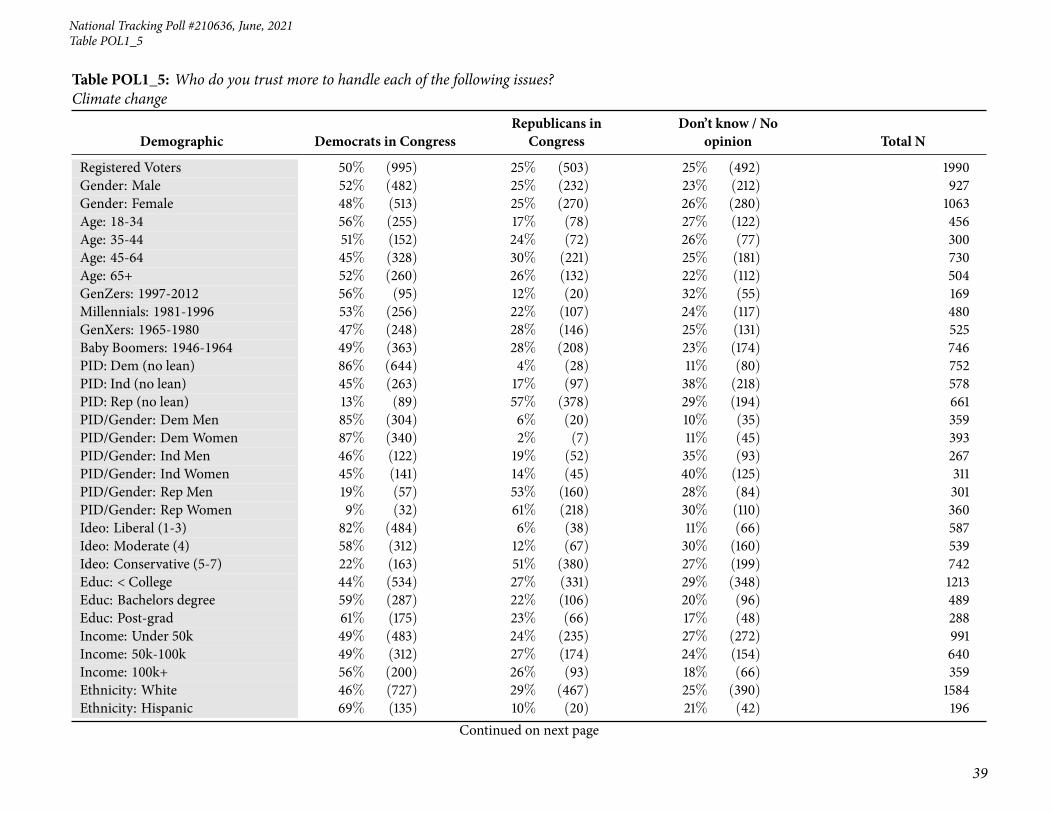
9 Table POL1_5: Who do you trust more to handle each of the following issues? Climate change 39
10 Table POL1_6: Who do you trust more to handle each of the following issues? The environment 43
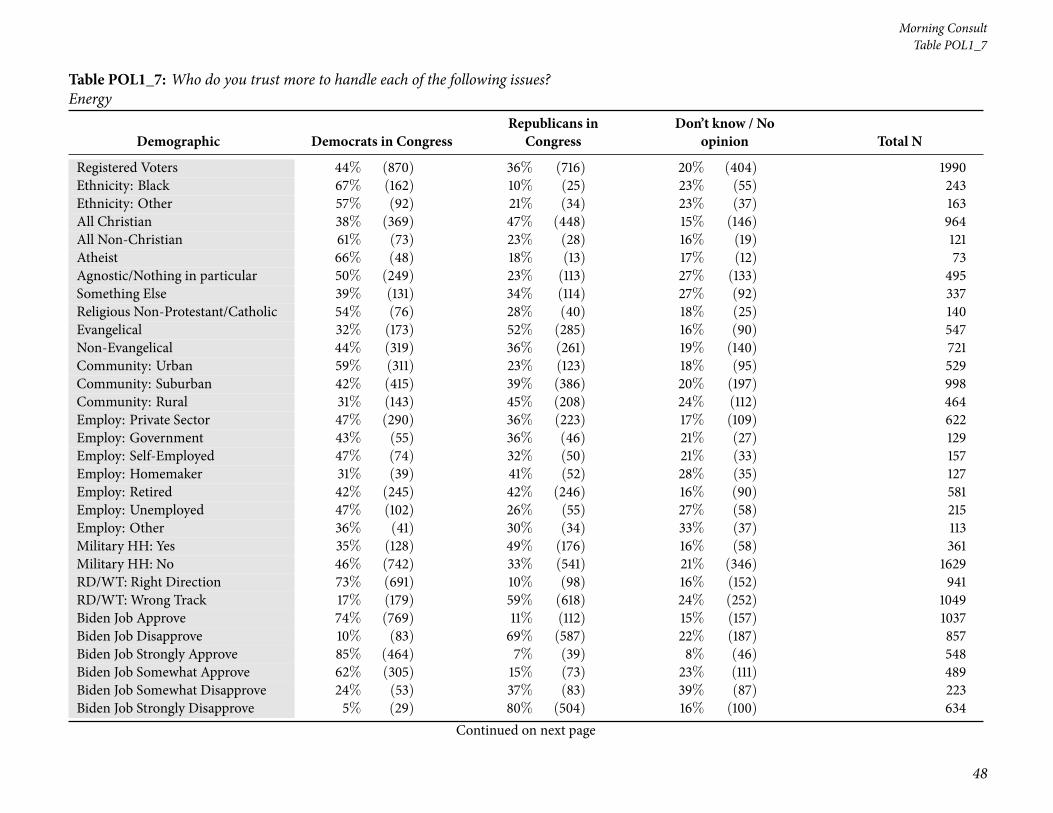
11 Table POL1_7: Who do you trust more to handle each of the following issues? Energy . . . 47
12 Table POL1_8: Who do you trust more to handle each of the following issues? Education . . 51
13 Table POL1_9: Who do you trust more to handle each of the following issues? National security 55
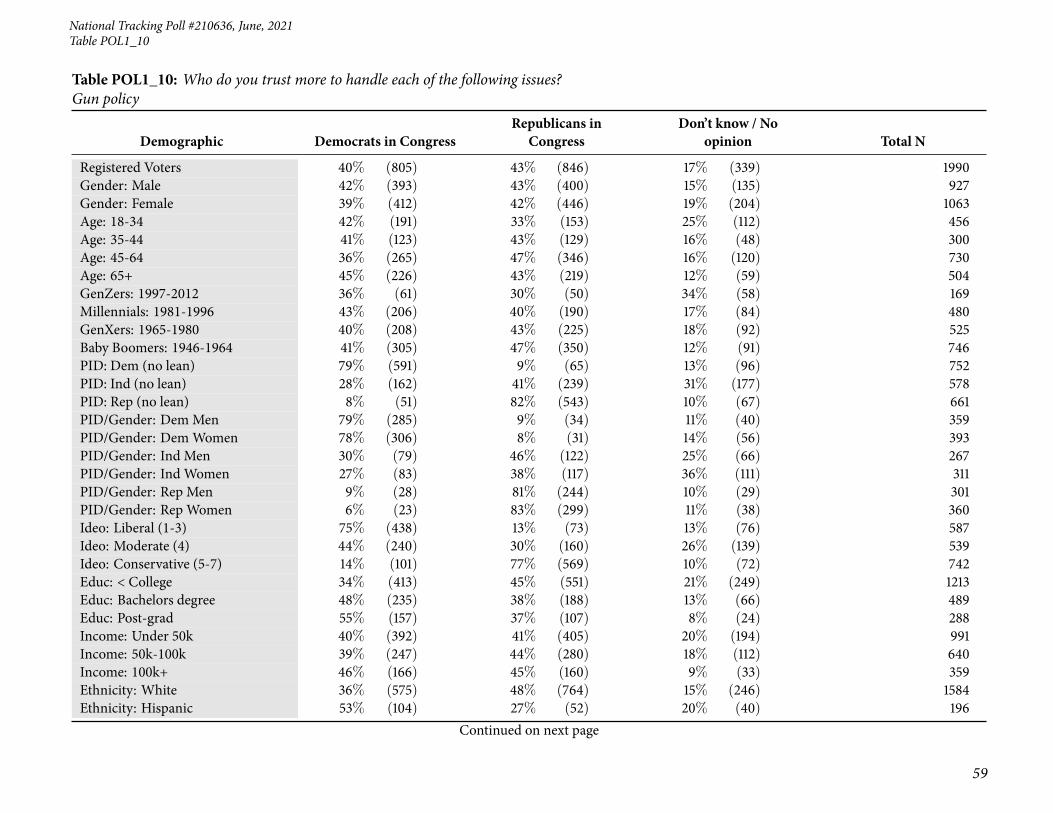
14 Table POL1_10: Who do you trust more to handle each of the following issues? Gun policy . 59
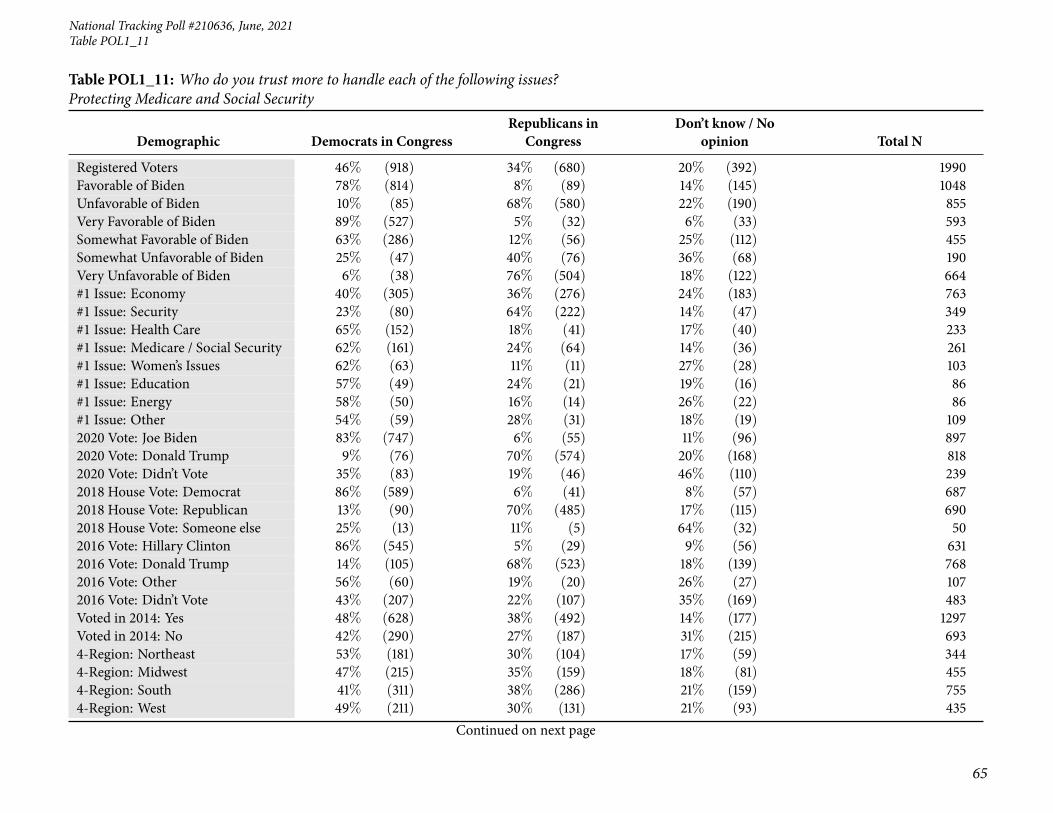
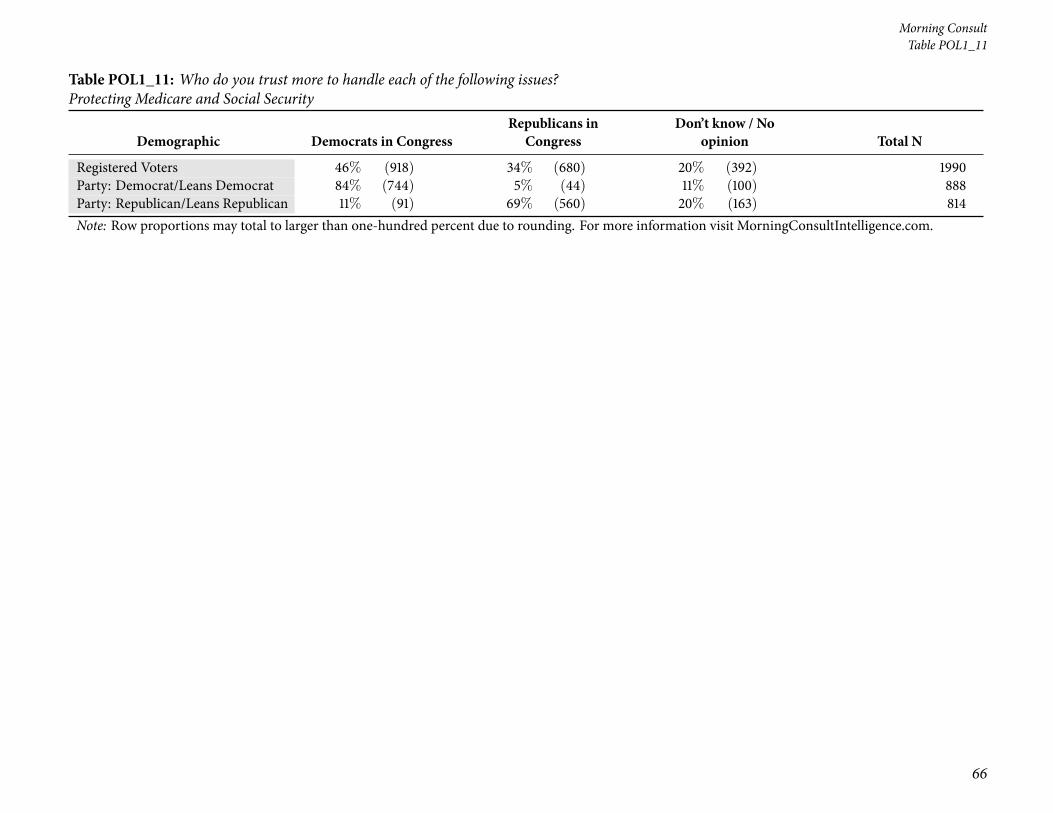
15 Table POL1_11: Who do you trust more to handle each of the following issues? ProtectingMedicare and Social Security . . . . . . . . . . . . . . . . . . . . . . . . . . . . . . . . . . 63
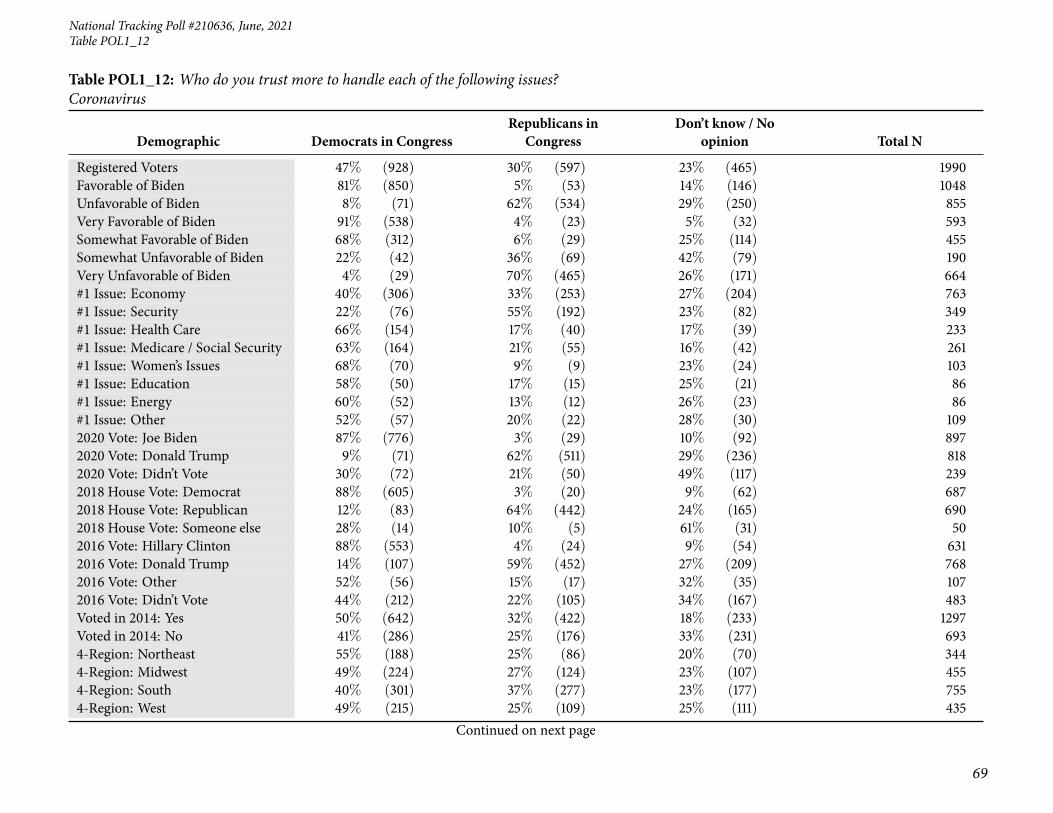
16 Table POL1_12: Who do you trust more to handle each of the following issues? Coronavirus 67
17 Table POL1_13: Who do you trust more to handle each of the following issues? Voting rights 71
18 Table POL2_1: How important of a priority should each of the following be for Congress?Passing a healthcare reform bill . . . . . . . . . . . . . . . . . . . . . . . . . . . . . . . . . 75
19 Table POL2_2: How important of a priority should each of the following be for Congress?Passing a bill to address climate change and its effects . . . . . . . . . . . . . . . . . . . . . 79
20 Table POL2_3: How important of a priority should each of the following be for Congress?Passing a bill to reduce inequality . . . . . . . . . . . . . . . . . . . . . . . . . . . . . . . 83
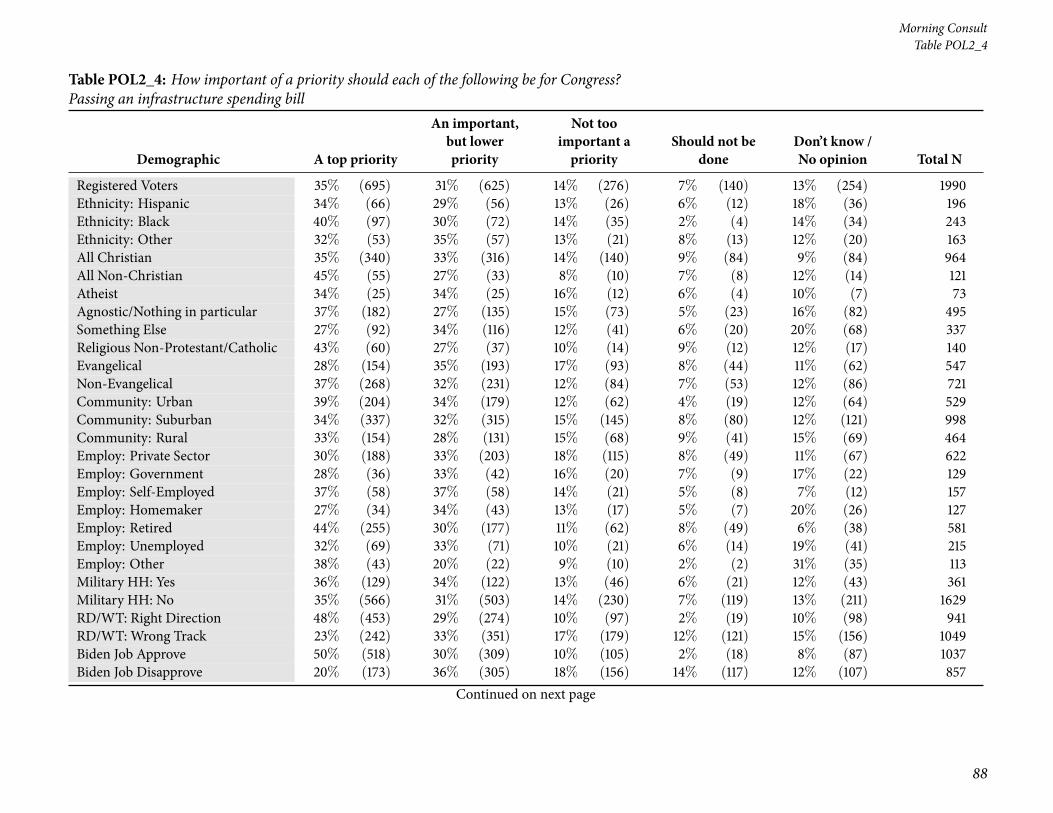
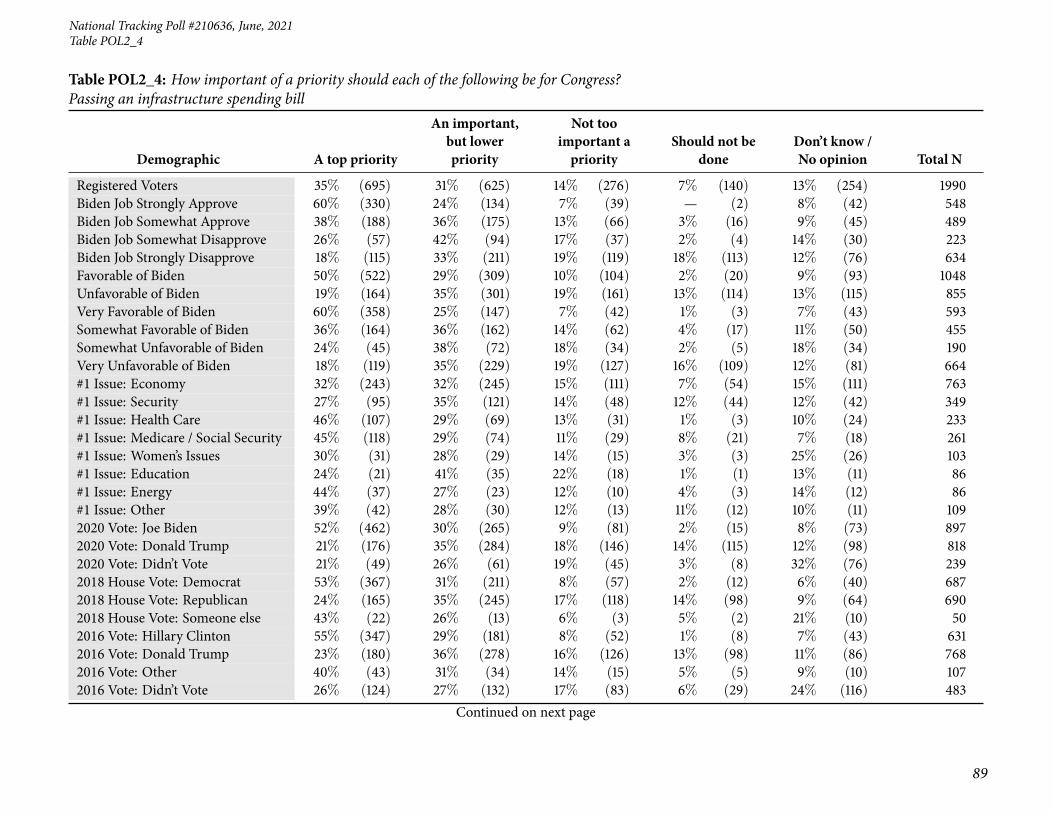
21 Table POL2_4: How important of a priority should each of the following be for Congress?Passing an infrastructure spending bill . . . . . . . . . . . . . . . . . . . . . . . . . . . . . 87
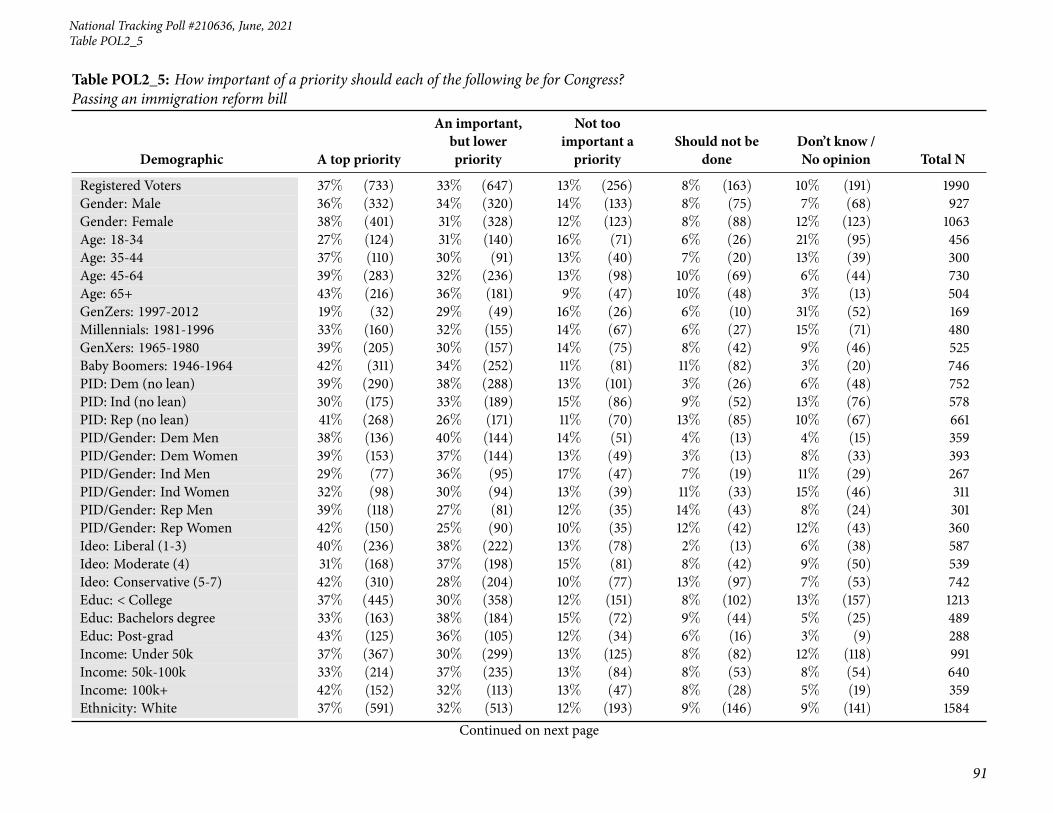
22 Table POL2_5: How important of a priority should each of the following be for Congress?Passing an immigration reform bill . . . . . . . . . . . . . . . . . . . . . . . . . . . . . . . 91
2
Page 3
National Tracking Poll #210636, June, 2021
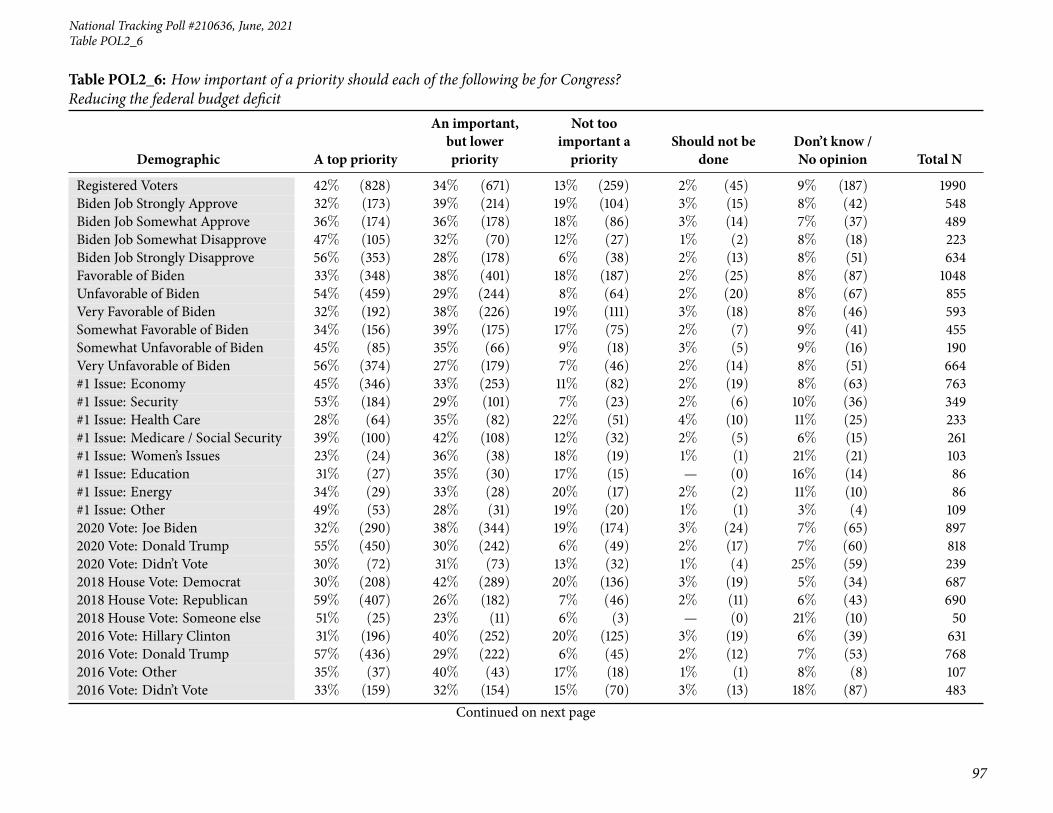
23 Table POL2_6: How important of a priority should each of the following be for Congress?Reducing the federal budget deficit . . . . . . . . . . . . . . . . . . . . . . . . . . . . . . . 95
24 Table POL2_7: How important of a priority should each of the following be for Congress?Passing legislation placing additional restrictions on gun ownership . . . . . . . . . . . . . . 99
25 Table POL2_8: How important of a priority should each of the following be for Congress?Regulating tech companies . . . . . . . . . . . . . . . . . . . . . . . . . . . . . . . . . . . 103
26 Table POL2_9: How important of a priority should each of the following be for Congress?Stimulating the economy to recover from the coronavirus pandemic . . . . . . . . . . . . . . 107
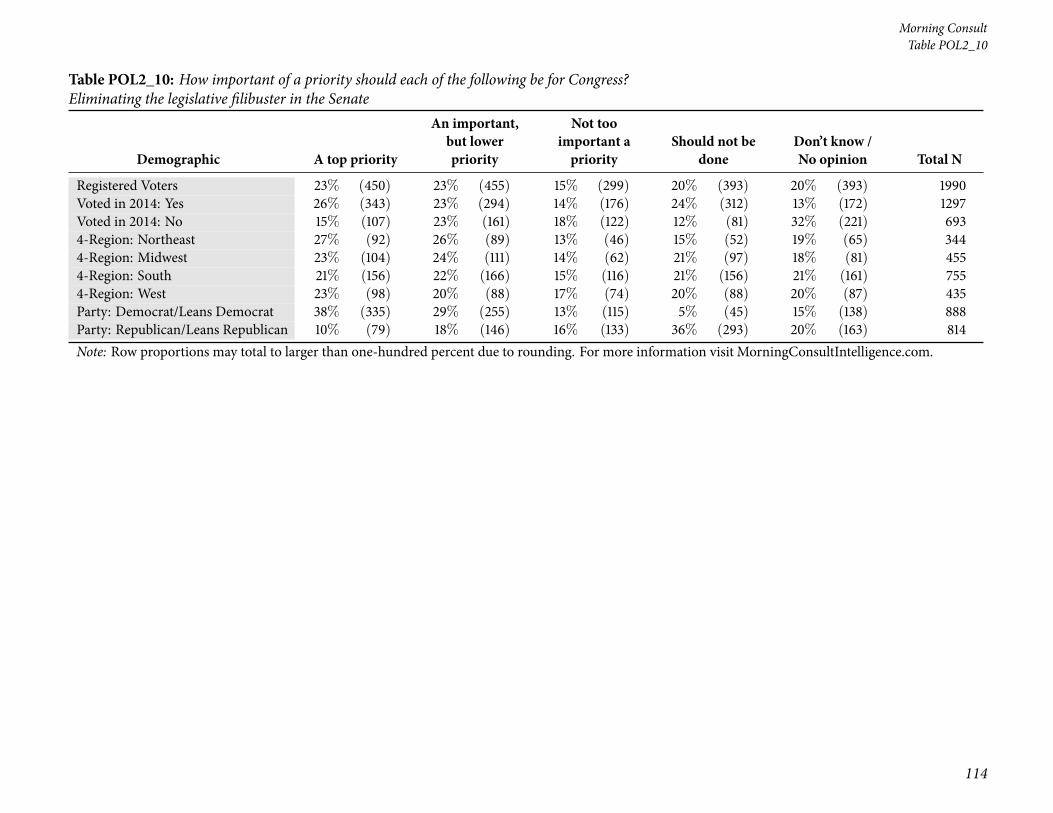
27 Table POL2_10: How important of a priority should each of the following be for Congress?Eliminating the legislative filibuster in the Senate . . . . . . . . . . . . . . . . . . . . . . . 111
28 Table POL2_11: How important of a priority should each of the following be for Congress?Passing a bill to legalize marijuana . . . . . . . . . . . . . . . . . . . . . . . . . . . . . . . 115
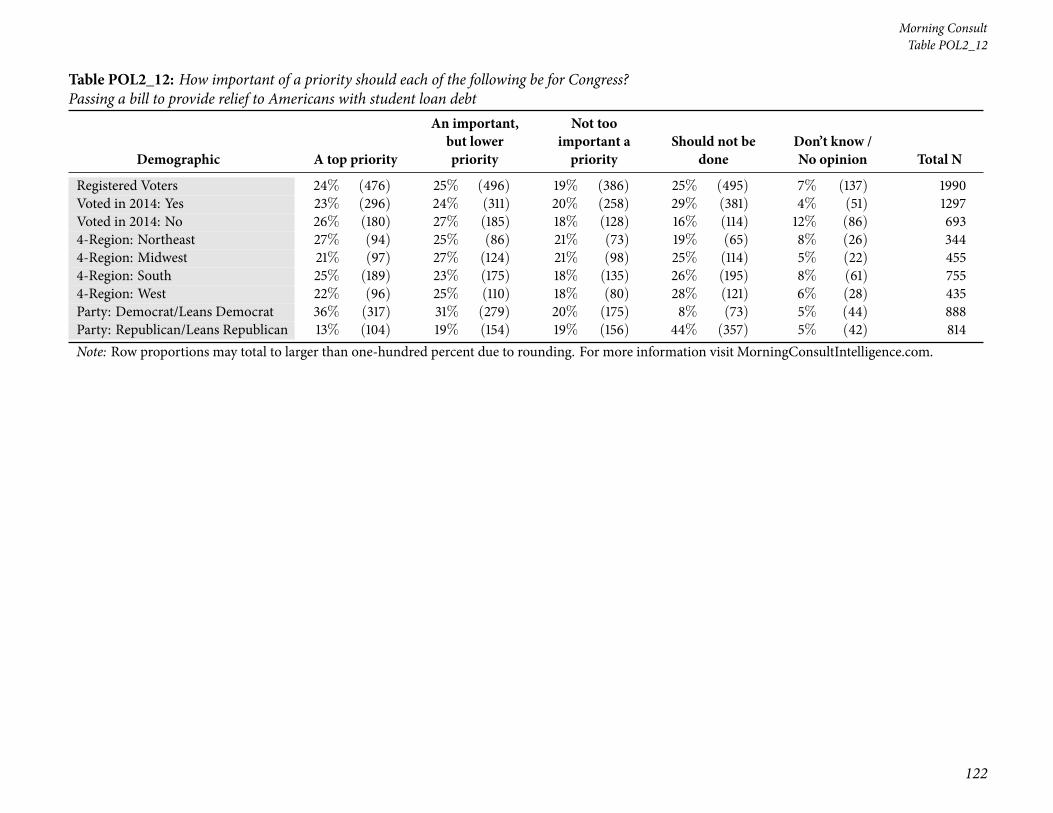
29 Table POL2_12: How important of a priority should each of the following be for Congress?Passing a bill to provide relief to Americans with student loan debt . . . . . . . . . . . . . . 119
30 Table POL3_1: How would you rate each of the following on their handling of the coron-avirus? President Joe Biden . . . . . . . . . . . . . . . . . . . . . . . . . . . . . . . . . . . 123
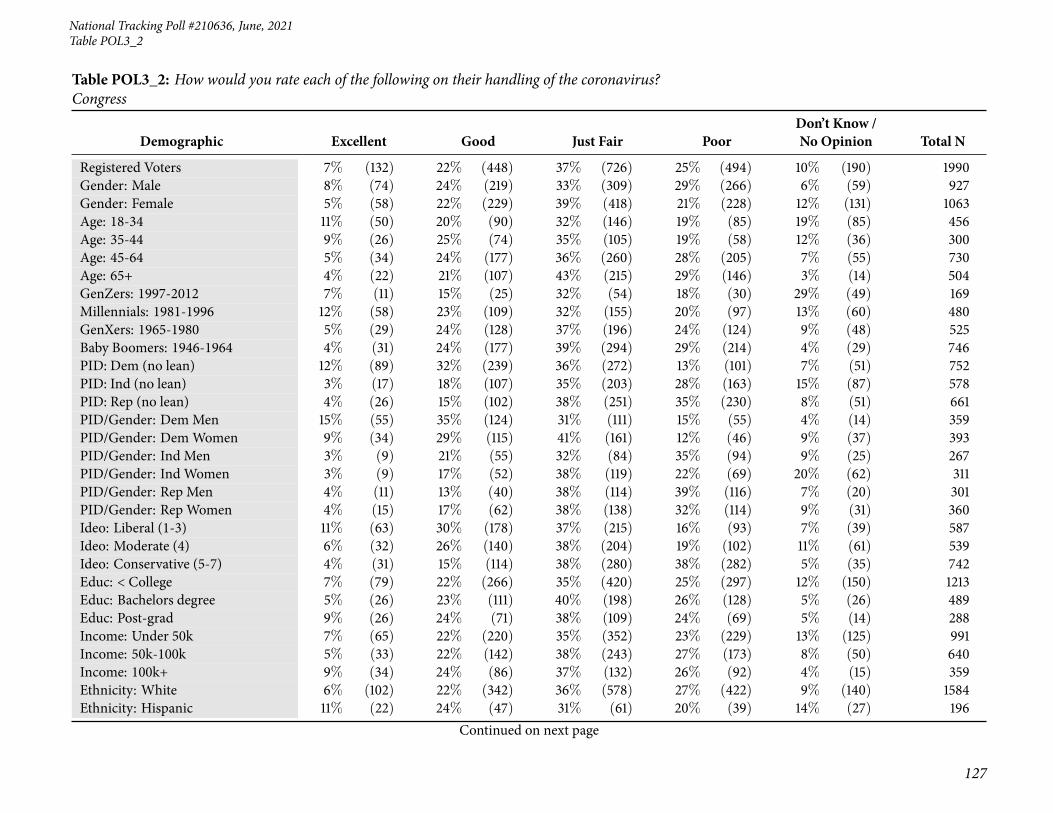
31 Table POL3_2: How would you rate each of the following on their handling of the coron-avirus? Congress . . . . . . . . . . . . . . . . . . . . . . . . . . . . . . . . . . . . . . . . 127
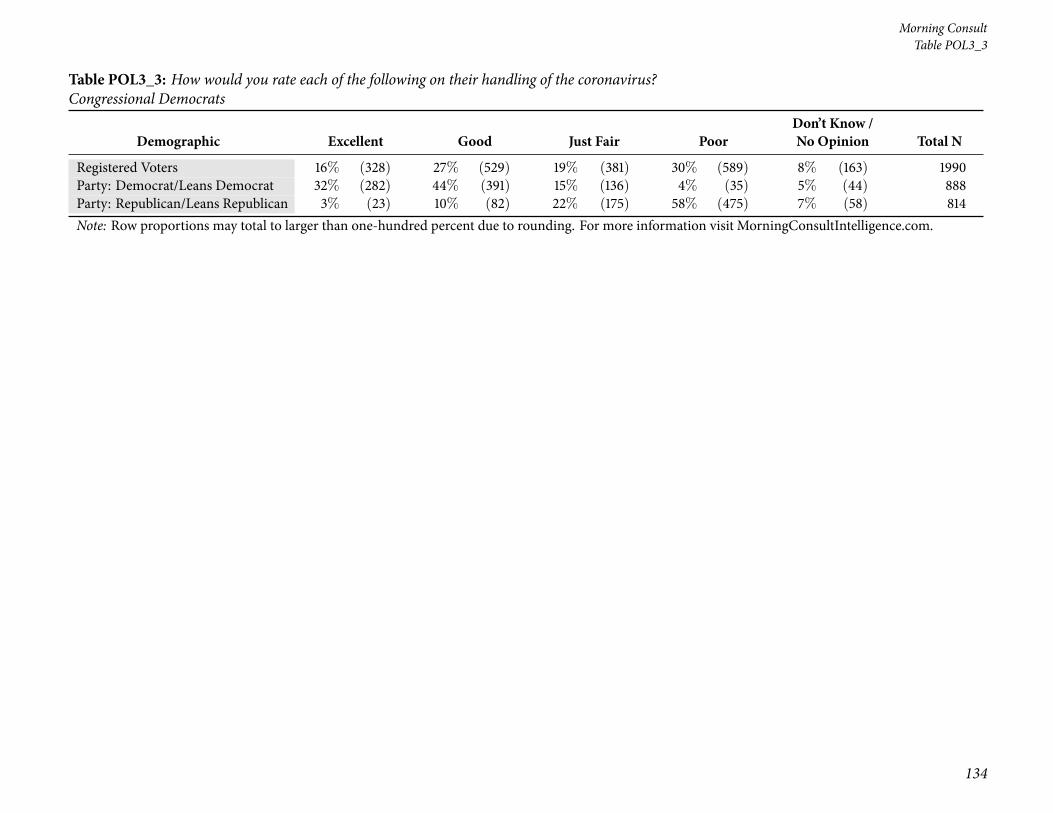
32 Table POL3_3: How would you rate each of the following on their handling of the coron-avirus? Congressional Democrats . . . . . . . . . . . . . . . . . . . . . . . . . . . . . . . 131
33 Table POL3_4: How would you rate each of the following on their handling of the coron-avirus? Congressional Republicans . . . . . . . . . . . . . . . . . . . . . . . . . . . . . . . 135
34 Table POL3_5: How would you rate each of the following on their handling of the coron-avirus? The World Health Organization (WHO) . . . . . . . . . . . . . . . . . . . . . . . . 139
35 Table POL3_6: How would you rate each of the following on their handling of the coron-avirus? The Centers for Disease Control and Prevention (CDC) . . . . . . . . . . . . . . . . 143
36 Table POL3_7: How would you rate each of the following on their handling of the coron-avirus? Your state’s governor . . . . . . . . . . . . . . . . . . . . . . . . . . . . . . . . . . 147
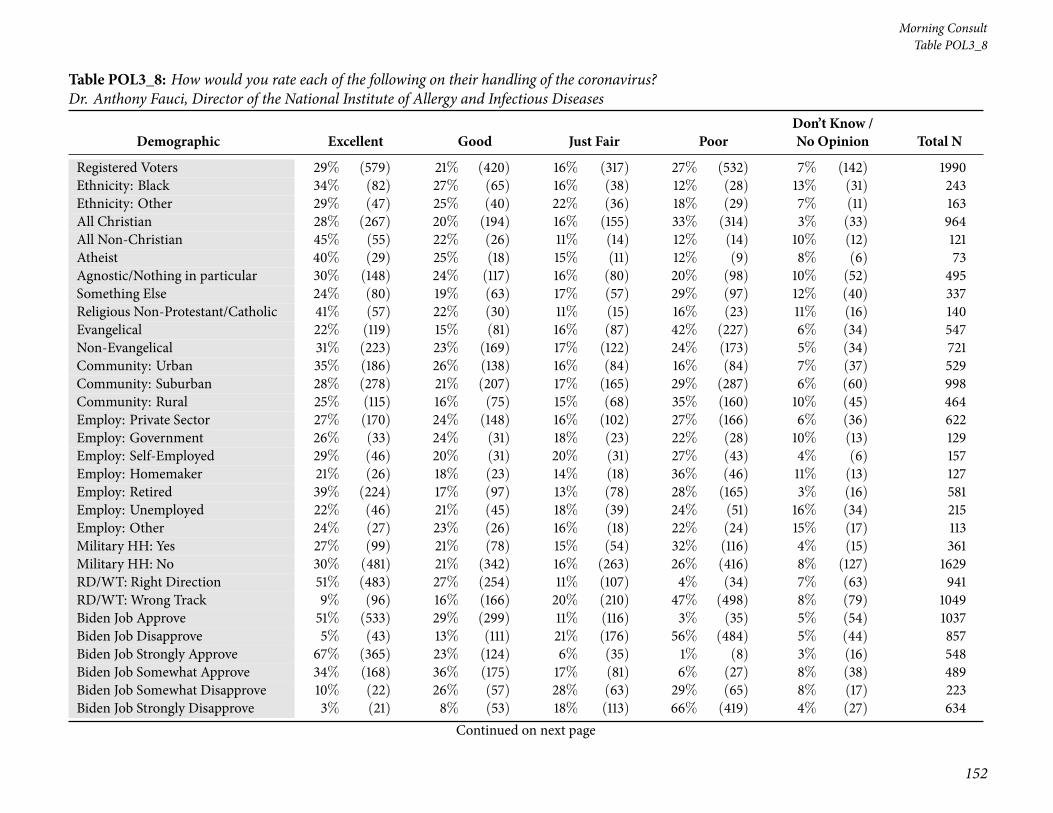
37 Table POL3_8: How would you rate each of the following on their handling of the coron-avirus? Dr. Anthony Fauci, Director of the National Institute of Allergy and Infectious Diseases 151
38 Table POL4: Generally speaking, would you say you are more concerned about... . . . . . . 155
39 Table POL5: Currently, do you believe it’s more important for the government to address the: 159
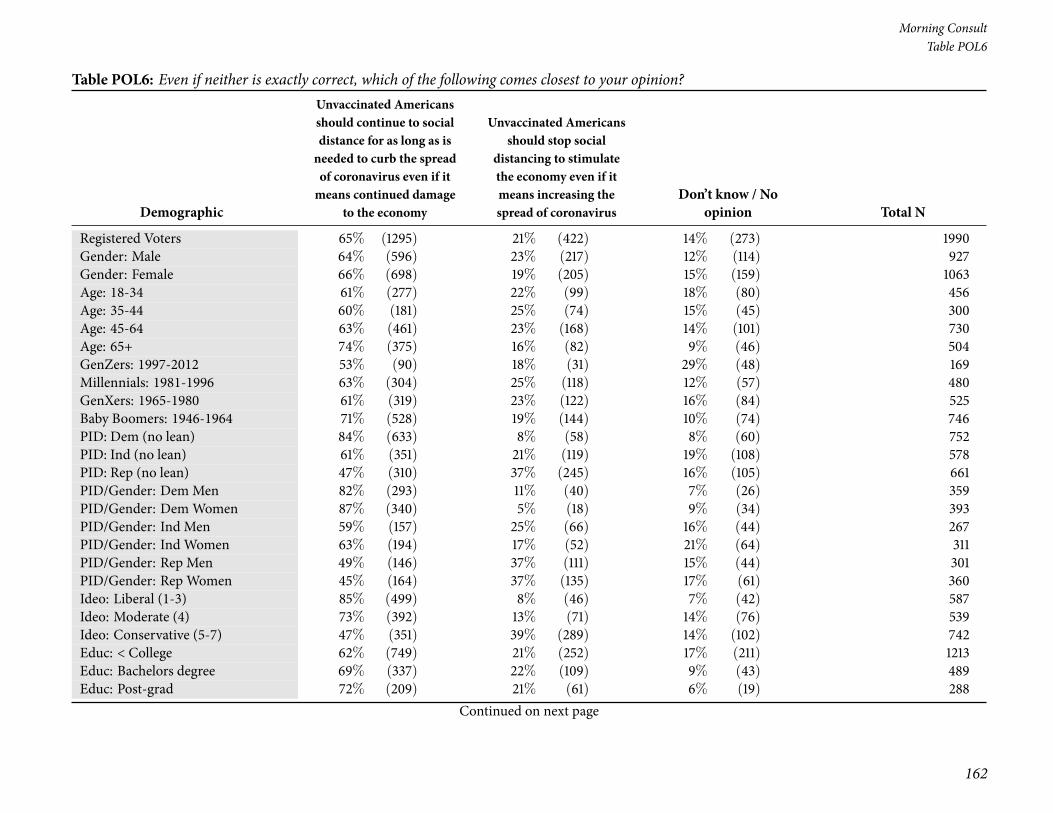
40 Table POL6: Even if neither is exactly correct, which of the following comes closest to youropinion? . . . . . . . . . . . . . . . . . . . . . . . . . . . . . . . . . . . . . . . . . . . . . 162
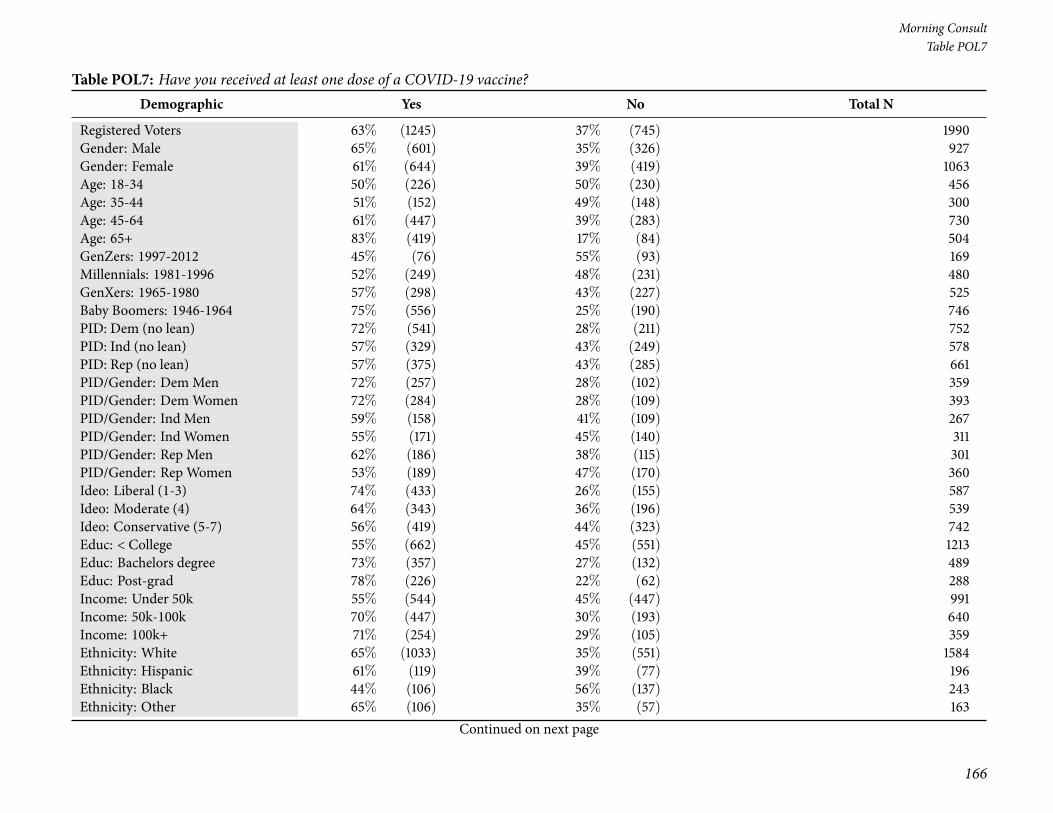
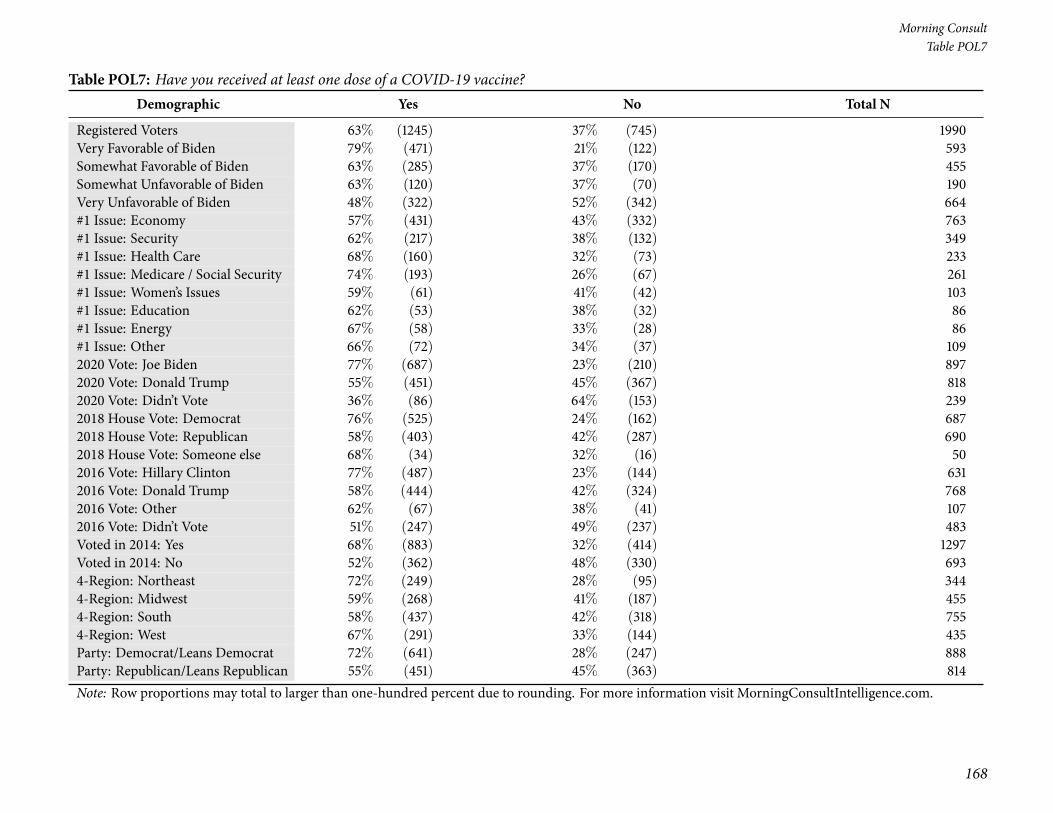
41 Table POL7: Have you received at least one dose of a COVID-19 vaccine? . . . . . . . . . . 166
3
Page 4
Morning Consult
42 TablePOL8_1: Howdesirable are the following incentives in exchange for receiving aCOVID-19 vaccine, if at all?Being entered into a lottery to win... Cash . . . . . . . . . . . . . . . . . 169
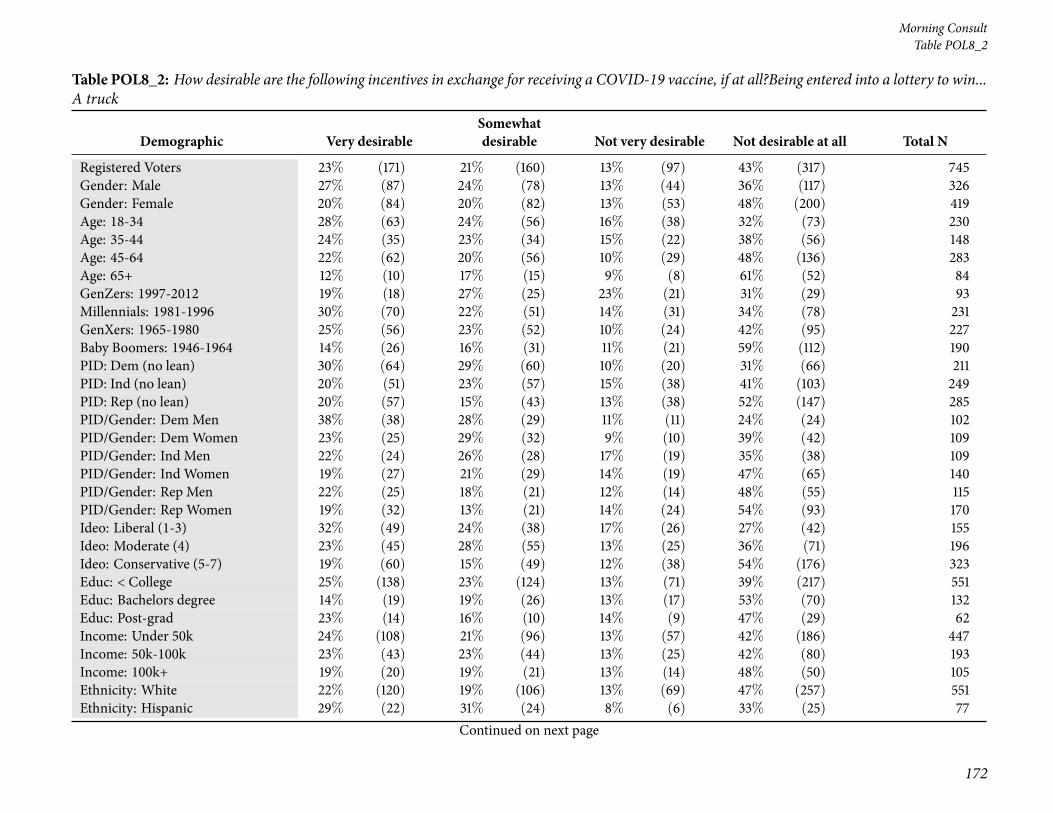
43 TablePOL8_2: Howdesirable are the following incentives in exchange for receiving aCOVID-19 vaccine, if at all?Being entered into a lottery to win... A truck . . . . . . . . . . . . . . . 172
44 TablePOL8_3: Howdesirable are the following incentives in exchange for receiving aCOVID-19 vaccine, if at all?Being entered into a lottery to win... A gun . . . . . . . . . . . . . . . . 175
45 TablePOL8_4: Howdesirable are the following incentives in exchange for receiving aCOVID-19 vaccine, if at all?Being entered into a lottery to win... A scholarship . . . . . . . . . . . . 178
46 TablePOL8_5: Howdesirable are the following incentives in exchange for receiving aCOVID-19 vaccine, if at all?Being entered into a lottery to win... A vacation . . . . . . . . . . . . . 181
47 Table POL9_1: As you may know, Congress is debating a bill that addresses voter access,election security, campaign finance, and government ethics. Do you support or oppose each ofthe following components of the bill? Allowing automatic voter registration . . . . . . . . . . 184
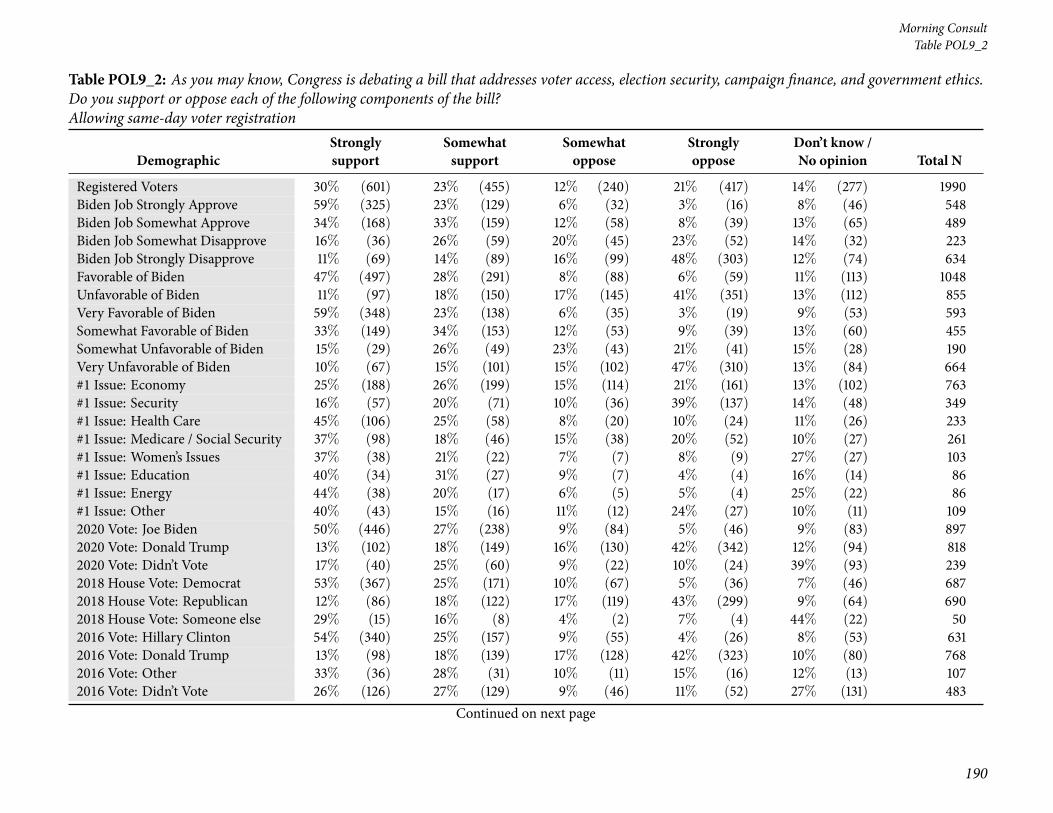
48 Table POL9_2: As you may know, Congress is debating a bill that addresses voter access,election security, campaign finance, and government ethics. Do you support or oppose each ofthe following components of the bill? Allowing same-day voter registration . . . . . . . . . . 188
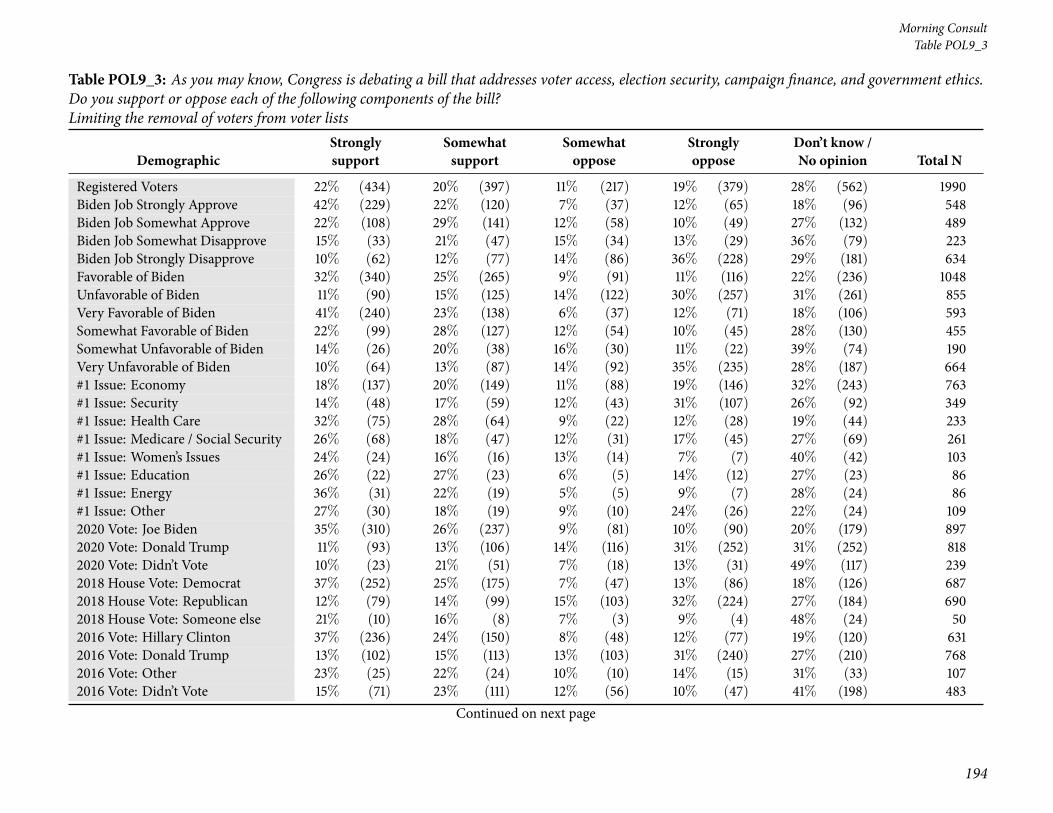
49 Table POL9_3: As you may know, Congress is debating a bill that addresses voter access,election security, campaign finance, and government ethics. Do you support or oppose each ofthe following components of the bill? Limiting the removal of voters from voter lists . . . . . 192
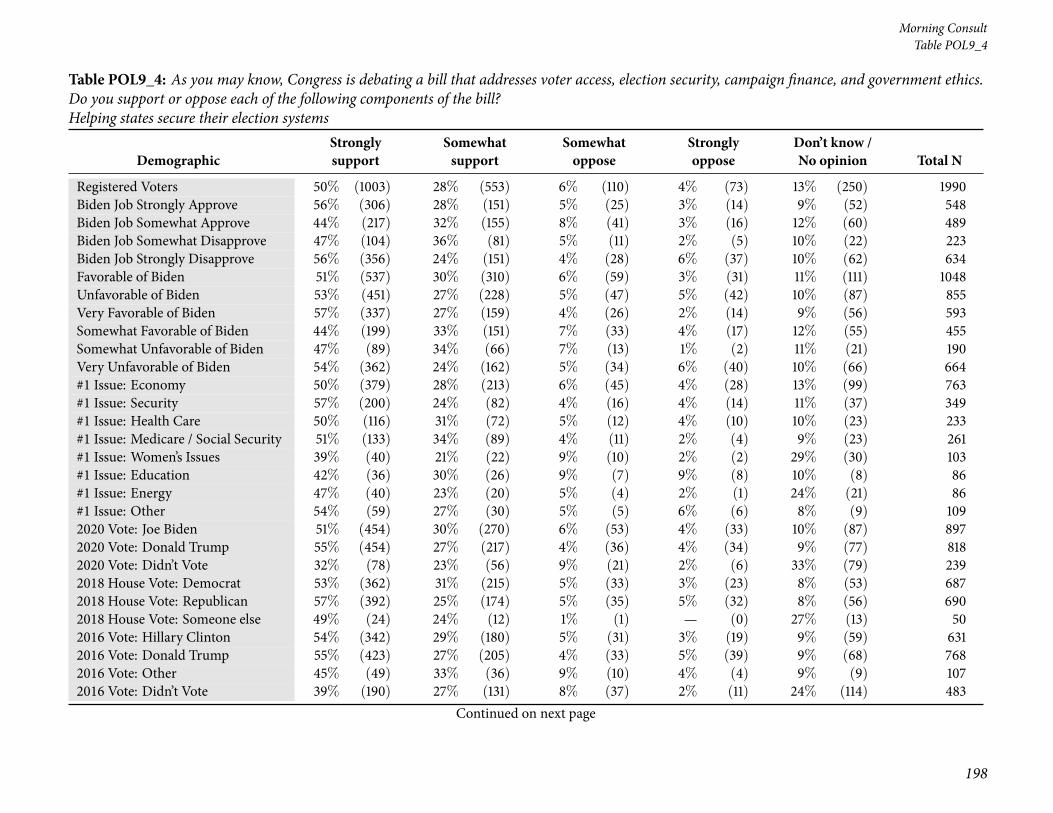
50 Table POL9_4: As you may know, Congress is debating a bill that addresses voter access,election security, campaign finance, and government ethics. Do you support or oppose each ofthe following components of the bill? Helping states secure their election systems . . . . . . . 196
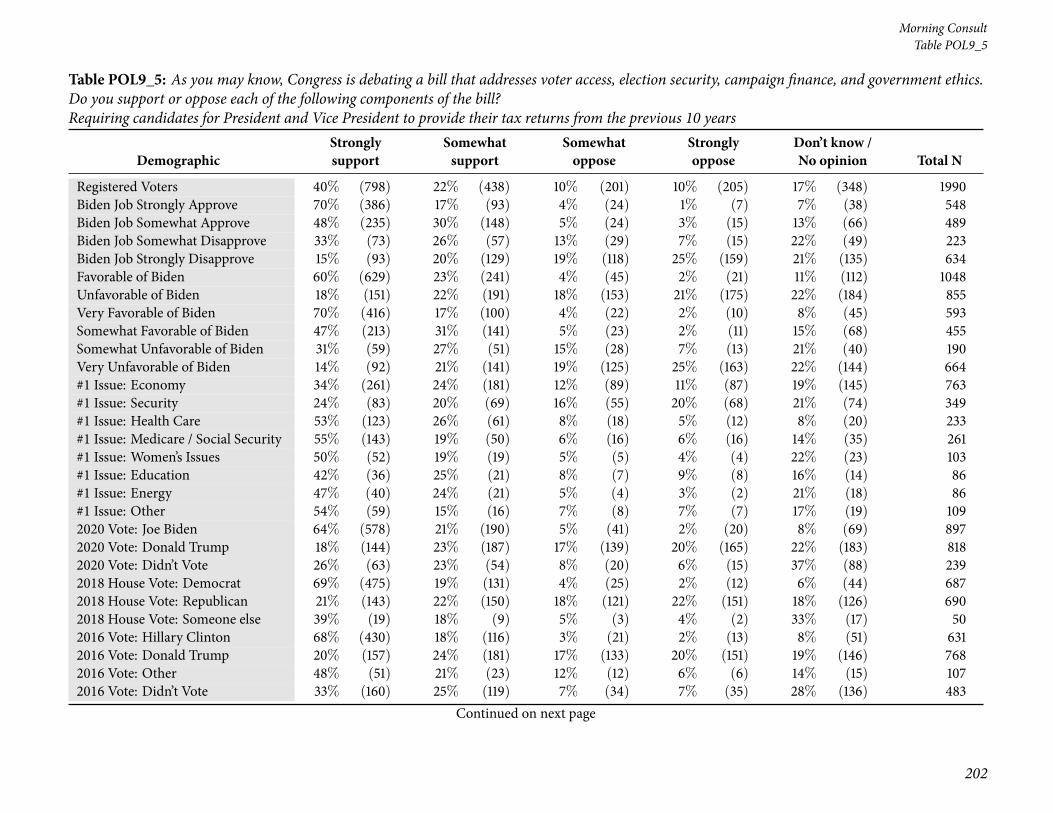
51 Table POL9_5: As you may know, Congress is debating a bill that addresses voter access,election security, campaign finance, and government ethics. Do you support or oppose each ofthe following components of the bill? Requiring candidates for President and Vice President toprovide their tax returns from the previous 10 years . . . . . . . . . . . . . . . . . . . . . . 200
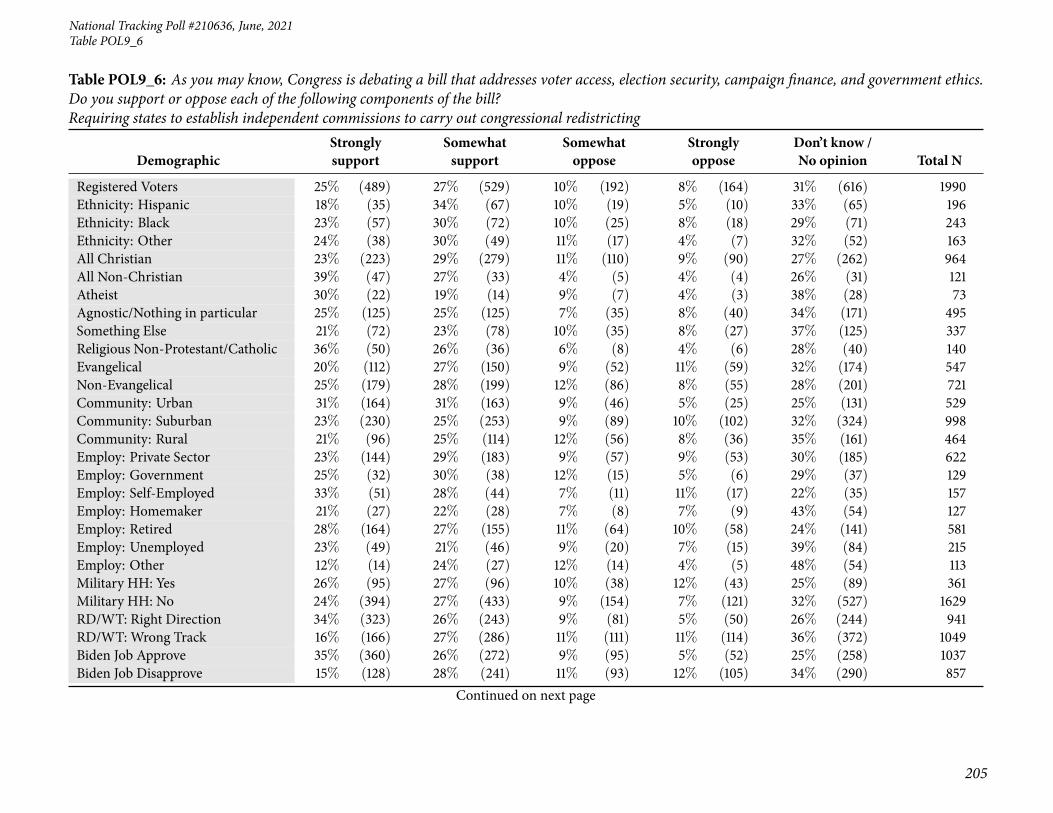
52 Table POL9_6: As you may know, Congress is debating a bill that addresses voter access,election security, campaign finance, and government ethics. Do you support or oppose each ofthe following components of the bill? Requiring states to establish independent commissionsto carry out congressional redistricting . . . . . . . . . . . . . . . . . . . . . . . . . . . . . 204
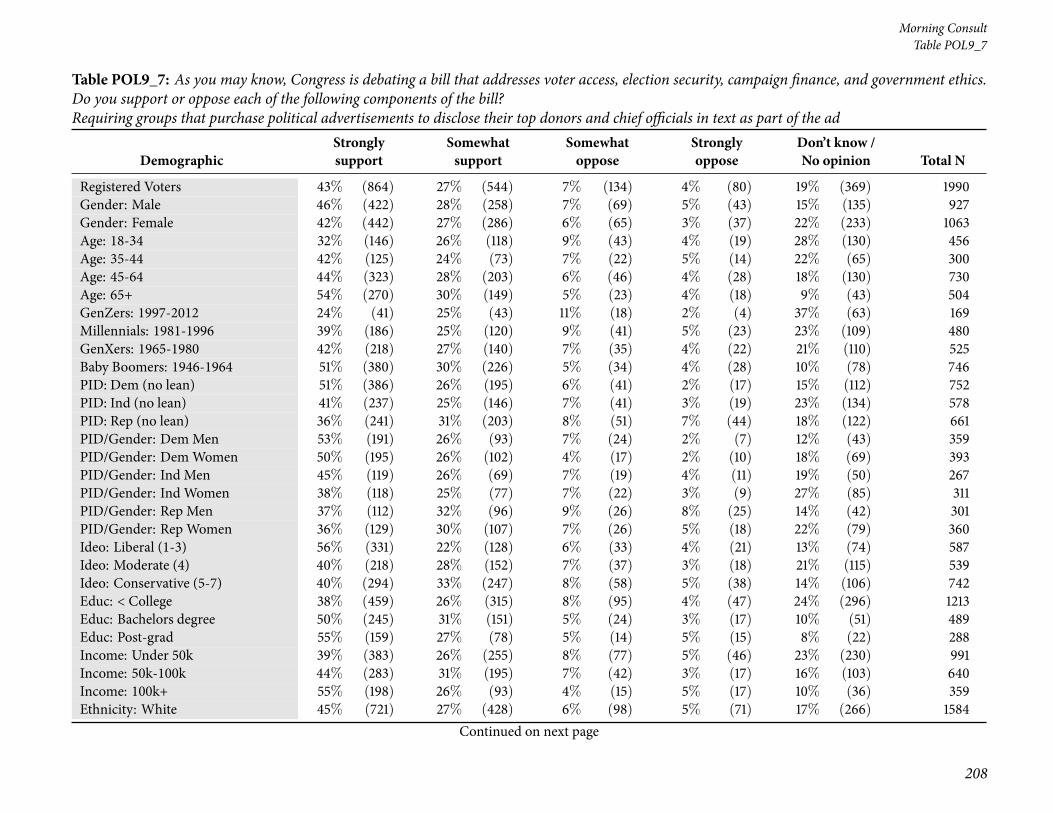
53 Table POL9_7: As you may know, Congress is debating a bill that addresses voter access,election security, campaign finance, and government ethics. Do you support or oppose each ofthe following components of the bill? Requiring groups that purchase political advertisementsto disclose their top donors and chief officials in text as part of the ad . . . . . . . . . . . . . 208
54 Table POL9_8: As you may know, Congress is debating a bill that addresses voter access,election security, campaign finance, and government ethics. Do you support or oppose each ofthe following components of the bill? Establishing voluntary small donor public financing forHouse of Representatives elections . . . . . . . . . . . . . . . . . . . . . . . . . . . . . . . 212
4
Page 5
National Tracking Poll #210636, June, 2021
55 Table POL10a: As you may know, the Senate has 100 members representing the 50 states.Which of the following comes closest to your opinion, even if neither is exactly right? . . . . . 216
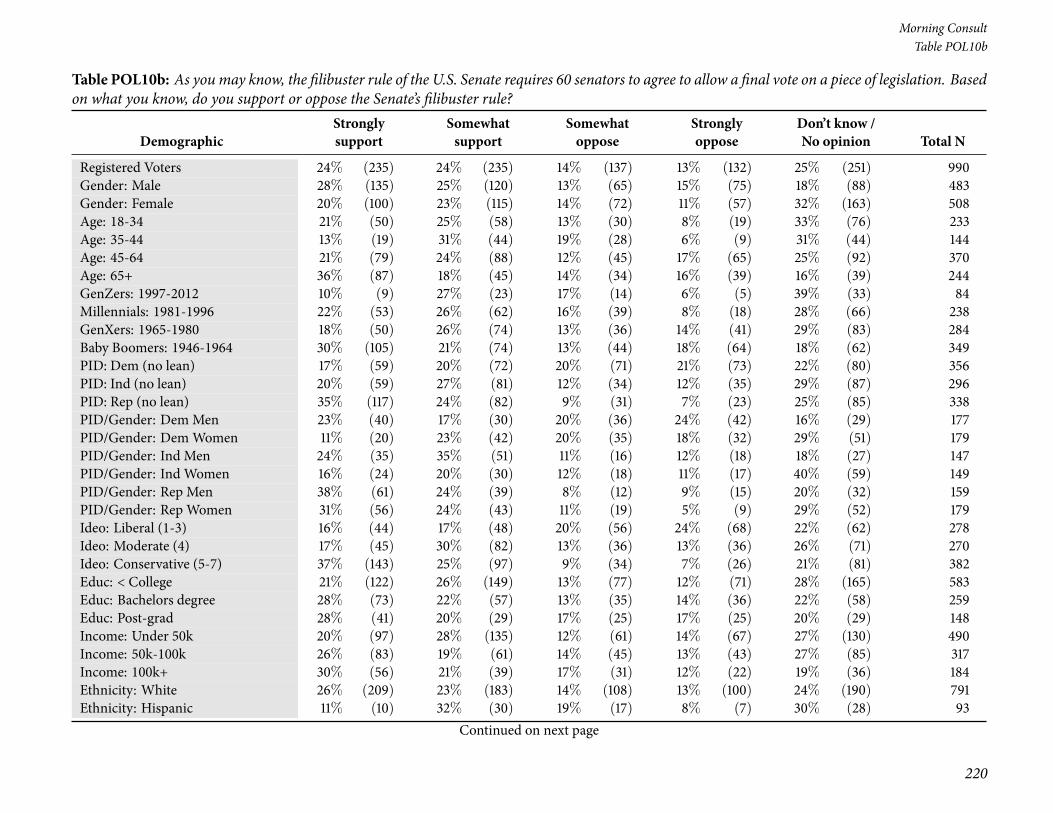
56 Table POL10b: As you may know, the filibuster rule of the U.S. Senate requires 60 senators toagree to allow a final vote on a piece of legislation. Based on what you know, do you supportor oppose the Senate’s filibuster rule? . . . . . . . . . . . . . . . . . . . . . . . . . . . . . . 220
57 Table POL12: Is America’s democracy currently being threatened? . . . . . . . . . . . . . . 223
58 Table POL13_1: Are each of the following a major threat, a minor threat, or not a threat toAmerican democracy? Restricting voting access . . . . . . . . . . . . . . . . . . . . . . . . 226
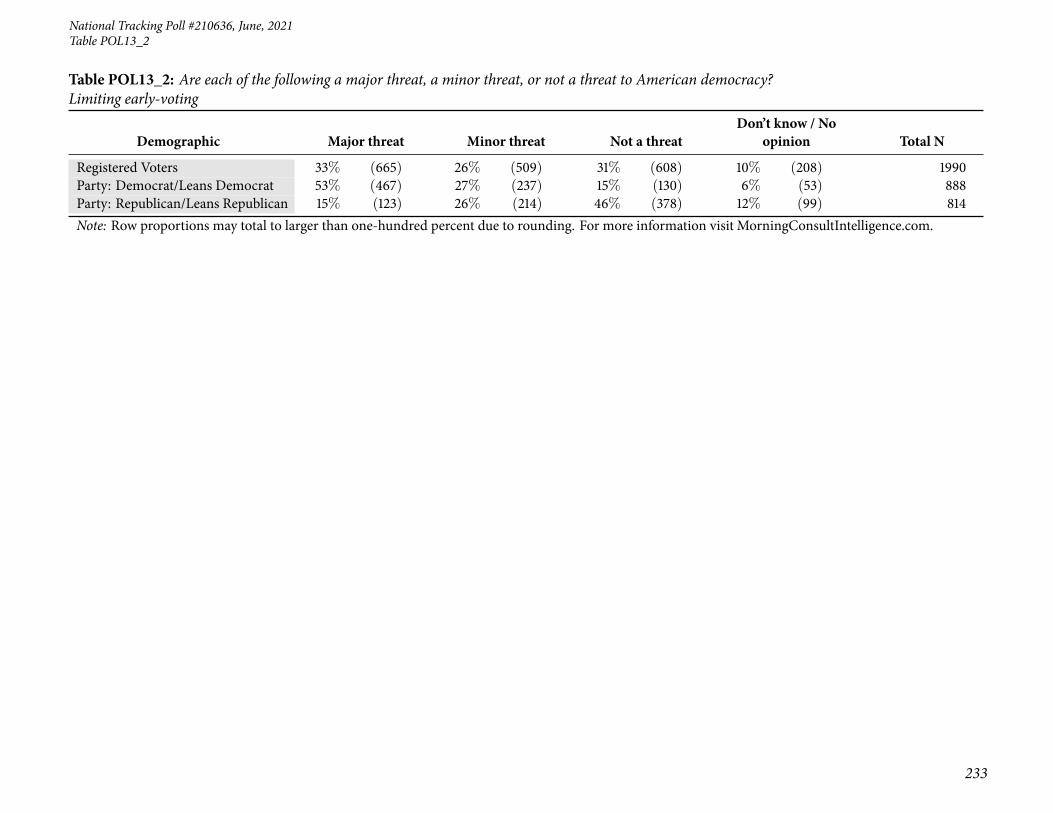
59 Table POL13_2: Are each of the following a major threat, a minor threat, or not a threat toAmerican democracy? Limiting early-voting . . . . . . . . . . . . . . . . . . . . . . . . . . 230
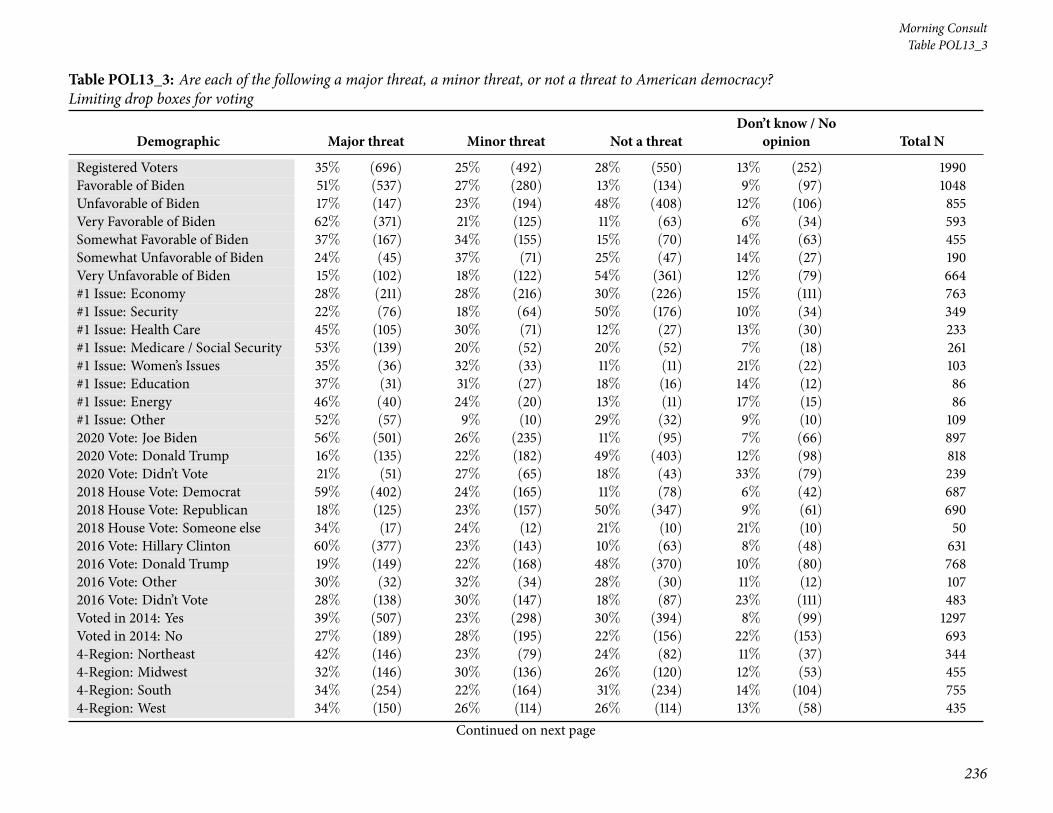
60 Table POL13_3: Are each of the following a major threat, a minor threat, or not a threat toAmerican democracy? Limiting drop boxes for voting . . . . . . . . . . . . . . . . . . . . . 234
61 TablePOL14: Do you believeDonald Trump should play amajor role in the Republican party,a minor role in the Republican party, or should he no longer play a role in the Republican party?238
62 Table POL15: How likely do you think it is that former President Donald Trump will bereinstated as U.S. President this year, if at all? . . . . . . . . . . . . . . . . . . . . . . . . . 242
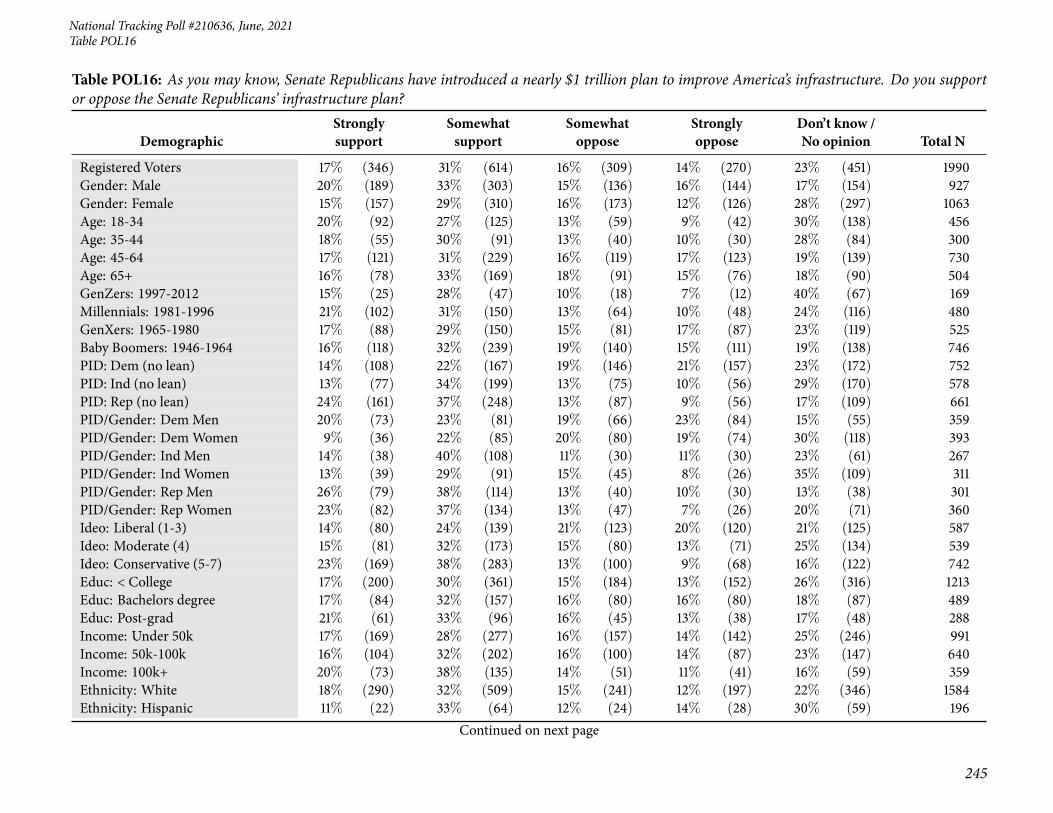
63 Table POL16: As you may know, Senate Republicans have introduced a nearly $1 trillionplan to improve America’s infrastructure. Do you support or oppose the Senate Republicans’infrastructure plan? . . . . . . . . . . . . . . . . . . . . . . . . . . . . . . . . . . . . . . . 245
64 Table POL17: As you may know, President Biden has introduced a $2.3 trillion plan to im-prove America’s infrastructure. Do you support or oppose Biden’s infrastructure plan? . . . . 249
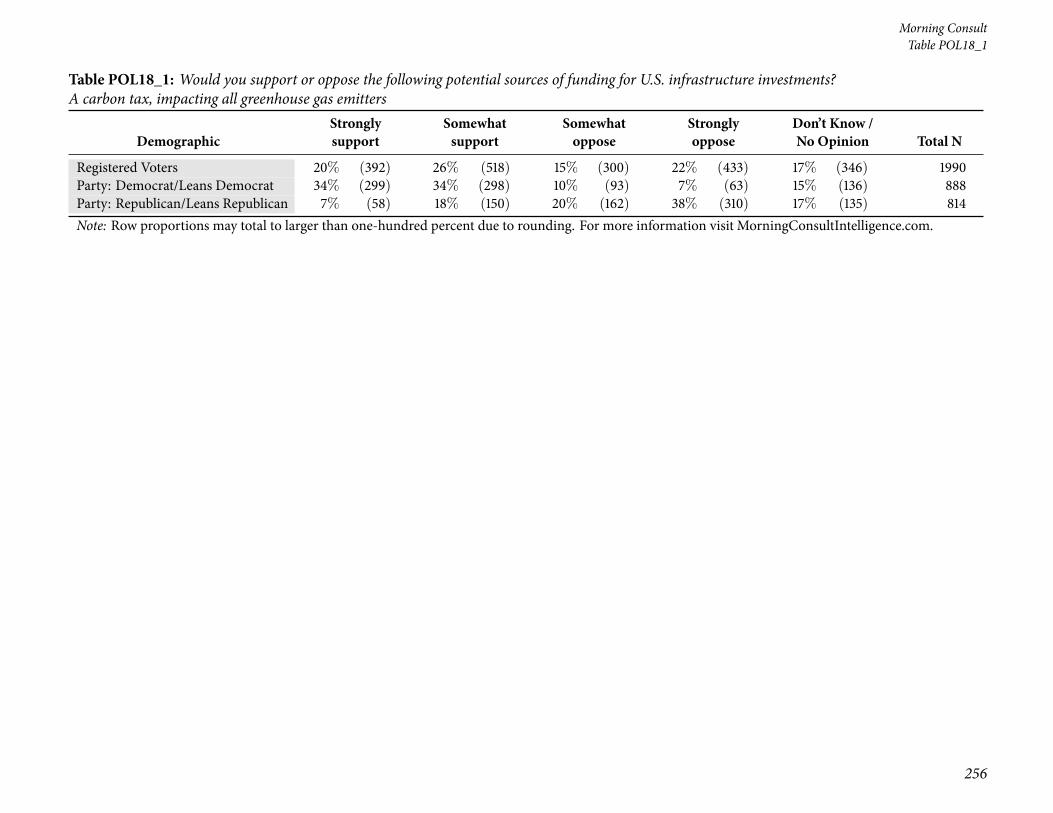
65 Table POL18_1: Would you support or oppose the following potential sources of funding forU.S. infrastructure investments? A carbon tax, impacting all greenhouse gas emitters . . . . 253
66 Table POL18_2: Would you support or oppose the following potential sources of funding forU.S. infrastructure investments? A ’vehicle miles traveled’ tax (e.g. a mileage tax), impactingthe drivers of all types of vehicles . . . . . . . . . . . . . . . . . . . . . . . . . . . . . . . . 257
67 Table POL18_3: Would you support or oppose the following potential sources of funding forU.S. infrastructure investments? A gasoline tax, impacting the drivers of all conventional carsand trucks . . . . . . . . . . . . . . . . . . . . . . . . . . . . . . . . . . . . . . . . . . . . 261
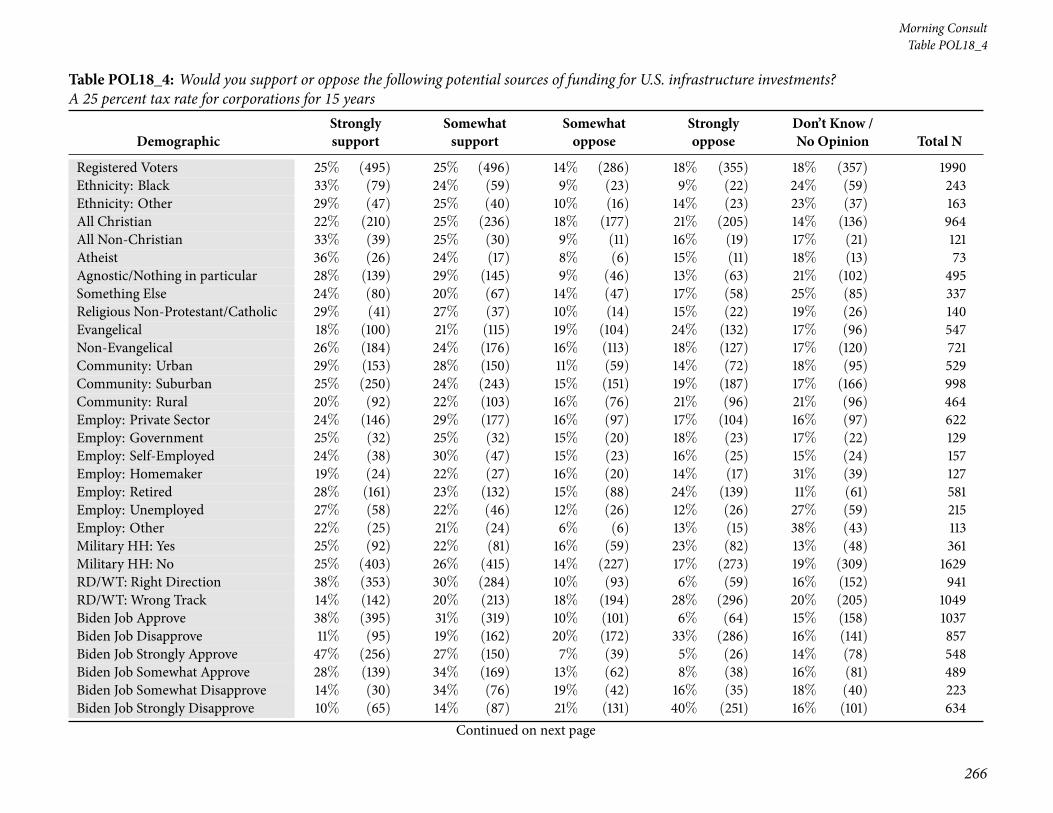
68 Table POL18_4: Would you support or oppose the following potential sources of funding forU.S. infrastructure investments? A 25 percent tax rate for corporations for 15 years . . . . . 265
69 Table POL18_5: Would you support or oppose the following potential sources of funding forU.S. infrastructure investments? A 28 percent tax rate for corporations for 15 years . . . . . 269
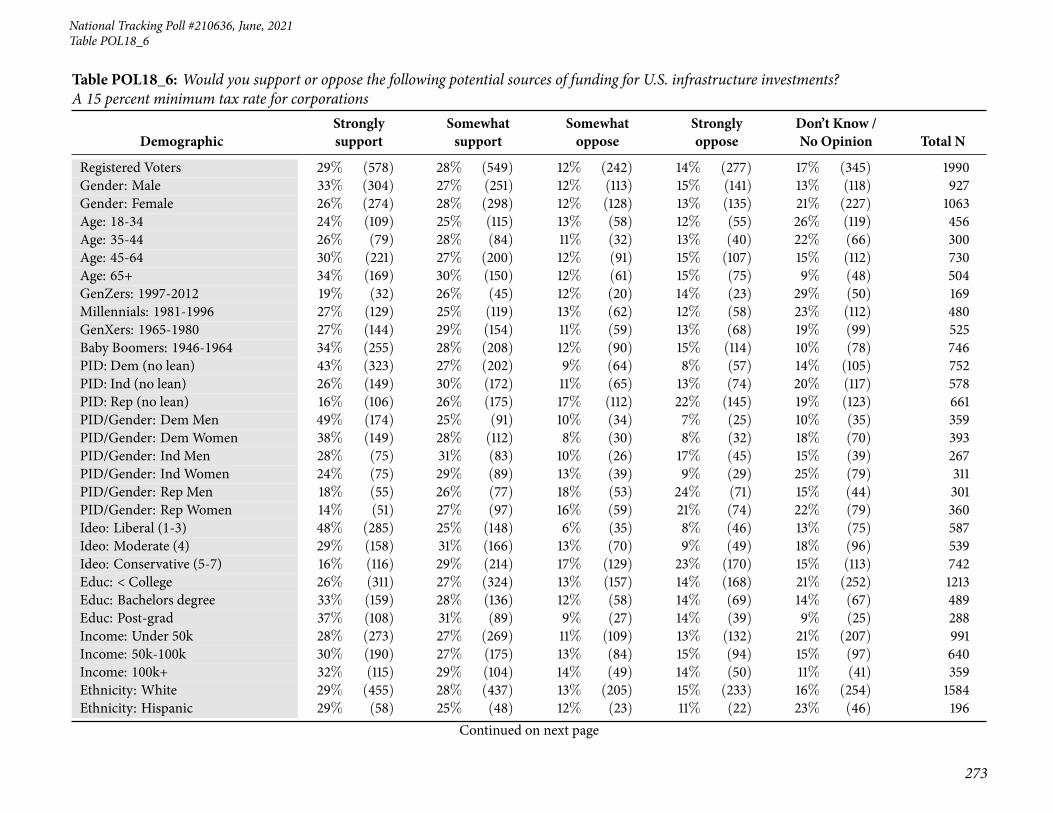
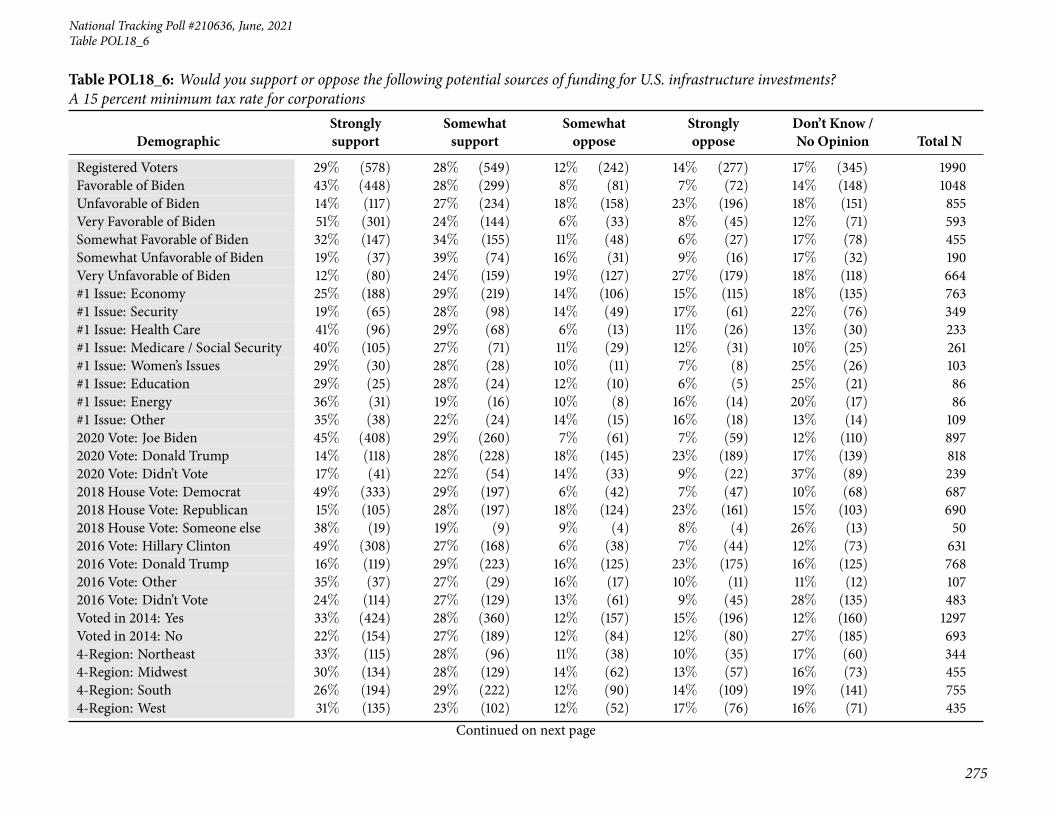
70 Table POL18_6: Would you support or oppose the following potential sources of funding forU.S. infrastructure investments? A 15 percent minimum tax rate for corporations . . . . . . 273
5
Page 6
Morning Consult
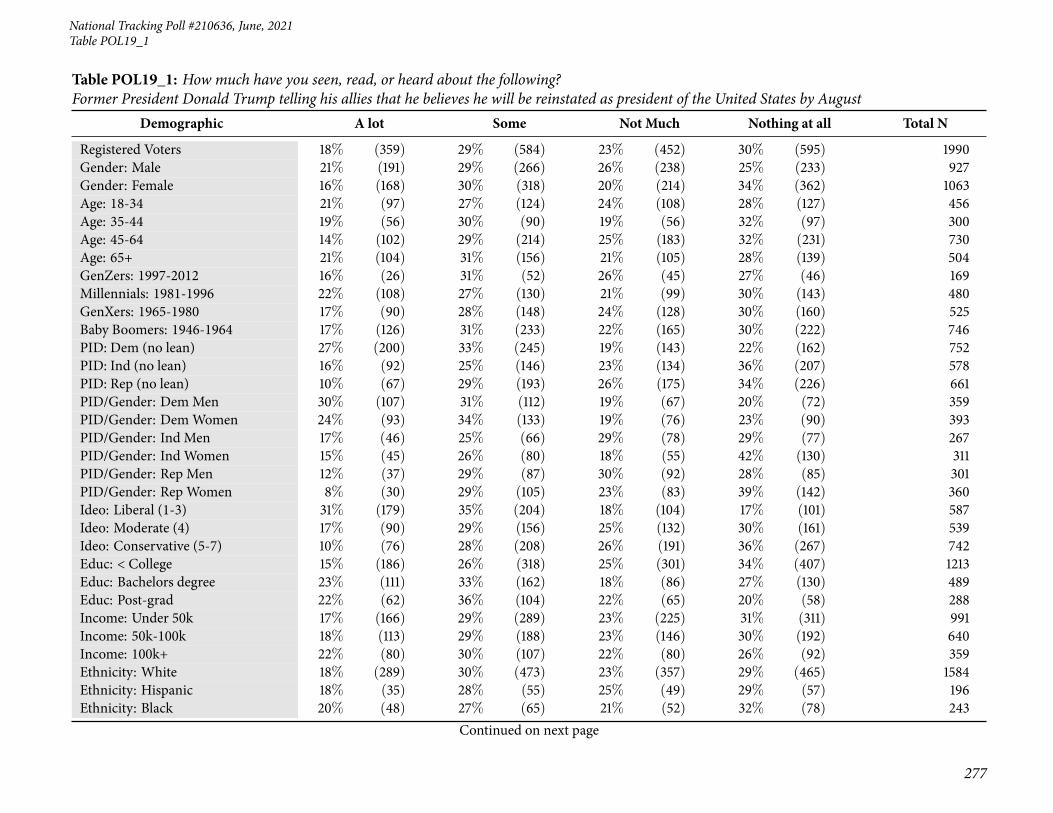
71 Table POL19_1: Howmuch have you seen, read, or heard about the following? Former Pres-ident Donald Trump telling his allies that he believes he will be reinstated as president of theUnited States by August . . . . . . . . . . . . . . . . . . . . . . . . . . . . . . . . . . . . . 277
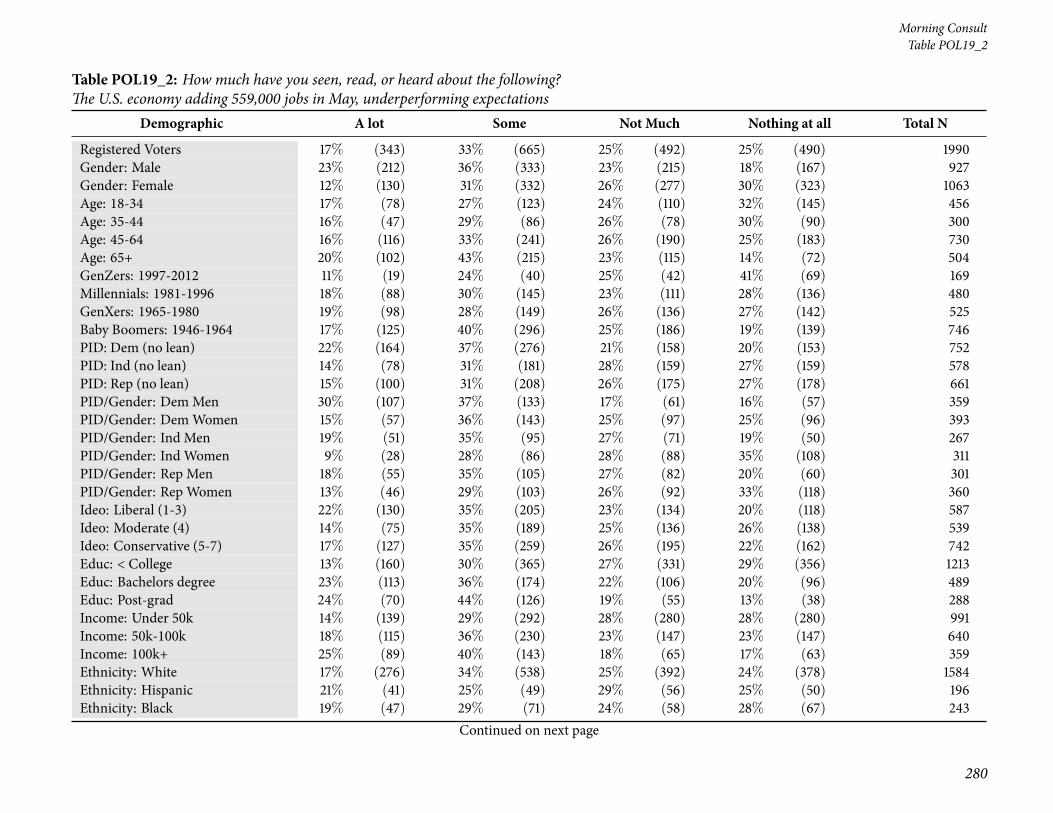
72 Table POL19_2: How much have you seen, read, or heard about the following? The U.S.economy adding 559,000 jobs in May, underperforming expectations . . . . . . . . . . . . . 280
73 Table POL19_3: Howmuch have you seen, read, or heard about the following? President JoeBiden ordering U.S. intelligence agencies to investigate the origins of the COVID-19 pandemic 283
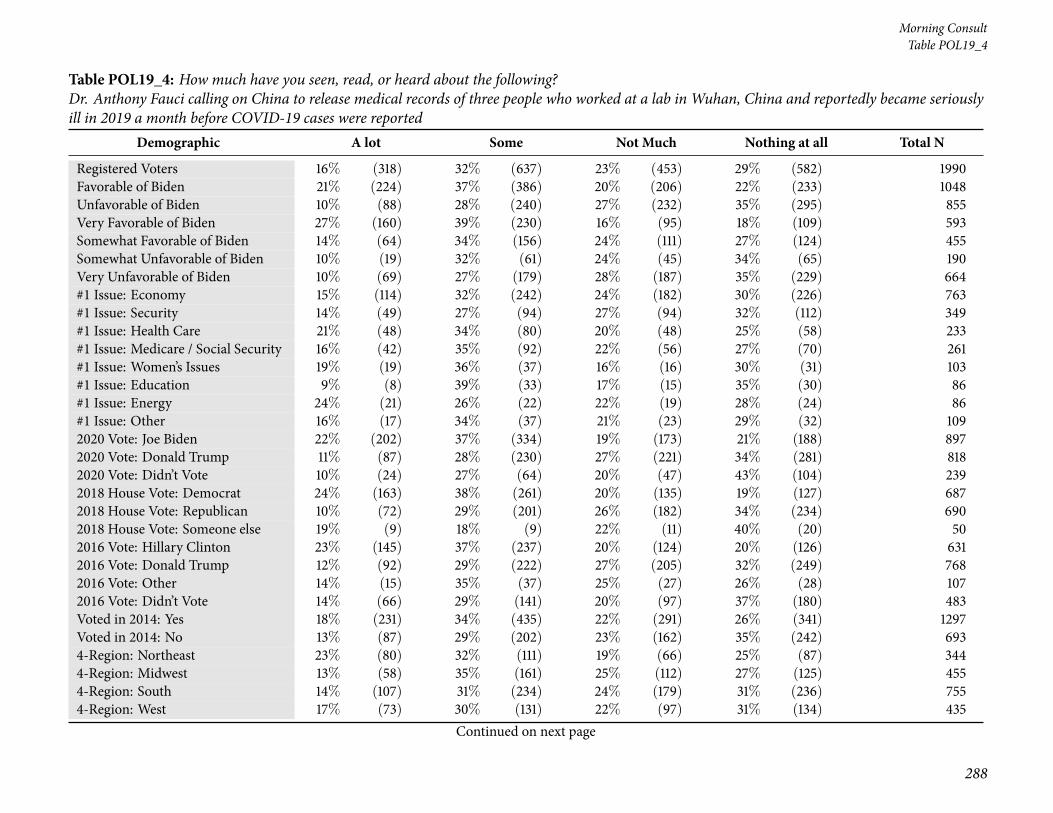
74 Table POL19_4: How much have you seen, read, or heard about the following? Dr. An-thony Fauci calling on China to release medical records of three people who worked at a lab inWuhan, China and reportedly became seriously ill in 2019 a month before COVID-19 caseswere reported . . . . . . . . . . . . . . . . . . . . . . . . . . . . . . . . . . . . . . . . . . 286
75 Table POL19_5: How much have you seen, read, or heard about the following? The WhiteHouse releasing President Joe Biden’s fiscal year 2022 budget, which calls for $6 trillion inspending . . . . . . . . . . . . . . . . . . . . . . . . . . . . . . . . . . . . . . . . . . . . 290
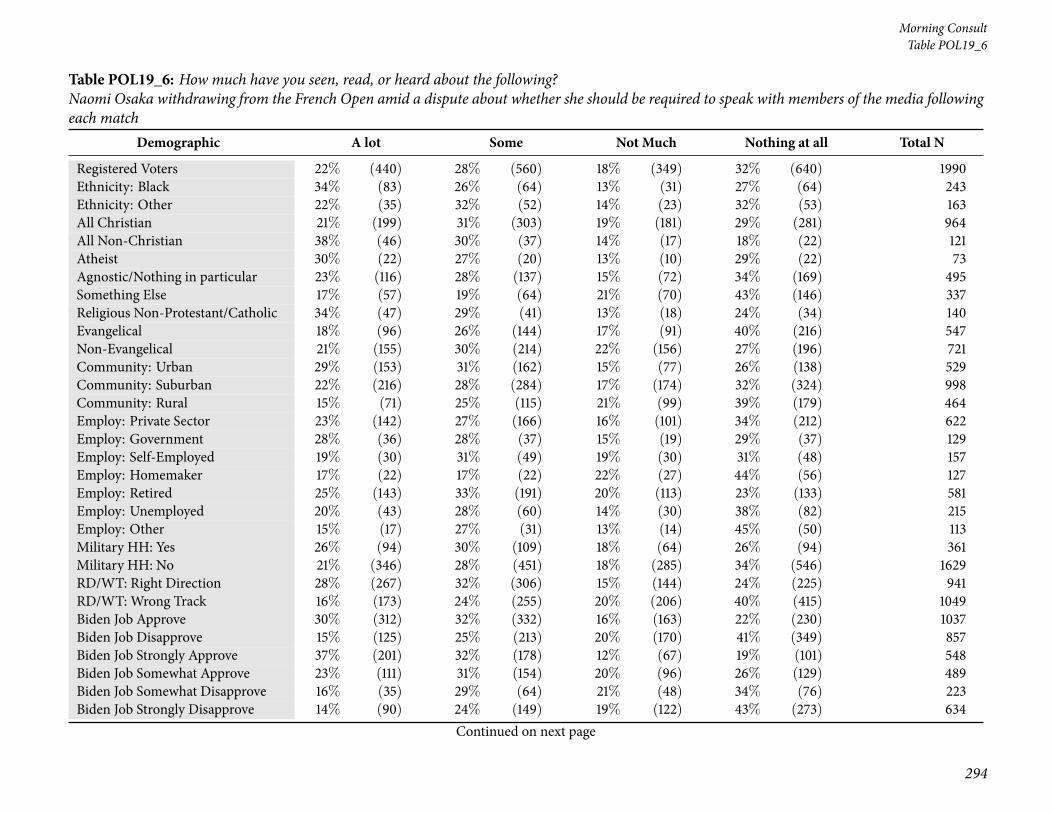
76 Table POL19_6: Howmuch have you seen, read, or heard about the following? Naomi Osakawithdrawing from the French Open amid a dispute about whether she should be required tospeak with members of the media following each match . . . . . . . . . . . . . . . . . . . . 293
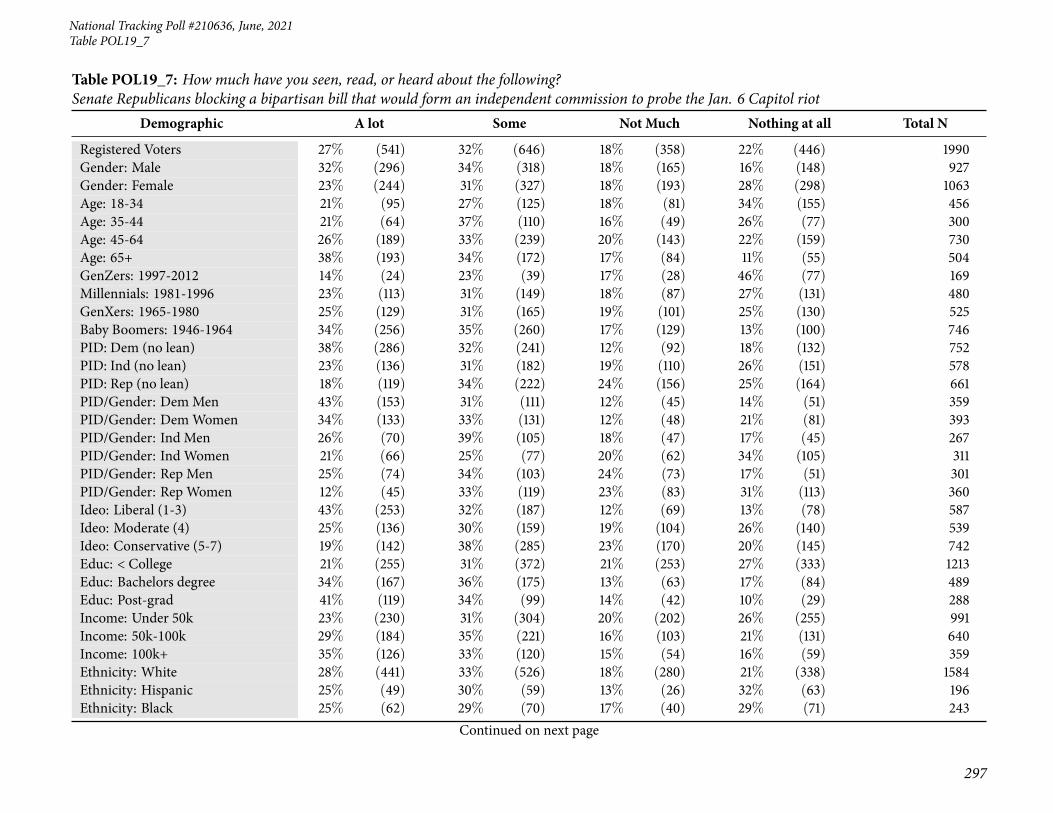
77 Table POL19_7: How much have you seen, read, or heard about the following? Senate Re-publicans blocking a bipartisan bill that would form an independent commission to probe theJan. 6 Capitol riot . . . . . . . . . . . . . . . . . . . . . . . . . . . . . . . . . . . . . . . . 297
78 Table POL19_8: How much have you seen, read, or heard about the following? Facebookannouncing that it plans to suspend former President Donald Trump from its platform for thenext two years, at least . . . . . . . . . . . . . . . . . . . . . . . . . . . . . . . . . . . . . 300
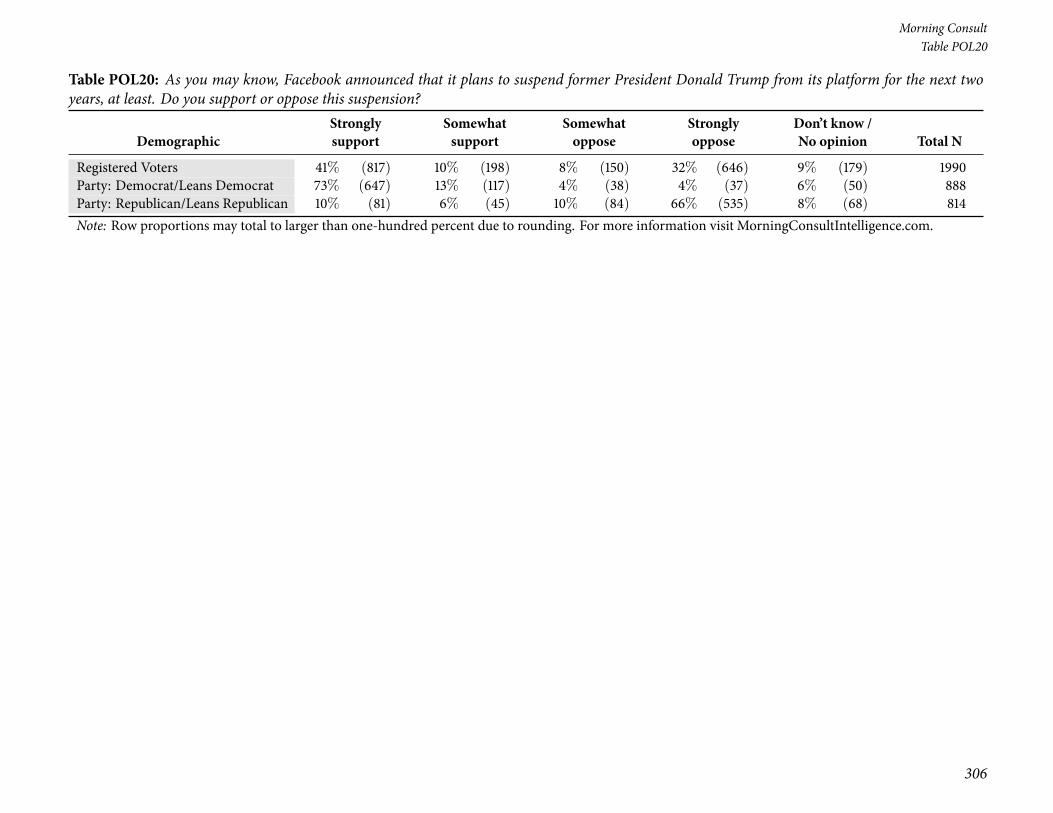
79 Table POL20: As you may know, Facebook announced that it plans to suspend former Pres-ident Donald Trump from its platform for the next two years, at least. Do you support oroppose this suspension? . . . . . . . . . . . . . . . . . . . . . . . . . . . . . . . . . . . . . 303
80 Table POLx_1: Next we will look at a list of names that are active in politics. It is a longlist, please take the time to go through the list carefully and give an individual answer foreach name below. For each person, please indicate if you have a Very Favorable, SomewhatFavorable, Somewhat Unfavorable, or Very Unfavorable opinion of each If you have heard ofthe person, but do not have an opinion, please mark ’Heard Of, No Opinion.’ If you have notheard of the person, please mark ’Never Heard Of.’Mitch McConnell . . . . . . . . . . . . . 307
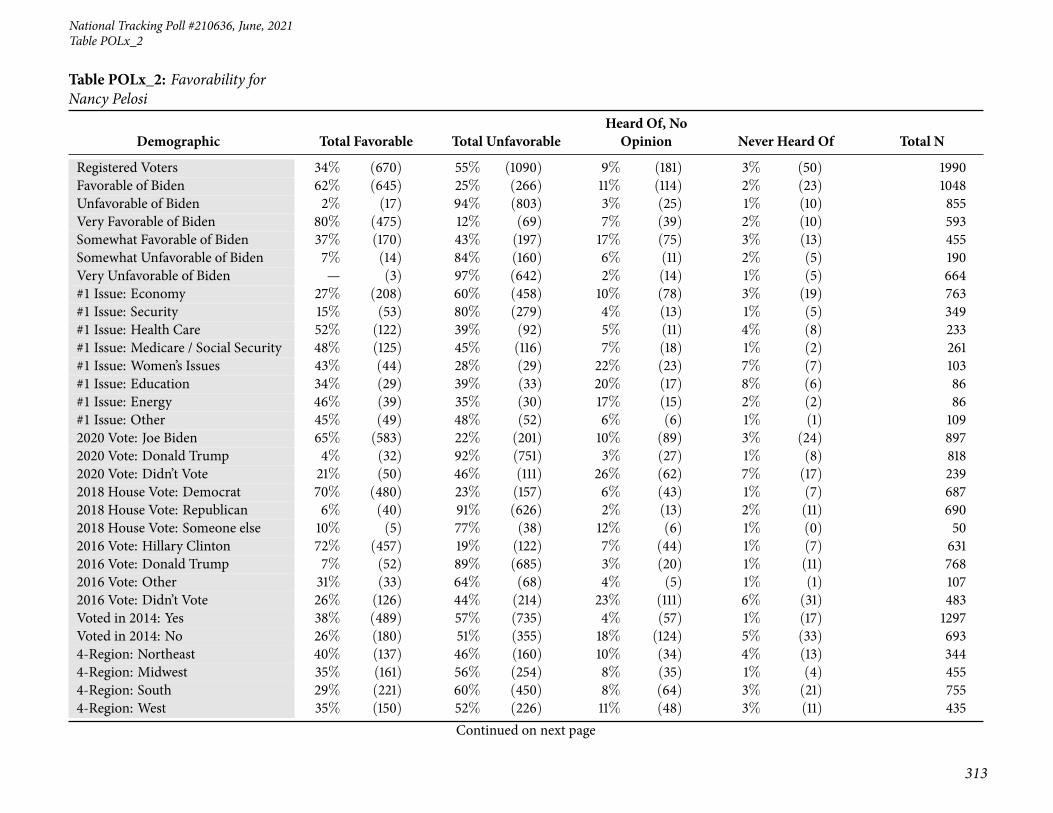
81 Table POLx_2: Favorability for Nancy Pelosi . . . . . . . . . . . . . . . . . . . . . . . . . 311
82 Table POLx_3: Favorability for Charles Schumer . . . . . . . . . . . . . . . . . . . . . . . 315
83 Table POLx_4: Favorability for Mike Pence . . . . . . . . . . . . . . . . . . . . . . . . . . 319
84 Table POLx_5: Favorability for Donald Trump . . . . . . . . . . . . . . . . . . . . . . . . 323
85 Table POLx_6: Favorability for Republicans in Congress . . . . . . . . . . . . . . . . . . . 327
6
Page 7
National Tracking Poll #210636, June, 2021
86 Table POLx_7: Favorability for Democrats in Congress . . . . . . . . . . . . . . . . . . . . 331
87 Table POLx_9: Favorability for Kevin McCarthy . . . . . . . . . . . . . . . . . . . . . . . 335
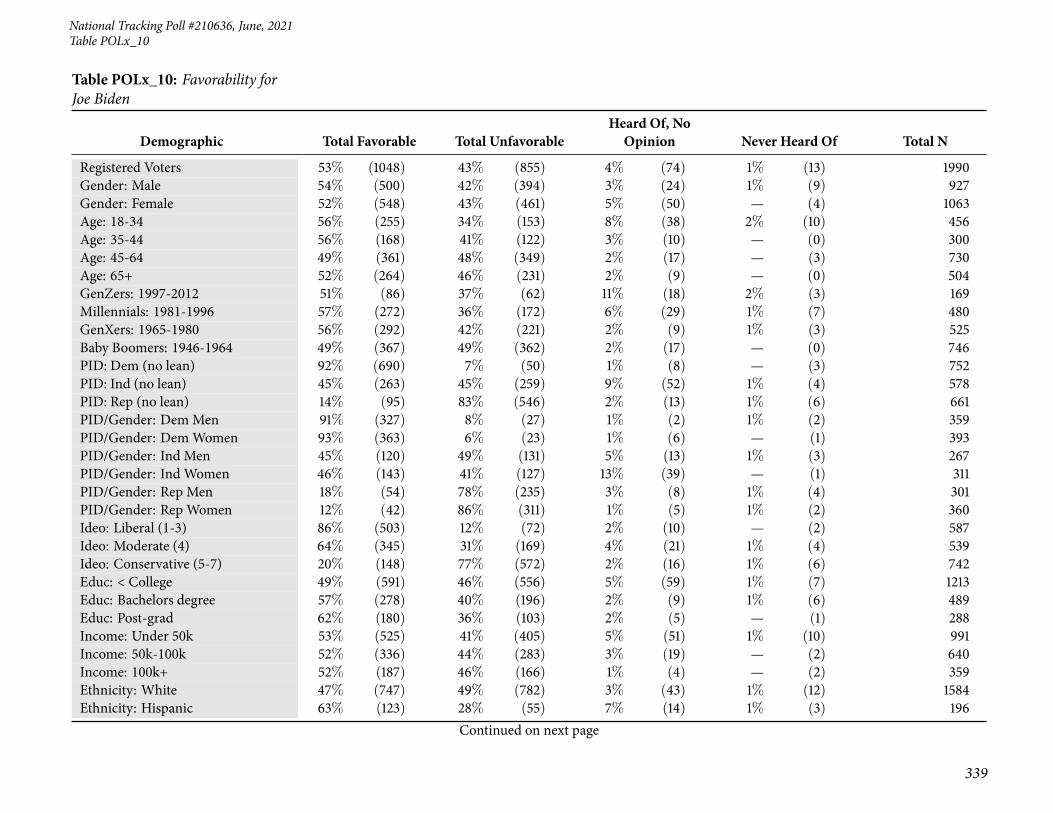
88 Table POLx_10: Favorability for Joe Biden . . . . . . . . . . . . . . . . . . . . . . . . . . 339
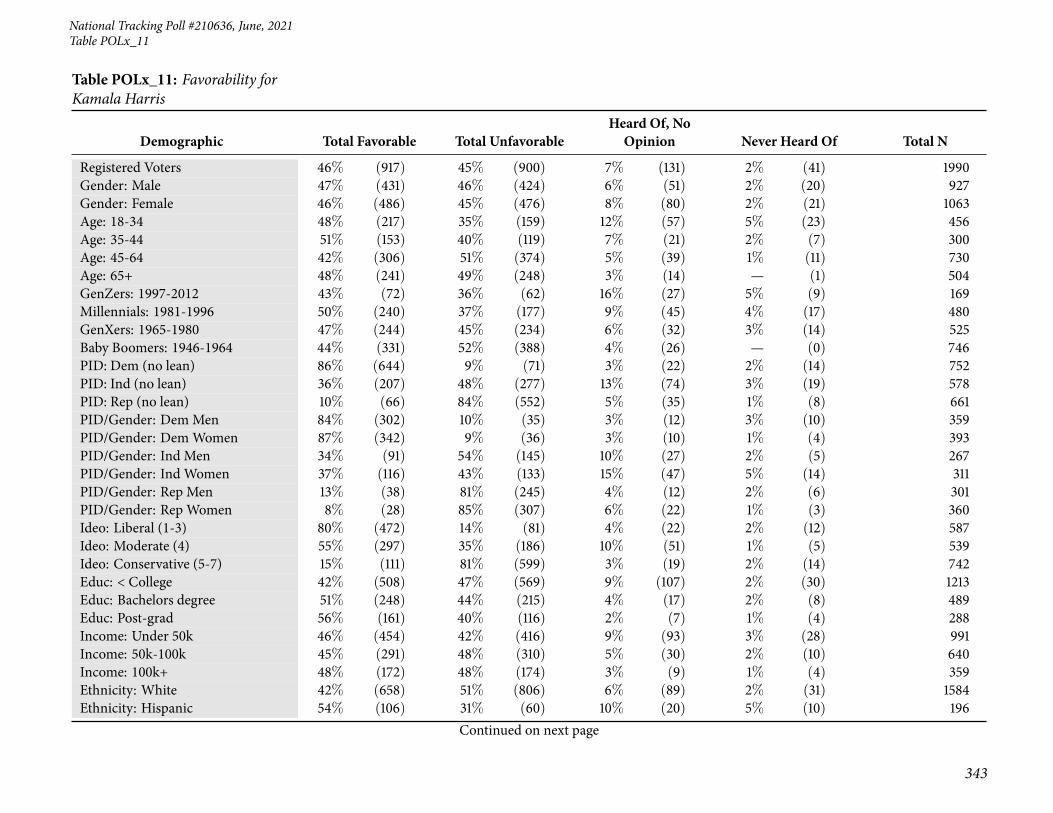
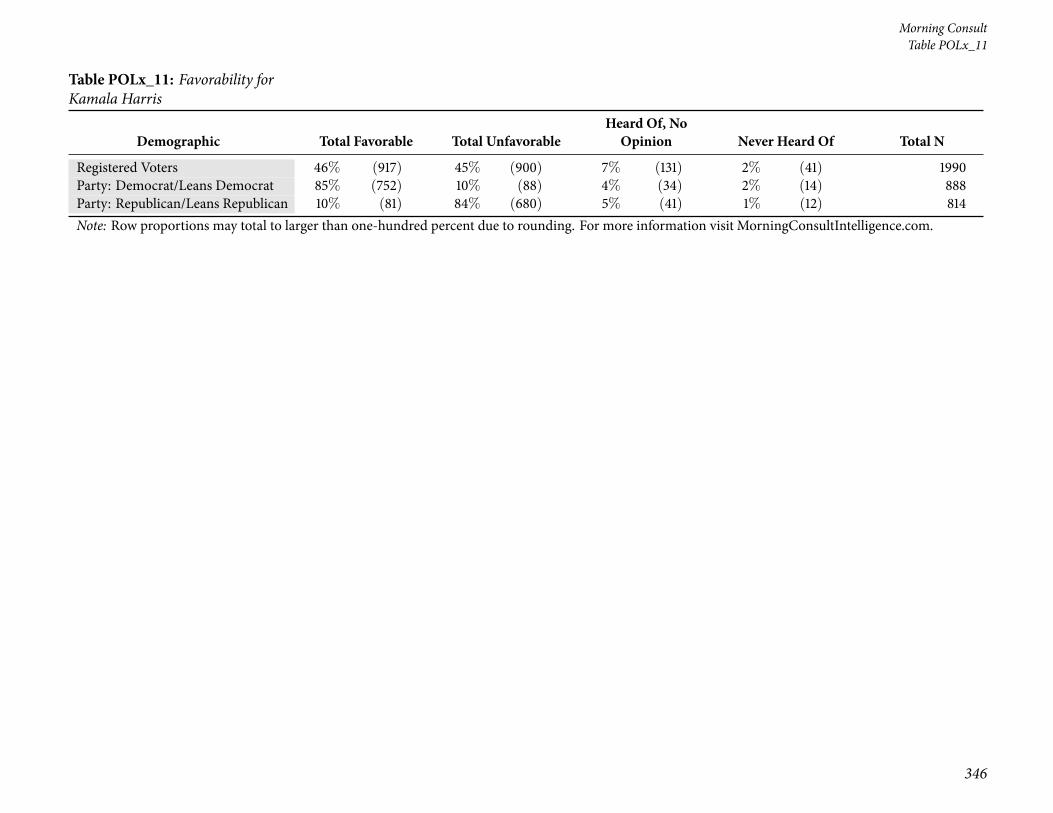
89 Table POLx_11: Favorability for Kamala Harris . . . . . . . . . . . . . . . . . . . . . . . 343
90 Table POLx_12: Favorability for Anthony Fauci . . . . . . . . . . . . . . . . . . . . . . . 347
91 Summary Statistics of Survey Respondent Demographics . . . . . . . . . . . . . . . . . 351
7
Page 8
8
Morning ConsultTable P1
Crosstabulation Results by Respondent Demographics
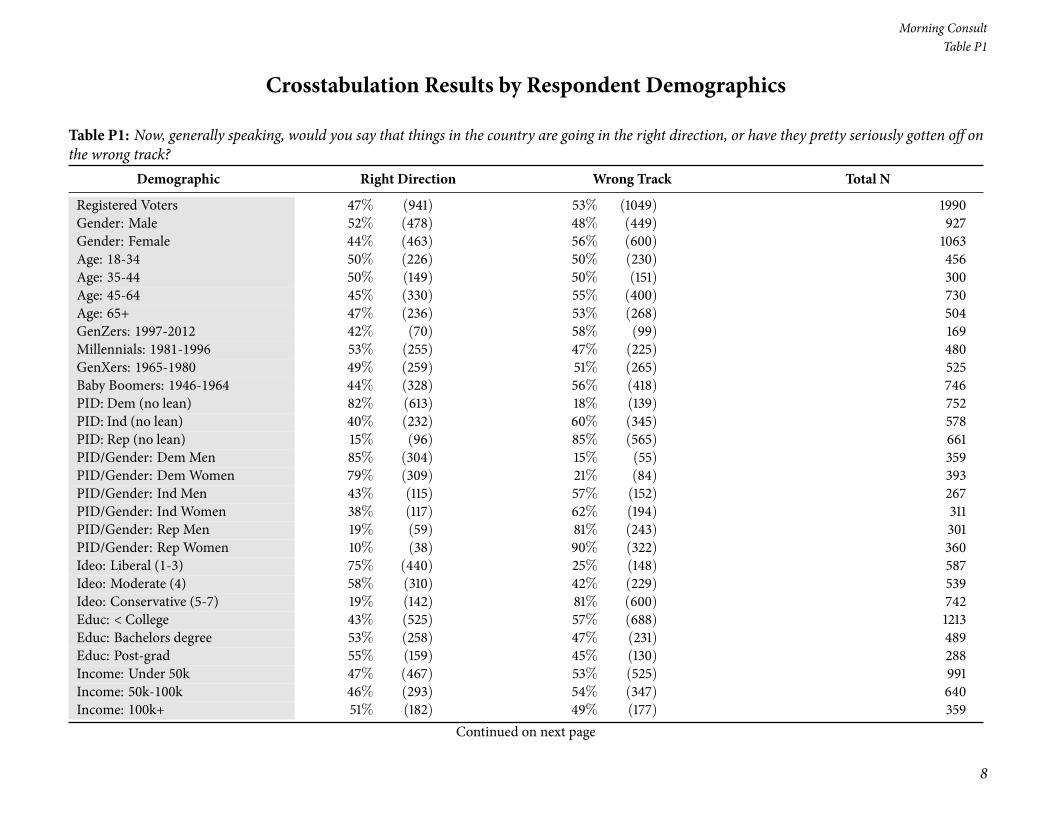
Table P1: Now, generally speaking, would you say that things in the country are going in the right direction, or have they pretty seriously gotten off onthe wrong track?
Demographic Right Direction Wrong Track Total N
Registered Voters 47% (941) 53% (1049) 1990Gender: Male 52% (478) 48% (449) 927Gender: Female 44% (463) 56% (600) 1063Age: 18-34 50% (226) 50% (230) 456Age: 35-44 50% (149) 50% (151) 300Age: 45-64 45% (330) 55% (400) 730Age: 65+ 47% (236) 53% (268) 504GenZers: 1997-2012 42% (70) 58% (99) 169Millennials: 1981-1996 53% (255) 47% (225) 480GenXers: 1965-1980 49% (259) 51% (265) 525Baby Boomers: 1946-1964 44% (328) 56% (418) 746PID: Dem (no lean) 82% (613) 18% (139) 752PID: Ind (no lean) 40% (232) 60% (345) 578PID: Rep (no lean) 15% (96) 85% (565) 661PID/Gender: DemMen 85% (304) 15% (55) 359PID/Gender: DemWomen 79% (309) 21% (84) 393PID/Gender: Ind Men 43% (115) 57% (152) 267PID/Gender: Ind Women 38% (117) 62% (194) 311PID/Gender: Rep Men 19% (59) 81% (243) 301PID/Gender: Rep Women 10% (38) 90% (322) 360Ideo: Liberal (1-3) 75% (440) 25% (148) 587Ideo: Moderate (4) 58% (310) 42% (229) 539Ideo: Conservative (5-7) 19% (142) 81% (600) 742Educ: < College 43% (525) 57% (688) 1213Educ: Bachelors degree 53% (258) 47% (231) 489Educ: Post-grad 55% (159) 45% (130) 288Income: Under 50k 47% (467) 53% (525) 991Income: 50k-100k 46% (293) 54% (347) 640Income: 100k+ 51% (182) 49% (177) 359
Continued on next page
Page 9
National Tracking Poll #210636, June, 2021
9
Table P1
Table P1: Now, generally speaking, would you say that things in the country are going in the right direction, or have they pretty seriously gotten off onthe wrong track?
Demographic Right Direction Wrong Track Total N
Registered Voters 47% (941) 53% (1049) 1990Ethnicity: White 43% (682) 57% (902) 1584Ethnicity: Hispanic 57% (112) 43% (83) 196Ethnicity: Black 72% (174) 28% (69) 243Ethnicity: Other 52% (85) 48% (78) 163All Christian 42% (400) 58% (564) 964All Non-Christian 75% (91) 25% (30) 121Atheist 68% (50) 32% (23) 73Agnostic/Nothing in particular 52% (259) 48% (236) 495Something Else 42% (141) 58% (196) 337Religious Non-Protestant/Catholic 71% (99) 29% (41) 140Evangelical 37% (201) 63% (346) 547Non-Evangelical 45% (323) 55% (398) 721Community: Urban 64% (337) 36% (191) 529Community: Suburban 44% (443) 56% (554) 998Community: Rural 35% (161) 65% (303) 464Employ: Private Sector 51% (320) 49% (302) 622Employ: Government 50% (64) 50% (65) 129Employ: Self-Employed 45% (71) 55% (86) 157Employ: Homemaker 37% (47) 63% (79) 127Employ: Retired 45% (263) 55% (318) 581Employ: Unemployed 44% (94) 56% (121) 215Employ: Other 52% (59) 48% (54) 113Military HH: Yes 40% (144) 60% (218) 361Military HH: No 49% (798) 51% (831) 1629RD/WT: Right Direction 100% (941) — (0) 941RD/WT: Wrong Track — (0) 100% (1049) 1049Biden Job Approve 83% (859) 17% (178) 1037Biden Job Disapprove 5% (47) 95% (810) 857
Continued on next page
Page 10
10
Morning ConsultTable P1
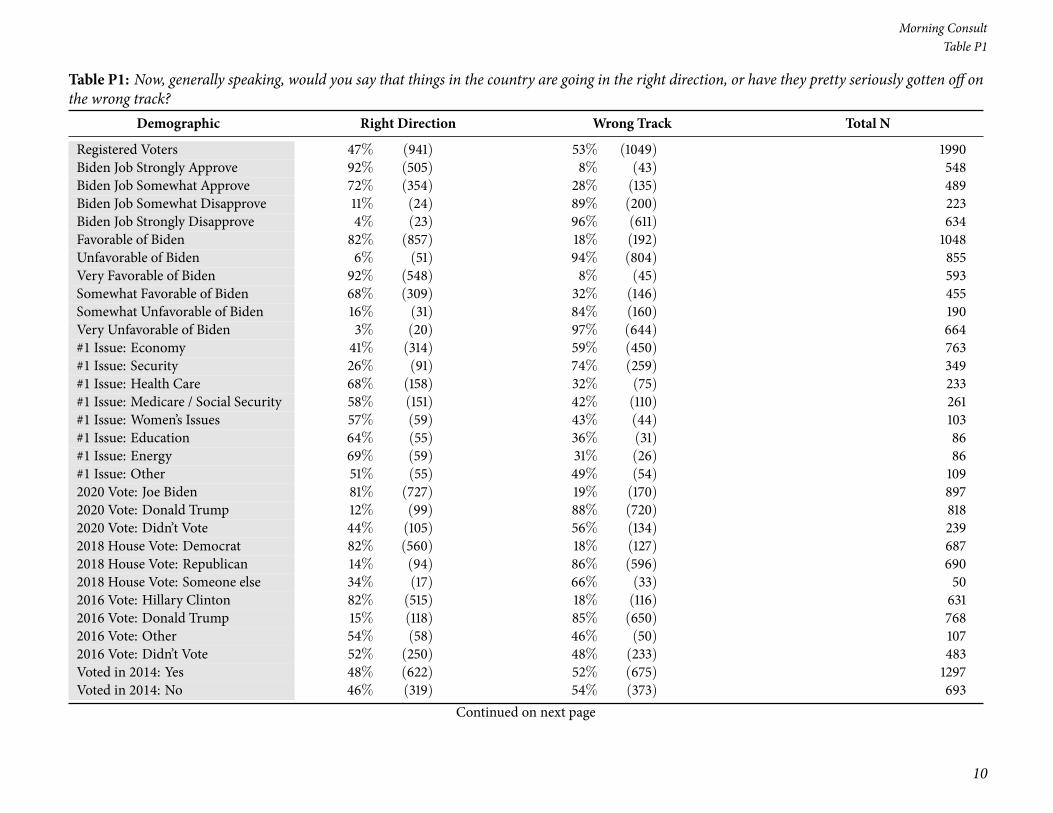
Table P1: Now, generally speaking, would you say that things in the country are going in the right direction, or have they pretty seriously gotten off onthe wrong track?
Demographic Right Direction Wrong Track Total N
Registered Voters 47% (941) 53% (1049) 1990Biden Job Strongly Approve 92% (505) 8% (43) 548Biden Job Somewhat Approve 72% (354) 28% (135) 489Biden Job Somewhat Disapprove 11% (24) 89% (200) 223Biden Job Strongly Disapprove 4% (23) 96% (611) 634Favorable of Biden 82% (857) 18% (192) 1048Unfavorable of Biden 6% (51) 94% (804) 855Very Favorable of Biden 92% (548) 8% (45) 593Somewhat Favorable of Biden 68% (309) 32% (146) 455Somewhat Unfavorable of Biden 16% (31) 84% (160) 190Very Unfavorable of Biden 3% (20) 97% (644) 664#1 Issue: Economy 41% (314) 59% (450) 763#1 Issue: Security 26% (91) 74% (259) 349#1 Issue: Health Care 68% (158) 32% (75) 233#1 Issue: Medicare / Social Security 58% (151) 42% (110) 261#1 Issue: Women’s Issues 57% (59) 43% (44) 103#1 Issue: Education 64% (55) 36% (31) 86#1 Issue: Energy 69% (59) 31% (26) 86#1 Issue: Other 51% (55) 49% (54) 1092020 Vote: Joe Biden 81% (727) 19% (170) 8972020 Vote: Donald Trump 12% (99) 88% (720) 8182020 Vote: Didn’t Vote 44% (105) 56% (134) 2392018 House Vote: Democrat 82% (560) 18% (127) 6872018 House Vote: Republican 14% (94) 86% (596) 6902018 House Vote: Someone else 34% (17) 66% (33) 502016 Vote: Hillary Clinton 82% (515) 18% (116) 6312016 Vote: Donald Trump 15% (118) 85% (650) 7682016 Vote: Other 54% (58) 46% (50) 1072016 Vote: Didn’t Vote 52% (250) 48% (233) 483Voted in 2014: Yes 48% (622) 52% (675) 1297Voted in 2014: No 46% (319) 54% (373) 693
Continued on next page
Page 11
National Tracking Poll #210636, June, 2021
11
Table P1
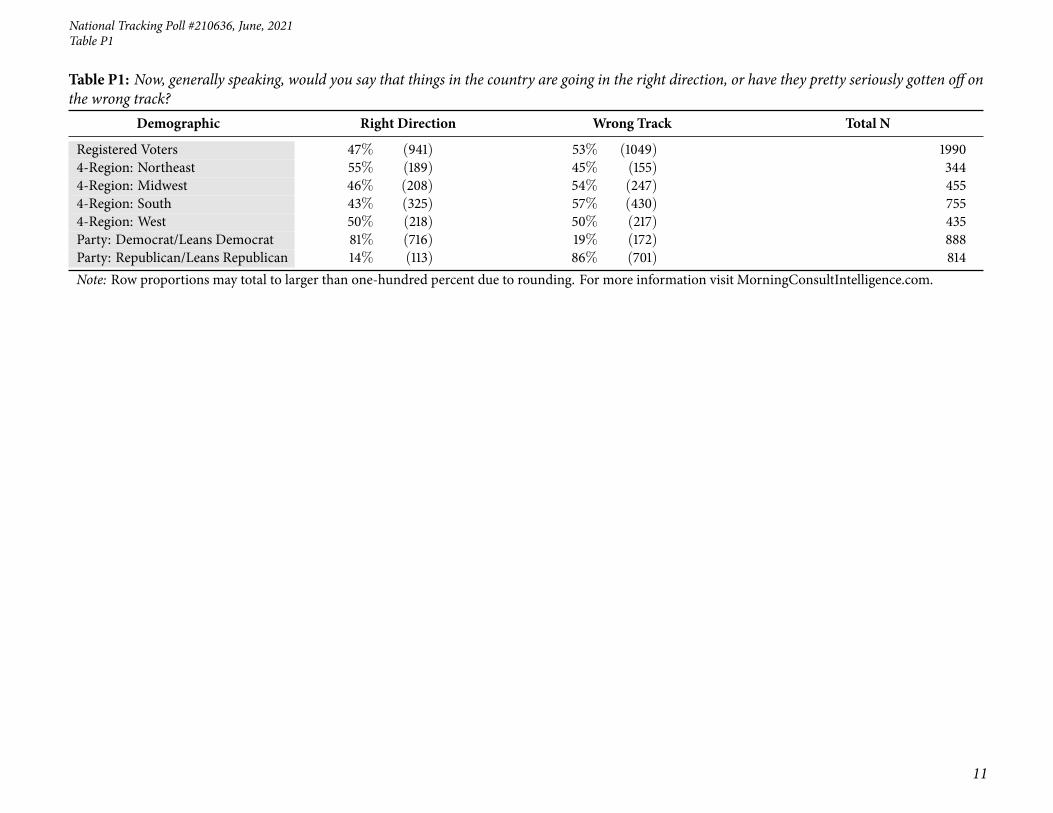
Table P1: Now, generally speaking, would you say that things in the country are going in the right direction, or have they pretty seriously gotten off onthe wrong track?
Demographic Right Direction Wrong Track Total N
Registered Voters 47% (941) 53% (1049) 19904-Region: Northeast 55% (189) 45% (155) 3444-Region: Midwest 46% (208) 54% (247) 4554-Region: South 43% (325) 57% (430) 7554-Region: West 50% (218) 50% (217) 435Party: Democrat/Leans Democrat 81% (716) 19% (172) 888Party: Republican/Leans Republican 14% (113) 86% (701) 814Note: Row proportions may total to larger than one-hundred percent due to rounding. For more information visit MorningConsultIntelligence.com.
Page 12
12
Morning ConsultTable nr2b
Table nr2b: Do you approve or disapprove of the job Joe Biden is doing as President?
DemographicStronglyApprove
SomewhatApprove
SomewhatDisapprove
StronglyDisapprove
Don’t Know /No Opinion Total N
Registered Voters 28% (548) 25% (489) 11% (223) 32% (634) 5% (96) 1990Gender: Male 31% (285) 24% (221) 10% (90) 32% (296) 4% (34) 927Gender: Female 25% (263) 25% (268) 13% (133) 32% (338) 6% (61) 1063Age: 18-34 22% (100) 35% (160) 12% (55) 19% (85) 12% (57) 456Age: 35-44 32% (95) 25% (75) 11% (32) 28% (85) 4% (13) 300Age: 45-64 25% (183) 22% (163) 12% (86) 38% (278) 3% (19) 730Age: 65+ 34% (170) 18% (91) 10% (50) 37% (186) 1% (7) 504GenZers: 1997-2012 17% (28) 33% (56) 13% (21) 17% (29) 20% (34) 169Millennials: 1981-1996 28% (134) 30% (144) 11% (53) 24% (115) 7% (34) 480GenXers: 1965-1980 27% (141) 27% (143) 12% (61) 31% (165) 3% (15) 525Baby Boomers: 1946-1964 29% (220) 19% (139) 11% (81) 39% (294) 1% (11) 746PID: Dem (no lean) 56% (424) 35% (260) 4% (34) 3% (20) 2% (14) 752PID: Ind (no lean) 15% (88) 28% (165) 15% (89) 29% (169) 11% (66) 578PID: Rep (no lean) 5% (35) 10% (65) 15% (100) 67% (445) 2% (15) 661PID/Gender: DemMen 61% (220) 31% (111) 4% (13) 3% (11) 1% (3) 359PID/Gender: DemWomen 52% (204) 38% (148) 5% (20) 2% (8) 3% (12) 393PID/Gender: Ind Men 16% (43) 28% (75) 12% (32) 34% (92) 9% (25) 267PID/Gender: Ind Women 14% (45) 29% (89) 19% (58) 25% (77) 13% (41) 311PID/Gender: Rep Men 7% (22) 11% (34) 15% (45) 64% (193) 2% (7) 301PID/Gender: Rep Women 4% (14) 8% (30) 15% (55) 70% (252) 2% (8) 360Ideo: Liberal (1-3) 51% (299) 35% (204) 7% (42) 5% (29) 2% (13) 587Ideo: Moderate (4) 31% (168) 31% (168) 13% (70) 20% (109) 4% (24) 539Ideo: Conservative (5-7) 9% (65) 12% (89) 13% (98) 64% (472) 2% (18) 742Educ: < College 23% (279) 25% (300) 12% (144) 33% (404) 7% (86) 1213Educ: Bachelors degree 34% (164) 24% (117) 11% (52) 30% (149) 1% (6) 489Educ: Post-grad 36% (105) 25% (72) 9% (27) 28% (81) 1% (4) 288Income: Under 50k 27% (263) 26% (258) 11% (110) 30% (301) 6% (60) 991Income: 50k-100k 26% (165) 26% (166) 10% (67) 34% (216) 4% (26) 640Income: 100k+ 33% (120) 18% (66) 13% (46) 33% (117) 3% (10) 359Ethnicity: White 26% (412) 21% (336) 12% (190) 37% (590) 4% (56) 1584Ethnicity: Hispanic 33% (66) 27% (54) 11% (22) 14% (28) 14% (27) 196Ethnicity: Black 43% (105) 37% (90) 6% (16) 4% (10) 9% (23) 243
Continued on next page
Page 13
National Tracking Poll #210636, June, 2021
13
Table nr2b
Table nr2b: Do you approve or disapprove of the job Joe Biden is doing as President?
DemographicStronglyApprove
SomewhatApprove
SomewhatDisapprove
StronglyDisapprove
Don’t Know /No Opinion Total N
Registered Voters 28% (548) 25% (489) 11% (223) 32% (634) 5% (96) 1990Ethnicity: Other 19% (31) 39% (63) 11% (18) 21% (34) 10% (17) 163All Christian 26% (249) 21% (207) 11% (104) 40% (385) 2% (19) 964All Non-Christian 51% (62) 23% (28) 4% (5) 16% (19) 6% (7) 121Atheist 37% (27) 33% (24) 12% (9) 16% (12) 1% (1) 73Agnostic/Nothing in particular 28% (139) 28% (139) 14% (68) 23% (114) 7% (36) 495Something Else 21% (71) 27% (91) 11% (38) 31% (104) 10% (33) 337Religious Non-Protestant/Catholic 46% (65) 23% (33) 5% (8) 20% (28) 5% (7) 140Evangelical 24% (131) 16% (88) 11% (58) 45% (248) 4% (22) 547Non-Evangelical 26% (185) 28% (199) 11% (79) 32% (228) 4% (30) 721Community: Urban 41% (215) 27% (145) 8% (41) 19% (99) 6% (29) 529Community: Suburban 24% (243) 24% (243) 12% (120) 35% (344) 5% (47) 998Community: Rural 19% (90) 22% (101) 13% (62) 41% (191) 4% (20) 464Employ: Private Sector 28% (174) 27% (165) 10% (61) 31% (195) 4% (27) 622Employ: Government 28% (36) 22% (28) 13% (17) 30% (39) 7% (9) 129Employ: Self-Employed 30% (47) 24% (38) 12% (19) 32% (50) 2% (3) 157Employ: Homemaker 25% (32) 14% (18) 16% (21) 36% (46) 8% (10) 127Employ: Retired 32% (185) 18% (107) 12% (68) 37% (213) 2% (9) 581Employ: Unemployed 18% (38) 38% (81) 10% (21) 24% (52) 11% (23) 215Employ: Other 28% (31) 27% (30) 10% (11) 23% (26) 12% (14) 113Military HH: Yes 23% (85) 20% (73) 10% (35) 44% (160) 3% (9) 361Military HH: No 28% (463) 26% (416) 12% (188) 29% (474) 5% (87) 1629RD/WT: Right Direction 54% (505) 38% (354) 3% (24) 2% (23) 4% (35) 941RD/WT: Wrong Track 4% (43) 13% (135) 19% (200) 58% (611) 6% (60) 1049Biden Job Approve 53% (548) 47% (489) — (0) — (0) — (0) 1037Biden Job Disapprove — (0) — (0) 26% (223) 74% (634) — (0) 857Biden Job Strongly Approve 100% (548) — (0) — (0) — (0) — (0) 548Biden Job Somewhat Approve — (0) 100% (489) — (0) — (0) — (0) 489Biden Job Somewhat Disapprove — (0) — (0) 100% (223) — (0) — (0) 223Biden Job Strongly Disapprove — (0) — (0) — (0) 100% (634) — (0) 634Favorable of Biden 51% (532) 43% (455) 3% (30) 1% (12) 2% (20) 1048Unfavorable of Biden 1% (7) 3% (27) 21% (183) 72% (611) 3% (26) 855
Continued on next page
Page 14
14
Morning ConsultTable nr2b
Table nr2b: Do you approve or disapprove of the job Joe Biden is doing as President?
DemographicStronglyApprove
SomewhatApprove
SomewhatDisapprove
StronglyDisapprove
Don’t Know /No Opinion Total N
Registered Voters 28% (548) 25% (489) 11% (223) 32% (634) 5% (96) 1990Very Favorable of Biden 85% (501) 13% (78) — (1) 1% (8) 1% (4) 593Somewhat Favorable of Biden 7% (30) 83% (376) 6% (29) 1% (4) 3% (16) 455Somewhat Unfavorable of Biden 2% (4) 10% (20) 72% (136) 8% (15) 8% (15) 190Very Unfavorable of Biden 1% (3) 1% (7) 7% (47) 90% (596) 2% (11) 664#1 Issue: Economy 22% (166) 24% (186) 13% (98) 35% (267) 6% (47) 763#1 Issue: Security 13% (46) 13% (46) 11% (38) 59% (208) 3% (11) 349#1 Issue: Health Care 45% (105) 28% (65) 10% (22) 14% (33) 4% (8) 233#1 Issue: Medicare / Social Security 37% (96) 27% (70) 11% (27) 24% (62) 2% (5) 261#1 Issue: Women’s Issues 35% (36) 33% (34) 9% (10) 13% (13) 11% (11) 103#1 Issue: Education 39% (33) 30% (26) 14% (12) 13% (11) 5% (4) 86#1 Issue: Energy 41% (35) 38% (33) 8% (6) 8% (7) 5% (4) 86#1 Issue: Other 29% (32) 26% (29) 9% (10) 31% (34) 4% (5) 1092020 Vote: Joe Biden 55% (490) 38% (337) 4% (36) 2% (16) 2% (18) 8972020 Vote: Donald Trump 3% (27) 9% (72) 16% (132) 69% (568) 2% (19) 8182020 Vote: Didn’t Vote 13% (31) 30% (71) 17% (41) 17% (42) 23% (55) 2392018 House Vote: Democrat 56% (385) 34% (236) 5% (37) 3% (21) 1% (8) 6872018 House Vote: Republican 6% (38) 10% (68) 15% (107) 67% (465) 2% (12) 6902018 House Vote: Someone else 8% (4) 30% (15) 26% (13) 26% (13) 9% (4) 502016 Vote: Hillary Clinton 59% (370) 31% (198) 5% (32) 3% (20) 2% (11) 6312016 Vote: Donald Trump 6% (49) 11% (88) 15% (115) 66% (503) 2% (12) 7682016 Vote: Other 20% (21) 37% (40) 18% (19) 21% (22) 4% (5) 1072016 Vote: Didn’t Vote 22% (107) 34% (163) 12% (57) 18% (88) 14% (68) 483Voted in 2014: Yes 32% (409) 21% (273) 10% (129) 36% (463) 2% (23) 1297Voted in 2014: No 20% (139) 31% (216) 14% (94) 25% (171) 11% (73) 6934-Region: Northeast 35% (120) 25% (87) 11% (37) 25% (85) 4% (15) 3444-Region: Midwest 28% (130) 24% (110) 11% (51) 33% (150) 3% (14) 4554-Region: South 25% (188) 23% (176) 11% (80) 36% (274) 5% (37) 7554-Region: West 25% (110) 27% (116) 12% (54) 29% (125) 7% (29) 435Party: Democrat/Leans Democrat 53% (475) 37% (325) 5% (45) 3% (25) 2% (20) 888Party: Republican/Leans Republican 5% (38) 11% (87) 16% (132) 66% (536) 3% (20) 814Note: Row proportions may total to larger than one-hundred percent due to rounding. For more information visit MorningConsultIntelligence.com.
Page 15
National Tracking Poll #210636, June, 2021
15
Table nr2bNET
Table nr2bNET: Do you approve or disapprove of the job Joe Biden is doing as President?
Demographic Total Approve Total DisapproveDon’t Know / No
Opinion Total N
Registered Voters 52% (1037) 43% (857) 5% (96) 1990Gender: Male 55% (506) 42% (387) 4% (34) 927Gender: Female 50% (531) 44% (471) 6% (61) 1063Age: 18-34 57% (259) 31% (140) 12% (57) 456Age: 35-44 57% (170) 39% (117) 4% (13) 300Age: 45-64 48% (347) 50% (364) 3% (19) 730Age: 65+ 52% (261) 47% (236) 1% (7) 504GenZers: 1997-2012 50% (85) 30% (50) 20% (34) 169Millennials: 1981-1996 58% (278) 35% (168) 7% (34) 480GenXers: 1965-1980 54% (285) 43% (225) 3% (15) 525Baby Boomers: 1946-1964 48% (359) 50% (376) 1% (11) 746PID: Dem (no lean) 91% (684) 7% (53) 2% (14) 752PID: Ind (no lean) 44% (253) 45% (259) 11% (66) 578PID: Rep (no lean) 15% (100) 83% (545) 2% (15) 661PID/Gender: DemMen 92% (332) 7% (25) 1% (3) 359PID/Gender: DemWomen 90% (353) 7% (28) 3% (12) 393PID/Gender: Ind Men 44% (119) 46% (124) 9% (25) 267PID/Gender: Ind Women 43% (134) 43% (135) 13% (41) 311PID/Gender: Rep Men 19% (56) 79% (238) 2% (7) 301PID/Gender: Rep Women 12% (44) 85% (307) 2% (8) 360Ideo: Liberal (1-3) 86% (503) 12% (71) 2% (13) 587Ideo: Moderate (4) 62% (336) 33% (179) 4% (24) 539Ideo: Conservative (5-7) 21% (154) 77% (570) 2% (18) 742Educ: < College 48% (579) 45% (549) 7% (86) 1213Educ: Bachelors degree 58% (282) 41% (201) 1% (6) 489Educ: Post-grad 61% (177) 37% (108) 1% (4) 288Income: Under 50k 53% (521) 41% (411) 6% (60) 991Income: 50k-100k 52% (331) 44% (283) 4% (26) 640Income: 100k+ 52% (186) 46% (164) 3% (10) 359Ethnicity: White 47% (749) 49% (780) 4% (56) 1584Ethnicity: Hispanic 61% (119) 25% (50) 14% (27) 196Ethnicity: Black 80% (194) 10% (25) 9% (23) 243
Continued on next page
Page 16
16
Morning ConsultTable nr2bNET
Table nr2bNET: Do you approve or disapprove of the job Joe Biden is doing as President?
Demographic Total Approve Total DisapproveDon’t Know / No
Opinion Total N
Registered Voters 52% (1037) 43% (857) 5% (96) 1990Ethnicity: Other 58% (94) 32% (52) 10% (17) 163All Christian 47% (456) 51% (489) 2% (19) 964All Non-Christian 74% (90) 19% (24) 6% (7) 121Atheist 70% (51) 29% (21) 1% (1) 73Agnostic/Nothing in particular 56% (278) 37% (182) 7% (36) 495Something Else 48% (161) 42% (142) 10% (33) 337Religious Non-Protestant/Catholic 69% (98) 25% (36) 5% (7) 140Evangelical 40% (219) 56% (306) 4% (22) 547Non-Evangelical 53% (384) 43% (307) 4% (30) 721Community: Urban 68% (360) 26% (140) 6% (29) 529Community: Suburban 49% (486) 47% (465) 5% (47) 998Community: Rural 41% (191) 54% (253) 4% (20) 464Employ: Private Sector 55% (339) 41% (256) 4% (27) 622Employ: Government 50% (64) 44% (56) 7% (9) 129Employ: Self-Employed 54% (85) 44% (69) 2% (3) 157Employ: Homemaker 39% (50) 52% (66) 8% (10) 127Employ: Retired 50% (291) 48% (281) 2% (9) 581Employ: Unemployed 55% (119) 34% (73) 11% (23) 215Employ: Other 54% (62) 33% (38) 12% (14) 113Military HH: Yes 44% (158) 54% (195) 3% (9) 361Military HH: No 54% (880) 41% (662) 5% (87) 1629RD/WT: Right Direction 91% (859) 5% (47) 4% (35) 941RD/WT: Wrong Track 17% (178) 77% (810) 6% (60) 1049Biden Job Approve 100% (1037) — (0) — (0) 1037Biden Job Disapprove — (0) 100% (857) — (0) 857Biden Job Strongly Approve 100% (548) — (0) — (0) 548Biden Job Somewhat Approve 100% (489) — (0) — (0) 489Biden Job Somewhat Disapprove — (0) 100% (223) — (0) 223Biden Job Strongly Disapprove — (0) 100% (634) — (0) 634Favorable of Biden 94% (986) 4% (42) 2% (20) 1048Unfavorable of Biden 4% (35) 93% (794) 3% (26) 855
Continued on next page
Page 17
National Tracking Poll #210636, June, 2021
17
Table nr2bNET
Table nr2bNET: Do you approve or disapprove of the job Joe Biden is doing as President?
Demographic Total Approve Total DisapproveDon’t Know / No
Opinion Total N
Registered Voters 52% (1037) 43% (857) 5% (96) 1990Very Favorable of Biden 98% (580) 2% (9) 1% (4) 593Somewhat Favorable of Biden 89% (407) 7% (33) 3% (16) 455Somewhat Unfavorable of Biden 12% (24) 80% (151) 8% (15) 190Very Unfavorable of Biden 2% (11) 97% (643) 2% (11) 664#1 Issue: Economy 46% (352) 48% (365) 6% (47) 763#1 Issue: Security 27% (93) 70% (246) 3% (11) 349#1 Issue: Health Care 73% (170) 24% (55) 4% (8) 233#1 Issue: Medicare / Social Security 64% (166) 34% (90) 2% (5) 261#1 Issue: Women’s Issues 67% (69) 22% (22) 11% (11) 103#1 Issue: Education 69% (59) 26% (22) 5% (4) 86#1 Issue: Energy 79% (68) 16% (14) 5% (4) 86#1 Issue: Other 55% (60) 40% (44) 4% (5) 1092020 Vote: Joe Biden 92% (827) 6% (52) 2% (18) 8972020 Vote: Donald Trump 12% (99) 86% (700) 2% (19) 8182020 Vote: Didn’t Vote 43% (102) 35% (83) 23% (55) 2392018 House Vote: Democrat 90% (621) 8% (58) 1% (8) 6872018 House Vote: Republican 15% (106) 83% (571) 2% (12) 6902018 House Vote: Someone else 39% (19) 52% (26) 9% (4) 502016 Vote: Hillary Clinton 90% (568) 8% (52) 2% (11) 6312016 Vote: Donald Trump 18% (137) 81% (619) 2% (12) 7682016 Vote: Other 57% (62) 38% (41) 4% (5) 1072016 Vote: Didn’t Vote 56% (270) 30% (145) 14% (68) 483Voted in 2014: Yes 53% (682) 46% (592) 2% (23) 1297Voted in 2014: No 51% (355) 38% (265) 11% (73) 6934-Region: Northeast 60% (207) 36% (122) 4% (15) 3444-Region: Midwest 53% (240) 44% (202) 3% (14) 4554-Region: South 48% (364) 47% (354) 5% (37) 7554-Region: West 52% (227) 41% (179) 7% (29) 435Party: Democrat/Leans Democrat 90% (799) 8% (69) 2% (20) 888Party: Republican/Leans Republican 15% (125) 82% (668) 3% (20) 814Note: Row proportions may total to larger than one-hundred percent due to rounding. For more information visit MorningConsultIntelligence.com.
Page 18
18
Morning ConsultTable P3
Table P3: Now, thinking about your vote, what would you say is the top set of issues on your mind when you cast your vote for federal offices such asU.S. Senate or Congress?
Demographic
EconomicIssues –like taxes,wages,jobs,
unemploy-ment, andspending
SecurityIssues –like
terrorism,foreign
policy, andbordersecurity
HealthCare Issues– like the2010 healthcare law,Medicaid,other
challenges
SeniorsIssues –like
Medicareand SocialSecurity
Women’sIssues –like birthcontrol,abortion,and equal
pay
EducationIssues – like
schoolstandards,class sizes,
school choice,and student
loans
Energy Issues– like carbonemissions,cost ofelectric-
ity/gasoline,or renewables Other: Total N
Registered Voters 38%(763) 18%(349) 12%(233) 13%(261) 5%(103) 4% (86) 4% (86) 5%(109) 1990Gender: Male 39%(362) 19%(175) 13% (117) 13% (117) 1% (14) 4% (33) 6% (54) 6% (56) 927Gender: Female 38%(401) 16%(174) 11% (117) 14%(144) 8% (89) 5% (53) 3% (32) 5% (53) 1063Age: 18-34 45%(203) 9% (42) 13% (57) 2% (11) 14% (62) 7% (30) 9% (39) 3% (12) 456Age: 35-44 44% (131) 14% (41) 13% (39) 5% (14) 6% (18) 8% (25) 5% (16) 6% (18) 300Age: 45-64 41%(300) 20%(143) 14%(102) 11% (83) 2% (16) 4% (26) 3% (22) 5% (37) 730Age: 65+ 26%(129) 24%(123) 7% (35) 30%(153) 2% (8) 1% (5) 2% (9) 8% (42) 504GenZers: 1997-2012 39% (65) 8% (14) 8% (13) 2% (4) 21% (35) 12% (20) 8% (14) 2% (3) 169Millennials: 1981-1996 47%(225) 11% (51) 13% (64) 3% (14) 8% (37) 7% (32) 8% (38) 4% (18) 480GenXers: 1965-1980 43%(225) 19% (98) 17% (89) 5% (26) 4% (21) 5% (25) 3% (18) 4% (23) 525Baby Boomers: 1946-1964 31%(235) 22% (161) 8% (62) 26%(197) 1% (9) 1% (6) 2% (14) 8% (61) 746PID: Dem (no lean) 33%(250) 8% (63) 17%(126) 16% (121) 8% (57) 6% (47) 6% (45) 6% (42) 752PID: Ind (no lean) 42%(241) 15% (86) 12% (67) 11% (62) 6% (34) 4% (21) 4% (21) 8% (46) 578PID: Rep (no lean) 41%(273) 30%(201) 6% (40) 12% (77) 2% (11) 3% (18) 3% (20) 3% (21) 661PID/Gender: DemMen 36%(129) 9% (32) 19% (70) 14% (52) 2% (8) 6% (20) 7% (27) 6% (22) 359PID/Gender: DemWomen 31% (121) 8% (31) 14% (57) 18% (70) 13% (50) 7% (27) 5% (18) 5% (20) 393PID/Gender: Ind Men 41%(109) 18% (49) 11% (29) 12% (32) 1% (3) 3% (7) 6% (15) 9% (23) 267PID/Gender: Ind Women 42%(132) 12% (37) 12% (38) 10% (31) 10% (31) 4% (14) 2% (6) 7% (23) 311PID/Gender: Rep Men 41%(125) 31% (94) 6% (18) 11% (33) 1% (3) 2% (6) 4% (12) 4% (11) 301PID/Gender: Rep Women 41%(148) 30%(107) 6% (22) 12% (43) 2% (9) 3% (12) 2% (8) 3% (10) 360Ideo: Liberal (1-3) 31%(183) 8% (44) 17% (99) 13% (77) 11% (62) 6% (35) 8% (46) 7% (42) 587Ideo: Moderate (4) 38%(204) 13% (69) 14% (77) 17% (92) 3% (16) 5% (27) 3% (18) 7% (36) 539Ideo: Conservative (5-7) 44%(326) 30%(224) 6% (43) 11% (80) 2% (11) 2% (15) 2% (17) 3% (26) 742
Continued on next page
Page 19
National Tracking Poll #210636, June, 2021
19
Table P3
Table P3: Now, thinking about your vote, what would you say is the top set of issues on your mind when you cast your vote for federal offices such asU.S. Senate or Congress?
Demographic
EconomicIssues –like taxes,wages,jobs,
unemploy-ment, andspending
SecurityIssues –like
terrorism,foreign
policy, andbordersecurity
HealthCare Issues– like the2010 healthcare law,Medicaid,other
challenges
SeniorsIssues –like
Medicareand SocialSecurity
Women’sIssues –like birthcontrol,abortion,and equal
pay
EducationIssues – like
schoolstandards,class sizes,
school choice,and student
loans
Energy Issues– like carbonemissions,cost ofelectric-
ity/gasoline,or renewables Other: Total N
Registered Voters 38%(763) 18%(349) 12%(233) 13%(261) 5%(103) 4% (86) 4% (86) 5%(109) 1990Educ: < College 38%(463) 18%(221) 11% (131) 14%(167) 6% (71) 3% (40) 4% (50) 6% (70) 1213Educ: Bachelors degree 37%(179) 16% (79) 14% (67) 13% (64) 4% (22) 6% (29) 4% (21) 6% (28) 489Educ: Post-grad 42%(122) 17% (49) 12% (36) 10% (30) 4% (11) 6% (16) 5% (15) 4% (10) 288Income: Under 50k 34%(340) 19%(189) 12% (114) 16%(155) 6% (61) 3% (34) 4% (39) 6% (59) 991Income: 50k-100k 40%(259) 15% (97) 12% (79) 11% (72) 5% (30) 5% (33) 5% (32) 6% (39) 640Income: 100k+ 46%(164) 18% (64) 11% (40) 9% (34) 3% (12) 5% (19) 4% (15) 3% (11) 359Ethnicity: White 38%(601) 20%(310) 11%(182) 13%(213) 4% (68) 4% (62) 4% (62) 6% (87) 1584Ethnicity: Hispanic 42% (83) 9% (18) 15% (29) 5% (9) 12% (23) 8% (15) 7% (13) 3% (6) 196Ethnicity: Black 39% (94) 8% (19) 15% (36) 14% (33) 8% (20) 7% (17) 6% (14) 4% (10) 243Ethnicity: Other 42% (69) 13% (21) 10% (16) 9% (14) 9% (15) 4% (7) 6% (10) 7% (12) 163All Christian 37%(356) 23%(222) 10% (98) 16% (151) 2% (22) 4% (36) 3% (29) 5% (49) 964All Non-Christian 40% (49) 16% (19) 17% (20) 10% (12) 4% (4) 3% (4) 4% (5) 6% (7) 121Atheist 35% (26) 7% (5) 14% (11) 2% (1) 12% (9) 7% (5) 14% (10) 9% (6) 73Agnostic/Nothing in particular 42%(210) 10% (51) 12% (61) 11% (54) 9% (42) 4% (18) 6% (30) 6% (30) 495Something Else 36%(122) 15% (52) 13% (44) 13% (42) 7% (25) 7% (23) 3% (12) 5% (17) 337Religious Non-Protestant/Catholic 41% (58) 15% (21) 15% (21) 11% (15) 4% (5) 4% (6) 5% (7) 5% (7) 140Evangelical 38%(209) 24%(132) 10% (53) 13% (70) 3% (17) 5% (28) 3% (17) 4% (20) 547Non-Evangelical 35%(253) 19%(137) 12% (87) 16% (118) 4% (29) 4% (28) 3% (21) 6% (46) 721Community: Urban 37%(197) 15% (79) 17% (91) 10% (55) 6% (33) 3% (16) 6% (30) 5% (28) 529Community: Suburban 39%(390) 17%(166) 10% (96) 14%(143) 5% (50) 5% (51) 4% (44) 6% (57) 998Community: Rural 38%(177) 23%(105) 10% (45) 13% (63) 4% (20) 4% (19) 3% (12) 5% (24) 464
Continued on next page
Page 20
20
Morning ConsultTable P3
Table P3: Now, thinking about your vote, what would you say is the top set of issues on your mind when you cast your vote for federal offices such asU.S. Senate or Congress?
Demographic
EconomicIssues –like taxes,wages,jobs,
unemploy-ment, andspending
SecurityIssues –like
terrorism,foreign
policy, andbordersecurity
HealthCare Issues– like the2010 healthcare law,Medicaid,other
challenges
SeniorsIssues –like
Medicareand SocialSecurity
Women’sIssues –like birthcontrol,abortion,and equal
pay
EducationIssues – like
schoolstandards,class sizes,
school choice,and student
loans
Energy Issues– like carbonemissions,cost ofelectric-
ity/gasoline,or renewables Other: Total N
Registered Voters 38%(763) 18%(349) 12%(233) 13%(261) 5%(103) 4% (86) 4% (86) 5%(109) 1990Employ: Private Sector 46%(287) 14% (89) 14% (85) 5% (32) 6% (35) 4% (23) 6% (38) 5% (34) 622Employ: Government 44% (56) 16% (21) 13% (17) 5% (7) 5% (7) 9% (12) 4% (5) 3% (4) 129Employ: Self-Employed 33% (51) 20% (32) 13% (21) 8% (13) 6% (9) 6% (9) 5% (9) 9% (14) 157Employ: Homemaker 41% (52) 18% (23) 13% (16) 5% (6) 5% (6) 8% (10) 4% (5) 6% (8) 127Employ: Retired 27%(159) 24%(138) 8% (46) 31%(179) 1% (6) 1% (7) 1% (7) 7% (39) 581Employ: Unemployed 41% (89) 15% (32) 11% (24) 6% (13) 10% (22) 7% (15) 6% (12) 4% (8) 215Employ: Other 46% (52) 10% (11) 17% (19) 10% (12) 5% (6) 4% (4) 5% (6) 2% (3) 113Military HH: Yes 34% (121) 22% (80) 11% (38) 17% (62) 3% (10) 3% (11) 4% (13) 7% (26) 361Military HH: No 39%(642) 17%(270) 12%(195) 12%(199) 6% (93) 5% (74) 4% (73) 5% (83) 1629RD/WT: Right Direction 33%(314) 10% (91) 17%(158) 16% (151) 6% (59) 6% (55) 6% (59) 6% (55) 941RD/WT: Wrong Track 43%(450) 25%(259) 7% (75) 10% (110) 4% (44) 3% (31) 3% (26) 5% (54) 1049Biden Job Approve 34%(352) 9% (93) 16%(170) 16%(166) 7% (69) 6% (59) 7% (68) 6% (60) 1037Biden Job Disapprove 43%(365) 29%(246) 6% (55) 10% (90) 3% (22) 3% (22) 2% (14) 5% (44) 857Biden Job Strongly Approve 30%(166) 8% (46) 19%(105) 18% (96) 7% (36) 6% (33) 6% (35) 6% (32) 548Biden Job Somewhat Approve 38%(186) 9% (46) 13% (65) 14% (70) 7% (34) 5% (26) 7% (33) 6% (29) 489Biden Job Somewhat Disapprove 44% (98) 17% (38) 10% (22) 12% (27) 4% (10) 5% (12) 3% (6) 5% (10) 223Biden Job Strongly Disapprove 42%(267) 33%(208) 5% (33) 10% (62) 2% (13) 2% (11) 1% (7) 5% (34) 634Favorable of Biden 34%(351) 9% (92) 16%(172) 16%(170) 7% (72) 6% (61) 6% (68) 6% (63) 1048Unfavorable of Biden 43%(370) 29%(247) 7% (56) 9% (80) 3% (22) 2% (21) 2% (16) 5% (43) 855Very Favorable of Biden 30%(179) 8% (50) 19% (112) 18%(107) 6% (38) 5% (32) 5% (32) 7% (42) 593Somewhat Favorable of Biden 38%(172) 9% (42) 13% (60) 14% (63) 7% (34) 6% (29) 8% (35) 5% (21) 455Somewhat Unfavorable of Biden 43% (81) 18% (35) 13% (25) 10% (19) 5% (9) 3% (5) 4% (8) 5% (9) 190Very Unfavorable of Biden 43%(288) 32%(213) 5% (32) 9% (61) 2% (13) 2% (16) 1% (8) 5% (35) 664
Continued on next page
Page 21
National Tracking Poll #210636, June, 2021
21
Table P3
Table P3: Now, thinking about your vote, what would you say is the top set of issues on your mind when you cast your vote for federal offices such asU.S. Senate or Congress?
Demographic
EconomicIssues –like taxes,wages,jobs,
unemploy-ment, andspending
SecurityIssues –like
terrorism,foreign
policy, andbordersecurity
HealthCare Issues– like the2010 healthcare law,Medicaid,other
challenges
SeniorsIssues –like
Medicareand SocialSecurity
Women’sIssues –like birthcontrol,abortion,and equal
pay
EducationIssues – like
schoolstandards,class sizes,
school choice,and student
loans
Energy Issues– like carbonemissions,cost ofelectric-
ity/gasoline,or renewables Other: Total N
Registered Voters 38%(763) 18%(349) 12%(233) 13%(261) 5%(103) 4% (86) 4% (86) 5%(109) 1990#1 Issue: Economy 100%(763) — (0) — (0) — (0) — (0) — (0) — (0) — (0) 763#1 Issue: Security — (0) 100%(349) — (0) — (0) — (0) — (0) — (0) — (0) 349#1 Issue: Health Care — (0) — (0) 100%(233) — (0) — (0) — (0) — (0) — (0) 233#1 Issue: Medicare / Social Security — (0) — (0) — (0) 100%(261) — (0) — (0) — (0) — (0) 261#1 Issue: Women’s Issues — (0) — (0) — (0) — (0) 100%(103) — (0) — (0) — (0) 103#1 Issue: Education — (0) — (0) — (0) — (0) — (0) 100% (86) — (0) — (0) 86#1 Issue: Energy — (0) — (0) — (0) — (0) — (0) — (0) 100% (86) — (0) 86#1 Issue: Other — (0) — (0) — (0) — (0) — (0) — (0) — (0) 100%(109) 1092020 Vote: Joe Biden 34%(303) 8% (71) 17%(152) 16%(146) 7% (65) 6% (51) 6% (51) 7% (59) 8972020 Vote: Donald Trump 40%(331) 31%(251) 7% (55) 12% (97) 2% (12) 2% (20) 2% (16) 4% (37) 8182020 Vote: Didn’t Vote 48% (114) 11% (27) 7% (18) 6% (15) 10% (24) 6% (15) 7% (18) 4% (9) 2392018 House Vote: Democrat 31%(215) 8% (56) 19%(130) 18%(122) 5% (37) 5% (36) 5% (37) 8% (55) 6872018 House Vote: Republican 40%(277) 31% (211) 7% (50) 12% (80) 1% (8) 2% (16) 3% (17) 4% (31) 6902018 House Vote: Someone else 29% (14) 29% (14) 8% (4) 18% (9) 4% (2) — (0) 2% (1) 9% (5) 502016 Vote: Hillary Clinton 31%(198) 8% (52) 19%(120) 19% (119) 5% (33) 5% (30) 6% (37) 7% (41) 6312016 Vote: Donald Trump 39%(303) 31%(235) 7% (57) 11% (86) 1% (9) 2% (19) 2% (19) 5% (40) 7682016 Vote: Other 49% (52) 8% (9) 10% (11) 15% (16) 4% (5) 3% (3) 3% (3) 8% (9) 1072016 Vote: Didn’t Vote 43%(210) 11% (53) 9% (45) 8% (39) 12% (57) 7% (33) 6% (28) 4% (18) 483Voted in 2014: Yes 36%(469) 19%(250) 13%(164) 16%(202) 3% (43) 3% (45) 4% (46) 6% (79) 1297Voted in 2014: No 42%(294) 14% (99) 10% (69) 9% (59) 9% (60) 6% (41) 6% (40) 4% (30) 6934-Region: Northeast 35%(122) 15% (52) 12% (42) 16% (54) 6% (22) 4% (14) 5% (16) 7% (23) 3444-Region: Midwest 37%(168) 18% (80) 15% (67) 13% (60) 5% (22) 4% (17) 4% (16) 6% (26) 4554-Region: South 38%(288) 20%(153) 12% (91) 11% (84) 5% (39) 6% (44) 4% (29) 4% (28) 7554-Region: West 43%(186) 15% (64) 8% (33) 14% (63) 5% (20) 3% (11) 6% (25) 8% (33) 435
Continued on next page
Page 22
22
Morning ConsultTable P3
Table P3: Now, thinking about your vote, what would you say is the top set of issues on your mind when you cast your vote for federal offices such asU.S. Senate or Congress?
Demographic
EconomicIssues –like taxes,wages,jobs,
unemploy-ment, andspending
SecurityIssues –like
terrorism,foreign
policy, andbordersecurity
HealthCare Issues– like the2010 healthcare law,Medicaid,other
challenges
SeniorsIssues –like
Medicareand SocialSecurity
Women’sIssues –like birthcontrol,abortion,and equal
pay
EducationIssues – like
schoolstandards,class sizes,
school choice,and student
loans
Energy Issues– like carbonemissions,cost ofelectric-
ity/gasoline,or renewables Other: Total N
Registered Voters 38%(763) 18%(349) 12%(233) 13%(261) 5%(103) 4% (86) 4% (86) 5%(109) 1990Party: Democrat/Leans Democrat 33%(297) 8% (70) 17%(147) 16% (141) 8% (72) 6% (51) 6% (55) 6% (55) 888Party: Republican/Leans Republican 43%(349) 29%(237) 6% (50) 11% (89) 1% (11) 3% (21) 3% (22) 4% (34) 814Note: Row proportions may total to larger than one-hundred percent due to rounding. For more information visit MorningConsultIntelligence.com.
Page 23
National Tracking Poll #210636, June, 2021
23
Table POL1_1
Table POL1_1: Who do you trust more to handle each of the following issues?The economy
Demographic Democrats in CongressRepublicans in
CongressDon’t know / No
opinion Total N
Registered Voters 41% (817) 43% (850) 16% (323) 1990Gender: Male 43% (401) 43% (401) 14% (126) 927Gender: Female 39% (416) 42% (449) 19% (198) 1063Age: 18-34 44% (202) 30% (135) 26% (119) 456Age: 35-44 44% (131) 41% (123) 15% (46) 300Age: 45-64 36% (266) 48% (352) 15% (113) 730Age: 65+ 43% (218) 48% (241) 9% (45) 504GenZers: 1997-2012 38% (64) 27% (46) 35% (59) 169Millennials: 1981-1996 46% (219) 36% (172) 18% (88) 480GenXers: 1965-1980 41% (213) 42% (218) 18% (94) 525Baby Boomers: 1946-1964 40% (295) 51% (378) 10% (72) 746PID: Dem (no lean) 80% (603) 9% (66) 11% (83) 752PID: Ind (no lean) 30% (172) 40% (232) 30% (173) 578PID: Rep (no lean) 6% (42) 84% (552) 10% (67) 661PID/Gender: DemMen 79% (284) 10% (38) 10% (37) 359PID/Gender: DemWomen 81% (318) 7% (29) 12% (46) 393PID/Gender: Ind Men 32% (86) 46% (123) 22% (58) 267PID/Gender: Ind Women 28% (86) 35% (109) 37% (115) 311PID/Gender: Rep Men 10% (30) 80% (240) 10% (31) 301PID/Gender: Rep Women 3% (12) 87% (311) 10% (37) 360Ideo: Liberal (1-3) 75% (441) 12% (71) 13% (75) 587Ideo: Moderate (4) 47% (252) 32% (171) 21% (115) 539Ideo: Conservative (5-7) 12% (91) 79% (584) 9% (68) 742Educ: < College 37% (453) 43% (523) 20% (237) 1213Educ: Bachelors degree 46% (226) 41% (202) 12% (60) 489Educ: Post-grad 48% (138) 43% (124) 9% (26) 288Income: Under 50k 43% (424) 38% (372) 20% (195) 991Income: 50k-100k 38% (246) 46% (297) 15% (97) 640Income: 100k+ 41% (146) 50% (181) 9% (32) 359Ethnicity: White 36% (573) 49% (778) 15% (234) 1584Ethnicity: Hispanic 58% (114) 24% (47) 17% (34) 196
Continued on next page
Page 24
24
Morning ConsultTable POL1_1
Table POL1_1: Who do you trust more to handle each of the following issues?The economy
Demographic Democrats in CongressRepublicans in
CongressDon’t know / No
opinion Total N
Registered Voters 41% (817) 43% (850) 16% (323) 1990Ethnicity: Black 64% (155) 14% (33) 22% (54) 243Ethnicity: Other 54% (89) 24% (39) 22% (35) 163All Christian 35% (339) 53% (508) 12% (117) 964All Non-Christian 54% (66) 24% (29) 22% (27) 121Atheist 55% (41) 31% (23) 13% (10) 73Agnostic/Nothing in particular 49% (243) 30% (148) 21% (104) 495Something Else 38% (129) 42% (143) 19% (65) 337Religious Non-Protestant/Catholic 50% (70) 29% (41) 21% (30) 140Evangelical 30% (161) 58% (315) 13% (71) 547Non-Evangelical 42% (300) 44% (316) 15% (105) 721Community: Urban 58% (309) 27% (142) 15% (78) 529Community: Suburban 38% (379) 46% (459) 16% (159) 998Community: Rural 28% (129) 54% (249) 18% (85) 464Employ: Private Sector 41% (255) 44% (274) 15% (92) 622Employ: Government 38% (49) 44% (57) 18% (23) 129Employ: Self-Employed 45% (70) 40% (64) 15% (23) 157Employ: Homemaker 28% (35) 52% (66) 20% (25) 127Employ: Retired 42% (243) 49% (282) 10% (56) 581Employ: Unemployed 47% (100) 27% (59) 26% (56) 215Employ: Other 38% (43) 31% (35) 31% (35) 113Military HH: Yes 29% (106) 56% (201) 15% (54) 361Military HH: No 44% (710) 40% (649) 17% (269) 1629RD/WT: Right Direction 71% (670) 13% (121) 16% (151) 941RD/WT: Wrong Track 14% (147) 70% (729) 16% (172) 1049Biden Job Approve 72% (749) 13% (138) 15% (151) 1037Biden Job Disapprove 6% (51) 81% (694) 13% (112) 857Biden Job Strongly Approve 86% (471) 6% (34) 8% (44) 548Biden Job Somewhat Approve 57% (278) 21% (104) 22% (107) 489Biden Job Somewhat Disapprove 16% (36) 60% (134) 24% (53) 223Biden Job Strongly Disapprove 2% (16) 88% (560) 9% (59) 634
Continued on next page
Page 25
National Tracking Poll #210636, June, 2021
25
Table POL1_1
Table POL1_1: Who do you trust more to handle each of the following issues?The economy
Demographic Democrats in CongressRepublicans in
CongressDon’t know / No
opinion Total N
Registered Voters 41% (817) 43% (850) 16% (323) 1990Favorable of Biden 72% (752) 13% (140) 15% (157) 1048Unfavorable of Biden 6% (50) 81% (693) 13% (112) 855Very Favorable of Biden 87% (516) 6% (33) 7% (44) 593Somewhat Favorable of Biden 52% (235) 23% (107) 25% (113) 455Somewhat Unfavorable of Biden 14% (27) 58% (110) 28% (53) 190Very Unfavorable of Biden 3% (22) 88% (583) 9% (59) 664#1 Issue: Economy 35% (267) 47% (361) 18% (135) 763#1 Issue: Security 20% (68) 73% (255) 8% (27) 349#1 Issue: Health Care 61% (142) 23% (55) 15% (36) 233#1 Issue: Medicare / Social Security 52% (136) 33% (86) 15% (39) 261#1 Issue: Women’s Issues 59% (60) 17% (17) 25% (25) 103#1 Issue: Education 52% (45) 26% (22) 22% (19) 86#1 Issue: Energy 53% (46) 26% (22) 21% (18) 86#1 Issue: Other 48% (53) 30% (32) 22% (24) 1092020 Vote: Joe Biden 78% (699) 9% (82) 13% (116) 8972020 Vote: Donald Trump 5% (44) 84% (685) 11% (90) 8182020 Vote: Didn’t Vote 28% (68) 30% (72) 42% (100) 2392018 House Vote: Democrat 81% (557) 10% (66) 9% (64) 6872018 House Vote: Republican 7% (50) 84% (581) 9% (59) 6902018 House Vote: Someone else 19% (9) 25% (12) 56% (28) 502016 Vote: Hillary Clinton 81% (512) 8% (50) 11% (70) 6312016 Vote: Donald Trump 10% (74) 80% (615) 10% (78) 7682016 Vote: Other 38% (41) 37% (40) 25% (26) 1072016 Vote: Didn’t Vote 39% (190) 30% (145) 31% (149) 483Voted in 2014: Yes 44% (566) 46% (599) 10% (133) 1297Voted in 2014: No 36% (251) 36% (252) 27% (190) 6934-Region: Northeast 47% (162) 36% (125) 16% (57) 3444-Region: Midwest 43% (198) 42% (191) 15% (66) 4554-Region: South 36% (272) 47% (355) 17% (128) 7554-Region: West 42% (184) 41% (178) 17% (72) 435
Continued on next page
Page 26
26
Morning ConsultTable POL1_1
Table POL1_1: Who do you trust more to handle each of the following issues?The economy
Demographic Democrats in CongressRepublicans in
CongressDon’t know / No
opinion Total N
Registered Voters 41% (817) 43% (850) 16% (323) 1990Party: Democrat/Leans Democrat 78% (695) 10% (85) 12% (108) 888Party: Republican/Leans Republican 6% (47) 84% (680) 11% (87) 814Note: Row proportions may total to larger than one-hundred percent due to rounding. For more information visit MorningConsultIntelligence.com.
Page 27
National Tracking Poll #210636, June, 2021
27
Table POL1_2
Table POL1_2: Who do you trust more to handle each of the following issues?Jobs
Demographic Democrats in CongressRepublicans in
CongressDon’t know / No
opinion Total N
Registered Voters 42% (832) 42% (839) 16% (319) 1990Gender: Male 43% (397) 43% (397) 14% (133) 927Gender: Female 41% (434) 42% (442) 18% (186) 1063Age: 18-34 45% (206) 30% (138) 25% (112) 456Age: 35-44 45% (134) 39% (117) 17% (50) 300Age: 45-64 37% (270) 49% (359) 14% (101) 730Age: 65+ 44% (222) 45% (225) 11% (57) 504GenZers: 1997-2012 45% (77) 24% (40) 31% (53) 169Millennials: 1981-1996 44% (210) 37% (179) 19% (91) 480GenXers: 1965-1980 42% (222) 42% (222) 15% (81) 525Baby Boomers: 1946-1964 40% (299) 49% (362) 11% (84) 746PID: Dem (no lean) 82% (616) 8% (61) 10% (75) 752PID: Ind (no lean) 29% (169) 41% (238) 30% (171) 578PID: Rep (no lean) 7% (46) 82% (541) 11% (74) 661PID/Gender: DemMen 82% (293) 9% (34) 9% (32) 359PID/Gender: DemWomen 82% (323) 7% (27) 11% (43) 393PID/Gender: Ind Men 28% (75) 47% (125) 25% (68) 267PID/Gender: Ind Women 30% (95) 36% (113) 33% (103) 311PID/Gender: Rep Men 10% (29) 79% (239) 11% (33) 301PID/Gender: Rep Women 5% (17) 84% (302) 11% (41) 360Ideo: Liberal (1-3) 77% (453) 10% (59) 13% (76) 587Ideo: Moderate (4) 47% (253) 32% (175) 21% (111) 539Ideo: Conservative (5-7) 13% (94) 78% (577) 10% (71) 742Educ: < College 38% (456) 43% (525) 19% (231) 1213Educ: Bachelors degree 49% (238) 39% (192) 12% (59) 489Educ: Post-grad 48% (138) 42% (122) 10% (29) 288Income: Under 50k 43% (427) 38% (377) 19% (188) 991Income: 50k-100k 40% (257) 45% (285) 15% (98) 640Income: 100k+ 41% (148) 50% (178) 9% (33) 359Ethnicity: White 37% (583) 48% (765) 15% (236) 1584Ethnicity: Hispanic 54% (106) 25% (48) 21% (42) 196
Continued on next page
Page 28
28
Morning ConsultTable POL1_2
Table POL1_2: Who do you trust more to handle each of the following issues?Jobs
Demographic Democrats in CongressRepublicans in
CongressDon’t know / No
opinion Total N
Registered Voters 42% (832) 42% (839) 16% (319) 1990Ethnicity: Black 69% (167) 12% (30) 19% (46) 243Ethnicity: Other 50% (81) 27% (44) 23% (37) 163All Christian 36% (345) 52% (503) 12% (116) 964All Non-Christian 59% (71) 27% (32) 14% (17) 121Atheist 62% (45) 27% (19) 11% (8) 73Agnostic/Nothing in particular 48% (239) 31% (155) 20% (101) 495Something Else 39% (131) 39% (130) 23% (76) 337Religious Non-Protestant/Catholic 53% (74) 32% (46) 15% (21) 140Evangelical 31% (170) 57% (313) 12% (65) 547Non-Evangelical 42% (300) 42% (300) 17% (121) 721Community: Urban 57% (301) 29% (151) 15% (77) 529Community: Suburban 40% (395) 45% (445) 16% (157) 998Community: Rural 29% (136) 52% (243) 18% (85) 464Employ: Private Sector 42% (260) 44% (273) 14% (88) 622Employ: Government 35% (45) 47% (60) 18% (23) 129Employ: Self-Employed 42% (66) 37% (59) 20% (32) 157Employ: Homemaker 30% (38) 51% (64) 19% (24) 127Employ: Retired 43% (248) 46% (268) 11% (65) 581Employ: Unemployed 49% (106) 32% (68) 19% (41) 215Employ: Other 40% (45) 31% (36) 28% (32) 113Military HH: Yes 34% (122) 52% (190) 14% (50) 361Military HH: No 44% (709) 40% (650) 17% (270) 1629RD/WT: Right Direction 71% (671) 14% (130) 15% (140) 941RD/WT: Wrong Track 15% (161) 68% (709) 17% (179) 1049Biden Job Approve 73% (753) 14% (142) 14% (142) 1037Biden Job Disapprove 7% (57) 79% (680) 14% (120) 857Biden Job Strongly Approve 85% (466) 8% (45) 7% (38) 548Biden Job Somewhat Approve 59% (288) 20% (97) 21% (104) 489Biden Job Somewhat Disapprove 17% (37) 58% (131) 25% (56) 223Biden Job Strongly Disapprove 3% (20) 87% (549) 10% (65) 634
Continued on next page
Page 29
National Tracking Poll #210636, June, 2021
29
Table POL1_2
Table POL1_2: Who do you trust more to handle each of the following issues?Jobs
Demographic Democrats in CongressRepublicans in
CongressDon’t know / No
opinion Total N
Registered Voters 42% (832) 42% (839) 16% (319) 1990Favorable of Biden 72% (756) 14% (142) 14% (150) 1048Unfavorable of Biden 6% (55) 80% (681) 14% (119) 855Very Favorable of Biden 86% (509) 7% (44) 7% (40) 593Somewhat Favorable of Biden 54% (247) 22% (99) 24% (110) 455Somewhat Unfavorable of Biden 16% (31) 56% (106) 28% (53) 190Very Unfavorable of Biden 4% (23) 87% (576) 10% (65) 664#1 Issue: Economy 36% (272) 47% (360) 17% (131) 763#1 Issue: Security 19% (65) 73% (255) 8% (29) 349#1 Issue: Health Care 63% (146) 24% (57) 13% (31) 233#1 Issue: Medicare / Social Security 54% (142) 33% (85) 13% (34) 261#1 Issue: Women’s Issues 62% (64) 14% (14) 24% (25) 103#1 Issue: Education 53% (46) 25% (22) 21% (18) 86#1 Issue: Energy 55% (47) 17% (14) 28% (24) 86#1 Issue: Other 45% (50) 29% (32) 25% (27) 1092020 Vote: Joe Biden 78% (698) 10% (90) 12% (109) 8972020 Vote: Donald Trump 5% (42) 82% (672) 13% (104) 8182020 Vote: Didn’t Vote 35% (85) 27% (64) 38% (90) 2392018 House Vote: Democrat 81% (559) 10% (66) 9% (62) 6872018 House Vote: Republican 7% (51) 82% (568) 10% (71) 6902018 House Vote: Someone else 18% (9) 31% (15) 51% (26) 502016 Vote: Hillary Clinton 82% (520) 8% (51) 10% (61) 6312016 Vote: Donald Trump 9% (73) 78% (602) 12% (93) 7682016 Vote: Other 37% (40) 39% (42) 23% (25) 1072016 Vote: Didn’t Vote 41% (199) 30% (144) 29% (140) 483Voted in 2014: Yes 44% (569) 45% (586) 11% (142) 1297Voted in 2014: No 38% (263) 36% (253) 26% (177) 6934-Region: Northeast 48% (166) 37% (126) 15% (53) 3444-Region: Midwest 44% (201) 43% (196) 13% (59) 4554-Region: South 37% (280) 46% (349) 17% (126) 7554-Region: West 43% (185) 39% (168) 19% (82) 435
Continued on next page
Page 30
30
Morning ConsultTable POL1_2
Table POL1_2: Who do you trust more to handle each of the following issues?Jobs
Demographic Democrats in CongressRepublicans in
CongressDon’t know / No
opinion Total N
Registered Voters 42% (832) 42% (839) 16% (319) 1990Party: Democrat/Leans Democrat 80% (713) 8% (75) 11% (100) 888Party: Republican/Leans Republican 6% (52) 81% (661) 12% (101) 814Note: Row proportions may total to larger than one-hundred percent due to rounding. For more information visit MorningConsultIntelligence.com.
Page 31
National Tracking Poll #210636, June, 2021
31
Table POL1_3
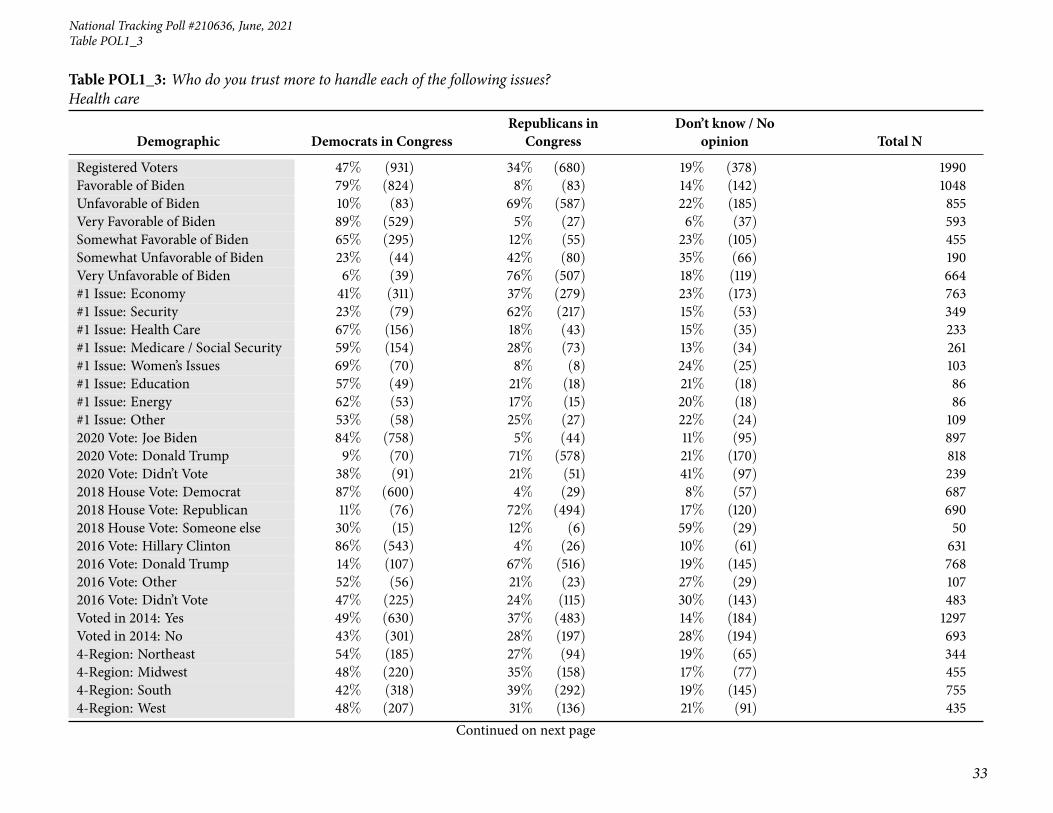
Table POL1_3: Who do you trust more to handle each of the following issues?Health care
Demographic Democrats in CongressRepublicans in
CongressDon’t know / No
opinion Total N
Registered Voters 47% (931) 34% (680) 19% (378) 1990Gender: Male 50% (465) 33% (304) 17% (159) 927Gender: Female 44% (466) 35% (377) 21% (220) 1063Age: 18-34 53% (242) 22% (101) 25% (113) 456Age: 35-44 49% (146) 32% (96) 19% (57) 300Age: 45-64 41% (300) 40% (292) 19% (138) 730Age: 65+ 48% (243) 38% (191) 14% (70) 504GenZers: 1997-2012 52% (88) 18% (31) 30% (51) 169Millennials: 1981-1996 51% (244) 28% (136) 21% (100) 480GenXers: 1965-1980 46% (242) 34% (177) 20% (106) 525Baby Boomers: 1946-1964 44% (331) 41% (305) 15% (109) 746PID: Dem (no lean) 86% (645) 5% (35) 9% (71) 752PID: Ind (no lean) 39% (222) 27% (156) 34% (199) 578PID: Rep (no lean) 10% (63) 74% (489) 16% (109) 661PID/Gender: DemMen 85% (304) 6% (22) 9% (33) 359PID/Gender: DemWomen 87% (341) 3% (13) 10% (38) 393PID/Gender: Ind Men 43% (114) 29% (78) 28% (75) 267PID/Gender: Ind Women 35% (108) 25% (78) 40% (124) 311PID/Gender: Rep Men 15% (46) 68% (203) 17% (51) 301PID/Gender: Rep Women 5% (17) 79% (285) 16% (57) 360Ideo: Liberal (1-3) 80% (472) 8% (50) 11% (65) 587Ideo: Moderate (4) 57% (305) 20% (110) 23% (124) 539Ideo: Conservative (5-7) 16% (117) 67% (496) 17% (129) 742Educ: < College 44% (529) 36% (436) 20% (248) 1213Educ: Bachelors degree 51% (250) 30% (146) 19% (92) 489Educ: Post-grad 53% (152) 34% (99) 13% (38) 288Income: Under 50k 48% (473) 32% (317) 20% (201) 991Income: 50k-100k 45% (289) 36% (227) 19% (124) 640Income: 100k+ 47% (169) 38% (136) 15% (54) 359Ethnicity: White 41% (655) 40% (630) 19% (300) 1584Ethnicity: Hispanic 64% (126) 15% (29) 21% (40) 196
Continued on next page
Page 32
32
Morning ConsultTable POL1_3
Table POL1_3: Who do you trust more to handle each of the following issues?Health care
Demographic Democrats in CongressRepublicans in
CongressDon’t know / No
opinion Total N
Registered Voters 47% (931) 34% (680) 19% (378) 1990Ethnicity: Black 73% (177) 10% (24) 17% (42) 243Ethnicity: Other 61% (99) 17% (27) 23% (37) 163All Christian 41% (393) 44% (423) 15% (148) 964All Non-Christian 61% (74) 19% (23) 19% (23) 121Atheist 68% (50) 19% (14) 13% (9) 73Agnostic/Nothing in particular 55% (272) 20% (101) 25% (122) 495Something Else 42% (141) 36% (120) 22% (76) 337Religious Non-Protestant/Catholic 55% (78) 25% (35) 19% (27) 140Evangelical 34% (184) 51% (280) 15% (84) 547Non-Evangelical 47% (342) 34% (246) 18% (133) 721Community: Urban 63% (334) 21% (113) 16% (82) 529Community: Suburban 44% (438) 36% (360) 20% (200) 998Community: Rural 34% (160) 45% (208) 21% (96) 464Employ: Private Sector 50% (309) 33% (203) 18% (109) 622Employ: Government 45% (58) 33% (42) 22% (28) 129Employ: Self-Employed 46% (73) 31% (48) 23% (36) 157Employ: Homemaker 31% (39) 48% (61) 21% (26) 127Employ: Retired 46% (266) 41% (236) 14% (80) 581Employ: Unemployed 52% (113) 25% (53) 23% (49) 215Employ: Other 44% (50) 25% (29) 31% (35) 113Military HH: Yes 38% (137) 45% (162) 17% (62) 361Military HH: No 49% (794) 32% (519) 19% (316) 1629RD/WT: Right Direction 76% (718) 9% (81) 15% (142) 941RD/WT: Wrong Track 20% (213) 57% (599) 23% (236) 1049Biden Job Approve 79% (816) 8% (85) 13% (136) 1037Biden Job Disapprove 10% (89) 68% (583) 22% (185) 857Biden Job Strongly Approve 89% (486) 5% (27) 6% (35) 548Biden Job Somewhat Approve 67% (330) 12% (59) 21% (100) 489Biden Job Somewhat Disapprove 26% (58) 42% (94) 32% (71) 223Biden Job Strongly Disapprove 5% (31) 77% (489) 18% (114) 634
Continued on next page
Page 33
National Tracking Poll #210636, June, 2021
33
Table POL1_3
Table POL1_3: Who do you trust more to handle each of the following issues?Health care
Demographic Democrats in CongressRepublicans in
CongressDon’t know / No
opinion Total N
Registered Voters 47% (931) 34% (680) 19% (378) 1990Favorable of Biden 79% (824) 8% (83) 14% (142) 1048Unfavorable of Biden 10% (83) 69% (587) 22% (185) 855Very Favorable of Biden 89% (529) 5% (27) 6% (37) 593Somewhat Favorable of Biden 65% (295) 12% (55) 23% (105) 455Somewhat Unfavorable of Biden 23% (44) 42% (80) 35% (66) 190Very Unfavorable of Biden 6% (39) 76% (507) 18% (119) 664#1 Issue: Economy 41% (311) 37% (279) 23% (173) 763#1 Issue: Security 23% (79) 62% (217) 15% (53) 349#1 Issue: Health Care 67% (156) 18% (43) 15% (35) 233#1 Issue: Medicare / Social Security 59% (154) 28% (73) 13% (34) 261#1 Issue: Women’s Issues 69% (70) 8% (8) 24% (25) 103#1 Issue: Education 57% (49) 21% (18) 21% (18) 86#1 Issue: Energy 62% (53) 17% (15) 20% (18) 86#1 Issue: Other 53% (58) 25% (27) 22% (24) 1092020 Vote: Joe Biden 84% (758) 5% (44) 11% (95) 8972020 Vote: Donald Trump 9% (70) 71% (578) 21% (170) 8182020 Vote: Didn’t Vote 38% (91) 21% (51) 41% (97) 2392018 House Vote: Democrat 87% (600) 4% (29) 8% (57) 6872018 House Vote: Republican 11% (76) 72% (494) 17% (120) 6902018 House Vote: Someone else 30% (15) 12% (6) 59% (29) 502016 Vote: Hillary Clinton 86% (543) 4% (26) 10% (61) 6312016 Vote: Donald Trump 14% (107) 67% (516) 19% (145) 7682016 Vote: Other 52% (56) 21% (23) 27% (29) 1072016 Vote: Didn’t Vote 47% (225) 24% (115) 30% (143) 483Voted in 2014: Yes 49% (630) 37% (483) 14% (184) 1297Voted in 2014: No 43% (301) 28% (197) 28% (194) 6934-Region: Northeast 54% (185) 27% (94) 19% (65) 3444-Region: Midwest 48% (220) 35% (158) 17% (77) 4554-Region: South 42% (318) 39% (292) 19% (145) 7554-Region: West 48% (207) 31% (136) 21% (91) 435
Continued on next page
Page 34
34
Morning ConsultTable POL1_3
Table POL1_3: Who do you trust more to handle each of the following issues?Health care
Demographic Democrats in CongressRepublicans in
CongressDon’t know / No
opinion Total N
Registered Voters 47% (931) 34% (680) 19% (378) 1990Party: Democrat/Leans Democrat 85% (759) 5% (42) 10% (88) 888Party: Republican/Leans Republican 10% (77) 70% (570) 20% (166) 814Note: Row proportions may total to larger than one-hundred percent due to rounding. For more information visit MorningConsultIntelligence.com.
Page 35
National Tracking Poll #210636, June, 2021
35
Table POL1_4
Table POL1_4: Who do you trust more to handle each of the following issues?Immigration
Demographic Democrats in CongressRepublicans in
CongressDon’t know / No
opinion Total N
Registered Voters 38% (763) 45% (887) 17% (340) 1990Gender: Male 39% (365) 47% (436) 14% (127) 927Gender: Female 37% (398) 42% (451) 20% (213) 1063Age: 18-34 45% (205) 29% (131) 26% (119) 456Age: 35-44 43% (129) 40% (121) 17% (51) 300Age: 45-64 32% (231) 54% (391) 15% (108) 730Age: 65+ 39% (198) 49% (244) 12% (61) 504GenZers: 1997-2012 42% (71) 25% (42) 33% (56) 169Millennials: 1981-1996 44% (213) 37% (177) 19% (90) 480GenXers: 1965-1980 37% (197) 45% (238) 17% (90) 525Baby Boomers: 1946-1964 35% (259) 53% (395) 12% (92) 746PID: Dem (no lean) 75% (563) 11% (80) 14% (108) 752PID: Ind (no lean) 28% (159) 44% (252) 29% (167) 578PID: Rep (no lean) 6% (41) 84% (555) 10% (65) 661PID/Gender: DemMen 75% (267) 14% (50) 12% (41) 359PID/Gender: DemWomen 75% (296) 8% (30) 17% (67) 393PID/Gender: Ind Men 27% (71) 52% (140) 21% (57) 267PID/Gender: Ind Women 28% (88) 36% (112) 36% (110) 311PID/Gender: Rep Men 9% (27) 82% (246) 9% (29) 301PID/Gender: Rep Women 4% (15) 86% (309) 10% (36) 360Ideo: Liberal (1-3) 73% (427) 13% (76) 14% (84) 587Ideo: Moderate (4) 41% (220) 34% (182) 25% (137) 539Ideo: Conservative (5-7) 11% (83) 81% (599) 8% (60) 742Educ: < College 33% (400) 46% (557) 21% (256) 1213Educ: Bachelors degree 45% (222) 42% (208) 12% (59) 489Educ: Post-grad 49% (141) 42% (122) 9% (25) 288Income: Under 50k 38% (381) 40% (399) 21% (211) 991Income: 50k-100k 37% (236) 48% (309) 15% (94) 640Income: 100k+ 41% (146) 50% (178) 10% (34) 359Ethnicity: White 33% (526) 51% (809) 16% (249) 1584Ethnicity: Hispanic 46% (90) 29% (58) 24% (48) 196
Continued on next page
Page 36
36
Morning ConsultTable POL1_4
Table POL1_4: Who do you trust more to handle each of the following issues?Immigration
Demographic Democrats in CongressRepublicans in
CongressDon’t know / No
opinion Total N
Registered Voters 38% (763) 45% (887) 17% (340) 1990Ethnicity: Black 64% (155) 14% (34) 22% (54) 243Ethnicity: Other 50% (82) 27% (44) 22% (37) 163All Christian 31% (304) 56% (535) 13% (125) 964All Non-Christian 56% (68) 24% (29) 20% (24) 121Atheist 65% (48) 21% (16) 14% (10) 73Agnostic/Nothing in particular 46% (227) 32% (158) 22% (111) 495Something Else 35% (117) 44% (150) 21% (70) 337Religious Non-Protestant/Catholic 51% (72) 28% (40) 21% (29) 140Evangelical 27% (145) 62% (339) 11% (63) 547Non-Evangelical 37% (267) 46% (329) 17% (126) 721Community: Urban 53% (278) 29% (152) 19% (98) 529Community: Suburban 36% (361) 48% (476) 16% (160) 998Community: Rural 27% (124) 56% (259) 18% (81) 464Employ: Private Sector 40% (248) 44% (276) 16% (98) 622Employ: Government 34% (43) 48% (62) 18% (23) 129Employ: Self-Employed 43% (68) 41% (64) 16% (25) 157Employ: Homemaker 27% (34) 52% (66) 21% (26) 127Employ: Retired 38% (220) 50% (292) 12% (69) 581Employ: Unemployed 38% (83) 33% (71) 29% (61) 215Employ: Other 38% (42) 37% (42) 25% (28) 113Military HH: Yes 28% (100) 58% (211) 14% (50) 361Military HH: No 41% (663) 42% (676) 18% (290) 1629RD/WT: Right Direction 66% (620) 16% (150) 18% (172) 941RD/WT: Wrong Track 14% (144) 70% (737) 16% (168) 1049Biden Job Approve 67% (693) 16% (163) 17% (180) 1037Biden Job Disapprove 6% (55) 82% (703) 12% (99) 857Biden Job Strongly Approve 81% (443) 9% (51) 10% (55) 548Biden Job Somewhat Approve 51% (251) 23% (113) 26% (126) 489Biden Job Somewhat Disapprove 16% (35) 65% (145) 19% (43) 223Biden Job Strongly Disapprove 3% (20) 88% (558) 9% (56) 634
Continued on next page
Page 37
National Tracking Poll #210636, June, 2021
37
Table POL1_4
Table POL1_4: Who do you trust more to handle each of the following issues?Immigration
Demographic Democrats in CongressRepublicans in
CongressDon’t know / No
opinion Total N
Registered Voters 38% (763) 45% (887) 17% (340) 1990Favorable of Biden 67% (703) 16% (167) 17% (178) 1048Unfavorable of Biden 6% (48) 82% (703) 12% (104) 855Very Favorable of Biden 82% (487) 9% (53) 9% (52) 593Somewhat Favorable of Biden 47% (216) 25% (114) 28% (126) 455Somewhat Unfavorable of Biden 13% (24) 62% (119) 25% (48) 190Very Unfavorable of Biden 4% (24) 88% (585) 8% (56) 664#1 Issue: Economy 33% (249) 48% (364) 20% (150) 763#1 Issue: Security 17% (59) 76% (264) 7% (26) 349#1 Issue: Health Care 55% (128) 28% (64) 18% (41) 233#1 Issue: Medicare / Social Security 48% (126) 36% (95) 15% (40) 261#1 Issue: Women’s Issues 61% (63) 15% (15) 24% (25) 103#1 Issue: Education 52% (44) 30% (26) 18% (15) 86#1 Issue: Energy 53% (46) 24% (20) 23% (20) 86#1 Issue: Other 44% (48) 35% (38) 21% (23) 1092020 Vote: Joe Biden 72% (649) 12% (110) 15% (138) 8972020 Vote: Donald Trump 5% (38) 84% (691) 11% (88) 8182020 Vote: Didn’t Vote 28% (67) 30% (71) 42% (101) 2392018 House Vote: Democrat 77% (526) 12% (81) 12% (80) 6872018 House Vote: Republican 6% (41) 86% (593) 8% (55) 6902018 House Vote: Someone else 18% (9) 30% (15) 52% (26) 502016 Vote: Hillary Clinton 78% (492) 9% (58) 13% (81) 6312016 Vote: Donald Trump 8% (59) 83% (634) 10% (75) 7682016 Vote: Other 38% (41) 36% (39) 26% (27) 1072016 Vote: Didn’t Vote 36% (172) 32% (155) 32% (156) 483Voted in 2014: Yes 40% (525) 49% (630) 11% (143) 1297Voted in 2014: No 34% (239) 37% (257) 28% (197) 6934-Region: Northeast 43% (148) 40% (137) 17% (59) 3444-Region: Midwest 40% (184) 41% (189) 18% (82) 4554-Region: South 34% (256) 50% (374) 17% (125) 7554-Region: West 40% (175) 43% (187) 17% (74) 435
Continued on next page
Page 38
38
Morning ConsultTable POL1_4
Table POL1_4: Who do you trust more to handle each of the following issues?Immigration
Demographic Democrats in CongressRepublicans in
CongressDon’t know / No
opinion Total N
Registered Voters 38% (763) 45% (887) 17% (340) 1990Party: Democrat/Leans Democrat 74% (660) 11% (97) 15% (132) 888Party: Republican/Leans Republican 6% (47) 83% (674) 11% (93) 814Note: Row proportions may total to larger than one-hundred percent due to rounding. For more information visit MorningConsultIntelligence.com.
Page 39
National Tracking Poll #210636, June, 2021
39
Table POL1_5
Table POL1_5: Who do you trust more to handle each of the following issues?Climate change
Demographic Democrats in CongressRepublicans in
CongressDon’t know / No
opinion Total N
Registered Voters 50% (995) 25% (503) 25% (492) 1990Gender: Male 52% (482) 25% (232) 23% (212) 927Gender: Female 48% (513) 25% (270) 26% (280) 1063Age: 18-34 56% (255) 17% (78) 27% (122) 456Age: 35-44 51% (152) 24% (72) 26% (77) 300Age: 45-64 45% (328) 30% (221) 25% (181) 730Age: 65+ 52% (260) 26% (132) 22% (112) 504GenZers: 1997-2012 56% (95) 12% (20) 32% (55) 169Millennials: 1981-1996 53% (256) 22% (107) 24% (117) 480GenXers: 1965-1980 47% (248) 28% (146) 25% (131) 525Baby Boomers: 1946-1964 49% (363) 28% (208) 23% (174) 746PID: Dem (no lean) 86% (644) 4% (28) 11% (80) 752PID: Ind (no lean) 45% (263) 17% (97) 38% (218) 578PID: Rep (no lean) 13% (89) 57% (378) 29% (194) 661PID/Gender: DemMen 85% (304) 6% (20) 10% (35) 359PID/Gender: DemWomen 87% (340) 2% (7) 11% (45) 393PID/Gender: Ind Men 46% (122) 19% (52) 35% (93) 267PID/Gender: Ind Women 45% (141) 14% (45) 40% (125) 311PID/Gender: Rep Men 19% (57) 53% (160) 28% (84) 301PID/Gender: Rep Women 9% (32) 61% (218) 30% (110) 360Ideo: Liberal (1-3) 82% (484) 6% (38) 11% (66) 587Ideo: Moderate (4) 58% (312) 12% (67) 30% (160) 539Ideo: Conservative (5-7) 22% (163) 51% (380) 27% (199) 742Educ: < College 44% (534) 27% (331) 29% (348) 1213Educ: Bachelors degree 59% (287) 22% (106) 20% (96) 489Educ: Post-grad 61% (175) 23% (66) 17% (48) 288Income: Under 50k 49% (483) 24% (235) 27% (272) 991Income: 50k-100k 49% (312) 27% (174) 24% (154) 640Income: 100k+ 56% (200) 26% (93) 18% (66) 359Ethnicity: White 46% (727) 29% (467) 25% (390) 1584Ethnicity: Hispanic 69% (135) 10% (20) 21% (42) 196
Continued on next page
Page 40
40
Morning ConsultTable POL1_5
Table POL1_5: Who do you trust more to handle each of the following issues?Climate change
Demographic Democrats in CongressRepublicans in
CongressDon’t know / No
opinion Total N
Registered Voters 50% (995) 25% (503) 25% (492) 1990Ethnicity: Black 68% (166) 8% (18) 24% (59) 243Ethnicity: Other 63% (102) 11% (18) 27% (43) 163All Christian 44% (427) 33% (322) 22% (215) 964All Non-Christian 67% (82) 11% (13) 22% (26) 121Atheist 73% (54) 13% (9) 14% (10) 73Agnostic/Nothing in particular 57% (281) 16% (78) 28% (137) 495Something Else 45% (152) 24% (81) 31% (104) 337Religious Non-Protestant/Catholic 62% (86) 14% (20) 24% (34) 140Evangelical 36% (198) 39% (215) 25% (134) 547Non-Evangelical 51% (370) 24% (175) 24% (176) 721Community: Urban 65% (342) 15% (79) 20% (107) 529Community: Suburban 49% (489) 27% (267) 24% (241) 998Community: Rural 35% (164) 34% (157) 31% (143) 464Employ: Private Sector 53% (330) 24% (151) 22% (140) 622Employ: Government 47% (61) 32% (41) 21% (27) 129Employ: Self-Employed 55% (86) 23% (37) 22% (35) 157Employ: Homemaker 33% (42) 37% (46) 30% (38) 127Employ: Retired 49% (285) 27% (159) 24% (137) 581Employ: Unemployed 52% (111) 17% (37) 31% (67) 215Employ: Other 47% (53) 22% (25) 31% (35) 113Military HH: Yes 43% (155) 34% (123) 23% (84) 361Military HH: No 52% (840) 23% (380) 25% (408) 1629RD/WT: Right Direction 78% (730) 6% (57) 16% (154) 941RD/WT: Wrong Track 25% (265) 43% (446) 32% (338) 1049Biden Job Approve 79% (824) 6% (64) 14% (149) 1037Biden Job Disapprove 18% (150) 50% (431) 32% (276) 857Biden Job Strongly Approve 88% (482) 5% (25) 8% (41) 548Biden Job Somewhat Approve 70% (342) 8% (39) 22% (108) 489Biden Job Somewhat Disapprove 40% (90) 25% (56) 34% (77) 223Biden Job Strongly Disapprove 9% (60) 59% (375) 31% (199) 634
Continued on next page
Page 41
National Tracking Poll #210636, June, 2021
41
Table POL1_5
Table POL1_5: Who do you trust more to handle each of the following issues?Climate change
Demographic Democrats in CongressRepublicans in
CongressDon’t know / No
opinion Total N
Registered Voters 50% (995) 25% (503) 25% (492) 1990Favorable of Biden 80% (838) 6% (60) 14% (150) 1048Unfavorable of Biden 16% (134) 51% (436) 33% (284) 855Very Favorable of Biden 89% (525) 4% (25) 7% (43) 593Somewhat Favorable of Biden 69% (313) 8% (36) 24% (107) 455Somewhat Unfavorable of Biden 37% (70) 22% (41) 41% (79) 190Very Unfavorable of Biden 10% (64) 59% (395) 31% (205) 664#1 Issue: Economy 44% (339) 27% (204) 29% (220) 763#1 Issue: Security 27% (95) 45% (158) 28% (97) 349#1 Issue: Health Care 70% (163) 14% (34) 16% (36) 233#1 Issue: Medicare / Social Security 61% (159) 21% (56) 18% (46) 261#1 Issue: Women’s Issues 70% (72) 5% (5) 24% (25) 103#1 Issue: Education 63% (54) 10% (9) 27% (23) 86#1 Issue: Energy 61% (52) 19% (16) 20% (17) 86#1 Issue: Other 56% (61) 19% (20) 26% (28) 1092020 Vote: Joe Biden 86% (774) 4% (34) 10% (89) 8972020 Vote: Donald Trump 16% (128) 53% (434) 31% (256) 8182020 Vote: Didn’t Vote 34% (81) 13% (31) 53% (127) 2392018 House Vote: Democrat 89% (610) 3% (24) 8% (53) 6872018 House Vote: Republican 17% (119) 54% (375) 28% (195) 6902018 House Vote: Someone else 25% (12) 15% (8) 60% (30) 502016 Vote: Hillary Clinton 88% (555) 3% (22) 9% (54) 6312016 Vote: Donald Trump 19% (146) 50% (386) 31% (235) 7682016 Vote: Other 53% (57) 17% (18) 30% (32) 1072016 Vote: Didn’t Vote 49% (236) 16% (76) 35% (171) 483Voted in 2014: Yes 52% (670) 28% (368) 20% (259) 1297Voted in 2014: No 47% (325) 19% (134) 34% (233) 6934-Region: Northeast 59% (203) 20% (69) 21% (72) 3444-Region: Midwest 49% (222) 28% (128) 23% (105) 4554-Region: South 45% (339) 29% (220) 26% (197) 7554-Region: West 53% (230) 20% (86) 27% (118) 435
Continued on next page
Page 42
42
Morning ConsultTable POL1_5
Table POL1_5: Who do you trust more to handle each of the following issues?Climate change
Demographic Democrats in CongressRepublicans in
CongressDon’t know / No
opinion Total N
Registered Voters 50% (995) 25% (503) 25% (492) 1990Party: Democrat/Leans Democrat 86% (764) 4% (32) 10% (92) 888Party: Republican/Leans Republican 16% (129) 53% (430) 31% (255) 814Note: Row proportions may total to larger than one-hundred percent due to rounding. For more information visit MorningConsultIntelligence.com.
Page 43
National Tracking Poll #210636, June, 2021
43
Table POL1_6
Table POL1_6: Who do you trust more to handle each of the following issues?The environment
Demographic Democrats in CongressRepublicans in
CongressDon’t know / No
opinion Total N
Registered Voters 50% (992) 28% (560) 22% (438) 1990Gender: Male 53% (490) 28% (255) 20% (182) 927Gender: Female 47% (502) 29% (305) 24% (256) 1063Age: 18-34 56% (255) 19% (86) 25% (115) 456Age: 35-44 49% (146) 29% (87) 22% (67) 300Age: 45-64 46% (336) 32% (236) 22% (158) 730Age: 65+ 50% (254) 30% (151) 20% (98) 504GenZers: 1997-2012 51% (86) 15% (26) 34% (57) 169Millennials: 1981-1996 54% (260) 25% (122) 20% (98) 480GenXers: 1965-1980 49% (255) 28% (149) 23% (121) 525Baby Boomers: 1946-1964 48% (359) 32% (237) 20% (150) 746PID: Dem (no lean) 85% (641) 5% (38) 10% (73) 752PID: Ind (no lean) 44% (253) 19% (110) 37% (215) 578PID: Rep (no lean) 15% (98) 62% (413) 23% (150) 661PID/Gender: DemMen 86% (310) 6% (20) 8% (29) 359PID/Gender: DemWomen 84% (331) 4% (18) 11% (45) 393PID/Gender: Ind Men 43% (115) 24% (64) 33% (89) 267PID/Gender: Ind Women 44% (138) 15% (47) 41% (126) 311PID/Gender: Rep Men 21% (65) 57% (172) 22% (65) 301PID/Gender: Rep Women 9% (33) 67% (241) 24% (85) 360Ideo: Liberal (1-3) 83% (490) 7% (39) 10% (58) 587Ideo: Moderate (4) 57% (308) 15% (79) 28% (152) 539Ideo: Conservative (5-7) 20% (152) 57% (424) 22% (167) 742Educ: < College 44% (529) 30% (366) 26% (318) 1213Educ: Bachelors degree 58% (284) 24% (117) 18% (87) 489Educ: Post-grad 62% (178) 27% (77) 12% (34) 288Income: Under 50k 48% (473) 27% (271) 25% (246) 991Income: 50k-100k 50% (321) 29% (188) 21% (131) 640Income: 100k+ 55% (198) 28% (101) 17% (60) 359Ethnicity: White 46% (729) 33% (528) 21% (328) 1584Ethnicity: Hispanic 61% (120) 16% (32) 22% (44) 196
Continued on next page
Page 44
44
Morning ConsultTable POL1_6
Table POL1_6: Who do you trust more to handle each of the following issues?The environment
Demographic Democrats in CongressRepublicans in
CongressDon’t know / No
opinion Total N
Registered Voters 50% (992) 28% (560) 22% (438) 1990Ethnicity: Black 69% (166) 7% (17) 24% (59) 243Ethnicity: Other 59% (96) 10% (16) 31% (51) 163All Christian 44% (426) 37% (358) 19% (180) 964All Non-Christian 65% (79) 14% (17) 21% (25) 121Atheist 74% (54) 14% (10) 12% (9) 73Agnostic/Nothing in particular 57% (284) 16% (80) 26% (131) 495Something Else 44% (149) 28% (94) 28% (93) 337Religious Non-Protestant/Catholic 59% (83) 21% (29) 21% (29) 140Evangelical 35% (193) 44% (242) 20% (112) 547Non-Evangelical 52% (372) 27% (194) 21% (155) 721Community: Urban 63% (334) 20% (105) 17% (90) 529Community: Suburban 49% (494) 29% (285) 22% (219) 998Community: Rural 35% (164) 37% (170) 28% (129) 464Employ: Private Sector 54% (334) 26% (163) 20% (124) 622Employ: Government 41% (52) 38% (49) 22% (28) 129Employ: Self-Employed 57% (89) 24% (37) 19% (30) 157Employ: Homemaker 32% (41) 40% (50) 28% (35) 127Employ: Retired 49% (285) 32% (184) 19% (113) 581Employ: Unemployed 50% (108) 22% (48) 27% (58) 215Employ: Other 47% (53) 20% (22) 34% (38) 113Military HH: Yes 43% (154) 36% (131) 21% (76) 361Military HH: No 51% (837) 26% (429) 22% (362) 1629RD/WT: Right Direction 78% (732) 8% (78) 14% (131) 941RD/WT: Wrong Track 25% (260) 46% (482) 29% (307) 1049Biden Job Approve 79% (824) 8% (81) 13% (132) 1037Biden Job Disapprove 17% (149) 55% (468) 28% (240) 857Biden Job Strongly Approve 88% (481) 5% (30) 7% (37) 548Biden Job Somewhat Approve 70% (343) 10% (51) 19% (95) 489Biden Job Somewhat Disapprove 38% (86) 28% (61) 34% (76) 223Biden Job Strongly Disapprove 10% (63) 64% (406) 26% (164) 634
Continued on next page
Page 45
National Tracking Poll #210636, June, 2021
45
Table POL1_6
Table POL1_6: Who do you trust more to handle each of the following issues?The environment
Demographic Democrats in CongressRepublicans in
CongressDon’t know / No
opinion Total N
Registered Voters 50% (992) 28% (560) 22% (438) 1990Favorable of Biden 80% (840) 7% (74) 13% (134) 1048Unfavorable of Biden 16% (133) 55% (474) 29% (247) 855Very Favorable of Biden 88% (524) 5% (31) 6% (38) 593Somewhat Favorable of Biden 69% (316) 9% (43) 21% (96) 455Somewhat Unfavorable of Biden 31% (59) 30% (57) 39% (74) 190Very Unfavorable of Biden 11% (74) 63% (417) 26% (174) 664#1 Issue: Economy 44% (333) 31% (236) 26% (195) 763#1 Issue: Security 28% (97) 52% (180) 21% (72) 349#1 Issue: Health Care 67% (157) 15% (36) 17% (40) 233#1 Issue: Medicare / Social Security 62% (161) 20% (53) 18% (47) 261#1 Issue: Women’s Issues 68% (70) 10% (10) 22% (23) 103#1 Issue: Education 65% (56) 14% (12) 21% (18) 86#1 Issue: Energy 65% (56) 15% (13) 20% (17) 86#1 Issue: Other 57% (62) 19% (21) 24% (26) 1092020 Vote: Joe Biden 85% (758) 5% (43) 11% (95) 8972020 Vote: Donald Trump 15% (124) 59% (480) 26% (215) 8182020 Vote: Didn’t Vote 40% (97) 14% (34) 45% (109) 2392018 House Vote: Democrat 88% (602) 3% (22) 9% (63) 6872018 House Vote: Republican 17% (116) 59% (406) 24% (168) 6902018 House Vote: Someone else 33% (16) 16% (8) 52% (26) 502016 Vote: Hillary Clinton 87% (552) 4% (23) 9% (57) 6312016 Vote: Donald Trump 19% (149) 54% (417) 26% (202) 7682016 Vote: Other 57% (62) 16% (17) 27% (29) 1072016 Vote: Didn’t Vote 47% (229) 21% (103) 31% (151) 483Voted in 2014: Yes 51% (666) 31% (399) 18% (232) 1297Voted in 2014: No 47% (326) 23% (162) 30% (206) 6934-Region: Northeast 58% (199) 25% (85) 18% (61) 3444-Region: Midwest 51% (232) 31% (140) 18% (83) 4554-Region: South 45% (338) 31% (234) 24% (183) 7554-Region: West 51% (222) 23% (101) 26% (111) 435
Continued on next page
Page 46
46
Morning ConsultTable POL1_6
Table POL1_6: Who do you trust more to handle each of the following issues?The environment
Demographic Democrats in CongressRepublicans in
CongressDon’t know / No
opinion Total N
Registered Voters 50% (992) 28% (560) 22% (438) 1990Party: Democrat/Leans Democrat 86% (760) 5% (44) 9% (84) 888Party: Republican/Leans Republican 17% (136) 57% (468) 26% (210) 814Note: Row proportions may total to larger than one-hundred percent due to rounding. For more information visit MorningConsultIntelligence.com.
Page 47
National Tracking Poll #210636, June, 2021
47
Table POL1_7
Table POL1_7: Who do you trust more to handle each of the following issues?Energy
Demographic Democrats in CongressRepublicans in
CongressDon’t know / No
opinion Total N
Registered Voters 44% (870) 36% (716) 20% (404) 1990Gender: Male 45% (413) 39% (358) 17% (156) 927Gender: Female 43% (457) 34% (359) 23% (248) 1063Age: 18-34 50% (228) 23% (105) 27% (122) 456Age: 35-44 47% (142) 32% (97) 20% (61) 300Age: 45-64 38% (280) 41% (300) 21% (151) 730Age: 65+ 44% (220) 43% (215) 14% (69) 504GenZers: 1997-2012 49% (82) 17% (29) 34% (58) 169Millennials: 1981-1996 49% (234) 30% (142) 22% (104) 480GenXers: 1965-1980 42% (223) 35% (186) 22% (116) 525Baby Boomers: 1946-1964 41% (304) 44% (327) 15% (115) 746PID: Dem (no lean) 82% (620) 6% (47) 11% (85) 752PID: Ind (no lean) 34% (198) 32% (186) 33% (193) 578PID: Rep (no lean) 8% (52) 73% (483) 19% (126) 661PID/Gender: DemMen 81% (292) 8% (29) 10% (38) 359PID/Gender: DemWomen 83% (327) 5% (18) 12% (47) 393PID/Gender: Ind Men 34% (90) 41% (109) 26% (68) 267PID/Gender: Ind Women 35% (109) 25% (77) 40% (125) 311PID/Gender: Rep Men 10% (31) 73% (220) 17% (50) 301PID/Gender: Rep Women 6% (21) 73% (264) 21% (75) 360Ideo: Liberal (1-3) 79% (466) 9% (51) 12% (70) 587Ideo: Moderate (4) 50% (269) 23% (121) 28% (148) 539Ideo: Conservative (5-7) 14% (100) 71% (525) 16% (117) 742Educ: < College 39% (472) 37% (443) 25% (298) 1213Educ: Bachelors degree 49% (239) 35% (173) 16% (77) 489Educ: Post-grad 55% (159) 35% (100) 10% (29) 288Income: Under 50k 43% (430) 33% (329) 23% (232) 991Income: 50k-100k 43% (274) 38% (242) 19% (123) 640Income: 100k+ 46% (166) 40% (145) 13% (48) 359Ethnicity: White 39% (615) 42% (658) 20% (311) 1584Ethnicity: Hispanic 55% (108) 20% (40) 24% (48) 196
Continued on next page
Page 48
48
Morning ConsultTable POL1_7
Table POL1_7: Who do you trust more to handle each of the following issues?Energy
Demographic Democrats in CongressRepublicans in
CongressDon’t know / No
opinion Total N
Registered Voters 44% (870) 36% (716) 20% (404) 1990Ethnicity: Black 67% (162) 10% (25) 23% (55) 243Ethnicity: Other 57% (92) 21% (34) 23% (37) 163All Christian 38% (369) 47% (448) 15% (146) 964All Non-Christian 61% (73) 23% (28) 16% (19) 121Atheist 66% (48) 18% (13) 17% (12) 73Agnostic/Nothing in particular 50% (249) 23% (113) 27% (133) 495Something Else 39% (131) 34% (114) 27% (92) 337Religious Non-Protestant/Catholic 54% (76) 28% (40) 18% (25) 140Evangelical 32% (173) 52% (285) 16% (90) 547Non-Evangelical 44% (319) 36% (261) 19% (140) 721Community: Urban 59% (311) 23% (123) 18% (95) 529Community: Suburban 42% (415) 39% (386) 20% (197) 998Community: Rural 31% (143) 45% (208) 24% (112) 464Employ: Private Sector 47% (290) 36% (223) 17% (109) 622Employ: Government 43% (55) 36% (46) 21% (27) 129Employ: Self-Employed 47% (74) 32% (50) 21% (33) 157Employ: Homemaker 31% (39) 41% (52) 28% (35) 127Employ: Retired 42% (245) 42% (246) 16% (90) 581Employ: Unemployed 47% (102) 26% (55) 27% (58) 215Employ: Other 36% (41) 30% (34) 33% (37) 113Military HH: Yes 35% (128) 49% (176) 16% (58) 361Military HH: No 46% (742) 33% (541) 21% (346) 1629RD/WT: Right Direction 73% (691) 10% (98) 16% (152) 941RD/WT: Wrong Track 17% (179) 59% (618) 24% (252) 1049Biden Job Approve 74% (769) 11% (112) 15% (157) 1037Biden Job Disapprove 10% (83) 69% (587) 22% (187) 857Biden Job Strongly Approve 85% (464) 7% (39) 8% (46) 548Biden Job Somewhat Approve 62% (305) 15% (73) 23% (111) 489Biden Job Somewhat Disapprove 24% (53) 37% (83) 39% (87) 223Biden Job Strongly Disapprove 5% (29) 80% (504) 16% (100) 634
Continued on next page
Page 49
National Tracking Poll #210636, June, 2021
49
Table POL1_7
Table POL1_7: Who do you trust more to handle each of the following issues?Energy
Demographic Democrats in CongressRepublicans in
CongressDon’t know / No
opinion Total N
Registered Voters 44% (870) 36% (716) 20% (404) 1990Favorable of Biden 74% (775) 10% (105) 16% (169) 1048Unfavorable of Biden 9% (77) 70% (598) 21% (180) 855Very Favorable of Biden 86% (512) 6% (35) 8% (46) 593Somewhat Favorable of Biden 58% (263) 15% (69) 27% (123) 455Somewhat Unfavorable of Biden 23% (43) 37% (71) 40% (76) 190Very Unfavorable of Biden 5% (34) 79% (527) 16% (104) 664#1 Issue: Economy 38% (291) 39% (299) 23% (174) 763#1 Issue: Security 20% (71) 67% (234) 13% (45) 349#1 Issue: Health Care 67% (155) 17% (40) 16% (38) 233#1 Issue: Medicare / Social Security 51% (134) 29% (75) 20% (52) 261#1 Issue: Women’s Issues 61% (63) 14% (15) 24% (25) 103#1 Issue: Education 59% (51) 15% (13) 26% (22) 86#1 Issue: Energy 58% (50) 18% (15) 24% (20) 86#1 Issue: Other 51% (56) 23% (25) 26% (28) 1092020 Vote: Joe Biden 80% (714) 7% (63) 13% (120) 8972020 Vote: Donald Trump 8% (63) 73% (599) 19% (156) 8182020 Vote: Didn’t Vote 35% (83) 20% (47) 46% (109) 2392018 House Vote: Democrat 84% (574) 7% (46) 10% (67) 6872018 House Vote: Republican 9% (64) 74% (513) 16% (113) 6902018 House Vote: Someone else 18% (9) 27% (13) 55% (28) 502016 Vote: Hillary Clinton 83% (521) 6% (40) 11% (70) 6312016 Vote: Donald Trump 11% (85) 71% (545) 18% (138) 7682016 Vote: Other 51% (55) 26% (28) 23% (25) 1072016 Vote: Didn’t Vote 43% (209) 21% (104) 35% (171) 483Voted in 2014: Yes 45% (586) 41% (528) 14% (183) 1297Voted in 2014: No 41% (284) 27% (189) 32% (220) 6934-Region: Northeast 53% (181) 30% (104) 17% (60) 3444-Region: Midwest 46% (209) 35% (161) 19% (85) 4554-Region: South 39% (292) 40% (303) 21% (161) 7554-Region: West 43% (188) 34% (149) 23% (99) 435
Continued on next page
Page 50
50
Morning ConsultTable POL1_7
Table POL1_7: Who do you trust more to handle each of the following issues?Energy
Demographic Democrats in CongressRepublicans in
CongressDon’t know / No
opinion Total N
Registered Voters 44% (870) 36% (716) 20% (404) 1990Party: Democrat/Leans Democrat 82% (727) 6% (52) 12% (109) 888Party: Republican/Leans Republican 8% (67) 71% (581) 20% (165) 814Note: Row proportions may total to larger than one-hundred percent due to rounding. For more information visit MorningConsultIntelligence.com.
Page 51
National Tracking Poll #210636, June, 2021
51
Table POL1_8
Table POL1_8: Who do you trust more to handle each of the following issues?Education
Demographic Democrats in CongressRepublicans in
CongressDon’t know / No
opinion Total N
Registered Voters 45% (891) 35% (690) 21% (409) 1990Gender: Male 47% (431) 34% (316) 19% (180) 927Gender: Female 43% (460) 35% (374) 22% (229) 1063Age: 18-34 51% (233) 23% (105) 26% (118) 456Age: 35-44 48% (144) 33% (98) 19% (58) 300Age: 45-64 39% (284) 39% (285) 22% (161) 730Age: 65+ 46% (230) 40% (202) 14% (72) 504GenZers: 1997-2012 52% (87) 17% (29) 32% (54) 169Millennials: 1981-1996 48% (231) 30% (144) 22% (105) 480GenXers: 1965-1980 44% (229) 35% (185) 21% (111) 525Baby Boomers: 1946-1964 42% (313) 41% (303) 17% (129) 746PID: Dem (no lean) 83% (621) 5% (36) 12% (94) 752PID: Ind (no lean) 37% (213) 28% (160) 35% (204) 578PID: Rep (no lean) 9% (56) 75% (494) 17% (111) 661PID/Gender: DemMen 82% (295) 6% (23) 11% (41) 359PID/Gender: DemWomen 83% (326) 3% (13) 14% (53) 393PID/Gender: Ind Men 39% (103) 30% (80) 31% (83) 267PID/Gender: Ind Women 35% (110) 26% (80) 39% (121) 311PID/Gender: Rep Men 11% (33) 71% (212) 19% (56) 301PID/Gender: Rep Women 7% (24) 78% (281) 15% (55) 360Ideo: Liberal (1-3) 78% (459) 9% (50) 13% (78) 587Ideo: Moderate (4) 53% (285) 22% (116) 26% (138) 539Ideo: Conservative (5-7) 15% (111) 68% (505) 17% (126) 742Educ: < College 40% (486) 36% (437) 24% (290) 1213Educ: Bachelors degree 51% (248) 33% (161) 16% (79) 489Educ: Post-grad 54% (157) 32% (93) 14% (39) 288Income: Under 50k 45% (449) 32% (320) 22% (222) 991Income: 50k-100k 43% (276) 37% (237) 20% (127) 640Income: 100k+ 46% (166) 37% (133) 17% (60) 359Ethnicity: White 40% (636) 40% (634) 20% (314) 1584Ethnicity: Hispanic 58% (113) 20% (39) 22% (44) 196
Continued on next page
Page 52
52
Morning ConsultTable POL1_8
Table POL1_8: Who do you trust more to handle each of the following issues?Education
Demographic Democrats in CongressRepublicans in
CongressDon’t know / No
opinion Total N
Registered Voters 45% (891) 35% (690) 21% (409) 1990Ethnicity: Black 66% (160) 9% (22) 25% (61) 243Ethnicity: Other 58% (95) 21% (34) 21% (34) 163All Christian 39% (371) 46% (440) 16% (153) 964All Non-Christian 65% (79) 18% (21) 17% (21) 121Atheist 66% (48) 18% (13) 17% (12) 73Agnostic/Nothing in particular 52% (255) 22% (110) 26% (130) 495Something Else 41% (137) 32% (106) 28% (93) 337Religious Non-Protestant/Catholic 59% (83) 24% (33) 17% (24) 140Evangelical 32% (173) 51% (279) 18% (96) 547Non-Evangelical 45% (327) 35% (250) 20% (144) 721Community: Urban 59% (312) 23% (121) 18% (95) 529Community: Suburban 44% (434) 36% (360) 20% (204) 998Community: Rural 31% (145) 45% (209) 24% (110) 464Employ: Private Sector 47% (289) 34% (214) 19% (118) 622Employ: Government 37% (48) 38% (49) 24% (31) 129Employ: Self-Employed 52% (81) 29% (45) 20% (31) 157Employ: Homemaker 34% (44) 40% (51) 25% (32) 127Employ: Retired 44% (258) 40% (233) 16% (90) 581Employ: Unemployed 50% (107) 26% (56) 24% (52) 215Employ: Other 36% (40) 27% (30) 38% (43) 113Military HH: Yes 35% (127) 45% (164) 19% (70) 361Military HH: No 47% (764) 32% (526) 21% (339) 1629RD/WT: Right Direction 74% (698) 8% (76) 18% (167) 941RD/WT: Wrong Track 18% (193) 59% (614) 23% (242) 1049Biden Job Approve 76% (791) 9% (91) 15% (155) 1037Biden Job Disapprove 9% (80) 69% (588) 22% (189) 857Biden Job Strongly Approve 87% (478) 5% (27) 8% (43) 548Biden Job Somewhat Approve 64% (312) 13% (64) 23% (112) 489Biden Job Somewhat Disapprove 22% (48) 41% (92) 37% (83) 223Biden Job Strongly Disapprove 5% (31) 78% (497) 17% (106) 634
Continued on next page
Page 53
National Tracking Poll #210636, June, 2021
53
Table POL1_8
Table POL1_8: Who do you trust more to handle each of the following issues?Education
Demographic Democrats in CongressRepublicans in
CongressDon’t know / No
opinion Total N
Registered Voters 45% (891) 35% (690) 21% (409) 1990Favorable of Biden 76% (798) 8% (84) 16% (166) 1048Unfavorable of Biden 9% (76) 69% (590) 22% (189) 855Very Favorable of Biden 87% (519) 4% (25) 8% (49) 593Somewhat Favorable of Biden 61% (279) 13% (59) 26% (117) 455Somewhat Unfavorable of Biden 19% (37) 42% (80) 39% (74) 190Very Unfavorable of Biden 6% (39) 77% (510) 17% (115) 664#1 Issue: Economy 38% (290) 38% (287) 24% (186) 763#1 Issue: Security 22% (75) 63% (220) 16% (55) 349#1 Issue: Health Care 65% (151) 17% (41) 18% (41) 233#1 Issue: Medicare / Social Security 55% (144) 28% (72) 17% (45) 261#1 Issue: Women’s Issues 67% (69) 11% (11) 23% (23) 103#1 Issue: Education 60% (51) 18% (16) 22% (19) 86#1 Issue: Energy 59% (51) 17% (15) 23% (20) 86#1 Issue: Other 55% (60) 26% (29) 19% (20) 1092020 Vote: Joe Biden 81% (730) 5% (44) 14% (123) 8972020 Vote: Donald Trump 8% (63) 72% (588) 20% (167) 8182020 Vote: Didn’t Vote 37% (88) 21% (50) 42% (101) 2392018 House Vote: Democrat 85% (583) 5% (34) 10% (69) 6872018 House Vote: Republican 10% (67) 72% (500) 18% (123) 6902018 House Vote: Someone else 21% (11) 23% (11) 56% (28) 502016 Vote: Hillary Clinton 83% (526) 5% (31) 12% (74) 6312016 Vote: Donald Trump 13% (102) 67% (516) 19% (150) 7682016 Vote: Other 49% (53) 29% (31) 21% (23) 1072016 Vote: Didn’t Vote 43% (210) 23% (111) 34% (163) 483Voted in 2014: Yes 46% (602) 39% (500) 15% (194) 1297Voted in 2014: No 42% (288) 27% (190) 31% (215) 6934-Region: Northeast 51% (177) 29% (101) 19% (66) 3444-Region: Midwest 47% (215) 35% (159) 18% (81) 4554-Region: South 41% (311) 39% (291) 20% (154) 7554-Region: West 43% (188) 32% (139) 25% (108) 435
Continued on next page
Page 54
54
Morning ConsultTable POL1_8
Table POL1_8: Who do you trust more to handle each of the following issues?Education
Demographic Democrats in CongressRepublicans in
CongressDon’t know / No
opinion Total N
Registered Voters 45% (891) 35% (690) 21% (409) 1990Party: Democrat/Leans Democrat 82% (728) 5% (44) 13% (117) 888Party: Republican/Leans Republican 9% (72) 71% (577) 20% (164) 814Note: Row proportions may total to larger than one-hundred percent due to rounding. For more information visit MorningConsultIntelligence.com.
Page 55
National Tracking Poll #210636, June, 2021
55
Table POL1_9
Table POL1_9: Who do you trust more to handle each of the following issues?National security
Demographic Democrats in CongressRepublicans in
CongressDon’t know / No
opinion Total N
Registered Voters 37% (742) 45% (898) 18% (350) 1990Gender: Male 38% (355) 48% (444) 14% (128) 927Gender: Female 36% (387) 43% (454) 21% (222) 1063Age: 18-34 40% (182) 33% (148) 28% (126) 456Age: 35-44 42% (125) 41% (123) 17% (52) 300Age: 45-64 32% (237) 52% (382) 15% (111) 730Age: 65+ 39% (198) 48% (244) 12% (61) 504GenZers: 1997-2012 38% (65) 26% (44) 36% (61) 169Millennials: 1981-1996 40% (194) 39% (188) 20% (98) 480GenXers: 1965-1980 37% (196) 46% (239) 17% (90) 525Baby Boomers: 1946-1964 35% (264) 52% (390) 12% (92) 746PID: Dem (no lean) 77% (575) 10% (78) 13% (98) 752PID: Ind (no lean) 23% (131) 47% (270) 31% (177) 578PID: Rep (no lean) 5% (36) 83% (550) 11% (75) 661PID/Gender: DemMen 77% (275) 12% (41) 12% (43) 359PID/Gender: DemWomen 76% (300) 9% (37) 14% (56) 393PID/Gender: Ind Men 22% (59) 57% (152) 21% (56) 267PID/Gender: Ind Women 23% (72) 38% (118) 39% (121) 311PID/Gender: Rep Men 7% (22) 83% (251) 10% (29) 301PID/Gender: Rep Women 4% (14) 83% (299) 13% (46) 360Ideo: Liberal (1-3) 71% (415) 14% (83) 15% (89) 587Ideo: Moderate (4) 40% (216) 36% (192) 24% (131) 539Ideo: Conservative (5-7) 11% (85) 80% (591) 9% (66) 742Educ: < College 33% (396) 47% (568) 21% (249) 1213Educ: Bachelors degree 45% (220) 40% (195) 15% (73) 489Educ: Post-grad 44% (126) 47% (135) 10% (27) 288Income: Under 50k 38% (377) 42% (421) 20% (194) 991Income: 50k-100k 35% (224) 46% (296) 19% (120) 640Income: 100k+ 40% (142) 50% (181) 10% (36) 359Ethnicity: White 33% (522) 51% (805) 16% (257) 1584Ethnicity: Hispanic 53% (105) 26% (52) 20% (39) 196
Continued on next page
Page 56
56
Morning ConsultTable POL1_9
Table POL1_9: Who do you trust more to handle each of the following issues?National security
Demographic Democrats in CongressRepublicans in
CongressDon’t know / No
opinion Total N
Registered Voters 37% (742) 45% (898) 18% (350) 1990Ethnicity: Black 58% (141) 16% (38) 26% (63) 243Ethnicity: Other 48% (79) 34% (56) 18% (29) 163All Christian 33% (315) 55% (533) 12% (116) 964All Non-Christian 59% (72) 25% (30) 16% (20) 121Atheist 53% (39) 24% (17) 23% (17) 73Agnostic/Nothing in particular 41% (203) 35% (173) 24% (119) 495Something Else 34% (113) 43% (145) 23% (78) 337Religious Non-Protestant/Catholic 53% (75) 30% (42) 17% (23) 140Evangelical 28% (156) 61% (336) 10% (56) 547Non-Evangelical 37% (266) 45% (324) 18% (131) 721Community: Urban 52% (276) 31% (162) 17% (91) 529Community: Suburban 35% (345) 48% (481) 17% (171) 998Community: Rural 26% (121) 55% (255) 19% (88) 464Employ: Private Sector 38% (239) 46% (286) 16% (97) 622Employ: Government 32% (42) 47% (61) 20% (26) 129Employ: Self-Employed 41% (64) 42% (67) 17% (26) 157Employ: Homemaker 25% (31) 53% (67) 22% (28) 127Employ: Retired 38% (220) 51% (294) 12% (68) 581Employ: Unemployed 41% (87) 34% (73) 25% (54) 215Employ: Other 36% (40) 34% (39) 30% (34) 113Military HH: Yes 29% (106) 56% (203) 15% (53) 361Military HH: No 39% (636) 43% (695) 18% (297) 1629RD/WT: Right Direction 67% (626) 16% (154) 17% (161) 941RD/WT: Wrong Track 11% (116) 71% (744) 18% (189) 1049Biden Job Approve 66% (688) 18% (184) 16% (165) 1037Biden Job Disapprove 5% (41) 81% (693) 14% (123) 857Biden Job Strongly Approve 82% (451) 9% (51) 8% (46) 548Biden Job Somewhat Approve 48% (237) 27% (133) 24% (119) 489Biden Job Somewhat Disapprove 12% (26) 62% (138) 27% (60) 223Biden Job Strongly Disapprove 2% (15) 88% (555) 10% (63) 634
Continued on next page
Page 57
National Tracking Poll #210636, June, 2021
57
Table POL1_9
Table POL1_9: Who do you trust more to handle each of the following issues?National security
Demographic Democrats in CongressRepublicans in
CongressDon’t know / No
opinion Total N
Registered Voters 37% (742) 45% (898) 18% (350) 1990Favorable of Biden 65% (686) 18% (187) 17% (175) 1048Unfavorable of Biden 5% (42) 81% (690) 14% (123) 855Very Favorable of Biden 82% (486) 10% (57) 9% (50) 593Somewhat Favorable of Biden 44% (201) 29% (130) 27% (124) 455Somewhat Unfavorable of Biden 10% (18) 57% (109) 33% (63) 190Very Unfavorable of Biden 3% (23) 87% (581) 9% (60) 664#1 Issue: Economy 30% (231) 50% (383) 20% (149) 763#1 Issue: Security 16% (55) 76% (267) 8% (27) 349#1 Issue: Health Care 58% (135) 26% (62) 15% (36) 233#1 Issue: Medicare / Social Security 48% (124) 36% (94) 16% (43) 261#1 Issue: Women’s Issues 59% (61) 18% (18) 23% (24) 103#1 Issue: Education 51% (44) 31% (26) 18% (16) 86#1 Issue: Energy 52% (44) 16% (14) 32% (28) 86#1 Issue: Other 43% (47) 31% (34) 25% (28) 1092020 Vote: Joe Biden 72% (648) 13% (118) 15% (131) 8972020 Vote: Donald Trump 3% (29) 85% (692) 12% (98) 8182020 Vote: Didn’t Vote 25% (59) 32% (76) 44% (104) 2392018 House Vote: Democrat 76% (524) 12% (81) 12% (82) 6872018 House Vote: Republican 5% (36) 86% (595) 9% (59) 6902018 House Vote: Someone else 17% (8) 25% (13) 58% (29) 502016 Vote: Hillary Clinton 77% (486) 10% (61) 13% (84) 6312016 Vote: Donald Trump 7% (51) 83% (635) 11% (81) 7682016 Vote: Other 36% (38) 39% (42) 26% (27) 1072016 Vote: Didn’t Vote 35% (167) 33% (160) 32% (157) 483Voted in 2014: Yes 40% (523) 48% (628) 11% (147) 1297Voted in 2014: No 32% (219) 39% (271) 29% (203) 6934-Region: Northeast 45% (154) 38% (130) 18% (61) 3444-Region: Midwest 40% (182) 45% (207) 15% (67) 4554-Region: South 33% (246) 50% (377) 18% (133) 7554-Region: West 37% (161) 42% (184) 21% (90) 435
Continued on next page
Page 58
58
Morning ConsultTable POL1_9
Table POL1_9: Who do you trust more to handle each of the following issues?National security
Demographic Democrats in CongressRepublicans in
CongressDon’t know / No
opinion Total N
Registered Voters 37% (742) 45% (898) 18% (350) 1990Party: Democrat/Leans Democrat 74% (657) 11% (100) 15% (132) 888Party: Republican/Leans Republican 5% (40) 83% (671) 13% (102) 814Note: Row proportions may total to larger than one-hundred percent due to rounding. For more information visit MorningConsultIntelligence.com.
Page 59
National Tracking Poll #210636, June, 2021
59
Table POL1_10
Table POL1_10: Who do you trust more to handle each of the following issues?Gun policy
Demographic Democrats in CongressRepublicans in
CongressDon’t know / No
opinion Total N
Registered Voters 40% (805) 43% (846) 17% (339) 1990Gender: Male 42% (393) 43% (400) 15% (135) 927Gender: Female 39% (412) 42% (446) 19% (204) 1063Age: 18-34 42% (191) 33% (153) 25% (112) 456Age: 35-44 41% (123) 43% (129) 16% (48) 300Age: 45-64 36% (265) 47% (346) 16% (120) 730Age: 65+ 45% (226) 43% (219) 12% (59) 504GenZers: 1997-2012 36% (61) 30% (50) 34% (58) 169Millennials: 1981-1996 43% (206) 40% (190) 17% (84) 480GenXers: 1965-1980 40% (208) 43% (225) 18% (92) 525Baby Boomers: 1946-1964 41% (305) 47% (350) 12% (91) 746PID: Dem (no lean) 79% (591) 9% (65) 13% (96) 752PID: Ind (no lean) 28% (162) 41% (239) 31% (177) 578PID: Rep (no lean) 8% (51) 82% (543) 10% (67) 661PID/Gender: DemMen 79% (285) 9% (34) 11% (40) 359PID/Gender: DemWomen 78% (306) 8% (31) 14% (56) 393PID/Gender: Ind Men 30% (79) 46% (122) 25% (66) 267PID/Gender: Ind Women 27% (83) 38% (117) 36% (111) 311PID/Gender: Rep Men 9% (28) 81% (244) 10% (29) 301PID/Gender: Rep Women 6% (23) 83% (299) 11% (38) 360Ideo: Liberal (1-3) 75% (438) 13% (73) 13% (76) 587Ideo: Moderate (4) 44% (240) 30% (160) 26% (139) 539Ideo: Conservative (5-7) 14% (101) 77% (569) 10% (72) 742Educ: < College 34% (413) 45% (551) 21% (249) 1213Educ: Bachelors degree 48% (235) 38% (188) 13% (66) 489Educ: Post-grad 55% (157) 37% (107) 8% (24) 288Income: Under 50k 40% (392) 41% (405) 20% (194) 991Income: 50k-100k 39% (247) 44% (280) 18% (112) 640Income: 100k+ 46% (166) 45% (160) 9% (33) 359Ethnicity: White 36% (575) 48% (764) 15% (246) 1584Ethnicity: Hispanic 53% (104) 27% (52) 20% (40) 196
Continued on next page
Page 60
60
Morning ConsultTable POL1_10
Table POL1_10: Who do you trust more to handle each of the following issues?Gun policy
Demographic Democrats in CongressRepublicans in
CongressDon’t know / No
opinion Total N
Registered Voters 40% (805) 43% (846) 17% (339) 1990Ethnicity: Black 62% (151) 16% (39) 21% (52) 243Ethnicity: Other 48% (79) 26% (42) 26% (42) 163All Christian 36% (350) 51% (488) 13% (125) 964All Non-Christian 61% (74) 22% (26) 18% (21) 121Atheist 67% (49) 22% (16) 10% (8) 73Agnostic/Nothing in particular 43% (213) 34% (170) 23% (113) 495Something Else 35% (119) 43% (146) 21% (72) 337Religious Non-Protestant/Catholic 54% (76) 28% (39) 18% (25) 140Evangelical 32% (174) 58% (316) 10% (57) 547Non-Evangelical 40% (288) 42% (299) 19% (134) 721Community: Urban 54% (285) 27% (145) 19% (99) 529Community: Suburban 40% (396) 45% (444) 16% (158) 998Community: Rural 27% (124) 55% (257) 18% (82) 464Employ: Private Sector 42% (261) 42% (258) 16% (102) 622Employ: Government 29% (37) 52% (66) 19% (25) 129Employ: Self-Employed 43% (67) 41% (64) 17% (26) 157Employ: Homemaker 31% (40) 49% (61) 20% (26) 127Employ: Retired 42% (247) 46% (269) 11% (66) 581Employ: Unemployed 42% (91) 36% (77) 22% (46) 215Employ: Other 36% (40) 33% (37) 31% (35) 113Military HH: Yes 34% (122) 54% (194) 13% (45) 361Military HH: No 42% (683) 40% (651) 18% (294) 1629RD/WT: Right Direction 70% (660) 14% (127) 16% (154) 941RD/WT: Wrong Track 14% (145) 69% (718) 18% (185) 1049Biden Job Approve 71% (736) 14% (141) 15% (160) 1037Biden Job Disapprove 6% (56) 79% (679) 14% (123) 857Biden Job Strongly Approve 82% (449) 8% (44) 10% (55) 548Biden Job Somewhat Approve 59% (287) 20% (97) 22% (105) 489Biden Job Somewhat Disapprove 16% (36) 60% (133) 24% (54) 223Biden Job Strongly Disapprove 3% (20) 86% (545) 11% (69) 634
Continued on next page
Page 61
National Tracking Poll #210636, June, 2021
61
Table POL1_10
Table POL1_10: Who do you trust more to handle each of the following issues?Gun policy
Demographic Democrats in CongressRepublicans in
CongressDon’t know / No
opinion Total N
Registered Voters 40% (805) 43% (846) 17% (339) 1990Favorable of Biden 71% (745) 14% (142) 15% (161) 1048Unfavorable of Biden 6% (47) 80% (682) 15% (126) 855Very Favorable of Biden 83% (495) 7% (43) 9% (55) 593Somewhat Favorable of Biden 55% (250) 22% (99) 23% (106) 455Somewhat Unfavorable of Biden 15% (29) 55% (106) 29% (55) 190Very Unfavorable of Biden 3% (18) 87% (576) 11% (70) 664#1 Issue: Economy 33% (251) 48% (366) 19% (147) 763#1 Issue: Security 18% (62) 72% (251) 10% (37) 349#1 Issue: Health Care 59% (137) 24% (55) 17% (41) 233#1 Issue: Medicare / Social Security 53% (138) 32% (84) 15% (38) 261#1 Issue: Women’s Issues 62% (64) 16% (16) 22% (23) 103#1 Issue: Education 53% (45) 26% (22) 22% (18) 86#1 Issue: Energy 57% (49) 21% (18) 21% (18) 86#1 Issue: Other 54% (58) 31% (34) 15% (17) 1092020 Vote: Joe Biden 77% (691) 9% (76) 14% (130) 8972020 Vote: Donald Trump 6% (51) 81% (666) 12% (101) 8182020 Vote: Didn’t Vote 24% (58) 37% (88) 39% (93) 2392018 House Vote: Democrat 79% (546) 9% (59) 12% (82) 6872018 House Vote: Republican 8% (53) 82% (563) 11% (74) 6902018 House Vote: Someone else 21% (10) 33% (16) 46% (23) 502016 Vote: Hillary Clinton 82% (520) 7% (45) 10% (66) 6312016 Vote: Donald Trump 10% (77) 78% (599) 12% (91) 7682016 Vote: Other 31% (34) 40% (43) 28% (30) 1072016 Vote: Didn’t Vote 36% (174) 33% (158) 31% (152) 483Voted in 2014: Yes 43% (552) 45% (585) 12% (161) 1297Voted in 2014: No 37% (253) 38% (261) 26% (178) 6934-Region: Northeast 49% (170) 34% (117) 16% (57) 3444-Region: Midwest 39% (179) 45% (206) 15% (70) 4554-Region: South 36% (269) 47% (356) 17% (130) 7554-Region: West 43% (186) 38% (167) 19% (82) 435
Continued on next page
Page 62
62
Morning ConsultTable POL1_10
Table POL1_10: Who do you trust more to handle each of the following issues?Gun policy
Demographic Democrats in CongressRepublicans in
CongressDon’t know / No
opinion Total N
Registered Voters 40% (805) 43% (846) 17% (339) 1990Party: Democrat/Leans Democrat 77% (688) 9% (81) 13% (119) 888Party: Republican/Leans Republican 7% (59) 81% (658) 12% (96) 814Note: Row proportions may total to larger than one-hundred percent due to rounding. For more information visit MorningConsultIntelligence.com.
Page 63
National Tracking Poll #210636, June, 2021
63
Table POL1_11
Table POL1_11: Who do you trust more to handle each of the following issues?Protecting Medicare and Social Security
Demographic Democrats in CongressRepublicans in
CongressDon’t know / No
opinion Total N
Registered Voters 46% (918) 34% (680) 20% (392) 1990Gender: Male 48% (448) 34% (313) 18% (166) 927Gender: Female 44% (470) 34% (367) 21% (226) 1063Age: 18-34 50% (230) 23% (105) 26% (121) 456Age: 35-44 47% (140) 34% (102) 19% (58) 300Age: 45-64 41% (297) 38% (280) 21% (152) 730Age: 65+ 50% (251) 38% (192) 12% (61) 504GenZers: 1997-2012 49% (83) 18% (30) 33% (56) 169Millennials: 1981-1996 48% (231) 31% (148) 21% (100) 480GenXers: 1965-1980 44% (233) 33% (171) 23% (121) 525Baby Boomers: 1946-1964 46% (341) 40% (301) 14% (104) 746PID: Dem (no lean) 85% (637) 5% (34) 11% (80) 752PID: Ind (no lean) 37% (211) 29% (170) 34% (197) 578PID: Rep (no lean) 11% (70) 72% (476) 17% (115) 661PID/Gender: DemMen 84% (302) 5% (19) 11% (38) 359PID/Gender: DemWomen 85% (336) 4% (15) 11% (42) 393PID/Gender: Ind Men 38% (102) 35% (93) 27% (72) 267PID/Gender: Ind Women 35% (109) 25% (77) 40% (125) 311PID/Gender: Rep Men 15% (44) 67% (201) 19% (56) 301PID/Gender: Rep Women 7% (25) 77% (275) 16% (59) 360Ideo: Liberal (1-3) 80% (470) 8% (48) 12% (69) 587Ideo: Moderate (4) 54% (290) 21% (112) 25% (137) 539Ideo: Conservative (5-7) 17% (127) 67% (495) 16% (120) 742Educ: < College 40% (489) 36% (437) 24% (286) 1213Educ: Bachelors degree 54% (262) 30% (147) 16% (80) 489Educ: Post-grad 58% (167) 33% (95) 9% (26) 288Income: Under 50k 47% (466) 31% (312) 22% (214) 991Income: 50k-100k 44% (280) 36% (229) 20% (130) 640Income: 100k+ 48% (172) 39% (138) 13% (48) 359Ethnicity: White 41% (653) 40% (630) 19% (301) 1584Ethnicity: Hispanic 62% (121) 17% (34) 21% (41) 196
Continued on next page
Page 64
64
Morning ConsultTable POL1_11
Table POL1_11: Who do you trust more to handle each of the following issues?Protecting Medicare and Social Security
Demographic Democrats in CongressRepublicans in
CongressDon’t know / No
opinion Total N
Registered Voters 46% (918) 34% (680) 20% (392) 1990Ethnicity: Black 68% (165) 10% (24) 22% (54) 243Ethnicity: Other 62% (101) 16% (26) 23% (37) 163All Christian 42% (405) 44% (421) 14% (138) 964All Non-Christian 62% (75) 23% (28) 15% (18) 121Atheist 63% (47) 20% (15) 16% (12) 73Agnostic/Nothing in particular 51% (251) 22% (110) 27% (134) 495Something Else 42% (140) 31% (105) 27% (91) 337Religious Non-Protestant/Catholic 57% (80) 27% (38) 16% (22) 140Evangelical 34% (188) 48% (264) 17% (95) 547Non-Evangelical 48% (346) 34% (248) 18% (126) 721Community: Urban 61% (320) 21% (113) 18% (95) 529Community: Suburban 45% (449) 36% (361) 19% (188) 998Community: Rural 32% (149) 44% (206) 23% (109) 464Employ: Private Sector 47% (291) 35% (220) 18% (111) 622Employ: Government 43% (55) 35% (45) 22% (29) 129Employ: Self-Employed 45% (71) 30% (48) 24% (38) 157Employ: Homemaker 35% (45) 41% (52) 24% (30) 127Employ: Retired 47% (276) 39% (229) 13% (76) 581Employ: Unemployed 49% (106) 24% (51) 27% (57) 215Employ: Other 46% (52) 22% (25) 32% (37) 113Military HH: Yes 39% (142) 46% (166) 15% (53) 361Military HH: No 48% (776) 32% (514) 21% (338) 1629RD/WT: Right Direction 75% (711) 10% (92) 15% (139) 941RD/WT: Wrong Track 20% (208) 56% (588) 24% (253) 1049Biden Job Approve 78% (809) 9% (96) 13% (132) 1037Biden Job Disapprove 10% (90) 67% (573) 23% (194) 857Biden Job Strongly Approve 88% (483) 6% (33) 6% (32) 548Biden Job Somewhat Approve 67% (326) 13% (63) 20% (100) 489Biden Job Somewhat Disapprove 25% (57) 41% (92) 33% (75) 223Biden Job Strongly Disapprove 5% (33) 76% (482) 19% (119) 634
Continued on next page
Page 65
National Tracking Poll #210636, June, 2021
65
Table POL1_11
Table POL1_11: Who do you trust more to handle each of the following issues?Protecting Medicare and Social Security
Demographic Democrats in CongressRepublicans in
CongressDon’t know / No
opinion Total N
Registered Voters 46% (918) 34% (680) 20% (392) 1990Favorable of Biden 78% (814) 8% (89) 14% (145) 1048Unfavorable of Biden 10% (85) 68% (580) 22% (190) 855Very Favorable of Biden 89% (527) 5% (32) 6% (33) 593Somewhat Favorable of Biden 63% (286) 12% (56) 25% (112) 455Somewhat Unfavorable of Biden 25% (47) 40% (76) 36% (68) 190Very Unfavorable of Biden 6% (38) 76% (504) 18% (122) 664#1 Issue: Economy 40% (305) 36% (276) 24% (183) 763#1 Issue: Security 23% (80) 64% (222) 14% (47) 349#1 Issue: Health Care 65% (152) 18% (41) 17% (40) 233#1 Issue: Medicare / Social Security 62% (161) 24% (64) 14% (36) 261#1 Issue: Women’s Issues 62% (63) 11% (11) 27% (28) 103#1 Issue: Education 57% (49) 24% (21) 19% (16) 86#1 Issue: Energy 58% (50) 16% (14) 26% (22) 86#1 Issue: Other 54% (59) 28% (31) 18% (19) 1092020 Vote: Joe Biden 83% (747) 6% (55) 11% (96) 8972020 Vote: Donald Trump 9% (76) 70% (574) 20% (168) 8182020 Vote: Didn’t Vote 35% (83) 19% (46) 46% (110) 2392018 House Vote: Democrat 86% (589) 6% (41) 8% (57) 6872018 House Vote: Republican 13% (90) 70% (485) 17% (115) 6902018 House Vote: Someone else 25% (13) 11% (5) 64% (32) 502016 Vote: Hillary Clinton 86% (545) 5% (29) 9% (56) 6312016 Vote: Donald Trump 14% (105) 68% (523) 18% (139) 7682016 Vote: Other 56% (60) 19% (20) 26% (27) 1072016 Vote: Didn’t Vote 43% (207) 22% (107) 35% (169) 483Voted in 2014: Yes 48% (628) 38% (492) 14% (177) 1297Voted in 2014: No 42% (290) 27% (187) 31% (215) 6934-Region: Northeast 53% (181) 30% (104) 17% (59) 3444-Region: Midwest 47% (215) 35% (159) 18% (81) 4554-Region: South 41% (311) 38% (286) 21% (159) 7554-Region: West 49% (211) 30% (131) 21% (93) 435
Continued on next page
Page 66
66
Morning ConsultTable POL1_11
Table POL1_11: Who do you trust more to handle each of the following issues?Protecting Medicare and Social Security
Demographic Democrats in CongressRepublicans in
CongressDon’t know / No
opinion Total N
Registered Voters 46% (918) 34% (680) 20% (392) 1990Party: Democrat/Leans Democrat 84% (744) 5% (44) 11% (100) 888Party: Republican/Leans Republican 11% (91) 69% (560) 20% (163) 814Note: Row proportions may total to larger than one-hundred percent due to rounding. For more information visit MorningConsultIntelligence.com.
Page 67
National Tracking Poll #210636, June, 2021
67
Table POL1_12
Table POL1_12: Who do you trust more to handle each of the following issues?Coronavirus
Demographic Democrats in CongressRepublicans in
CongressDon’t know / No
opinion Total N
Registered Voters 47% (928) 30% (597) 23% (465) 1990Gender: Male 49% (457) 29% (271) 21% (199) 927Gender: Female 44% (471) 31% (326) 25% (266) 1063Age: 18-34 49% (225) 22% (99) 29% (132) 456Age: 35-44 46% (138) 30% (90) 24% (72) 300Age: 45-64 42% (308) 35% (254) 23% (168) 730Age: 65+ 51% (258) 30% (154) 18% (93) 504GenZers: 1997-2012 46% (78) 18% (31) 36% (61) 169Millennials: 1981-1996 48% (231) 28% (135) 24% (114) 480GenXers: 1965-1980 46% (241) 29% (153) 25% (130) 525Baby Boomers: 1946-1964 47% (351) 34% (252) 19% (143) 746PID: Dem (no lean) 86% (647) 4% (27) 10% (77) 752PID: Ind (no lean) 38% (218) 23% (133) 39% (227) 578PID: Rep (no lean) 10% (63) 66% (438) 24% (160) 661PID/Gender: DemMen 85% (304) 5% (18) 10% (37) 359PID/Gender: DemWomen 87% (343) 2% (9) 10% (40) 393PID/Gender: Ind Men 43% (115) 24% (65) 33% (88) 267PID/Gender: Ind Women 33% (103) 22% (68) 45% (140) 311PID/Gender: Rep Men 13% (38) 63% (189) 24% (74) 301PID/Gender: Rep Women 7% (25) 69% (248) 24% (86) 360Ideo: Liberal (1-3) 81% (479) 8% (44) 11% (65) 587Ideo: Moderate (4) 53% (286) 17% (93) 30% (159) 539Ideo: Conservative (5-7) 17% (129) 59% (435) 24% (178) 742Educ: < College 40% (487) 32% (388) 28% (338) 1213Educ: Bachelors degree 55% (270) 27% (133) 18% (86) 489Educ: Post-grad 59% (171) 27% (77) 14% (40) 288Income: Under 50k 45% (451) 27% (268) 28% (273) 991Income: 50k-100k 47% (301) 32% (206) 21% (133) 640Income: 100k+ 49% (177) 34% (123) 17% (59) 359Ethnicity: White 42% (667) 35% (559) 23% (359) 1584Ethnicity: Hispanic 58% (113) 15% (29) 27% (54) 196
Continued on next page
Page 68
68
Morning ConsultTable POL1_12
Table POL1_12: Who do you trust more to handle each of the following issues?Coronavirus
Demographic Democrats in CongressRepublicans in
CongressDon’t know / No
opinion Total N
Registered Voters 47% (928) 30% (597) 23% (465) 1990Ethnicity: Black 67% (162) 7% (18) 26% (63) 243Ethnicity: Other 61% (99) 13% (21) 26% (43) 163All Christian 42% (404) 38% (362) 21% (198) 964All Non-Christian 66% (80) 13% (16) 21% (26) 121Atheist 68% (50) 17% (13) 15% (11) 73Agnostic/Nothing in particular 52% (256) 20% (100) 28% (139) 495Something Else 41% (138) 32% (107) 27% (92) 337Religious Non-Protestant/Catholic 60% (84) 18% (26) 22% (31) 140Evangelical 33% (182) 46% (250) 21% (115) 547Non-Evangelical 48% (349) 28% (204) 23% (167) 721Community: Urban 61% (325) 17% (92) 21% (112) 529Community: Suburban 46% (459) 33% (327) 21% (212) 998Community: Rural 31% (145) 38% (178) 30% (141) 464Employ: Private Sector 50% (311) 30% (187) 20% (123) 622Employ: Government 44% (56) 28% (36) 29% (37) 129Employ: Self-Employed 47% (74) 28% (44) 25% (39) 157Employ: Homemaker 33% (41) 43% (54) 25% (31) 127Employ: Retired 48% (280) 33% (190) 19% (111) 581Employ: Unemployed 44% (95) 21% (46) 34% (74) 215Employ: Other 41% (46) 27% (31) 32% (36) 113Military HH: Yes 39% (140) 38% (138) 23% (84) 361Military HH: No 48% (788) 28% (459) 23% (381) 1629RD/WT: Right Direction 78% (736) 6% (59) 16% (146) 941RD/WT: Wrong Track 18% (192) 51% (538) 30% (318) 1049Biden Job Approve 80% (834) 6% (61) 14% (142) 1037Biden Job Disapprove 9% (81) 61% (524) 29% (252) 857Biden Job Strongly Approve 89% (486) 5% (25) 7% (37) 548Biden Job Somewhat Approve 71% (348) 7% (36) 21% (105) 489Biden Job Somewhat Disapprove 24% (55) 35% (78) 41% (91) 223Biden Job Strongly Disapprove 4% (26) 70% (446) 25% (161) 634
Continued on next page
Page 69
National Tracking Poll #210636, June, 2021
69
Table POL1_12
Table POL1_12: Who do you trust more to handle each of the following issues?Coronavirus
Demographic Democrats in CongressRepublicans in
CongressDon’t know / No
opinion Total N
Registered Voters 47% (928) 30% (597) 23% (465) 1990Favorable of Biden 81% (850) 5% (53) 14% (146) 1048Unfavorable of Biden 8% (71) 62% (534) 29% (250) 855Very Favorable of Biden 91% (538) 4% (23) 5% (32) 593Somewhat Favorable of Biden 68% (312) 6% (29) 25% (114) 455Somewhat Unfavorable of Biden 22% (42) 36% (69) 42% (79) 190Very Unfavorable of Biden 4% (29) 70% (465) 26% (171) 664#1 Issue: Economy 40% (306) 33% (253) 27% (204) 763#1 Issue: Security 22% (76) 55% (192) 23% (82) 349#1 Issue: Health Care 66% (154) 17% (40) 17% (39) 233#1 Issue: Medicare / Social Security 63% (164) 21% (55) 16% (42) 261#1 Issue: Women’s Issues 68% (70) 9% (9) 23% (24) 103#1 Issue: Education 58% (50) 17% (15) 25% (21) 86#1 Issue: Energy 60% (52) 13% (12) 26% (23) 86#1 Issue: Other 52% (57) 20% (22) 28% (30) 1092020 Vote: Joe Biden 87% (776) 3% (29) 10% (92) 8972020 Vote: Donald Trump 9% (71) 62% (511) 29% (236) 8182020 Vote: Didn’t Vote 30% (72) 21% (50) 49% (117) 2392018 House Vote: Democrat 88% (605) 3% (20) 9% (62) 6872018 House Vote: Republican 12% (83) 64% (442) 24% (165) 6902018 House Vote: Someone else 28% (14) 10% (5) 61% (31) 502016 Vote: Hillary Clinton 88% (553) 4% (24) 9% (54) 6312016 Vote: Donald Trump 14% (107) 59% (452) 27% (209) 7682016 Vote: Other 52% (56) 15% (17) 32% (35) 1072016 Vote: Didn’t Vote 44% (212) 22% (105) 34% (167) 483Voted in 2014: Yes 50% (642) 32% (422) 18% (233) 1297Voted in 2014: No 41% (286) 25% (176) 33% (231) 6934-Region: Northeast 55% (188) 25% (86) 20% (70) 3444-Region: Midwest 49% (224) 27% (124) 23% (107) 4554-Region: South 40% (301) 37% (277) 23% (177) 7554-Region: West 49% (215) 25% (109) 25% (111) 435
Continued on next page
Page 70
70
Morning ConsultTable POL1_12
Table POL1_12: Who do you trust more to handle each of the following issues?Coronavirus
Demographic Democrats in CongressRepublicans in
CongressDon’t know / No
opinion Total N
Registered Voters 47% (928) 30% (597) 23% (465) 1990Party: Democrat/Leans Democrat 86% (762) 3% (30) 11% (96) 888Party: Republican/Leans Republican 10% (80) 63% (510) 28% (224) 814Note: Row proportions may total to larger than one-hundred percent due to rounding. For more information visit MorningConsultIntelligence.com.
Page 71
National Tracking Poll #210636, June, 2021
71
Table POL1_13
Table POL1_13: Who do you trust more to handle each of the following issues?Voting rights
Demographic Democrats in CongressRepublicans in
CongressDon’t know / No
opinion Total N
Registered Voters 45% (895) 38% (751) 17% (344) 1990Gender: Male 46% (429) 38% (354) 16% (144) 927Gender: Female 44% (466) 37% (397) 19% (200) 1063Age: 18-34 47% (213) 28% (129) 25% (114) 456Age: 35-44 49% (147) 35% (104) 16% (49) 300Age: 45-64 40% (294) 42% (309) 17% (127) 730Age: 65+ 48% (241) 42% (210) 11% (53) 504GenZers: 1997-2012 40% (67) 27% (46) 33% (56) 169Millennials: 1981-1996 48% (233) 34% (161) 18% (86) 480GenXers: 1965-1980 45% (238) 35% (183) 20% (104) 525Baby Boomers: 1946-1964 44% (327) 44% (331) 12% (88) 746PID: Dem (no lean) 85% (640) 6% (43) 9% (69) 752PID: Ind (no lean) 35% (202) 34% (197) 31% (179) 578PID: Rep (no lean) 8% (54) 77% (511) 14% (96) 661PID/Gender: DemMen 84% (302) 7% (26) 9% (31) 359PID/Gender: DemWomen 86% (338) 4% (17) 10% (38) 393PID/Gender: Ind Men 36% (95) 40% (107) 24% (65) 267PID/Gender: Ind Women 34% (107) 29% (90) 37% (115) 311PID/Gender: Rep Men 11% (32) 73% (221) 16% (48) 301PID/Gender: Rep Women 6% (22) 81% (291) 13% (47) 360Ideo: Liberal (1-3) 81% (477) 8% (49) 10% (61) 587Ideo: Moderate (4) 54% (289) 23% (126) 23% (124) 539Ideo: Conservative (5-7) 13% (95) 74% (548) 13% (100) 742Educ: < College 39% (475) 40% (480) 21% (258) 1213Educ: Bachelors degree 53% (258) 35% (172) 12% (58) 489Educ: Post-grad 56% (162) 34% (99) 10% (28) 288Income: Under 50k 44% (438) 35% (346) 21% (207) 991Income: 50k-100k 44% (282) 40% (257) 16% (100) 640Income: 100k+ 49% (175) 41% (148) 10% (37) 359Ethnicity: White 40% (634) 43% (687) 17% (263) 1584Ethnicity: Hispanic 58% (114) 24% (47) 18% (35) 196
Continued on next page
Page 72
72
Morning ConsultTable POL1_13
Table POL1_13: Who do you trust more to handle each of the following issues?Voting rights
Demographic Democrats in CongressRepublicans in
CongressDon’t know / No
opinion Total N
Registered Voters 45% (895) 38% (751) 17% (344) 1990Ethnicity: Black 68% (166) 11% (26) 21% (51) 243Ethnicity: Other 58% (95) 23% (38) 19% (30) 163All Christian 39% (377) 48% (460) 13% (126) 964All Non-Christian 60% (73) 22% (26) 18% (22) 121Atheist 65% (48) 18% (13) 17% (12) 73Agnostic/Nothing in particular 52% (259) 24% (118) 24% (118) 495Something Else 41% (139) 39% (133) 19% (65) 337Religious Non-Protestant/Catholic 54% (76) 28% (39) 18% (26) 140Evangelical 32% (174) 56% (305) 12% (68) 547Non-Evangelical 46% (334) 37% (270) 16% (117) 721Community: Urban 61% (323) 23% (124) 16% (82) 529Community: Suburban 43% (431) 40% (399) 17% (168) 998Community: Rural 30% (141) 49% (228) 20% (94) 464Employ: Private Sector 48% (299) 37% (232) 15% (91) 622Employ: Government 40% (51) 42% (54) 18% (23) 129Employ: Self-Employed 45% (70) 37% (58) 18% (29) 157Employ: Homemaker 31% (40) 49% (62) 20% (25) 127Employ: Retired 46% (265) 42% (244) 12% (72) 581Employ: Unemployed 48% (103) 25% (54) 27% (58) 215Employ: Other 40% (45) 29% (33) 31% (35) 113Military HH: Yes 37% (135) 48% (172) 15% (55) 361Military HH: No 47% (760) 36% (579) 18% (289) 1629RD/WT: Right Direction 76% (715) 10% (92) 14% (134) 941RD/WT: Wrong Track 17% (180) 63% (659) 20% (210) 1049Biden Job Approve 78% (811) 9% (96) 13% (131) 1037Biden Job Disapprove 8% (69) 74% (636) 18% (152) 857Biden Job Strongly Approve 87% (477) 6% (34) 7% (37) 548Biden Job Somewhat Approve 68% (333) 13% (62) 19% (94) 489Biden Job Somewhat Disapprove 23% (50) 48% (106) 30% (67) 223Biden Job Strongly Disapprove 3% (19) 84% (530) 13% (85) 634
Continued on next page
Page 73
National Tracking Poll #210636, June, 2021
73
Table POL1_13
Table POL1_13: Who do you trust more to handle each of the following issues?Voting rights
Demographic Democrats in CongressRepublicans in
CongressDon’t know / No
opinion Total N
Registered Voters 45% (895) 38% (751) 17% (344) 1990Favorable of Biden 78% (816) 9% (93) 13% (140) 1048Unfavorable of Biden 8% (66) 75% (644) 17% (145) 855Very Favorable of Biden 89% (525) 5% (32) 6% (35) 593Somewhat Favorable of Biden 64% (290) 13% (61) 23% (104) 455Somewhat Unfavorable of Biden 22% (41) 48% (91) 31% (58) 190Very Unfavorable of Biden 4% (25) 83% (553) 13% (87) 664#1 Issue: Economy 37% (283) 42% (323) 21% (158) 763#1 Issue: Security 22% (76) 66% (232) 12% (41) 349#1 Issue: Health Care 65% (152) 20% (47) 15% (35) 233#1 Issue: Medicare / Social Security 59% (154) 29% (76) 12% (31) 261#1 Issue: Women’s Issues 64% (65) 12% (12) 25% (25) 103#1 Issue: Education 61% (52) 23% (20) 16% (14) 86#1 Issue: Energy 63% (54) 12% (10) 25% (22) 86#1 Issue: Other 54% (59) 29% (32) 17% (18) 1092020 Vote: Joe Biden 84% (750) 6% (57) 10% (91) 8972020 Vote: Donald Trump 7% (58) 77% (632) 16% (128) 8182020 Vote: Didn’t Vote 32% (76) 23% (54) 45% (108) 2392018 House Vote: Democrat 87% (594) 5% (37) 8% (55) 6872018 House Vote: Republican 9% (65) 78% (535) 13% (89) 6902018 House Vote: Someone else 27% (14) 19% (10) 53% (27) 502016 Vote: Hillary Clinton 87% (548) 6% (35) 8% (48) 6312016 Vote: Donald Trump 11% (88) 73% (562) 15% (117) 7682016 Vote: Other 51% (55) 21% (23) 28% (30) 1072016 Vote: Didn’t Vote 42% (204) 27% (131) 31% (149) 483Voted in 2014: Yes 47% (615) 41% (534) 11% (148) 1297Voted in 2014: No 40% (280) 31% (217) 28% (196) 6934-Region: Northeast 53% (183) 31% (108) 15% (53) 3444-Region: Midwest 46% (209) 36% (166) 18% (81) 4554-Region: South 40% (305) 43% (324) 17% (127) 7554-Region: West 46% (199) 35% (153) 19% (84) 435
Continued on next page
Page 74
74
Morning ConsultTable POL1_13
Table POL1_13: Who do you trust more to handle each of the following issues?Voting rights
Demographic Democrats in CongressRepublicans in
CongressDon’t know / No
opinion Total N
Registered Voters 45% (895) 38% (751) 17% (344) 1990Party: Democrat/Leans Democrat 85% (751) 6% (51) 10% (86) 888Party: Republican/Leans Republican 9% (69) 76% (620) 15% (124) 814Note: Row proportions may total to larger than one-hundred percent due to rounding. For more information visit MorningConsultIntelligence.com.
Page 75
National Tracking Poll #210636, June, 2021
75
Table POL2_1
Table POL2_1: How important of a priority should each of the following be for Congress?Passing a healthcare reform bill
Demographic A top priority
An important,but lowerpriority
Not tooimportant apriority
Should not bedone
Don’t know /No opinion Total N
Registered Voters 41% (817) 30% (605) 12% (234) 7% (142) 10% (192) 1990Gender: Male 36% (337) 35% (324) 13% (125) 8% (70) 8% (72) 927Gender: Female 45% (480) 26% (281) 10% (109) 7% (72) 11% (120) 1063Age: 18-34 39% (180) 27% (122) 9% (43) 7% (31) 18% (81) 456Age: 35-44 43% (130) 30% (91) 10% (31) 6% (19) 10% (29) 300Age: 45-64 42% (305) 32% (233) 13% (93) 7% (51) 7% (48) 730Age: 65+ 40% (202) 32% (159) 13% (67) 8% (41) 7% (34) 504GenZers: 1997-2012 36% (61) 19% (33) 13% (21) 6% (9) 27% (45) 169Millennials: 1981-1996 42% (201) 31% (151) 9% (42) 7% (34) 11% (52) 480GenXers: 1965-1980 42% (222) 30% (158) 12% (65) 6% (32) 9% (48) 525Baby Boomers: 1946-1964 41% (307) 33% (245) 12% (92) 8% (60) 6% (42) 746PID: Dem (no lean) 56% (421) 29% (222) 6% (44) 3% (22) 6% (42) 752PID: Ind (no lean) 36% (206) 30% (176) 13% (75) 7% (38) 14% (83) 578PID: Rep (no lean) 29% (190) 31% (207) 17% (115) 12% (82) 10% (67) 661PID/Gender: DemMen 53% (190) 33% (120) 6% (22) 3% (11) 5% (16) 359PID/Gender: DemWomen 59% (231) 26% (101) 6% (23) 3% (11) 7% (26) 393PID/Gender: Ind Men 32% (86) 33% (89) 16% (44) 7% (20) 11% (28) 267PID/Gender: Ind Women 39% (120) 28% (87) 10% (31) 6% (18) 18% (55) 311PID/Gender: Rep Men 20% (61) 38% (115) 20% (59) 13% (39) 9% (28) 301PID/Gender: Rep Women 36% (129) 26% (93) 15% (56) 12% (43) 11% (40) 360Ideo: Liberal (1-3) 55% (322) 30% (174) 7% (41) 2% (14) 6% (37) 587Ideo: Moderate (4) 43% (234) 30% (163) 11% (60) 5% (27) 10% (55) 539Ideo: Conservative (5-7) 30% (224) 32% (240) 17% (127) 13% (95) 8% (56) 742Educ: < College 41% (493) 29% (357) 10% (124) 8% (92) 12% (147) 1213Educ: Bachelors degree 43% (209) 32% (155) 13% (66) 6% (29) 6% (30) 489Educ: Post-grad 40% (116) 32% (93) 15% (44) 7% (21) 5% (15) 288Income: Under 50k 43% (428) 29% (285) 9% (91) 7% (73) 12% (114) 991Income: 50k-100k 39% (250) 32% (203) 15% (96) 6% (39) 8% (52) 640Income: 100k+ 39% (139) 33% (117) 13% (47) 8% (29) 7% (26) 359Ethnicity: White 39% (622) 30% (483) 13% (206) 8% (120) 10% (153) 1584
Continued on next page
Page 76
76
Morning ConsultTable POL2_1
Table POL2_1: How important of a priority should each of the following be for Congress?Passing a healthcare reform bill
Demographic A top priority
An important,but lowerpriority
Not tooimportant apriority
Should not bedone
Don’t know /No opinion Total N
Registered Voters 41% (817) 30% (605) 12% (234) 7% (142) 10% (192) 1990Ethnicity: Hispanic 44% (87) 23% (46) 10% (19) 8% (15) 15% (29) 196Ethnicity: Black 52% (125) 27% (66) 6% (14) 5% (11) 10% (25) 243Ethnicity: Other 43% (70) 34% (56) 8% (13) 6% (10) 8% (14) 163All Christian 38% (365) 33% (318) 14% (131) 8% (81) 7% (69) 964All Non-Christian 50% (60) 25% (30) 9% (11) 5% (6) 11% (14) 121Atheist 45% (33) 29% (22) 8% (6) 10% (8) 7% (5) 73Agnostic/Nothing in particular 42% (209) 30% (148) 10% (48) 5% (27) 13% (64) 495Something Else 44% (150) 26% (88) 11% (38) 6% (21) 12% (40) 337Religious Non-Protestant/Catholic 45% (64) 30% (42) 8% (12) 5% (8) 11% (16) 140Evangelical 41% (223) 29% (156) 12% (68) 10% (53) 9% (48) 547Non-Evangelical 40% (286) 32% (232) 14% (98) 6% (47) 8% (58) 721Community: Urban 49% (258) 28% (148) 12% (65) 4% (20) 7% (38) 529Community: Suburban 38% (383) 31% (314) 11% (114) 8% (83) 11% (105) 998Community: Rural 38% (176) 31% (144) 12% (55) 9% (40) 11% (49) 464Employ: Private Sector 42% (261) 31% (191) 12% (74) 7% (41) 9% (54) 622Employ: Government 38% (49) 29% (37) 16% (21) 7% (9) 10% (13) 129Employ: Self-Employed 43% (68) 34% (54) 9% (14) 8% (13) 5% (8) 157Employ: Homemaker 40% (51) 31% (40) 13% (17) 6% (8) 9% (12) 127Employ: Retired 42% (241) 32% (187) 12% (70) 8% (46) 6% (36) 581Employ: Unemployed 38% (81) 30% (64) 9% (19) 7% (15) 17% (37) 215Employ: Other 43% (48) 22% (25) 11% (13) 6% (7) 18% (21) 113Military HH: Yes 37% (132) 32% (115) 14% (51) 8% (30) 9% (33) 361Military HH: No 42% (685) 30% (490) 11% (183) 7% (112) 10% (159) 1629RD/WT: Right Direction 52% (492) 30% (283) 7% (65) 3% (26) 8% (75) 941RD/WT: Wrong Track 31% (325) 31% (322) 16% (168) 11% (115) 11% (117) 1049Biden Job Approve 53% (553) 31% (323) 7% (69) 3% (27) 6% (65) 1037Biden Job Disapprove 28% (241) 30% (260) 19% (161) 13% (113) 9% (81) 857
Continued on next page
Page 77
National Tracking Poll #210636, June, 2021
77
Table POL2_1
Table POL2_1: How important of a priority should each of the following be for Congress?Passing a healthcare reform bill
Demographic A top priority
An important,but lowerpriority
Not tooimportant apriority
Should not bedone
Don’t know /No opinion Total N
Registered Voters 41% (817) 30% (605) 12% (234) 7% (142) 10% (192) 1990Biden Job Strongly Approve 59% (323) 28% (153) 5% (29) 2% (11) 6% (32) 548Biden Job Somewhat Approve 47% (231) 35% (170) 8% (40) 3% (15) 7% (33) 489Biden Job Somewhat Disapprove 41% (91) 31% (70) 13% (28) 7% (15) 8% (18) 223Biden Job Strongly Disapprove 24% (150) 30% (190) 21% (133) 15% (98) 10% (63) 634Favorable of Biden 53% (561) 31% (330) 6% (68) 2% (25) 6% (65) 1048Unfavorable of Biden 28% (239) 30% (257) 19% (161) 13% (110) 10% (87) 855Very Favorable of Biden 59% (352) 28% (165) 5% (30) 3% (17) 5% (28) 593Somewhat Favorable of Biden 46% (209) 36% (165) 8% (38) 2% (7) 8% (37) 455Somewhat Unfavorable of Biden 40% (76) 32% (62) 12% (23) 5% (9) 11% (21) 190Very Unfavorable of Biden 25% (163) 29% (195) 21% (138) 15% (102) 10% (66) 664#1 Issue: Economy 37% (284) 33% (254) 12% (88) 8% (61) 10% (76) 763#1 Issue: Security 25% (88) 32% (113) 18% (64) 14% (50) 10% (34) 349#1 Issue: Health Care 68% (157) 20% (46) 6% (15) 1% (3) 5% (12) 233#1 Issue: Medicare / Social Security 47% (123) 32% (83) 11% (28) 4% (9) 7% (18) 261#1 Issue: Women’s Issues 51% (52) 18% (18) 7% (7) 6% (6) 19% (19) 103#1 Issue: Education 49% (42) 24% (21) 14% (12) 1% (1) 12% (10) 86#1 Issue: Energy 33% (28) 44% (38) 8% (7) 1% (1) 14% (12) 86#1 Issue: Other 39% (43) 30% (33) 11% (12) 10% (11) 10% (11) 1092020 Vote: Joe Biden 56% (502) 29% (264) 6% (52) 3% (26) 6% (53) 8972020 Vote: Donald Trump 27% (221) 33% (266) 19% (152) 12% (102) 10% (78) 8182020 Vote: Didn’t Vote 35% (83) 27% (63) 10% (24) 5% (13) 23% (56) 2392018 House Vote: Democrat 58% (396) 30% (208) 6% (40) 3% (18) 4% (26) 6872018 House Vote: Republican 28% (194) 32% (219) 18% (126) 13% (90) 9% (61) 6902018 House Vote: Someone else 41% (21) 22% (11) 9% (5) 12% (6) 15% (8) 502016 Vote: Hillary Clinton 57% (361) 30% (192) 6% (36) 3% (17) 4% (25) 6312016 Vote: Donald Trump 28% (211) 33% (252) 18% (138) 12% (90) 10% (77) 7682016 Vote: Other 45% (48) 34% (36) 10% (10) 6% (6) 6% (7) 1072016 Vote: Didn’t Vote 41% (197) 26% (125) 10% (49) 6% (29) 17% (83) 483
Continued on next page
Page 78
78
Morning ConsultTable POL2_1
Table POL2_1: How important of a priority should each of the following be for Congress?Passing a healthcare reform bill
Demographic A top priority
An important,but lowerpriority
Not tooimportant apriority
Should not bedone
Don’t know /No opinion Total N
Registered Voters 41% (817) 30% (605) 12% (234) 7% (142) 10% (192) 1990Voted in 2014: Yes 43% (560) 30% (394) 12% (161) 8% (98) 6% (84) 1297Voted in 2014: No 37% (257) 30% (211) 11% (73) 6% (44) 16% (108) 6934-Region: Northeast 47% (161) 29% (99) 12% (41) 5% (16) 8% (28) 3444-Region: Midwest 41% (188) 34% (155) 12% (53) 7% (31) 6% (29) 4554-Region: South 39% (292) 30% (224) 11% (82) 9% (69) 12% (88) 7554-Region: West 41% (177) 29% (127) 14% (59) 6% (26) 11% (46) 435Party: Democrat/Leans Democrat 55% (493) 31% (273) 5% (49) 3% (24) 6% (49) 888Party: Republican/Leans Republican 28% (225) 33% (265) 18% (144) 12% (97) 10% (84) 814Note: Row proportions may total to larger than one-hundred percent due to rounding. For more information visit MorningConsultIntelligence.com.
Page 79
National Tracking Poll #210636, June, 2021
79
Table POL2_2
Table POL2_2: How important of a priority should each of the following be for Congress?Passing a bill to address climate change and its effects
Demographic A top priority
An important,but lowerpriority
Not tooimportant apriority
Should not bedone
Don’t know /No opinion Total N
Registered Voters 33% (651) 28% (550) 16% (320) 16% (312) 8% (157) 1990Gender: Male 33% (303) 30% (274) 15% (135) 17% (159) 6% (56) 927Gender: Female 33% (348) 26% (275) 17% (185) 14% (154) 9% (101) 1063Age: 18-34 38% (174) 29% (130) 13% (59) 7% (31) 14% (62) 456Age: 35-44 36% (107) 27% (80) 15% (45) 12% (37) 10% (31) 300Age: 45-64 27% (196) 31% (224) 17% (127) 19% (137) 6% (46) 730Age: 65+ 35% (174) 23% (115) 18% (89) 21% (108) 3% (17) 504GenZers: 1997-2012 37% (63) 28% (48) 9% (16) 6% (10) 19% (33) 169Millennials: 1981-1996 37% (176) 28% (136) 15% (73) 10% (47) 10% (49) 480GenXers: 1965-1980 28% (149) 31% (162) 16% (86) 15% (77) 10% (51) 525Baby Boomers: 1946-1964 33% (246) 25% (184) 18% (131) 22% (164) 3% (21) 746PID: Dem (no lean) 54% (403) 31% (231) 9% (66) 2% (14) 5% (37) 752PID: Ind (no lean) 29% (167) 28% (164) 15% (85) 17% (97) 11% (65) 578PID: Rep (no lean) 12% (81) 23% (155) 25% (168) 31% (202) 8% (55) 661PID/Gender: DemMen 54% (193) 32% (114) 7% (25) 4% (13) 4% (14) 359PID/Gender: DemWomen 53% (210) 30% (117) 11% (42) — (1) 6% (23) 393PID/Gender: Ind Men 28% (75) 29% (79) 14% (38) 21% (55) 8% (21) 267PID/Gender: Ind Women 29% (92) 27% (85) 15% (48) 13% (42) 14% (44) 311PID/Gender: Rep Men 11% (34) 27% (82) 24% (73) 30% (90) 7% (21) 301PID/Gender: Rep Women 13% (47) 20% (73) 26% (95) 31% (111) 9% (33) 360Ideo: Liberal (1-3) 60% (351) 27% (160) 8% (48) 2% (10) 3% (18) 587Ideo: Moderate (4) 32% (175) 34% (183) 15% (82) 8% (42) 11% (57) 539Ideo: Conservative (5-7) 13% (97) 23% (172) 25% (182) 34% (251) 5% (41) 742Educ: < College 29% (355) 28% (345) 17% (204) 15% (182) 10% (126) 1213Educ: Bachelors degree 38% (184) 25% (125) 16% (76) 17% (82) 4% (22) 489Educ: Post-grad 39% (112) 28% (80) 14% (40) 17% (48) 3% (9) 288Income: Under 50k 33% (326) 26% (263) 17% (167) 14% (137) 10% (98) 991Income: 50k-100k 32% (204) 27% (174) 16% (105) 18% (115) 7% (42) 640Income: 100k+ 34% (121) 31% (113) 13% (48) 17% (60) 5% (17) 359Ethnicity: White 31% (490) 27% (423) 17% (275) 18% (282) 7% (113) 1584
Continued on next page
Page 80
80
Morning ConsultTable POL2_2
Table POL2_2: How important of a priority should each of the following be for Congress?Passing a bill to address climate change and its effects
Demographic A top priority
An important,but lowerpriority
Not tooimportant apriority
Should not bedone
Don’t know /No opinion Total N
Registered Voters 33% (651) 28% (550) 16% (320) 16% (312) 8% (157) 1990Ethnicity: Hispanic 42% (82) 30% (58) 9% (17) 8% (16) 12% (23) 196Ethnicity: Black 39% (95) 31% (75) 11% (27) 6% (14) 13% (32) 243Ethnicity: Other 40% (66) 32% (52) 11% (18) 10% (17) 7% (11) 163All Christian 27% (258) 27% (264) 19% (184) 21% (199) 6% (59) 964All Non-Christian 48% (58) 25% (30) 12% (14) 5% (6) 11% (13) 121Atheist 56% (41) 21% (16) 6% (4) 13% (9) 4% (3) 73Agnostic/Nothing in particular 39% (191) 29% (142) 13% (62) 11% (54) 9% (45) 495Something Else 30% (103) 29% (98) 16% (55) 13% (44) 11% (36) 337Religious Non-Protestant/Catholic 44% (61) 26% (36) 14% (20) 6% (8) 11% (16) 140Evangelical 23% (123) 25% (137) 19% (104) 26% (140) 8% (43) 547Non-Evangelical 32% (232) 30% (215) 18% (127) 14% (100) 6% (47) 721Community: Urban 44% (233) 29% (152) 13% (71) 7% (38) 7% (35) 529Community: Suburban 31% (306) 27% (268) 17% (167) 18% (178) 8% (79) 998Community: Rural 24% (113) 28% (130) 18% (83) 21% (96) 9% (42) 464Employ: Private Sector 32% (199) 31% (192) 17% (103) 15% (96) 5% (33) 622Employ: Government 28% (36) 27% (35) 18% (24) 13% (17) 13% (17) 129Employ: Self-Employed 38% (60) 32% (50) 14% (21) 12% (18) 5% (8) 157Employ: Homemaker 26% (33) 20% (25) 15% (19) 24% (30) 15% (19) 127Employ: Retired 33% (191) 26% (149) 17% (101) 21% (120) 3% (19) 581Employ: Unemployed 36% (77) 27% (58) 15% (33) 9% (19) 13% (28) 215Employ: Other 32% (36) 25% (28) 14% (15) 7% (8) 23% (26) 113Military HH: Yes 24% (87) 29% (105) 20% (73) 21% (75) 6% (22) 361Military HH: No 35% (565) 27% (445) 15% (247) 15% (237) 8% (134) 1629RD/WT: Right Direction 51% (477) 29% (277) 10% (94) 3% (29) 7% (64) 941RD/WT: Wrong Track 17% (174) 26% (273) 22% (226) 27% (283) 9% (92) 1049Biden Job Approve 52% (541) 30% (316) 10% (104) 2% (24) 5% (52) 1037Biden Job Disapprove 11% (91) 25% (213) 24% (209) 33% (283) 7% (62) 857
Continued on next page
Page 81
National Tracking Poll #210636, June, 2021
81
Table POL2_2
Table POL2_2: How important of a priority should each of the following be for Congress?Passing a bill to address climate change and its effects
Demographic A top priority
An important,but lowerpriority
Not tooimportant apriority
Should not bedone
Don’t know /No opinion Total N
Registered Voters 33% (651) 28% (550) 16% (320) 16% (312) 8% (157) 1990Biden Job Strongly Approve 61% (337) 26% (144) 6% (32) 1% (7) 5% (28) 548Biden Job Somewhat Approve 42% (204) 35% (171) 15% (73) 3% (17) 5% (24) 489Biden Job Somewhat Disapprove 18% (41) 44% (97) 20% (46) 13% (28) 5% (11) 223Biden Job Strongly Disapprove 8% (50) 18% (116) 26% (163) 40% (254) 8% (50) 634Favorable of Biden 52% (549) 31% (325) 9% (97) 2% (21) 5% (57) 1048Unfavorable of Biden 10% (87) 24% (209) 25% (215) 33% (284) 7% (60) 855Very Favorable of Biden 61% (360) 27% (161) 6% (37) 2% (10) 4% (25) 593Somewhat Favorable of Biden 41% (189) 36% (164) 13% (60) 2% (11) 7% (32) 455Somewhat Unfavorable of Biden 18% (35) 42% (80) 20% (38) 12% (22) 8% (15) 190Very Unfavorable of Biden 8% (52) 19% (128) 27% (177) 39% (261) 7% (46) 664#1 Issue: Economy 27% (203) 29% (219) 18% (136) 18% (138) 9% (68) 763#1 Issue: Security 13% (46) 27% (93) 23% (80) 30% (104) 7% (25) 349#1 Issue: Health Care 45% (106) 31% (71) 14% (33) 4% (8) 6% (15) 233#1 Issue: Medicare / Social Security 42% (110) 30% (78) 12% (31) 9% (24) 6% (17) 261#1 Issue: Women’s Issues 48% (49) 30% (30) 4% (4) 7% (7) 11% (11) 103#1 Issue: Education 42% (36) 25% (21) 19% (16) 6% (5) 8% (7) 86#1 Issue: Energy 68% (58) 11% (10) 6% (5) 4% (3) 10% (9) 86#1 Issue: Other 39% (42) 24% (26) 13% (14) 19% (21) 5% (6) 1092020 Vote: Joe Biden 54% (483) 31% (276) 9% (80) 2% (15) 5% (43) 8972020 Vote: Donald Trump 11% (92) 24% (194) 24% (198) 34% (275) 7% (60) 8182020 Vote: Didn’t Vote 28% (67) 29% (71) 15% (35) 7% (17) 21% (50) 2392018 House Vote: Democrat 56% (385) 29% (202) 9% (61) 2% (16) 3% (23) 6872018 House Vote: Republican 12% (83) 24% (163) 24% (169) 34% (238) 5% (38) 6902018 House Vote: Someone else 23% (12) 25% (13) 23% (11) 15% (8) 13% (7) 502016 Vote: Hillary Clinton 57% (357) 28% (179) 8% (53) 2% (15) 4% (27) 6312016 Vote: Donald Trump 13% (98) 25% (193) 24% (183) 32% (246) 6% (47) 7682016 Vote: Other 39% (42) 26% (28) 15% (16) 16% (17) 5% (5) 1072016 Vote: Didn’t Vote 32% (154) 31% (149) 14% (68) 7% (35) 16% (77) 483
Continued on next page
Page 82
82
Morning ConsultTable POL2_2
Table POL2_2: How important of a priority should each of the following be for Congress?Passing a bill to address climate change and its effects
Demographic A top priority
An important,but lowerpriority
Not tooimportant apriority
Should not bedone
Don’t know /No opinion Total N
Registered Voters 33% (651) 28% (550) 16% (320) 16% (312) 8% (157) 1990Voted in 2014: Yes 34% (436) 26% (336) 17% (217) 19% (245) 5% (64) 1297Voted in 2014: No 31% (216) 31% (214) 15% (103) 10% (67) 13% (93) 6934-Region: Northeast 41% (142) 33% (113) 9% (31) 11% (36) 6% (22) 3444-Region: Midwest 30% (139) 27% (123) 19% (87) 17% (76) 7% (30) 4554-Region: South 29% (218) 26% (198) 18% (135) 18% (132) 10% (73) 7554-Region: West 35% (152) 27% (116) 15% (67) 15% (67) 7% (32) 435Party: Democrat/Leans Democrat 54% (482) 31% (275) 8% (74) 2% (15) 5% (42) 888Party: Republican/Leans Republican 12% (98) 25% (203) 25% (204) 30% (247) 8% (62) 814Note: Row proportions may total to larger than one-hundred percent due to rounding. For more information visit MorningConsultIntelligence.com.
Page 83
National Tracking Poll #210636, June, 2021
83
Table POL2_3
Table POL2_3: How important of a priority should each of the following be for Congress?Passing a bill to reduce inequality
Demographic A top priority
An important,but lowerpriority
Not tooimportant apriority
Should not bedone
Don’t know /No opinion Total N
Registered Voters 29% (578) 27% (543) 17% (342) 17% (337) 10% (191) 1990Gender: Male 27% (253) 27% (249) 18% (170) 20% (187) 7% (69) 927Gender: Female 31% (324) 28% (294) 16% (172) 14% (150) 11% (122) 1063Age: 18-34 39% (180) 25% (113) 12% (56) 8% (35) 16% (72) 456Age: 35-44 35% (104) 29% (88) 11% (33) 12% (37) 13% (38) 300Age: 45-64 25% (180) 28% (203) 21% (154) 20% (145) 7% (49) 730Age: 65+ 23% (114) 28% (139) 20% (99) 24% (120) 6% (32) 504GenZers: 1997-2012 38% (65) 19% (32) 12% (21) 8% (13) 22% (38) 169Millennials: 1981-1996 37% (180) 29% (140) 12% (56) 9% (43) 13% (61) 480GenXers: 1965-1980 29% (152) 28% (149) 18% (94) 16% (82) 9% (47) 525Baby Boomers: 1946-1964 23% (171) 26% (194) 21% (157) 24% (180) 6% (43) 746PID: Dem (no lean) 49% (365) 32% (240) 10% (79) 3% (26) 6% (42) 752PID: Ind (no lean) 27% (154) 26% (148) 19% (107) 15% (87) 14% (81) 578PID: Rep (no lean) 9% (59) 23% (155) 24% (156) 34% (224) 10% (68) 661PID/Gender: DemMen 45% (162) 34% (121) 13% (46) 5% (17) 4% (13) 359PID/Gender: DemWomen 52% (203) 30% (119) 8% (33) 2% (9) 7% (29) 393PID/Gender: Ind Men 24% (65) 23% (60) 19% (51) 22% (59) 12% (32) 267PID/Gender: Ind Women 29% (89) 28% (88) 18% (56) 9% (29) 16% (49) 311PID/Gender: Rep Men 9% (26) 22% (68) 24% (73) 37% (111) 8% (23) 301PID/Gender: Rep Women 9% (32) 24% (87) 23% (83) 31% (112) 12% (45) 360Ideo: Liberal (1-3) 52% (306) 31% (181) 9% (55) 3% (18) 5% (28) 587Ideo: Moderate (4) 28% (153) 34% (182) 19% (100) 9% (47) 11% (57) 539Ideo: Conservative (5-7) 11% (78) 21% (154) 24% (180) 36% (268) 8% (62) 742Educ: < College 28% (342) 25% (307) 18% (220) 16% (196) 12% (148) 1213Educ: Bachelors degree 30% (148) 30% (148) 16% (76) 18% (89) 6% (27) 489Educ: Post-grad 30% (88) 30% (87) 16% (46) 18% (51) 6% (16) 288Income: Under 50k 31% (310) 26% (262) 16% (163) 14% (141) 11% (114) 991Income: 50k-100k 27% (174) 27% (170) 18% (117) 19% (124) 9% (55) 640Income: 100k+ 26% (93) 31% (111) 17% (61) 20% (72) 6% (22) 359Ethnicity: White 25% (389) 28% (436) 20% (311) 20% (310) 9% (139) 1584
Continued on next page
Page 84
84
Morning ConsultTable POL2_3
Table POL2_3: How important of a priority should each of the following be for Congress?Passing a bill to reduce inequality
Demographic A top priority
An important,but lowerpriority
Not tooimportant apriority
Should not bedone
Don’t know /No opinion Total N
Registered Voters 29% (578) 27% (543) 17% (342) 17% (337) 10% (191) 1990Ethnicity: Hispanic 40% (78) 25% (50) 11% (21) 10% (19) 14% (27) 196Ethnicity: Black 53% (128) 27% (64) 5% (12) 3% (7) 13% (31) 243Ethnicity: Other 38% (61) 26% (43) 11% (18) 12% (20) 13% (21) 163All Christian 21% (206) 29% (280) 20% (192) 22% (216) 7% (69) 964All Non-Christian 47% (56) 26% (32) 9% (11) 8% (10) 10% (13) 121Atheist 38% (27) 24% (18) 18% (13) 15% (11) 5% (4) 73Agnostic/Nothing in particular 35% (172) 27% (133) 13% (66) 13% (67) 12% (58) 495Something Else 34% (116) 24% (80) 18% (60) 10% (34) 14% (48) 337Religious Non-Protestant/Catholic 43% (60) 28% (40) 9% (13) 9% (13) 11% (15) 140Evangelical 23% (125) 24% (133) 20% (109) 23% (127) 10% (52) 547Non-Evangelical 26% (187) 30% (216) 19% (139) 16% (118) 8% (61) 721Community: Urban 41% (217) 28% (148) 13% (67) 9% (48) 9% (49) 529Community: Suburban 27% (268) 27% (266) 17% (174) 20% (199) 9% (91) 998Community: Rural 20% (93) 28% (129) 22% (100) 19% (90) 11% (52) 464Employ: Private Sector 33% (203) 26% (164) 17% (104) 17% (108) 7% (43) 622Employ: Government 22% (28) 32% (42) 21% (27) 11% (14) 14% (18) 129Employ: Self-Employed 36% (56) 26% (40) 19% (30) 13% (20) 7% (11) 157Employ: Homemaker 27% (34) 26% (33) 13% (17) 20% (25) 15% (18) 127Employ: Retired 21% (123) 29% (168) 21% (124) 23% (135) 5% (31) 581Employ: Unemployed 31% (67) 31% (66) 12% (27) 10% (21) 16% (34) 215Employ: Other 39% (44) 21% (23) 9% (10) 4% (4) 28% (32) 113Military HH: Yes 21% (77) 27% (96) 25% (89) 21% (77) 6% (23) 361Military HH: No 31% (501) 27% (447) 16% (253) 16% (260) 10% (168) 1629RD/WT: Right Direction 45% (420) 32% (304) 12% (110) 4% (38) 7% (69) 941RD/WT: Wrong Track 15% (157) 23% (239) 22% (232) 28% (299) 12% (121) 1049Biden Job Approve 46% (477) 33% (346) 11% (117) 3% (33) 6% (65) 1037Biden Job Disapprove 10% (85) 21% (178) 25% (216) 35% (302) 9% (76) 857
Continued on next page
Page 85
National Tracking Poll #210636, June, 2021
85
Table POL2_3
Table POL2_3: How important of a priority should each of the following be for Congress?Passing a bill to reduce inequality
Demographic A top priority
An important,but lowerpriority
Not tooimportant apriority
Should not bedone
Don’t know /No opinion Total N
Registered Voters 29% (578) 27% (543) 17% (342) 17% (337) 10% (191) 1990Biden Job Strongly Approve 50% (274) 35% (190) 8% (44) 2% (12) 5% (28) 548Biden Job Somewhat Approve 41% (203) 32% (156) 15% (73) 4% (21) 8% (37) 489Biden Job Somewhat Disapprove 19% (42) 33% (74) 24% (53) 16% (35) 9% (19) 223Biden Job Strongly Disapprove 7% (43) 16% (104) 26% (163) 42% (267) 9% (57) 634Favorable of Biden 46% (484) 33% (349) 11% (113) 3% (33) 7% (70) 1048Unfavorable of Biden 9% (78) 21% (179) 25% (216) 35% (297) 10% (84) 855Very Favorable of Biden 52% (306) 32% (191) 9% (53) 2% (13) 5% (30) 593Somewhat Favorable of Biden 39% (178) 35% (158) 13% (60) 4% (20) 9% (40) 455Somewhat Unfavorable of Biden 17% (32) 31% (59) 27% (51) 12% (24) 13% (24) 190Very Unfavorable of Biden 7% (47) 18% (120) 25% (165) 41% (274) 9% (60) 664#1 Issue: Economy 25% (190) 30% (229) 16% (124) 19% (146) 10% (75) 763#1 Issue: Security 13% (47) 21% (75) 23% (82) 32% (111) 10% (35) 349#1 Issue: Health Care 40% (94) 31% (71) 16% (38) 6% (14) 7% (16) 233#1 Issue: Medicare / Social Security 32% (83) 31% (80) 19% (50) 12% (30) 7% (17) 261#1 Issue: Women’s Issues 56% (58) 14% (14) 8% (8) 8% (8) 14% (14) 103#1 Issue: Education 34% (29) 34% (29) 17% (15) 3% (2) 12% (11) 86#1 Issue: Energy 40% (35) 32% (28) 10% (9) 1% (1) 16% (14) 86#1 Issue: Other 38% (42) 16% (18) 15% (17) 22% (23) 8% (9) 1092020 Vote: Joe Biden 47% (421) 34% (307) 10% (94) 3% (29) 5% (47) 8972020 Vote: Donald Trump 9% (76) 21% (172) 25% (204) 36% (291) 9% (76) 8182020 Vote: Didn’t Vote 31% (73) 23% (55) 15% (37) 6% (13) 26% (61) 2392018 House Vote: Democrat 47% (324) 34% (233) 12% (81) 4% (26) 3% (23) 6872018 House Vote: Republican 9% (59) 23% (155) 25% (172) 36% (245) 8% (58) 6902018 House Vote: Someone else 35% (18) 15% (8) 16% (8) 11% (5) 23% (11) 502016 Vote: Hillary Clinton 47% (296) 36% (230) 10% (61) 3% (19) 4% (25) 6312016 Vote: Donald Trump 10% (79) 22% (168) 25% (193) 34% (260) 9% (67) 7682016 Vote: Other 31% (33) 26% (28) 17% (19) 13% (14) 13% (13) 1072016 Vote: Didn’t Vote 35% (169) 24% (116) 15% (70) 9% (43) 18% (85) 483
Continued on next page
Page 86
86
Morning ConsultTable POL2_3
Table POL2_3: How important of a priority should each of the following be for Congress?Passing a bill to reduce inequality
Demographic A top priority
An important,but lowerpriority
Not tooimportant apriority
Should not bedone
Don’t know /No opinion Total N
Registered Voters 29% (578) 27% (543) 17% (342) 17% (337) 10% (191) 1990Voted in 2014: Yes 28% (370) 27% (351) 18% (229) 20% (260) 7% (88) 1297Voted in 2014: No 30% (208) 28% (192) 16% (113) 11% (77) 15% (102) 6934-Region: Northeast 35% (120) 27% (94) 17% (60) 13% (44) 8% (27) 3444-Region: Midwest 27% (121) 32% (146) 18% (81) 18% (84) 5% (23) 4554-Region: South 29% (217) 25% (187) 17% (126) 18% (137) 12% (88) 7554-Region: West 28% (120) 27% (115) 17% (75) 17% (72) 12% (52) 435Party: Democrat/Leans Democrat 49% (433) 33% (292) 10% (89) 3% (28) 5% (45) 888Party: Republican/Leans Republican 9% (74) 23% (187) 24% (197) 33% (270) 11% (86) 814Note: Row proportions may total to larger than one-hundred percent due to rounding. For more information visit MorningConsultIntelligence.com.
Page 87
National Tracking Poll #210636, June, 2021
87
Table POL2_4
Table POL2_4: How important of a priority should each of the following be for Congress?Passing an infrastructure spending bill
Demographic A top priority
An important,but lowerpriority
Not tooimportant apriority
Should not bedone
Don’t know /No opinion Total N
Registered Voters 35% (695) 31% (625) 14% (276) 7% (140) 13% (254) 1990Gender: Male 39% (364) 32% (296) 14% (131) 7% (65) 8% (71) 927Gender: Female 31% (331) 31% (329) 14% (145) 7% (75) 17% (183) 1063Age: 18-34 23% (104) 30% (136) 19% (88) 6% (25) 23% (103) 456Age: 35-44 33% (98) 33% (99) 12% (37) 4% (12) 18% (54) 300Age: 45-64 36% (263) 33% (241) 14% (105) 8% (57) 9% (64) 730Age: 65+ 46% (229) 30% (150) 9% (45) 9% (46) 7% (34) 504GenZers: 1997-2012 14% (23) 25% (42) 21% (36) 6% (11) 34% (57) 169Millennials: 1981-1996 30% (144) 32% (156) 15% (74) 5% (23) 17% (83) 480GenXers: 1965-1980 33% (172) 36% (187) 14% (72) 6% (32) 12% (62) 525Baby Boomers: 1946-1964 44% (327) 29% (217) 12% (86) 9% (68) 6% (48) 746PID: Dem (no lean) 49% (369) 31% (230) 10% (73) 1% (11) 9% (69) 752PID: Ind (no lean) 31% (177) 30% (175) 13% (77) 9% (49) 17% (99) 578PID: Rep (no lean) 23% (149) 33% (221) 19% (125) 12% (80) 13% (86) 661PID/Gender: DemMen 53% (191) 32% (113) 9% (31) 1% (3) 6% (21) 359PID/Gender: DemWomen 45% (178) 30% (116) 11% (42) 2% (8) 12% (48) 393PID/Gender: Ind Men 37% (98) 31% (82) 14% (39) 9% (23) 10% (26) 267PID/Gender: Ind Women 25% (79) 30% (93) 12% (39) 8% (26) 24% (73) 311PID/Gender: Rep Men 25% (76) 34% (102) 20% (61) 13% (39) 8% (24) 301PID/Gender: Rep Women 20% (74) 33% (119) 18% (64) 11% (41) 17% (62) 360Ideo: Liberal (1-3) 48% (284) 31% (183) 11% (63) 1% (9) 8% (49) 587Ideo: Moderate (4) 39% (208) 31% (166) 12% (63) 6% (32) 13% (70) 539Ideo: Conservative (5-7) 25% (184) 34% (252) 18% (131) 13% (97) 11% (79) 742Educ: < College 31% (377) 31% (373) 14% (170) 8% (92) 17% (201) 1213Educ: Bachelors degree 40% (195) 33% (162) 12% (61) 7% (32) 8% (39) 489Educ: Post-grad 43% (123) 31% (91) 16% (45) 6% (16) 5% (14) 288Income: Under 50k 34% (334) 31% (304) 14% (134) 7% (67) 15% (153) 991Income: 50k-100k 34% (215) 33% (210) 14% (90) 9% (56) 11% (69) 640Income: 100k+ 41% (146) 31% (112) 14% (51) 5% (17) 9% (32) 359Ethnicity: White 34% (545) 31% (496) 14% (220) 8% (123) 13% (200) 1584
Continued on next page
Page 88
88
Morning ConsultTable POL2_4
Table POL2_4: How important of a priority should each of the following be for Congress?Passing an infrastructure spending bill
Demographic A top priority
An important,but lowerpriority
Not tooimportant apriority
Should not bedone
Don’t know /No opinion Total N
Registered Voters 35% (695) 31% (625) 14% (276) 7% (140) 13% (254) 1990Ethnicity: Hispanic 34% (66) 29% (56) 13% (26) 6% (12) 18% (36) 196Ethnicity: Black 40% (97) 30% (72) 14% (35) 2% (4) 14% (34) 243Ethnicity: Other 32% (53) 35% (57) 13% (21) 8% (13) 12% (20) 163All Christian 35% (340) 33% (316) 14% (140) 9% (84) 9% (84) 964All Non-Christian 45% (55) 27% (33) 8% (10) 7% (8) 12% (14) 121Atheist 34% (25) 34% (25) 16% (12) 6% (4) 10% (7) 73Agnostic/Nothing in particular 37% (182) 27% (135) 15% (73) 5% (23) 16% (82) 495Something Else 27% (92) 34% (116) 12% (41) 6% (20) 20% (68) 337Religious Non-Protestant/Catholic 43% (60) 27% (37) 10% (14) 9% (12) 12% (17) 140Evangelical 28% (154) 35% (193) 17% (93) 8% (44) 11% (62) 547Non-Evangelical 37% (268) 32% (231) 12% (84) 7% (53) 12% (86) 721Community: Urban 39% (204) 34% (179) 12% (62) 4% (19) 12% (64) 529Community: Suburban 34% (337) 32% (315) 15% (145) 8% (80) 12% (121) 998Community: Rural 33% (154) 28% (131) 15% (68) 9% (41) 15% (69) 464Employ: Private Sector 30% (188) 33% (203) 18% (115) 8% (49) 11% (67) 622Employ: Government 28% (36) 33% (42) 16% (20) 7% (9) 17% (22) 129Employ: Self-Employed 37% (58) 37% (58) 14% (21) 5% (8) 7% (12) 157Employ: Homemaker 27% (34) 34% (43) 13% (17) 5% (7) 20% (26) 127Employ: Retired 44% (255) 30% (177) 11% (62) 8% (49) 6% (38) 581Employ: Unemployed 32% (69) 33% (71) 10% (21) 6% (14) 19% (41) 215Employ: Other 38% (43) 20% (22) 9% (10) 2% (2) 31% (35) 113Military HH: Yes 36% (129) 34% (122) 13% (46) 6% (21) 12% (43) 361Military HH: No 35% (566) 31% (503) 14% (230) 7% (119) 13% (211) 1629RD/WT: Right Direction 48% (453) 29% (274) 10% (97) 2% (19) 10% (98) 941RD/WT: Wrong Track 23% (242) 33% (351) 17% (179) 12% (121) 15% (156) 1049Biden Job Approve 50% (518) 30% (309) 10% (105) 2% (18) 8% (87) 1037Biden Job Disapprove 20% (173) 36% (305) 18% (156) 14% (117) 12% (107) 857
Continued on next page
Page 89
National Tracking Poll #210636, June, 2021
89
Table POL2_4
Table POL2_4: How important of a priority should each of the following be for Congress?Passing an infrastructure spending bill
Demographic A top priority
An important,but lowerpriority
Not tooimportant apriority
Should not bedone
Don’t know /No opinion Total N
Registered Voters 35% (695) 31% (625) 14% (276) 7% (140) 13% (254) 1990Biden Job Strongly Approve 60% (330) 24% (134) 7% (39) — (2) 8% (42) 548Biden Job Somewhat Approve 38% (188) 36% (175) 13% (66) 3% (16) 9% (45) 489Biden Job Somewhat Disapprove 26% (57) 42% (94) 17% (37) 2% (4) 14% (30) 223Biden Job Strongly Disapprove 18% (115) 33% (211) 19% (119) 18% (113) 12% (76) 634Favorable of Biden 50% (522) 29% (309) 10% (104) 2% (20) 9% (93) 1048Unfavorable of Biden 19% (164) 35% (301) 19% (161) 13% (114) 13% (115) 855Very Favorable of Biden 60% (358) 25% (147) 7% (42) 1% (3) 7% (43) 593Somewhat Favorable of Biden 36% (164) 36% (162) 14% (62) 4% (17) 11% (50) 455Somewhat Unfavorable of Biden 24% (45) 38% (72) 18% (34) 2% (5) 18% (34) 190Very Unfavorable of Biden 18% (119) 35% (229) 19% (127) 16% (109) 12% (81) 664#1 Issue: Economy 32% (243) 32% (245) 15% (111) 7% (54) 15% (111) 763#1 Issue: Security 27% (95) 35% (121) 14% (48) 12% (44) 12% (42) 349#1 Issue: Health Care 46% (107) 29% (69) 13% (31) 1% (3) 10% (24) 233#1 Issue: Medicare / Social Security 45% (118) 29% (74) 11% (29) 8% (21) 7% (18) 261#1 Issue: Women’s Issues 30% (31) 28% (29) 14% (15) 3% (3) 25% (26) 103#1 Issue: Education 24% (21) 41% (35) 22% (18) 1% (1) 13% (11) 86#1 Issue: Energy 44% (37) 27% (23) 12% (10) 4% (3) 14% (12) 86#1 Issue: Other 39% (42) 28% (30) 12% (13) 11% (12) 10% (11) 1092020 Vote: Joe Biden 52% (462) 30% (265) 9% (81) 2% (15) 8% (73) 8972020 Vote: Donald Trump 21% (176) 35% (284) 18% (146) 14% (115) 12% (98) 8182020 Vote: Didn’t Vote 21% (49) 26% (61) 19% (45) 3% (8) 32% (76) 2392018 House Vote: Democrat 53% (367) 31% (211) 8% (57) 2% (12) 6% (40) 6872018 House Vote: Republican 24% (165) 35% (245) 17% (118) 14% (98) 9% (64) 6902018 House Vote: Someone else 43% (22) 26% (13) 6% (3) 5% (2) 21% (10) 502016 Vote: Hillary Clinton 55% (347) 29% (181) 8% (52) 1% (8) 7% (43) 6312016 Vote: Donald Trump 23% (180) 36% (278) 16% (126) 13% (98) 11% (86) 7682016 Vote: Other 40% (43) 31% (34) 14% (15) 5% (5) 9% (10) 1072016 Vote: Didn’t Vote 26% (124) 27% (132) 17% (83) 6% (29) 24% (116) 483
Continued on next page
Page 90
90
Morning ConsultTable POL2_4
Table POL2_4: How important of a priority should each of the following be for Congress?Passing an infrastructure spending bill
Demographic A top priority
An important,but lowerpriority
Not tooimportant apriority
Should not bedone
Don’t know /No opinion Total N
Registered Voters 35% (695) 31% (625) 14% (276) 7% (140) 13% (254) 1990Voted in 2014: Yes 39% (512) 33% (428) 12% (154) 7% (96) 8% (107) 1297Voted in 2014: No 26% (183) 29% (197) 18% (122) 6% (44) 21% (147) 6934-Region: Northeast 39% (134) 32% (110) 11% (39) 4% (15) 13% (46) 3444-Region: Midwest 40% (180) 29% (131) 14% (65) 8% (36) 9% (43) 4554-Region: South 31% (237) 30% (230) 16% (120) 8% (58) 15% (111) 7554-Region: West 33% (144) 36% (154) 12% (51) 7% (31) 13% (55) 435Party: Democrat/Leans Democrat 49% (438) 31% (272) 9% (84) 2% (14) 9% (80) 888Party: Republican/Leans Republican 22% (179) 34% (277) 18% (150) 12% (101) 13% (107) 814Note: Row proportions may total to larger than one-hundred percent due to rounding. For more information visit MorningConsultIntelligence.com.
Page 91
National Tracking Poll #210636, June, 2021
91
Table POL2_5
Table POL2_5: How important of a priority should each of the following be for Congress?Passing an immigration reform bill
Demographic A top priority
An important,but lowerpriority
Not tooimportant apriority
Should not bedone
Don’t know /No opinion Total N
Registered Voters 37% (733) 33% (647) 13% (256) 8% (163) 10% (191) 1990Gender: Male 36% (332) 34% (320) 14% (133) 8% (75) 7% (68) 927Gender: Female 38% (401) 31% (328) 12% (123) 8% (88) 12% (123) 1063Age: 18-34 27% (124) 31% (140) 16% (71) 6% (26) 21% (95) 456Age: 35-44 37% (110) 30% (91) 13% (40) 7% (20) 13% (39) 300Age: 45-64 39% (283) 32% (236) 13% (98) 10% (69) 6% (44) 730Age: 65+ 43% (216) 36% (181) 9% (47) 10% (48) 3% (13) 504GenZers: 1997-2012 19% (32) 29% (49) 16% (26) 6% (10) 31% (52) 169Millennials: 1981-1996 33% (160) 32% (155) 14% (67) 6% (27) 15% (71) 480GenXers: 1965-1980 39% (205) 30% (157) 14% (75) 8% (42) 9% (46) 525Baby Boomers: 1946-1964 42% (311) 34% (252) 11% (81) 11% (82) 3% (20) 746PID: Dem (no lean) 39% (290) 38% (288) 13% (101) 3% (26) 6% (48) 752PID: Ind (no lean) 30% (175) 33% (189) 15% (86) 9% (52) 13% (76) 578PID: Rep (no lean) 41% (268) 26% (171) 11% (70) 13% (85) 10% (67) 661PID/Gender: DemMen 38% (136) 40% (144) 14% (51) 4% (13) 4% (15) 359PID/Gender: DemWomen 39% (153) 37% (144) 13% (49) 3% (13) 8% (33) 393PID/Gender: Ind Men 29% (77) 36% (95) 17% (47) 7% (19) 11% (29) 267PID/Gender: Ind Women 32% (98) 30% (94) 13% (39) 11% (33) 15% (46) 311PID/Gender: Rep Men 39% (118) 27% (81) 12% (35) 14% (43) 8% (24) 301PID/Gender: Rep Women 42% (150) 25% (90) 10% (35) 12% (42) 12% (43) 360Ideo: Liberal (1-3) 40% (236) 38% (222) 13% (78) 2% (13) 6% (38) 587Ideo: Moderate (4) 31% (168) 37% (198) 15% (81) 8% (42) 9% (50) 539Ideo: Conservative (5-7) 42% (310) 28% (204) 10% (77) 13% (97) 7% (53) 742Educ: < College 37% (445) 30% (358) 12% (151) 8% (102) 13% (157) 1213Educ: Bachelors degree 33% (163) 38% (184) 15% (72) 9% (44) 5% (25) 489Educ: Post-grad 43% (125) 36% (105) 12% (34) 6% (16) 3% (9) 288Income: Under 50k 37% (367) 30% (299) 13% (125) 8% (82) 12% (118) 991Income: 50k-100k 33% (214) 37% (235) 13% (84) 8% (53) 8% (54) 640Income: 100k+ 42% (152) 32% (113) 13% (47) 8% (28) 5% (19) 359Ethnicity: White 37% (591) 32% (513) 12% (193) 9% (146) 9% (141) 1584
Continued on next page
Page 92
92
Morning ConsultTable POL2_5
Table POL2_5: How important of a priority should each of the following be for Congress?Passing an immigration reform bill
Demographic A top priority
An important,but lowerpriority
Not tooimportant apriority
Should not bedone
Don’t know /No opinion Total N
Registered Voters 37% (733) 33% (647) 13% (256) 8% (163) 10% (191) 1990Ethnicity: Hispanic 36% (71) 28% (54) 12% (24) 8% (15) 16% (31) 196Ethnicity: Black 33% (81) 34% (82) 15% (37) 4% (9) 14% (34) 243Ethnicity: Other 37% (61) 32% (52) 17% (27) 5% (8) 10% (16) 163All Christian 40% (382) 35% (340) 10% (100) 9% (89) 6% (53) 964All Non-Christian 51% (62) 25% (30) 12% (14) 2% (2) 11% (13) 121Atheist 24% (18) 46% (34) 11% (8) 9% (6) 10% (7) 73Agnostic/Nothing in particular 33% (161) 32% (157) 15% (74) 7% (35) 14% (68) 495Something Else 33% (110) 26% (86) 18% (60) 9% (31) 15% (50) 337Religious Non-Protestant/Catholic 49% (69) 24% (34) 13% (18) 2% (3) 12% (17) 140Evangelical 41% (226) 30% (162) 12% (66) 9% (47) 8% (46) 547Non-Evangelical 35% (253) 35% (254) 12% (89) 10% (72) 7% (52) 721Community: Urban 40% (212) 31% (164) 15% (79) 5% (24) 9% (50) 529Community: Suburban 35% (351) 34% (336) 12% (118) 10% (104) 9% (88) 998Community: Rural 37% (170) 32% (147) 13% (60) 7% (34) 11% (53) 464Employ: Private Sector 31% (192) 35% (220) 17% (103) 8% (49) 9% (59) 622Employ: Government 34% (44) 30% (38) 17% (22) 8% (11) 11% (14) 129Employ: Self-Employed 43% (67) 29% (45) 13% (20) 9% (14) 7% (11) 157Employ: Homemaker 36% (46) 28% (36) 13% (17) 8% (10) 15% (18) 127Employ: Retired 42% (246) 36% (208) 10% (57) 10% (57) 2% (12) 581Employ: Unemployed 39% (83) 27% (58) 11% (23) 6% (12) 18% (38) 215Employ: Other 33% (37) 27% (31) 9% (10) 6% (6) 26% (30) 113Military HH: Yes 38% (138) 34% (123) 12% (44) 9% (33) 6% (23) 361Military HH: No 37% (595) 32% (524) 13% (212) 8% (130) 10% (168) 1629RD/WT: Right Direction 37% (348) 37% (351) 14% (131) 4% (38) 8% (73) 941RD/WT: Wrong Track 37% (385) 28% (296) 12% (126) 12% (125) 11% (117) 1049Biden Job Approve 38% (389) 39% (409) 14% (141) 3% (35) 6% (63) 1037Biden Job Disapprove 39% (335) 26% (224) 12% (100) 14% (124) 9% (74) 857
Continued on next page
Page 93
National Tracking Poll #210636, June, 2021
93
Table POL2_5
Table POL2_5: How important of a priority should each of the following be for Congress?Passing an immigration reform bill
Demographic A top priority
An important,but lowerpriority
Not tooimportant apriority
Should not bedone
Don’t know /No opinion Total N
Registered Voters 37% (733) 33% (647) 13% (256) 8% (163) 10% (191) 1990Biden Job Strongly Approve 42% (232) 38% (209) 12% (65) 2% (12) 5% (30) 548Biden Job Somewhat Approve 32% (157) 41% (200) 16% (76) 5% (23) 7% (34) 489Biden Job Somewhat Disapprove 35% (79) 33% (75) 14% (31) 9% (21) 8% (18) 223Biden Job Strongly Disapprove 40% (256) 24% (150) 11% (69) 16% (103) 9% (56) 634Favorable of Biden 38% (395) 39% (408) 13% (138) 4% (37) 7% (70) 1048Unfavorable of Biden 38% (321) 27% (227) 12% (104) 14% (119) 10% (83) 855Very Favorable of Biden 43% (253) 37% (220) 12% (70) 3% (20) 5% (31) 593Somewhat Favorable of Biden 31% (143) 41% (188) 15% (68) 4% (17) 9% (39) 455Somewhat Unfavorable of Biden 30% (58) 36% (68) 15% (28) 8% (15) 11% (21) 190Very Unfavorable of Biden 40% (264) 24% (159) 11% (76) 16% (104) 9% (62) 664#1 Issue: Economy 34% (261) 36% (273) 13% (96) 7% (56) 10% (77) 763#1 Issue: Security 42% (147) 26% (90) 10% (33) 14% (48) 9% (32) 349#1 Issue: Health Care 36% (84) 33% (77) 19% (43) 4% (9) 9% (21) 233#1 Issue: Medicare / Social Security 38% (98) 36% (93) 12% (32) 10% (26) 4% (11) 261#1 Issue: Women’s Issues 37% (38) 30% (31) 10% (10) 4% (4) 20% (21) 103#1 Issue: Education 39% (33) 28% (24) 17% (15) 7% (6) 9% (8) 86#1 Issue: Energy 38% (33) 32% (28) 12% (10) — (0) 18% (15) 86#1 Issue: Other 35% (38) 30% (32) 15% (17) 14% (15) 7% (7) 1092020 Vote: Joe Biden 38% (344) 39% (353) 13% (120) 3% (26) 6% (54) 8972020 Vote: Donald Trump 40% (323) 26% (209) 11% (88) 15% (123) 9% (75) 8182020 Vote: Didn’t Vote 23% (54) 31% (75) 18% (42) 5% (11) 24% (57) 2392018 House Vote: Democrat 39% (271) 40% (275) 13% (88) 4% (25) 4% (28) 6872018 House Vote: Republican 41% (282) 26% (182) 12% (82) 14% (96) 7% (49) 6902018 House Vote: Someone else 33% (16) 22% (11) 11% (5) 17% (8) 18% (9) 502016 Vote: Hillary Clinton 39% (245) 41% (257) 13% (82) 3% (19) 5% (29) 6312016 Vote: Donald Trump 41% (315) 26% (198) 11% (88) 14% (107) 8% (60) 7682016 Vote: Other 37% (39) 38% (41) 10% (10) 8% (8) 8% (8) 1072016 Vote: Didn’t Vote 28% (133) 31% (151) 16% (76) 6% (29) 19% (94) 483
Continued on next page
Page 94
94
Morning ConsultTable POL2_5
Table POL2_5: How important of a priority should each of the following be for Congress?Passing an immigration reform bill
Demographic A top priority
An important,but lowerpriority
Not tooimportant apriority
Should not bedone
Don’t know /No opinion Total N
Registered Voters 37% (733) 33% (647) 13% (256) 8% (163) 10% (191) 1990Voted in 2014: Yes 40% (518) 34% (439) 12% (154) 9% (116) 5% (70) 1297Voted in 2014: No 31% (214) 30% (208) 15% (102) 7% (47) 17% (121) 6934-Region: Northeast 38% (131) 37% (126) 11% (38) 7% (23) 7% (25) 3444-Region: Midwest 35% (159) 35% (157) 14% (64) 10% (44) 7% (31) 4554-Region: South 38% (287) 29% (218) 14% (104) 9% (64) 11% (82) 7554-Region: West 36% (156) 33% (146) 11% (50) 7% (31) 12% (53) 435Party: Democrat/Leans Democrat 38% (338) 39% (347) 14% (120) 3% (31) 6% (53) 888Party: Republican/Leans Republican 40% (325) 26% (212) 11% (90) 13% (109) 10% (78) 814Note: Row proportions may total to larger than one-hundred percent due to rounding. For more information visit MorningConsultIntelligence.com.
Page 95
National Tracking Poll #210636, June, 2021
95
Table POL2_6
Table POL2_6: How important of a priority should each of the following be for Congress?Reducing the federal budget deficit
Demographic A top priority
An important,but lowerpriority
Not tooimportant apriority
Should not bedone
Don’t know /No opinion Total N
Registered Voters 42% (828) 34% (671) 13% (259) 2% (45) 9% (187) 1990Gender: Male 46% (426) 31% (288) 14% (132) 3% (24) 6% (56) 927Gender: Female 38% (402) 36% (383) 12% (127) 2% (21) 12% (131) 1063Age: 18-34 31% (142) 30% (138) 17% (79) 3% (14) 18% (83) 456Age: 35-44 38% (114) 38% (113) 9% (28) 2% (7) 13% (38) 300Age: 45-64 45% (328) 34% (247) 12% (88) 2% (18) 7% (49) 730Age: 65+ 48% (244) 34% (173) 13% (64) 1% (6) 3% (17) 504GenZers: 1997-2012 20% (35) 31% (52) 18% (30) 4% (7) 27% (45) 169Millennials: 1981-1996 37% (177) 34% (163) 14% (66) 3% (13) 12% (60) 480GenXers: 1965-1980 41% (217) 34% (178) 13% (69) 2% (12) 9% (50) 525Baby Boomers: 1946-1964 50% (372) 33% (249) 11% (84) 2% (13) 4% (28) 746PID: Dem (no lean) 33% (245) 37% (275) 20% (147) 3% (22) 8% (63) 752PID: Ind (no lean) 42% (240) 34% (198) 10% (59) 2% (12) 12% (69) 578PID: Rep (no lean) 52% (343) 30% (198) 8% (53) 2% (11) 8% (56) 661PID/Gender: DemMen 36% (129) 34% (122) 21% (77) 4% (14) 5% (18) 359PID/Gender: DemWomen 30% (116) 39% (153) 18% (71) 2% (9) 11% (45) 393PID/Gender: Ind Men 50% (133) 31% (83) 9% (23) 2% (6) 8% (22) 267PID/Gender: Ind Women 34% (106) 37% (115) 12% (36) 2% (6) 15% (47) 311PID/Gender: Rep Men 54% (164) 28% (84) 11% (32) 1% (4) 6% (17) 301PID/Gender: Rep Women 50% (179) 32% (115) 6% (20) 2% (7) 11% (39) 360Ideo: Liberal (1-3) 30% (176) 37% (218) 24% (139) 3% (15) 7% (39) 587Ideo: Moderate (4) 38% (207) 35% (188) 14% (74) 3% (17) 10% (52) 539Ideo: Conservative (5-7) 56% (418) 31% (230) 5% (39) 2% (12) 6% (43) 742Educ: < College 41% (494) 33% (406) 11% (138) 2% (26) 12% (149) 1213Educ: Bachelors degree 43% (210) 32% (156) 17% (83) 2% (12) 6% (28) 489Educ: Post-grad 43% (123) 38% (109) 13% (38) 3% (7) 3% (10) 288Income: Under 50k 38% (378) 33% (326) 14% (138) 3% (25) 13% (125) 991Income: 50k-100k 43% (278) 34% (216) 13% (80) 3% (17) 8% (48) 640Income: 100k+ 48% (172) 36% (130) 11% (41) 1% (3) 4% (14) 359Ethnicity: White 43% (683) 34% (539) 12% (198) 2% (35) 8% (130) 1584
Continued on next page
Page 96
96
Morning ConsultTable POL2_6
Table POL2_6: How important of a priority should each of the following be for Congress?Reducing the federal budget deficit
Demographic A top priority
An important,but lowerpriority
Not tooimportant apriority
Should not bedone
Don’t know /No opinion Total N
Registered Voters 42% (828) 34% (671) 13% (259) 2% (45) 9% (187) 1990Ethnicity: Hispanic 36% (70) 33% (64) 16% (31) 1% (1) 15% (30) 196Ethnicity: Black 37% (89) 32% (78) 12% (28) 4% (9) 16% (38) 243Ethnicity: Other 34% (56) 33% (54) 20% (33) 1% (1) 12% (19) 163All Christian 48% (460) 33% (318) 11% (109) 2% (15) 6% (62) 964All Non-Christian 40% (48) 33% (41) 12% (14) 3% (4) 11% (14) 121Atheist 29% (21) 29% (21) 27% (20) 7% (5) 9% (6) 73Agnostic/Nothing in particular 35% (171) 35% (173) 16% (77) 3% (14) 12% (60) 495Something Else 38% (128) 35% (118) 11% (39) 2% (7) 13% (45) 337Religious Non-Protestant/Catholic 36% (51) 36% (50) 13% (18) 4% (6) 11% (15) 140Evangelical 48% (263) 33% (183) 8% (44) 1% (7) 9% (50) 547Non-Evangelical 44% (318) 33% (238) 14% (99) 2% (11) 8% (55) 721Community: Urban 40% (210) 34% (177) 16% (83) 3% (16) 8% (42) 529Community: Suburban 43% (430) 33% (332) 13% (125) 2% (19) 9% (91) 998Community: Rural 41% (188) 35% (162) 11% (51) 2% (10) 12% (54) 464Employ: Private Sector 41% (256) 36% (222) 14% (86) 2% (16) 7% (43) 622Employ: Government 37% (48) 34% (43) 15% (20) 2% (2) 12% (15) 129Employ: Self-Employed 41% (64) 35% (56) 12% (19) 3% (5) 9% (14) 157Employ: Homemaker 43% (54) 24% (30) 12% (16) 3% (4) 18% (23) 127Employ: Retired 48% (277) 36% (212) 11% (65) 2% (10) 3% (17) 581Employ: Unemployed 36% (76) 28% (60) 17% (37) 3% (6) 16% (35) 215Employ: Other 36% (41) 29% (33) 7% (8) 3% (3) 25% (28) 113Military HH: Yes 52% (189) 29% (103) 11% (41) 1% (4) 7% (24) 361Military HH: No 39% (638) 35% (568) 13% (218) 3% (41) 10% (163) 1629RD/WT: Right Direction 33% (314) 38% (357) 17% (165) 3% (25) 9% (80) 941RD/WT: Wrong Track 49% (513) 30% (314) 9% (94) 2% (20) 10% (107) 1049Biden Job Approve 34% (348) 38% (392) 18% (190) 3% (29) 8% (79) 1037Biden Job Disapprove 53% (458) 29% (248) 8% (65) 2% (16) 8% (70) 857
Continued on next page
Page 97
National Tracking Poll #210636, June, 2021
97
Table POL2_6
Table POL2_6: How important of a priority should each of the following be for Congress?Reducing the federal budget deficit
Demographic A top priority
An important,but lowerpriority
Not tooimportant apriority
Should not bedone
Don’t know /No opinion Total N
Registered Voters 42% (828) 34% (671) 13% (259) 2% (45) 9% (187) 1990Biden Job Strongly Approve 32% (173) 39% (214) 19% (104) 3% (15) 8% (42) 548Biden Job Somewhat Approve 36% (174) 36% (178) 18% (86) 3% (14) 7% (37) 489Biden Job Somewhat Disapprove 47% (105) 32% (70) 12% (27) 1% (2) 8% (18) 223Biden Job Strongly Disapprove 56% (353) 28% (178) 6% (38) 2% (13) 8% (51) 634Favorable of Biden 33% (348) 38% (401) 18% (187) 2% (25) 8% (87) 1048Unfavorable of Biden 54% (459) 29% (244) 8% (64) 2% (20) 8% (67) 855Very Favorable of Biden 32% (192) 38% (226) 19% (111) 3% (18) 8% (46) 593Somewhat Favorable of Biden 34% (156) 39% (175) 17% (75) 2% (7) 9% (41) 455Somewhat Unfavorable of Biden 45% (85) 35% (66) 9% (18) 3% (5) 9% (16) 190Very Unfavorable of Biden 56% (374) 27% (179) 7% (46) 2% (14) 8% (51) 664#1 Issue: Economy 45% (346) 33% (253) 11% (82) 2% (19) 8% (63) 763#1 Issue: Security 53% (184) 29% (101) 7% (23) 2% (6) 10% (36) 349#1 Issue: Health Care 28% (64) 35% (82) 22% (51) 4% (10) 11% (25) 233#1 Issue: Medicare / Social Security 39% (100) 42% (108) 12% (32) 2% (5) 6% (15) 261#1 Issue: Women’s Issues 23% (24) 36% (38) 18% (19) 1% (1) 21% (21) 103#1 Issue: Education 31% (27) 35% (30) 17% (15) — (0) 16% (14) 86#1 Issue: Energy 34% (29) 33% (28) 20% (17) 2% (2) 11% (10) 86#1 Issue: Other 49% (53) 28% (31) 19% (20) 1% (1) 3% (4) 1092020 Vote: Joe Biden 32% (290) 38% (344) 19% (174) 3% (24) 7% (65) 8972020 Vote: Donald Trump 55% (450) 30% (242) 6% (49) 2% (17) 7% (60) 8182020 Vote: Didn’t Vote 30% (72) 31% (73) 13% (32) 1% (4) 25% (59) 2392018 House Vote: Democrat 30% (208) 42% (289) 20% (136) 3% (19) 5% (34) 6872018 House Vote: Republican 59% (407) 26% (182) 7% (46) 2% (11) 6% (43) 6902018 House Vote: Someone else 51% (25) 23% (11) 6% (3) — (0) 21% (10) 502016 Vote: Hillary Clinton 31% (196) 40% (252) 20% (125) 3% (19) 6% (39) 6312016 Vote: Donald Trump 57% (436) 29% (222) 6% (45) 2% (12) 7% (53) 7682016 Vote: Other 35% (37) 40% (43) 17% (18) 1% (1) 8% (8) 1072016 Vote: Didn’t Vote 33% (159) 32% (154) 15% (70) 3% (13) 18% (87) 483
Continued on next page
Page 98
98
Morning ConsultTable POL2_6
Table POL2_6: How important of a priority should each of the following be for Congress?Reducing the federal budget deficit
Demographic A top priority
An important,but lowerpriority
Not tooimportant apriority
Should not bedone
Don’t know /No opinion Total N
Registered Voters 42% (828) 34% (671) 13% (259) 2% (45) 9% (187) 1990Voted in 2014: Yes 46% (594) 33% (433) 12% (162) 2% (29) 6% (79) 1297Voted in 2014: No 34% (234) 34% (238) 14% (97) 2% (16) 16% (108) 6934-Region: Northeast 40% (138) 37% (127) 11% (38) 2% (7) 10% (34) 3444-Region: Midwest 39% (176) 34% (153) 16% (73) 4% (19) 8% (34) 4554-Region: South 44% (336) 32% (244) 11% (82) 1% (11) 11% (83) 7554-Region: West 41% (178) 34% (147) 15% (66) 2% (8) 8% (36) 435Party: Democrat/Leans Democrat 32% (286) 38% (335) 19% (170) 3% (26) 8% (70) 888Party: Republican/Leans Republican 53% (433) 30% (244) 7% (59) 2% (15) 8% (62) 814Note: Row proportions may total to larger than one-hundred percent due to rounding. For more information visit MorningConsultIntelligence.com.
Page 99
National Tracking Poll #210636, June, 2021
99
Table POL2_7
Table POL2_7: How important of a priority should each of the following be for Congress?Passing legislation placing additional restrictions on gun ownership
Demographic A top priority
An important,but lowerpriority
Not tooimportant apriority
Should not bedone
Don’t know /No opinion Total N
Registered Voters 32% (629) 21% (415) 12% (235) 28% (562) 7% (148) 1990Gender: Male 28% (261) 24% (219) 12% (107) 32% (293) 5% (47) 927Gender: Female 35% (369) 18% (196) 12% (128) 25% (270) 9% (100) 1063Age: 18-34 27% (122) 24% (111) 15% (69) 20% (91) 14% (63) 456Age: 35-44 34% (101) 21% (62) 11% (32) 25% (75) 10% (30) 300Age: 45-64 29% (210) 21% (153) 12% (86) 33% (238) 6% (43) 730Age: 65+ 39% (197) 18% (88) 10% (48) 32% (159) 2% (11) 504GenZers: 1997-2012 22% (38) 21% (36) 17% (29) 17% (28) 23% (39) 169Millennials: 1981-1996 31% (150) 23% (111) 12% (59) 24% (117) 9% (42) 480GenXers: 1965-1980 29% (154) 24% (127) 13% (66) 26% (137) 8% (41) 525Baby Boomers: 1946-1964 35% (261) 17% (129) 10% (75) 34% (257) 3% (24) 746PID: Dem (no lean) 54% (406) 27% (202) 9% (69) 5% (40) 4% (34) 752PID: Ind (no lean) 25% (142) 19% (112) 13% (76) 32% (185) 11% (63) 578PID: Rep (no lean) 12% (82) 15% (100) 14% (90) 51% (337) 8% (51) 661PID/Gender: DemMen 49% (175) 30% (109) 9% (34) 8% (29) 3% (12) 359PID/Gender: DemWomen 59% (231) 24% (93) 9% (36) 3% (11) 6% (22) 393PID/Gender: Ind Men 19% (52) 21% (55) 14% (37) 38% (101) 8% (22) 267PID/Gender: Ind Women 29% (90) 18% (57) 13% (39) 27% (84) 13% (40) 311PID/Gender: Rep Men 11% (34) 18% (54) 12% (37) 54% (163) 4% (13) 301PID/Gender: Rep Women 13% (48) 13% (46) 15% (53) 49% (175) 10% (38) 360Ideo: Liberal (1-3) 54% (315) 26% (151) 9% (53) 8% (48) 4% (21) 587Ideo: Moderate (4) 38% (206) 25% (135) 12% (63) 17% (92) 8% (43) 539Ideo: Conservative (5-7) 12% (87) 15% (114) 14% (107) 53% (396) 5% (39) 742Educ: < College 28% (340) 19% (229) 13% (154) 31% (372) 10% (117) 1213Educ: Bachelors degree 36% (174) 24% (118) 9% (45) 26% (129) 5% (23) 489Educ: Post-grad 40% (115) 24% (68) 12% (36) 21% (62) 3% (8) 288Income: Under 50k 32% (321) 18% (181) 12% (116) 28% (279) 10% (94) 991Income: 50k-100k 28% (180) 24% (150) 13% (83) 28% (181) 7% (46) 640Income: 100k+ 36% (129) 23% (83) 10% (37) 29% (103) 2% (8) 359Ethnicity: White 30% (472) 20% (311) 12% (182) 33% (516) 6% (102) 1584
Continued on next page
Page 100
100
Morning ConsultTable POL2_7
Table POL2_7: How important of a priority should each of the following be for Congress?Passing legislation placing additional restrictions on gun ownership
Demographic A top priority
An important,but lowerpriority
Not tooimportant apriority
Should not bedone
Don’t know /No opinion Total N
Registered Voters 32% (629) 21% (415) 12% (235) 28% (562) 7% (148) 1990Ethnicity: Hispanic 35% (68) 25% (48) 11% (22) 19% (38) 10% (20) 196Ethnicity: Black 44% (106) 24% (59) 11% (27) 7% (18) 14% (33) 243Ethnicity: Other 31% (51) 28% (45) 16% (26) 18% (29) 8% (12) 163All Christian 28% (274) 21% (205) 11% (108) 34% (327) 5% (49) 964All Non-Christian 50% (60) 20% (24) 9% (10) 11% (13) 11% (14) 121Atheist 45% (33) 26% (19) 4% (3) 20% (15) 5% (4) 73Agnostic/Nothing in particular 34% (166) 21% (103) 16% (78) 21% (104) 9% (44) 495Something Else 29% (96) 19% (64) 11% (36) 31% (104) 11% (37) 337Religious Non-Protestant/Catholic 45% (64) 20% (28) 10% (14) 14% (19) 12% (16) 140Evangelical 24% (130) 18% (96) 11% (62) 41% (224) 6% (34) 547Non-Evangelical 32% (234) 23% (164) 11% (78) 27% (196) 7% (49) 721Community: Urban 42% (222) 25% (130) 10% (51) 16% (84) 8% (41) 529Community: Suburban 29% (290) 21% (213) 12% (125) 30% (299) 7% (71) 998Community: Rural 25% (117) 16% (72) 13% (60) 39% (179) 8% (35) 464Employ: Private Sector 30% (188) 26% (161) 12% (73) 27% (170) 5% (29) 622Employ: Government 25% (32) 24% (31) 10% (13) 32% (41) 9% (12) 129Employ: Self-Employed 38% (60) 14% (21) 16% (25) 25% (39) 8% (12) 157Employ: Homemaker 29% (37) 14% (17) 18% (23) 31% (39) 9% (11) 127Employ: Retired 35% (205) 18% (103) 10% (57) 34% (198) 3% (18) 581Employ: Unemployed 27% (57) 22% (48) 12% (26) 22% (48) 17% (36) 215Employ: Other 30% (34) 23% (26) 12% (14) 15% (17) 19% (21) 113Military HH: Yes 28% (100) 22% (79) 9% (32) 37% (133) 5% (17) 361Military HH: No 32% (529) 21% (336) 12% (204) 26% (430) 8% (130) 1629RD/WT: Right Direction 51% (482) 26% (242) 10% (97) 7% (66) 6% (54) 941RD/WT: Wrong Track 14% (147) 17% (173) 13% (139) 47% (496) 9% (93) 1049Biden Job Approve 52% (540) 27% (277) 10% (103) 7% (68) 5% (50) 1037Biden Job Disapprove 9% (79) 15% (128) 14% (117) 56% (476) 7% (57) 857
Continued on next page
Page 101
National Tracking Poll #210636, June, 2021
101
Table POL2_7
Table POL2_7: How important of a priority should each of the following be for Congress?Passing legislation placing additional restrictions on gun ownership
Demographic A top priority
An important,but lowerpriority
Not tooimportant apriority
Should not bedone
Don’t know /No opinion Total N
Registered Voters 32% (629) 21% (415) 12% (235) 28% (562) 7% (148) 1990Biden Job Strongly Approve 64% (353) 22% (123) 6% (35) 3% (15) 4% (22) 548Biden Job Somewhat Approve 38% (187) 32% (154) 14% (68) 11% (53) 6% (27) 489Biden Job Somewhat Disapprove 18% (41) 25% (56) 22% (50) 32% (71) 3% (6) 223Biden Job Strongly Disapprove 6% (38) 11% (72) 11% (67) 64% (405) 8% (51) 634Favorable of Biden 52% (546) 26% (277) 9% (99) 7% (74) 5% (52) 1048Unfavorable of Biden 8% (71) 15% (126) 15% (126) 55% (470) 7% (61) 855Very Favorable of Biden 64% (378) 22% (130) 7% (40) 4% (24) 4% (21) 593Somewhat Favorable of Biden 37% (168) 32% (148) 13% (59) 11% (50) 7% (31) 455Somewhat Unfavorable of Biden 15% (29) 26% (49) 25% (48) 26% (49) 8% (15) 190Very Unfavorable of Biden 6% (42) 12% (77) 12% (79) 63% (421) 7% (46) 664#1 Issue: Economy 26% (200) 23% (173) 12% (93) 31% (238) 8% (59) 763#1 Issue: Security 14% (51) 18% (62) 8% (29) 52% (180) 8% (28) 349#1 Issue: Health Care 44% (103) 24% (56) 17% (39) 10% (24) 4% (10) 233#1 Issue: Medicare / Social Security 42% (110) 20% (52) 11% (28) 21% (55) 6% (16) 261#1 Issue: Women’s Issues 43% (44) 21% (22) 12% (12) 9% (9) 15% (15) 103#1 Issue: Education 48% (41) 19% (16) 14% (12) 12% (10) 8% (7) 86#1 Issue: Energy 36% (31) 18% (16) 19% (17) 15% (13) 11% (9) 86#1 Issue: Other 45% (49) 17% (19) 5% (5) 30% (33) 3% (3) 1092020 Vote: Joe Biden 55% (489) 28% (248) 9% (83) 4% (37) 5% (41) 8972020 Vote: Donald Trump 9% (77) 15% (122) 13% (105) 56% (456) 7% (58) 8182020 Vote: Didn’t Vote 24% (58) 17% (41) 18% (43) 22% (53) 19% (45) 2392018 House Vote: Democrat 57% (390) 28% (192) 9% (59) 4% (30) 2% (17) 6872018 House Vote: Republican 12% (80) 16% (109) 13% (88) 54% (374) 6% (39) 6902018 House Vote: Someone else 20% (10) 12% (6) 12% (6) 41% (21) 14% (7) 502016 Vote: Hillary Clinton 59% (370) 26% (166) 8% (48) 4% (27) 3% (20) 6312016 Vote: Donald Trump 13% (100) 16% (120) 13% (96) 53% (405) 6% (47) 7682016 Vote: Other 31% (33) 22% (23) 13% (14) 30% (32) 4% (5) 1072016 Vote: Didn’t Vote 26% (126) 22% (106) 16% (77) 21% (99) 16% (76) 483
Continued on next page
Page 102
102
Morning ConsultTable POL2_7
Table POL2_7: How important of a priority should each of the following be for Congress?Passing legislation placing additional restrictions on gun ownership
Demographic A top priority
An important,but lowerpriority
Not tooimportant apriority
Should not bedone
Don’t know /No opinion Total N
Registered Voters 32% (629) 21% (415) 12% (235) 28% (562) 7% (148) 1990Voted in 2014: Yes 34% (447) 21% (268) 11% (139) 30% (386) 4% (58) 1297Voted in 2014: No 26% (183) 21% (147) 14% (97) 25% (177) 13% (89) 6934-Region: Northeast 42% (145) 21% (71) 12% (41) 18% (64) 7% (25) 3444-Region: Midwest 32% (145) 19% (88) 13% (60) 31% (141) 5% (21) 4554-Region: South 28% (208) 20% (154) 12% (94) 31% (234) 8% (64) 7554-Region: West 30% (131) 23% (102) 9% (40) 29% (124) 9% (38) 435Party: Democrat/Leans Democrat 53% (473) 27% (238) 10% (88) 6% (52) 4% (37) 888Party: Republican/Leans Republican 12% (101) 15% (125) 13% (105) 52% (425) 7% (57) 814Note: Row proportions may total to larger than one-hundred percent due to rounding. For more information visit MorningConsultIntelligence.com.
Page 103
National Tracking Poll #210636, June, 2021
103
Table POL2_8
Table POL2_8: How important of a priority should each of the following be for Congress?Regulating tech companies
Demographic A top priority
An important,but lowerpriority
Not tooimportant apriority
Should not bedone
Don’t know /No opinion Total N
Registered Voters 23% (455) 35% (702) 25% (491) 7% (133) 11% (210) 1990Gender: Male 25% (230) 37% (339) 24% (226) 8% (72) 6% (59) 927Gender: Female 21% (224) 34% (362) 25% (265) 6% (61) 14% (151) 1063Age: 18-34 21% (94) 32% (147) 26% (117) 6% (26) 16% (71) 456Age: 35-44 25% (75) 33% (99) 22% (67) 6% (17) 14% (41) 300Age: 45-64 24% (176) 36% (259) 25% (180) 6% (46) 9% (69) 730Age: 65+ 22% (109) 39% (196) 25% (126) 9% (44) 6% (29) 504GenZers: 1997-2012 16% (27) 23% (39) 31% (53) 6% (9) 24% (41) 169Millennials: 1981-1996 25% (119) 36% (173) 21% (103) 6% (27) 12% (58) 480GenXers: 1965-1980 22% (118) 36% (187) 25% (132) 6% (33) 11% (55) 525Baby Boomers: 1946-1964 23% (171) 37% (274) 26% (190) 8% (58) 7% (53) 746PID: Dem (no lean) 21% (158) 39% (290) 27% (200) 5% (37) 9% (66) 752PID: Ind (no lean) 21% (124) 32% (187) 26% (152) 7% (40) 13% (74) 578PID: Rep (no lean) 26% (172) 34% (224) 21% (138) 8% (56) 11% (70) 661PID/Gender: DemMen 25% (90) 36% (129) 26% (95) 7% (24) 6% (22) 359PID/Gender: DemWomen 17% (68) 41% (161) 27% (106) 3% (13) 11% (44) 393PID/Gender: Ind Men 24% (63) 35% (95) 27% (72) 7% (19) 7% (18) 267PID/Gender: Ind Women 20% (61) 30% (93) 26% (80) 7% (21) 18% (56) 311PID/Gender: Rep Men 26% (77) 38% (116) 20% (60) 10% (29) 6% (19) 301PID/Gender: Rep Women 26% (95) 30% (109) 22% (78) 8% (27) 14% (51) 360Ideo: Liberal (1-3) 21% (122) 39% (228) 27% (160) 6% (35) 8% (44) 587Ideo: Moderate (4) 19% (101) 35% (187) 29% (159) 5% (29) 12% (63) 539Ideo: Conservative (5-7) 29% (218) 36% (265) 19% (143) 8% (61) 7% (55) 742Educ: < College 23% (281) 33% (394) 25% (306) 5% (66) 14% (166) 1213Educ: Bachelors degree 22% (108) 40% (195) 23% (112) 9% (46) 6% (29) 489Educ: Post-grad 23% (66) 39% (113) 25% (73) 7% (21) 5% (16) 288Income: Under 50k 23% (224) 33% (330) 25% (252) 6% (55) 13% (130) 991Income: 50k-100k 23% (149) 36% (230) 25% (157) 8% (48) 9% (56) 640Income: 100k+ 23% (82) 40% (142) 23% (82) 8% (29) 7% (24) 359Ethnicity: White 23% (372) 35% (555) 24% (386) 7% (117) 10% (155) 1584
Continued on next page
Page 104
104
Morning ConsultTable POL2_8
Table POL2_8: How important of a priority should each of the following be for Congress?Regulating tech companies
Demographic A top priority
An important,but lowerpriority
Not tooimportant apriority
Should not bedone
Don’t know /No opinion Total N
Registered Voters 23% (455) 35% (702) 25% (491) 7% (133) 11% (210) 1990Ethnicity: Hispanic 18% (36) 39% (77) 25% (49) 6% (12) 11% (22) 196Ethnicity: Black 20% (48) 36% (87) 24% (59) 3% (8) 17% (41) 243Ethnicity: Other 21% (35) 37% (60) 28% (46) 5% (8) 9% (14) 163All Christian 25% (240) 36% (350) 23% (225) 7% (68) 8% (81) 964All Non-Christian 26% (32) 35% (43) 19% (23) 9% (10) 11% (13) 121Atheist 20% (15) 39% (29) 27% (20) 7% (5) 7% (5) 73Agnostic/Nothing in particular 18% (90) 36% (176) 29% (145) 6% (27) 11% (57) 495Something Else 23% (77) 31% (105) 23% (79) 6% (22) 16% (55) 337Religious Non-Protestant/Catholic 26% (37) 34% (47) 20% (28) 7% (10) 13% (18) 140Evangelical 27% (150) 34% (187) 23% (125) 6% (31) 10% (54) 547Non-Evangelical 22% (161) 36% (258) 24% (170) 8% (57) 10% (75) 721Community: Urban 25% (132) 36% (189) 23% (123) 6% (31) 10% (54) 529Community: Suburban 23% (226) 35% (352) 24% (241) 7% (73) 11% (106) 998Community: Rural 21% (97) 35% (160) 27% (127) 6% (29) 11% (50) 464Employ: Private Sector 26% (160) 36% (222) 24% (149) 6% (38) 8% (53) 622Employ: Government 17% (22) 37% (48) 20% (26) 11% (15) 14% (18) 129Employ: Self-Employed 26% (40) 37% (58) 23% (37) 7% (11) 7% (11) 157Employ: Homemaker 28% (35) 24% (30) 26% (33) 7% (9) 15% (19) 127Employ: Retired 24% (139) 37% (218) 24% (139) 9% (50) 6% (36) 581Employ: Unemployed 17% (37) 34% (73) 30% (64) 3% (7) 16% (33) 215Employ: Other 10% (11) 39% (44) 24% (27) 3% (4) 24% (27) 113Military HH: Yes 24% (88) 38% (136) 23% (81) 8% (29) 7% (27) 361Military HH: No 22% (366) 35% (566) 25% (409) 6% (104) 11% (183) 1629RD/WT: Right Direction 19% (181) 37% (347) 28% (265) 6% (55) 10% (93) 941RD/WT: Wrong Track 26% (273) 34% (355) 22% (226) 7% (77) 11% (117) 1049Biden Job Approve 20% (202) 39% (404) 28% (289) 5% (54) 8% (88) 1037Biden Job Disapprove 29% (246) 33% (281) 21% (180) 9% (74) 9% (78) 857
Continued on next page
Page 105
National Tracking Poll #210636, June, 2021
105
Table POL2_8
Table POL2_8: How important of a priority should each of the following be for Congress?Regulating tech companies
Demographic A top priority
An important,but lowerpriority
Not tooimportant apriority
Should not bedone
Don’t know /No opinion Total N
Registered Voters 23% (455) 35% (702) 25% (491) 7% (133) 11% (210) 1990Biden Job Strongly Approve 23% (126) 40% (219) 25% (135) 4% (24) 8% (45) 548Biden Job Somewhat Approve 16% (77) 38% (185) 32% (154) 6% (30) 9% (43) 489Biden Job Somewhat Disapprove 18% (40) 37% (84) 28% (62) 9% (21) 7% (16) 223Biden Job Strongly Disapprove 32% (206) 31% (197) 18% (117) 8% (52) 10% (61) 634Favorable of Biden 19% (202) 39% (405) 29% (299) 5% (56) 8% (87) 1048Unfavorable of Biden 28% (242) 33% (281) 21% (178) 9% (73) 9% (81) 855Very Favorable of Biden 22% (129) 39% (231) 27% (160) 5% (27) 8% (46) 593Somewhat Favorable of Biden 16% (73) 38% (174) 30% (139) 6% (29) 9% (41) 455Somewhat Unfavorable of Biden 19% (35) 32% (61) 28% (53) 10% (18) 12% (23) 190Very Unfavorable of Biden 31% (207) 33% (221) 19% (125) 8% (54) 9% (58) 664#1 Issue: Economy 22% (171) 36% (275) 25% (191) 6% (44) 11% (83) 763#1 Issue: Security 31% (108) 34% (117) 17% (60) 8% (28) 10% (36) 349#1 Issue: Health Care 16% (38) 39% (91) 27% (62) 8% (20) 10% (23) 233#1 Issue: Medicare / Social Security 18% (46) 38% (100) 29% (75) 7% (19) 8% (20) 261#1 Issue: Women’s Issues 21% (22) 30% (31) 23% (23) 6% (6) 20% (21) 103#1 Issue: Education 24% (20) 38% (32) 21% (18) 4% (4) 13% (11) 86#1 Issue: Energy 25% (21) 30% (26) 31% (26) 3% (3) 11% (10) 86#1 Issue: Other 26% (28) 28% (30) 32% (35) 8% (9) 6% (7) 1092020 Vote: Joe Biden 20% (176) 39% (353) 28% (253) 5% (46) 8% (70) 8972020 Vote: Donald Trump 28% (232) 34% (279) 20% (164) 8% (66) 10% (78) 8182020 Vote: Didn’t Vote 17% (42) 25% (60) 28% (66) 7% (16) 23% (56) 2392018 House Vote: Democrat 19% (133) 41% (280) 28% (190) 6% (40) 6% (44) 6872018 House Vote: Republican 30% (205) 35% (241) 19% (133) 9% (59) 8% (53) 6902018 House Vote: Someone else 34% (17) 23% (11) 21% (10) 8% (4) 15% (7) 502016 Vote: Hillary Clinton 20% (128) 42% (263) 25% (158) 5% (32) 8% (50) 6312016 Vote: Donald Trump 29% (224) 34% (258) 20% (156) 9% (65) 8% (65) 7682016 Vote: Other 18% (19) 37% (39) 29% (31) 10% (11) 6% (7) 1072016 Vote: Didn’t Vote 17% (84) 29% (141) 30% (146) 5% (25) 18% (88) 483
Continued on next page
Page 106
106
Morning ConsultTable POL2_8
Table POL2_8: How important of a priority should each of the following be for Congress?Regulating tech companies
Demographic A top priority
An important,but lowerpriority
Not tooimportant apriority
Should not bedone
Don’t know /No opinion Total N
Registered Voters 23% (455) 35% (702) 25% (491) 7% (133) 11% (210) 1990Voted in 2014: Yes 26% (332) 38% (488) 22% (282) 7% (95) 8% (100) 1297Voted in 2014: No 18% (123) 31% (214) 30% (208) 5% (37) 16% (110) 6934-Region: Northeast 24% (82) 37% (128) 24% (84) 6% (20) 9% (31) 3444-Region: Midwest 20% (90) 39% (176) 27% (122) 6% (29) 8% (38) 4554-Region: South 24% (178) 33% (249) 24% (178) 8% (58) 12% (92) 7554-Region: West 24% (104) 34% (149) 25% (107) 6% (25) 11% (49) 435Party: Democrat/Leans Democrat 20% (182) 38% (337) 28% (250) 5% (46) 8% (74) 888Party: Republican/Leans Republican 27% (218) 34% (277) 21% (174) 8% (62) 10% (83) 814Note: Row proportions may total to larger than one-hundred percent due to rounding. For more information visit MorningConsultIntelligence.com.
Page 107
National Tracking Poll #210636, June, 2021
107
Table POL2_9
Table POL2_9: How important of a priority should each of the following be for Congress?Stimulating the economy to recover from the coronavirus pandemic
Demographic A top priority
An important,but lowerpriority
Not tooimportant apriority
Should not bedone
Don’t know /No opinion Total N
Registered Voters 55% (1103) 24% (487) 8% (168) 6% (110) 6% (122) 1990Gender: Male 53% (491) 25% (234) 10% (96) 6% (59) 5% (48) 927Gender: Female 58% (612) 24% (253) 7% (73) 5% (50) 7% (75) 1063Age: 18-34 50% (230) 23% (106) 10% (47) 4% (18) 12% (56) 456Age: 35-44 64% (190) 20% (60) 4% (12) 6% (19) 6% (19) 300Age: 45-64 57% (418) 24% (178) 9% (63) 5% (39) 4% (32) 730Age: 65+ 53% (265) 28% (142) 9% (47) 7% (34) 3% (16) 504GenZers: 1997-2012 42% (71) 20% (35) 12% (20) 4% (7) 21% (36) 169Millennials: 1981-1996 58% (280) 22% (107) 8% (37) 5% (22) 7% (34) 480GenXers: 1965-1980 57% (302) 24% (129) 7% (36) 5% (27) 6% (31) 525Baby Boomers: 1946-1964 56% (416) 26% (197) 9% (69) 6% (47) 2% (17) 746PID: Dem (no lean) 68% (509) 23% (170) 6% (42) 1% (7) 3% (24) 752PID: Ind (no lean) 49% (282) 27% (156) 10% (58) 5% (27) 10% (55) 578PID: Rep (no lean) 47% (312) 24% (161) 10% (68) 11% (76) 7% (44) 661PID/Gender: DemMen 67% (240) 23% (83) 7% (26) 1% (3) 2% (8) 359PID/Gender: DemWomen 69% (269) 22% (87) 4% (17) 1% (4) 4% (16) 393PID/Gender: Ind Men 46% (124) 26% (69) 13% (35) 7% (18) 8% (22) 267PID/Gender: Ind Women 51% (158) 28% (87) 8% (23) 3% (10) 10% (33) 311PID/Gender: Rep Men 42% (127) 27% (83) 12% (35) 13% (39) 6% (17) 301PID/Gender: Rep Women 51% (185) 22% (78) 9% (33) 10% (37) 7% (27) 360Ideo: Liberal (1-3) 63% (369) 26% (155) 7% (42) 1% (6) 3% (15) 587Ideo: Moderate (4) 59% (316) 24% (128) 8% (45) 3% (18) 6% (33) 539Ideo: Conservative (5-7) 48% (356) 24% (182) 11% (81) 11% (85) 5% (38) 742Educ: < College 56% (681) 23% (279) 8% (92) 5% (58) 8% (103) 1213Educ: Bachelors degree 53% (261) 28% (135) 10% (47) 6% (31) 3% (15) 489Educ: Post-grad 56% (160) 25% (72) 10% (30) 7% (20) 2% (5) 288Income: Under 50k 59% (582) 22% (221) 7% (66) 3% (34) 9% (88) 991Income: 50k-100k 51% (328) 27% (173) 10% (62) 8% (49) 4% (28) 640Income: 100k+ 54% (193) 26% (92) 11% (40) 8% (27) 2% (7) 359Ethnicity: White 54% (863) 25% (399) 8% (133) 7% (104) 5% (86) 1584
Continued on next page
Page 108
108
Morning ConsultTable POL2_9
Table POL2_9: How important of a priority should each of the following be for Congress?Stimulating the economy to recover from the coronavirus pandemic
Demographic A top priority
An important,but lowerpriority
Not tooimportant apriority
Should not bedone
Don’t know /No opinion Total N
Registered Voters 55% (1103) 24% (487) 8% (168) 6% (110) 6% (122) 1990Ethnicity: Hispanic 65% (126) 19% (37) 6% (11) 3% (7) 7% (14) 196Ethnicity: Black 63% (152) 19% (46) 6% (15) 1% (3) 11% (27) 243Ethnicity: Other 54% (88) 25% (41) 12% (20) 2% (3) 6% (10) 163All Christian 54% (516) 26% (249) 9% (89) 7% (70) 4% (40) 964All Non-Christian 66% (79) 15% (18) 7% (9) 5% (6) 8% (9) 121Atheist 48% (35) 27% (20) 16% (12) 3% (2) 5% (4) 73Agnostic/Nothing in particular 54% (266) 26% (127) 9% (43) 3% (16) 9% (43) 495Something Else 61% (206) 22% (73) 5% (16) 5% (15) 8% (26) 337Religious Non-Protestant/Catholic 65% (91) 15% (21) 7% (9) 5% (7) 8% (12) 140Evangelical 52% (284) 23% (126) 11% (58) 9% (48) 6% (31) 547Non-Evangelical 58% (419) 26% (190) 6% (43) 5% (36) 4% (32) 721Community: Urban 61% (322) 22% (118) 8% (41) 3% (16) 6% (32) 529Community: Suburban 54% (535) 25% (250) 9% (87) 6% (65) 6% (61) 998Community: Rural 53% (246) 26% (119) 9% (41) 6% (29) 6% (29) 464Employ: Private Sector 56% (348) 26% (164) 9% (56) 5% (28) 4% (26) 622Employ: Government 49% (63) 28% (36) 10% (12) 6% (8) 7% (9) 129Employ: Self-Employed 59% (92) 20% (31) 14% (22) 3% (5) 4% (7) 157Employ: Homemaker 55% (70) 20% (25) 8% (11) 7% (9) 9% (11) 127Employ: Retired 56% (324) 26% (153) 8% (47) 7% (40) 3% (18) 581Employ: Unemployed 53% (115) 21% (46) 7% (16) 4% (10) 13% (29) 215Employ: Other 58% (66) 19% (22) 2% (2) 5% (5) 16% (18) 113Military HH: Yes 51% (183) 25% (92) 11% (41) 8% (28) 5% (18) 361Military HH: No 57% (920) 24% (395) 8% (128) 5% (81) 6% (104) 1629RD/WT: Right Direction 63% (597) 25% (234) 6% (56) 1% (10) 5% (44) 941RD/WT: Wrong Track 48% (506) 24% (253) 11% (112) 10% (100) 7% (78) 1049Biden Job Approve 65% (675) 25% (255) 6% (63) 1% (7) 4% (36) 1037Biden Job Disapprove 45% (389) 25% (218) 12% (100) 12% (102) 6% (49) 857
Continued on next page
Page 109
National Tracking Poll #210636, June, 2021
109
Table POL2_9
Table POL2_9: How important of a priority should each of the following be for Congress?Stimulating the economy to recover from the coronavirus pandemic
Demographic A top priority
An important,but lowerpriority
Not tooimportant apriority
Should not bedone
Don’t know /No opinion Total N
Registered Voters 55% (1103) 24% (487) 8% (168) 6% (110) 6% (122) 1990Biden Job Strongly Approve 70% (381) 21% (116) 5% (29) — (3) 3% (19) 548Biden Job Somewhat Approve 60% (294) 28% (138) 7% (34) 1% (5) 4% (18) 489Biden Job Somewhat Disapprove 50% (111) 30% (68) 11% (24) 7% (16) 2% (5) 223Biden Job Strongly Disapprove 44% (278) 24% (150) 12% (75) 14% (86) 7% (44) 634Favorable of Biden 64% (676) 26% (269) 6% (59) 1% (8) 3% (36) 1048Unfavorable of Biden 46% (393) 24% (205) 12% (104) 11% (98) 6% (54) 855Very Favorable of Biden 70% (417) 22% (129) 4% (26) 1% (4) 3% (17) 593Somewhat Favorable of Biden 57% (259) 31% (140) 7% (33) 1% (4) 4% (20) 455Somewhat Unfavorable of Biden 56% (107) 23% (44) 10% (19) 5% (10) 5% (10) 190Very Unfavorable of Biden 43% (286) 24% (161) 13% (85) 13% (87) 7% (45) 664#1 Issue: Economy 60% (460) 21% (161) 7% (55) 6% (43) 6% (44) 763#1 Issue: Security 42% (148) 28% (98) 10% (37) 12% (42) 7% (24) 349#1 Issue: Health Care 63% (146) 24% (55) 6% (15) 3% (7) 4% (10) 233#1 Issue: Medicare / Social Security 61% (158) 27% (70) 8% (20) 2% (6) 2% (6) 261#1 Issue: Women’s Issues 46% (47) 30% (31) 9% (10) 3% (3) 11% (12) 103#1 Issue: Education 53% (45) 27% (23) 7% (6) 3% (3) 9% (8) 86#1 Issue: Energy 48% (41) 26% (23) 14% (12) 1% (1) 11% (10) 86#1 Issue: Other 52% (57) 23% (25) 13% (14) 5% (5) 7% (8) 1092020 Vote: Joe Biden 65% (581) 25% (227) 6% (55) 1% (6) 3% (28) 8972020 Vote: Donald Trump 46% (377) 25% (209) 11% (93) 11% (93) 6% (47) 8182020 Vote: Didn’t Vote 53% (128) 17% (41) 7% (17) 4% (9) 18% (44) 2392018 House Vote: Democrat 66% (452) 26% (181) 5% (35) 1% (7) 2% (12) 6872018 House Vote: Republican 46% (317) 25% (172) 12% (86) 12% (82) 5% (33) 6902018 House Vote: Someone else 62% (31) 18% (9) 6% (3) 2% (1) 12% (6) 502016 Vote: Hillary Clinton 66% (415) 26% (167) 5% (31) 1% (4) 2% (14) 6312016 Vote: Donald Trump 47% (362) 25% (190) 11% (83) 11% (85) 6% (47) 7682016 Vote: Other 59% (63) 20% (22) 14% (16) 3% (3) 4% (4) 1072016 Vote: Didn’t Vote 54% (263) 22% (107) 8% (38) 4% (17) 12% (58) 483
Continued on next page
Page 110
110
Morning ConsultTable POL2_9
Table POL2_9: How important of a priority should each of the following be for Congress?Stimulating the economy to recover from the coronavirus pandemic
Demographic A top priority
An important,but lowerpriority
Not tooimportant apriority
Should not bedone
Don’t know /No opinion Total N
Registered Voters 55% (1103) 24% (487) 8% (168) 6% (110) 6% (122) 1990Voted in 2014: Yes 56% (731) 24% (318) 9% (112) 7% (87) 4% (50) 1297Voted in 2014: No 54% (373) 24% (169) 8% (57) 3% (22) 10% (73) 6934-Region: Northeast 59% (203) 24% (81) 8% (26) 4% (15) 6% (19) 3444-Region: Midwest 55% (250) 30% (138) 6% (28) 6% (26) 3% (14) 4554-Region: South 54% (410) 23% (171) 9% (70) 6% (45) 8% (60) 7554-Region: West 55% (240) 22% (97) 10% (44) 6% (24) 7% (30) 435Party: Democrat/Leans Democrat 66% (583) 24% (215) 6% (55) 1% (8) 3% (27) 888Party: Republican/Leans Republican 48% (389) 24% (196) 11% (90) 11% (89) 6% (49) 814Note: Row proportions may total to larger than one-hundred percent due to rounding. For more information visit MorningConsultIntelligence.com.
Page 111
National Tracking Poll #210636, June, 2021
111
Table POL2_10
Table POL2_10: How important of a priority should each of the following be for Congress?Eliminating the legislative filibuster in the Senate
Demographic A top priority
An important,but lowerpriority
Not tooimportant apriority
Should not bedone
Don’t know /No opinion Total N
Registered Voters 23% (450) 23% (455) 15% (299) 20% (393) 20% (393) 1990Gender: Male 25% (229) 23% (213) 16% (147) 24% (220) 13% (118) 927Gender: Female 21% (221) 23% (242) 14% (152) 16% (173) 26% (275) 1063Age: 18-34 20% (91) 24% (111) 19% (85) 8% (38) 29% (132) 456Age: 35-44 20% (61) 27% (82) 15% (44) 12% (37) 26% (77) 300Age: 45-64 22% (160) 22% (164) 15% (113) 23% (165) 18% (129) 730Age: 65+ 28% (139) 20% (99) 11% (57) 30% (153) 11% (55) 504GenZers: 1997-2012 12% (21) 27% (45) 17% (29) 5% (8) 39% (67) 169Millennials: 1981-1996 22% (106) 24% (117) 18% (85) 12% (56) 24% (117) 480GenXers: 1965-1980 21% (113) 25% (131) 17% (92) 15% (81) 21% (109) 525Baby Boomers: 1946-1964 26% (194) 21% (154) 12% (89) 29% (216) 12% (93) 746PID: Dem (no lean) 37% (281) 29% (221) 13% (94) 5% (37) 16% (118) 752PID: Ind (no lean) 18% (101) 19% (112) 17% (98) 22% (127) 24% (139) 578PID: Rep (no lean) 10% (68) 18% (122) 16% (106) 35% (229) 21% (136) 661PID/Gender: DemMen 42% (151) 29% (105) 13% (46) 6% (21) 10% (35) 359PID/Gender: DemWomen 33% (130) 30% (116) 12% (48) 4% (15) 21% (83) 393PID/Gender: Ind Men 18% (48) 19% (50) 18% (48) 30% (80) 15% (41) 267PID/Gender: Ind Women 17% (54) 20% (62) 16% (50) 15% (47) 32% (98) 311PID/Gender: Rep Men 10% (31) 19% (58) 17% (53) 39% (118) 14% (42) 301PID/Gender: Rep Women 10% (37) 18% (64) 15% (53) 31% (111) 26% (94) 360Ideo: Liberal (1-3) 40% (234) 27% (161) 15% (86) 4% (23) 14% (83) 587Ideo: Moderate (4) 19% (104) 27% (148) 19% (101) 11% (61) 23% (126) 539Ideo: Conservative (5-7) 13% (99) 17% (128) 14% (103) 41% (302) 15% (110) 742Educ: < College 20% (242) 22% (272) 15% (186) 18% (216) 25% (298) 1213Educ: Bachelors degree 28% (137) 21% (102) 14% (69) 24% (118) 13% (63) 489Educ: Post-grad 25% (72) 28% (82) 15% (44) 20% (58) 11% (32) 288Income: Under 50k 22% (217) 23% (233) 15% (147) 17% (170) 23% (225) 991Income: 50k-100k 22% (138) 21% (134) 15% (99) 23% (147) 19% (121) 640Income: 100k+ 26% (95) 24% (88) 15% (54) 21% (76) 13% (47) 359Ethnicity: White 22% (345) 21% (338) 15% (232) 23% (359) 20% (310) 1584
Continued on next page
Page 112
112
Morning ConsultTable POL2_10
Table POL2_10: How important of a priority should each of the following be for Congress?Eliminating the legislative filibuster in the Senate
Demographic A top priority
An important,but lowerpriority
Not tooimportant apriority
Should not bedone
Don’t know /No opinion Total N
Registered Voters 23% (450) 23% (455) 15% (299) 20% (393) 20% (393) 1990Ethnicity: Hispanic 23% (46) 30% (59) 13% (25) 6% (13) 27% (53) 196Ethnicity: Black 29% (70) 31% (76) 13% (31) 5% (13) 22% (53) 243Ethnicity: Other 21% (35) 25% (41) 22% (35) 13% (21) 19% (31) 163All Christian 20% (191) 24% (231) 14% (140) 26% (252) 16% (150) 964All Non-Christian 40% (49) 23% (28) 8% (10) 11% (14) 17% (20) 121Atheist 37% (27) 19% (14) 14% (10) 11% (8) 18% (13) 73Agnostic/Nothing in particular 24% (117) 20% (100) 16% (79) 15% (77) 25% (122) 495Something Else 20% (66) 24% (82) 18% (59) 13% (42) 26% (87) 337Religious Non-Protestant/Catholic 35% (49) 25% (34) 11% (15) 11% (16) 18% (26) 140Evangelical 18% (101) 25% (135) 15% (80) 25% (137) 17% (95) 547Non-Evangelical 21% (155) 23% (167) 15% (111) 21% (154) 19% (135) 721Community: Urban 28% (148) 27% (144) 16% (84) 11% (61) 17% (92) 529Community: Suburban 23% (225) 20% (198) 15% (150) 23% (226) 20% (198) 998Community: Rural 17% (77) 24% (112) 14% (65) 23% (107) 22% (103) 464Employ: Private Sector 22% (136) 24% (147) 19% (116) 18% (109) 18% (113) 622Employ: Government 18% (23) 30% (39) 18% (23) 14% (18) 19% (25) 129Employ: Self-Employed 29% (45) 26% (42) 12% (19) 17% (27) 16% (25) 157Employ: Homemaker 18% (22) 20% (25) 13% (16) 22% (28) 28% (35) 127Employ: Retired 27% (156) 21% (120) 10% (60) 31% (179) 11% (66) 581Employ: Unemployed 19% (41) 27% (58) 16% (34) 10% (22) 28% (60) 215Employ: Other 17% (19) 15% (17) 19% (21) 5% (5) 44% (50) 113Military HH: Yes 21% (75) 19% (68) 14% (50) 30% (108) 17% (61) 361Military HH: No 23% (375) 24% (387) 15% (249) 17% (285) 20% (332) 1629RD/WT: Right Direction 36% (335) 28% (261) 15% (142) 5% (47) 17% (157) 941RD/WT: Wrong Track 11% (116) 19% (194) 15% (156) 33% (346) 23% (236) 1049Biden Job Approve 35% (364) 29% (304) 16% (163) 5% (49) 15% (157) 1037Biden Job Disapprove 10% (82) 16% (138) 15% (130) 40% (341) 19% (167) 857
Continued on next page
Page 113
National Tracking Poll #210636, June, 2021
113
Table POL2_10
Table POL2_10: How important of a priority should each of the following be for Congress?Eliminating the legislative filibuster in the Senate
Demographic A top priority
An important,but lowerpriority
Not tooimportant apriority
Should not bedone
Don’t know /No opinion Total N
Registered Voters 23% (450) 23% (455) 15% (299) 20% (393) 20% (393) 1990Biden Job Strongly Approve 46% (249) 28% (154) 10% (55) 4% (22) 12% (67) 548Biden Job Somewhat Approve 24% (115) 31% (150) 22% (108) 6% (27) 18% (89) 489Biden Job Somewhat Disapprove 15% (34) 18% (41) 23% (51) 19% (42) 25% (56) 223Biden Job Strongly Disapprove 7% (47) 15% (97) 12% (79) 47% (299) 18% (111) 634Favorable of Biden 35% (371) 28% (298) 15% (162) 5% (49) 16% (169) 1048Unfavorable of Biden 9% (76) 17% (142) 15% (130) 39% (336) 20% (171) 855Very Favorable of Biden 46% (274) 27% (161) 11% (65) 4% (23) 12% (70) 593Somewhat Favorable of Biden 21% (97) 30% (137) 21% (96) 6% (26) 22% (99) 455Somewhat Unfavorable of Biden 14% (26) 19% (37) 21% (40) 16% (31) 30% (57) 190Very Unfavorable of Biden 8% (50) 16% (105) 14% (91) 46% (304) 17% (114) 664#1 Issue: Economy 17% (133) 24% (183) 17% (130) 21% (159) 21% (159) 763#1 Issue: Security 15% (52) 15% (54) 13% (46) 40% (140) 17% (58) 349#1 Issue: Health Care 30% (71) 29% (69) 19% (44) 5% (12) 16% (37) 233#1 Issue: Medicare / Social Security 33% (87) 26% (68) 10% (25) 14% (36) 17% (44) 261#1 Issue: Women’s Issues 26% (27) 25% (25) 14% (14) 5% (5) 31% (32) 103#1 Issue: Education 26% (23) 23% (20) 20% (17) 8% (7) 22% (19) 86#1 Issue: Energy 28% (24) 20% (17) 14% (12) 4% (4) 34% (29) 86#1 Issue: Other 32% (34) 17% (19) 10% (11) 27% (30) 14% (15) 1092020 Vote: Joe Biden 38% (337) 29% (262) 14% (126) 5% (45) 14% (127) 8972020 Vote: Donald Trump 9% (74) 16% (134) 15% (124) 40% (328) 19% (159) 8182020 Vote: Didn’t Vote 14% (33) 21% (49) 18% (43) 6% (15) 41% (98) 2392018 House Vote: Democrat 42% (287) 29% (199) 15% (101) 5% (35) 10% (66) 6872018 House Vote: Republican 11% (73) 17% (115) 14% (100) 42% (287) 17% (115) 6902018 House Vote: Someone else 24% (12) 16% (8) 12% (6) 15% (8) 32% (16) 502016 Vote: Hillary Clinton 42% (264) 29% (181) 13% (79) 5% (33) 12% (74) 6312016 Vote: Donald Trump 11% (83) 17% (134) 14% (111) 40% (305) 18% (135) 7682016 Vote: Other 23% (25) 25% (27) 20% (21) 19% (20) 13% (14) 1072016 Vote: Didn’t Vote 16% (77) 23% (113) 18% (87) 7% (35) 35% (171) 483
Continued on next page
Page 114
114
Morning ConsultTable POL2_10
Table POL2_10: How important of a priority should each of the following be for Congress?Eliminating the legislative filibuster in the Senate
Demographic A top priority
An important,but lowerpriority
Not tooimportant apriority
Should not bedone
Don’t know /No opinion Total N
Registered Voters 23% (450) 23% (455) 15% (299) 20% (393) 20% (393) 1990Voted in 2014: Yes 26% (343) 23% (294) 14% (176) 24% (312) 13% (172) 1297Voted in 2014: No 15% (107) 23% (161) 18% (122) 12% (81) 32% (221) 6934-Region: Northeast 27% (92) 26% (89) 13% (46) 15% (52) 19% (65) 3444-Region: Midwest 23% (104) 24% (111) 14% (62) 21% (97) 18% (81) 4554-Region: South 21% (156) 22% (166) 15% (116) 21% (156) 21% (161) 7554-Region: West 23% (98) 20% (88) 17% (74) 20% (88) 20% (87) 435Party: Democrat/Leans Democrat 38% (335) 29% (255) 13% (115) 5% (45) 15% (138) 888Party: Republican/Leans Republican 10% (79) 18% (146) 16% (133) 36% (293) 20% (163) 814Note: Row proportions may total to larger than one-hundred percent due to rounding. For more information visit MorningConsultIntelligence.com.
Page 115
National Tracking Poll #210636, June, 2021
115
Table POL2_11
Table POL2_11: How important of a priority should each of the following be for Congress?Passing a bill to legalize marijuana
Demographic A top priority
An important,but lowerpriority
Not tooimportant apriority
Should not bedone
Don’t know /No opinion Total N
Registered Voters 19% (385) 20% (408) 32% (628) 22% (429) 7% (141) 1990Gender: Male 20% (189) 22% (205) 32% (298) 19% (173) 7% (62) 927Gender: Female 18% (197) 19% (203) 31% (329) 24% (256) 7% (78) 1063Age: 18-34 26% (119) 24% (109) 27% (122) 13% (57) 11% (49) 456Age: 35-44 30% (90) 20% (59) 29% (86) 14% (41) 8% (24) 300Age: 45-64 17% (125) 21% (151) 33% (241) 24% (174) 5% (38) 730Age: 65+ 10% (51) 18% (89) 35% (178) 31% (157) 6% (29) 504GenZers: 1997-2012 22% (37) 21% (35) 25% (43) 15% (26) 17% (29) 169Millennials: 1981-1996 29% (137) 24% (115) 27% (131) 12% (58) 8% (38) 480GenXers: 1965-1980 22% (116) 21% (108) 32% (166) 19% (100) 7% (35) 525Baby Boomers: 1946-1964 12% (93) 19% (143) 34% (256) 29% (219) 5% (35) 746PID: Dem (no lean) 24% (183) 25% (189) 34% (257) 10% (77) 6% (45) 752PID: Ind (no lean) 20% (116) 20% (114) 33% (192) 17% (97) 10% (58) 578PID: Rep (no lean) 13% (86) 16% (104) 27% (178) 38% (254) 6% (38) 661PID/Gender: DemMen 29% (103) 26% (95) 31% (113) 8% (30) 5% (19) 359PID/Gender: DemWomen 21% (81) 24% (94) 37% (144) 12% (48) 7% (26) 393PID/Gender: Ind Men 17% (46) 19% (51) 36% (97) 18% (47) 10% (27) 267PID/Gender: Ind Women 22% (70) 21% (64) 31% (96) 16% (51) 10% (31) 311PID/Gender: Rep Men 13% (40) 20% (59) 29% (89) 32% (97) 6% (17) 301PID/Gender: Rep Women 13% (46) 13% (45) 25% (89) 44% (158) 6% (21) 360Ideo: Liberal (1-3) 27% (158) 29% (168) 31% (183) 9% (51) 5% (28) 587Ideo: Moderate (4) 21% (113) 19% (104) 35% (187) 17% (91) 8% (44) 539Ideo: Conservative (5-7) 11% (84) 16% (121) 31% (227) 37% (277) 5% (35) 742Educ: < College 22% (261) 19% (226) 30% (359) 22% (268) 8% (99) 1213Educ: Bachelors degree 16% (76) 25% (121) 36% (177) 17% (85) 6% (30) 489Educ: Post-grad 17% (48) 21% (61) 32% (92) 26% (76) 4% (11) 288Income: Under 50k 23% (223) 20% (199) 29% (285) 20% (198) 9% (86) 991Income: 50k-100k 15% (99) 21% (132) 35% (225) 23% (148) 6% (36) 640Income: 100k+ 18% (63) 21% (77) 33% (117) 23% (83) 5% (18) 359Ethnicity: White 19% (298) 20% (317) 31% (494) 24% (375) 6% (100) 1584
Continued on next page
Page 116
116
Morning ConsultTable POL2_11
Table POL2_11: How important of a priority should each of the following be for Congress?Passing a bill to legalize marijuana
Demographic A top priority
An important,but lowerpriority
Not tooimportant apriority
Should not bedone
Don’t know /No opinion Total N
Registered Voters 19% (385) 20% (408) 32% (628) 22% (429) 7% (141) 1990Ethnicity: Hispanic 27% (53) 20% (39) 27% (53) 15% (29) 11% (22) 196Ethnicity: Black 24% (59) 19% (47) 34% (82) 11% (27) 11% (27) 243Ethnicity: Other 17% (29) 27% (44) 31% (51) 16% (27) 8% (13) 163All Christian 13% (121) 19% (182) 33% (317) 30% (288) 6% (55) 964All Non-Christian 26% (31) 28% (34) 23% (28) 11% (13) 12% (14) 121Atheist 22% (16) 31% (23) 31% (22) 8% (6) 8% (6) 73Agnostic/Nothing in particular 28% (141) 21% (106) 31% (153) 12% (58) 8% (37) 495Something Else 22% (75) 19% (63) 32% (106) 19% (63) 8% (28) 337Religious Non-Protestant/Catholic 25% (36) 25% (35) 24% (33) 14% (20) 12% (17) 140Evangelical 16% (89) 19% (102) 29% (158) 30% (166) 6% (31) 547Non-Evangelical 14% (101) 19% (137) 36% (258) 24% (175) 7% (49) 721Community: Urban 27% (143) 24% (127) 28% (147) 15% (80) 6% (32) 529Community: Suburban 16% (155) 20% (197) 34% (336) 24% (234) 8% (76) 998Community: Rural 19% (88) 18% (84) 31% (145) 25% (115) 7% (33) 464Employ: Private Sector 23% (142) 22% (137) 33% (204) 17% (108) 5% (30) 622Employ: Government 14% (18) 27% (34) 29% (37) 23% (30) 7% (9) 129Employ: Self-Employed 24% (37) 25% (39) 28% (44) 14% (23) 8% (13) 157Employ: Homemaker 26% (33) 16% (21) 25% (32) 27% (34) 6% (7) 127Employ: Retired 13% (76) 17% (98) 35% (204) 31% (178) 4% (26) 581Employ: Unemployed 21% (44) 23% (49) 34% (73) 10% (21) 13% (28) 215Employ: Other 19% (21) 17% (19) 20% (23) 24% (27) 20% (22) 113Military HH: Yes 15% (54) 18% (64) 32% (117) 29% (105) 6% (22) 361Military HH: No 20% (331) 21% (344) 31% (511) 20% (324) 7% (119) 1629RD/WT: Right Direction 24% (230) 23% (219) 35% (327) 11% (102) 7% (64) 941RD/WT: Wrong Track 15% (155) 18% (189) 29% (301) 31% (327) 7% (76) 1049Biden Job Approve 24% (252) 24% (252) 35% (360) 11% (115) 6% (59) 1037Biden Job Disapprove 14% (118) 16% (138) 29% (247) 36% (305) 6% (49) 857
Continued on next page
Page 117
National Tracking Poll #210636, June, 2021
117
Table POL2_11
Table POL2_11: How important of a priority should each of the following be for Congress?Passing a bill to legalize marijuana
Demographic A top priority
An important,but lowerpriority
Not tooimportant apriority
Should not bedone
Don’t know /No opinion Total N
Registered Voters 19% (385) 20% (408) 32% (628) 22% (429) 7% (141) 1990Biden Job Strongly Approve 28% (155) 24% (130) 34% (185) 8% (46) 6% (33) 548Biden Job Somewhat Approve 20% (97) 25% (122) 36% (175) 14% (69) 5% (27) 489Biden Job Somewhat Disapprove 17% (38) 20% (44) 35% (78) 25% (56) 3% (7) 223Biden Job Strongly Disapprove 13% (80) 15% (93) 27% (169) 39% (249) 7% (42) 634Favorable of Biden 24% (255) 24% (252) 35% (368) 11% (112) 6% (61) 1048Unfavorable of Biden 13% (115) 17% (142) 28% (243) 36% (309) 5% (46) 855Very Favorable of Biden 28% (164) 23% (137) 36% (211) 8% (48) 6% (33) 593Somewhat Favorable of Biden 20% (91) 25% (115) 34% (157) 14% (64) 6% (28) 455Somewhat Unfavorable of Biden 16% (30) 23% (44) 31% (58) 25% (47) 6% (11) 190Very Unfavorable of Biden 13% (85) 15% (98) 28% (185) 39% (262) 5% (35) 664#1 Issue: Economy 19% (149) 22% (167) 32% (244) 20% (149) 7% (55) 763#1 Issue: Security 13% (44) 17% (58) 28% (99) 37% (129) 6% (20) 349#1 Issue: Health Care 24% (55) 23% (54) 36% (84) 11% (26) 6% (14) 233#1 Issue: Medicare / Social Security 20% (52) 19% (50) 29% (76) 26% (68) 6% (15) 261#1 Issue: Women’s Issues 23% (23) 23% (24) 30% (31) 9% (9) 15% (16) 103#1 Issue: Education 22% (18) 15% (13) 42% (36) 15% (13) 6% (5) 86#1 Issue: Energy 27% (23) 17% (15) 30% (26) 12% (10) 14% (12) 86#1 Issue: Other 19% (21) 25% (27) 30% (33) 23% (25) 3% (3) 1092020 Vote: Joe Biden 24% (211) 25% (229) 35% (311) 11% (100) 5% (46) 8972020 Vote: Donald Trump 13% (105) 16% (129) 29% (240) 36% (295) 6% (49) 8182020 Vote: Didn’t Vote 25% (59) 18% (44) 28% (66) 13% (30) 17% (40) 2392018 House Vote: Democrat 25% (171) 26% (175) 36% (251) 10% (66) 4% (24) 6872018 House Vote: Republican 11% (73) 16% (107) 29% (202) 40% (273) 5% (34) 6902018 House Vote: Someone else 42% (21) 8% (4) 18% (9) 16% (8) 16% (8) 502016 Vote: Hillary Clinton 23% (143) 26% (161) 36% (227) 11% (67) 5% (33) 6312016 Vote: Donald Trump 14% (104) 15% (117) 29% (223) 37% (283) 5% (41) 7682016 Vote: Other 27% (29) 27% (29) 29% (31) 13% (14) 4% (4) 1072016 Vote: Didn’t Vote 23% (109) 21% (100) 30% (147) 14% (66) 13% (62) 483
Continued on next page
Page 118
118
Morning ConsultTable POL2_11
Table POL2_11: How important of a priority should each of the following be for Congress?Passing a bill to legalize marijuana
Demographic A top priority
An important,but lowerpriority
Not tooimportant apriority
Should not bedone
Don’t know /No opinion Total N
Registered Voters 19% (385) 20% (408) 32% (628) 22% (429) 7% (141) 1990Voted in 2014: Yes 18% (234) 20% (259) 32% (417) 25% (325) 5% (63) 1297Voted in 2014: No 22% (151) 22% (149) 30% (210) 15% (104) 11% (78) 6934-Region: Northeast 20% (68) 23% (78) 32% (109) 19% (67) 7% (23) 3444-Region: Midwest 18% (83) 21% (95) 35% (161) 22% (100) 4% (16) 4554-Region: South 21% (156) 21% (158) 30% (223) 21% (158) 8% (60) 7554-Region: West 18% (78) 18% (76) 31% (134) 24% (105) 10% (42) 435Party: Democrat/Leans Democrat 25% (218) 26% (231) 34% (305) 10% (85) 6% (49) 888Party: Republican/Leans Republican 13% (107) 16% (129) 29% (237) 37% (297) 5% (44) 814Note: Row proportions may total to larger than one-hundred percent due to rounding. For more information visit MorningConsultIntelligence.com.
Page 119
National Tracking Poll #210636, June, 2021
119
Table POL2_12
Table POL2_12: How important of a priority should each of the following be for Congress?Passing a bill to provide relief to Americans with student loan debt
Demographic A top priority
An important,but lowerpriority
Not tooimportant apriority
Should not bedone
Don’t know /No opinion Total N
Registered Voters 24% (476) 25% (496) 19% (386) 25% (495) 7% (137) 1990Gender: Male 22% (200) 25% (232) 20% (182) 28% (257) 6% (55) 927Gender: Female 26% (276) 25% (264) 19% (203) 22% (237) 8% (82) 1063Age: 18-34 34% (157) 29% (133) 14% (62) 10% (47) 13% (58) 456Age: 35-44 34% (103) 29% (86) 13% (40) 15% (45) 9% (27) 300Age: 45-64 18% (135) 23% (169) 22% (158) 32% (231) 5% (37) 730Age: 65+ 16% (82) 21% (108) 25% (127) 34% (172) 3% (15) 504GenZers: 1997-2012 33% (56) 28% (48) 10% (18) 9% (16) 19% (32) 169Millennials: 1981-1996 36% (171) 30% (142) 14% (68) 12% (56) 9% (43) 480GenXers: 1965-1980 23% (123) 28% (149) 19% (100) 22% (117) 7% (37) 525Baby Boomers: 1946-1964 16% (122) 18% (138) 24% (182) 38% (281) 3% (23) 746PID: Dem (no lean) 37% (276) 31% (236) 19% (144) 7% (56) 5% (40) 752PID: Ind (no lean) 21% (121) 24% (140) 20% (117) 24% (140) 10% (60) 578PID: Rep (no lean) 12% (80) 18% (120) 19% (124) 45% (299) 6% (37) 661PID/Gender: DemMen 35% (126) 34% (122) 20% (73) 8% (28) 3% (10) 359PID/Gender: DemWomen 38% (150) 29% (114) 18% (72) 7% (28) 8% (30) 393PID/Gender: Ind Men 18% (49) 20% (55) 22% (59) 30% (81) 9% (24) 267PID/Gender: Ind Women 23% (72) 27% (85) 19% (58) 19% (60) 12% (36) 311PID/Gender: Rep Men 9% (26) 18% (55) 17% (51) 49% (149) 7% (21) 301PID/Gender: Rep Women 15% (54) 18% (65) 20% (74) 42% (150) 5% (17) 360Ideo: Liberal (1-3) 38% (222) 31% (183) 20% (116) 8% (44) 4% (22) 587Ideo: Moderate (4) 23% (126) 28% (152) 22% (117) 18% (97) 9% (47) 539Ideo: Conservative (5-7) 12% (87) 18% (137) 19% (139) 47% (346) 5% (34) 742Educ: < College 23% (275) 26% (320) 19% (234) 22% (272) 9% (112) 1213Educ: Bachelors degree 25% (121) 23% (111) 19% (94) 30% (146) 3% (16) 489Educ: Post-grad 28% (80) 23% (65) 20% (57) 27% (77) 3% (9) 288Income: Under 50k 26% (258) 26% (261) 19% (193) 19% (189) 9% (90) 991Income: 50k-100k 21% (132) 24% (153) 19% (123) 30% (192) 6% (40) 640Income: 100k+ 24% (86) 23% (82) 20% (70) 32% (114) 2% (7) 359Ethnicity: White 21% (336) 24% (380) 20% (323) 29% (453) 6% (93) 1584
Continued on next page
Page 120
120
Morning ConsultTable POL2_12
Table POL2_12: How important of a priority should each of the following be for Congress?Passing a bill to provide relief to Americans with student loan debt
Demographic A top priority
An important,but lowerpriority
Not tooimportant apriority
Should not bedone
Don’t know /No opinion Total N
Registered Voters 24% (476) 25% (496) 19% (386) 25% (495) 7% (137) 1990Ethnicity: Hispanic 33% (64) 30% (59) 12% (24) 13% (25) 12% (24) 196Ethnicity: Black 41% (100) 29% (70) 14% (34) 5% (12) 11% (26) 243Ethnicity: Other 25% (41) 28% (46) 18% (29) 18% (30) 11% (18) 163All Christian 19% (182) 23% (224) 22% (214) 32% (307) 4% (37) 964All Non-Christian 37% (45) 27% (32) 11% (13) 13% (16) 11% (14) 121Atheist 30% (22) 25% (18) 19% (14) 18% (13) 8% (6) 73Agnostic/Nothing in particular 26% (129) 29% (142) 17% (83) 19% (96) 9% (46) 495Something Else 29% (98) 24% (79) 18% (62) 19% (63) 10% (35) 337Religious Non-Protestant/Catholic 35% (49) 25% (35) 14% (20) 16% (22) 10% (14) 140Evangelical 24% (129) 23% (124) 17% (95) 31% (167) 6% (32) 547Non-Evangelical 20% (146) 24% (170) 24% (173) 27% (193) 5% (39) 721Community: Urban 33% (174) 30% (158) 17% (87) 13% (70) 7% (39) 529Community: Suburban 21% (209) 24% (234) 20% (197) 29% (291) 7% (66) 998Community: Rural 20% (94) 22% (104) 22% (101) 29% (133) 7% (32) 464Employ: Private Sector 28% (173) 26% (162) 19% (115) 22% (139) 5% (31) 622Employ: Government 25% (32) 24% (31) 17% (22) 23% (29) 11% (14) 129Employ: Self-Employed 27% (42) 29% (45) 17% (26) 22% (34) 6% (9) 157Employ: Homemaker 23% (29) 24% (30) 17% (22) 28% (35) 8% (11) 127Employ: Retired 16% (91) 20% (117) 25% (144) 36% (211) 3% (18) 581Employ: Unemployed 22% (47) 34% (73) 18% (40) 14% (31) 12% (25) 215Employ: Other 37% (41) 22% (25) 13% (15) 8% (9) 21% (23) 113Military HH: Yes 19% (67) 20% (73) 23% (82) 33% (120) 5% (20) 361Military HH: No 25% (409) 26% (423) 19% (304) 23% (375) 7% (117) 1629RD/WT: Right Direction 34% (317) 30% (281) 21% (198) 9% (84) 7% (62) 941RD/WT: Wrong Track 15% (159) 21% (215) 18% (188) 39% (410) 7% (75) 1049Biden Job Approve 35% (359) 31% (324) 21% (216) 8% (86) 5% (52) 1037Biden Job Disapprove 12% (100) 17% (149) 19% (162) 47% (401) 5% (45) 857
Continued on next page
Page 121
National Tracking Poll #210636, June, 2021
121
Table POL2_12
Table POL2_12: How important of a priority should each of the following be for Congress?Passing a bill to provide relief to Americans with student loan debt
Demographic A top priority
An important,but lowerpriority
Not tooimportant apriority
Should not bedone
Don’t know /No opinion Total N
Registered Voters 24% (476) 25% (496) 19% (386) 25% (495) 7% (137) 1990Biden Job Strongly Approve 40% (219) 28% (156) 19% (106) 7% (36) 6% (31) 548Biden Job Somewhat Approve 29% (140) 34% (168) 22% (110) 10% (50) 4% (21) 489Biden Job Somewhat Disapprove 20% (44) 26% (59) 21% (46) 28% (63) 5% (11) 223Biden Job Strongly Disapprove 9% (56) 14% (91) 18% (116) 53% (338) 5% (33) 634Favorable of Biden 33% (351) 31% (329) 21% (216) 9% (94) 6% (58) 1048Unfavorable of Biden 13% (108) 18% (153) 19% (163) 45% (389) 5% (42) 855Very Favorable of Biden 39% (229) 29% (172) 21% (123) 7% (40) 5% (30) 593Somewhat Favorable of Biden 27% (122) 35% (158) 20% (93) 12% (54) 6% (28) 455Somewhat Unfavorable of Biden 24% (46) 28% (53) 21% (40) 22% (42) 5% (10) 190Very Unfavorable of Biden 9% (62) 15% (100) 18% (123) 52% (347) 5% (32) 664#1 Issue: Economy 21% (162) 27% (205) 17% (126) 28% (214) 7% (56) 763#1 Issue: Security 15% (51) 17% (59) 22% (77) 40% (139) 7% (23) 349#1 Issue: Health Care 34% (78) 31% (73) 20% (46) 11% (25) 5% (12) 233#1 Issue: Medicare / Social Security 20% (52) 25% (65) 27% (71) 25% (65) 3% (8) 261#1 Issue: Women’s Issues 40% (41) 25% (25) 12% (13) 10% (10) 14% (14) 103#1 Issue: Education 44% (38) 19% (16) 18% (16) 10% (9) 9% (7) 86#1 Issue: Energy 34% (29) 31% (26) 17% (14) 4% (3) 15% (13) 86#1 Issue: Other 23% (25) 24% (26) 21% (23) 28% (30) 4% (4) 1092020 Vote: Joe Biden 34% (302) 32% (283) 21% (191) 9% (82) 4% (40) 8972020 Vote: Donald Trump 13% (104) 17% (137) 18% (148) 47% (388) 5% (42) 8182020 Vote: Didn’t Vote 26% (63) 27% (64) 18% (42) 8% (18) 22% (52) 2392018 House Vote: Democrat 34% (236) 32% (222) 21% (143) 10% (69) 2% (17) 6872018 House Vote: Republican 11% (77) 17% (121) 18% (126) 48% (333) 5% (33) 6902018 House Vote: Someone else 31% (16) 26% (13) 18% (9) 13% (6) 11% (6) 502016 Vote: Hillary Clinton 33% (210) 33% (206) 22% (139) 8% (53) 4% (23) 6312016 Vote: Donald Trump 13% (101) 16% (126) 18% (141) 47% (360) 5% (41) 7682016 Vote: Other 28% (30) 24% (25) 22% (23) 23% (25) 3% (3) 1072016 Vote: Didn’t Vote 28% (135) 29% (139) 17% (82) 12% (57) 14% (70) 483
Continued on next page
Page 122
122
Morning ConsultTable POL2_12
Table POL2_12: How important of a priority should each of the following be for Congress?Passing a bill to provide relief to Americans with student loan debt
Demographic A top priority
An important,but lowerpriority
Not tooimportant apriority
Should not bedone
Don’t know /No opinion Total N
Registered Voters 24% (476) 25% (496) 19% (386) 25% (495) 7% (137) 1990Voted in 2014: Yes 23% (296) 24% (311) 20% (258) 29% (381) 4% (51) 1297Voted in 2014: No 26% (180) 27% (185) 18% (128) 16% (114) 12% (86) 6934-Region: Northeast 27% (94) 25% (86) 21% (73) 19% (65) 8% (26) 3444-Region: Midwest 21% (97) 27% (124) 21% (98) 25% (114) 5% (22) 4554-Region: South 25% (189) 23% (175) 18% (135) 26% (195) 8% (61) 7554-Region: West 22% (96) 25% (110) 18% (80) 28% (121) 6% (28) 435Party: Democrat/Leans Democrat 36% (317) 31% (279) 20% (175) 8% (73) 5% (44) 888Party: Republican/Leans Republican 13% (104) 19% (154) 19% (156) 44% (357) 5% (42) 814Note: Row proportions may total to larger than one-hundred percent due to rounding. For more information visit MorningConsultIntelligence.com.
Page 123
National Tracking Poll #210636, June, 2021
123
Table POL3_1
Table POL3_1: How would you rate each of the following on their handling of the coronavirus?President Joe Biden
Demographic Excellent Good Just Fair PoorDon’t Know /No Opinion Total N
Registered Voters 28% (564) 22% (431) 17% (338) 29% (573) 4% (84) 1990Gender: Male 30% (278) 23% (214) 14% (133) 28% (262) 4% (40) 927Gender: Female 27% (286) 20% (218) 19% (205) 29% (311) 4% (44) 1063Age: 18-34 19% (87) 27% (123) 23% (105) 22% (100) 9% (41) 456Age: 35-44 33% (98) 22% (65) 12% (36) 30% (89) 4% (12) 300Age: 45-64 26% (190) 20% (148) 16% (117) 34% (250) 4% (26) 730Age: 65+ 37% (189) 19% (95) 16% (81) 27% (134) 1% (5) 504GenZers: 1997-2012 16% (27) 24% (41) 27% (45) 22% (38) 11% (18) 169Millennials: 1981-1996 25% (120) 26% (127) 16% (75) 26% (126) 7% (32) 480GenXers: 1965-1980 26% (139) 23% (120) 17% (91) 29% (150) 5% (26) 525Baby Boomers: 1946-1964 34% (255) 17% (129) 15% (115) 32% (238) 1% (7) 746PID: Dem (no lean) 55% (413) 31% (236) 8% (64) 3% (23) 2% (16) 752PID: Ind (no lean) 20% (113) 22% (128) 23% (135) 27% (157) 8% (44) 578PID: Rep (no lean) 6% (38) 10% (67) 21% (139) 59% (393) 4% (24) 661PID/Gender: DemMen 55% (196) 33% (119) 6% (23) 4% (13) 2% (8) 359PID/Gender: DemWomen 55% (217) 30% (117) 10% (41) 2% (10) 2% (8) 393PID/Gender: Ind Men 22% (59) 21% (57) 21% (57) 29% (76) 7% (19) 267PID/Gender: Ind Women 17% (54) 23% (72) 25% (78) 26% (81) 8% (25) 311PID/Gender: Rep Men 8% (24) 13% (38) 18% (54) 57% (172) 4% (13) 301PID/Gender: Rep Women 4% (14) 8% (29) 24% (86) 61% (220) 3% (10) 360Ideo: Liberal (1-3) 49% (290) 31% (184) 10% (60) 7% (39) 2% (14) 587Ideo: Moderate (4) 34% (185) 26% (142) 18% (99) 17% (92) 4% (21) 539Ideo: Conservative (5-7) 9% (69) 11% (81) 21% (157) 56% (417) 2% (18) 742Educ: < College 25% (300) 20% (244) 19% (227) 31% (375) 6% (67) 1213Educ: Bachelors degree 32% (158) 23% (115) 15% (73) 26% (129) 3% (13) 489Educ: Post-grad 37% (106) 25% (73) 13% (38) 24% (68) 1% (3) 288Income: Under 50k 29% (290) 20% (200) 16% (163) 28% (279) 6% (59) 991Income: 50k-100k 26% (164) 24% (154) 17% (110) 30% (193) 3% (19) 640Income: 100k+ 30% (109) 22% (78) 18% (66) 28% (101) 1% (5) 359Ethnicity: White 26% (420) 20% (315) 16% (253) 34% (532) 4% (65) 1584Ethnicity: Hispanic 31% (61) 27% (52) 18% (36) 18% (35) 6% (11) 196
Continued on next page
Page 124
124
Morning ConsultTable POL3_1
Table POL3_1: How would you rate each of the following on their handling of the coronavirus?President Joe Biden
Demographic Excellent Good Just Fair PoorDon’t Know /No Opinion Total N
Registered Voters 28% (564) 22% (431) 17% (338) 29% (573) 4% (84) 1990Ethnicity: Black 41% (100) 29% (70) 18% (44) 6% (14) 6% (15) 243Ethnicity: Other 27% (44) 28% (46) 25% (41) 17% (27) 3% (4) 163All Christian 26% (252) 20% (193) 16% (155) 35% (342) 2% (22) 964All Non-Christian 51% (62) 26% (31) 9% (11) 7% (8) 8% (10) 121Atheist 38% (28) 28% (20) 19% (14) 10% (8) 6% (4) 73Agnostic/Nothing in particular 29% (144) 25% (126) 18% (88) 21% (106) 6% (31) 495Something Else 23% (78) 18% (61) 21% (70) 33% (110) 5% (17) 337Religious Non-Protestant/Catholic 45% (64) 24% (34) 11% (15) 11% (16) 8% (12) 140Evangelical 21% (114) 15% (85) 16% (88) 45% (246) 3% (14) 547Non-Evangelical 29% (211) 22% (161) 18% (131) 27% (196) 3% (22) 721Community: Urban 38% (202) 25% (135) 15% (81) 16% (85) 5% (26) 529Community: Suburban 26% (264) 23% (225) 16% (164) 31% (309) 4% (35) 998Community: Rural 21% (97) 15% (72) 20% (93) 39% (179) 5% (23) 464Employ: Private Sector 27% (165) 25% (152) 15% (92) 30% (184) 5% (28) 622Employ: Government 22% (28) 28% (36) 17% (22) 27% (35) 5% (7) 129Employ: Self-Employed 32% (50) 19% (30) 16% (26) 32% (50) 1% (2) 157Employ: Homemaker 20% (26) 13% (16) 23% (29) 36% (46) 7% (9) 127Employ: Retired 35% (205) 18% (106) 16% (95) 29% (169) 1% (6) 581Employ: Unemployed 23% (49) 26% (56) 23% (50) 23% (48) 6% (12) 215Employ: Other 26% (29) 23% (26) 14% (15) 25% (28) 13% (15) 113Military HH: Yes 24% (87) 18% (65) 23% (82) 34% (121) 2% (6) 361Military HH: No 29% (477) 23% (367) 16% (256) 28% (452) 5% (78) 1629RD/WT: Right Direction 54% (505) 33% (311) 9% (81) 1% (10) 4% (34) 941RD/WT: Wrong Track 6% (58) 12% (121) 25% (257) 54% (563) 5% (49) 1049Biden Job Approve 52% (540) 35% (366) 10% (99) 1% (9) 2% (23) 1037Biden Job Disapprove 2% (18) 6% (55) 25% (214) 64% (550) 2% (20) 857Biden Job Strongly Approve 80% (440) 16% (87) 2% (11) 1% (3) 1% (7) 548Biden Job Somewhat Approve 21% (100) 57% (279) 18% (87) 1% (6) 3% (16) 489Biden Job Somewhat Disapprove 3% (6) 16% (36) 53% (118) 26% (58) 2% (5) 223Biden Job Strongly Disapprove 2% (12) 3% (19) 15% (96) 78% (491) 2% (15) 634
Continued on next page
Page 125
National Tracking Poll #210636, June, 2021
125
Table POL3_1
Table POL3_1: How would you rate each of the following on their handling of the coronavirus?President Joe Biden
Demographic Excellent Good Just Fair PoorDon’t Know /No Opinion Total N
Registered Voters 28% (564) 22% (431) 17% (338) 29% (573) 4% (84) 1990Favorable of Biden 52% (544) 36% (377) 9% (97) 1% (6) 2% (25) 1048Unfavorable of Biden 2% (15) 5% (46) 26% (218) 64% (548) 3% (27) 855Very Favorable of Biden 80% (476) 17% (102) 2% (10) — (0) 1% (5) 593Somewhat Favorable of Biden 15% (68) 60% (275) 19% (87) 1% (6) 4% (20) 455Somewhat Unfavorable of Biden 3% (5) 13% (24) 57% (108) 21% (40) 6% (12) 190Very Unfavorable of Biden 1% (9) 3% (22) 17% (110) 76% (508) 2% (15) 664#1 Issue: Economy 23% (173) 21% (158) 19% (147) 33% (253) 4% (33) 763#1 Issue: Security 14% (51) 12% (44) 18% (64) 51% (179) 4% (13) 349#1 Issue: Health Care 45% (104) 24% (56) 17% (40) 11% (25) 4% (9) 233#1 Issue: Medicare / Social Security 40% (105) 26% (69) 12% (30) 19% (51) 2% (6) 261#1 Issue: Women’s Issues 28% (29) 30% (30) 20% (21) 12% (12) 11% (11) 103#1 Issue: Education 36% (31) 30% (26) 17% (14) 13% (12) 4% (3) 86#1 Issue: Energy 40% (35) 30% (26) 10% (9) 13% (11) 7% (6) 86#1 Issue: Other 34% (37) 21% (23) 13% (14) 29% (31) 3% (3) 1092020 Vote: Joe Biden 55% (496) 32% (289) 9% (80) 1% (13) 2% (20) 8972020 Vote: Donald Trump 4% (31) 10% (80) 22% (178) 61% (503) 3% (26) 8182020 Vote: Didn’t Vote 13% (32) 23% (55) 29% (70) 21% (50) 13% (32) 2392018 House Vote: Democrat 57% (388) 32% (218) 8% (57) 3% (18) 1% (5) 6872018 House Vote: Republican 6% (41) 10% (71) 22% (151) 59% (408) 3% (19) 6902018 House Vote: Someone else 19% (9) 21% (10) 32% (16) 13% (6) 15% (8) 502016 Vote: Hillary Clinton 58% (368) 31% (195) 7% (44) 3% (17) 1% (8) 6312016 Vote: Donald Trump 7% (57) 11% (84) 21% (161) 58% (447) 3% (20) 7682016 Vote: Other 28% (30) 26% (27) 25% (26) 16% (18) 6% (6) 1072016 Vote: Didn’t Vote 23% (109) 26% (125) 22% (107) 19% (92) 10% (50) 483Voted in 2014: Yes 32% (414) 20% (259) 15% (191) 31% (405) 2% (28) 1297Voted in 2014: No 22% (150) 25% (172) 21% (147) 24% (168) 8% (55) 6934-Region: Northeast 36% (123) 27% (93) 12% (42) 22% (75) 3% (11) 3444-Region: Midwest 30% (136) 22% (102) 13% (61) 31% (139) 4% (17) 4554-Region: South 25% (185) 20% (148) 19% (147) 32% (244) 4% (31) 7554-Region: West 27% (119) 20% (88) 20% (88) 26% (115) 6% (25) 435
Continued on next page
Page 126
126
Morning ConsultTable POL3_1
Table POL3_1: How would you rate each of the following on their handling of the coronavirus?President Joe Biden
Demographic Excellent Good Just Fair PoorDon’t Know /No Opinion Total N
Registered Voters 28% (564) 22% (431) 17% (338) 29% (573) 4% (84) 1990Party: Democrat/Leans Democrat 53% (473) 32% (286) 9% (82) 3% (28) 2% (19) 888Party: Republican/Leans Republican 5% (44) 10% (82) 22% (180) 59% (477) 4% (29) 814Note: Row proportions may total to larger than one-hundred percent due to rounding. For more information visit MorningConsultIntelligence.com.
Page 127
National Tracking Poll #210636, June, 2021
127
Table POL3_2
Table POL3_2: How would you rate each of the following on their handling of the coronavirus?Congress
Demographic Excellent Good Just Fair PoorDon’t Know /No Opinion Total N
Registered Voters 7% (132) 22% (448) 37% (726) 25% (494) 10% (190) 1990Gender: Male 8% (74) 24% (219) 33% (309) 29% (266) 6% (59) 927Gender: Female 5% (58) 22% (229) 39% (418) 21% (228) 12% (131) 1063Age: 18-34 11% (50) 20% (90) 32% (146) 19% (85) 19% (85) 456Age: 35-44 9% (26) 25% (74) 35% (105) 19% (58) 12% (36) 300Age: 45-64 5% (34) 24% (177) 36% (260) 28% (205) 7% (55) 730Age: 65+ 4% (22) 21% (107) 43% (215) 29% (146) 3% (14) 504GenZers: 1997-2012 7% (11) 15% (25) 32% (54) 18% (30) 29% (49) 169Millennials: 1981-1996 12% (58) 23% (109) 32% (155) 20% (97) 13% (60) 480GenXers: 1965-1980 5% (29) 24% (128) 37% (196) 24% (124) 9% (48) 525Baby Boomers: 1946-1964 4% (31) 24% (177) 39% (294) 29% (214) 4% (29) 746PID: Dem (no lean) 12% (89) 32% (239) 36% (272) 13% (101) 7% (51) 752PID: Ind (no lean) 3% (17) 18% (107) 35% (203) 28% (163) 15% (87) 578PID: Rep (no lean) 4% (26) 15% (102) 38% (251) 35% (230) 8% (51) 661PID/Gender: DemMen 15% (55) 35% (124) 31% (111) 15% (55) 4% (14) 359PID/Gender: DemWomen 9% (34) 29% (115) 41% (161) 12% (46) 9% (37) 393PID/Gender: Ind Men 3% (9) 21% (55) 32% (84) 35% (94) 9% (25) 267PID/Gender: Ind Women 3% (9) 17% (52) 38% (119) 22% (69) 20% (62) 311PID/Gender: Rep Men 4% (11) 13% (40) 38% (114) 39% (116) 7% (20) 301PID/Gender: Rep Women 4% (15) 17% (62) 38% (138) 32% (114) 9% (31) 360Ideo: Liberal (1-3) 11% (63) 30% (178) 37% (215) 16% (93) 7% (39) 587Ideo: Moderate (4) 6% (32) 26% (140) 38% (204) 19% (102) 11% (61) 539Ideo: Conservative (5-7) 4% (31) 15% (114) 38% (280) 38% (282) 5% (35) 742Educ: < College 7% (79) 22% (266) 35% (420) 25% (297) 12% (150) 1213Educ: Bachelors degree 5% (26) 23% (111) 40% (198) 26% (128) 5% (26) 489Educ: Post-grad 9% (26) 24% (71) 38% (109) 24% (69) 5% (14) 288Income: Under 50k 7% (65) 22% (220) 35% (352) 23% (229) 13% (125) 991Income: 50k-100k 5% (33) 22% (142) 38% (243) 27% (173) 8% (50) 640Income: 100k+ 9% (34) 24% (86) 37% (132) 26% (92) 4% (15) 359Ethnicity: White 6% (102) 22% (342) 36% (578) 27% (422) 9% (140) 1584Ethnicity: Hispanic 11% (22) 24% (47) 31% (61) 20% (39) 14% (27) 196
Continued on next page
Page 128
128
Morning ConsultTable POL3_2
Table POL3_2: How would you rate each of the following on their handling of the coronavirus?Congress
Demographic Excellent Good Just Fair PoorDon’t Know /No Opinion Total N
Registered Voters 7% (132) 22% (448) 37% (726) 25% (494) 10% (190) 1990Ethnicity: Black 6% (15) 29% (71) 40% (97) 12% (29) 13% (31) 243Ethnicity: Other 9% (14) 21% (35) 32% (52) 27% (44) 11% (19) 163All Christian 7% (65) 23% (223) 38% (367) 26% (251) 6% (57) 964All Non-Christian 19% (23) 23% (27) 26% (32) 19% (23) 13% (15) 121Atheist 1% (1) 21% (15) 42% (31) 19% (14) 16% (12) 73Agnostic/Nothing in particular 6% (29) 21% (103) 37% (185) 24% (117) 13% (62) 495Something Else 4% (15) 23% (79) 33% (111) 26% (89) 13% (43) 337Religious Non-Protestant/Catholic 17% (24) 23% (33) 26% (37) 19% (27) 14% (20) 140Evangelical 8% (44) 20% (108) 36% (195) 29% (161) 7% (40) 547Non-Evangelical 4% (32) 26% (187) 38% (274) 24% (172) 8% (55) 721Community: Urban 11% (60) 30% (160) 29% (155) 20% (107) 9% (47) 529Community: Suburban 5% (48) 20% (198) 41% (404) 25% (254) 9% (93) 998Community: Rural 5% (24) 19% (90) 36% (167) 29% (133) 11% (49) 464Employ: Private Sector 9% (56) 22% (139) 36% (222) 22% (140) 10% (65) 622Employ: Government 7% (9) 30% (39) 32% (41) 23% (29) 9% (11) 129Employ: Self-Employed 7% (11) 26% (41) 38% (59) 25% (40) 4% (7) 157Employ: Homemaker 4% (5) 21% (27) 40% (51) 23% (29) 12% (15) 127Employ: Retired 4% (23) 22% (128) 41% (241) 29% (170) 4% (21) 581Employ: Unemployed 7% (16) 20% (42) 33% (71) 23% (50) 16% (35) 215Employ: Other 9% (10) 22% (24) 32% (36) 19% (21) 19% (21) 113Military HH: Yes 5% (18) 22% (80) 39% (142) 29% (106) 4% (15) 361Military HH: No 7% (114) 23% (367) 36% (584) 24% (388) 11% (175) 1629RD/WT: Right Direction 11% (104) 33% (308) 36% (342) 11% (102) 9% (85) 941RD/WT: Wrong Track 3% (28) 13% (139) 37% (385) 37% (392) 10% (105) 1049Biden Job Approve 11% (113) 32% (328) 38% (392) 12% (129) 7% (75) 1037Biden Job Disapprove 2% (19) 13% (109) 37% (313) 41% (355) 7% (61) 857Biden Job Strongly Approve 17% (92) 35% (193) 35% (191) 8% (42) 6% (30) 548Biden Job Somewhat Approve 4% (21) 28% (135) 41% (201) 18% (87) 9% (45) 489Biden Job Somewhat Disapprove 3% (8) 19% (42) 50% (112) 22% (48) 6% (14) 223Biden Job Strongly Disapprove 2% (11) 11% (68) 32% (201) 48% (306) 7% (47) 634
Continued on next page
Page 129
National Tracking Poll #210636, June, 2021
129
Table POL3_2
Table POL3_2: How would you rate each of the following on their handling of the coronavirus?Congress
Demographic Excellent Good Just Fair PoorDon’t Know /No Opinion Total N
Registered Voters 7% (132) 22% (448) 37% (726) 25% (494) 10% (190) 1990Favorable of Biden 10% (107) 32% (336) 38% (394) 13% (134) 7% (77) 1048Unfavorable of Biden 3% (22) 12% (105) 36% (310) 40% (345) 8% (72) 855Very Favorable of Biden 16% (95) 35% (209) 35% (207) 9% (52) 5% (30) 593Somewhat Favorable of Biden 3% (13) 28% (127) 41% (187) 18% (82) 10% (46) 455Somewhat Unfavorable of Biden 4% (8) 18% (35) 49% (94) 16% (31) 12% (22) 190Very Unfavorable of Biden 2% (13) 11% (71) 33% (216) 47% (314) 7% (50) 664#1 Issue: Economy 6% (44) 21% (162) 38% (287) 24% (186) 11% (84) 763#1 Issue: Security 5% (16) 15% (53) 32% (110) 41% (144) 7% (26) 349#1 Issue: Health Care 10% (24) 29% (67) 40% (93) 13% (31) 8% (18) 233#1 Issue: Medicare / Social Security 6% (15) 31% (81) 43% (111) 16% (40) 5% (12) 261#1 Issue: Women’s Issues 5% (5) 18% (19) 37% (38) 16% (16) 24% (25) 103#1 Issue: Education 9% (8) 28% (24) 31% (26) 20% (17) 12% (10) 86#1 Issue: Energy 16% (13) 19% (16) 27% (23) 24% (21) 14% (12) 86#1 Issue: Other 6% (6) 23% (25) 33% (36) 36% (39) 2% (3) 1092020 Vote: Joe Biden 10% (93) 31% (275) 38% (341) 14% (129) 7% (59) 8972020 Vote: Donald Trump 3% (25) 15% (120) 37% (300) 38% (312) 8% (62) 8182020 Vote: Didn’t Vote 5% (13) 20% (48) 31% (73) 18% (43) 26% (62) 2392018 House Vote: Democrat 10% (70) 32% (220) 39% (269) 15% (102) 4% (27) 6872018 House Vote: Republican 4% (26) 14% (96) 39% (270) 39% (269) 4% (30) 6902018 House Vote: Someone else 4% (2) 16% (8) 26% (13) 29% (14) 24% (12) 502016 Vote: Hillary Clinton 10% (65) 32% (204) 38% (240) 14% (88) 5% (34) 6312016 Vote: Donald Trump 3% (26) 14% (111) 37% (285) 39% (303) 6% (44) 7682016 Vote: Other 6% (7) 15% (16) 43% (46) 30% (32) 6% (7) 1072016 Vote: Didn’t Vote 7% (34) 24% (117) 32% (155) 15% (71) 22% (105) 483Voted in 2014: Yes 7% (88) 22% (290) 39% (505) 28% (357) 4% (58) 1297Voted in 2014: No 6% (44) 23% (158) 32% (222) 20% (137) 19% (132) 6934-Region: Northeast 12% (42) 27% (91) 35% (119) 18% (63) 8% (29) 3444-Region: Midwest 3% (12) 25% (115) 36% (163) 27% (121) 10% (45) 4554-Region: South 7% (54) 21% (162) 38% (288) 24% (181) 9% (71) 7554-Region: West 6% (25) 18% (79) 36% (156) 30% (129) 10% (45) 435
Continued on next page
Page 130
130
Morning ConsultTable POL3_2
Table POL3_2: How would you rate each of the following on their handling of the coronavirus?Congress
Demographic Excellent Good Just Fair PoorDon’t Know /No Opinion Total N
Registered Voters 7% (132) 22% (448) 37% (726) 25% (494) 10% (190) 1990Party: Democrat/Leans Democrat 10% (92) 31% (279) 37% (328) 14% (128) 7% (61) 888Party: Republican/Leans Republican 3% (28) 15% (121) 38% (306) 36% (294) 8% (65) 814Note: Row proportions may total to larger than one-hundred percent due to rounding. For more information visit MorningConsultIntelligence.com.
Page 131
National Tracking Poll #210636, June, 2021
131
Table POL3_3
Table POL3_3: How would you rate each of the following on their handling of the coronavirus?Congressional Democrats
Demographic Excellent Good Just Fair PoorDon’t Know /No Opinion Total N
Registered Voters 16% (328) 27% (529) 19% (381) 30% (589) 8% (163) 1990Gender: Male 19% (175) 28% (256) 18% (167) 30% (277) 6% (52) 927Gender: Female 14% (153) 26% (273) 20% (214) 29% (312) 10% (111) 1063Age: 18-34 17% (76) 27% (122) 21% (97) 17% (79) 18% (82) 456Age: 35-44 24% (72) 20% (61) 18% (54) 29% (88) 8% (25) 300Age: 45-64 15% (106) 25% (184) 19% (138) 35% (257) 6% (45) 730Age: 65+ 15% (74) 32% (161) 18% (93) 33% (165) 2% (11) 504GenZers: 1997-2012 11% (19) 27% (46) 20% (34) 14% (23) 28% (48) 169Millennials: 1981-1996 21% (100) 25% (118) 20% (95) 24% (116) 11% (51) 480GenXers: 1965-1980 18% (96) 24% (126) 20% (106) 30% (157) 8% (40) 525Baby Boomers: 1946-1964 14% (107) 29% (215) 17% (130) 36% (270) 3% (24) 746PID: Dem (no lean) 34% (257) 43% (326) 13% (100) 4% (32) 5% (37) 752PID: Ind (no lean) 9% (50) 24% (136) 25% (144) 29% (166) 14% (82) 578PID: Rep (no lean) 3% (21) 10% (67) 21% (137) 59% (391) 7% (45) 661PID/Gender: DemMen 39% (141) 39% (142) 13% (47) 5% (19) 3% (10) 359PID/Gender: DemWomen 29% (116) 47% (184) 13% (53) 3% (13) 7% (27) 393PID/Gender: Ind Men 9% (24) 26% (68) 22% (58) 35% (92) 9% (25) 267PID/Gender: Ind Women 8% (26) 22% (68) 28% (86) 24% (74) 18% (57) 311PID/Gender: Rep Men 3% (10) 15% (46) 20% (61) 55% (166) 6% (18) 301PID/Gender: Rep Women 3% (11) 6% (21) 21% (76) 62% (224) 7% (27) 360Ideo: Liberal (1-3) 31% (180) 42% (247) 16% (96) 6% (38) 5% (27) 587Ideo: Moderate (4) 17% (92) 31% (168) 23% (124) 19% (101) 10% (54) 539Ideo: Conservative (5-7) 6% (41) 13% (96) 20% (146) 58% (430) 4% (30) 742Educ: < College 15% (183) 25% (305) 18% (224) 31% (373) 11% (129) 1213Educ: Bachelors degree 18% (86) 28% (139) 19% (94) 30% (145) 5% (25) 489Educ: Post-grad 21% (60) 29% (85) 22% (63) 25% (72) 3% (9) 288Income: Under 50k 18% (175) 27% (265) 17% (167) 29% (283) 10% (100) 991Income: 50k-100k 14% (86) 28% (178) 20% (126) 31% (201) 8% (49) 640Income: 100k+ 18% (66) 24% (86) 25% (88) 29% (105) 4% (14) 359Ethnicity: White 14% (228) 26% (408) 18% (291) 34% (541) 7% (116) 1584Ethnicity: Hispanic 23% (45) 27% (53) 21% (41) 15% (29) 14% (28) 196
Continued on next page
Page 132
132
Morning ConsultTable POL3_3
Table POL3_3: How would you rate each of the following on their handling of the coronavirus?Congressional Democrats
Demographic Excellent Good Just Fair PoorDon’t Know /No Opinion Total N
Registered Voters 16% (328) 27% (529) 19% (381) 30% (589) 8% (163) 1990Ethnicity: Black 29% (71) 32% (78) 17% (42) 8% (20) 13% (31) 243Ethnicity: Other 17% (28) 26% (42) 30% (48) 17% (28) 10% (17) 163All Christian 14% (135) 26% (252) 18% (171) 37% (360) 5% (45) 964All Non-Christian 29% (35) 32% (39) 19% (23) 10% (12) 10% (12) 121Atheist 29% (21) 25% (19) 23% (17) 10% (7) 12% (9) 73Agnostic/Nothing in particular 17% (83) 28% (140) 22% (108) 22% (109) 11% (55) 495Something Else 16% (53) 23% (78) 18% (62) 30% (101) 13% (43) 337Religious Non-Protestant/Catholic 25% (35) 32% (45) 19% (27) 14% (20) 10% (14) 140Evangelical 15% (80) 19% (104) 15% (85) 45% (249) 5% (30) 547Non-Evangelical 15% (106) 30% (218) 20% (142) 28% (201) 8% (55) 721Community: Urban 26% (138) 33% (177) 18% (93) 16% (84) 7% (36) 529Community: Suburban 14% (144) 25% (247) 20% (201) 32% (321) 8% (84) 998Community: Rural 10% (46) 22% (104) 19% (87) 40% (184) 9% (42) 464Employ: Private Sector 19% (117) 26% (164) 17% (109) 29% (182) 8% (50) 622Employ: Government 20% (26) 27% (35) 18% (24) 27% (34) 8% (10) 129Employ: Self-Employed 21% (34) 19% (30) 27% (42) 29% (46) 3% (5) 157Employ: Homemaker 11% (14) 20% (25) 23% (29) 37% (46) 10% (13) 127Employ: Retired 14% (83) 31% (178) 19% (108) 33% (194) 3% (18) 581Employ: Unemployed 16% (35) 26% (55) 17% (37) 26% (56) 15% (31) 215Employ: Other 16% (18) 25% (28) 20% (22) 18% (21) 21% (24) 113Military HH: Yes 14% (51) 23% (82) 22% (78) 37% (135) 4% (16) 361Military HH: No 17% (277) 27% (447) 19% (303) 28% (455) 9% (147) 1629RD/WT: Right Direction 31% (292) 43% (406) 16% (149) 3% (32) 7% (62) 941RD/WT: Wrong Track 3% (36) 12% (122) 22% (232) 53% (557) 10% (101) 1049Biden Job Approve 30% (312) 44% (451) 17% (181) 4% (42) 5% (51) 1037Biden Job Disapprove 2% (14) 8% (67) 21% (178) 63% (539) 7% (59) 857Biden Job Strongly Approve 47% (259) 41% (223) 8% (42) 1% (6) 3% (18) 548Biden Job Somewhat Approve 11% (53) 47% (228) 28% (138) 7% (36) 7% (34) 489Biden Job Somewhat Disapprove 3% (6) 17% (39) 39% (88) 29% (65) 12% (26) 223Biden Job Strongly Disapprove 1% (9) 4% (28) 14% (90) 75% (473) 5% (33) 634
Continued on next page
Page 133
National Tracking Poll #210636, June, 2021
133
Table POL3_3
Table POL3_3: How would you rate each of the following on their handling of the coronavirus?Congressional Democrats
Demographic Excellent Good Just Fair PoorDon’t Know /No Opinion Total N
Registered Voters 16% (328) 27% (529) 19% (381) 30% (589) 8% (163) 1990Favorable of Biden 30% (312) 44% (458) 17% (181) 4% (42) 5% (55) 1048Unfavorable of Biden 1% (13) 7% (60) 21% (180) 62% (534) 8% (68) 855Very Favorable of Biden 46% (273) 42% (248) 9% (51) 1% (4) 3% (16) 593Somewhat Favorable of Biden 9% (39) 46% (210) 29% (130) 8% (37) 9% (39) 455Somewhat Unfavorable of Biden 4% (7) 17% (32) 40% (77) 23% (43) 16% (31) 190Very Unfavorable of Biden 1% (6) 4% (28) 15% (103) 74% (491) 6% (37) 664#1 Issue: Economy 13% (101) 23% (173) 21% (164) 33% (253) 9% (72) 763#1 Issue: Security 8% (28) 16% (57) 17% (61) 53% (184) 6% (20) 349#1 Issue: Health Care 29% (68) 34% (80) 18% (41) 13% (31) 6% (13) 233#1 Issue: Medicare / Social Security 20% (52) 38% (100) 19% (49) 19% (49) 4% (11) 261#1 Issue: Women’s Issues 21% (21) 32% (33) 18% (19) 9% (9) 20% (21) 103#1 Issue: Education 20% (17) 30% (25) 19% (16) 18% (16) 13% (11) 86#1 Issue: Energy 21% (18) 36% (31) 18% (16) 12% (10) 12% (10) 86#1 Issue: Other 20% (22) 27% (30) 14% (16) 34% (37) 4% (5) 1092020 Vote: Joe Biden 31% (276) 44% (396) 16% (147) 4% (36) 5% (42) 8972020 Vote: Donald Trump 3% (21) 10% (81) 20% (165) 60% (495) 7% (56) 8182020 Vote: Didn’t Vote 11% (26) 20% (48) 25% (59) 20% (48) 24% (58) 2392018 House Vote: Democrat 34% (231) 44% (300) 16% (108) 4% (30) 3% (18) 6872018 House Vote: Republican 3% (21) 10% (68) 22% (149) 61% (420) 5% (32) 6902018 House Vote: Someone else 16% (8) 11% (6) 23% (12) 24% (12) 27% (13) 502016 Vote: Hillary Clinton 33% (210) 46% (287) 13% (81) 5% (33) 3% (21) 6312016 Vote: Donald Trump 4% (31) 11% (85) 21% (159) 59% (451) 5% (41) 7682016 Vote: Other 14% (16) 18% (20) 38% (40) 23% (25) 6% (7) 1072016 Vote: Didn’t Vote 15% (72) 28% (135) 21% (102) 17% (80) 20% (95) 483Voted in 2014: Yes 19% (241) 26% (336) 18% (238) 33% (430) 4% (52) 1297Voted in 2014: No 12% (86) 28% (192) 21% (144) 23% (159) 16% (111) 6934-Region: Northeast 22% (74) 33% (112) 16% (55) 23% (78) 7% (25) 3444-Region: Midwest 16% (72) 29% (132) 17% (76) 32% (144) 7% (31) 4554-Region: South 15% (112) 24% (182) 18% (137) 34% (257) 9% (66) 7554-Region: West 16% (69) 23% (101) 26% (114) 25% (110) 9% (41) 435
Continued on next page
Page 134
134
Morning ConsultTable POL3_3
Table POL3_3: How would you rate each of the following on their handling of the coronavirus?Congressional Democrats
Demographic Excellent Good Just Fair PoorDon’t Know /No Opinion Total N
Registered Voters 16% (328) 27% (529) 19% (381) 30% (589) 8% (163) 1990Party: Democrat/Leans Democrat 32% (282) 44% (391) 15% (136) 4% (35) 5% (44) 888Party: Republican/Leans Republican 3% (23) 10% (82) 22% (175) 58% (475) 7% (58) 814Note: Row proportions may total to larger than one-hundred percent due to rounding. For more information visit MorningConsultIntelligence.com.
Page 135
National Tracking Poll #210636, June, 2021
135
Table POL3_4
Table POL3_4: How would you rate each of the following on their handling of the coronavirus?Congressional Republicans
Demographic Excellent Good Just Fair PoorDon’t Know /No Opinion Total N
Registered Voters 9% (183) 22% (429) 26% (521) 34% (679) 9% (178) 1990Gender: Male 10% (95) 21% (198) 28% (260) 34% (311) 7% (63) 927Gender: Female 8% (87) 22% (231) 25% (261) 35% (368) 11% (114) 1063Age: 18-34 11% (52) 19% (88) 23% (106) 28% (126) 19% (85) 456Age: 35-44 12% (37) 19% (58) 23% (70) 34% (102) 11% (32) 300Age: 45-64 9% (62) 24% (176) 26% (192) 34% (251) 7% (50) 730Age: 65+ 6% (31) 21% (108) 30% (153) 40% (201) 2% (11) 504GenZers: 1997-2012 5% (8) 20% (33) 22% (37) 29% (49) 25% (42) 169Millennials: 1981-1996 15% (72) 19% (91) 24% (113) 28% (135) 14% (69) 480GenXers: 1965-1980 9% (45) 22% (114) 25% (133) 36% (191) 8% (41) 525Baby Boomers: 1946-1964 7% (52) 23% (173) 29% (219) 38% (280) 3% (22) 746PID: Dem (no lean) 6% (42) 11% (79) 21% (161) 56% (421) 6% (47) 752PID: Ind (no lean) 6% (34) 16% (94) 30% (176) 33% (189) 15% (84) 578PID: Rep (no lean) 16% (106) 39% (256) 28% (184) 10% (69) 7% (46) 661PID/Gender: DemMen 9% (34) 12% (44) 22% (79) 51% (183) 5% (18) 359PID/Gender: DemWomen 2% (8) 9% (35) 21% (82) 61% (238) 8% (30) 393PID/Gender: Ind Men 6% (15) 18% (49) 31% (83) 35% (94) 10% (26) 267PID/Gender: Ind Women 6% (20) 15% (45) 30% (93) 31% (95) 19% (58) 311PID/Gender: Rep Men 15% (47) 35% (105) 32% (98) 11% (33) 6% (19) 301PID/Gender: Rep Women 17% (60) 42% (151) 24% (86) 10% (36) 8% (27) 360Ideo: Liberal (1-3) 6% (38) 10% (56) 20% (119) 58% (344) 5% (31) 587Ideo: Moderate (4) 8% (41) 18% (97) 28% (150) 37% (199) 10% (52) 539Ideo: Conservative (5-7) 13% (95) 35% (261) 32% (239) 15% (109) 5% (39) 742Educ: < College 10% (119) 23% (274) 27% (323) 30% (358) 11% (139) 1213Educ: Bachelors degree 8% (38) 18% (90) 25% (124) 43% (209) 6% (27) 489Educ: Post-grad 9% (25) 23% (65) 26% (74) 39% (112) 4% (11) 288Income: Under 50k 9% (87) 20% (194) 27% (263) 33% (327) 12% (121) 991Income: 50k-100k 8% (49) 24% (151) 27% (170) 36% (227) 7% (43) 640Income: 100k+ 13% (47) 24% (85) 25% (88) 35% (125) 4% (14) 359Ethnicity: White 10% (163) 23% (371) 26% (414) 32% (509) 8% (127) 1584Ethnicity: Hispanic 5% (11) 20% (38) 25% (50) 38% (75) 11% (22) 196
Continued on next page
Page 136
136
Morning ConsultTable POL3_4
Table POL3_4: How would you rate each of the following on their handling of the coronavirus?Congressional Republicans
Demographic Excellent Good Just Fair PoorDon’t Know /No Opinion Total N
Registered Voters 9% (183) 22% (429) 26% (521) 34% (679) 9% (178) 1990Ethnicity: Black 3% (8) 15% (36) 27% (64) 41% (101) 14% (34) 243Ethnicity: Other 7% (12) 14% (22) 26% (42) 43% (69) 11% (17) 163All Christian 9% (88) 28% (275) 29% (282) 28% (275) 5% (45) 964All Non-Christian 16% (19) 18% (22) 15% (18) 37% (44) 14% (17) 121Atheist 7% (5) 9% (6) 15% (11) 60% (44) 9% (7) 73Agnostic/Nothing in particular 7% (35) 14% (67) 26% (127) 40% (199) 14% (67) 495Something Else 10% (35) 18% (60) 25% (83) 35% (117) 12% (41) 337Religious Non-Protestant/Catholic 16% (22) 19% (27) 16% (23) 34% (47) 15% (22) 140Evangelical 14% (79) 27% (146) 30% (166) 22% (121) 6% (35) 547Non-Evangelical 6% (42) 25% (177) 27% (191) 37% (265) 6% (46) 721Community: Urban 10% (55) 20% (104) 23% (120) 38% (202) 9% (48) 529Community: Suburban 8% (79) 21% (208) 27% (272) 35% (351) 9% (88) 998Community: Rural 11% (49) 25% (118) 28% (129) 27% (127) 9% (42) 464Employ: Private Sector 9% (56) 22% (137) 23% (144) 36% (224) 10% (60) 622Employ: Government 18% (23) 25% (32) 25% (32) 23% (30) 9% (12) 129Employ: Self-Employed 13% (20) 21% (33) 25% (39) 39% (61) 3% (4) 157Employ: Homemaker 11% (14) 27% (34) 29% (37) 20% (25) 13% (17) 127Employ: Retired 7% (38) 25% (144) 29% (166) 37% (215) 3% (18) 581Employ: Unemployed 10% (21) 11% (23) 29% (62) 34% (73) 16% (35) 215Employ: Other 7% (8) 18% (21) 26% (29) 25% (29) 24% (27) 113Military HH: Yes 9% (34) 25% (91) 34% (122) 26% (96) 5% (18) 361Military HH: No 9% (148) 21% (338) 24% (399) 36% (584) 10% (159) 1629RD/WT: Right Direction 7% (68) 13% (124) 22% (206) 50% (472) 8% (72) 941RD/WT: Wrong Track 11% (115) 29% (305) 30% (315) 20% (208) 10% (106) 1049Biden Job Approve 7% (70) 13% (135) 22% (225) 53% (547) 6% (61) 1037Biden Job Disapprove 13% (112) 33% (286) 32% (275) 15% (126) 7% (59) 857Biden Job Strongly Approve 10% (55) 9% (51) 17% (93) 59% (325) 5% (25) 548Biden Job Somewhat Approve 3% (15) 17% (84) 27% (132) 45% (222) 7% (36) 489Biden Job Somewhat Disapprove 5% (12) 32% (70) 35% (78) 20% (44) 8% (19) 223Biden Job Strongly Disapprove 16% (100) 34% (215) 31% (197) 13% (82) 6% (40) 634
Continued on next page
Page 137
National Tracking Poll #210636, June, 2021
137
Table POL3_4
Table POL3_4: How would you rate each of the following on their handling of the coronavirus?Congressional Republicans
Demographic Excellent Good Just Fair PoorDon’t Know /No Opinion Total N
Registered Voters 9% (183) 22% (429) 26% (521) 34% (679) 9% (178) 1990Favorable of Biden 6% (64) 13% (135) 22% (226) 53% (556) 6% (67) 1048Unfavorable of Biden 13% (113) 34% (292) 31% (265) 14% (116) 8% (69) 855Very Favorable of Biden 9% (53) 9% (56) 17% (101) 60% (356) 4% (26) 593Somewhat Favorable of Biden 2% (11) 17% (79) 28% (125) 44% (200) 9% (41) 455Somewhat Unfavorable of Biden 6% (12) 29% (56) 32% (61) 19% (36) 14% (26) 190Very Unfavorable of Biden 15% (101) 36% (236) 31% (205) 12% (80) 6% (43) 664#1 Issue: Economy 8% (63) 23% (174) 29% (222) 30% (228) 10% (76) 763#1 Issue: Security 16% (57) 31% (110) 31% (107) 16% (55) 6% (20) 349#1 Issue: Health Care 10% (24) 18% (41) 15% (36) 48% (113) 8% (19) 233#1 Issue: Medicare / Social Security 6% (16) 18% (48) 29% (75) 42% (109) 5% (13) 261#1 Issue: Women’s Issues 5% (5) 9% (9) 21% (21) 45% (47) 20% (20) 103#1 Issue: Education 6% (5) 21% (18) 23% (20) 36% (31) 13% (12) 86#1 Issue: Energy 6% (5) 21% (18) 16% (14) 44% (38) 12% (10) 86#1 Issue: Other 5% (6) 9% (10) 24% (26) 55% (60) 7% (7) 1092020 Vote: Joe Biden 5% (48) 9% (80) 20% (179) 60% (539) 6% (51) 8972020 Vote: Donald Trump 14% (116) 37% (304) 31% (257) 10% (86) 7% (55) 8182020 Vote: Didn’t Vote 7% (17) 16% (37) 33% (79) 17% (42) 27% (64) 2392018 House Vote: Democrat 5% (31) 10% (67) 20% (139) 62% (426) 3% (23) 6872018 House Vote: Republican 15% (104) 37% (254) 31% (214) 13% (89) 4% (29) 6902018 House Vote: Someone else 5% (3) 4% (2) 25% (12) 35% (17) 31% (15) 502016 Vote: Hillary Clinton 5% (34) 8% (48) 20% (129) 62% (389) 5% (31) 6312016 Vote: Donald Trump 13% (103) 35% (272) 30% (233) 16% (120) 5% (41) 7682016 Vote: Other 4% (4) 16% (18) 29% (32) 44% (47) 7% (7) 1072016 Vote: Didn’t Vote 9% (42) 19% (92) 26% (128) 25% (123) 20% (99) 483Voted in 2014: Yes 9% (120) 22% (289) 27% (350) 37% (482) 4% (56) 1297Voted in 2014: No 9% (62) 20% (140) 25% (171) 29% (198) 18% (121) 6934-Region: Northeast 12% (41) 20% (67) 27% (93) 33% (114) 9% (29) 3444-Region: Midwest 7% (32) 23% (105) 25% (113) 37% (167) 8% (38) 4554-Region: South 12% (90) 26% (197) 24% (178) 30% (229) 8% (61) 7554-Region: West 4% (20) 14% (60) 32% (137) 39% (169) 11% (49) 435
Continued on next page
Page 138
138
Morning ConsultTable POL3_4
Table POL3_4: How would you rate each of the following on their handling of the coronavirus?Congressional Republicans
Demographic Excellent Good Just Fair PoorDon’t Know /No Opinion Total N
Registered Voters 9% (183) 22% (429) 26% (521) 34% (679) 9% (178) 1990Party: Democrat/Leans Democrat 5% (46) 10% (90) 22% (192) 57% (507) 6% (53) 888Party: Republican/Leans Republican 15% (119) 37% (299) 29% (239) 12% (96) 7% (61) 814Note: Row proportions may total to larger than one-hundred percent due to rounding. For more information visit MorningConsultIntelligence.com.
Page 139
National Tracking Poll #210636, June, 2021
139
Table POL3_5
Table POL3_5: How would you rate each of the following on their handling of the coronavirus?The World Health Organization (WHO)
Demographic Excellent Good Just Fair PoorDon’t Know /No Opinion Total N
Registered Voters 16% (324) 28% (565) 20% (390) 27% (537) 9% (174) 1990Gender: Male 19% (178) 28% (264) 15% (143) 30% (281) 7% (61) 927Gender: Female 14% (146) 28% (301) 23% (246) 24% (256) 11% (113) 1063Age: 18-34 20% (92) 27% (125) 18% (83) 17% (75) 17% (80) 456Age: 35-44 21% (63) 29% (87) 18% (54) 23% (68) 9% (27) 300Age: 45-64 14% (99) 27% (198) 20% (147) 33% (238) 7% (48) 730Age: 65+ 14% (69) 31% (155) 21% (105) 31% (156) 4% (19) 504GenZers: 1997-2012 19% (32) 20% (35) 23% (39) 12% (20) 26% (44) 169Millennials: 1981-1996 22% (104) 30% (146) 15% (73) 22% (107) 10% (50) 480GenXers: 1965-1980 16% (84) 28% (146) 22% (115) 25% (133) 9% (46) 525Baby Boomers: 1946-1964 12% (93) 29% (214) 20% (152) 34% (253) 5% (34) 746PID: Dem (no lean) 29% (217) 42% (319) 16% (117) 6% (48) 7% (51) 752PID: Ind (no lean) 11% (66) 25% (142) 23% (133) 29% (166) 12% (71) 578PID: Rep (no lean) 6% (41) 16% (104) 21% (141) 49% (323) 8% (52) 661PID/Gender: DemMen 36% (128) 42% (149) 11% (39) 8% (28) 4% (14) 359PID/Gender: DemWomen 23% (89) 43% (170) 20% (77) 5% (20) 9% (37) 393PID/Gender: Ind Men 10% (26) 25% (68) 21% (56) 36% (95) 8% (22) 267PID/Gender: Ind Women 13% (40) 24% (75) 25% (76) 23% (71) 16% (49) 311PID/Gender: Rep Men 8% (24) 15% (47) 16% (48) 52% (158) 8% (25) 301PID/Gender: Rep Women 5% (17) 16% (57) 26% (93) 46% (165) 8% (27) 360Ideo: Liberal (1-3) 29% (168) 42% (248) 16% (92) 8% (46) 6% (33) 587Ideo: Moderate (4) 16% (87) 33% (176) 24% (127) 18% (94) 10% (55) 539Ideo: Conservative (5-7) 7% (55) 16% (116) 20% (152) 51% (382) 5% (37) 742Educ: < College 15% (177) 26% (320) 20% (247) 27% (331) 11% (139) 1213Educ: Bachelors degree 17% (82) 32% (159) 18% (86) 29% (142) 4% (20) 489Educ: Post-grad 23% (65) 30% (87) 20% (56) 23% (65) 5% (16) 288Income: Under 50k 16% (163) 28% (277) 20% (195) 25% (245) 11% (112) 991Income: 50k-100k 14% (87) 30% (192) 20% (128) 29% (187) 7% (46) 640Income: 100k+ 21% (74) 27% (97) 19% (67) 29% (106) 4% (16) 359Ethnicity: White 15% (237) 27% (433) 20% (309) 30% (481) 8% (124) 1584Ethnicity: Hispanic 16% (31) 32% (63) 19% (38) 17% (33) 16% (30) 196
Continued on next page
Page 140
140
Morning ConsultTable POL3_5
Table POL3_5: How would you rate each of the following on their handling of the coronavirus?The World Health Organization (WHO)
Demographic Excellent Good Just Fair PoorDon’t Know /No Opinion Total N
Registered Voters 16% (324) 28% (565) 20% (390) 27% (537) 9% (174) 1990Ethnicity: Black 25% (60) 33% (80) 17% (41) 11% (27) 14% (35) 243Ethnicity: Other 16% (27) 32% (53) 25% (40) 18% (29) 9% (15) 163All Christian 14% (138) 27% (264) 20% (189) 33% (318) 6% (55) 964All Non-Christian 33% (40) 26% (32) 15% (18) 16% (19) 10% (12) 121Atheist 21% (15) 44% (32) 16% (11) 15% (11) 5% (3) 73Agnostic/Nothing in particular 18% (91) 30% (148) 21% (103) 19% (96) 12% (57) 495Something Else 12% (39) 27% (90) 20% (69) 28% (93) 14% (46) 337Religious Non-Protestant/Catholic 30% (42) 27% (39) 15% (21) 17% (24) 10% (14) 140Evangelical 15% (80) 22% (118) 19% (104) 37% (204) 7% (40) 547Non-Evangelical 13% (94) 31% (224) 20% (146) 28% (198) 8% (58) 721Community: Urban 26% (137) 29% (155) 19% (101) 17% (92) 8% (43) 529Community: Suburban 13% (133) 29% (292) 19% (186) 30% (296) 9% (90) 998Community: Rural 12% (54) 25% (118) 22% (103) 32% (149) 9% (41) 464Employ: Private Sector 18% (113) 28% (177) 19% (117) 27% (166) 8% (48) 622Employ: Government 14% (18) 38% (48) 15% (19) 24% (31) 9% (12) 129Employ: Self-Employed 18% (28) 27% (42) 23% (36) 29% (45) 4% (6) 157Employ: Homemaker 15% (19) 19% (24) 25% (32) 29% (37) 12% (15) 127Employ: Retired 15% (86) 30% (174) 19% (111) 32% (185) 4% (24) 581Employ: Unemployed 15% (32) 25% (53) 20% (42) 23% (49) 18% (40) 215Employ: Other 16% (18) 29% (33) 21% (24) 16% (18) 18% (20) 113Military HH: Yes 14% (50) 25% (92) 22% (81) 34% (124) 4% (14) 361Military HH: No 17% (274) 29% (473) 19% (309) 25% (413) 10% (160) 1629RD/WT: Right Direction 29% (271) 43% (407) 15% (143) 5% (51) 7% (70) 941RD/WT: Wrong Track 5% (53) 15% (158) 24% (247) 46% (487) 10% (104) 1049Biden Job Approve 29% (297) 43% (450) 16% (165) 6% (60) 6% (65) 1037Biden Job Disapprove 3% (24) 12% (101) 24% (202) 55% (469) 7% (61) 857Biden Job Strongly Approve 39% (215) 41% (225) 12% (67) 3% (17) 4% (24) 548Biden Job Somewhat Approve 17% (82) 46% (225) 20% (98) 9% (43) 8% (42) 489Biden Job Somewhat Disapprove 3% (7) 23% (51) 36% (80) 31% (69) 7% (16) 223Biden Job Strongly Disapprove 3% (17) 8% (50) 19% (122) 63% (399) 7% (45) 634
Continued on next page
Page 141
National Tracking Poll #210636, June, 2021
141
Table POL3_5
Table POL3_5: How would you rate each of the following on their handling of the coronavirus?The World Health Organization (WHO)
Demographic Excellent Good Just Fair PoorDon’t Know /No Opinion Total N
Registered Voters 16% (324) 28% (565) 20% (390) 27% (537) 9% (174) 1990Favorable of Biden 28% (291) 43% (455) 16% (170) 6% (67) 6% (66) 1048Unfavorable of Biden 3% (29) 11% (97) 23% (198) 54% (461) 8% (69) 855Very Favorable of Biden 39% (229) 42% (246) 12% (71) 3% (18) 5% (29) 593Somewhat Favorable of Biden 14% (62) 46% (208) 22% (99) 11% (48) 8% (38) 455Somewhat Unfavorable of Biden 6% (11) 23% (43) 37% (70) 24% (45) 11% (21) 190Very Unfavorable of Biden 3% (19) 8% (54) 19% (128) 63% (417) 7% (47) 664#1 Issue: Economy 14% (104) 27% (205) 22% (170) 28% (217) 9% (67) 763#1 Issue: Security 9% (32) 17% (58) 13% (46) 52% (182) 9% (31) 349#1 Issue: Health Care 26% (60) 37% (86) 20% (47) 7% (16) 11% (25) 233#1 Issue: Medicare / Social Security 17% (44) 37% (96) 22% (57) 19% (51) 5% (13) 261#1 Issue: Women’s Issues 18% (19) 28% (29) 22% (23) 12% (13) 19% (19) 103#1 Issue: Education 22% (19) 39% (34) 17% (15) 15% (13) 7% (6) 86#1 Issue: Energy 29% (25) 36% (31) 14% (12) 13% (12) 8% (7) 86#1 Issue: Other 19% (21) 24% (26) 19% (21) 32% (35) 5% (6) 1092020 Vote: Joe Biden 27% (246) 43% (390) 17% (155) 6% (56) 6% (50) 8972020 Vote: Donald Trump 5% (39) 14% (118) 20% (166) 54% (439) 7% (56) 8182020 Vote: Didn’t Vote 14% (34) 19% (46) 26% (62) 14% (33) 26% (63) 2392018 House Vote: Democrat 28% (190) 44% (301) 17% (116) 7% (50) 4% (30) 6872018 House Vote: Republican 6% (40) 15% (103) 21% (147) 52% (361) 6% (39) 6902018 House Vote: Someone else 15% (7) 9% (5) 17% (9) 29% (15) 29% (14) 502016 Vote: Hillary Clinton 28% (179) 44% (275) 16% (101) 7% (42) 5% (34) 6312016 Vote: Donald Trump 6% (48) 15% (115) 23% (173) 50% (387) 6% (45) 7682016 Vote: Other 10% (11) 31% (33) 21% (23) 31% (34) 6% (7) 1072016 Vote: Didn’t Vote 18% (85) 29% (142) 19% (93) 15% (74) 18% (88) 483Voted in 2014: Yes 17% (217) 29% (373) 19% (243) 31% (396) 5% (68) 1297Voted in 2014: No 15% (107) 28% (192) 21% (147) 20% (141) 15% (106) 6934-Region: Northeast 21% (73) 31% (106) 19% (64) 22% (75) 8% (27) 3444-Region: Midwest 16% (72) 31% (143) 18% (81) 28% (126) 7% (33) 4554-Region: South 16% (117) 26% (195) 19% (147) 30% (223) 10% (74) 7554-Region: West 14% (62) 28% (122) 23% (99) 26% (114) 9% (39) 435
Continued on next page
Page 142
142
Morning ConsultTable POL3_5
Table POL3_5: How would you rate each of the following on their handling of the coronavirus?The World Health Organization (WHO)
Demographic Excellent Good Just Fair PoorDon’t Know /No Opinion Total N
Registered Voters 16% (324) 28% (565) 20% (390) 27% (537) 9% (174) 1990Party: Democrat/Leans Democrat 28% (244) 43% (378) 17% (150) 6% (55) 7% (61) 888Party: Republican/Leans Republican 6% (45) 15% (123) 22% (178) 49% (402) 8% (66) 814Note: Row proportions may total to larger than one-hundred percent due to rounding. For more information visit MorningConsultIntelligence.com.
Page 143
National Tracking Poll #210636, June, 2021
143
Table POL3_6
Table POL3_6: How would you rate each of the following on their handling of the coronavirus?The Centers for Disease Control and Prevention (CDC)
Demographic Excellent Good Just Fair PoorDon’t Know /No Opinion Total N
Registered Voters 21% (427) 33% (663) 20% (407) 19% (388) 5% (106) 1990Gender: Male 23% (211) 33% (308) 19% (173) 21% (198) 4% (37) 927Gender: Female 20% (216) 33% (355) 22% (234) 18% (189) 7% (69) 1063Age: 18-34 23% (103) 28% (129) 22% (102) 16% (71) 11% (51) 456Age: 35-44 26% (78) 32% (97) 18% (54) 18% (54) 6% (18) 300Age: 45-64 17% (127) 34% (250) 20% (147) 24% (174) 4% (31) 730Age: 65+ 24% (120) 37% (185) 21% (104) 17% (88) 1% (7) 504GenZers: 1997-2012 14% (24) 29% (50) 28% (47) 11% (19) 18% (30) 169Millennials: 1981-1996 26% (127) 31% (147) 18% (87) 18% (88) 7% (31) 480GenXers: 1965-1980 21% (108) 33% (171) 20% (104) 21% (108) 6% (33) 525Baby Boomers: 1946-1964 21% (153) 36% (266) 21% (155) 21% (160) 1% (11) 746PID: Dem (no lean) 36% (268) 44% (332) 13% (98) 5% (34) 3% (20) 752PID: Ind (no lean) 18% (101) 27% (158) 25% (144) 21% (119) 10% (56) 578PID: Rep (no lean) 9% (59) 26% (173) 25% (165) 36% (235) 5% (30) 661PID/Gender: DemMen 38% (136) 44% (156) 12% (43) 5% (19) 2% (6) 359PID/Gender: DemWomen 34% (132) 45% (176) 14% (56) 4% (15) 4% (14) 393PID/Gender: Ind Men 17% (46) 25% (67) 25% (67) 26% (69) 7% (19) 267PID/Gender: Ind Women 18% (56) 29% (91) 25% (77) 16% (49) 12% (37) 311PID/Gender: Rep Men 10% (30) 28% (85) 21% (63) 37% (111) 4% (12) 301PID/Gender: Rep Women 8% (29) 24% (88) 28% (101) 35% (125) 5% (18) 360Ideo: Liberal (1-3) 36% (210) 42% (247) 14% (85) 6% (34) 2% (12) 587Ideo: Moderate (4) 22% (118) 38% (207) 21% (114) 12% (64) 7% (36) 539Ideo: Conservative (5-7) 11% (82) 25% (185) 24% (178) 37% (276) 3% (20) 742Educ: < College 19% (235) 32% (388) 20% (248) 20% (249) 8% (93) 1213Educ: Bachelors degree 24% (118) 35% (172) 20% (97) 19% (94) 1% (7) 489Educ: Post-grad 26% (75) 35% (102) 21% (61) 16% (45) 2% (5) 288Income: Under 50k 22% (219) 30% (302) 21% (208) 19% (185) 8% (77) 991Income: 50k-100k 19% (125) 36% (230) 21% (135) 20% (129) 3% (21) 640Income: 100k+ 23% (83) 36% (131) 18% (64) 20% (73) 2% (8) 359Ethnicity: White 21% (325) 32% (512) 20% (322) 22% (346) 5% (78) 1584Ethnicity: Hispanic 21% (40) 33% (65) 24% (47) 12% (23) 11% (21) 196
Continued on next page
Page 144
144
Morning ConsultTable POL3_6
Table POL3_6: How would you rate each of the following on their handling of the coronavirus?The Centers for Disease Control and Prevention (CDC)
Demographic Excellent Good Just Fair PoorDon’t Know /No Opinion Total N
Registered Voters 21% (427) 33% (663) 20% (407) 19% (388) 5% (106) 1990Ethnicity: Black 26% (63) 40% (97) 18% (43) 9% (21) 8% (19) 243Ethnicity: Other 24% (39) 32% (53) 25% (41) 13% (20) 6% (9) 163All Christian 20% (191) 33% (318) 21% (205) 23% (221) 3% (28) 964All Non-Christian 41% (49) 31% (37) 15% (18) 7% (9) 7% (8) 121Atheist 24% (18) 44% (32) 20% (15) 8% (6) 4% (3) 73Agnostic/Nothing in particular 22% (107) 33% (165) 20% (101) 17% (82) 8% (39) 495Something Else 18% (61) 32% (109) 20% (68) 21% (70) 8% (28) 337Religious Non-Protestant/Catholic 37% (51) 30% (42) 15% (22) 10% (14) 7% (11) 140Evangelical 19% (106) 26% (144) 21% (116) 29% (157) 4% (25) 547Non-Evangelical 20% (143) 38% (272) 21% (150) 18% (126) 4% (28) 721Community: Urban 27% (143) 36% (189) 19% (103) 13% (69) 5% (24) 529Community: Suburban 20% (201) 32% (323) 21% (211) 21% (212) 5% (50) 998Community: Rural 18% (83) 32% (151) 20% (93) 23% (106) 7% (32) 464Employ: Private Sector 22% (136) 34% (214) 20% (127) 19% (116) 5% (29) 622Employ: Government 17% (22) 32% (41) 23% (29) 22% (28) 7% (8) 129Employ: Self-Employed 21% (33) 31% (48) 21% (32) 25% (39) 3% (5) 157Employ: Homemaker 17% (22) 32% (40) 17% (22) 25% (32) 8% (10) 127Employ: Retired 23% (134) 37% (215) 20% (113) 19% (112) 1% (7) 581Employ: Unemployed 20% (42) 27% (58) 23% (49) 16% (35) 14% (30) 215Employ: Other 23% (26) 28% (32) 18% (21) 18% (21) 12% (13) 113Military HH: Yes 20% (71) 33% (119) 22% (80) 22% (81) 3% (11) 361Military HH: No 22% (356) 33% (544) 20% (327) 19% (307) 6% (95) 1629RD/WT: Right Direction 36% (340) 44% (417) 13% (123) 3% (26) 4% (36) 941RD/WT: Wrong Track 8% (87) 23% (246) 27% (284) 35% (362) 7% (69) 1049Biden Job Approve 37% (382) 44% (459) 13% (138) 3% (30) 3% (28) 1037Biden Job Disapprove 5% (42) 21% (181) 29% (246) 41% (351) 4% (37) 857Biden Job Strongly Approve 49% (270) 40% (219) 7% (41) 2% (10) 1% (7) 548Biden Job Somewhat Approve 23% (111) 49% (239) 20% (97) 4% (20) 4% (21) 489Biden Job Somewhat Disapprove 7% (15) 33% (74) 37% (83) 18% (40) 5% (11) 223Biden Job Strongly Disapprove 4% (26) 17% (107) 26% (163) 49% (311) 4% (26) 634
Continued on next page
Page 145
National Tracking Poll #210636, June, 2021
145
Table POL3_6
Table POL3_6: How would you rate each of the following on their handling of the coronavirus?The Centers for Disease Control and Prevention (CDC)
Demographic Excellent Good Just Fair PoorDon’t Know /No Opinion Total N
Registered Voters 21% (427) 33% (663) 20% (407) 19% (388) 5% (106) 1990Favorable of Biden 36% (373) 45% (467) 13% (141) 3% (34) 3% (33) 1048Unfavorable of Biden 5% (46) 21% (176) 29% (245) 40% (344) 5% (44) 855Very Favorable of Biden 50% (295) 38% (228) 8% (50) 2% (9) 2% (10) 593Somewhat Favorable of Biden 17% (77) 52% (239) 20% (91) 5% (25) 5% (23) 455Somewhat Unfavorable of Biden 12% (23) 33% (62) 31% (60) 17% (32) 7% (14) 190Very Unfavorable of Biden 4% (24) 17% (114) 28% (185) 47% (312) 5% (31) 664#1 Issue: Economy 19% (143) 32% (244) 23% (179) 20% (155) 6% (43) 763#1 Issue: Security 12% (41) 24% (85) 20% (70) 39% (135) 5% (18) 349#1 Issue: Health Care 34% (79) 40% (94) 14% (32) 7% (17) 5% (11) 233#1 Issue: Medicare / Social Security 24% (62) 42% (110) 21% (55) 11% (28) 2% (6) 261#1 Issue: Women’s Issues 27% (28) 32% (33) 20% (20) 8% (8) 13% (14) 103#1 Issue: Education 19% (16) 48% (41) 18% (15) 9% (8) 6% (5) 86#1 Issue: Energy 31% (27) 36% (31) 17% (15) 11% (9) 5% (4) 86#1 Issue: Other 29% (32) 23% (25) 19% (20) 25% (28) 4% (5) 1092020 Vote: Joe Biden 36% (322) 44% (398) 14% (122) 4% (33) 3% (23) 8972020 Vote: Donald Trump 8% (61) 24% (194) 25% (205) 40% (325) 4% (33) 8182020 Vote: Didn’t Vote 16% (39) 26% (63) 28% (68) 10% (25) 19% (45) 2392018 House Vote: Democrat 36% (246) 45% (312) 13% (90) 4% (30) 1% (9) 6872018 House Vote: Republican 10% (67) 24% (166) 26% (183) 37% (255) 3% (20) 6902018 House Vote: Someone else 16% (8) 15% (8) 27% (14) 19% (10) 23% (11) 502016 Vote: Hillary Clinton 37% (233) 44% (278) 13% (79) 5% (30) 2% (10) 6312016 Vote: Donald Trump 10% (74) 25% (193) 26% (197) 36% (280) 3% (25) 7682016 Vote: Other 22% (24) 28% (30) 26% (28) 18% (20) 5% (6) 1072016 Vote: Didn’t Vote 20% (97) 33% (161) 21% (103) 12% (58) 13% (65) 483Voted in 2014: Yes 23% (296) 33% (429) 20% (265) 21% (277) 2% (30) 1297Voted in 2014: No 19% (131) 34% (234) 20% (142) 16% (110) 11% (76) 6934-Region: Northeast 30% (104) 32% (110) 17% (60) 16% (56) 4% (14) 3444-Region: Midwest 20% (92) 37% (168) 17% (77) 21% (96) 5% (22) 4554-Region: South 19% (147) 34% (254) 21% (157) 20% (151) 6% (46) 7554-Region: West 19% (85) 30% (130) 26% (113) 19% (84) 5% (23) 435
Continued on next page
Page 146
146
Morning ConsultTable POL3_6
Table POL3_6: How would you rate each of the following on their handling of the coronavirus?The Centers for Disease Control and Prevention (CDC)
Demographic Excellent Good Just Fair PoorDon’t Know /No Opinion Total N
Registered Voters 21% (427) 33% (663) 20% (407) 19% (388) 5% (106) 1990Party: Democrat/Leans Democrat 35% (311) 44% (394) 14% (123) 4% (38) 2% (22) 888Party: Republican/Leans Republican 9% (75) 24% (197) 26% (208) 36% (290) 5% (43) 814Note: Row proportions may total to larger than one-hundred percent due to rounding. For more information visit MorningConsultIntelligence.com.
Page 147
National Tracking Poll #210636, June, 2021
147
Table POL3_7
Table POL3_7: How would you rate each of the following on their handling of the coronavirus?Your state’s governor
Demographic Excellent Good Just Fair PoorDon’t Know /No Opinion Total N
Registered Voters 21% (413) 29% (586) 21% (418) 23% (458) 6% (114) 1990Gender: Male 20% (187) 30% (281) 22% (203) 23% (212) 5% (44) 927Gender: Female 21% (226) 29% (306) 20% (215) 23% (247) 7% (70) 1063Age: 18-34 15% (69) 27% (124) 22% (100) 23% (106) 13% (57) 456Age: 35-44 22% (65) 26% (79) 23% (68) 24% (72) 5% (16) 300Age: 45-64 20% (146) 30% (222) 21% (153) 24% (176) 5% (34) 730Age: 65+ 26% (133) 32% (161) 19% (98) 21% (105) 1% (7) 504GenZers: 1997-2012 12% (20) 22% (37) 28% (48) 20% (33) 18% (31) 169Millennials: 1981-1996 20% (97) 30% (144) 19% (91) 23% (112) 7% (36) 480GenXers: 1965-1980 18% (96) 28% (145) 24% (124) 24% (128) 6% (33) 525Baby Boomers: 1946-1964 24% (179) 32% (238) 19% (145) 23% (170) 2% (14) 746PID: Dem (no lean) 26% (194) 33% (248) 18% (139) 19% (143) 4% (29) 752PID: Ind (no lean) 16% (95) 26% (148) 25% (144) 23% (135) 10% (56) 578PID: Rep (no lean) 19% (124) 29% (190) 21% (136) 27% (181) 4% (29) 661PID/Gender: DemMen 26% (93) 34% (122) 21% (74) 16% (59) 3% (10) 359PID/Gender: DemWomen 26% (100) 32% (126) 16% (64) 21% (83) 5% (18) 393PID/Gender: Ind Men 15% (41) 26% (69) 24% (64) 29% (76) 6% (17) 267PID/Gender: Ind Women 17% (54) 25% (79) 26% (79) 19% (59) 13% (40) 311PID/Gender: Rep Men 17% (53) 30% (90) 22% (65) 25% (76) 6% (17) 301PID/Gender: Rep Women 20% (72) 28% (100) 20% (71) 29% (105) 3% (12) 360Ideo: Liberal (1-3) 25% (149) 31% (185) 21% (125) 18% (107) 4% (21) 587Ideo: Moderate (4) 17% (91) 32% (171) 22% (117) 23% (124) 7% (36) 539Ideo: Conservative (5-7) 21% (156) 28% (209) 21% (157) 28% (206) 2% (15) 742Educ: < College 19% (225) 28% (345) 22% (261) 24% (288) 8% (95) 1213Educ: Bachelors degree 22% (106) 30% (146) 23% (112) 23% (112) 3% (14) 489Educ: Post-grad 29% (83) 33% (96) 16% (46) 21% (59) 2% (5) 288Income: Under 50k 20% (202) 28% (280) 21% (204) 22% (221) 8% (84) 991Income: 50k-100k 20% (125) 28% (182) 24% (151) 25% (162) 3% (20) 640Income: 100k+ 24% (86) 35% (124) 18% (63) 21% (75) 3% (10) 359Ethnicity: White 22% (345) 31% (485) 19% (308) 23% (372) 5% (74) 1584Ethnicity: Hispanic 20% (40) 25% (49) 24% (48) 21% (41) 9% (18) 196
Continued on next page
Page 148
148
Morning ConsultTable POL3_7
Table POL3_7: How would you rate each of the following on their handling of the coronavirus?Your state’s governor
Demographic Excellent Good Just Fair PoorDon’t Know /No Opinion Total N
Registered Voters 21% (413) 29% (586) 21% (418) 23% (458) 6% (114) 1990Ethnicity: Black 16% (39) 27% (65) 25% (61) 21% (52) 10% (25) 243Ethnicity: Other 18% (29) 22% (36) 30% (49) 21% (35) 9% (14) 163All Christian 23% (222) 31% (302) 21% (203) 22% (211) 3% (27) 964All Non-Christian 31% (38) 31% (38) 12% (14) 16% (19) 10% (12) 121Atheist 24% (18) 27% (20) 27% (20) 21% (15) 1% (1) 73Agnostic/Nothing in particular 18% (88) 26% (128) 24% (118) 24% (119) 8% (42) 495Something Else 14% (48) 29% (99) 19% (63) 28% (94) 10% (33) 337Religious Non-Protestant/Catholic 29% (41) 31% (43) 14% (19) 16% (23) 10% (14) 140Evangelical 21% (114) 32% (176) 18% (100) 23% (128) 5% (30) 547Non-Evangelical 21% (148) 30% (217) 22% (158) 24% (171) 4% (27) 721Community: Urban 23% (120) 30% (158) 22% (118) 19% (98) 7% (34) 529Community: Suburban 21% (210) 28% (282) 21% (212) 25% (246) 5% (48) 998Community: Rural 18% (83) 32% (146) 19% (88) 25% (114) 7% (32) 464Employ: Private Sector 21% (127) 29% (179) 22% (136) 24% (147) 5% (32) 622Employ: Government 15% (20) 41% (52) 15% (19) 20% (25) 10% (12) 129Employ: Self-Employed 26% (41) 24% (39) 22% (35) 23% (36) 4% (7) 157Employ: Homemaker 18% (23) 33% (42) 16% (21) 27% (34) 6% (7) 127Employ: Retired 25% (147) 33% (189) 20% (117) 21% (122) 1% (7) 581Employ: Unemployed 14% (30) 19% (40) 26% (56) 27% (57) 14% (31) 215Employ: Other 17% (19) 28% (32) 21% (24) 19% (22) 15% (16) 113Military HH: Yes 19% (67) 31% (114) 20% (73) 27% (98) 3% (9) 361Military HH: No 21% (346) 29% (473) 21% (345) 22% (360) 6% (105) 1629RD/WT: Right Direction 27% (251) 35% (326) 18% (166) 16% (148) 5% (50) 941RD/WT: Wrong Track 15% (163) 25% (260) 24% (252) 30% (310) 6% (63) 1049Biden Job Approve 26% (267) 34% (356) 19% (192) 17% (181) 4% (41) 1037Biden Job Disapprove 16% (141) 25% (213) 23% (201) 31% (269) 4% (33) 857Biden Job Strongly Approve 36% (195) 34% (185) 13% (69) 14% (78) 4% (21) 548Biden Job Somewhat Approve 15% (71) 35% (172) 25% (123) 21% (103) 4% (20) 489Biden Job Somewhat Disapprove 9% (21) 28% (62) 37% (82) 23% (52) 3% (6) 223Biden Job Strongly Disapprove 19% (120) 24% (150) 19% (119) 34% (217) 4% (27) 634
Continued on next page
Page 149
National Tracking Poll #210636, June, 2021
149
Table POL3_7
Table POL3_7: How would you rate each of the following on their handling of the coronavirus?Your state’s governor
Demographic Excellent Good Just Fair PoorDon’t Know /No Opinion Total N
Registered Voters 21% (413) 29% (586) 21% (418) 23% (458) 6% (114) 1990Favorable of Biden 25% (264) 35% (363) 19% (198) 17% (182) 4% (41) 1048Unfavorable of Biden 17% (145) 25% (212) 23% (197) 31% (264) 4% (38) 855Very Favorable of Biden 35% (210) 32% (193) 13% (77) 16% (93) 3% (20) 593Somewhat Favorable of Biden 12% (54) 38% (171) 27% (121) 20% (89) 5% (21) 455Somewhat Unfavorable of Biden 10% (18) 27% (51) 36% (69) 23% (43) 4% (8) 190Very Unfavorable of Biden 19% (127) 24% (161) 19% (128) 33% (220) 4% (29) 664#1 Issue: Economy 17% (128) 29% (225) 23% (176) 25% (190) 6% (44) 763#1 Issue: Security 23% (82) 28% (99) 18% (64) 25% (88) 5% (17) 349#1 Issue: Health Care 28% (64) 30% (69) 21% (50) 16% (37) 5% (12) 233#1 Issue: Medicare / Social Security 28% (73) 28% (73) 19% (50) 21% (53) 5% (12) 261#1 Issue: Women’s Issues 12% (12) 32% (33) 20% (20) 22% (23) 15% (15) 103#1 Issue: Education 20% (17) 33% (28) 18% (15) 21% (18) 8% (7) 86#1 Issue: Energy 23% (20) 28% (24) 26% (22) 19% (17) 4% (3) 86#1 Issue: Other 16% (18) 32% (34) 19% (21) 30% (33) 3% (3) 1092020 Vote: Joe Biden 25% (225) 34% (305) 18% (165) 18% (165) 4% (36) 8972020 Vote: Donald Trump 20% (160) 28% (226) 22% (177) 28% (228) 3% (28) 8182020 Vote: Didn’t Vote 9% (22) 20% (49) 29% (69) 22% (54) 19% (45) 2392018 House Vote: Democrat 27% (185) 36% (248) 18% (120) 17% (118) 2% (16) 6872018 House Vote: Republican 20% (136) 29% (197) 22% (152) 28% (192) 2% (14) 6902018 House Vote: Someone else 21% (10) 12% (6) 13% (6) 30% (15) 24% (12) 502016 Vote: Hillary Clinton 27% (172) 36% (228) 18% (112) 16% (100) 3% (19) 6312016 Vote: Donald Trump 20% (152) 27% (204) 22% (170) 29% (220) 3% (21) 7682016 Vote: Other 18% (19) 22% (24) 18% (19) 37% (39) 6% (6) 1072016 Vote: Didn’t Vote 14% (70) 27% (129) 24% (118) 21% (99) 14% (68) 483Voted in 2014: Yes 23% (304) 31% (408) 19% (251) 23% (298) 3% (36) 1297Voted in 2014: No 16% (109) 26% (178) 24% (168) 23% (161) 11% (78) 6934-Region: Northeast 27% (94) 35% (121) 17% (58) 17% (58) 4% (13) 3444-Region: Midwest 19% (88) 33% (148) 21% (98) 21% (93) 6% (28) 4554-Region: South 22% (169) 28% (214) 19% (142) 24% (184) 6% (47) 7554-Region: West 14% (61) 24% (104) 28% (121) 28% (123) 6% (27) 435
Continued on next page
Page 150
150
Morning ConsultTable POL3_7
Table POL3_7: How would you rate each of the following on their handling of the coronavirus?Your state’s governor
Demographic Excellent Good Just Fair PoorDon’t Know /No Opinion Total N
Registered Voters 21% (413) 29% (586) 21% (418) 23% (458) 6% (114) 1990Party: Democrat/Leans Democrat 25% (220) 33% (297) 19% (171) 19% (165) 4% (35) 888Party: Republican/Leans Republican 19% (153) 27% (216) 22% (177) 28% (231) 4% (36) 814Note: Row proportions may total to larger than one-hundred percent due to rounding. For more information visit MorningConsultIntelligence.com.
Page 151
National Tracking Poll #210636, June, 2021
151
Table POL3_8
Table POL3_8: How would you rate each of the following on their handling of the coronavirus?Dr. Anthony Fauci, Director of the National Institute of Allergy and Infectious Diseases
Demographic Excellent Good Just Fair PoorDon’t Know /No Opinion Total N
Registered Voters 29% (579) 21% (420) 16% (317) 27% (532) 7% (142) 1990Gender: Male 30% (274) 23% (217) 15% (141) 28% (256) 4% (40) 927Gender: Female 29% (305) 19% (203) 17% (176) 26% (276) 10% (102) 1063Age: 18-34 22% (100) 23% (105) 18% (80) 21% (96) 16% (75) 456Age: 35-44 29% (86) 25% (75) 13% (40) 26% (79) 7% (21) 300Age: 45-64 27% (196) 21% (150) 17% (126) 30% (218) 6% (41) 730Age: 65+ 39% (198) 18% (89) 14% (72) 28% (139) 1% (6) 504GenZers: 1997-2012 15% (25) 24% (40) 19% (32) 19% (32) 23% (40) 169Millennials: 1981-1996 26% (127) 24% (116) 15% (72) 24% (115) 10% (50) 480GenXers: 1965-1980 27% (143) 21% (113) 18% (95) 27% (142) 6% (32) 525Baby Boomers: 1946-1964 35% (263) 18% (137) 14% (103) 30% (224) 3% (20) 746PID: Dem (no lean) 51% (387) 27% (200) 12% (89) 5% (37) 5% (39) 752PID: Ind (no lean) 22% (128) 21% (119) 19% (109) 28% (162) 10% (59) 578PID: Rep (no lean) 10% (64) 15% (101) 18% (119) 50% (332) 7% (44) 661PID/Gender: DemMen 52% (185) 28% (102) 12% (44) 6% (20) 2% (8) 359PID/Gender: DemWomen 51% (201) 25% (98) 11% (45) 4% (17) 8% (31) 393PID/Gender: Ind Men 21% (55) 23% (61) 17% (45) 33% (88) 7% (18) 267PID/Gender: Ind Women 23% (73) 19% (58) 21% (64) 24% (73) 13% (42) 311PID/Gender: Rep Men 11% (33) 18% (54) 17% (52) 49% (147) 5% (15) 301PID/Gender: Rep Women 9% (31) 13% (47) 19% (67) 52% (185) 8% (29) 360Ideo: Liberal (1-3) 51% (299) 27% (161) 12% (69) 6% (36) 4% (22) 587Ideo: Moderate (4) 31% (167) 27% (147) 17% (89) 16% (87) 9% (50) 539Ideo: Conservative (5-7) 13% (94) 13% (100) 18% (136) 52% (387) 3% (25) 742Educ: < College 25% (303) 19% (232) 17% (212) 29% (350) 10% (115) 1213Educ: Bachelors degree 33% (160) 25% (121) 14% (67) 25% (124) 3% (17) 489Educ: Post-grad 40% (116) 23% (66) 13% (38) 20% (57) 3% (10) 288Income: Under 50k 30% (300) 18% (176) 16% (155) 26% (258) 10% (102) 991Income: 50k-100k 25% (159) 26% (165) 15% (99) 29% (183) 5% (34) 640Income: 100k+ 33% (120) 22% (79) 18% (63) 25% (91) 2% (6) 359Ethnicity: White 28% (450) 20% (315) 15% (244) 30% (475) 6% (100) 1584Ethnicity: Hispanic 26% (51) 21% (42) 20% (39) 19% (37) 14% (27) 196
Continued on next page
Page 152
152
Morning ConsultTable POL3_8
Table POL3_8: How would you rate each of the following on their handling of the coronavirus?Dr. Anthony Fauci, Director of the National Institute of Allergy and Infectious Diseases
Demographic Excellent Good Just Fair PoorDon’t Know /No Opinion Total N
Registered Voters 29% (579) 21% (420) 16% (317) 27% (532) 7% (142) 1990Ethnicity: Black 34% (82) 27% (65) 16% (38) 12% (28) 13% (31) 243Ethnicity: Other 29% (47) 25% (40) 22% (36) 18% (29) 7% (11) 163All Christian 28% (267) 20% (194) 16% (155) 33% (314) 3% (33) 964All Non-Christian 45% (55) 22% (26) 11% (14) 12% (14) 10% (12) 121Atheist 40% (29) 25% (18) 15% (11) 12% (9) 8% (6) 73Agnostic/Nothing in particular 30% (148) 24% (117) 16% (80) 20% (98) 10% (52) 495Something Else 24% (80) 19% (63) 17% (57) 29% (97) 12% (40) 337Religious Non-Protestant/Catholic 41% (57) 22% (30) 11% (15) 16% (23) 11% (16) 140Evangelical 22% (119) 15% (81) 16% (87) 42% (227) 6% (34) 547Non-Evangelical 31% (223) 23% (169) 17% (122) 24% (173) 5% (34) 721Community: Urban 35% (186) 26% (138) 16% (84) 16% (84) 7% (37) 529Community: Suburban 28% (278) 21% (207) 17% (165) 29% (287) 6% (60) 998Community: Rural 25% (115) 16% (75) 15% (68) 35% (160) 10% (45) 464Employ: Private Sector 27% (170) 24% (148) 16% (102) 27% (166) 6% (36) 622Employ: Government 26% (33) 24% (31) 18% (23) 22% (28) 10% (13) 129Employ: Self-Employed 29% (46) 20% (31) 20% (31) 27% (43) 4% (6) 157Employ: Homemaker 21% (26) 18% (23) 14% (18) 36% (46) 11% (13) 127Employ: Retired 39% (224) 17% (97) 13% (78) 28% (165) 3% (16) 581Employ: Unemployed 22% (46) 21% (45) 18% (39) 24% (51) 16% (34) 215Employ: Other 24% (27) 23% (26) 16% (18) 22% (24) 15% (17) 113Military HH: Yes 27% (99) 21% (78) 15% (54) 32% (116) 4% (15) 361Military HH: No 30% (481) 21% (342) 16% (263) 26% (416) 8% (127) 1629RD/WT: Right Direction 51% (483) 27% (254) 11% (107) 4% (34) 7% (63) 941RD/WT: Wrong Track 9% (96) 16% (166) 20% (210) 47% (498) 8% (79) 1049Biden Job Approve 51% (533) 29% (299) 11% (116) 3% (35) 5% (54) 1037Biden Job Disapprove 5% (43) 13% (111) 21% (176) 56% (484) 5% (44) 857Biden Job Strongly Approve 67% (365) 23% (124) 6% (35) 1% (8) 3% (16) 548Biden Job Somewhat Approve 34% (168) 36% (175) 17% (81) 6% (27) 8% (38) 489Biden Job Somewhat Disapprove 10% (22) 26% (57) 28% (63) 29% (65) 8% (17) 223Biden Job Strongly Disapprove 3% (21) 8% (53) 18% (113) 66% (419) 4% (27) 634
Continued on next page
Page 153
National Tracking Poll #210636, June, 2021
153
Table POL3_8
Table POL3_8: How would you rate each of the following on their handling of the coronavirus?Dr. Anthony Fauci, Director of the National Institute of Allergy and Infectious Diseases
Demographic Excellent Good Just Fair PoorDon’t Know /No Opinion Total N
Registered Voters 29% (579) 21% (420) 16% (317) 27% (532) 7% (142) 1990Favorable of Biden 51% (534) 29% (300) 11% (117) 4% (42) 5% (54) 1048Unfavorable of Biden 4% (37) 13% (109) 21% (182) 56% (476) 6% (51) 855Very Favorable of Biden 69% (406) 21% (126) 6% (37) 1% (9) 2% (14) 593Somewhat Favorable of Biden 28% (128) 38% (174) 17% (80) 7% (34) 9% (40) 455Somewhat Unfavorable of Biden 11% (21) 22% (42) 33% (62) 24% (45) 11% (20) 190Very Unfavorable of Biden 2% (16) 10% (67) 18% (120) 65% (431) 5% (31) 664#1 Issue: Economy 24% (180) 22% (167) 17% (127) 30% (227) 8% (63) 763#1 Issue: Security 15% (51) 16% (55) 13% (46) 51% (179) 5% (18) 349#1 Issue: Health Care 46% (106) 25% (59) 14% (32) 9% (21) 6% (14) 233#1 Issue: Medicare / Social Security 42% (109) 20% (51) 19% (49) 16% (41) 4% (10) 261#1 Issue: Women’s Issues 30% (30) 23% (23) 18% (19) 12% (12) 17% (18) 103#1 Issue: Education 31% (27) 33% (28) 15% (13) 11% (10) 10% (9) 86#1 Issue: Energy 36% (31) 24% (21) 18% (15) 12% (10) 10% (8) 86#1 Issue: Other 41% (45) 14% (15) 15% (16) 28% (31) 2% (2) 1092020 Vote: Joe Biden 53% (476) 29% (258) 10% (90) 4% (34) 4% (39) 8972020 Vote: Donald Trump 7% (60) 13% (110) 19% (154) 55% (451) 5% (44) 8182020 Vote: Didn’t Vote 14% (34) 19% (45) 28% (67) 16% (38) 23% (55) 2392018 House Vote: Democrat 55% (381) 27% (186) 11% (76) 3% (24) 3% (21) 6872018 House Vote: Republican 10% (66) 16% (109) 18% (122) 53% (364) 4% (30) 6902018 House Vote: Someone else 19% (10) 9% (4) 29% (15) 26% (13) 17% (8) 502016 Vote: Hillary Clinton 57% (362) 26% (166) 9% (57) 4% (28) 3% (18) 6312016 Vote: Donald Trump 10% (75) 17% (127) 18% (139) 51% (392) 4% (34) 7682016 Vote: Other 33% (36) 19% (20) 19% (20) 22% (24) 7% (8) 1072016 Vote: Didn’t Vote 22% (106) 22% (107) 21% (101) 18% (88) 17% (82) 483Voted in 2014: Yes 33% (429) 21% (267) 14% (180) 28% (368) 4% (53) 1297Voted in 2014: No 22% (150) 22% (153) 20% (138) 24% (164) 13% (89) 6934-Region: Northeast 39% (133) 23% (78) 14% (49) 19% (65) 5% (19) 3444-Region: Midwest 31% (142) 21% (97) 14% (63) 27% (123) 7% (30) 4554-Region: South 24% (182) 21% (162) 15% (117) 31% (233) 8% (61) 7554-Region: West 28% (122) 19% (82) 20% (89) 25% (111) 7% (32) 435
Continued on next page
Page 154
154
Morning ConsultTable POL3_8
Table POL3_8: How would you rate each of the following on their handling of the coronavirus?Dr. Anthony Fauci, Director of the National Institute of Allergy and Infectious Diseases
Demographic Excellent Good Just Fair PoorDon’t Know /No Opinion Total N
Registered Voters 29% (579) 21% (420) 16% (317) 27% (532) 7% (142) 1990Party: Democrat/Leans Democrat 51% (452) 27% (240) 12% (109) 5% (43) 5% (44) 888Party: Republican/Leans Republican 9% (74) 15% (122) 19% (152) 51% (416) 6% (49) 814Note: Row proportions may total to larger than one-hundred percent due to rounding. For more information visit MorningConsultIntelligence.com.
Page 155
National Tracking Poll #210636, June, 2021
155
Table POL4
Table POL4: Generally speaking, would you say you are more concerned about...
Demographic
The economic impact ofcoronavirus including theeffect on the stock market
and increasedunemployment
The public health impactof coronavirus includingthe spread of the diseasewhich would cause more
deathsDon’t know / No
opinion Total N
Registered Voters 43% (850) 48% (947) 10% (192) 1990Gender: Male 46% (424) 46% (424) 9% (79) 927Gender: Female 40% (427) 49% (523) 11% (113) 1063Age: 18-34 45% (205) 42% (192) 13% (59) 456Age: 35-44 43% (128) 45% (134) 13% (38) 300Age: 45-64 46% (338) 45% (330) 8% (62) 730Age: 65+ 35% (179) 58% (291) 7% (34) 504GenZers: 1997-2012 35% (60) 44% (74) 21% (36) 169Millennials: 1981-1996 49% (235) 42% (202) 9% (43) 480GenXers: 1965-1980 44% (231) 45% (235) 11% (58) 525Baby Boomers: 1946-1964 40% (299) 54% (402) 6% (45) 746PID: Dem (no lean) 24% (184) 70% (525) 6% (43) 752PID: Ind (no lean) 43% (247) 43% (251) 14% (80) 578PID: Rep (no lean) 64% (420) 26% (172) 10% (69) 661PID/Gender: DemMen 27% (96) 67% (241) 6% (22) 359PID/Gender: DemWomen 22% (88) 72% (284) 5% (21) 393PID/Gender: Ind Men 47% (126) 43% (114) 10% (27) 267PID/Gender: Ind Women 39% (120) 44% (137) 17% (54) 311PID/Gender: Rep Men 67% (201) 23% (69) 10% (31) 301PID/Gender: Rep Women 61% (219) 29% (103) 11% (38) 360Ideo: Liberal (1-3) 23% (137) 71% (414) 6% (36) 587Ideo: Moderate (4) 38% (206) 51% (277) 10% (56) 539Ideo: Conservative (5-7) 63% (468) 29% (215) 8% (60) 742Educ: < College 42% (513) 46% (554) 12% (146) 1213Educ: Bachelors degree 44% (214) 50% (243) 6% (31) 489Educ: Post-grad 43% (123) 52% (150) 5% (15) 288Income: Under 50k 39% (390) 49% (490) 11% (111) 991Income: 50k-100k 44% (283) 46% (297) 9% (60) 640Income: 100k+ 49% (177) 45% (160) 6% (21) 359
Continued on next page
Page 156
156
Morning ConsultTable POL4
Table POL4: Generally speaking, would you say you are more concerned about...
Demographic
The economic impact ofcoronavirus including theeffect on the stock market
and increasedunemployment
The public health impactof coronavirus includingthe spread of the diseasewhich would cause more
deathsDon’t know / No
opinion Total N
Registered Voters 43% (850) 48% (947) 10% (192) 1990Ethnicity: White 45% (721) 45% (720) 9% (144) 1584Ethnicity: Hispanic 36% (71) 52% (102) 12% (23) 196Ethnicity: Black 26% (62) 61% (148) 13% (32) 243Ethnicity: Other 41% (67) 49% (79) 10% (17) 163All Christian 48% (465) 45% (434) 7% (65) 964All Non-Christian 42% (51) 51% (61) 7% (9) 121Atheist 28% (20) 58% (43) 14% (10) 73Agnostic/Nothing in particular 37% (182) 50% (248) 13% (66) 495Something Else 39% (133) 48% (161) 13% (43) 337Religious Non-Protestant/Catholic 47% (65) 47% (66) 7% (10) 140Evangelical 51% (282) 41% (222) 8% (43) 547Non-Evangelical 41% (298) 50% (360) 9% (63) 721Community: Urban 36% (193) 56% (294) 8% (42) 529Community: Suburban 45% (448) 46% (458) 9% (91) 998Community: Rural 45% (209) 42% (195) 13% (59) 464Employ: Private Sector 51% (320) 41% (256) 7% (45) 622Employ: Government 45% (58) 43% (56) 12% (15) 129Employ: Self-Employed 40% (63) 48% (75) 12% (19) 157Employ: Homemaker 47% (59) 44% (55) 9% (12) 127Employ: Retired 37% (216) 55% (320) 8% (45) 581Employ: Unemployed 38% (81) 46% (99) 16% (35) 215Employ: Other 29% (32) 55% (62) 16% (18) 113Military HH: Yes 47% (169) 43% (154) 11% (38) 361Military HH: No 42% (682) 49% (793) 9% (154) 1629RD/WT: Right Direction 26% (247) 67% (629) 7% (65) 941RD/WT: Wrong Track 58% (603) 30% (318) 12% (127) 1049Biden Job Approve 26% (268) 68% (707) 6% (62) 1037Biden Job Disapprove 64% (552) 25% (214) 11% (92) 857
Continued on next page
Page 157
National Tracking Poll #210636, June, 2021
157
Table POL4
Table POL4: Generally speaking, would you say you are more concerned about...
Demographic
The economic impact ofcoronavirus including theeffect on the stock market
and increasedunemployment
The public health impactof coronavirus includingthe spread of the diseasewhich would cause more
deathsDon’t know / No
opinion Total N
Registered Voters 43% (850) 48% (947) 10% (192) 1990Biden Job Strongly Approve 21% (116) 73% (402) 5% (30) 548Biden Job Somewhat Approve 31% (152) 62% (305) 7% (32) 489Biden Job Somewhat Disapprove 54% (121) 35% (79) 11% (24) 223Biden Job Strongly Disapprove 68% (431) 21% (135) 11% (68) 634Favorable of Biden 25% (265) 68% (714) 7% (69) 1048Unfavorable of Biden 65% (557) 24% (204) 11% (94) 855Very Favorable of Biden 21% (125) 74% (437) 5% (32) 593Somewhat Favorable of Biden 31% (140) 61% (278) 8% (37) 455Somewhat Unfavorable of Biden 55% (104) 35% (67) 10% (19) 190Very Unfavorable of Biden 68% (452) 21% (137) 11% (75) 664#1 Issue: Economy 54% (413) 37% (282) 9% (68) 763#1 Issue: Security 55% (193) 33% (116) 12% (41) 349#1 Issue: Health Care 27% (64) 66% (155) 6% (15) 233#1 Issue: Medicare / Social Security 28% (72) 65% (171) 7% (18) 261#1 Issue: Women’s Issues 23% (23) 57% (59) 20% (21) 103#1 Issue: Education 31% (26) 59% (51) 10% (9) 86#1 Issue: Energy 27% (23) 55% (47) 18% (16) 86#1 Issue: Other 33% (36) 62% (67) 6% (6) 1092020 Vote: Joe Biden 25% (221) 70% (625) 6% (51) 8972020 Vote: Donald Trump 65% (533) 25% (205) 10% (80) 8182020 Vote: Didn’t Vote 33% (78) 43% (104) 24% (57) 2392018 House Vote: Democrat 25% (169) 71% (486) 5% (31) 6872018 House Vote: Republican 64% (441) 27% (189) 9% (60) 6902018 House Vote: Someone else 48% (24) 37% (19) 15% (8) 502016 Vote: Hillary Clinton 24% (149) 71% (451) 5% (32) 6312016 Vote: Donald Trump 62% (480) 28% (214) 10% (74) 7682016 Vote: Other 37% (40) 52% (56) 10% (11) 1072016 Vote: Didn’t Vote 38% (182) 47% (226) 16% (76) 483
Continued on next page
Page 158
158
Morning ConsultTable POL4
Table POL4: Generally speaking, would you say you are more concerned about...
Demographic
The economic impact ofcoronavirus including theeffect on the stock market
and increasedunemployment
The public health impactof coronavirus includingthe spread of the diseasewhich would cause more
deathsDon’t know / No
opinion Total N
Registered Voters 43% (850) 48% (947) 10% (192) 1990Voted in 2014: Yes 44% (566) 49% (635) 7% (96) 1297Voted in 2014: No 41% (284) 45% (313) 14% (96) 6934-Region: Northeast 34% (116) 57% (197) 9% (31) 3444-Region: Midwest 47% (215) 45% (204) 8% (37) 4554-Region: South 44% (329) 45% (339) 11% (87) 7554-Region: West 44% (190) 48% (207) 9% (38) 435Party: Democrat/Leans Democrat 24% (215) 70% (620) 6% (53) 888Party: Republican/Leans Republican 64% (523) 25% (207) 10% (83) 814Note: Row proportions may total to larger than one-hundred percent due to rounding. For more information visit MorningConsultIntelligence.com.
Page 159
National Tracking Poll #210636, June, 2021
159
Table POL5
Table POL5: Currently, do you believe it’s more important for the government to address the:
DemographicThe spread ofcoronavirus The economy
Don’t know / Noopinion Total N
Registered Voters 40% (797) 53% (1052) 7% (141) 1990Gender: Male 41% (384) 54% (496) 5% (47) 927Gender: Female 39% (414) 52% (556) 9% (93) 1063Age: 18-34 42% (190) 47% (215) 11% (51) 456Age: 35-44 38% (113) 55% (166) 7% (22) 300Age: 45-64 35% (259) 58% (424) 6% (47) 730Age: 65+ 47% (236) 49% (247) 4% (21) 504GenZers: 1997-2012 42% (72) 40% (68) 18% (30) 169Millennials: 1981-1996 40% (191) 53% (253) 7% (36) 480GenXers: 1965-1980 35% (186) 58% (303) 7% (36) 525Baby Boomers: 1946-1964 43% (317) 53% (394) 5% (34) 746PID: Dem (no lean) 63% (471) 33% (247) 4% (33) 752PID: Ind (no lean) 37% (212) 52% (300) 11% (66) 578PID: Rep (no lean) 17% (114) 76% (505) 6% (41) 661PID/Gender: DemMen 62% (222) 34% (121) 4% (16) 359PID/Gender: DemWomen 63% (249) 32% (126) 5% (18) 393PID/Gender: Ind Men 37% (99) 56% (149) 7% (19) 267PID/Gender: Ind Women 36% (113) 49% (151) 15% (47) 311PID/Gender: Rep Men 21% (62) 75% (227) 4% (12) 301PID/Gender: Rep Women 15% (52) 78% (279) 8% (29) 360Ideo: Liberal (1-3) 64% (375) 31% (185) 5% (28) 587Ideo: Moderate (4) 45% (242) 47% (254) 8% (43) 539Ideo: Conservative (5-7) 20% (147) 75% (558) 5% (37) 742Educ: < College 37% (452) 54% (654) 9% (106) 1213Educ: Bachelors degree 45% (221) 51% (248) 4% (19) 489Educ: Post-grad 43% (124) 52% (149) 5% (15) 288Income: Under 50k 42% (413) 49% (485) 9% (93) 991Income: 50k-100k 39% (252) 56% (356) 5% (31) 640Income: 100k+ 37% (132) 59% (210) 5% (16) 359Ethnicity: White 37% (594) 56% (884) 7% (106) 1584Ethnicity: Hispanic 42% (82) 50% (98) 8% (16) 196Ethnicity: Black 55% (134) 35% (86) 9% (23) 243
Continued on next page
Page 160
160
Morning ConsultTable POL5
Table POL5: Currently, do you believe it’s more important for the government to address the:
DemographicThe spread ofcoronavirus The economy
Don’t know / Noopinion Total N
Registered Voters 40% (797) 53% (1052) 7% (141) 1990Ethnicity: Other 43% (70) 50% (82) 7% (11) 163All Christian 35% (335) 60% (575) 6% (54) 964All Non-Christian 45% (54) 49% (59) 7% (8) 121Atheist 58% (42) 34% (25) 8% (6) 73Agnostic/Nothing in particular 46% (228) 46% (227) 8% (41) 495Something Else 41% (138) 50% (167) 9% (32) 337Religious Non-Protestant/Catholic 42% (58) 51% (72) 7% (10) 140Evangelical 31% (168) 63% (346) 6% (33) 547Non-Evangelical 41% (298) 52% (373) 7% (50) 721Community: Urban 52% (274) 42% (224) 6% (31) 529Community: Suburban 37% (364) 58% (574) 6% (59) 998Community: Rural 34% (160) 55% (254) 11% (50) 464Employ: Private Sector 36% (227) 59% (366) 5% (29) 622Employ: Government 37% (47) 56% (72) 7% (9) 129Employ: Self-Employed 39% (61) 50% (79) 11% (17) 157Employ: Homemaker 30% (38) 61% (77) 9% (12) 127Employ: Retired 45% (260) 51% (294) 5% (27) 581Employ: Unemployed 43% (92) 41% (89) 16% (33) 215Employ: Other 42% (48) 48% (54) 10% (11) 113Military HH: Yes 36% (132) 57% (207) 6% (22) 361Military HH: No 41% (666) 52% (844) 7% (118) 1629RD/WT: Right Direction 61% (577) 33% (308) 6% (56) 941RD/WT: Wrong Track 21% (220) 71% (744) 8% (84) 1049Biden Job Approve 62% (639) 33% (340) 6% (59) 1037Biden Job Disapprove 16% (135) 78% (668) 6% (54) 857Biden Job Strongly Approve 68% (374) 26% (143) 6% (32) 548Biden Job Somewhat Approve 54% (265) 40% (197) 6% (27) 489Biden Job Somewhat Disapprove 27% (60) 66% (147) 8% (17) 223Biden Job Strongly Disapprove 12% (76) 82% (521) 6% (37) 634Favorable of Biden 61% (639) 33% (346) 6% (64) 1048Unfavorable of Biden 16% (137) 78% (665) 6% (53) 855
Continued on next page
Page 161
National Tracking Poll #210636, June, 2021
161
Table POL5
Table POL5: Currently, do you believe it’s more important for the government to address the:
DemographicThe spread ofcoronavirus The economy
Don’t know / Noopinion Total N
Registered Voters 40% (797) 53% (1052) 7% (141) 1990Very Favorable of Biden 70% (416) 24% (145) 5% (32) 593Somewhat Favorable of Biden 49% (223) 44% (201) 7% (31) 455Somewhat Unfavorable of Biden 29% (55) 64% (121) 8% (14) 190Very Unfavorable of Biden 12% (82) 82% (543) 6% (39) 664#1 Issue: Economy 28% (212) 65% (498) 7% (53) 763#1 Issue: Security 27% (95) 67% (233) 6% (22) 349#1 Issue: Health Care 61% (142) 32% (75) 7% (15) 233#1 Issue: Medicare / Social Security 55% (143) 40% (104) 5% (14) 261#1 Issue: Women’s Issues 55% (57) 26% (27) 19% (20) 103#1 Issue: Education 55% (47) 35% (30) 10% (9) 86#1 Issue: Energy 51% (44) 43% (37) 5% (5) 86#1 Issue: Other 52% (57) 44% (48) 4% (4) 1092020 Vote: Joe Biden 63% (568) 31% (282) 5% (47) 8972020 Vote: Donald Trump 17% (142) 77% (633) 5% (43) 8182020 Vote: Didn’t Vote 32% (77) 48% (115) 19% (46) 2392018 House Vote: Democrat 63% (432) 33% (225) 4% (30) 6872018 House Vote: Republican 18% (123) 78% (537) 4% (29) 6902018 House Vote: Someone else 36% (18) 53% (26) 12% (6) 502016 Vote: Hillary Clinton 63% (396) 32% (204) 5% (31) 6312016 Vote: Donald Trump 19% (147) 76% (584) 5% (36) 7682016 Vote: Other 42% (45) 50% (54) 8% (8) 1072016 Vote: Didn’t Vote 43% (208) 43% (210) 13% (65) 483Voted in 2014: Yes 40% (517) 55% (719) 5% (61) 1297Voted in 2014: No 41% (281) 48% (333) 11% (79) 6934-Region: Northeast 48% (164) 45% (153) 8% (27) 3444-Region: Midwest 37% (169) 58% (263) 5% (23) 4554-Region: South 37% (277) 54% (411) 9% (67) 7554-Region: West 43% (187) 52% (225) 6% (24) 435Party: Democrat/Leans Democrat 61% (546) 33% (297) 5% (45) 888Party: Republican/Leans Republican 18% (148) 76% (617) 6% (49) 814Note: Row proportions may total to larger than one-hundred percent due to rounding. For more information visit MorningConsultIntelligence.com.
Page 162
162
Morning ConsultTable POL6
Table POL6: Even if neither is exactly correct, which of the following comes closest to your opinion?
Demographic
Unvaccinated Americansshould continue to socialdistance for as long as isneeded to curb the spreadof coronavirus even if itmeans continued damage
to the economy
Unvaccinated Americansshould stop social
distancing to stimulatethe economy even if itmeans increasing thespread of coronavirus
Don’t know / Noopinion Total N
Registered Voters 65% (1295) 21% (422) 14% (273) 1990Gender: Male 64% (596) 23% (217) 12% (114) 927Gender: Female 66% (698) 19% (205) 15% (159) 1063Age: 18-34 61% (277) 22% (99) 18% (80) 456Age: 35-44 60% (181) 25% (74) 15% (45) 300Age: 45-64 63% (461) 23% (168) 14% (101) 730Age: 65+ 74% (375) 16% (82) 9% (46) 504GenZers: 1997-2012 53% (90) 18% (31) 29% (48) 169Millennials: 1981-1996 63% (304) 25% (118) 12% (57) 480GenXers: 1965-1980 61% (319) 23% (122) 16% (84) 525Baby Boomers: 1946-1964 71% (528) 19% (144) 10% (74) 746PID: Dem (no lean) 84% (633) 8% (58) 8% (60) 752PID: Ind (no lean) 61% (351) 21% (119) 19% (108) 578PID: Rep (no lean) 47% (310) 37% (245) 16% (105) 661PID/Gender: DemMen 82% (293) 11% (40) 7% (26) 359PID/Gender: DemWomen 87% (340) 5% (18) 9% (34) 393PID/Gender: Ind Men 59% (157) 25% (66) 16% (44) 267PID/Gender: Ind Women 63% (194) 17% (52) 21% (64) 311PID/Gender: Rep Men 49% (146) 37% (111) 15% (44) 301PID/Gender: Rep Women 45% (164) 37% (135) 17% (61) 360Ideo: Liberal (1-3) 85% (499) 8% (46) 7% (42) 587Ideo: Moderate (4) 73% (392) 13% (71) 14% (76) 539Ideo: Conservative (5-7) 47% (351) 39% (289) 14% (102) 742Educ: < College 62% (749) 21% (252) 17% (211) 1213Educ: Bachelors degree 69% (337) 22% (109) 9% (43) 489Educ: Post-grad 72% (209) 21% (61) 6% (19) 288
Continued on next page
Page 163
National Tracking Poll #210636, June, 2021
163
Table POL6
Table POL6: Even if neither is exactly correct, which of the following comes closest to your opinion?
Demographic
Unvaccinated Americansshould continue to socialdistance for as long as isneeded to curb the spreadof coronavirus even if itmeans continued damage
to the economy
Unvaccinated Americansshould stop social
distancing to stimulatethe economy even if itmeans increasing thespread of coronavirus
Don’t know / Noopinion Total N
Registered Voters 65% (1295) 21% (422) 14% (273) 1990Income: Under 50k 65% (648) 19% (190) 15% (153) 991Income: 50k-100k 64% (412) 22% (144) 13% (84) 640Income: 100k+ 65% (234) 25% (88) 10% (36) 359Ethnicity: White 64% (1008) 24% (374) 13% (203) 1584Ethnicity: Hispanic 69% (134) 16% (32) 15% (30) 196Ethnicity: Black 71% (171) 8% (20) 21% (51) 243Ethnicity: Other 71% (116) 18% (29) 12% (19) 163All Christian 62% (602) 26% (247) 12% (115) 964All Non-Christian 72% (88) 16% (19) 12% (14) 121Atheist 75% (55) 12% (8) 13% (10) 73Agnostic/Nothing in particular 69% (340) 17% (86) 14% (70) 495Something Else 62% (210) 18% (62) 19% (65) 337Religious Non-Protestant/Catholic 69% (97) 19% (27) 12% (17) 140Evangelical 52% (284) 33% (181) 15% (82) 547Non-Evangelical 71% (511) 16% (118) 13% (92) 721Community: Urban 71% (376) 17% (92) 11% (61) 529Community: Suburban 65% (645) 22% (218) 14% (135) 998Community: Rural 59% (273) 24% (113) 17% (77) 464Employ: Private Sector 63% (392) 25% (158) 12% (72) 622Employ: Government 59% (75) 32% (41) 9% (12) 129Employ: Self-Employed 61% (96) 26% (42) 12% (19) 157Employ: Homemaker 56% (71) 28% (35) 16% (20) 127Employ: Retired 73% (424) 17% (96) 10% (61) 581Employ: Unemployed 66% (142) 11% (23) 23% (50) 215Employ: Other 60% (67) 14% (16) 26% (30) 113
Continued on next page
Page 164
164
Morning ConsultTable POL6
Table POL6: Even if neither is exactly correct, which of the following comes closest to your opinion?
Demographic
Unvaccinated Americansshould continue to socialdistance for as long as isneeded to curb the spreadof coronavirus even if itmeans continued damage
to the economy
Unvaccinated Americansshould stop social
distancing to stimulatethe economy even if itmeans increasing thespread of coronavirus
Don’t know / Noopinion Total N
Registered Voters 65% (1295) 21% (422) 14% (273) 1990Military HH: Yes 62% (225) 24% (85) 14% (51) 361Military HH: No 66% (1070) 21% (337) 14% (222) 1629RD/WT: Right Direction 84% (787) 7% (67) 9% (88) 941RD/WT: Wrong Track 48% (508) 34% (355) 18% (185) 1049Biden Job Approve 85% (883) 7% (71) 8% (84) 1037Biden Job Disapprove 43% (371) 40% (343) 17% (143) 857Biden Job Strongly Approve 88% (484) 6% (34) 6% (30) 548Biden Job Somewhat Approve 82% (399) 8% (37) 11% (53) 489Biden Job Somewhat Disapprove 61% (135) 26% (58) 13% (30) 223Biden Job Strongly Disapprove 37% (236) 45% (285) 18% (113) 634Favorable of Biden 85% (890) 7% (72) 8% (86) 1048Unfavorable of Biden 42% (361) 40% (340) 18% (154) 855Very Favorable of Biden 87% (518) 6% (36) 7% (39) 593Somewhat Favorable of Biden 82% (372) 8% (35) 10% (47) 455Somewhat Unfavorable of Biden 58% (110) 26% (49) 16% (31) 190Very Unfavorable of Biden 38% (251) 44% (291) 18% (123) 664#1 Issue: Economy 59% (452) 25% (190) 16% (121) 763#1 Issue: Security 47% (165) 33% (116) 20% (68) 349#1 Issue: Health Care 81% (188) 13% (31) 6% (14) 233#1 Issue: Medicare / Social Security 83% (216) 11% (29) 6% (16) 261#1 Issue: Women’s Issues 70% (72) 11% (12) 18% (19) 103#1 Issue: Education 72% (61) 13% (11) 16% (13) 86#1 Issue: Energy 76% (65) 12% (10) 12% (10) 86#1 Issue: Other 69% (75) 21% (23) 10% (11) 109
Continued on next page
Page 165
National Tracking Poll #210636, June, 2021
165
Table POL6
Table POL6: Even if neither is exactly correct, which of the following comes closest to your opinion?
Demographic
Unvaccinated Americansshould continue to socialdistance for as long as isneeded to curb the spreadof coronavirus even if itmeans continued damage
to the economy
Unvaccinated Americansshould stop social
distancing to stimulatethe economy even if itmeans increasing thespread of coronavirus
Don’t know / Noopinion Total N
Registered Voters 65% (1295) 21% (422) 14% (273) 19902020 Vote: Joe Biden 86% (774) 7% (59) 7% (64) 8972020 Vote: Donald Trump 44% (360) 39% (323) 17% (135) 8182020 Vote: Didn’t Vote 58% (139) 13% (30) 29% (70) 2392018 House Vote: Democrat 88% (603) 7% (48) 5% (36) 6872018 House Vote: Republican 47% (321) 39% (271) 14% (98) 6902018 House Vote: Someone else 57% (29) 8% (4) 34% (17) 502016 Vote: Hillary Clinton 87% (552) 7% (42) 6% (37) 6312016 Vote: Donald Trump 48% (367) 38% (288) 15% (112) 7682016 Vote: Other 73% (78) 16% (17) 11% (12) 1072016 Vote: Didn’t Vote 62% (298) 15% (74) 23% (111) 483Voted in 2014: Yes 67% (876) 22% (291) 10% (131) 1297Voted in 2014: No 61% (419) 19% (132) 20% (142) 6934-Region: Northeast 70% (242) 18% (60) 12% (42) 3444-Region: Midwest 65% (298) 21% (98) 13% (60) 4554-Region: South 62% (470) 23% (171) 15% (115) 7554-Region: West 65% (285) 22% (94) 13% (57) 435Party: Democrat/Leans Democrat 85% (757) 7% (66) 7% (65) 888Party: Republican/Leans Republican 45% (368) 38% (306) 17% (140) 814Note: Row proportions may total to larger than one-hundred percent due to rounding. For more information visit MorningConsultIntelligence.com.
Page 166
166
Morning ConsultTable POL7
Table POL7: Have you received at least one dose of a COVID-19 vaccine?Demographic Yes No Total N
Registered Voters 63% (1245) 37% (745) 1990Gender: Male 65% (601) 35% (326) 927Gender: Female 61% (644) 39% (419) 1063Age: 18-34 50% (226) 50% (230) 456Age: 35-44 51% (152) 49% (148) 300Age: 45-64 61% (447) 39% (283) 730Age: 65+ 83% (419) 17% (84) 504GenZers: 1997-2012 45% (76) 55% (93) 169Millennials: 1981-1996 52% (249) 48% (231) 480GenXers: 1965-1980 57% (298) 43% (227) 525Baby Boomers: 1946-1964 75% (556) 25% (190) 746PID: Dem (no lean) 72% (541) 28% (211) 752PID: Ind (no lean) 57% (329) 43% (249) 578PID: Rep (no lean) 57% (375) 43% (285) 661PID/Gender: DemMen 72% (257) 28% (102) 359PID/Gender: DemWomen 72% (284) 28% (109) 393PID/Gender: Ind Men 59% (158) 41% (109) 267PID/Gender: Ind Women 55% (171) 45% (140) 311PID/Gender: Rep Men 62% (186) 38% (115) 301PID/Gender: Rep Women 53% (189) 47% (170) 360Ideo: Liberal (1-3) 74% (433) 26% (155) 587Ideo: Moderate (4) 64% (343) 36% (196) 539Ideo: Conservative (5-7) 56% (419) 44% (323) 742Educ: < College 55% (662) 45% (551) 1213Educ: Bachelors degree 73% (357) 27% (132) 489Educ: Post-grad 78% (226) 22% (62) 288Income: Under 50k 55% (544) 45% (447) 991Income: 50k-100k 70% (447) 30% (193) 640Income: 100k+ 71% (254) 29% (105) 359Ethnicity: White 65% (1033) 35% (551) 1584Ethnicity: Hispanic 61% (119) 39% (77) 196Ethnicity: Black 44% (106) 56% (137) 243Ethnicity: Other 65% (106) 35% (57) 163
Continued on next page
Page 167
National Tracking Poll #210636, June, 2021
167
Table POL7
Table POL7: Have you received at least one dose of a COVID-19 vaccine?Demographic Yes No Total N
Registered Voters 63% (1245) 37% (745) 1990All Christian 67% (645) 33% (319) 964All Non-Christian 79% (96) 21% (25) 121Atheist 79% (58) 21% (15) 73Agnostic/Nothing in particular 56% (276) 44% (219) 495Something Else 50% (170) 50% (167) 337Religious Non-Protestant/Catholic 76% (107) 24% (33) 140Evangelical 52% (284) 48% (263) 547Non-Evangelical 71% (512) 29% (209) 721Community: Urban 61% (322) 39% (207) 529Community: Suburban 67% (667) 33% (330) 998Community: Rural 55% (256) 45% (208) 464Employ: Private Sector 60% (371) 40% (250) 622Employ: Government 64% (83) 36% (46) 129Employ: Self-Employed 54% (84) 46% (73) 157Employ: Homemaker 44% (56) 56% (71) 127Employ: Retired 79% (457) 21% (125) 581Employ: Unemployed 51% (110) 49% (105) 215Employ: Other 47% (53) 53% (60) 113Military HH: Yes 73% (264) 27% (97) 361Military HH: No 60% (981) 40% (648) 1629RD/WT: Right Direction 74% (692) 26% (249) 941RD/WT: Wrong Track 53% (553) 47% (495) 1049Biden Job Approve 73% (754) 27% (283) 1037Biden Job Disapprove 53% (456) 47% (402) 857Biden Job Strongly Approve 79% (435) 21% (113) 548Biden Job Somewhat Approve 65% (319) 35% (170) 489Biden Job Somewhat Disapprove 60% (135) 40% (88) 223Biden Job Strongly Disapprove 51% (321) 49% (313) 634Favorable of Biden 72% (756) 28% (293) 1048Unfavorable of Biden 52% (442) 48% (412) 855
Continued on next page
Page 168
168
Morning ConsultTable POL7
Table POL7: Have you received at least one dose of a COVID-19 vaccine?Demographic Yes No Total N
Registered Voters 63% (1245) 37% (745) 1990Very Favorable of Biden 79% (471) 21% (122) 593Somewhat Favorable of Biden 63% (285) 37% (170) 455Somewhat Unfavorable of Biden 63% (120) 37% (70) 190Very Unfavorable of Biden 48% (322) 52% (342) 664#1 Issue: Economy 57% (431) 43% (332) 763#1 Issue: Security 62% (217) 38% (132) 349#1 Issue: Health Care 68% (160) 32% (73) 233#1 Issue: Medicare / Social Security 74% (193) 26% (67) 261#1 Issue: Women’s Issues 59% (61) 41% (42) 103#1 Issue: Education 62% (53) 38% (32) 86#1 Issue: Energy 67% (58) 33% (28) 86#1 Issue: Other 66% (72) 34% (37) 1092020 Vote: Joe Biden 77% (687) 23% (210) 8972020 Vote: Donald Trump 55% (451) 45% (367) 8182020 Vote: Didn’t Vote 36% (86) 64% (153) 2392018 House Vote: Democrat 76% (525) 24% (162) 6872018 House Vote: Republican 58% (403) 42% (287) 6902018 House Vote: Someone else 68% (34) 32% (16) 502016 Vote: Hillary Clinton 77% (487) 23% (144) 6312016 Vote: Donald Trump 58% (444) 42% (324) 7682016 Vote: Other 62% (67) 38% (41) 1072016 Vote: Didn’t Vote 51% (247) 49% (237) 483Voted in 2014: Yes 68% (883) 32% (414) 1297Voted in 2014: No 52% (362) 48% (330) 6934-Region: Northeast 72% (249) 28% (95) 3444-Region: Midwest 59% (268) 41% (187) 4554-Region: South 58% (437) 42% (318) 7554-Region: West 67% (291) 33% (144) 435Party: Democrat/Leans Democrat 72% (641) 28% (247) 888Party: Republican/Leans Republican 55% (451) 45% (363) 814Note: Row proportions may total to larger than one-hundred percent due to rounding. For more information visit MorningConsultIntelligence.com.
Page 169
National Tracking Poll #210636, June, 2021
169
Table POL8_1
Table POL8_1: How desirable are the following incentives in exchange for receiving a COVID-19 vaccine, if at all?Being entered into a lottery to win...Cash
Demographic Very desirableSomewhatdesirable Not very desirable Not desirable at all Total N
Registered Voters 40% (295) 17% (129) 7% (52) 36% (268) 745Gender: Male 42% (137) 20% (64) 7% (22) 32% (103) 326Gender: Female 38% (159) 16% (65) 7% (30) 39% (165) 419Age: 18-34 48% (110) 18% (41) 10% (23) 24% (55) 230Age: 35-44 41% (61) 17% (26) 7% (11) 34% (50) 148Age: 45-64 36% (102) 17% (48) 5% (15) 42% (118) 283Age: 65+ 26% (22) 17% (14) 5% (4) 53% (45) 84GenZers: 1997-2012 43% (40) 19% (18) 18% (17) 20% (18) 93Millennials: 1981-1996 48% (110) 18% (41) 6% (13) 29% (66) 231GenXers: 1965-1980 40% (92) 17% (39) 6% (13) 37% (84) 227Baby Boomers: 1946-1964 27% (52) 17% (32) 5% (9) 51% (97) 190PID: Dem (no lean) 58% (122) 18% (39) 5% (10) 19% (40) 211PID: Ind (no lean) 37% (93) 19% (48) 9% (22) 34% (85) 249PID: Rep (no lean) 28% (81) 15% (42) 7% (20) 50% (143) 285PID/Gender: DemMen 60% (61) 23% (23) 4% (4) 13% (13) 102PID/Gender: DemWomen 55% (60) 15% (16) 5% (6) 25% (27) 109PID/Gender: Ind Men 40% (44) 19% (21) 8% (9) 33% (36) 109PID/Gender: Ind Women 35% (49) 19% (27) 10% (14) 35% (50) 140PID/Gender: Rep Men 27% (32) 17% (20) 8% (9) 48% (55) 115PID/Gender: Rep Women 29% (49) 13% (22) 6% (11) 52% (88) 170Ideo: Liberal (1-3) 59% (91) 17% (26) 7% (11) 17% (27) 155Ideo: Moderate (4) 45% (87) 20% (38) 7% (14) 28% (56) 196Ideo: Conservative (5-7) 25% (81) 16% (52) 6% (20) 52% (169) 323Educ: < College 43% (237) 16% (91) 7% (40) 33% (184) 551Educ: Bachelors degree 32% (42) 18% (23) 6% (7) 45% (60) 132Educ: Post-grad 27% (17) 24% (15) 8% (5) 40% (25) 62Income: Under 50k 43% (193) 16% (73) 7% (31) 33% (149) 447Income: 50k-100k 38% (74) 17% (32) 7% (14) 38% (73) 193Income: 100k+ 27% (28) 22% (23) 7% (8) 44% (46) 105Ethnicity: White 34% (189) 18% (101) 7% (41) 40% (220) 551Ethnicity: Hispanic 56% (43) 17% (13) 4% (3) 22% (17) 77
Continued on next page
Page 170
170
Morning ConsultTable POL8_1
Table POL8_1: How desirable are the following incentives in exchange for receiving a COVID-19 vaccine, if at all?Being entered into a lottery to win...Cash
Demographic Very desirableSomewhatdesirable Not very desirable Not desirable at all Total N
Registered Voters 40% (295) 17% (129) 7% (52) 36% (268) 745Ethnicity: Black 56% (76) 13% (18) 6% (8) 26% (35) 137Ethnicity: Other 53% (31) 18% (11) 7% (4) 22% (13) 57All Christian 33% (104) 17% (54) 6% (20) 44% (141) 319Agnostic/Nothing in particular 53% (116) 16% (36) 8% (18) 23% (50) 219Something Else 37% (62) 17% (28) 7% (12) 39% (64) 167Evangelical 35% (93) 13% (34) 5% (12) 47% (124) 263Non-Evangelical 33% (69) 21% (44) 7% (15) 38% (80) 209Community: Urban 55% (113) 17% (34) 8% (16) 21% (43) 207Community: Suburban 31% (104) 18% (60) 8% (25) 43% (141) 330Community: Rural 38% (79) 17% (35) 5% (11) 40% (84) 208Employ: Private Sector 39% (97) 17% (44) 9% (23) 35% (87) 250Employ: Self-Employed 43% (32) 23% (17) 4% (3) 29% (21) 73Employ: Homemaker 37% (26) 10% (7) 9% (6) 45% (32) 71Employ: Retired 26% (33) 20% (25) 7% (8) 47% (58) 125Employ: Unemployed 49% (52) 15% (16) 5% (5) 31% (32) 105Employ: Other 56% (34) 13% (8) 6% (3) 25% (15) 60Military HH: Yes 32% (31) 24% (24) 2% (2) 41% (40) 97Military HH: No 41% (264) 16% (105) 8% (50) 35% (228) 648RD/WT: Right Direction 58% (144) 19% (48) 5% (12) 18% (45) 249RD/WT: Wrong Track 31% (151) 16% (81) 8% (40) 45% (223) 495Biden Job Approve 56% (158) 20% (57) 6% (17) 18% (51) 283Biden Job Disapprove 28% (114) 16% (64) 7% (28) 49% (195) 402Biden Job Strongly Approve 61% (69) 20% (23) 2% (2) 17% (19) 113Biden Job Somewhat Approve 52% (89) 20% (34) 9% (15) 19% (32) 170Biden Job Somewhat Disapprove 41% (36) 18% (16) 9% (8) 32% (28) 88Biden Job Strongly Disapprove 25% (77) 15% (48) 7% (21) 53% (167) 313Favorable of Biden 59% (171) 19% (56) 5% (13) 18% (52) 293Unfavorable of Biden 27% (110) 15% (64) 8% (34) 50% (205) 412
Continued on next page
Page 171
National Tracking Poll #210636, June, 2021
171
Table POL8_1
Table POL8_1: How desirable are the following incentives in exchange for receiving a COVID-19 vaccine, if at all?Being entered into a lottery to win...Cash
Demographic Very desirableSomewhatdesirable Not very desirable Not desirable at all Total N
Registered Voters 40% (295) 17% (129) 7% (52) 36% (268) 745Very Favorable of Biden 61% (75) 19% (23) 2% (2) 19% (23) 122Somewhat Favorable of Biden 57% (97) 20% (34) 6% (11) 17% (29) 170Somewhat Unfavorable of Biden 36% (25) 18% (13) 6% (4) 39% (27) 70Very Unfavorable of Biden 25% (85) 15% (51) 9% (29) 52% (178) 342#1 Issue: Economy 37% (123) 17% (56) 10% (33) 36% (120) 332#1 Issue: Security 28% (37) 16% (21) 2% (2) 54% (72) 132#1 Issue: Health Care 63% (46) 17% (12) 1% (1) 19% (14) 73#1 Issue: Medicare / Social Security 38% (25) 24% (16) 7% (5) 31% (21) 672020 Vote: Joe Biden 56% (118) 21% (43) 5% (11) 18% (38) 2102020 Vote: Donald Trump 28% (102) 15% (57) 7% (25) 50% (184) 3672020 Vote: Didn’t Vote 47% (72) 15% (23) 10% (15) 28% (43) 1532018 House Vote: Democrat 57% (93) 20% (33) 2% (3) 20% (33) 1622018 House Vote: Republican 25% (72) 16% (46) 7% (19) 52% (150) 2872016 Vote: Hillary Clinton 55% (79) 19% (28) 4% (6) 22% (31) 1442016 Vote: Donald Trump 27% (86) 16% (52) 7% (22) 50% (163) 3242016 Vote: Didn’t Vote 47% (111) 19% (45) 9% (20) 25% (59) 237Voted in 2014: Yes 37% (155) 16% (68) 6% (24) 41% (168) 414Voted in 2014: No 43% (141) 19% (61) 9% (28) 30% (100) 3304-Region: Northeast 45% (43) 18% (17) 5% (5) 32% (30) 954-Region: Midwest 37% (70) 16% (30) 6% (12) 41% (76) 1874-Region: South 42% (132) 15% (48) 7% (23) 36% (115) 3184-Region: West 35% (50) 23% (34) 9% (13) 33% (47) 144Party: Democrat/Leans Democrat 58% (143) 20% (49) 4% (11) 18% (44) 247Party: Republican/Leans Republican 29% (105) 15% (54) 8% (28) 48% (175) 363Note: Row proportions may total to larger than one-hundred percent due to rounding. For more information visit MorningConsultIntelligence.com.
Page 172
172
Morning ConsultTable POL8_2
Table POL8_2: How desirable are the following incentives in exchange for receiving a COVID-19 vaccine, if at all?Being entered into a lottery to win...A truck
Demographic Very desirableSomewhatdesirable Not very desirable Not desirable at all Total N
Registered Voters 23% (171) 21% (160) 13% (97) 43% (317) 745Gender: Male 27% (87) 24% (78) 13% (44) 36% (117) 326Gender: Female 20% (84) 20% (82) 13% (53) 48% (200) 419Age: 18-34 28% (63) 24% (56) 16% (38) 32% (73) 230Age: 35-44 24% (35) 23% (34) 15% (22) 38% (56) 148Age: 45-64 22% (62) 20% (56) 10% (29) 48% (136) 283Age: 65+ 12% (10) 17% (15) 9% (8) 61% (52) 84GenZers: 1997-2012 19% (18) 27% (25) 23% (21) 31% (29) 93Millennials: 1981-1996 30% (70) 22% (51) 14% (31) 34% (78) 231GenXers: 1965-1980 25% (56) 23% (52) 10% (24) 42% (95) 227Baby Boomers: 1946-1964 14% (26) 16% (31) 11% (21) 59% (112) 190PID: Dem (no lean) 30% (64) 29% (60) 10% (20) 31% (66) 211PID: Ind (no lean) 20% (51) 23% (57) 15% (38) 41% (103) 249PID: Rep (no lean) 20% (57) 15% (43) 13% (38) 52% (147) 285PID/Gender: DemMen 38% (38) 28% (29) 11% (11) 24% (24) 102PID/Gender: DemWomen 23% (25) 29% (32) 9% (10) 39% (42) 109PID/Gender: Ind Men 22% (24) 26% (28) 17% (19) 35% (38) 109PID/Gender: Ind Women 19% (27) 21% (29) 14% (19) 47% (65) 140PID/Gender: Rep Men 22% (25) 18% (21) 12% (14) 48% (55) 115PID/Gender: Rep Women 19% (32) 13% (21) 14% (24) 54% (93) 170Ideo: Liberal (1-3) 32% (49) 24% (38) 17% (26) 27% (42) 155Ideo: Moderate (4) 23% (45) 28% (55) 13% (25) 36% (71) 196Ideo: Conservative (5-7) 19% (60) 15% (49) 12% (38) 54% (176) 323Educ: < College 25% (138) 23% (124) 13% (71) 39% (217) 551Educ: Bachelors degree 14% (19) 19% (26) 13% (17) 53% (70) 132Educ: Post-grad 23% (14) 16% (10) 14% (9) 47% (29) 62Income: Under 50k 24% (108) 21% (96) 13% (57) 42% (186) 447Income: 50k-100k 23% (43) 23% (44) 13% (25) 42% (80) 193Income: 100k+ 19% (20) 19% (21) 13% (14) 48% (50) 105Ethnicity: White 22% (120) 19% (106) 13% (69) 47% (257) 551Ethnicity: Hispanic 29% (22) 31% (24) 8% (6) 33% (25) 77
Continued on next page
Page 173
National Tracking Poll #210636, June, 2021
173
Table POL8_2
Table POL8_2: How desirable are the following incentives in exchange for receiving a COVID-19 vaccine, if at all?Being entered into a lottery to win...A truck
Demographic Very desirableSomewhatdesirable Not very desirable Not desirable at all Total N
Registered Voters 23% (171) 21% (160) 13% (97) 43% (317) 745Ethnicity: Black 24% (32) 32% (43) 11% (15) 34% (46) 137Ethnicity: Other 34% (19) 19% (11) 22% (13) 24% (14) 57All Christian 22% (70) 15% (46) 13% (42) 50% (161) 319Agnostic/Nothing in particular 26% (56) 30% (66) 12% (27) 32% (70) 219Something Else 21% (34) 25% (41) 12% (21) 42% (71) 167Evangelical 21% (55) 17% (45) 11% (29) 51% (135) 263Non-Evangelical 21% (44) 19% (39) 14% (30) 46% (96) 209Community: Urban 33% (69) 24% (50) 11% (23) 31% (65) 207Community: Suburban 15% (50) 24% (78) 13% (42) 49% (161) 330Community: Rural 25% (53) 15% (32) 15% (32) 44% (91) 208Employ: Private Sector 24% (61) 18% (46) 17% (42) 41% (102) 250Employ: Self-Employed 26% (19) 31% (23) 7% (5) 36% (26) 73Employ: Homemaker 23% (16) 16% (12) 12% (8) 49% (35) 71Employ: Retired 13% (17) 20% (25) 9% (11) 58% (72) 125Employ: Unemployed 25% (27) 29% (30) 11% (11) 35% (37) 105Employ: Other 34% (21) 22% (13) 17% (10) 27% (16) 60Military HH: Yes 19% (19) 24% (23) 10% (10) 47% (45) 97Military HH: No 24% (153) 21% (137) 13% (87) 42% (272) 648RD/WT: Right Direction 30% (75) 31% (77) 13% (32) 26% (66) 249RD/WT: Wrong Track 19% (96) 17% (83) 13% (65) 51% (251) 495Biden Job Approve 31% (89) 27% (77) 15% (42) 27% (76) 283Biden Job Disapprove 18% (73) 16% (65) 12% (47) 54% (216) 402Biden Job Strongly Approve 39% (45) 23% (26) 10% (12) 27% (31) 113Biden Job Somewhat Approve 26% (44) 30% (51) 18% (30) 27% (45) 170Biden Job Somewhat Disapprove 24% (21) 25% (22) 9% (8) 42% (37) 88Biden Job Strongly Disapprove 17% (52) 14% (43) 12% (39) 57% (179) 313Favorable of Biden 32% (94) 29% (85) 14% (40) 25% (74) 293Unfavorable of Biden 17% (70) 17% (69) 12% (49) 54% (224) 412
Continued on next page
Page 174
174
Morning ConsultTable POL8_2
Table POL8_2: How desirable are the following incentives in exchange for receiving a COVID-19 vaccine, if at all?Being entered into a lottery to win...A truck
Demographic Very desirableSomewhatdesirable Not very desirable Not desirable at all Total N
Registered Voters 23% (171) 21% (160) 13% (97) 43% (317) 745Very Favorable of Biden 40% (49) 26% (31) 9% (11) 26% (32) 122Somewhat Favorable of Biden 26% (45) 31% (54) 17% (30) 25% (42) 170Somewhat Unfavorable of Biden 20% (14) 25% (18) 11% (8) 44% (31) 70Very Unfavorable of Biden 16% (56) 15% (51) 12% (41) 56% (193) 342#1 Issue: Economy 24% (81) 18% (59) 14% (48) 43% (144) 332#1 Issue: Security 20% (26) 15% (20) 8% (10) 57% (75) 132#1 Issue: Health Care 29% (21) 34% (25) 11% (8) 26% (19) 73#1 Issue: Medicare / Social Security 18% (12) 22% (15) 14% (9) 46% (31) 672020 Vote: Joe Biden 29% (60) 29% (61) 14% (29) 28% (59) 2102020 Vote: Donald Trump 18% (67) 15% (55) 13% (47) 54% (199) 3672020 Vote: Didn’t Vote 28% (43) 25% (38) 12% (19) 35% (53) 1532018 House Vote: Democrat 29% (46) 29% (46) 10% (15) 33% (54) 1622018 House Vote: Republican 17% (50) 15% (44) 12% (35) 55% (158) 2872016 Vote: Hillary Clinton 27% (38) 30% (43) 11% (16) 32% (47) 1442016 Vote: Donald Trump 16% (53) 17% (55) 12% (40) 54% (176) 3242016 Vote: Didn’t Vote 30% (70) 23% (55) 15% (35) 32% (76) 237Voted in 2014: Yes 21% (88) 21% (85) 10% (43) 48% (197) 414Voted in 2014: No 25% (83) 23% (75) 16% (53) 36% (119) 3304-Region: Northeast 26% (25) 23% (22) 12% (11) 39% (37) 954-Region: Midwest 25% (46) 22% (42) 9% (18) 44% (82) 1874-Region: South 24% (75) 22% (69) 12% (37) 43% (137) 3184-Region: West 17% (25) 19% (27) 22% (31) 42% (61) 144Party: Democrat/Leans Democrat 31% (77) 28% (70) 11% (26) 30% (74) 247Party: Republican/Leans Republican 20% (71) 15% (56) 14% (50) 51% (186) 363Note: Row proportions may total to larger than one-hundred percent due to rounding. For more information visit MorningConsultIntelligence.com.
Page 175
National Tracking Poll #210636, June, 2021
175
Table POL8_3
Table POL8_3: How desirable are the following incentives in exchange for receiving a COVID-19 vaccine, if at all?Being entered into a lottery to win...A gun
Demographic Very desirableSomewhatdesirable Not very desirable Not desirable at all Total N
Registered Voters 11% (81) 12% (86) 18% (136) 59% (442) 745Gender: Male 15% (49) 17% (54) 18% (60) 50% (162) 326Gender: Female 8% (31) 8% (32) 18% (76) 67% (279) 419Age: 18-34 9% (20) 20% (47) 24% (55) 47% (107) 230Age: 35-44 16% (24) 8% (11) 22% (32) 54% (80) 148Age: 45-64 11% (30) 9% (26) 12% (35) 68% (192) 283Age: 65+ 8% (7) 2% (2) 16% (13) 74% (63) 84GenZers: 1997-2012 6% (6) 24% (23) 30% (28) 39% (37) 93Millennials: 1981-1996 14% (33) 14% (32) 21% (47) 51% (119) 231GenXers: 1965-1980 15% (33) 9% (21) 16% (36) 60% (137) 227Baby Boomers: 1946-1964 5% (9) 6% (10) 13% (24) 77% (146) 190PID: Dem (no lean) 11% (23) 11% (24) 23% (49) 54% (114) 211PID: Ind (no lean) 9% (22) 13% (32) 20% (49) 58% (145) 249PID: Rep (no lean) 12% (35) 11% (30) 13% (37) 64% (182) 285PID/Gender: DemMen 16% (16) 18% (19) 28% (28) 38% (39) 102PID/Gender: DemWomen 7% (7) 5% (5) 19% (21) 69% (75) 109PID/Gender: Ind Men 15% (16) 16% (17) 19% (21) 50% (55) 109PID/Gender: Ind Women 5% (6) 11% (15) 20% (28) 65% (91) 140PID/Gender: Rep Men 15% (17) 16% (18) 10% (11) 59% (68) 115PID/Gender: Rep Women 10% (18) 7% (12) 15% (26) 67% (114) 170Ideo: Liberal (1-3) 14% (22) 13% (21) 21% (33) 51% (79) 155Ideo: Moderate (4) 11% (22) 14% (28) 20% (39) 54% (106) 196Ideo: Conservative (5-7) 9% (28) 9% (29) 15% (50) 67% (216) 323Educ: < College 12% (64) 12% (68) 20% (111) 56% (307) 551Educ: Bachelors degree 9% (13) 8% (10) 11% (15) 71% (94) 132Educ: Post-grad 7% (4) 13% (8) 15% (9) 65% (41) 62Income: Under 50k 12% (54) 11% (51) 18% (83) 58% (259) 447Income: 50k-100k 6% (12) 13% (25) 17% (34) 63% (122) 193Income: 100k+ 14% (15) 9% (10) 19% (20) 58% (61) 105Ethnicity: White 12% (67) 10% (53) 16% (88) 62% (343) 551Ethnicity: Hispanic 7% (5) 13% (10) 20% (15) 61% (47) 77
Continued on next page
Page 176
176
Morning ConsultTable POL8_3
Table POL8_3: How desirable are the following incentives in exchange for receiving a COVID-19 vaccine, if at all?Being entered into a lottery to win...A gun
Demographic Very desirableSomewhatdesirable Not very desirable Not desirable at all Total N
Registered Voters 11% (81) 12% (86) 18% (136) 59% (442) 745Ethnicity: Black 7% (9) 19% (26) 21% (29) 53% (73) 137Ethnicity: Other 8% (5) 13% (7) 33% (19) 46% (27) 57All Christian 10% (31) 7% (23) 17% (55) 66% (210) 319Agnostic/Nothing in particular 10% (23) 16% (35) 22% (49) 51% (112) 219Something Else 12% (21) 13% (22) 14% (24) 60% (100) 167Evangelical 13% (35) 9% (24) 13% (35) 64% (170) 263Non-Evangelical 7% (15) 9% (20) 18% (38) 65% (136) 209Community: Urban 12% (24) 15% (32) 19% (40) 54% (111) 207Community: Suburban 7% (22) 11% (37) 16% (53) 66% (218) 330Community: Rural 17% (35) 8% (18) 21% (43) 54% (113) 208Employ: Private Sector 10% (26) 14% (34) 21% (52) 55% (138) 250Employ: Self-Employed 20% (15) 21% (16) 12% (9) 46% (34) 73Employ: Homemaker 10% (7) 2% (1) 18% (12) 71% (50) 71Employ: Retired 6% (8) 5% (7) 16% (20) 73% (91) 125Employ: Unemployed 9% (9) 11% (12) 20% (21) 59% (62) 105Employ: Other 13% (8) 11% (6) 23% (14) 53% (32) 60Military HH: Yes 9% (9) 14% (14) 16% (16) 61% (59) 97Military HH: No 11% (72) 11% (73) 19% (120) 59% (383) 648RD/WT: Right Direction 10% (26) 14% (35) 22% (54) 54% (134) 249RD/WT: Wrong Track 11% (55) 10% (51) 17% (82) 62% (308) 495Biden Job Approve 10% (30) 14% (41) 24% (68) 51% (146) 283Biden Job Disapprove 12% (50) 9% (38) 14% (55) 64% (259) 402Biden Job Strongly Approve 17% (19) 11% (12) 20% (22) 53% (60) 113Biden Job Somewhat Approve 6% (11) 17% (29) 27% (46) 50% (85) 170Biden Job Somewhat Disapprove 14% (12) 15% (13) 15% (13) 56% (50) 88Biden Job Strongly Disapprove 12% (38) 8% (25) 13% (41) 67% (209) 313Favorable of Biden 10% (30) 13% (37) 23% (68) 54% (158) 293Unfavorable of Biden 12% (49) 11% (46) 14% (56) 64% (262) 412
Continued on next page
Page 177
National Tracking Poll #210636, June, 2021
177
Table POL8_3
Table POL8_3: How desirable are the following incentives in exchange for receiving a COVID-19 vaccine, if at all?Being entered into a lottery to win...A gun
Demographic Very desirableSomewhatdesirable Not very desirable Not desirable at all Total N
Registered Voters 11% (81) 12% (86) 18% (136) 59% (442) 745Very Favorable of Biden 16% (20) 9% (11) 21% (25) 54% (67) 122Somewhat Favorable of Biden 6% (11) 15% (26) 25% (43) 53% (91) 170Somewhat Unfavorable of Biden 6% (5) 23% (16) 13% (9) 58% (41) 70Very Unfavorable of Biden 13% (44) 9% (30) 14% (47) 65% (222) 342#1 Issue: Economy 11% (38) 11% (35) 19% (63) 59% (196) 332#1 Issue: Security 13% (17) 8% (10) 14% (18) 66% (87) 132#1 Issue: Health Care 11% (8) 13% (9) 21% (16) 55% (41) 73#1 Issue: Medicare / Social Security 7% (5) 14% (9) 16% (11) 63% (42) 672020 Vote: Joe Biden 10% (21) 14% (29) 25% (53) 51% (107) 2102020 Vote: Donald Trump 12% (46) 8% (29) 13% (49) 66% (244) 3672020 Vote: Didn’t Vote 9% (13) 16% (25) 20% (31) 55% (85) 1532018 House Vote: Democrat 9% (14) 13% (21) 23% (37) 56% (91) 1622018 House Vote: Republican 10% (29) 9% (26) 13% (36) 69% (197) 2872016 Vote: Hillary Clinton 7% (10) 11% (16) 24% (35) 58% (83) 1442016 Vote: Donald Trump 9% (29) 9% (29) 14% (47) 67% (218) 3242016 Vote: Didn’t Vote 16% (37) 15% (35) 20% (47) 50% (118) 237Voted in 2014: Yes 10% (41) 9% (38) 16% (67) 65% (269) 414Voted in 2014: No 12% (40) 15% (48) 21% (69) 52% (173) 3304-Region: Northeast 12% (11) 17% (16) 16% (15) 56% (53) 954-Region: Midwest 11% (21) 8% (14) 15% (29) 66% (124) 1874-Region: South 11% (36) 13% (41) 18% (57) 58% (184) 3184-Region: West 9% (13) 10% (15) 25% (35) 56% (81) 144Party: Democrat/Leans Democrat 11% (27) 12% (29) 22% (55) 55% (135) 247Party: Republican/Leans Republican 12% (44) 10% (36) 16% (56) 62% (227) 363Note: Row proportions may total to larger than one-hundred percent due to rounding. For more information visit MorningConsultIntelligence.com.
Page 178
178
Morning ConsultTable POL8_4
Table POL8_4: How desirable are the following incentives in exchange for receiving a COVID-19 vaccine, if at all?Being entered into a lottery to win...A scholarship
Demographic Very desirableSomewhatdesirable Not very desirable Not desirable at all Total N
Registered Voters 16% (121) 18% (135) 14% (107) 51% (381) 745Gender: Male 16% (51) 24% (77) 14% (47) 46% (151) 326Gender: Female 17% (70) 14% (59) 14% (60) 55% (230) 419Age: 18-34 27% (61) 24% (56) 15% (35) 34% (77) 230Age: 35-44 21% (30) 22% (32) 13% (20) 44% (65) 148Age: 45-64 9% (25) 14% (39) 13% (37) 64% (182) 283Age: 65+ 5% (4) 9% (8) 19% (16) 67% (57) 84GenZers: 1997-2012 31% (29) 27% (25) 17% (16) 26% (24) 93Millennials: 1981-1996 23% (53) 23% (53) 14% (31) 41% (94) 231GenXers: 1965-1980 13% (29) 17% (38) 14% (31) 57% (129) 227Baby Boomers: 1946-1964 5% (10) 10% (20) 15% (28) 69% (132) 190PID: Dem (no lean) 29% (61) 27% (57) 11% (23) 33% (70) 211PID: Ind (no lean) 15% (38) 20% (50) 16% (41) 48% (120) 249PID: Rep (no lean) 8% (22) 10% (28) 15% (43) 67% (192) 285PID/Gender: DemMen 29% (29) 37% (38) 10% (10) 25% (26) 102PID/Gender: DemWomen 29% (32) 18% (19) 12% (13) 41% (44) 109PID/Gender: Ind Men 15% (16) 24% (26) 21% (22) 41% (44) 109PID/Gender: Ind Women 16% (22) 17% (24) 13% (19) 54% (75) 140PID/Gender: Rep Men 5% (6) 11% (13) 13% (15) 70% (81) 115PID/Gender: Rep Women 9% (16) 9% (15) 16% (28) 65% (111) 170Ideo: Liberal (1-3) 30% (46) 26% (40) 13% (20) 32% (49) 155Ideo: Moderate (4) 18% (34) 19% (38) 17% (34) 46% (90) 196Ideo: Conservative (5-7) 8% (25) 14% (44) 13% (41) 66% (213) 323Educ: < College 18% (97) 18% (98) 15% (83) 50% (273) 551Educ: Bachelors degree 11% (15) 18% (24) 12% (16) 58% (77) 132Educ: Post-grad 16% (10) 21% (13) 13% (8) 50% (31) 62Income: Under 50k 17% (78) 17% (77) 15% (69) 50% (223) 447Income: 50k-100k 16% (32) 20% (38) 13% (25) 51% (98) 193Income: 100k+ 11% (12) 19% (20) 13% (14) 57% (60) 105Ethnicity: White 12% (65) 16% (86) 15% (84) 57% (316) 551Ethnicity: Hispanic 34% (26) 27% (21) 4% (3) 35% (27) 77
Continued on next page
Page 179
National Tracking Poll #210636, June, 2021
179
Table POL8_4
Table POL8_4: How desirable are the following incentives in exchange for receiving a COVID-19 vaccine, if at all?Being entered into a lottery to win...A scholarship
Demographic Very desirableSomewhatdesirable Not very desirable Not desirable at all Total N
Registered Voters 16% (121) 18% (135) 14% (107) 51% (381) 745Ethnicity: Black 28% (39) 25% (34) 10% (14) 36% (50) 137Ethnicity: Other 30% (17) 26% (15) 16% (9) 27% (15) 57All Christian 12% (38) 15% (48) 15% (46) 58% (186) 319Agnostic/Nothing in particular 22% (47) 21% (46) 17% (38) 40% (87) 219Something Else 18% (30) 16% (27) 11% (18) 55% (92) 167Evangelical 15% (40) 12% (31) 12% (31) 61% (162) 263Non-Evangelical 12% (24) 20% (42) 14% (30) 54% (113) 209Community: Urban 25% (52) 25% (52) 14% (29) 35% (73) 207Community: Suburban 13% (42) 18% (59) 11% (37) 58% (192) 330Community: Rural 13% (28) 11% (24) 20% (41) 56% (116) 208Employ: Private Sector 15% (38) 22% (54) 15% (38) 48% (121) 250Employ: Self-Employed 17% (12) 22% (16) 12% (9) 49% (36) 73Employ: Homemaker 16% (11) 7% (5) 14% (10) 63% (44) 71Employ: Retired 7% (9) 7% (9) 17% (21) 69% (86) 125Employ: Unemployed 20% (21) 23% (24) 15% (15) 43% (45) 105Employ: Other 19% (11) 25% (15) 14% (9) 42% (25) 60Military HH: Yes 12% (11) 12% (11) 17% (17) 60% (58) 97Military HH: No 17% (110) 19% (124) 14% (91) 50% (323) 648RD/WT: Right Direction 26% (65) 28% (69) 12% (31) 34% (85) 249RD/WT: Wrong Track 11% (56) 13% (66) 15% (77) 60% (296) 495Biden Job Approve 27% (76) 27% (76) 12% (35) 34% (96) 283Biden Job Disapprove 10% (38) 11% (45) 15% (62) 64% (257) 402Biden Job Strongly Approve 31% (35) 26% (30) 10% (12) 33% (37) 113Biden Job Somewhat Approve 24% (41) 27% (47) 14% (24) 34% (58) 170Biden Job Somewhat Disapprove 15% (13) 15% (13) 19% (17) 51% (45) 88Biden Job Strongly Disapprove 8% (25) 10% (32) 14% (45) 68% (212) 313Favorable of Biden 28% (82) 26% (77) 12% (35) 34% (99) 293Unfavorable of Biden 8% (34) 11% (46) 16% (66) 65% (266) 412
Continued on next page
Page 180
180
Morning ConsultTable POL8_4
Table POL8_4: How desirable are the following incentives in exchange for receiving a COVID-19 vaccine, if at all?Being entered into a lottery to win...A scholarship
Demographic Very desirableSomewhatdesirable Not very desirable Not desirable at all Total N
Registered Voters 16% (121) 18% (135) 14% (107) 51% (381) 745Very Favorable of Biden 35% (43) 20% (24) 13% (16) 32% (39) 122Somewhat Favorable of Biden 23% (39) 31% (53) 11% (19) 35% (59) 170Somewhat Unfavorable of Biden 11% (8) 14% (10) 20% (14) 54% (38) 70Very Unfavorable of Biden 8% (26) 11% (36) 15% (52) 67% (228) 342#1 Issue: Economy 15% (51) 18% (60) 15% (49) 52% (172) 332#1 Issue: Security 6% (8) 12% (16) 16% (21) 66% (87) 132#1 Issue: Health Care 27% (20) 26% (19) 10% (8) 37% (27) 73#1 Issue: Medicare / Social Security 7% (5) 10% (7) 17% (11) 65% (44) 672020 Vote: Joe Biden 28% (59) 28% (58) 11% (24) 33% (68) 2102020 Vote: Donald Trump 8% (29) 11% (40) 15% (53) 67% (245) 3672020 Vote: Didn’t Vote 21% (32) 21% (33) 18% (27) 40% (62) 1532018 House Vote: Democrat 24% (39) 27% (43) 11% (18) 38% (62) 1622018 House Vote: Republican 7% (21) 11% (31) 16% (45) 66% (189) 2872016 Vote: Hillary Clinton 24% (34) 27% (39) 12% (18) 37% (53) 1442016 Vote: Donald Trump 7% (22) 12% (40) 15% (48) 66% (215) 3242016 Vote: Didn’t Vote 25% (60) 20% (47) 14% (34) 40% (95) 237Voted in 2014: Yes 13% (55) 16% (67) 15% (61) 56% (231) 414Voted in 2014: No 20% (66) 21% (68) 14% (46) 45% (150) 3304-Region: Northeast 26% (24) 19% (18) 12% (11) 43% (41) 954-Region: Midwest 9% (17) 16% (31) 15% (27) 60% (113) 1874-Region: South 19% (61) 18% (57) 13% (42) 50% (158) 3184-Region: West 13% (19) 20% (29) 19% (27) 48% (69) 144Party: Democrat/Leans Democrat 31% (76) 28% (68) 11% (27) 31% (76) 247Party: Republican/Leans Republican 8% (28) 12% (43) 16% (58) 64% (234) 363Note: Row proportions may total to larger than one-hundred percent due to rounding. For more information visit MorningConsultIntelligence.com.
Page 181
National Tracking Poll #210636, June, 2021
181
Table POL8_5
Table POL8_5: How desirable are the following incentives in exchange for receiving a COVID-19 vaccine, if at all?Being entered into a lottery to win...A vacation
Demographic Very desirableSomewhatdesirable Not very desirable Not desirable at all Total N
Registered Voters 23% (170) 21% (156) 12% (92) 44% (326) 745Gender: Male 22% (72) 24% (78) 12% (40) 42% (136) 326Gender: Female 23% (98) 19% (78) 13% (53) 45% (190) 419Age: 18-34 32% (74) 28% (64) 11% (25) 29% (67) 230Age: 35-44 26% (39) 20% (30) 12% (18) 41% (60) 148Age: 45-64 18% (51) 18% (50) 13% (37) 51% (145) 283Age: 65+ 8% (7) 14% (12) 14% (12) 64% (54) 84GenZers: 1997-2012 32% (30) 30% (28) 14% (13) 24% (22) 93Millennials: 1981-1996 32% (73) 25% (58) 10% (23) 33% (77) 231GenXers: 1965-1980 20% (46) 20% (45) 12% (27) 48% (109) 227Baby Boomers: 1946-1964 11% (21) 13% (25) 15% (28) 61% (115) 190PID: Dem (no lean) 36% (75) 27% (57) 10% (21) 28% (58) 211PID: Ind (no lean) 20% (50) 21% (53) 14% (35) 45% (111) 249PID: Rep (no lean) 16% (45) 16% (47) 13% (37) 55% (157) 285PID/Gender: DemMen 40% (41) 28% (28) 9% (10) 23% (23) 102PID/Gender: DemWomen 31% (34) 26% (28) 10% (11) 32% (35) 109PID/Gender: Ind Men 16% (18) 22% (24) 19% (21) 43% (47) 109PID/Gender: Ind Women 23% (33) 21% (29) 10% (14) 46% (64) 140PID/Gender: Rep Men 11% (13) 23% (26) 8% (10) 58% (66) 115PID/Gender: Rep Women 19% (32) 12% (21) 16% (27) 53% (91) 170Ideo: Liberal (1-3) 35% (55) 24% (37) 15% (23) 26% (41) 155Ideo: Moderate (4) 22% (43) 31% (60) 9% (17) 39% (75) 196Ideo: Conservative (5-7) 17% (53) 13% (43) 14% (44) 57% (183) 323Educ: < College 25% (137) 20% (109) 13% (69) 43% (236) 551Educ: Bachelors degree 15% (20) 25% (33) 12% (16) 47% (63) 132Educ: Post-grad 22% (13) 23% (14) 12% (7) 44% (28) 62Income: Under 50k 24% (105) 19% (86) 14% (61) 43% (194) 447Income: 50k-100k 24% (46) 26% (50) 9% (17) 42% (80) 193Income: 100k+ 19% (20) 19% (20) 13% (14) 49% (51) 105Ethnicity: White 20% (111) 18% (100) 13% (73) 49% (267) 551Ethnicity: Hispanic 33% (25) 27% (21) 5% (4) 35% (27) 77
Continued on next page
Page 182
182
Morning ConsultTable POL8_5
Table POL8_5: How desirable are the following incentives in exchange for receiving a COVID-19 vaccine, if at all?Being entered into a lottery to win...A vacation
Demographic Very desirableSomewhatdesirable Not very desirable Not desirable at all Total N
Registered Voters 23% (170) 21% (156) 12% (92) 44% (326) 745Ethnicity: Black 32% (43) 28% (39) 8% (12) 32% (43) 137Ethnicity: Other 28% (16) 31% (18) 14% (8) 27% (16) 57All Christian 21% (65) 20% (62) 11% (34) 49% (157) 319Agnostic/Nothing in particular 26% (57) 24% (52) 15% (33) 35% (77) 219Something Else 23% (38) 19% (32) 12% (20) 46% (77) 167Evangelical 19% (51) 15% (39) 13% (33) 53% (140) 263Non-Evangelical 23% (47) 25% (51) 9% (20) 44% (91) 209Community: Urban 37% (77) 23% (47) 11% (22) 29% (61) 207Community: Suburban 15% (49) 24% (79) 12% (38) 50% (164) 330Community: Rural 21% (44) 14% (30) 15% (32) 49% (102) 208Employ: Private Sector 22% (55) 22% (54) 14% (34) 43% (107) 250Employ: Self-Employed 24% (18) 32% (23) 9% (7) 34% (25) 73Employ: Homemaker 23% (16) 13% (9) 13% (9) 51% (36) 71Employ: Retired 13% (16) 15% (18) 15% (19) 57% (71) 125Employ: Unemployed 28% (30) 27% (28) 6% (6) 39% (41) 105Employ: Other 37% (22) 14% (9) 18% (11) 31% (18) 60Military HH: Yes 16% (16) 19% (18) 13% (13) 52% (50) 97Military HH: No 24% (155) 21% (138) 12% (79) 43% (276) 648RD/WT: Right Direction 32% (81) 29% (73) 11% (29) 27% (67) 249RD/WT: Wrong Track 18% (89) 17% (84) 13% (64) 52% (259) 495Biden Job Approve 34% (97) 29% (82) 13% (36) 24% (68) 283Biden Job Disapprove 15% (61) 16% (62) 12% (49) 57% (229) 402Biden Job Strongly Approve 41% (46) 21% (24) 12% (13) 27% (30) 113Biden Job Somewhat Approve 30% (51) 34% (58) 14% (23) 22% (38) 170Biden Job Somewhat Disapprove 25% (22) 21% (19) 12% (11) 42% (37) 88Biden Job Strongly Disapprove 13% (39) 14% (44) 12% (38) 61% (192) 313Favorable of Biden 34% (101) 29% (84) 12% (34) 25% (74) 293Unfavorable of Biden 15% (60) 16% (65) 12% (51) 57% (237) 412
Continued on next page
Page 183
National Tracking Poll #210636, June, 2021
183
Table POL8_5
Table POL8_5: How desirable are the following incentives in exchange for receiving a COVID-19 vaccine, if at all?Being entered into a lottery to win...A vacation
Demographic Very desirableSomewhatdesirable Not very desirable Not desirable at all Total N
Registered Voters 23% (170) 21% (156) 12% (92) 44% (326) 745Very Favorable of Biden 40% (49) 19% (23) 14% (17) 27% (33) 122Somewhat Favorable of Biden 30% (52) 35% (60) 10% (17) 24% (42) 170Somewhat Unfavorable of Biden 18% (13) 23% (16) 13% (9) 46% (32) 70Very Unfavorable of Biden 14% (47) 14% (49) 12% (42) 60% (204) 342#1 Issue: Economy 26% (86) 18% (59) 13% (44) 43% (144) 332#1 Issue: Security 13% (18) 14% (18) 11% (15) 62% (82) 132#1 Issue: Health Care 24% (18) 34% (25) 8% (6) 34% (25) 73#1 Issue: Medicare / Social Security 17% (12) 21% (14) 16% (11) 46% (31) 672020 Vote: Joe Biden 33% (70) 30% (63) 12% (26) 24% (51) 2102020 Vote: Donald Trump 16% (58) 14% (50) 12% (44) 59% (215) 3672020 Vote: Didn’t Vote 27% (41) 25% (38) 13% (19) 36% (54) 1532018 House Vote: Democrat 29% (47) 30% (49) 12% (19) 29% (47) 1622018 House Vote: Republican 15% (42) 14% (41) 14% (40) 57% (164) 2872016 Vote: Hillary Clinton 28% (41) 28% (40) 13% (19) 31% (45) 1442016 Vote: Donald Trump 14% (44) 16% (53) 13% (43) 57% (184) 3242016 Vote: Didn’t Vote 33% (79) 23% (54) 10% (24) 33% (79) 237Voted in 2014: Yes 19% (79) 19% (79) 14% (57) 48% (199) 414Voted in 2014: No 28% (91) 23% (77) 11% (36) 38% (127) 3304-Region: Northeast 29% (28) 24% (22) 8% (8) 39% (37) 954-Region: Midwest 18% (34) 16% (29) 14% (27) 52% (97) 1874-Region: South 25% (79) 22% (68) 11% (36) 42% (135) 3184-Region: West 20% (29) 25% (36) 15% (22) 39% (57) 144Party: Democrat/Leans Democrat 35% (87) 27% (67) 11% (27) 27% (67) 247Party: Republican/Leans Republican 16% (57) 15% (56) 14% (51) 55% (199) 363Note: Row proportions may total to larger than one-hundred percent due to rounding. For more information visit MorningConsultIntelligence.com.
Page 184
184
Morning ConsultTable POL9_1
Table POL9_1: As you may know, Congress is debating a bill that addresses voter access, election security, campaign finance, and government ethics.Do you support or oppose each of the following components of the bill?Allowing automatic voter registration
DemographicStronglysupport
Somewhatsupport
Somewhatoppose
Stronglyoppose
Don’t know /No opinion Total N
Registered Voters 26% (514) 20% (398) 11% (227) 26% (520) 17% (331) 1990Gender: Male 26% (243) 23% (214) 11% (100) 28% (262) 12% (107) 927Gender: Female 25% (271) 17% (184) 12% (127) 24% (258) 21% (224) 1063Age: 18-34 28% (127) 24% (108) 12% (55) 12% (55) 24% (111) 456Age: 35-44 30% (91) 21% (62) 12% (36) 19% (57) 18% (54) 300Age: 45-64 22% (164) 20% (146) 9% (66) 34% (249) 14% (105) 730Age: 65+ 26% (131) 16% (81) 14% (70) 32% (160) 12% (61) 504GenZers: 1997-2012 24% (41) 17% (28) 14% (24) 9% (16) 35% (60) 169Millennials: 1981-1996 29% (140) 26% (125) 12% (57) 15% (70) 18% (88) 480GenXers: 1965-1980 26% (138) 21% (113) 8% (44) 28% (144) 16% (86) 525Baby Boomers: 1946-1964 24% (180) 16% (121) 13% (94) 36% (265) 12% (86) 746PID: Dem (no lean) 44% (329) 28% (212) 8% (60) 5% (41) 15% (110) 752PID: Ind (no lean) 21% (119) 19% (107) 14% (78) 25% (145) 22% (128) 578PID: Rep (no lean) 10% (66) 12% (80) 13% (88) 51% (334) 14% (93) 661PID/Gender: DemMen 47% (170) 30% (106) 9% (31) 6% (20) 9% (31) 359PID/Gender: DemWomen 40% (159) 27% (105) 7% (29) 5% (21) 20% (78) 393PID/Gender: Ind Men 18% (49) 22% (60) 14% (36) 29% (76) 17% (46) 267PID/Gender: Ind Women 23% (70) 15% (47) 14% (42) 22% (69) 27% (82) 311PID/Gender: Rep Men 8% (24) 16% (48) 11% (33) 55% (166) 10% (30) 301PID/Gender: Rep Women 12% (42) 9% (31) 15% (55) 47% (168) 17% (63) 360Ideo: Liberal (1-3) 50% (294) 25% (149) 8% (44) 6% (34) 11% (67) 587Ideo: Moderate (4) 25% (136) 23% (127) 14% (74) 18% (96) 20% (106) 539Ideo: Conservative (5-7) 9% (66) 15% (109) 13% (95) 51% (380) 12% (91) 742Educ: < College 22% (269) 19% (227) 11% (139) 27% (327) 21% (252) 1213Educ: Bachelors degree 30% (146) 23% (113) 11% (52) 26% (129) 10% (48) 489Educ: Post-grad 34% (99) 20% (57) 13% (36) 23% (65) 11% (31) 288Income: Under 50k 24% (242) 19% (189) 12% (119) 24% (241) 20% (202) 991Income: 50k-100k 25% (161) 21% (134) 11% (72) 28% (177) 15% (96) 640Income: 100k+ 31% (111) 21% (76) 10% (36) 29% (103) 9% (34) 359Ethnicity: White 24% (385) 18% (285) 11% (181) 30% (476) 16% (257) 1584
Continued on next page
Page 185
National Tracking Poll #210636, June, 2021
185
Table POL9_1
Table POL9_1: As you may know, Congress is debating a bill that addresses voter access, election security, campaign finance, and government ethics.Do you support or oppose each of the following components of the bill?Allowing automatic voter registration
DemographicStronglysupport
Somewhatsupport
Somewhatoppose
Stronglyoppose
Don’t know /No opinion Total N
Registered Voters 26% (514) 20% (398) 11% (227) 26% (520) 17% (331) 1990Ethnicity: Hispanic 24% (47) 28% (55) 13% (25) 14% (28) 20% (40) 196Ethnicity: Black 34% (82) 28% (67) 11% (27) 7% (18) 20% (48) 243Ethnicity: Other 29% (47) 28% (45) 12% (19) 16% (26) 16% (26) 163All Christian 22% (208) 19% (187) 12% (120) 32% (312) 14% (136) 964All Non-Christian 37% (45) 23% (28) 9% (11) 18% (21) 14% (16) 121Atheist 42% (31) 23% (17) 7% (5) 16% (12) 12% (9) 73Agnostic/Nothing in particular 30% (150) 22% (109) 10% (49) 18% (89) 20% (98) 495Something Else 24% (80) 17% (58) 12% (42) 26% (86) 21% (71) 337Religious Non-Protestant/Catholic 32% (46) 22% (31) 10% (14) 18% (26) 18% (25) 140Evangelical 20% (112) 15% (84) 12% (65) 39% (212) 13% (74) 547Non-Evangelical 24% (173) 21% (154) 13% (94) 25% (179) 17% (122) 721Community: Urban 33% (176) 28% (146) 9% (47) 15% (80) 15% (80) 529Community: Suburban 24% (244) 18% (180) 12% (121) 30% (298) 16% (155) 998Community: Rural 20% (94) 16% (72) 13% (59) 31% (142) 21% (96) 464Employ: Private Sector 30% (187) 23% (141) 10% (61) 25% (157) 12% (76) 622Employ: Government 26% (33) 22% (29) 12% (16) 28% (36) 12% (16) 129Employ: Self-Employed 32% (50) 22% (35) 8% (12) 23% (37) 15% (24) 157Employ: Homemaker 17% (22) 14% (18) 13% (16) 29% (37) 27% (34) 127Employ: Retired 26% (148) 15% (89) 13% (76) 34% (195) 12% (72) 581Employ: Unemployed 21% (44) 24% (51) 11% (24) 18% (39) 26% (56) 215Employ: Other 16% (18) 25% (28) 12% (13) 15% (17) 32% (36) 113Military HH: Yes 22% (79) 16% (60) 11% (41) 39% (140) 11% (41) 361Military HH: No 27% (435) 21% (338) 11% (186) 23% (380) 18% (289) 1629RD/WT: Right Direction 41% (385) 29% (272) 8% (77) 7% (64) 15% (143) 941RD/WT: Wrong Track 12% (128) 12% (126) 14% (150) 44% (457) 18% (188) 1049Biden Job Approve 42% (440) 28% (286) 10% (99) 6% (62) 14% (150) 1037Biden Job Disapprove 8% (68) 11% (96) 15% (125) 52% (445) 14% (123) 857
Continued on next page
Page 186
186
Morning ConsultTable POL9_1
Table POL9_1: As you may know, Congress is debating a bill that addresses voter access, election security, campaign finance, and government ethics.Do you support or oppose each of the following components of the bill?Allowing automatic voter registration
DemographicStronglysupport
Somewhatsupport
Somewhatoppose
Stronglyoppose
Don’t know /No opinion Total N
Registered Voters 26% (514) 20% (398) 11% (227) 26% (520) 17% (331) 1990Biden Job Strongly Approve 54% (295) 25% (139) 5% (29) 4% (23) 11% (63) 548Biden Job Somewhat Approve 30% (145) 30% (148) 14% (70) 8% (39) 18% (87) 489Biden Job Somewhat Disapprove 15% (34) 20% (46) 18% (41) 26% (59) 19% (43) 223Biden Job Strongly Disapprove 5% (34) 8% (50) 13% (84) 61% (386) 13% (79) 634Favorable of Biden 42% (439) 28% (298) 9% (93) 6% (67) 14% (152) 1048Unfavorable of Biden 8% (67) 11% (92) 15% (129) 51% (439) 15% (128) 855Very Favorable of Biden 52% (307) 27% (163) 5% (30) 4% (24) 12% (68) 593Somewhat Favorable of Biden 29% (132) 30% (135) 14% (62) 9% (43) 18% (84) 455Somewhat Unfavorable of Biden 16% (31) 18% (34) 16% (31) 29% (55) 20% (39) 190Very Unfavorable of Biden 5% (36) 9% (58) 15% (98) 58% (384) 13% (89) 664#1 Issue: Economy 19% (147) 21% (162) 12% (90) 28% (217) 19% (148) 763#1 Issue: Security 12% (43) 13% (44) 13% (47) 48% (168) 14% (47) 349#1 Issue: Health Care 41% (95) 25% (59) 11% (26) 12% (29) 11% (25) 233#1 Issue: Medicare / Social Security 33% (87) 20% (52) 11% (30) 22% (59) 13% (34) 261#1 Issue: Women’s Issues 38% (39) 25% (25) 6% (6) 7% (7) 25% (26) 103#1 Issue: Education 37% (32) 17% (14) 16% (14) 11% (9) 19% (16) 86#1 Issue: Energy 37% (32) 24% (20) 6% (5) 7% (6) 26% (22) 86#1 Issue: Other 36% (40) 19% (21) 9% (9) 24% (26) 12% (13) 1092020 Vote: Joe Biden 44% (393) 29% (258) 9% (84) 5% (49) 13% (113) 8972020 Vote: Donald Trump 8% (69) 11% (91) 14% (111) 52% (427) 15% (120) 8182020 Vote: Didn’t Vote 18% (43) 17% (41) 12% (28) 16% (38) 37% (89) 2392018 House Vote: Democrat 46% (318) 29% (202) 7% (48) 6% (38) 12% (81) 6872018 House Vote: Republican 9% (65) 10% (72) 15% (101) 54% (371) 12% (81) 6902018 House Vote: Someone else 27% (13) 18% (9) 8% (4) 17% (8) 30% (15) 502016 Vote: Hillary Clinton 45% (286) 29% (182) 8% (50) 6% (39) 12% (74) 6312016 Vote: Donald Trump 10% (80) 12% (90) 14% (109) 51% (393) 13% (96) 7682016 Vote: Other 28% (30) 20% (21) 13% (14) 24% (26) 15% (16) 1072016 Vote: Didn’t Vote 24% (117) 21% (104) 11% (54) 13% (63) 30% (146) 483
Continued on next page
Page 187
National Tracking Poll #210636, June, 2021
187
Table POL9_1
Table POL9_1: As you may know, Congress is debating a bill that addresses voter access, election security, campaign finance, and government ethics.Do you support or oppose each of the following components of the bill?Allowing automatic voter registration
DemographicStronglysupport
Somewhatsupport
Somewhatoppose
Stronglyoppose
Don’t know /No opinion Total N
Registered Voters 26% (514) 20% (398) 11% (227) 26% (520) 17% (331) 1990Voted in 2014: Yes 28% (360) 19% (251) 11% (140) 30% (392) 12% (155) 1297Voted in 2014: No 22% (154) 21% (147) 13% (87) 19% (129) 25% (176) 6934-Region: Northeast 28% (98) 26% (90) 11% (37) 19% (67) 16% (53) 3444-Region: Midwest 27% (121) 19% (88) 12% (53) 29% (131) 14% (62) 4554-Region: South 24% (178) 18% (135) 13% (95) 27% (206) 19% (142) 7554-Region: West 27% (117) 20% (86) 10% (42) 27% (116) 17% (74) 435Party: Democrat/Leans Democrat 43% (386) 29% (259) 8% (73) 5% (48) 14% (122) 888Party: Republican/Leans Republican 9% (73) 11% (92) 14% (114) 50% (409) 15% (126) 814Note: Row proportions may total to larger than one-hundred percent due to rounding. For more information visit MorningConsultIntelligence.com.
Page 188
188
Morning ConsultTable POL9_2
Table POL9_2: As you may know, Congress is debating a bill that addresses voter access, election security, campaign finance, and government ethics.Do you support or oppose each of the following components of the bill?Allowing same-day voter registration
DemographicStronglysupport
Somewhatsupport
Somewhatoppose
Stronglyoppose
Don’t know /No opinion Total N
Registered Voters 30% (601) 23% (455) 12% (240) 21% (417) 14% (277) 1990Gender: Male 31% (286) 25% (230) 12% (115) 21% (197) 11% (99) 927Gender: Female 30% (315) 21% (225) 12% (125) 21% (219) 17% (178) 1063Age: 18-34 34% (157) 26% (118) 11% (49) 7% (33) 22% (99) 456Age: 35-44 35% (104) 23% (70) 10% (29) 14% (43) 18% (54) 300Age: 45-64 26% (190) 24% (175) 11% (83) 26% (189) 13% (93) 730Age: 65+ 30% (151) 18% (92) 15% (78) 30% (153) 6% (31) 504GenZers: 1997-2012 29% (48) 20% (34) 12% (20) 8% (13) 32% (54) 169Millennials: 1981-1996 35% (168) 28% (134) 9% (45) 10% (49) 17% (83) 480GenXers: 1965-1980 30% (160) 25% (133) 10% (50) 19% (101) 16% (82) 525Baby Boomers: 1946-1964 28% (208) 19% (141) 15% (116) 31% (231) 7% (51) 746PID: Dem (no lean) 50% (377) 25% (186) 9% (65) 5% (38) 11% (85) 752PID: Ind (no lean) 25% (146) 23% (135) 13% (78) 19% (112) 19% (108) 578PID: Rep (no lean) 12% (78) 20% (134) 15% (97) 40% (267) 13% (85) 661PID/Gender: DemMen 51% (185) 26% (93) 9% (33) 5% (16) 9% (32) 359PID/Gender: DemWomen 49% (192) 24% (93) 8% (32) 6% (22) 14% (53) 393PID/Gender: Ind Men 26% (69) 25% (67) 13% (34) 24% (63) 13% (34) 267PID/Gender: Ind Women 25% (76) 22% (68) 14% (44) 16% (49) 24% (73) 311PID/Gender: Rep Men 11% (32) 23% (70) 16% (48) 39% (118) 11% (33) 301PID/Gender: Rep Women 13% (46) 18% (64) 14% (49) 41% (149) 14% (51) 360Ideo: Liberal (1-3) 56% (329) 22% (131) 8% (50) 4% (24) 9% (54) 587Ideo: Moderate (4) 29% (157) 28% (153) 12% (65) 14% (73) 17% (91) 539Ideo: Conservative (5-7) 13% (95) 21% (154) 16% (117) 42% (309) 9% (66) 742Educ: < College 27% (326) 23% (285) 11% (137) 20% (245) 18% (219) 1213Educ: Bachelors degree 36% (176) 21% (103) 13% (63) 22% (107) 8% (40) 489Educ: Post-grad 34% (98) 23% (68) 14% (40) 22% (64) 6% (18) 288Income: Under 50k 31% (305) 23% (229) 10% (104) 19% (187) 17% (167) 991Income: 50k-100k 27% (172) 23% (146) 16% (100) 22% (141) 13% (81) 640Income: 100k+ 35% (125) 22% (80) 10% (37) 25% (89) 8% (29) 359Ethnicity: White 28% (443) 22% (344) 13% (201) 24% (386) 13% (211) 1584
Continued on next page
Page 189
National Tracking Poll #210636, June, 2021
189
Table POL9_2
Table POL9_2: As you may know, Congress is debating a bill that addresses voter access, election security, campaign finance, and government ethics.Do you support or oppose each of the following components of the bill?Allowing same-day voter registration
DemographicStronglysupport
Somewhatsupport
Somewhatoppose
Stronglyoppose
Don’t know /No opinion Total N
Registered Voters 30% (601) 23% (455) 12% (240) 21% (417) 14% (277) 1990Ethnicity: Hispanic 33% (66) 25% (49) 15% (30) 8% (16) 18% (36) 196Ethnicity: Black 42% (102) 22% (53) 11% (26) 6% (14) 20% (47) 243Ethnicity: Other 34% (56) 36% (59) 8% (13) 10% (17) 12% (19) 163All Christian 25% (241) 23% (218) 15% (144) 28% (270) 9% (91) 964All Non-Christian 48% (58) 22% (26) 4% (5) 13% (16) 13% (16) 121Atheist 47% (34) 17% (12) 13% (9) 12% (9) 12% (9) 73Agnostic/Nothing in particular 35% (174) 24% (119) 10% (49) 13% (62) 18% (92) 495Something Else 28% (94) 24% (80) 10% (33) 18% (60) 21% (70) 337Religious Non-Protestant/Catholic 43% (60) 21% (29) 8% (12) 15% (20) 14% (19) 140Evangelical 24% (130) 21% (112) 13% (72) 30% (165) 12% (68) 547Non-Evangelical 27% (198) 25% (182) 13% (93) 22% (158) 12% (89) 721Community: Urban 40% (210) 26% (139) 10% (55) 11% (58) 13% (68) 529Community: Suburban 28% (280) 21% (207) 13% (131) 25% (248) 13% (131) 998Community: Rural 24% (111) 24% (109) 12% (54) 24% (111) 17% (78) 464Employ: Private Sector 33% (202) 24% (150) 12% (72) 19% (119) 12% (77) 622Employ: Government 31% (39) 25% (32) 10% (13) 20% (25) 15% (19) 129Employ: Self-Employed 38% (59) 25% (40) 8% (13) 17% (27) 11% (18) 157Employ: Homemaker 19% (24) 22% (28) 16% (20) 23% (29) 21% (26) 127Employ: Retired 30% (175) 19% (108) 16% (92) 29% (171) 6% (35) 581Employ: Unemployed 26% (56) 29% (62) 5% (11) 13% (28) 27% (57) 215Employ: Other 27% (31) 23% (26) 11% (12) 10% (11) 29% (32) 113Military HH: Yes 26% (94) 21% (75) 14% (50) 28% (102) 11% (39) 361Military HH: No 31% (507) 23% (380) 12% (190) 19% (314) 15% (238) 1629RD/WT: Right Direction 46% (433) 28% (260) 8% (78) 6% (52) 13% (118) 941RD/WT: Wrong Track 16% (168) 19% (195) 15% (162) 35% (365) 15% (159) 1049Biden Job Approve 48% (493) 28% (288) 9% (90) 5% (55) 11% (112) 1037Biden Job Disapprove 12% (104) 17% (148) 17% (144) 41% (355) 12% (106) 857
Continued on next page
Page 190
190
Morning ConsultTable POL9_2
Table POL9_2: As you may know, Congress is debating a bill that addresses voter access, election security, campaign finance, and government ethics.Do you support or oppose each of the following components of the bill?Allowing same-day voter registration
DemographicStronglysupport
Somewhatsupport
Somewhatoppose
Stronglyoppose
Don’t know /No opinion Total N
Registered Voters 30% (601) 23% (455) 12% (240) 21% (417) 14% (277) 1990Biden Job Strongly Approve 59% (325) 23% (129) 6% (32) 3% (16) 8% (46) 548Biden Job Somewhat Approve 34% (168) 33% (159) 12% (58) 8% (39) 13% (65) 489Biden Job Somewhat Disapprove 16% (36) 26% (59) 20% (45) 23% (52) 14% (32) 223Biden Job Strongly Disapprove 11% (69) 14% (89) 16% (99) 48% (303) 12% (74) 634Favorable of Biden 47% (497) 28% (291) 8% (88) 6% (59) 11% (113) 1048Unfavorable of Biden 11% (97) 18% (150) 17% (145) 41% (351) 13% (112) 855Very Favorable of Biden 59% (348) 23% (138) 6% (35) 3% (19) 9% (53) 593Somewhat Favorable of Biden 33% (149) 34% (153) 12% (53) 9% (39) 13% (60) 455Somewhat Unfavorable of Biden 15% (29) 26% (49) 23% (43) 21% (41) 15% (28) 190Very Unfavorable of Biden 10% (67) 15% (101) 15% (102) 47% (310) 13% (84) 664#1 Issue: Economy 25% (188) 26% (199) 15% (114) 21% (161) 13% (102) 763#1 Issue: Security 16% (57) 20% (71) 10% (36) 39% (137) 14% (48) 349#1 Issue: Health Care 45% (106) 25% (58) 8% (20) 10% (24) 11% (26) 233#1 Issue: Medicare / Social Security 37% (98) 18% (46) 15% (38) 20% (52) 10% (27) 261#1 Issue: Women’s Issues 37% (38) 21% (22) 7% (7) 8% (9) 27% (27) 103#1 Issue: Education 40% (34) 31% (27) 9% (7) 4% (4) 16% (14) 86#1 Issue: Energy 44% (38) 20% (17) 6% (5) 5% (4) 25% (22) 86#1 Issue: Other 40% (43) 15% (16) 11% (12) 24% (27) 10% (11) 1092020 Vote: Joe Biden 50% (446) 27% (238) 9% (84) 5% (46) 9% (83) 8972020 Vote: Donald Trump 13% (102) 18% (149) 16% (130) 42% (342) 12% (94) 8182020 Vote: Didn’t Vote 17% (40) 25% (60) 9% (22) 10% (24) 39% (93) 2392018 House Vote: Democrat 53% (367) 25% (171) 10% (67) 5% (36) 7% (46) 6872018 House Vote: Republican 12% (86) 18% (122) 17% (119) 43% (299) 9% (64) 6902018 House Vote: Someone else 29% (15) 16% (8) 4% (2) 7% (4) 44% (22) 502016 Vote: Hillary Clinton 54% (340) 25% (157) 9% (55) 4% (26) 8% (53) 6312016 Vote: Donald Trump 13% (98) 18% (139) 17% (128) 42% (323) 10% (80) 7682016 Vote: Other 33% (36) 28% (31) 10% (11) 15% (16) 12% (13) 1072016 Vote: Didn’t Vote 26% (126) 27% (129) 9% (46) 11% (52) 27% (131) 483
Continued on next page
Page 191
National Tracking Poll #210636, June, 2021
191
Table POL9_2
Table POL9_2: As you may know, Congress is debating a bill that addresses voter access, election security, campaign finance, and government ethics.Do you support or oppose each of the following components of the bill?Allowing same-day voter registration
DemographicStronglysupport
Somewhatsupport
Somewhatoppose
Stronglyoppose
Don’t know /No opinion Total N
Registered Voters 30% (601) 23% (455) 12% (240) 21% (417) 14% (277) 1990Voted in 2014: Yes 33% (429) 21% (267) 13% (164) 25% (323) 9% (114) 1297Voted in 2014: No 25% (172) 27% (188) 11% (76) 14% (94) 23% (163) 6934-Region: Northeast 33% (115) 29% (98) 9% (29) 17% (59) 13% (43) 3444-Region: Midwest 31% (141) 27% (123) 9% (43) 22% (101) 10% (46) 4554-Region: South 28% (214) 21% (157) 12% (93) 22% (169) 16% (122) 7554-Region: West 30% (131) 18% (77) 17% (74) 20% (88) 15% (65) 435Party: Democrat/Leans Democrat 50% (447) 26% (232) 8% (73) 5% (45) 10% (91) 888Party: Republican/Leans Republican 11% (90) 20% (163) 17% (135) 39% (320) 13% (106) 814Note: Row proportions may total to larger than one-hundred percent due to rounding. For more information visit MorningConsultIntelligence.com.
Page 192
192
Morning ConsultTable POL9_3
Table POL9_3: As you may know, Congress is debating a bill that addresses voter access, election security, campaign finance, and government ethics.Do you support or oppose each of the following components of the bill?Limiting the removal of voters from voter lists
DemographicStronglysupport
Somewhatsupport
Somewhatoppose
Stronglyoppose
Don’t know /No opinion Total N
Registered Voters 22% (434) 20% (397) 11% (217) 19% (379) 28% (562) 1990Gender: Male 25% (232) 24% (219) 12% (107) 19% (177) 21% (193) 927Gender: Female 19% (202) 17% (179) 10% (111) 19% (202) 35% (369) 1063Age: 18-34 21% (97) 23% (105) 11% (52) 10% (45) 34% (157) 456Age: 35-44 23% (70) 27% (80) 8% (25) 8% (25) 33% (100) 300Age: 45-64 20% (143) 18% (129) 10% (76) 24% (178) 28% (204) 730Age: 65+ 24% (123) 16% (83) 13% (65) 26% (131) 20% (102) 504GenZers: 1997-2012 17% (29) 24% (40) 13% (23) 6% (10) 40% (67) 169Millennials: 1981-1996 24% (115) 25% (118) 8% (40) 11% (52) 32% (154) 480GenXers: 1965-1980 19% (99) 20% (106) 11% (57) 19% (102) 31% (160) 525Baby Boomers: 1946-1964 23% (175) 17% (126) 11% (84) 26% (195) 22% (166) 746PID: Dem (no lean) 34% (258) 25% (190) 8% (64) 11% (80) 21% (159) 752PID: Ind (no lean) 17% (97) 19% (108) 12% (69) 18% (103) 35% (201) 578PID: Rep (no lean) 12% (79) 15% (99) 13% (84) 30% (196) 31% (202) 661PID/Gender: DemMen 41% (147) 28% (100) 7% (27) 9% (33) 15% (52) 359PID/Gender: DemWomen 28% (112) 23% (90) 9% (37) 12% (47) 27% (107) 393PID/Gender: Ind Men 17% (46) 24% (63) 14% (37) 21% (55) 25% (66) 267PID/Gender: Ind Women 16% (51) 14% (45) 10% (32) 15% (48) 43% (135) 311PID/Gender: Rep Men 13% (39) 18% (55) 14% (43) 29% (88) 25% (75) 301PID/Gender: Rep Women 11% (39) 12% (44) 12% (41) 30% (108) 35% (127) 360Ideo: Liberal (1-3) 39% (230) 24% (144) 7% (42) 9% (54) 20% (117) 587Ideo: Moderate (4) 19% (102) 24% (128) 13% (68) 15% (82) 30% (159) 539Ideo: Conservative (5-7) 12% (87) 16% (116) 13% (97) 32% (235) 28% (208) 742Educ: < College 18% (215) 19% (235) 11% (134) 19% (228) 33% (401) 1213Educ: Bachelors degree 27% (132) 20% (98) 11% (53) 20% (96) 22% (109) 489Educ: Post-grad 30% (87) 22% (64) 10% (30) 19% (55) 18% (52) 288Income: Under 50k 20% (203) 19% (185) 12% (121) 19% (186) 30% (297) 991Income: 50k-100k 22% (141) 21% (136) 10% (63) 19% (123) 28% (177) 640Income: 100k+ 25% (91) 21% (77) 9% (34) 19% (69) 25% (88) 359Ethnicity: White 22% (341) 19% (293) 11% (176) 21% (325) 28% (448) 1584
Continued on next page
Page 193
National Tracking Poll #210636, June, 2021
193
Table POL9_3
Table POL9_3: As you may know, Congress is debating a bill that addresses voter access, election security, campaign finance, and government ethics.Do you support or oppose each of the following components of the bill?Limiting the removal of voters from voter lists
DemographicStronglysupport
Somewhatsupport
Somewhatoppose
Stronglyoppose
Don’t know /No opinion Total N
Registered Voters 22% (434) 20% (397) 11% (217) 19% (379) 28% (562) 1990Ethnicity: Hispanic 21% (42) 28% (55) 10% (19) 9% (17) 32% (63) 196Ethnicity: Black 22% (54) 27% (66) 10% (23) 14% (35) 27% (65) 243Ethnicity: Other 24% (39) 23% (38) 11% (18) 12% (19) 30% (49) 163All Christian 19% (184) 21% (200) 12% (116) 23% (226) 25% (238) 964All Non-Christian 39% (47) 17% (21) 8% (9) 11% (14) 25% (31) 121Atheist 27% (20) 23% (17) 9% (7) 15% (11) 27% (20) 73Agnostic/Nothing in particular 24% (117) 21% (105) 9% (45) 14% (72) 32% (157) 495Something Else 20% (66) 17% (56) 12% (40) 17% (57) 35% (117) 337Religious Non-Protestant/Catholic 34% (48) 18% (25) 9% (13) 12% (17) 27% (38) 140Evangelical 18% (96) 18% (96) 11% (61) 26% (142) 28% (152) 547Non-Evangelical 21% (152) 21% (149) 13% (92) 19% (136) 27% (191) 721Community: Urban 29% (154) 25% (133) 11% (57) 13% (68) 22% (117) 529Community: Suburban 20% (203) 18% (182) 11% (110) 21% (211) 29% (291) 998Community: Rural 17% (77) 18% (82) 11% (51) 22% (100) 33% (154) 464Employ: Private Sector 23% (140) 24% (151) 12% (73) 18% (110) 24% (148) 622Employ: Government 20% (25) 28% (36) 10% (12) 14% (18) 28% (37) 129Employ: Self-Employed 25% (40) 24% (38) 12% (19) 14% (22) 24% (38) 157Employ: Homemaker 14% (18) 14% (18) 8% (10) 15% (20) 48% (61) 127Employ: Retired 24% (140) 14% (82) 12% (70) 28% (162) 22% (127) 581Employ: Unemployed 21% (45) 18% (39) 8% (18) 14% (30) 39% (83) 215Employ: Other 14% (16) 22% (25) 7% (8) 12% (14) 44% (50) 113Military HH: Yes 20% (71) 16% (59) 12% (43) 27% (99) 25% (90) 361Military HH: No 22% (364) 21% (339) 11% (174) 17% (280) 29% (472) 1629RD/WT: Right Direction 32% (297) 25% (236) 9% (84) 10% (98) 24% (227) 941RD/WT: Wrong Track 13% (137) 15% (162) 13% (134) 27% (281) 32% (335) 1049Biden Job Approve 33% (338) 25% (262) 9% (96) 11% (115) 22% (228) 1037Biden Job Disapprove 11% (94) 15% (124) 14% (120) 30% (258) 30% (261) 857
Continued on next page
Page 194
194
Morning ConsultTable POL9_3
Table POL9_3: As you may know, Congress is debating a bill that addresses voter access, election security, campaign finance, and government ethics.Do you support or oppose each of the following components of the bill?Limiting the removal of voters from voter lists
DemographicStronglysupport
Somewhatsupport
Somewhatoppose
Stronglyoppose
Don’t know /No opinion Total N
Registered Voters 22% (434) 20% (397) 11% (217) 19% (379) 28% (562) 1990Biden Job Strongly Approve 42% (229) 22% (120) 7% (37) 12% (65) 18% (96) 548Biden Job Somewhat Approve 22% (108) 29% (141) 12% (58) 10% (49) 27% (132) 489Biden Job Somewhat Disapprove 15% (33) 21% (47) 15% (34) 13% (29) 36% (79) 223Biden Job Strongly Disapprove 10% (62) 12% (77) 14% (86) 36% (228) 29% (181) 634Favorable of Biden 32% (340) 25% (265) 9% (91) 11% (116) 22% (236) 1048Unfavorable of Biden 11% (90) 15% (125) 14% (122) 30% (257) 31% (261) 855Very Favorable of Biden 41% (240) 23% (138) 6% (37) 12% (71) 18% (106) 593Somewhat Favorable of Biden 22% (99) 28% (127) 12% (54) 10% (45) 28% (130) 455Somewhat Unfavorable of Biden 14% (26) 20% (38) 16% (30) 11% (22) 39% (74) 190Very Unfavorable of Biden 10% (64) 13% (87) 14% (92) 35% (235) 28% (187) 664#1 Issue: Economy 18% (137) 20% (149) 11% (88) 19% (146) 32% (243) 763#1 Issue: Security 14% (48) 17% (59) 12% (43) 31% (107) 26% (92) 349#1 Issue: Health Care 32% (75) 28% (64) 9% (22) 12% (28) 19% (44) 233#1 Issue: Medicare / Social Security 26% (68) 18% (47) 12% (31) 17% (45) 27% (69) 261#1 Issue: Women’s Issues 24% (24) 16% (16) 13% (14) 7% (7) 40% (42) 103#1 Issue: Education 26% (22) 27% (23) 6% (5) 14% (12) 27% (23) 86#1 Issue: Energy 36% (31) 22% (19) 5% (5) 9% (7) 28% (24) 86#1 Issue: Other 27% (30) 18% (19) 9% (10) 24% (26) 22% (24) 1092020 Vote: Joe Biden 35% (310) 26% (237) 9% (81) 10% (90) 20% (179) 8972020 Vote: Donald Trump 11% (93) 13% (106) 14% (116) 31% (252) 31% (252) 8182020 Vote: Didn’t Vote 10% (23) 21% (51) 7% (18) 13% (31) 49% (117) 2392018 House Vote: Democrat 37% (252) 25% (175) 7% (47) 13% (86) 18% (126) 6872018 House Vote: Republican 12% (79) 14% (99) 15% (103) 32% (224) 27% (184) 6902018 House Vote: Someone else 21% (10) 16% (8) 7% (3) 9% (4) 48% (24) 502016 Vote: Hillary Clinton 37% (236) 24% (150) 8% (48) 12% (77) 19% (120) 6312016 Vote: Donald Trump 13% (102) 15% (113) 13% (103) 31% (240) 27% (210) 7682016 Vote: Other 23% (25) 22% (24) 10% (10) 14% (15) 31% (33) 1072016 Vote: Didn’t Vote 15% (71) 23% (111) 12% (56) 10% (47) 41% (198) 483
Continued on next page
Page 195
National Tracking Poll #210636, June, 2021
195
Table POL9_3
Table POL9_3: As you may know, Congress is debating a bill that addresses voter access, election security, campaign finance, and government ethics.Do you support or oppose each of the following components of the bill?Limiting the removal of voters from voter lists
DemographicStronglysupport
Somewhatsupport
Somewhatoppose
Stronglyoppose
Don’t know /No opinion Total N
Registered Voters 22% (434) 20% (397) 11% (217) 19% (379) 28% (562) 1990Voted in 2014: Yes 24% (313) 19% (247) 11% (138) 23% (303) 23% (296) 1297Voted in 2014: No 17% (121) 22% (151) 11% (79) 11% (76) 38% (266) 6934-Region: Northeast 24% (84) 26% (90) 10% (36) 13% (46) 26% (88) 3444-Region: Midwest 22% (99) 18% (82) 14% (62) 20% (92) 26% (120) 4554-Region: South 20% (154) 18% (139) 11% (82) 21% (158) 29% (223) 7554-Region: West 22% (97) 20% (87) 9% (37) 19% (83) 30% (131) 435Party: Democrat/Leans Democrat 34% (300) 25% (225) 9% (78) 11% (94) 21% (190) 888Party: Republican/Leans Republican 11% (93) 15% (124) 14% (111) 29% (233) 31% (252) 814Note: Row proportions may total to larger than one-hundred percent due to rounding. For more information visit MorningConsultIntelligence.com.
Page 196
196
Morning ConsultTable POL9_4
Table POL9_4: As you may know, Congress is debating a bill that addresses voter access, election security, campaign finance, and government ethics.Do you support or oppose each of the following components of the bill?Helping states secure their election systems
DemographicStronglysupport
Somewhatsupport
Somewhatoppose
Stronglyoppose
Don’t know /No opinion Total N
Registered Voters 50% (1003) 28% (553) 6% (110) 4% (73) 13% (250) 1990Gender: Male 50% (461) 29% (271) 6% (59) 4% (42) 10% (94) 927Gender: Female 51% (542) 26% (281) 5% (51) 3% (32) 15% (156) 1063Age: 18-34 40% (184) 25% (116) 11% (50) 3% (13) 20% (93) 456Age: 35-44 50% (150) 27% (81) 6% (17) 3% (9) 14% (43) 300Age: 45-64 52% (383) 29% (211) 3% (22) 4% (26) 12% (89) 730Age: 65+ 57% (286) 29% (146) 4% (21) 5% (25) 5% (26) 504GenZers: 1997-2012 34% (57) 20% (34) 15% (25) 4% (7) 27% (46) 169Millennials: 1981-1996 47% (225) 28% (132) 7% (35) 2% (10) 16% (78) 480GenXers: 1965-1980 51% (266) 27% (144) 4% (21) 4% (20) 14% (73) 525Baby Boomers: 1946-1964 56% (415) 30% (221) 4% (28) 4% (31) 7% (51) 746PID: Dem (no lean) 50% (375) 30% (228) 6% (44) 3% (24) 11% (81) 752PID: Ind (no lean) 46% (264) 27% (155) 6% (33) 4% (23) 18% (103) 578PID: Rep (no lean) 55% (365) 26% (170) 5% (33) 4% (27) 10% (66) 661PID/Gender: DemMen 53% (189) 31% (110) 6% (21) 2% (8) 9% (31) 359PID/Gender: DemWomen 47% (186) 30% (118) 6% (24) 4% (15) 13% (51) 393PID/Gender: Ind Men 45% (121) 28% (75) 7% (17) 6% (15) 15% (39) 267PID/Gender: Ind Women 46% (143) 26% (81) 5% (16) 2% (7) 21% (64) 311PID/Gender: Rep Men 50% (151) 29% (86) 7% (21) 6% (18) 8% (25) 301PID/Gender: Rep Women 59% (214) 23% (83) 3% (12) 3% (9) 12% (42) 360Ideo: Liberal (1-3) 53% (312) 28% (166) 6% (34) 2% (15) 10% (60) 587Ideo: Moderate (4) 44% (237) 31% (169) 6% (32) 4% (24) 14% (77) 539Ideo: Conservative (5-7) 56% (417) 27% (201) 6% (41) 4% (32) 7% (51) 742Educ: < College 49% (596) 28% (334) 6% (70) 3% (32) 15% (182) 1213Educ: Bachelors degree 51% (247) 29% (142) 6% (30) 4% (21) 10% (49) 489Educ: Post-grad 56% (161) 27% (77) 4% (11) 7% (21) 6% (19) 288Income: Under 50k 49% (486) 28% (275) 5% (53) 3% (27) 15% (150) 991Income: 50k-100k 48% (310) 30% (193) 6% (36) 5% (30) 11% (72) 640Income: 100k+ 58% (207) 24% (86) 6% (21) 5% (17) 8% (28) 359Ethnicity: White 52% (819) 28% (438) 5% (82) 4% (63) 11% (182) 1584
Continued on next page
Page 197
National Tracking Poll #210636, June, 2021
197
Table POL9_4
Table POL9_4: As you may know, Congress is debating a bill that addresses voter access, election security, campaign finance, and government ethics.Do you support or oppose each of the following components of the bill?Helping states secure their election systems
DemographicStronglysupport
Somewhatsupport
Somewhatoppose
Stronglyoppose
Don’t know /No opinion Total N
Registered Voters 50% (1003) 28% (553) 6% (110) 4% (73) 13% (250) 1990Ethnicity: Hispanic 39% (77) 27% (54) 9% (17) 6% (11) 19% (37) 196Ethnicity: Black 42% (102) 27% (66) 8% (20) 3% (7) 20% (48) 243Ethnicity: Other 51% (83) 30% (49) 5% (8) 2% (3) 12% (20) 163All Christian 52% (499) 31% (298) 6% (59) 4% (35) 8% (72) 964All Non-Christian 54% (65) 27% (32) 2% (2) 5% (6) 12% (15) 121Atheist 49% (36) 27% (20) 6% (5) 3% (2) 15% (11) 73Agnostic/Nothing in particular 47% (231) 25% (125) 5% (26) 4% (22) 19% (92) 495Something Else 51% (172) 23% (78) 6% (19) 2% (8) 18% (60) 337Religious Non-Protestant/Catholic 54% (76) 26% (37) 3% (5) 4% (6) 12% (17) 140Evangelical 54% (298) 27% (149) 5% (30) 3% (15) 10% (55) 547Non-Evangelical 49% (356) 31% (220) 6% (45) 4% (26) 10% (74) 721Community: Urban 48% (256) 29% (156) 6% (34) 4% (20) 12% (63) 529Community: Suburban 52% (516) 26% (256) 6% (61) 4% (44) 12% (121) 998Community: Rural 50% (231) 30% (141) 3% (15) 2% (9) 14% (67) 464Employ: Private Sector 51% (320) 27% (168) 6% (37) 4% (27) 11% (69) 622Employ: Government 49% (63) 30% (39) 6% (8) 2% (3) 12% (15) 129Employ: Self-Employed 53% (84) 28% (43) 8% (13) 1% (2) 10% (15) 157Employ: Homemaker 46% (58) 25% (32) 6% (8) 3% (4) 19% (25) 127Employ: Retired 56% (323) 30% (176) 4% (21) 5% (28) 6% (33) 581Employ: Unemployed 43% (92) 25% (54) 7% (14) 2% (4) 23% (50) 215Employ: Other 38% (42) 25% (28) 5% (6) 4% (5) 28% (32) 113Military HH: Yes 56% (203) 28% (100) 7% (25) 4% (15) 5% (18) 361Military HH: No 49% (800) 28% (453) 5% (86) 4% (58) 14% (232) 1629RD/WT: Right Direction 49% (461) 30% (281) 6% (53) 3% (29) 13% (118) 941RD/WT: Wrong Track 52% (543) 26% (272) 6% (58) 4% (44) 13% (132) 1049Biden Job Approve 50% (522) 30% (306) 6% (66) 3% (31) 11% (112) 1037Biden Job Disapprove 54% (460) 27% (232) 5% (39) 5% (42) 10% (84) 857
Continued on next page
Page 198
198
Morning ConsultTable POL9_4
Table POL9_4: As you may know, Congress is debating a bill that addresses voter access, election security, campaign finance, and government ethics.Do you support or oppose each of the following components of the bill?Helping states secure their election systems
DemographicStronglysupport
Somewhatsupport
Somewhatoppose
Stronglyoppose
Don’t know /No opinion Total N
Registered Voters 50% (1003) 28% (553) 6% (110) 4% (73) 13% (250) 1990Biden Job Strongly Approve 56% (306) 28% (151) 5% (25) 3% (14) 9% (52) 548Biden Job Somewhat Approve 44% (217) 32% (155) 8% (41) 3% (16) 12% (60) 489Biden Job Somewhat Disapprove 47% (104) 36% (81) 5% (11) 2% (5) 10% (22) 223Biden Job Strongly Disapprove 56% (356) 24% (151) 4% (28) 6% (37) 10% (62) 634Favorable of Biden 51% (537) 30% (310) 6% (59) 3% (31) 11% (111) 1048Unfavorable of Biden 53% (451) 27% (228) 5% (47) 5% (42) 10% (87) 855Very Favorable of Biden 57% (337) 27% (159) 4% (26) 2% (14) 9% (56) 593Somewhat Favorable of Biden 44% (199) 33% (151) 7% (33) 4% (17) 12% (55) 455Somewhat Unfavorable of Biden 47% (89) 34% (66) 7% (13) 1% (2) 11% (21) 190Very Unfavorable of Biden 54% (362) 24% (162) 5% (34) 6% (40) 10% (66) 664#1 Issue: Economy 50% (379) 28% (213) 6% (45) 4% (28) 13% (99) 763#1 Issue: Security 57% (200) 24% (82) 4% (16) 4% (14) 11% (37) 349#1 Issue: Health Care 50% (116) 31% (72) 5% (12) 4% (10) 10% (23) 233#1 Issue: Medicare / Social Security 51% (133) 34% (89) 4% (11) 2% (4) 9% (23) 261#1 Issue: Women’s Issues 39% (40) 21% (22) 9% (10) 2% (2) 29% (30) 103#1 Issue: Education 42% (36) 30% (26) 9% (7) 9% (8) 10% (8) 86#1 Issue: Energy 47% (40) 23% (20) 5% (4) 2% (1) 24% (21) 86#1 Issue: Other 54% (59) 27% (30) 5% (5) 6% (6) 8% (9) 1092020 Vote: Joe Biden 51% (454) 30% (270) 6% (53) 4% (33) 10% (87) 8972020 Vote: Donald Trump 55% (454) 27% (217) 4% (36) 4% (34) 9% (77) 8182020 Vote: Didn’t Vote 32% (78) 23% (56) 9% (21) 2% (6) 33% (79) 2392018 House Vote: Democrat 53% (362) 31% (215) 5% (33) 3% (23) 8% (53) 6872018 House Vote: Republican 57% (392) 25% (174) 5% (35) 5% (32) 8% (56) 6902018 House Vote: Someone else 49% (24) 24% (12) 1% (1) — (0) 27% (13) 502016 Vote: Hillary Clinton 54% (342) 29% (180) 5% (31) 3% (19) 9% (59) 6312016 Vote: Donald Trump 55% (423) 27% (205) 4% (33) 5% (39) 9% (68) 7682016 Vote: Other 45% (49) 33% (36) 9% (10) 4% (4) 9% (9) 1072016 Vote: Didn’t Vote 39% (190) 27% (131) 8% (37) 2% (11) 24% (114) 483
Continued on next page
Page 199
National Tracking Poll #210636, June, 2021
199
Table POL9_4
Table POL9_4: As you may know, Congress is debating a bill that addresses voter access, election security, campaign finance, and government ethics.Do you support or oppose each of the following components of the bill?Helping states secure their election systems
DemographicStronglysupport
Somewhatsupport
Somewhatoppose
Stronglyoppose
Don’t know /No opinion Total N
Registered Voters 50% (1003) 28% (553) 6% (110) 4% (73) 13% (250) 1990Voted in 2014: Yes 55% (714) 28% (358) 5% (59) 4% (56) 8% (110) 1297Voted in 2014: No 42% (289) 28% (195) 7% (51) 2% (17) 20% (140) 6934-Region: Northeast 50% (173) 29% (100) 5% (16) 2% (8) 14% (48) 3444-Region: Midwest 52% (237) 29% (134) 6% (29) 3% (16) 9% (40) 4554-Region: South 50% (374) 27% (203) 6% (43) 4% (30) 14% (105) 7554-Region: West 51% (220) 27% (116) 5% (23) 4% (19) 13% (57) 435Party: Democrat/Leans Democrat 50% (445) 30% (270) 6% (51) 3% (28) 11% (94) 888Party: Republican/Leans Republican 54% (437) 26% (215) 5% (38) 5% (38) 10% (85) 814Note: Row proportions may total to larger than one-hundred percent due to rounding. For more information visit MorningConsultIntelligence.com.
Page 200
200
Morning ConsultTable POL9_5
Table POL9_5: As you may know, Congress is debating a bill that addresses voter access, election security, campaign finance, and government ethics.Do you support or oppose each of the following components of the bill?Requiring candidates for President and Vice President to provide their tax returns from the previous 10 years
DemographicStronglysupport
Somewhatsupport
Somewhatoppose
Stronglyoppose
Don’t know /No opinion Total N
Registered Voters 40% (798) 22% (438) 10% (201) 10% (205) 17% (348) 1990Gender: Male 39% (358) 24% (219) 11% (100) 12% (116) 15% (135) 927Gender: Female 41% (440) 21% (220) 9% (101) 8% (89) 20% (213) 1063Age: 18-34 33% (152) 25% (114) 10% (44) 9% (39) 24% (108) 456Age: 35-44 41% (124) 24% (72) 8% (25) 6% (17) 21% (62) 300Age: 45-64 39% (283) 21% (156) 9% (66) 13% (91) 18% (133) 730Age: 65+ 48% (239) 19% (96) 13% (66) 12% (58) 9% (44) 504GenZers: 1997-2012 29% (49) 19% (32) 10% (17) 10% (16) 33% (55) 169Millennials: 1981-1996 37% (178) 28% (132) 9% (42) 7% (33) 20% (95) 480GenXers: 1965-1980 40% (211) 23% (120) 8% (40) 11% (57) 19% (97) 525Baby Boomers: 1946-1964 44% (325) 19% (145) 13% (97) 11% (84) 13% (94) 746PID: Dem (no lean) 61% (461) 22% (164) 4% (34) 2% (15) 10% (78) 752PID: Ind (no lean) 35% (199) 22% (126) 10% (56) 11% (66) 23% (130) 578PID: Rep (no lean) 21% (138) 22% (149) 17% (111) 19% (124) 21% (139) 661PID/Gender: DemMen 60% (214) 25% (88) 6% (20) 2% (7) 8% (29) 359PID/Gender: DemWomen 63% (247) 19% (76) 3% (14) 2% (7) 13% (49) 393PID/Gender: Ind Men 33% (87) 21% (55) 12% (33) 15% (41) 19% (51) 267PID/Gender: Ind Women 36% (112) 23% (71) 8% (24) 8% (25) 25% (79) 311PID/Gender: Rep Men 19% (56) 25% (76) 16% (48) 22% (67) 18% (54) 301PID/Gender: Rep Women 23% (81) 20% (73) 18% (63) 16% (57) 24% (85) 360Ideo: Liberal (1-3) 65% (383) 19% (112) 4% (24) 2% (10) 10% (59) 587Ideo: Moderate (4) 44% (238) 25% (133) 9% (46) 6% (30) 17% (91) 539Ideo: Conservative (5-7) 21% (153) 24% (177) 17% (124) 21% (157) 18% (131) 742Educ: < College 35% (426) 22% (271) 10% (121) 10% (127) 22% (267) 1213Educ: Bachelors degree 46% (226) 22% (108) 11% (53) 10% (50) 11% (52) 489Educ: Post-grad 51% (146) 21% (60) 9% (26) 10% (28) 10% (28) 288Income: Under 50k 39% (391) 21% (207) 10% (100) 9% (90) 21% (203) 991Income: 50k-100k 38% (246) 25% (157) 10% (65) 11% (72) 16% (100) 640Income: 100k+ 45% (161) 21% (75) 10% (37) 12% (42) 12% (44) 359Ethnicity: White 39% (620) 21% (335) 11% (170) 11% (182) 17% (277) 1584
Continued on next page
Page 201
National Tracking Poll #210636, June, 2021
201
Table POL9_5
Table POL9_5: As you may know, Congress is debating a bill that addresses voter access, election security, campaign finance, and government ethics.Do you support or oppose each of the following components of the bill?Requiring candidates for President and Vice President to provide their tax returns from the previous 10 years
DemographicStronglysupport
Somewhatsupport
Somewhatoppose
Stronglyoppose
Don’t know /No opinion Total N
Registered Voters 40% (798) 22% (438) 10% (201) 10% (205) 17% (348) 1990Ethnicity: Hispanic 38% (74) 22% (42) 10% (19) 8% (16) 23% (44) 196Ethnicity: Black 46% (111) 24% (59) 8% (20) 4% (10) 18% (43) 243Ethnicity: Other 41% (66) 27% (45) 7% (12) 8% (14) 17% (27) 163All Christian 36% (350) 24% (235) 12% (114) 13% (122) 15% (143) 964All Non-Christian 60% (72) 15% (19) 9% (11) 7% (8) 9% (11) 121Atheist 44% (32) 24% (17) 10% (7) 5% (4) 17% (13) 73Agnostic/Nothing in particular 42% (207) 20% (101) 9% (43) 9% (45) 20% (99) 495Something Else 41% (136) 20% (66) 8% (26) 8% (26) 24% (82) 337Religious Non-Protestant/Catholic 55% (77) 18% (25) 10% (14) 8% (11) 10% (14) 140Evangelical 31% (170) 24% (131) 11% (58) 15% (85) 19% (104) 547Non-Evangelical 42% (304) 22% (161) 11% (79) 8% (60) 16% (117) 721Community: Urban 47% (247) 25% (132) 8% (42) 7% (35) 14% (74) 529Community: Suburban 40% (395) 21% (206) 11% (107) 12% (117) 17% (173) 998Community: Rural 34% (156) 22% (100) 11% (52) 12% (54) 22% (101) 464Employ: Private Sector 43% (267) 22% (135) 9% (57) 10% (63) 16% (100) 622Employ: Government 39% (51) 25% (32) 9% (11) 13% (17) 14% (18) 129Employ: Self-Employed 41% (64) 22% (35) 11% (17) 9% (14) 18% (28) 157Employ: Homemaker 26% (33) 26% (33) 12% (15) 9% (12) 27% (34) 127Employ: Retired 44% (257) 19% (112) 13% (77) 13% (78) 10% (58) 581Employ: Unemployed 32% (69) 27% (57) 7% (15) 4% (9) 30% (65) 215Employ: Other 38% (43) 24% (27) 4% (5) 8% (10) 25% (28) 113Military HH: Yes 38% (137) 21% (77) 11% (40) 16% (58) 14% (49) 361Military HH: No 41% (661) 22% (361) 10% (161) 9% (147) 18% (298) 1629RD/WT: Right Direction 58% (546) 22% (211) 5% (45) 2% (23) 12% (116) 941RD/WT: Wrong Track 24% (252) 22% (228) 15% (156) 17% (182) 22% (231) 1049Biden Job Approve 60% (621) 23% (242) 5% (49) 2% (22) 10% (103) 1037Biden Job Disapprove 19% (166) 22% (186) 17% (147) 20% (174) 21% (184) 857
Continued on next page
Page 202
202
Morning ConsultTable POL9_5
Table POL9_5: As you may know, Congress is debating a bill that addresses voter access, election security, campaign finance, and government ethics.Do you support or oppose each of the following components of the bill?Requiring candidates for President and Vice President to provide their tax returns from the previous 10 years
DemographicStronglysupport
Somewhatsupport
Somewhatoppose
Stronglyoppose
Don’t know /No opinion Total N
Registered Voters 40% (798) 22% (438) 10% (201) 10% (205) 17% (348) 1990Biden Job Strongly Approve 70% (386) 17% (93) 4% (24) 1% (7) 7% (38) 548Biden Job Somewhat Approve 48% (235) 30% (148) 5% (24) 3% (15) 13% (66) 489Biden Job Somewhat Disapprove 33% (73) 26% (57) 13% (29) 7% (15) 22% (49) 223Biden Job Strongly Disapprove 15% (93) 20% (129) 19% (118) 25% (159) 21% (135) 634Favorable of Biden 60% (629) 23% (241) 4% (45) 2% (21) 11% (112) 1048Unfavorable of Biden 18% (151) 22% (191) 18% (153) 21% (175) 22% (184) 855Very Favorable of Biden 70% (416) 17% (100) 4% (22) 2% (10) 8% (45) 593Somewhat Favorable of Biden 47% (213) 31% (141) 5% (23) 2% (11) 15% (68) 455Somewhat Unfavorable of Biden 31% (59) 27% (51) 15% (28) 7% (13) 21% (40) 190Very Unfavorable of Biden 14% (92) 21% (141) 19% (125) 25% (163) 22% (144) 664#1 Issue: Economy 34% (261) 24% (181) 12% (89) 11% (87) 19% (145) 763#1 Issue: Security 24% (83) 20% (69) 16% (55) 20% (68) 21% (74) 349#1 Issue: Health Care 53% (123) 26% (61) 8% (18) 5% (12) 8% (20) 233#1 Issue: Medicare / Social Security 55% (143) 19% (50) 6% (16) 6% (16) 14% (35) 261#1 Issue: Women’s Issues 50% (52) 19% (19) 5% (5) 4% (4) 22% (23) 103#1 Issue: Education 42% (36) 25% (21) 8% (7) 9% (8) 16% (14) 86#1 Issue: Energy 47% (40) 24% (21) 5% (4) 3% (2) 21% (18) 86#1 Issue: Other 54% (59) 15% (16) 7% (8) 7% (7) 17% (19) 1092020 Vote: Joe Biden 64% (578) 21% (190) 5% (41) 2% (20) 8% (69) 8972020 Vote: Donald Trump 18% (144) 23% (187) 17% (139) 20% (165) 22% (183) 8182020 Vote: Didn’t Vote 26% (63) 23% (54) 8% (20) 6% (15) 37% (88) 2392018 House Vote: Democrat 69% (475) 19% (131) 4% (25) 2% (12) 6% (44) 6872018 House Vote: Republican 21% (143) 22% (150) 18% (121) 22% (151) 18% (126) 6902018 House Vote: Someone else 39% (19) 18% (9) 5% (3) 4% (2) 33% (17) 502016 Vote: Hillary Clinton 68% (430) 18% (116) 3% (21) 2% (13) 8% (51) 6312016 Vote: Donald Trump 20% (157) 24% (181) 17% (133) 20% (151) 19% (146) 7682016 Vote: Other 48% (51) 21% (23) 12% (12) 6% (6) 14% (15) 1072016 Vote: Didn’t Vote 33% (160) 25% (119) 7% (34) 7% (35) 28% (136) 483
Continued on next page
Page 203
National Tracking Poll #210636, June, 2021
203
Table POL9_5
Table POL9_5: As you may know, Congress is debating a bill that addresses voter access, election security, campaign finance, and government ethics.Do you support or oppose each of the following components of the bill?Requiring candidates for President and Vice President to provide their tax returns from the previous 10 years
DemographicStronglysupport
Somewhatsupport
Somewhatoppose
Stronglyoppose
Don’t know /No opinion Total N
Registered Voters 40% (798) 22% (438) 10% (201) 10% (205) 17% (348) 1990Voted in 2014: Yes 45% (582) 20% (263) 11% (139) 12% (154) 12% (159) 1297Voted in 2014: No 31% (216) 25% (175) 9% (62) 7% (51) 27% (188) 6934-Region: Northeast 46% (159) 24% (81) 8% (28) 8% (26) 15% (51) 3444-Region: Midwest 42% (192) 22% (100) 9% (43) 11% (50) 16% (71) 4554-Region: South 37% (277) 22% (169) 11% (85) 11% (84) 19% (141) 7554-Region: West 39% (171) 20% (88) 11% (46) 11% (46) 20% (85) 435Party: Democrat/Leans Democrat 62% (551) 22% (199) 4% (36) 2% (17) 10% (86) 888Party: Republican/Leans Republican 19% (158) 22% (182) 17% (141) 20% (160) 21% (173) 814Note: Row proportions may total to larger than one-hundred percent due to rounding. For more information visit MorningConsultIntelligence.com.
Page 204
204
Morning ConsultTable POL9_6
Table POL9_6: As you may know, Congress is debating a bill that addresses voter access, election security, campaign finance, and government ethics.Do you support or oppose each of the following components of the bill?Requiring states to establish independent commissions to carry out congressional redistricting
DemographicStronglysupport
Somewhatsupport
Somewhatoppose
Stronglyoppose
Don’t know /No opinion Total N
Registered Voters 25% (489) 27% (529) 10% (192) 8% (164) 31% (616) 1990Gender: Male 29% (268) 31% (286) 9% (82) 8% (76) 23% (216) 927Gender: Female 21% (221) 23% (243) 10% (109) 8% (88) 38% (401) 1063Age: 18-34 18% (84) 28% (126) 10% (44) 7% (33) 37% (169) 456Age: 35-44 27% (80) 26% (79) 6% (18) 4% (13) 37% (111) 300Age: 45-64 22% (160) 24% (179) 9% (69) 11% (78) 33% (244) 730Age: 65+ 33% (166) 29% (146) 12% (60) 8% (40) 18% (92) 504GenZers: 1997-2012 14% (23) 22% (37) 11% (19) 5% (9) 48% (81) 169Millennials: 1981-1996 24% (114) 30% (143) 7% (34) 6% (31) 33% (158) 480GenXers: 1965-1980 22% (117) 26% (137) 9% (47) 7% (38) 35% (186) 525Baby Boomers: 1946-1964 28% (212) 26% (196) 11% (82) 11% (81) 23% (175) 746PID: Dem (no lean) 35% (262) 27% (201) 9% (71) 4% (28) 25% (190) 752PID: Ind (no lean) 19% (110) 26% (152) 9% (52) 10% (57) 36% (208) 578PID: Rep (no lean) 18% (118) 27% (177) 10% (68) 12% (79) 33% (219) 661PID/Gender: DemMen 42% (151) 28% (102) 8% (30) 3% (11) 18% (65) 359PID/Gender: DemWomen 28% (111) 25% (99) 10% (41) 4% (17) 32% (125) 393PID/Gender: Ind Men 23% (61) 33% (89) 9% (24) 9% (24) 26% (70) 267PID/Gender: Ind Women 16% (49) 20% (63) 9% (28) 11% (33) 44% (138) 311PID/Gender: Rep Men 18% (56) 32% (95) 9% (28) 14% (41) 27% (81) 301PID/Gender: Rep Women 17% (62) 23% (82) 11% (40) 11% (38) 38% (138) 360Ideo: Liberal (1-3) 39% (228) 25% (148) 8% (48) 4% (24) 24% (140) 587Ideo: Moderate (4) 24% (128) 28% (153) 10% (54) 7% (37) 31% (167) 539Ideo: Conservative (5-7) 17% (124) 29% (212) 11% (80) 13% (98) 31% (228) 742Educ: < College 19% (235) 25% (307) 10% (125) 8% (101) 37% (445) 1213Educ: Bachelors degree 31% (150) 28% (137) 9% (42) 8% (40) 25% (120) 489Educ: Post-grad 36% (105) 30% (86) 9% (25) 8% (22) 18% (51) 288Income: Under 50k 22% (214) 26% (255) 10% (100) 8% (78) 35% (344) 991Income: 50k-100k 24% (156) 28% (180) 11% (69) 8% (48) 29% (186) 640Income: 100k+ 33% (119) 26% (94) 6% (23) 10% (38) 24% (85) 359Ethnicity: White 25% (394) 26% (409) 9% (149) 9% (139) 31% (494) 1584
Continued on next page
Page 205
National Tracking Poll #210636, June, 2021
205
Table POL9_6
Table POL9_6: As you may know, Congress is debating a bill that addresses voter access, election security, campaign finance, and government ethics.Do you support or oppose each of the following components of the bill?Requiring states to establish independent commissions to carry out congressional redistricting
DemographicStronglysupport
Somewhatsupport
Somewhatoppose
Stronglyoppose
Don’t know /No opinion Total N
Registered Voters 25% (489) 27% (529) 10% (192) 8% (164) 31% (616) 1990Ethnicity: Hispanic 18% (35) 34% (67) 10% (19) 5% (10) 33% (65) 196Ethnicity: Black 23% (57) 30% (72) 10% (25) 8% (18) 29% (71) 243Ethnicity: Other 24% (38) 30% (49) 11% (17) 4% (7) 32% (52) 163All Christian 23% (223) 29% (279) 11% (110) 9% (90) 27% (262) 964All Non-Christian 39% (47) 27% (33) 4% (5) 4% (4) 26% (31) 121Atheist 30% (22) 19% (14) 9% (7) 4% (3) 38% (28) 73Agnostic/Nothing in particular 25% (125) 25% (125) 7% (35) 8% (40) 34% (171) 495Something Else 21% (72) 23% (78) 10% (35) 8% (27) 37% (125) 337Religious Non-Protestant/Catholic 36% (50) 26% (36) 6% (8) 4% (6) 28% (40) 140Evangelical 20% (112) 27% (150) 9% (52) 11% (59) 32% (174) 547Non-Evangelical 25% (179) 28% (199) 12% (86) 8% (55) 28% (201) 721Community: Urban 31% (164) 31% (163) 9% (46) 5% (25) 25% (131) 529Community: Suburban 23% (230) 25% (253) 9% (89) 10% (102) 32% (324) 998Community: Rural 21% (96) 25% (114) 12% (56) 8% (36) 35% (161) 464Employ: Private Sector 23% (144) 29% (183) 9% (57) 9% (53) 30% (185) 622Employ: Government 25% (32) 30% (38) 12% (15) 5% (6) 29% (37) 129Employ: Self-Employed 33% (51) 28% (44) 7% (11) 11% (17) 22% (35) 157Employ: Homemaker 21% (27) 22% (28) 7% (8) 7% (9) 43% (54) 127Employ: Retired 28% (164) 27% (155) 11% (64) 10% (58) 24% (141) 581Employ: Unemployed 23% (49) 21% (46) 9% (20) 7% (15) 39% (84) 215Employ: Other 12% (14) 24% (27) 12% (14) 4% (5) 48% (54) 113Military HH: Yes 26% (95) 27% (96) 10% (38) 12% (43) 25% (89) 361Military HH: No 24% (394) 27% (433) 9% (154) 7% (121) 32% (527) 1629RD/WT: Right Direction 34% (323) 26% (243) 9% (81) 5% (50) 26% (244) 941RD/WT: Wrong Track 16% (166) 27% (286) 11% (111) 11% (114) 36% (372) 1049Biden Job Approve 35% (360) 26% (272) 9% (95) 5% (52) 25% (258) 1037Biden Job Disapprove 15% (128) 28% (241) 11% (93) 12% (105) 34% (290) 857
Continued on next page
Page 206
206
Morning ConsultTable POL9_6
Table POL9_6: As you may know, Congress is debating a bill that addresses voter access, election security, campaign finance, and government ethics.Do you support or oppose each of the following components of the bill?Requiring states to establish independent commissions to carry out congressional redistricting
DemographicStronglysupport
Somewhatsupport
Somewhatoppose
Stronglyoppose
Don’t know /No opinion Total N
Registered Voters 25% (489) 27% (529) 10% (192) 8% (164) 31% (616) 1990Biden Job Strongly Approve 44% (240) 22% (119) 8% (43) 5% (28) 22% (119) 548Biden Job Somewhat Approve 25% (120) 31% (153) 11% (52) 5% (25) 28% (139) 489Biden Job Somewhat Disapprove 14% (32) 33% (74) 12% (26) 4% (8) 37% (83) 223Biden Job Strongly Disapprove 15% (95) 26% (167) 11% (67) 15% (97) 33% (208) 634Favorable of Biden 34% (356) 27% (284) 9% (92) 5% (54) 25% (263) 1048Unfavorable of Biden 15% (128) 28% (240) 11% (92) 12% (106) 34% (289) 855Very Favorable of Biden 42% (248) 23% (134) 8% (46) 6% (34) 22% (130) 593Somewhat Favorable of Biden 24% (108) 33% (150) 10% (45) 4% (20) 29% (133) 455Somewhat Unfavorable of Biden 16% (30) 32% (61) 13% (25) 5% (10) 34% (65) 190Very Unfavorable of Biden 15% (98) 27% (179) 10% (67) 14% (95) 34% (225) 664#1 Issue: Economy 20% (151) 29% (219) 11% (82) 8% (62) 33% (250) 763#1 Issue: Security 19% (67) 27% (94) 8% (29) 12% (43) 33% (115) 349#1 Issue: Health Care 34% (80) 28% (66) 10% (23) 6% (15) 21% (50) 233#1 Issue: Medicare / Social Security 30% (77) 25% (66) 11% (30) 6% (15) 28% (73) 261#1 Issue: Women’s Issues 27% (27) 15% (15) 7% (8) 6% (6) 45% (46) 103#1 Issue: Education 26% (22) 28% (24) 8% (7) 9% (7) 29% (25) 86#1 Issue: Energy 34% (29) 27% (23) 8% (6) 4% (3) 28% (24) 86#1 Issue: Other 33% (36) 20% (22) 6% (6) 11% (12) 30% (33) 1092020 Vote: Joe Biden 36% (321) 27% (238) 9% (76) 6% (51) 24% (211) 8972020 Vote: Donald Trump 16% (128) 27% (221) 11% (94) 12% (101) 34% (275) 8182020 Vote: Didn’t Vote 14% (35) 26% (62) 8% (19) 4% (10) 48% (114) 2392018 House Vote: Democrat 38% (261) 26% (181) 9% (60) 6% (42) 21% (143) 6872018 House Vote: Republican 18% (128) 29% (201) 10% (70) 13% (87) 30% (204) 6902018 House Vote: Someone else 27% (14) 21% (11) 5% (3) 4% (2) 42% (21) 502016 Vote: Hillary Clinton 38% (239) 25% (159) 9% (59) 5% (32) 23% (142) 6312016 Vote: Donald Trump 17% (134) 29% (223) 10% (78) 13% (102) 30% (231) 7682016 Vote: Other 33% (36) 26% (28) 9% (9) 5% (6) 27% (29) 1072016 Vote: Didn’t Vote 17% (80) 25% (120) 9% (45) 5% (24) 44% (214) 483
Continued on next page
Page 207
National Tracking Poll #210636, June, 2021
207
Table POL9_6
Table POL9_6: As you may know, Congress is debating a bill that addresses voter access, election security, campaign finance, and government ethics.Do you support or oppose each of the following components of the bill?Requiring states to establish independent commissions to carry out congressional redistricting
DemographicStronglysupport
Somewhatsupport
Somewhatoppose
Stronglyoppose
Don’t know /No opinion Total N
Registered Voters 25% (489) 27% (529) 10% (192) 8% (164) 31% (616) 1990Voted in 2014: Yes 29% (373) 26% (341) 10% (125) 10% (124) 26% (335) 1297Voted in 2014: No 17% (116) 27% (188) 10% (67) 6% (40) 41% (282) 6934-Region: Northeast 27% (93) 29% (100) 11% (39) 4% (13) 28% (98) 3444-Region: Midwest 26% (119) 25% (114) 10% (46) 10% (47) 28% (130) 4554-Region: South 22% (168) 26% (199) 9% (69) 9% (65) 34% (254) 7554-Region: West 25% (109) 27% (116) 8% (37) 9% (38) 31% (135) 435Party: Democrat/Leans Democrat 35% (310) 27% (237) 9% (80) 4% (36) 25% (226) 888Party: Republican/Leans Republican 17% (135) 27% (220) 10% (81) 12% (99) 34% (279) 814Note: Row proportions may total to larger than one-hundred percent due to rounding. For more information visit MorningConsultIntelligence.com.
Page 208
208
Morning ConsultTable POL9_7
Table POL9_7: As you may know, Congress is debating a bill that addresses voter access, election security, campaign finance, and government ethics.Do you support or oppose each of the following components of the bill?Requiring groups that purchase political advertisements to disclose their top donors and chief officials in text as part of the ad
DemographicStronglysupport
Somewhatsupport
Somewhatoppose
Stronglyoppose
Don’t know /No opinion Total N
Registered Voters 43% (864) 27% (544) 7% (134) 4% (80) 19% (369) 1990Gender: Male 46% (422) 28% (258) 7% (69) 5% (43) 15% (135) 927Gender: Female 42% (442) 27% (286) 6% (65) 3% (37) 22% (233) 1063Age: 18-34 32% (146) 26% (118) 9% (43) 4% (19) 28% (130) 456Age: 35-44 42% (125) 24% (73) 7% (22) 5% (14) 22% (65) 300Age: 45-64 44% (323) 28% (203) 6% (46) 4% (28) 18% (130) 730Age: 65+ 54% (270) 30% (149) 5% (23) 4% (18) 9% (43) 504GenZers: 1997-2012 24% (41) 25% (43) 11% (18) 2% (4) 37% (63) 169Millennials: 1981-1996 39% (186) 25% (120) 9% (41) 5% (23) 23% (109) 480GenXers: 1965-1980 42% (218) 27% (140) 7% (35) 4% (22) 21% (110) 525Baby Boomers: 1946-1964 51% (380) 30% (226) 5% (34) 4% (28) 10% (78) 746PID: Dem (no lean) 51% (386) 26% (195) 6% (41) 2% (17) 15% (112) 752PID: Ind (no lean) 41% (237) 25% (146) 7% (41) 3% (19) 23% (134) 578PID: Rep (no lean) 36% (241) 31% (203) 8% (51) 7% (44) 18% (122) 661PID/Gender: DemMen 53% (191) 26% (93) 7% (24) 2% (7) 12% (43) 359PID/Gender: DemWomen 50% (195) 26% (102) 4% (17) 2% (10) 18% (69) 393PID/Gender: Ind Men 45% (119) 26% (69) 7% (19) 4% (11) 19% (50) 267PID/Gender: Ind Women 38% (118) 25% (77) 7% (22) 3% (9) 27% (85) 311PID/Gender: Rep Men 37% (112) 32% (96) 9% (26) 8% (25) 14% (42) 301PID/Gender: Rep Women 36% (129) 30% (107) 7% (26) 5% (18) 22% (79) 360Ideo: Liberal (1-3) 56% (331) 22% (128) 6% (33) 4% (21) 13% (74) 587Ideo: Moderate (4) 40% (218) 28% (152) 7% (37) 3% (18) 21% (115) 539Ideo: Conservative (5-7) 40% (294) 33% (247) 8% (58) 5% (38) 14% (106) 742Educ: < College 38% (459) 26% (315) 8% (95) 4% (47) 24% (296) 1213Educ: Bachelors degree 50% (245) 31% (151) 5% (24) 3% (17) 10% (51) 489Educ: Post-grad 55% (159) 27% (78) 5% (14) 5% (15) 8% (22) 288Income: Under 50k 39% (383) 26% (255) 8% (77) 5% (46) 23% (230) 991Income: 50k-100k 44% (283) 31% (195) 7% (42) 3% (17) 16% (103) 640Income: 100k+ 55% (198) 26% (93) 4% (15) 5% (17) 10% (36) 359Ethnicity: White 45% (721) 27% (428) 6% (98) 5% (71) 17% (266) 1584
Continued on next page
Page 209
National Tracking Poll #210636, June, 2021
209
Table POL9_7
Table POL9_7: As you may know, Congress is debating a bill that addresses voter access, election security, campaign finance, and government ethics.Do you support or oppose each of the following components of the bill?Requiring groups that purchase political advertisements to disclose their top donors and chief officials in text as part of the ad
DemographicStronglysupport
Somewhatsupport
Somewhatoppose
Stronglyoppose
Don’t know /No opinion Total N
Registered Voters 43% (864) 27% (544) 7% (134) 4% (80) 19% (369) 1990Ethnicity: Hispanic 34% (66) 28% (54) 12% (24) 2% (4) 24% (47) 196Ethnicity: Black 35% (85) 26% (63) 8% (19) 2% (5) 29% (71) 243Ethnicity: Other 36% (59) 32% (53) 10% (16) 2% (3) 20% (32) 163All Christian 43% (415) 31% (303) 7% (66) 4% (41) 14% (139) 964All Non-Christian 53% (64) 23% (28) 4% (4) 4% (5) 17% (20) 121Atheist 49% (36) 27% (20) 13% (9) 2% (1) 9% (7) 73Agnostic/Nothing in particular 43% (213) 22% (110) 7% (33) 3% (17) 25% (122) 495Something Else 41% (137) 25% (82) 6% (21) 5% (16) 24% (81) 337Religious Non-Protestant/Catholic 50% (70) 24% (34) 6% (8) 3% (5) 17% (24) 140Evangelical 41% (225) 29% (161) 7% (39) 6% (33) 16% (90) 547Non-Evangelical 44% (315) 30% (216) 6% (42) 3% (24) 17% (124) 721Community: Urban 42% (224) 29% (152) 8% (42) 3% (18) 18% (94) 529Community: Suburban 45% (450) 28% (282) 5% (47) 4% (40) 18% (179) 998Community: Rural 41% (191) 24% (110) 10% (45) 5% (22) 21% (96) 464Employ: Private Sector 44% (271) 29% (182) 8% (48) 4% (27) 15% (92) 622Employ: Government 46% (59) 24% (31) 8% (10) 3% (4) 19% (25) 129Employ: Self-Employed 47% (74) 19% (30) 10% (16) 6% (10) 17% (26) 157Employ: Homemaker 34% (44) 34% (43) 4% (5) 3% (4) 24% (31) 127Employ: Retired 51% (297) 29% (171) 5% (27) 5% (27) 10% (59) 581Employ: Unemployed 33% (70) 25% (54) 6% (12) 2% (4) 34% (74) 215Employ: Other 30% (33) 21% (24) 9% (11) 1% (1) 39% (44) 113Military HH: Yes 48% (172) 28% (101) 7% (24) 6% (20) 12% (44) 361Military HH: No 42% (692) 27% (443) 7% (109) 4% (60) 20% (325) 1629RD/WT: Right Direction 50% (470) 27% (252) 5% (47) 2% (23) 16% (149) 941RD/WT: Wrong Track 38% (394) 28% (292) 8% (87) 5% (57) 21% (219) 1049Biden Job Approve 52% (534) 27% (282) 5% (50) 2% (23) 14% (147) 1037Biden Job Disapprove 37% (319) 29% (252) 9% (75) 6% (53) 18% (158) 857
Continued on next page
Page 210
210
Morning ConsultTable POL9_7
Table POL9_7: As you may know, Congress is debating a bill that addresses voter access, election security, campaign finance, and government ethics.Do you support or oppose each of the following components of the bill?Requiring groups that purchase political advertisements to disclose their top donors and chief officials in text as part of the ad
DemographicStronglysupport
Somewhatsupport
Somewhatoppose
Stronglyoppose
Don’t know /No opinion Total N
Registered Voters 43% (864) 27% (544) 7% (134) 4% (80) 19% (369) 1990Biden Job Strongly Approve 61% (337) 22% (122) 5% (25) 1% (7) 10% (57) 548Biden Job Somewhat Approve 40% (197) 33% (160) 5% (25) 3% (17) 18% (90) 489Biden Job Somewhat Disapprove 36% (81) 31% (70) 10% (23) 4% (8) 19% (41) 223Biden Job Strongly Disapprove 38% (238) 29% (183) 8% (51) 7% (45) 18% (117) 634Favorable of Biden 52% (547) 27% (278) 5% (47) 2% (23) 15% (153) 1048Unfavorable of Biden 36% (305) 30% (255) 9% (80) 6% (55) 19% (159) 855Very Favorable of Biden 61% (361) 23% (135) 5% (29) 1% (8) 10% (60) 593Somewhat Favorable of Biden 41% (186) 31% (143) 4% (18) 3% (15) 20% (93) 455Somewhat Unfavorable of Biden 33% (62) 35% (66) 10% (20) 3% (7) 19% (36) 190Very Unfavorable of Biden 37% (243) 28% (189) 9% (61) 7% (48) 19% (124) 664#1 Issue: Economy 38% (292) 30% (227) 8% (59) 4% (28) 21% (158) 763#1 Issue: Security 41% (143) 25% (89) 6% (22) 6% (22) 21% (74) 349#1 Issue: Health Care 53% (123) 24% (55) 9% (22) 2% (5) 12% (29) 233#1 Issue: Medicare / Social Security 51% (134) 30% (78) 2% (6) 5% (12) 12% (31) 261#1 Issue: Women’s Issues 41% (42) 18% (18) 9% (9) 2% (2) 30% (31) 103#1 Issue: Education 34% (29) 31% (26) 12% (11) 5% (4) 18% (15) 86#1 Issue: Energy 46% (40) 23% (20) 3% (2) 3% (2) 25% (22) 86#1 Issue: Other 57% (63) 29% (31) 3% (4) 3% (3) 8% (9) 1092020 Vote: Joe Biden 55% (495) 26% (234) 5% (47) 2% (16) 12% (104) 8972020 Vote: Donald Trump 35% (289) 31% (257) 8% (65) 6% (52) 19% (155) 8182020 Vote: Didn’t Vote 27% (64) 19% (45) 9% (21) 4% (10) 42% (100) 2392018 House Vote: Democrat 59% (403) 24% (166) 5% (31) 2% (17) 10% (70) 6872018 House Vote: Republican 40% (278) 33% (230) 6% (44) 5% (36) 15% (102) 6902018 House Vote: Someone else 42% (21) 9% (4) 5% (2) 2% (1) 43% (21) 502016 Vote: Hillary Clinton 58% (366) 24% (152) 4% (26) 2% (14) 12% (74) 6312016 Vote: Donald Trump 40% (305) 32% (246) 7% (51) 5% (40) 17% (127) 7682016 Vote: Other 45% (48) 19% (20) 12% (13) 7% (8) 17% (18) 1072016 Vote: Didn’t Vote 30% (146) 26% (126) 9% (44) 4% (18) 31% (150) 483
Continued on next page
Page 211
National Tracking Poll #210636, June, 2021
211
Table POL9_7
Table POL9_7: As you may know, Congress is debating a bill that addresses voter access, election security, campaign finance, and government ethics.Do you support or oppose each of the following components of the bill?Requiring groups that purchase political advertisements to disclose their top donors and chief officials in text as part of the ad
DemographicStronglysupport
Somewhatsupport
Somewhatoppose
Stronglyoppose
Don’t know /No opinion Total N
Registered Voters 43% (864) 27% (544) 7% (134) 4% (80) 19% (369) 1990Voted in 2014: Yes 50% (651) 28% (358) 6% (77) 4% (51) 12% (161) 1297Voted in 2014: No 31% (213) 27% (186) 8% (57) 4% (29) 30% (207) 6934-Region: Northeast 41% (142) 33% (114) 6% (22) 3% (12) 16% (54) 3444-Region: Midwest 47% (215) 26% (121) 6% (28) 3% (15) 17% (76) 4554-Region: South 42% (316) 27% (201) 6% (48) 4% (33) 21% (157) 7554-Region: West 44% (191) 25% (109) 8% (35) 5% (20) 19% (81) 435Party: Democrat/Leans Democrat 53% (470) 26% (230) 5% (46) 2% (19) 14% (124) 888Party: Republican/Leans Republican 37% (297) 32% (257) 7% (57) 6% (49) 19% (153) 814Note: Row proportions may total to larger than one-hundred percent due to rounding. For more information visit MorningConsultIntelligence.com.
Page 212
212
Morning ConsultTable POL9_8
Table POL9_8: As you may know, Congress is debating a bill that addresses voter access, election security, campaign finance, and government ethics.Do you support or oppose each of the following components of the bill?Establishing voluntary small donor public financing for House of Representatives elections
DemographicStronglysupport
Somewhatsupport
Somewhatoppose
Stronglyoppose
Don’t know /No opinion Total N
Registered Voters 13% (264) 23% (463) 11% (228) 12% (239) 40% (797) 1990Gender: Male 16% (149) 29% (269) 10% (94) 13% (120) 32% (295) 927Gender: Female 11% (115) 18% (194) 13% (133) 11% (119) 47% (502) 1063Age: 18-34 18% (83) 26% (120) 11% (51) 5% (23) 39% (178) 456Age: 35-44 16% (48) 23% (69) 8% (25) 8% (25) 45% (134) 300Age: 45-64 10% (75) 22% (161) 11% (79) 16% (117) 41% (299) 730Age: 65+ 12% (59) 22% (113) 14% (73) 15% (74) 37% (186) 504GenZers: 1997-2012 15% (25) 25% (42) 11% (18) 3% (5) 47% (79) 169Millennials: 1981-1996 19% (92) 25% (119) 10% (48) 7% (32) 39% (188) 480GenXers: 1965-1980 11% (59) 24% (127) 11% (56) 12% (65) 41% (218) 525Baby Boomers: 1946-1964 11% (81) 21% (155) 13% (99) 16% (123) 39% (287) 746PID: Dem (no lean) 20% (152) 30% (224) 9% (70) 7% (49) 34% (257) 752PID: Ind (no lean) 9% (53) 20% (115) 13% (72) 13% (73) 46% (264) 578PID: Rep (no lean) 9% (59) 19% (123) 13% (86) 18% (117) 42% (276) 661PID/Gender: DemMen 27% (97) 36% (130) 8% (28) 5% (17) 24% (87) 359PID/Gender: DemWomen 14% (55) 24% (94) 10% (41) 8% (32) 43% (170) 393PID/Gender: Ind Men 9% (24) 27% (73) 11% (29) 14% (36) 39% (106) 267PID/Gender: Ind Women 9% (29) 14% (43) 14% (43) 12% (36) 51% (159) 311PID/Gender: Rep Men 10% (29) 22% (66) 12% (37) 22% (66) 34% (103) 301PID/Gender: Rep Women 8% (30) 16% (57) 14% (49) 14% (51) 48% (173) 360Ideo: Liberal (1-3) 21% (122) 29% (170) 10% (57) 7% (38) 34% (201) 587Ideo: Moderate (4) 13% (68) 26% (142) 12% (62) 9% (51) 40% (216) 539Ideo: Conservative (5-7) 9% (67) 19% (138) 13% (98) 19% (141) 40% (298) 742Educ: < College 12% (144) 21% (252) 11% (136) 11% (137) 45% (544) 1213Educ: Bachelors degree 14% (70) 26% (129) 12% (59) 12% (59) 35% (171) 489Educ: Post-grad 17% (50) 28% (82) 11% (33) 15% (42) 28% (82) 288Income: Under 50k 13% (124) 22% (219) 12% (120) 11% (112) 42% (415) 991Income: 50k-100k 13% (83) 24% (152) 11% (68) 12% (78) 41% (259) 640Income: 100k+ 16% (57) 26% (92) 11% (40) 14% (49) 34% (122) 359Ethnicity: White 13% (205) 22% (343) 11% (178) 14% (219) 40% (640) 1584
Continued on next page
Page 213
National Tracking Poll #210636, June, 2021
213
Table POL9_8
Table POL9_8: As you may know, Congress is debating a bill that addresses voter access, election security, campaign finance, and government ethics.Do you support or oppose each of the following components of the bill?Establishing voluntary small donor public financing for House of Representatives elections
DemographicStronglysupport
Somewhatsupport
Somewhatoppose
Stronglyoppose
Don’t know /No opinion Total N
Registered Voters 13% (264) 23% (463) 11% (228) 12% (239) 40% (797) 1990Ethnicity: Hispanic 20% (39) 23% (44) 11% (21) 7% (13) 40% (79) 196Ethnicity: Black 14% (35) 32% (78) 13% (31) 3% (7) 38% (91) 243Ethnicity: Other 15% (24) 26% (42) 11% (19) 8% (13) 40% (66) 163All Christian 12% (120) 25% (236) 14% (135) 13% (123) 36% (350) 964All Non-Christian 28% (34) 21% (26) 6% (7) 11% (13) 35% (42) 121Atheist 19% (14) 24% (18) 9% (7) 7% (5) 40% (29) 73Agnostic/Nothing in particular 12% (57) 24% (118) 8% (40) 11% (56) 45% (223) 495Something Else 12% (39) 19% (64) 12% (39) 12% (41) 45% (153) 337Religious Non-Protestant/Catholic 25% (35) 20% (28) 8% (12) 10% (14) 36% (51) 140Evangelical 12% (67) 22% (120) 12% (64) 15% (82) 39% (215) 547Non-Evangelical 12% (86) 24% (176) 14% (104) 11% (80) 38% (275) 721Community: Urban 22% (118) 28% (151) 10% (51) 8% (44) 31% (165) 529Community: Suburban 10% (103) 23% (225) 11% (112) 13% (134) 42% (423) 998Community: Rural 9% (43) 19% (87) 14% (65) 13% (60) 45% (209) 464Employ: Private Sector 16% (97) 26% (160) 11% (69) 12% (73) 36% (223) 622Employ: Government 16% (21) 28% (36) 11% (14) 12% (15) 33% (42) 129Employ: Self-Employed 19% (30) 29% (45) 11% (17) 9% (14) 33% (52) 157Employ: Homemaker 11% (14) 10% (13) 13% (16) 9% (11) 57% (72) 127Employ: Retired 10% (57) 21% (124) 14% (81) 17% (99) 38% (219) 581Employ: Unemployed 13% (27) 22% (48) 8% (18) 10% (21) 47% (101) 215Employ: Other 12% (13) 23% (26) 7% (7) 4% (5) 54% (61) 113Military HH: Yes 11% (39) 22% (79) 15% (54) 18% (66) 34% (124) 361Military HH: No 14% (225) 24% (384) 11% (173) 11% (173) 41% (673) 1629RD/WT: Right Direction 20% (190) 28% (266) 10% (90) 7% (62) 35% (332) 941RD/WT: Wrong Track 7% (74) 19% (196) 13% (137) 17% (177) 44% (465) 1049Biden Job Approve 20% (212) 29% (302) 10% (101) 6% (65) 34% (358) 1037Biden Job Disapprove 6% (49) 17% (148) 14% (118) 20% (171) 43% (371) 857
Continued on next page
Page 214
214
Morning ConsultTable POL9_8
Table POL9_8: As you may know, Congress is debating a bill that addresses voter access, election security, campaign finance, and government ethics.Do you support or oppose each of the following components of the bill?Establishing voluntary small donor public financing for House of Representatives elections
DemographicStronglysupport
Somewhatsupport
Somewhatoppose
Stronglyoppose
Don’t know /No opinion Total N
Registered Voters 13% (264) 23% (463) 11% (228) 12% (239) 40% (797) 1990Biden Job Strongly Approve 28% (154) 28% (151) 8% (43) 6% (32) 31% (168) 548Biden Job Somewhat Approve 12% (58) 31% (150) 12% (59) 7% (32) 39% (190) 489Biden Job Somewhat Disapprove 6% (12) 21% (46) 16% (35) 8% (18) 50% (111) 223Biden Job Strongly Disapprove 6% (36) 16% (102) 13% (83) 24% (153) 41% (259) 634Favorable of Biden 20% (210) 29% (306) 10% (102) 6% (68) 34% (362) 1048Unfavorable of Biden 6% (49) 18% (152) 14% (117) 19% (166) 43% (371) 855Very Favorable of Biden 27% (158) 28% (168) 8% (47) 6% (38) 31% (182) 593Somewhat Favorable of Biden 11% (52) 30% (139) 12% (55) 7% (30) 40% (180) 455Somewhat Unfavorable of Biden 5% (9) 21% (40) 16% (30) 10% (19) 49% (93) 190Very Unfavorable of Biden 6% (41) 17% (112) 13% (87) 22% (147) 42% (278) 664#1 Issue: Economy 12% (89) 22% (171) 14% (106) 11% (85) 41% (312) 763#1 Issue: Security 9% (30) 19% (66) 13% (45) 18% (62) 42% (147) 349#1 Issue: Health Care 22% (52) 29% (69) 12% (29) 10% (22) 26% (61) 233#1 Issue: Medicare / Social Security 13% (33) 25% (66) 9% (24) 12% (31) 41% (107) 261#1 Issue: Women’s Issues 13% (14) 19% (19) 7% (7) 8% (8) 54% (55) 103#1 Issue: Education 16% (13) 28% (24) 5% (4) 10% (9) 41% (35) 86#1 Issue: Energy 19% (17) 33% (28) 6% (6) 9% (8) 33% (28) 86#1 Issue: Other 14% (16) 19% (21) 7% (7) 12% (13) 48% (52) 1092020 Vote: Joe Biden 20% (179) 29% (263) 10% (86) 7% (61) 34% (307) 8972020 Vote: Donald Trump 7% (56) 17% (143) 13% (108) 20% (164) 43% (349) 8182020 Vote: Didn’t Vote 11% (26) 21% (49) 12% (30) 3% (8) 52% (125) 2392018 House Vote: Democrat 20% (135) 31% (216) 8% (56) 8% (52) 33% (227) 6872018 House Vote: Republican 8% (55) 19% (130) 14% (94) 20% (136) 40% (275) 6902018 House Vote: Someone else 10% (5) 13% (7) 8% (4) 13% (7) 55% (27) 502016 Vote: Hillary Clinton 19% (119) 31% (196) 9% (54) 7% (45) 34% (217) 6312016 Vote: Donald Trump 9% (66) 18% (135) 13% (99) 20% (153) 41% (315) 7682016 Vote: Other 8% (9) 27% (29) 11% (11) 10% (11) 44% (48) 1072016 Vote: Didn’t Vote 14% (70) 21% (102) 13% (64) 6% (30) 45% (218) 483
Continued on next page
Page 215
National Tracking Poll #210636, June, 2021
215
Table POL9_8
Table POL9_8: As you may know, Congress is debating a bill that addresses voter access, election security, campaign finance, and government ethics.Do you support or oppose each of the following components of the bill?Establishing voluntary small donor public financing for House of Representatives elections
DemographicStronglysupport
Somewhatsupport
Somewhatoppose
Stronglyoppose
Don’t know /No opinion Total N
Registered Voters 13% (264) 23% (463) 11% (228) 12% (239) 40% (797) 1990Voted in 2014: Yes 14% (179) 24% (317) 11% (144) 14% (187) 36% (471) 1297Voted in 2014: No 12% (85) 21% (146) 12% (84) 7% (52) 47% (326) 6934-Region: Northeast 17% (57) 27% (94) 10% (36) 12% (42) 33% (115) 3444-Region: Midwest 11% (52) 24% (109) 11% (48) 13% (58) 41% (188) 4554-Region: South 13% (101) 22% (166) 13% (94) 12% (94) 40% (300) 7554-Region: West 12% (54) 21% (93) 11% (49) 10% (46) 44% (194) 435Party: Democrat/Leans Democrat 20% (174) 30% (266) 9% (80) 6% (56) 35% (311) 888Party: Republican/Leans Republican 8% (66) 18% (146) 13% (105) 18% (145) 43% (352) 814Note: Row proportions may total to larger than one-hundred percent due to rounding. For more information visit MorningConsultIntelligence.com.
Page 216
216
Morning ConsultTable POL10a
Table POL10a: As you may know, the Senate has 100 members representing the 50 states. Which of the following comes closest to your opinion, evenif neither is exactly right?
Demographic
Bills in the Senateshould be required tohave at least 51/100
votes to pass
Bills in the Senateshould be required tohave at least 60/100
votes to passDon’t know/ no
opinion Total N
Registered Voters 45% (446) 38% (379) 17% (175) 1000Gender: Male 46% (204) 42% (188) 12% (52) 444Gender: Female 44% (242) 34% (190) 22% (122) 555Age: 18-34 43% (95) 31% (70) 26% (58) 223Age: 35-44 41% (64) 41% (64) 18% (28) 156Age: 45-64 48% (173) 36% (129) 16% (59) 361Age: 65+ 44% (115) 45% (116) 11% (29) 260GenZers: 1997-2012 35% (30) 25% (21) 40% (34) 86Millennials: 1981-1996 45% (108) 38% (91) 18% (43) 242GenXers: 1965-1980 48% (116) 36% (86) 16% (39) 241Baby Boomers: 1946-1964 44% (176) 42% (166) 14% (55) 396PID: Dem (no lean) 57% (226) 27% (105) 16% (65) 395PID: Ind (no lean) 42% (119) 36% (103) 21% (60) 282PID: Rep (no lean) 31% (101) 53% (171) 15% (49) 322PID/Gender: DemMen 60% (109) 30% (55) 10% (18) 182PID/Gender: DemWomen 55% (117) 23% (50) 22% (47) 213PID/Gender: Ind Men 38% (46) 44% (53) 18% (21) 121PID/Gender: Ind Women 45% (73) 31% (49) 24% (39) 161PID/Gender: Rep Men 34% (49) 57% (80) 9% (13) 142PID/Gender: Rep Women 29% (53) 51% (91) 20% (37) 180Ideo: Liberal (1-3) 59% (183) 25% (77) 16% (49) 309Ideo: Moderate (4) 47% (125) 34% (90) 20% (53) 269Ideo: Conservative (5-7) 33% (118) 54% (197) 13% (46) 361Educ: < College 42% (262) 36% (228) 22% (139) 630Educ: Bachelors degree 50% (114) 41% (95) 9% (20) 229Educ: Post-grad 50% (70) 40% (56) 11% (15) 140Income: Under 50k 44% (218) 35% (174) 22% (109) 502Income: 50k-100k 44% (142) 42% (136) 14% (45) 323Income: 100k+ 49% (86) 39% (69) 12% (20) 175
Continued on next page
Page 217
National Tracking Poll #210636, June, 2021
217
Table POL10a
Table POL10a: As you may know, the Senate has 100 members representing the 50 states. Which of the following comes closest to your opinion, evenif neither is exactly right?
Demographic
Bills in the Senateshould be required tohave at least 51/100
votes to pass
Bills in the Senateshould be required tohave at least 60/100
votes to passDon’t know/ no
opinion Total N
Registered Voters 45% (446) 38% (379) 17% (175) 1000Ethnicity: White 43% (345) 40% (320) 16% (129) 794Ethnicity: Hispanic 61% (63) 18% (18) 21% (22) 103Ethnicity: Black 46% (53) 28% (33) 26% (30) 116Ethnicity: Other 54% (48) 29% (26) 17% (15) 90All Christian 43% (208) 43% (210) 13% (65) 483All Non-Christian 56% (37) 30% (20) 14% (9) 67Agnostic/Nothing in particular 47% (117) 29% (74) 24% (61) 253Something Else 42% (66) 40% (62) 18% (28) 156Religious Non-Protestant/Catholic 56% (40) 29% (21) 15% (11) 72Evangelical 42% (109) 43% (111) 15% (39) 260Non-Evangelical 44% (161) 42% (154) 14% (51) 366Community: Urban 52% (139) 31% (83) 17% (45) 267Community: Suburban 41% (193) 43% (202) 17% (79) 474Community: Rural 44% (115) 36% (93) 19% (50) 258Employ: Private Sector 48% (142) 38% (115) 14% (42) 299Employ: Government 46% (28) 34% (20) 20% (12) 61Employ: Self-Employed 41% (31) 38% (29) 20% (15) 75Employ: Homemaker 45% (27) 37% (22) 18% (11) 59Employ: Retired 45% (137) 41% (126) 14% (42) 305Employ: Unemployed 43% (49) 32% (36) 25% (28) 112Employ: Other 34% (22) 39% (25) 27% (17) 64Military HH: Yes 41% (76) 46% (87) 13% (24) 187Military HH: No 46% (370) 36% (292) 18% (150) 813RD/WT: Right Direction 58% (277) 26% (123) 17% (80) 479RD/WT: Wrong Track 33% (169) 49% (256) 18% (95) 520Biden Job Approve 58% (300) 28% (144) 15% (78) 521Biden Job Disapprove 30% (128) 55% (231) 15% (65) 424
Continued on next page
Page 218
218
Morning ConsultTable POL10a
Table POL10a: As you may know, the Senate has 100 members representing the 50 states. Which of the following comes closest to your opinion, evenif neither is exactly right?
Demographic
Bills in the Senateshould be required tohave at least 51/100
votes to pass
Bills in the Senateshould be required tohave at least 60/100
votes to passDon’t know/ no
opinion Total N
Registered Voters 45% (446) 38% (379) 17% (175) 1000Biden Job Strongly Approve 66% (189) 20% (58) 13% (38) 285Biden Job Somewhat Approve 47% (111) 36% (85) 17% (39) 236Biden Job Somewhat Disapprove 35% (39) 49% (54) 16% (18) 111Biden Job Strongly Disapprove 28% (89) 57% (177) 15% (47) 313Favorable of Biden 57% (303) 27% (146) 15% (82) 531Unfavorable of Biden 31% (130) 53% (226) 17% (71) 427Very Favorable of Biden 63% (195) 23% (71) 14% (43) 309Somewhat Favorable of Biden 48% (108) 34% (75) 18% (39) 222Somewhat Unfavorable of Biden 40% (37) 39% (36) 21% (19) 92Very Unfavorable of Biden 28% (93) 57% (190) 15% (52) 335#1 Issue: Economy 42% (162) 40% (153) 17% (66) 381#1 Issue: Security 34% (58) 50% (85) 16% (28) 171#1 Issue: Health Care 69% (73) 19% (20) 12% (13) 107#1 Issue: Medicare / Social Security 46% (66) 36% (51) 18% (25) 142#1 Issue: Energy 37% (19) 39% (20) 24% (12) 51#1 Issue: Other 55% (32) 36% (21) 9% (5) 582020 Vote: Joe Biden 59% (280) 27% (127) 14% (68) 4752020 Vote: Donald Trump 32% (125) 53% (208) 14% (56) 3892020 Vote: Didn’t Vote 28% (34) 31% (37) 41% (48) 1192018 House Vote: Democrat 63% (219) 25% (88) 12% (41) 3482018 House Vote: Republican 31% (103) 57% (189) 12% (40) 3322016 Vote: Hillary Clinton 59% (199) 25% (85) 16% (52) 3362016 Vote: Donald Trump 34% (121) 54% (196) 12% (44) 3612016 Vote: Other 49% (25) 41% (21) 10% (5) 512016 Vote: Didn’t Vote 40% (101) 30% (77) 29% (74) 252Voted in 2014: Yes 48% (308) 40% (258) 12% (79) 646Voted in 2014: No 39% (138) 34% (121) 27% (95) 354
Continued on next page
Page 219
National Tracking Poll #210636, June, 2021
219
Table POL10a
Table POL10a: As you may know, the Senate has 100 members representing the 50 states. Which of the following comes closest to your opinion, evenif neither is exactly right?
Demographic
Bills in the Senateshould be required tohave at least 51/100
votes to pass
Bills in the Senateshould be required tohave at least 60/100
votes to passDon’t know/ no
opinion Total N
Registered Voters 45% (446) 38% (379) 17% (175) 10004-Region: Northeast 52% (88) 35% (60) 13% (22) 1704-Region: Midwest 49% (104) 39% (82) 12% (26) 2124-Region: South 38% (149) 39% (152) 23% (88) 3894-Region: West 46% (106) 37% (85) 17% (38) 228Party: Democrat/Leans Democrat 58% (269) 26% (122) 16% (72) 463Party: Republican/Leans Republican 30% (118) 55% (215) 15% (60) 393Note: Row proportions may total to larger than one-hundred percent due to rounding. For more information visit MorningConsultIntelligence.com.
Page 220
220
Morning ConsultTable POL10b
Table POL10b: As youmay know, the filibuster rule of the U.S. Senate requires 60 senators to agree to allow a final vote on a piece of legislation. Basedon what you know, do you support or oppose the Senate’s filibuster rule?
DemographicStronglysupport
Somewhatsupport
Somewhatoppose
Stronglyoppose
Don’t know /No opinion Total N
Registered Voters 24% (235) 24% (235) 14% (137) 13% (132) 25% (251) 990Gender: Male 28% (135) 25% (120) 13% (65) 15% (75) 18% (88) 483Gender: Female 20% (100) 23% (115) 14% (72) 11% (57) 32% (163) 508Age: 18-34 21% (50) 25% (58) 13% (30) 8% (19) 33% (76) 233Age: 35-44 13% (19) 31% (44) 19% (28) 6% (9) 31% (44) 144Age: 45-64 21% (79) 24% (88) 12% (45) 17% (65) 25% (92) 370Age: 65+ 36% (87) 18% (45) 14% (34) 16% (39) 16% (39) 244GenZers: 1997-2012 10% (9) 27% (23) 17% (14) 6% (5) 39% (33) 84Millennials: 1981-1996 22% (53) 26% (62) 16% (39) 8% (18) 28% (66) 238GenXers: 1965-1980 18% (50) 26% (74) 13% (36) 14% (41) 29% (83) 284Baby Boomers: 1946-1964 30% (105) 21% (74) 13% (44) 18% (64) 18% (62) 349PID: Dem (no lean) 17% (59) 20% (72) 20% (71) 21% (73) 22% (80) 356PID: Ind (no lean) 20% (59) 27% (81) 12% (34) 12% (35) 29% (87) 296PID: Rep (no lean) 35% (117) 24% (82) 9% (31) 7% (23) 25% (85) 338PID/Gender: DemMen 23% (40) 17% (30) 20% (36) 24% (42) 16% (29) 177PID/Gender: DemWomen 11% (20) 23% (42) 20% (35) 18% (32) 29% (51) 179PID/Gender: Ind Men 24% (35) 35% (51) 11% (16) 12% (18) 18% (27) 147PID/Gender: Ind Women 16% (24) 20% (30) 12% (18) 11% (17) 40% (59) 149PID/Gender: Rep Men 38% (61) 24% (39) 8% (12) 9% (15) 20% (32) 159PID/Gender: Rep Women 31% (56) 24% (43) 11% (19) 5% (9) 29% (52) 179Ideo: Liberal (1-3) 16% (44) 17% (48) 20% (56) 24% (68) 22% (62) 278Ideo: Moderate (4) 17% (45) 30% (82) 13% (36) 13% (36) 26% (71) 270Ideo: Conservative (5-7) 37% (143) 25% (97) 9% (34) 7% (26) 21% (81) 382Educ: < College 21% (122) 26% (149) 13% (77) 12% (71) 28% (165) 583Educ: Bachelors degree 28% (73) 22% (57) 13% (35) 14% (36) 22% (58) 259Educ: Post-grad 28% (41) 20% (29) 17% (25) 17% (25) 20% (29) 148Income: Under 50k 20% (97) 28% (135) 12% (61) 14% (67) 27% (130) 490Income: 50k-100k 26% (83) 19% (61) 14% (45) 13% (43) 27% (85) 317Income: 100k+ 30% (56) 21% (39) 17% (31) 12% (22) 19% (36) 184Ethnicity: White 26% (209) 23% (183) 14% (108) 13% (100) 24% (190) 791Ethnicity: Hispanic 11% (10) 32% (30) 19% (17) 8% (7) 30% (28) 93
Continued on next page
Page 221
National Tracking Poll #210636, June, 2021
221
Table POL10b
Table POL10b: As youmay know, the filibuster rule of the U.S. Senate requires 60 senators to agree to allow a final vote on a piece of legislation. Basedon what you know, do you support or oppose the Senate’s filibuster rule?
DemographicStronglysupport
Somewhatsupport
Somewhatoppose
Stronglyoppose
Don’t know /No opinion Total N
Registered Voters 24% (235) 24% (235) 14% (137) 13% (132) 25% (251) 990Ethnicity: Black 13% (16) 25% (31) 15% (19) 15% (19) 33% (41) 126Ethnicity: Other 13% (10) 29% (21) 14% (10) 18% (13) 27% (20) 74All Christian 30% (145) 23% (112) 13% (61) 11% (55) 22% (108) 481All Non-Christian 39% (22) 10% (6) 17% (9) 25% (14) 8% (5) 55Agnostic/Nothing in particular 15% (35) 26% (64) 17% (42) 14% (33) 28% (68) 243Something Else 16% (29) 27% (49) 11% (19) 13% (23) 34% (61) 180Religious Non-Protestant/Catholic 34% (24) 15% (10) 15% (10) 20% (14) 15% (11) 68Evangelical 28% (81) 25% (71) 11% (30) 9% (27) 27% (78) 288Non-Evangelical 25% (91) 24% (85) 13% (45) 14% (51) 24% (84) 355Community: Urban 23% (61) 24% (62) 16% (41) 14% (37) 23% (61) 262Community: Suburban 23% (120) 23% (118) 13% (66) 16% (83) 26% (136) 523Community: Rural 26% (54) 27% (55) 15% (30) 6% (13) 26% (54) 205Employ: Private Sector 22% (73) 27% (88) 14% (45) 11% (37) 25% (80) 322Employ: Government 21% (14) 25% (17) 23% (16) 7% (5) 24% (16) 68Employ: Self-Employed 21% (17) 25% (21) 15% (13) 18% (15) 21% (18) 83Employ: Homemaker 27% (18) 22% (15) 9% (6) 2% (1) 40% (27) 67Employ: Retired 32% (88) 18% (50) 12% (34) 19% (53) 19% (52) 277Employ: Unemployed 13% (14) 25% (26) 16% (17) 14% (14) 31% (32) 102Military HH: Yes 32% (56) 26% (45) 10% (17) 14% (25) 18% (32) 175Military HH: No 22% (180) 23% (190) 15% (120) 13% (107) 27% (219) 816RD/WT: Right Direction 16% (75) 22% (101) 19% (86) 20% (94) 23% (107) 462RD/WT: Wrong Track 30% (161) 25% (134) 10% (51) 7% (38) 27% (145) 528Biden Job Approve 16% (82) 23% (120) 19% (98) 20% (103) 22% (113) 516Biden Job Disapprove 35% (153) 25% (106) 8% (35) 6% (28) 26% (111) 433Biden Job Strongly Approve 21% (56) 19% (49) 17% (46) 26% (68) 17% (44) 263Biden Job Somewhat Approve 10% (26) 28% (71) 21% (52) 14% (35) 27% (69) 253Biden Job Somewhat Disapprove 19% (21) 32% (36) 10% (11) 7% (8) 32% (36) 112Biden Job Strongly Disapprove 41% (132) 22% (71) 7% (24) 6% (20) 23% (74) 321Favorable of Biden 15% (80) 23% (120) 19% (98) 20% (105) 22% (113) 517Unfavorable of Biden 35% (150) 24% (103) 9% (37) 6% (26) 26% (112) 428
Continued on next page
Page 222
222
Morning ConsultTable POL10b
Table POL10b: As youmay know, the filibuster rule of the U.S. Senate requires 60 senators to agree to allow a final vote on a piece of legislation. Basedon what you know, do you support or oppose the Senate’s filibuster rule?
DemographicStronglysupport
Somewhatsupport
Somewhatoppose
Stronglyoppose
Don’t know /No opinion Total N
Registered Voters 24% (235) 24% (235) 14% (137) 13% (132) 25% (251) 990Very Favorable of Biden 20% (57) 16% (46) 18% (50) 24% (70) 22% (62) 284Somewhat Favorable of Biden 10% (23) 32% (75) 21% (48) 15% (36) 22% (51) 233Somewhat Unfavorable of Biden 21% (20) 23% (23) 9% (9) 7% (7) 40% (39) 98Very Unfavorable of Biden 39% (130) 24% (80) 8% (28) 6% (19) 22% (73) 329#1 Issue: Economy 24% (91) 22% (83) 14% (53) 10% (40) 30% (115) 382#1 Issue: Security 39% (70) 25% (45) 7% (13) 5% (9) 23% (41) 178#1 Issue: Health Care 19% (23) 25% (31) 14% (17) 21% (26) 22% (28) 126#1 Issue: Medicare / Social Security 16% (19) 23% (27) 16% (19) 24% (29) 21% (25) 119#1 Issue: Women’s Issues 4% (2) 24% (13) 24% (13) 14% (8) 34% (19) 55#1 Issue: Other 32% (16) 17% (9) 17% (8) 14% (7) 21% (11) 512020 Vote: Joe Biden 17% (71) 20% (84) 20% (86) 23% (96) 20% (86) 4222020 Vote: Donald Trump 36% (153) 27% (117) 7% (31) 5% (23) 24% (105) 4302020 Vote: Didn’t Vote 8% (10) 25% (30) 15% (18) 8% (10) 43% (52) 1202018 House Vote: Democrat 17% (56) 16% (56) 22% (74) 26% (86) 20% (66) 3392018 House Vote: Republican 38% (136) 29% (103) 7% (26) 7% (23) 19% (69) 3582016 Vote: Hillary Clinton 17% (51) 16% (46) 21% (61) 25% (75) 21% (62) 2952016 Vote: Donald Trump 37% (151) 30% (120) 7% (29) 6% (25) 20% (81) 4072016 Vote: Other 14% (8) 20% (11) 17% (10) 21% (12) 27% (15) 572016 Vote: Didn’t Vote 11% (26) 25% (57) 16% (37) 8% (19) 40% (92) 232Voted in 2014: Yes 29% (189) 22% (144) 13% (87) 16% (105) 19% (127) 652Voted in 2014: No 14% (46) 27% (91) 15% (49) 8% (27) 37% (124) 3394-Region: Northeast 25% (44) 17% (30) 15% (27) 16% (28) 26% (45) 1754-Region: Midwest 20% (49) 22% (53) 21% (52) 12% (29) 25% (60) 2434-Region: South 23% (84) 30% (108) 9% (34) 14% (51) 24% (89) 3664-Region: West 28% (58) 21% (44) 12% (24) 12% (24) 27% (57) 207Party: Democrat/Leans Democrat 16% (68) 19% (79) 20% (86) 22% (93) 23% (99) 425Party: Republican/Leans Republican 34% (143) 26% (108) 9% (37) 6% (27) 25% (106) 421Note: Row proportions may total to larger than one-hundred percent due to rounding. For more information visit MorningConsultIntelligence.com.
Page 223
National Tracking Poll #210636, June, 2021
223
Table POL12
Table POL12: Is America’s democracy currently being threatened?
Demographic Yes, definitely Yes, probablyNo, probably
notNo, definitely
notDon’t know /No opinion Total N
Registered Voters 47% (932) 30% (601) 10% (194) 3% (67) 10% (196) 1990Gender: Male 49% (452) 28% (261) 12% (108) 5% (42) 7% (65) 927Gender: Female 45% (481) 32% (340) 8% (86) 2% (25) 12% (132) 1063Age: 18-34 32% (145) 31% (140) 15% (69) 5% (21) 18% (81) 456Age: 35-44 37% (111) 33% (98) 8% (25) 6% (18) 16% (48) 300Age: 45-64 52% (382) 27% (199) 10% (72) 2% (18) 8% (58) 730Age: 65+ 58% (293) 32% (163) 6% (29) 2% (9) 2% (8) 504GenZers: 1997-2012 22% (38) 29% (49) 18% (31) 4% (7) 26% (45) 169Millennials: 1981-1996 38% (182) 33% (158) 10% (50) 6% (27) 13% (64) 480GenXers: 1965-1980 45% (236) 30% (155) 10% (53) 3% (16) 12% (65) 525Baby Boomers: 1946-1964 58% (431) 30% (223) 7% (54) 2% (16) 3% (21) 746PID: Dem (no lean) 43% (326) 34% (257) 11% (79) 4% (30) 8% (60) 752PID: Ind (no lean) 43% (246) 29% (168) 11% (61) 3% (17) 15% (86) 578PID: Rep (no lean) 55% (361) 27% (176) 8% (54) 3% (19) 8% (51) 661PID/Gender: DemMen 46% (166) 30% (107) 13% (46) 5% (18) 6% (21) 359PID/Gender: DemWomen 41% (159) 38% (150) 8% (33) 3% (12) 10% (39) 393PID/Gender: Ind Men 46% (122) 28% (75) 12% (33) 4% (11) 10% (25) 267PID/Gender: Ind Women 40% (124) 30% (93) 9% (28) 2% (6) 19% (60) 311PID/Gender: Rep Men 54% (163) 26% (79) 10% (29) 4% (12) 6% (18) 301PID/Gender: Rep Women 55% (197) 27% (97) 7% (26) 2% (7) 9% (33) 360Ideo: Liberal (1-3) 48% (282) 29% (170) 11% (64) 4% (25) 8% (46) 587Ideo: Moderate (4) 38% (202) 38% (205) 13% (69) 2% (10) 10% (52) 539Ideo: Conservative (5-7) 57% (423) 26% (196) 7% (53) 4% (28) 6% (42) 742Educ: < College 44% (534) 31% (373) 9% (113) 3% (33) 13% (160) 1213Educ: Bachelors degree 50% (243) 31% (150) 10% (50) 4% (17) 6% (28) 489Educ: Post-grad 54% (155) 27% (78) 11% (31) 6% (16) 3% (8) 288Income: Under 50k 46% (457) 29% (283) 10% (95) 3% (28) 13% (128) 991Income: 50k-100k 46% (297) 32% (207) 9% (58) 4% (24) 8% (53) 640Income: 100k+ 50% (178) 31% (110) 11% (41) 4% (15) 4% (15) 359Ethnicity: White 49% (774) 30% (473) 10% (155) 3% (54) 8% (128) 1584Ethnicity: Hispanic 35% (68) 30% (59) 11% (22) 5% (9) 19% (37) 196Ethnicity: Black 41% (98) 31% (75) 9% (21) 3% (8) 16% (40) 243
Continued on next page
Page 224
224
Morning ConsultTable POL12
Table POL12: Is America’s democracy currently being threatened?
Demographic Yes, definitely Yes, probablyNo, probably
notNo, definitely
notDon’t know /No opinion Total N
Registered Voters 47% (932) 30% (601) 10% (194) 3% (67) 10% (196) 1990Ethnicity: Other 37% (60) 32% (53) 11% (18) 3% (4) 18% (29) 163All Christian 50% (482) 31% (301) 10% (98) 3% (28) 6% (55) 964All Non-Christian 56% (68) 23% (28) 11% (13) 4% (5) 6% (8) 121Atheist 38% (28) 29% (21) 12% (9) 8% (6) 13% (9) 73Agnostic/Nothing in particular 39% (194) 31% (155) 11% (52) 4% (19) 15% (75) 495Something Else 48% (161) 28% (96) 7% (22) 2% (8) 15% (49) 337Religious Non-Protestant/Catholic 54% (75) 25% (36) 10% (14) 4% (6) 7% (9) 140Evangelical 54% (294) 27% (148) 9% (47) 3% (15) 8% (43) 547Non-Evangelical 46% (333) 33% (239) 10% (69) 3% (21) 8% (59) 721Community: Urban 47% (250) 27% (144) 10% (55) 5% (26) 10% (54) 529Community: Suburban 46% (457) 32% (319) 10% (102) 3% (32) 9% (86) 998Community: Rural 49% (225) 29% (137) 8% (36) 2% (8) 12% (57) 464Employ: Private Sector 41% (256) 32% (199) 13% (81) 5% (29) 9% (57) 622Employ: Government 52% (67) 27% (34) 6% (8) 3% (4) 12% (16) 129Employ: Self-Employed 53% (83) 25% (39) 11% (17) 5% (7) 7% (10) 157Employ: Homemaker 40% (50) 35% (45) 8% (10) — (0) 17% (22) 127Employ: Retired 58% (335) 29% (170) 8% (44) 3% (15) 3% (17) 581Employ: Unemployed 40% (85) 30% (64) 11% (23) 3% (6) 17% (36) 215Employ: Other 38% (43) 28% (31) 7% (8) 3% (4) 23% (26) 113Military HH: Yes 57% (205) 29% (103) 7% (24) 3% (11) 5% (18) 361Military HH: No 45% (727) 31% (497) 10% (171) 3% (56) 11% (178) 1629RD/WT: Right Direction 41% (382) 33% (307) 12% (112) 5% (44) 10% (97) 941RD/WT: Wrong Track 52% (550) 28% (294) 8% (83) 2% (23) 9% (99) 1049Biden Job Approve 41% (428) 34% (353) 12% (122) 4% (44) 9% (90) 1037Biden Job Disapprove 57% (491) 26% (224) 8% (66) 2% (21) 6% (56) 857Biden Job Strongly Approve 53% (290) 28% (154) 8% (46) 5% (25) 6% (32) 548Biden Job Somewhat Approve 28% (138) 41% (198) 15% (76) 4% (19) 12% (58) 489Biden Job Somewhat Disapprove 31% (69) 42% (95) 16% (35) 3% (6) 8% (19) 223Biden Job Strongly Disapprove 66% (421) 20% (129) 5% (32) 2% (15) 6% (37) 634Favorable of Biden 41% (425) 34% (361) 11% (119) 4% (46) 9% (98) 1048Unfavorable of Biden 57% (486) 26% (222) 8% (67) 2% (19) 7% (60) 855
Continued on next page
Page 225
National Tracking Poll #210636, June, 2021
225
Table POL12
Table POL12: Is America’s democracy currently being threatened?
Demographic Yes, definitely Yes, probablyNo, probably
notNo, definitely
notDon’t know /No opinion Total N
Registered Voters 47% (932) 30% (601) 10% (194) 3% (67) 10% (196) 1990Very Favorable of Biden 52% (306) 29% (169) 9% (53) 4% (27) 6% (38) 593Somewhat Favorable of Biden 26% (119) 42% (191) 14% (66) 4% (19) 13% (60) 455Somewhat Unfavorable of Biden 37% (71) 39% (74) 14% (27) 1% (3) 8% (16) 190Very Unfavorable of Biden 63% (416) 22% (148) 6% (40) 2% (17) 7% (44) 664#1 Issue: Economy 43% (326) 31% (239) 11% (87) 3% (22) 12% (89) 763#1 Issue: Security 56% (196) 24% (84) 8% (29) 3% (10) 9% (30) 349#1 Issue: Health Care 44% (102) 36% (84) 8% (18) 4% (8) 9% (21) 233#1 Issue: Medicare / Social Security 52% (136) 30% (79) 10% (26) 2% (5) 6% (14) 261#1 Issue: Women’s Issues 36% (37) 35% (36) 7% (7) 4% (4) 18% (19) 103#1 Issue: Education 25% (22) 45% (39) 9% (8) 8% (7) 13% (11) 86#1 Issue: Energy 42% (36) 22% (19) 17% (15) 10% (8) 10% (8) 86#1 Issue: Other 72% (79) 18% (20) 5% (5) 1% (1) 4% (4) 1092020 Vote: Joe Biden 45% (407) 34% (308) 10% (87) 3% (31) 7% (64) 8972020 Vote: Donald Trump 56% (458) 26% (210) 8% (65) 3% (24) 8% (62) 8182020 Vote: Didn’t Vote 24% (57) 28% (66) 17% (40) 4% (10) 28% (66) 2392018 House Vote: Democrat 50% (347) 33% (224) 9% (64) 3% (23) 4% (29) 6872018 House Vote: Republican 57% (392) 26% (182) 8% (55) 3% (20) 6% (41) 6902018 House Vote: Someone else 40% (20) 23% (12) 8% (4) 2% (1) 27% (14) 502016 Vote: Hillary Clinton 51% (321) 31% (193) 10% (60) 3% (21) 6% (36) 6312016 Vote: Donald Trump 56% (429) 27% (210) 8% (59) 3% (23) 6% (47) 7682016 Vote: Other 40% (43) 41% (44) 4% (5) 5% (6) 9% (10) 1072016 Vote: Didn’t Vote 29% (139) 32% (154) 15% (70) 4% (17) 21% (104) 483Voted in 2014: Yes 54% (707) 30% (383) 8% (102) 3% (39) 5% (65) 1297Voted in 2014: No 33% (225) 31% (217) 13% (92) 4% (27) 19% (131) 6934-Region: Northeast 45% (154) 33% (112) 11% (38) 3% (10) 9% (30) 3444-Region: Midwest 47% (215) 32% (146) 11% (48) 2% (8) 8% (37) 4554-Region: South 46% (349) 30% (225) 9% (66) 4% (31) 11% (84) 7554-Region: West 49% (214) 27% (118) 10% (41) 4% (18) 10% (45) 435Party: Democrat/Leans Democrat 44% (394) 33% (297) 11% (95) 4% (34) 8% (68) 888Party: Republican/Leans Republican 54% (439) 27% (217) 9% (70) 3% (23) 8% (64) 814Note: Row proportions may total to larger than one-hundred percent due to rounding. For more information visit MorningConsultIntelligence.com.
Page 226
226
Morning ConsultTable POL13_1
Table POL13_1: Are each of the following a major threat, a minor threat, or not a threat to American democracy?Restricting voting access
Demographic Major threat Minor threat Not a threatDon’t know / No
opinion Total N
Registered Voters 50% (986) 19% (385) 21% (419) 10% (200) 1990Gender: Male 48% (449) 20% (183) 24% (226) 8% (70) 927Gender: Female 51% (537) 19% (202) 18% (194) 12% (130) 1063Age: 18-34 47% (215) 20% (93) 16% (75) 16% (74) 456Age: 35-44 47% (142) 23% (70) 14% (41) 16% (47) 300Age: 45-64 48% (351) 21% (156) 23% (165) 8% (59) 730Age: 65+ 55% (278) 13% (67) 27% (138) 4% (21) 504GenZers: 1997-2012 39% (66) 18% (30) 21% (36) 22% (38) 169Millennials: 1981-1996 50% (239) 22% (107) 14% (67) 14% (66) 480GenXers: 1965-1980 50% (261) 22% (117) 17% (89) 11% (58) 525Baby Boomers: 1946-1964 53% (392) 16% (118) 27% (200) 5% (36) 746PID: Dem (no lean) 70% (523) 17% (127) 8% (59) 6% (42) 752PID: Ind (no lean) 44% (253) 20% (113) 23% (131) 14% (80) 578PID: Rep (no lean) 32% (209) 22% (145) 35% (229) 12% (77) 661PID/Gender: DemMen 67% (240) 19% (69) 10% (37) 4% (13) 359PID/Gender: DemWomen 72% (283) 15% (58) 6% (22) 8% (30) 393PID/Gender: Ind Men 45% (121) 19% (49) 26% (69) 10% (27) 267PID/Gender: Ind Women 42% (132) 20% (63) 20% (62) 17% (53) 311PID/Gender: Rep Men 29% (87) 22% (65) 40% (120) 10% (30) 301PID/Gender: Rep Women 34% (122) 22% (80) 30% (109) 13% (48) 360Ideo: Liberal (1-3) 73% (429) 13% (76) 8% (49) 6% (34) 587Ideo: Moderate (4) 55% (295) 22% (119) 14% (76) 9% (48) 539Ideo: Conservative (5-7) 31% (230) 23% (172) 37% (278) 8% (62) 742Educ: < College 46% (561) 19% (227) 22% (261) 14% (164) 1213Educ: Bachelors degree 55% (267) 20% (97) 21% (102) 5% (22) 489Educ: Post-grad 55% (158) 21% (61) 19% (55) 5% (14) 288Income: Under 50k 50% (495) 18% (176) 19% (192) 13% (129) 991Income: 50k-100k 47% (304) 20% (131) 23% (148) 9% (57) 640Income: 100k+ 52% (188) 22% (78) 22% (80) 4% (14) 359Ethnicity: White 47% (739) 20% (312) 24% (377) 10% (157) 1584Ethnicity: Hispanic 47% (93) 22% (44) 12% (23) 19% (37) 196
Continued on next page
Page 227
National Tracking Poll #210636, June, 2021
227
Table POL13_1
Table POL13_1: Are each of the following a major threat, a minor threat, or not a threat to American democracy?Restricting voting access
Demographic Major threat Minor threat Not a threatDon’t know / No
opinion Total N
Registered Voters 50% (986) 19% (385) 21% (419) 10% (200) 1990Ethnicity: Black 64% (156) 17% (42) 8% (20) 10% (24) 243Ethnicity: Other 56% (92) 19% (31) 14% (22) 11% (19) 163All Christian 45% (435) 21% (199) 27% (257) 8% (73) 964All Non-Christian 60% (72) 19% (22) 14% (17) 8% (9) 121Atheist 61% (45) 15% (11) 16% (12) 8% (6) 73Agnostic/Nothing in particular 53% (261) 18% (91) 16% (77) 13% (66) 495Something Else 51% (173) 18% (61) 17% (57) 14% (46) 337Religious Non-Protestant/Catholic 54% (76) 20% (28) 16% (23) 10% (14) 140Evangelical 42% (229) 22% (121) 28% (151) 8% (46) 547Non-Evangelical 51% (370) 18% (131) 21% (152) 9% (68) 721Community: Urban 55% (290) 23% (122) 12% (65) 10% (52) 529Community: Suburban 49% (493) 18% (183) 24% (243) 8% (78) 998Community: Rural 44% (203) 17% (79) 24% (111) 15% (70) 464Employ: Private Sector 49% (306) 23% (144) 19% (117) 9% (55) 622Employ: Government 49% (63) 24% (31) 17% (22) 10% (13) 129Employ: Self-Employed 53% (83) 14% (22) 27% (42) 7% (11) 157Employ: Homemaker 38% (48) 20% (25) 24% (30) 18% (23) 127Employ: Retired 53% (311) 16% (91) 26% (154) 4% (26) 581Employ: Unemployed 47% (101) 17% (36) 16% (34) 20% (43) 215Employ: Other 44% (49) 23% (26) 12% (13) 21% (24) 113Military HH: Yes 50% (180) 18% (64) 26% (93) 7% (23) 361Military HH: No 49% (806) 20% (320) 20% (326) 11% (176) 1629RD/WT: Right Direction 66% (625) 17% (161) 9% (88) 7% (67) 941RD/WT: Wrong Track 34% (361) 21% (224) 32% (331) 13% (133) 1049Biden Job Approve 70% (724) 16% (169) 8% (85) 6% (59) 1037Biden Job Disapprove 29% (247) 23% (198) 38% (323) 10% (89) 857Biden Job Strongly Approve 76% (414) 13% (70) 7% (41) 4% (22) 548Biden Job Somewhat Approve 63% (309) 20% (98) 9% (44) 8% (37) 489Biden Job Somewhat Disapprove 35% (77) 35% (78) 19% (43) 11% (25) 223Biden Job Strongly Disapprove 27% (170) 19% (121) 44% (280) 10% (64) 634
Continued on next page
Page 228
228
Morning ConsultTable POL13_1
Table POL13_1: Are each of the following a major threat, a minor threat, or not a threat to American democracy?Restricting voting access
Demographic Major threat Minor threat Not a threatDon’t know / No
opinion Total N
Registered Voters 50% (986) 19% (385) 21% (419) 10% (200) 1990Favorable of Biden 69% (728) 16% (172) 8% (81) 6% (67) 1048Unfavorable of Biden 28% (235) 23% (198) 39% (330) 11% (92) 855Very Favorable of Biden 76% (453) 13% (77) 7% (41) 4% (22) 593Somewhat Favorable of Biden 60% (274) 21% (95) 9% (40) 10% (46) 455Somewhat Unfavorable of Biden 40% (77) 31% (59) 21% (39) 8% (16) 190Very Unfavorable of Biden 24% (159) 21% (139) 44% (290) 11% (76) 664#1 Issue: Economy 42% (318) 23% (178) 23% (176) 12% (91) 763#1 Issue: Security 29% (102) 22% (75) 39% (138) 10% (34) 349#1 Issue: Health Care 65% (152) 17% (39) 10% (24) 8% (19) 233#1 Issue: Medicare / Social Security 69% (181) 14% (37) 12% (32) 4% (10) 261#1 Issue: Women’s Issues 65% (67) 11% (11) 9% (9) 15% (16) 103#1 Issue: Education 61% (53) 18% (16) 10% (8) 11% (9) 86#1 Issue: Energy 52% (45) 26% (23) 8% (7) 14% (12) 86#1 Issue: Other 64% (69) 5% (6) 22% (24) 9% (10) 1092020 Vote: Joe Biden 73% (655) 15% (134) 8% (71) 4% (38) 8972020 Vote: Donald Trump 29% (235) 23% (185) 39% (316) 10% (82) 8182020 Vote: Didn’t Vote 34% (81) 23% (55) 12% (29) 31% (74) 2392018 House Vote: Democrat 74% (508) 16% (108) 8% (52) 3% (19) 6872018 House Vote: Republican 30% (208) 23% (162) 38% (262) 9% (59) 6902018 House Vote: Someone else 61% (31) 16% (8) 7% (3) 16% (8) 502016 Vote: Hillary Clinton 74% (468) 14% (90) 8% (49) 4% (24) 6312016 Vote: Donald Trump 32% (245) 23% (174) 36% (275) 10% (74) 7682016 Vote: Other 51% (55) 21% (23) 17% (18) 10% (11) 1072016 Vote: Didn’t Vote 45% (218) 20% (98) 16% (77) 19% (91) 483Voted in 2014: Yes 53% (682) 19% (249) 22% (283) 6% (84) 1297Voted in 2014: No 44% (305) 20% (136) 20% (137) 17% (116) 6934-Region: Northeast 54% (184) 21% (73) 16% (56) 9% (30) 3444-Region: Midwest 49% (225) 20% (89) 21% (95) 10% (46) 4554-Region: South 47% (353) 19% (142) 24% (184) 10% (77) 7554-Region: West 51% (224) 19% (81) 19% (83) 11% (47) 435
Continued on next page
Page 229
National Tracking Poll #210636, June, 2021
229
Table POL13_1
Table POL13_1: Are each of the following a major threat, a minor threat, or not a threat to American democracy?Restricting voting access
Demographic Major threat Minor threat Not a threatDon’t know / No
opinion Total N
Registered Voters 50% (986) 19% (385) 21% (419) 10% (200) 1990Party: Democrat/Leans Democrat 71% (634) 16% (138) 8% (68) 5% (48) 888Party: Republican/Leans Republican 30% (245) 23% (190) 35% (285) 11% (93) 814Note: Row proportions may total to larger than one-hundred percent due to rounding. For more information visit MorningConsultIntelligence.com.
Page 230
230
Morning ConsultTable POL13_2
Table POL13_2: Are each of the following a major threat, a minor threat, or not a threat to American democracy?Limiting early-voting
Demographic Major threat Minor threat Not a threatDon’t know / No
opinion Total N
Registered Voters 33% (665) 26% (509) 31% (608) 10% (208) 1990Gender: Male 33% (305) 26% (243) 32% (299) 9% (79) 927Gender: Female 34% (360) 25% (265) 29% (308) 12% (129) 1063Age: 18-34 28% (129) 27% (124) 25% (112) 20% (91) 456Age: 35-44 33% (99) 28% (84) 23% (70) 16% (47) 300Age: 45-64 33% (243) 24% (176) 35% (253) 8% (58) 730Age: 65+ 39% (194) 25% (124) 34% (173) 2% (12) 504GenZers: 1997-2012 21% (36) 24% (41) 30% (51) 25% (42) 169Millennials: 1981-1996 32% (152) 30% (145) 21% (102) 17% (81) 480GenXers: 1965-1980 35% (184) 27% (141) 28% (147) 10% (53) 525Baby Boomers: 1946-1964 36% (271) 22% (164) 38% (281) 4% (29) 746PID: Dem (no lean) 52% (393) 27% (202) 15% (110) 6% (47) 752PID: Ind (no lean) 29% (166) 23% (132) 34% (198) 14% (83) 578PID: Rep (no lean) 16% (106) 26% (175) 45% (300) 12% (79) 661PID/Gender: DemMen 51% (184) 29% (104) 16% (56) 4% (14) 359PID/Gender: DemWomen 53% (208) 25% (98) 14% (53) 8% (33) 393PID/Gender: Ind Men 28% (76) 24% (64) 37% (100) 10% (28) 267PID/Gender: Ind Women 29% (90) 22% (67) 32% (98) 18% (55) 311PID/Gender: Rep Men 15% (45) 25% (75) 48% (143) 13% (38) 301PID/Gender: Rep Women 17% (61) 28% (100) 44% (157) 11% (41) 360Ideo: Liberal (1-3) 54% (319) 24% (143) 15% (86) 7% (40) 587Ideo: Moderate (4) 36% (193) 28% (152) 26% (140) 10% (54) 539Ideo: Conservative (5-7) 18% (131) 27% (198) 49% (360) 7% (53) 742Educ: < College 32% (391) 23% (278) 31% (380) 14% (164) 1213Educ: Bachelors degree 34% (168) 29% (143) 30% (146) 6% (31) 489Educ: Post-grad 37% (106) 30% (87) 28% (82) 5% (13) 288Income: Under 50k 34% (342) 23% (231) 28% (282) 14% (137) 991Income: 50k-100k 31% (197) 29% (185) 33% (211) 7% (48) 640Income: 100k+ 35% (127) 26% (93) 32% (115) 7% (24) 359Ethnicity: White 31% (485) 26% (404) 34% (534) 10% (161) 1584Ethnicity: Hispanic 38% (74) 21% (42) 20% (40) 20% (40) 196
Continued on next page
Page 231
National Tracking Poll #210636, June, 2021
231
Table POL13_2
Table POL13_2: Are each of the following a major threat, a minor threat, or not a threat to American democracy?Limiting early-voting
Demographic Major threat Minor threat Not a threatDon’t know / No
opinion Total N
Registered Voters 33% (665) 26% (509) 31% (608) 10% (208) 1990Ethnicity: Black 51% (124) 22% (54) 16% (39) 10% (25) 243Ethnicity: Other 35% (57) 31% (50) 21% (34) 14% (22) 163All Christian 29% (275) 28% (270) 36% (346) 8% (73) 964All Non-Christian 45% (54) 24% (29) 22% (26) 10% (12) 121Atheist 36% (27) 27% (20) 28% (20) 9% (6) 73Agnostic/Nothing in particular 37% (184) 23% (112) 26% (129) 14% (70) 495Something Else 37% (125) 23% (79) 25% (85) 14% (48) 337Religious Non-Protestant/Catholic 40% (56) 25% (36) 24% (33) 12% (16) 140Evangelical 28% (151) 27% (147) 37% (205) 8% (45) 547Non-Evangelical 34% (242) 27% (192) 30% (216) 10% (71) 721Community: Urban 42% (222) 25% (132) 23% (121) 10% (53) 529Community: Suburban 30% (303) 27% (274) 34% (336) 9% (85) 998Community: Rural 30% (140) 22% (103) 32% (150) 15% (71) 464Employ: Private Sector 35% (215) 29% (180) 27% (171) 9% (56) 622Employ: Government 29% (37) 28% (37) 31% (39) 12% (16) 129Employ: Self-Employed 34% (53) 24% (38) 32% (50) 10% (16) 157Employ: Homemaker 21% (26) 23% (29) 40% (50) 17% (22) 127Employ: Retired 38% (222) 22% (130) 36% (207) 4% (23) 581Employ: Unemployed 28% (61) 24% (52) 26% (56) 22% (46) 215Employ: Other 32% (37) 28% (31) 19% (21) 21% (23) 113Military HH: Yes 30% (108) 29% (104) 35% (128) 6% (22) 361Military HH: No 34% (557) 25% (405) 29% (479) 11% (187) 1629RD/WT: Right Direction 49% (459) 26% (245) 17% (156) 9% (82) 941RD/WT: Wrong Track 20% (206) 25% (264) 43% (452) 12% (127) 1049Biden Job Approve 49% (513) 27% (285) 16% (167) 7% (72) 1037Biden Job Disapprove 17% (142) 24% (205) 50% (426) 10% (83) 857Biden Job Strongly Approve 61% (337) 21% (117) 13% (69) 5% (26) 548Biden Job Somewhat Approve 36% (176) 34% (168) 20% (99) 9% (46) 489Biden Job Somewhat Disapprove 24% (54) 30% (67) 35% (78) 11% (24) 223Biden Job Strongly Disapprove 14% (88) 22% (139) 55% (348) 9% (59) 634
Continued on next page
Page 232
232
Morning ConsultTable POL13_2
Table POL13_2: Are each of the following a major threat, a minor threat, or not a threat to American democracy?Limiting early-voting
Demographic Major threat Minor threat Not a threatDon’t know / No
opinion Total N
Registered Voters 33% (665) 26% (509) 31% (608) 10% (208) 1990Favorable of Biden 50% (522) 27% (282) 16% (171) 7% (74) 1048Unfavorable of Biden 16% (134) 25% (214) 49% (421) 10% (86) 855Very Favorable of Biden 60% (357) 24% (143) 12% (70) 4% (23) 593Somewhat Favorable of Biden 36% (165) 31% (139) 22% (101) 11% (51) 455Somewhat Unfavorable of Biden 23% (43) 34% (65) 33% (63) 10% (20) 190Very Unfavorable of Biden 14% (90) 23% (150) 54% (358) 10% (66) 664#1 Issue: Economy 26% (196) 29% (218) 33% (256) 12% (94) 763#1 Issue: Security 23% (79) 21% (75) 47% (166) 8% (30) 349#1 Issue: Health Care 44% (102) 29% (68) 18% (42) 9% (21) 233#1 Issue: Medicare / Social Security 49% (127) 23% (61) 21% (56) 6% (17) 261#1 Issue: Women’s Issues 39% (40) 24% (25) 18% (18) 19% (20) 103#1 Issue: Education 41% (35) 26% (22) 22% (19) 12% (10) 86#1 Issue: Energy 43% (37) 26% (22) 19% (16) 13% (11) 86#1 Issue: Other 45% (49) 16% (18) 32% (35) 6% (7) 1092020 Vote: Joe Biden 54% (480) 27% (244) 14% (127) 5% (46) 8972020 Vote: Donald Trump 15% (119) 25% (204) 51% (414) 10% (81) 8182020 Vote: Didn’t Vote 24% (58) 20% (48) 24% (58) 31% (75) 2392018 House Vote: Democrat 56% (387) 25% (173) 15% (106) 3% (21) 6872018 House Vote: Republican 16% (112) 26% (182) 49% (339) 8% (56) 6902018 House Vote: Someone else 35% (17) 19% (9) 32% (16) 14% (7) 502016 Vote: Hillary Clinton 56% (355) 25% (159) 14% (89) 5% (29) 6312016 Vote: Donald Trump 17% (132) 26% (200) 48% (370) 9% (66) 7682016 Vote: Other 36% (38) 21% (23) 31% (33) 12% (13) 1072016 Vote: Didn’t Vote 29% (141) 26% (127) 24% (116) 21% (100) 483Voted in 2014: Yes 37% (476) 26% (332) 32% (412) 6% (77) 1297Voted in 2014: No 27% (189) 25% (177) 28% (196) 19% (131) 6934-Region: Northeast 38% (130) 26% (89) 27% (92) 10% (34) 3444-Region: Midwest 32% (146) 28% (128) 30% (136) 10% (46) 4554-Region: South 33% (252) 24% (178) 33% (250) 10% (75) 7554-Region: West 32% (137) 26% (114) 30% (130) 12% (54) 435
Continued on next page
Page 233
National Tracking Poll #210636, June, 2021
233
Table POL13_2
Table POL13_2: Are each of the following a major threat, a minor threat, or not a threat to American democracy?Limiting early-voting
Demographic Major threat Minor threat Not a threatDon’t know / No
opinion Total N
Registered Voters 33% (665) 26% (509) 31% (608) 10% (208) 1990Party: Democrat/Leans Democrat 53% (467) 27% (237) 15% (130) 6% (53) 888Party: Republican/Leans Republican 15% (123) 26% (214) 46% (378) 12% (99) 814Note: Row proportions may total to larger than one-hundred percent due to rounding. For more information visit MorningConsultIntelligence.com.
Page 234
234
Morning ConsultTable POL13_3
Table POL13_3: Are each of the following a major threat, a minor threat, or not a threat to American democracy?Limiting drop boxes for voting
Demographic Major threat Minor threat Not a threatDon’t know / No
opinion Total N
Registered Voters 35% (696) 25% (492) 28% (550) 13% (252) 1990Gender: Male 35% (325) 25% (232) 30% (283) 9% (87) 927Gender: Female 35% (371) 24% (260) 25% (267) 15% (164) 1063Age: 18-34 30% (136) 30% (135) 19% (89) 21% (97) 456Age: 35-44 36% (109) 26% (79) 21% (63) 16% (48) 300Age: 45-64 34% (249) 24% (176) 31% (227) 11% (78) 730Age: 65+ 40% (202) 20% (102) 34% (171) 6% (29) 504GenZers: 1997-2012 25% (43) 26% (44) 20% (35) 28% (48) 169Millennials: 1981-1996 33% (158) 31% (147) 19% (93) 17% (82) 480GenXers: 1965-1980 36% (187) 26% (138) 25% (133) 13% (67) 525Baby Boomers: 1946-1964 38% (282) 21% (154) 35% (259) 7% (50) 746PID: Dem (no lean) 55% (415) 25% (189) 11% (83) 9% (65) 752PID: Ind (no lean) 27% (157) 25% (142) 31% (177) 18% (101) 578PID: Rep (no lean) 19% (124) 24% (161) 44% (290) 13% (85) 661PID/Gender: DemMen 56% (202) 25% (89) 13% (46) 6% (21) 359PID/Gender: DemWomen 54% (213) 25% (99) 9% (37) 11% (44) 393PID/Gender: Ind Men 26% (70) 26% (71) 35% (94) 12% (32) 267PID/Gender: Ind Women 28% (87) 23% (72) 27% (83) 22% (69) 311PID/Gender: Rep Men 18% (53) 24% (72) 47% (142) 11% (34) 301PID/Gender: Rep Women 20% (71) 25% (89) 41% (148) 14% (51) 360Ideo: Liberal (1-3) 57% (337) 24% (141) 10% (61) 8% (48) 587Ideo: Moderate (4) 37% (201) 29% (158) 20% (109) 13% (72) 539Ideo: Conservative (5-7) 19% (140) 23% (174) 49% (361) 9% (68) 742Educ: < College 33% (402) 24% (291) 28% (334) 15% (187) 1213Educ: Bachelors degree 38% (186) 26% (125) 27% (132) 9% (45) 489Educ: Post-grad 37% (108) 26% (76) 29% (84) 7% (20) 288Income: Under 50k 35% (349) 25% (249) 24% (236) 16% (157) 991Income: 50k-100k 34% (218) 23% (149) 33% (209) 10% (64) 640Income: 100k+ 36% (130) 26% (94) 29% (105) 9% (31) 359Ethnicity: White 33% (519) 25% (389) 31% (483) 12% (194) 1584Ethnicity: Hispanic 31% (62) 32% (63) 14% (28) 22% (44) 196
Continued on next page
Page 235
National Tracking Poll #210636, June, 2021
235
Table POL13_3
Table POL13_3: Are each of the following a major threat, a minor threat, or not a threat to American democracy?Limiting drop boxes for voting
Demographic Major threat Minor threat Not a threatDon’t know / No
opinion Total N
Registered Voters 35% (696) 25% (492) 28% (550) 13% (252) 1990Ethnicity: Black 49% (118) 20% (49) 16% (39) 15% (36) 243Ethnicity: Other 36% (59) 33% (54) 17% (28) 14% (22) 163All Christian 32% (308) 24% (230) 34% (326) 10% (99) 964All Non-Christian 47% (57) 22% (27) 22% (26) 9% (11) 121Atheist 45% (33) 23% (17) 20% (15) 12% (9) 73Agnostic/Nothing in particular 36% (177) 27% (133) 21% (105) 16% (79) 495Something Else 36% (122) 25% (84) 23% (77) 16% (53) 337Religious Non-Protestant/Catholic 41% (58) 23% (32) 23% (33) 12% (18) 140Evangelical 30% (166) 23% (126) 36% (195) 11% (60) 547Non-Evangelical 36% (259) 25% (179) 28% (198) 12% (85) 721Community: Urban 42% (221) 28% (146) 19% (100) 12% (62) 529Community: Suburban 34% (342) 24% (239) 31% (305) 11% (112) 998Community: Rural 29% (133) 23% (108) 31% (145) 17% (77) 464Employ: Private Sector 36% (222) 28% (176) 24% (151) 12% (71) 622Employ: Government 33% (42) 28% (36) 26% (34) 13% (17) 129Employ: Self-Employed 39% (62) 20% (31) 31% (49) 10% (16) 157Employ: Homemaker 26% (33) 18% (23) 38% (48) 19% (24) 127Employ: Retired 39% (228) 21% (122) 34% (195) 6% (35) 581Employ: Unemployed 23% (49) 30% (64) 22% (47) 26% (55) 215Employ: Other 39% (44) 25% (28) 14% (16) 22% (25) 113Military HH: Yes 32% (114) 27% (96) 32% (117) 9% (34) 361Military HH: No 36% (582) 24% (396) 27% (433) 13% (218) 1629RD/WT: Right Direction 50% (474) 26% (248) 12% (115) 11% (104) 941RD/WT: Wrong Track 21% (222) 23% (244) 41% (435) 14% (148) 1049Biden Job Approve 52% (537) 27% (278) 13% (130) 9% (93) 1037Biden Job Disapprove 17% (148) 23% (196) 48% (408) 12% (106) 857Biden Job Strongly Approve 65% (356) 19% (103) 10% (54) 6% (35) 548Biden Job Somewhat Approve 37% (181) 36% (175) 15% (76) 12% (57) 489Biden Job Somewhat Disapprove 21% (48) 37% (83) 27% (60) 15% (33) 223Biden Job Strongly Disapprove 16% (100) 18% (113) 55% (348) 11% (73) 634
Continued on next page
Page 236
236
Morning ConsultTable POL13_3
Table POL13_3: Are each of the following a major threat, a minor threat, or not a threat to American democracy?Limiting drop boxes for voting
Demographic Major threat Minor threat Not a threatDon’t know / No
opinion Total N
Registered Voters 35% (696) 25% (492) 28% (550) 13% (252) 1990Favorable of Biden 51% (537) 27% (280) 13% (134) 9% (97) 1048Unfavorable of Biden 17% (147) 23% (194) 48% (408) 12% (106) 855Very Favorable of Biden 62% (371) 21% (125) 11% (63) 6% (34) 593Somewhat Favorable of Biden 37% (167) 34% (155) 15% (70) 14% (63) 455Somewhat Unfavorable of Biden 24% (45) 37% (71) 25% (47) 14% (27) 190Very Unfavorable of Biden 15% (102) 18% (122) 54% (361) 12% (79) 664#1 Issue: Economy 28% (211) 28% (216) 30% (226) 15% (111) 763#1 Issue: Security 22% (76) 18% (64) 50% (176) 10% (34) 349#1 Issue: Health Care 45% (105) 30% (71) 12% (27) 13% (30) 233#1 Issue: Medicare / Social Security 53% (139) 20% (52) 20% (52) 7% (18) 261#1 Issue: Women’s Issues 35% (36) 32% (33) 11% (11) 21% (22) 103#1 Issue: Education 37% (31) 31% (27) 18% (16) 14% (12) 86#1 Issue: Energy 46% (40) 24% (20) 13% (11) 17% (15) 86#1 Issue: Other 52% (57) 9% (10) 29% (32) 9% (10) 1092020 Vote: Joe Biden 56% (501) 26% (235) 11% (95) 7% (66) 8972020 Vote: Donald Trump 16% (135) 22% (182) 49% (403) 12% (98) 8182020 Vote: Didn’t Vote 21% (51) 27% (65) 18% (43) 33% (79) 2392018 House Vote: Democrat 59% (402) 24% (165) 11% (78) 6% (42) 6872018 House Vote: Republican 18% (125) 23% (157) 50% (347) 9% (61) 6902018 House Vote: Someone else 34% (17) 24% (12) 21% (10) 21% (10) 502016 Vote: Hillary Clinton 60% (377) 23% (143) 10% (63) 8% (48) 6312016 Vote: Donald Trump 19% (149) 22% (168) 48% (370) 10% (80) 7682016 Vote: Other 30% (32) 32% (34) 28% (30) 11% (12) 1072016 Vote: Didn’t Vote 28% (138) 30% (147) 18% (87) 23% (111) 483Voted in 2014: Yes 39% (507) 23% (298) 30% (394) 8% (99) 1297Voted in 2014: No 27% (189) 28% (195) 22% (156) 22% (153) 6934-Region: Northeast 42% (146) 23% (79) 24% (82) 11% (37) 3444-Region: Midwest 32% (146) 30% (136) 26% (120) 12% (53) 4554-Region: South 34% (254) 22% (164) 31% (234) 14% (104) 7554-Region: West 34% (150) 26% (114) 26% (114) 13% (58) 435
Continued on next page
Page 237
National Tracking Poll #210636, June, 2021
237
Table POL13_3
Table POL13_3: Are each of the following a major threat, a minor threat, or not a threat to American democracy?Limiting drop boxes for voting
Demographic Major threat Minor threat Not a threatDon’t know / No
opinion Total N
Registered Voters 35% (696) 25% (492) 28% (550) 13% (252) 1990Party: Democrat/Leans Democrat 55% (485) 26% (233) 11% (97) 8% (73) 888Party: Republican/Leans Republican 17% (138) 24% (194) 46% (371) 14% (111) 814Note: Row proportions may total to larger than one-hundred percent due to rounding. For more information visit MorningConsultIntelligence.com.
Page 238
238
Morning ConsultTable POL14
Table POL14: Do you believe Donald Trump should play a major role in the Republican party, a minor role in the Republican party, or should he nolonger play a role in the Republican party?
Demographic
Play a major rolein the Republican
party
Play a minor rolein the Republican
party
No longer play arole in the
Republican partyDon’t know / No
opinion Total N
Registered Voters 29% (582) 14% (279) 45% (886) 12% (244) 1990Gender: Male 31% (290) 14% (134) 43% (399) 11% (104) 927Gender: Female 27% (292) 14% (145) 46% (486) 13% (139) 1063Age: 18-34 25% (112) 16% (72) 37% (168) 23% (103) 456Age: 35-44 35% (104) 13% (39) 38% (113) 15% (44) 300Age: 45-64 34% (246) 13% (94) 44% (319) 10% (71) 730Age: 65+ 24% (120) 14% (73) 57% (285) 5% (26) 504GenZers: 1997-2012 15% (26) 16% (27) 38% (64) 31% (52) 169Millennials: 1981-1996 33% (160) 15% (73) 35% (167) 17% (80) 480GenXers: 1965-1980 30% (159) 12% (65) 46% (240) 11% (60) 525Baby Boomers: 1946-1964 30% (222) 14% (101) 51% (377) 6% (46) 746PID: Dem (no lean) 9% (67) 9% (70) 73% (547) 9% (67) 752PID: Ind (no lean) 22% (129) 12% (72) 44% (253) 22% (125) 578PID: Rep (no lean) 59% (387) 21% (136) 13% (86) 8% (52) 661PID/Gender: DemMen 14% (51) 12% (42) 66% (238) 8% (28) 359PID/Gender: DemWomen 4% (15) 7% (29) 79% (309) 10% (40) 393PID/Gender: Ind Men 25% (66) 13% (34) 42% (113) 20% (54) 267PID/Gender: Ind Women 20% (63) 12% (38) 45% (140) 23% (71) 311PID/Gender: Rep Men 57% (173) 19% (58) 16% (48) 8% (23) 301PID/Gender: Rep Women 60% (214) 22% (79) 10% (37) 8% (29) 360Ideo: Liberal (1-3) 10% (61) 8% (50) 71% (418) 10% (59) 587Ideo: Moderate (4) 19% (105) 13% (69) 55% (294) 13% (71) 539Ideo: Conservative (5-7) 53% (390) 20% (150) 19% (142) 8% (60) 742Educ: < College 31% (376) 14% (167) 41% (493) 15% (177) 1213Educ: Bachelors degree 26% (126) 13% (64) 50% (246) 11% (52) 489Educ: Post-grad 28% (80) 17% (48) 51% (146) 5% (15) 288Income: Under 50k 29% (287) 11% (114) 45% (441) 15% (149) 991Income: 50k-100k 30% (195) 15% (97) 44% (280) 11% (67) 640Income: 100k+ 28% (100) 19% (68) 46% (164) 8% (27) 359Ethnicity: White 34% (532) 15% (234) 41% (654) 10% (164) 1584
Continued on next page
Page 239
National Tracking Poll #210636, June, 2021
239
Table POL14
Table POL14: Do you believe Donald Trump should play a major role in the Republican party, a minor role in the Republican party, or should he nolonger play a role in the Republican party?
Demographic
Play a major rolein the Republican
party
Play a minor rolein the Republican
party
No longer play arole in the
Republican partyDon’t know / No
opinion Total N
Registered Voters 29% (582) 14% (279) 45% (886) 12% (244) 1990Ethnicity: Hispanic 21% (41) 15% (30) 41% (80) 23% (44) 196Ethnicity: Black 10% (24) 10% (24) 63% (153) 17% (42) 243Ethnicity: Other 16% (26) 12% (20) 48% (79) 24% (39) 163All Christian 34% (324) 17% (160) 41% (392) 9% (87) 964All Non-Christian 27% (33) 14% (16) 50% (61) 9% (11) 121Atheist 12% (9) 8% (6) 67% (49) 12% (9) 73Agnostic/Nothing in particular 20% (100) 12% (58) 51% (254) 17% (83) 495Something Else 34% (116) 11% (38) 39% (130) 16% (53) 337Religious Non-Protestant/Catholic 29% (41) 14% (19) 47% (66) 10% (14) 140Evangelical 44% (243) 15% (84) 29% (158) 11% (63) 547Non-Evangelical 26% (185) 15% (108) 49% (355) 10% (73) 721Community: Urban 26% (138) 11% (56) 50% (264) 14% (71) 529Community: Suburban 28% (276) 15% (153) 46% (462) 11% (107) 998Community: Rural 36% (168) 15% (70) 35% (160) 14% (65) 464Employ: Private Sector 32% (200) 15% (92) 43% (265) 10% (64) 622Employ: Government 37% (47) 19% (24) 30% (39) 15% (19) 129Employ: Self-Employed 36% (57) 12% (19) 42% (65) 10% (16) 157Employ: Homemaker 35% (44) 16% (20) 32% (41) 17% (21) 127Employ: Retired 26% (150) 15% (86) 53% (309) 6% (36) 581Employ: Unemployed 22% (47) 11% (24) 46% (99) 21% (45) 215Employ: Other 25% (29) 5% (6) 43% (48) 26% (30) 113Military HH: Yes 32% (116) 17% (62) 42% (151) 9% (33) 361Military HH: No 29% (466) 13% (217) 45% (735) 13% (211) 1629RD/WT: Right Direction 11% (100) 10% (93) 69% (651) 10% (97) 941RD/WT: Wrong Track 46% (482) 18% (186) 22% (234) 14% (147) 1049Biden Job Approve 10% (103) 9% (98) 72% (746) 9% (91) 1037Biden Job Disapprove 54% (465) 20% (170) 14% (121) 12% (102) 857
Continued on next page
Page 240
240
Morning ConsultTable POL14
Table POL14: Do you believe Donald Trump should play a major role in the Republican party, a minor role in the Republican party, or should he nolonger play a role in the Republican party?
Demographic
Play a major rolein the Republican
party
Play a minor rolein the Republican
party
No longer play arole in the
Republican partyDon’t know / No
opinion Total N
Registered Voters 29% (582) 14% (279) 45% (886) 12% (244) 1990Biden Job Strongly Approve 11% (61) 6% (31) 76% (414) 8% (42) 548Biden Job Somewhat Approve 9% (42) 14% (67) 68% (331) 10% (49) 489Biden Job Somewhat Disapprove 26% (58) 32% (71) 28% (62) 15% (32) 223Biden Job Strongly Disapprove 64% (407) 16% (99) 9% (59) 11% (69) 634Favorable of Biden 9% (95) 10% (102) 72% (755) 9% (96) 1048Unfavorable of Biden 55% (472) 20% (168) 13% (111) 12% (103) 855Very Favorable of Biden 10% (58) 5% (30) 78% (460) 7% (44) 593Somewhat Favorable of Biden 8% (37) 16% (72) 65% (295) 11% (52) 455Somewhat Unfavorable of Biden 27% (51) 28% (54) 30% (57) 15% (29) 190Very Unfavorable of Biden 63% (421) 17% (115) 8% (55) 11% (74) 664#1 Issue: Economy 30% (230) 17% (132) 39% (295) 14% (106) 763#1 Issue: Security 54% (190) 17% (58) 19% (68) 10% (34) 349#1 Issue: Health Care 20% (46) 9% (21) 61% (142) 11% (25) 233#1 Issue: Medicare / Social Security 22% (56) 10% (26) 62% (162) 6% (17) 261#1 Issue: Women’s Issues 9% (9) 7% (7) 58% (59) 27% (27) 103#1 Issue: Education 16% (14) 14% (12) 57% (49) 13% (11) 86#1 Issue: Energy 15% (13) 17% (15) 52% (45) 15% (13) 86#1 Issue: Other 22% (24) 8% (9) 60% (65) 10% (11) 1092020 Vote: Joe Biden 7% (65) 7% (66) 77% (691) 8% (75) 8972020 Vote: Donald Trump 58% (474) 20% (165) 11% (94) 10% (86) 8182020 Vote: Didn’t Vote 17% (42) 17% (41) 34% (82) 31% (74) 2392018 House Vote: Democrat 7% (51) 7% (49) 79% (541) 7% (45) 6872018 House Vote: Republican 55% (380) 20% (140) 15% (103) 10% (66) 6902018 House Vote: Someone else 16% (8) 15% (7) 50% (25) 20% (10) 502016 Vote: Hillary Clinton 8% (48) 7% (42) 78% (494) 7% (47) 6312016 Vote: Donald Trump 54% (411) 20% (153) 16% (125) 10% (79) 7682016 Vote: Other 6% (6) 13% (14) 67% (72) 15% (16) 1072016 Vote: Didn’t Vote 24% (117) 14% (69) 40% (195) 21% (102) 483
Continued on next page
Page 241
National Tracking Poll #210636, June, 2021
241
Table POL14
Table POL14: Do you believe Donald Trump should play a major role in the Republican party, a minor role in the Republican party, or should he nolonger play a role in the Republican party?
Demographic
Play a major rolein the Republican
party
Play a minor rolein the Republican
party
No longer play arole in the
Republican partyDon’t know / No
opinion Total N
Registered Voters 29% (582) 14% (279) 45% (886) 12% (244) 1990Voted in 2014: Yes 30% (391) 14% (179) 47% (612) 9% (115) 1297Voted in 2014: No 28% (191) 14% (100) 39% (273) 19% (128) 6934-Region: Northeast 27% (93) 14% (50) 47% (163) 11% (39) 3444-Region: Midwest 30% (135) 12% (55) 48% (220) 10% (44) 4554-Region: South 33% (248) 15% (114) 38% (288) 14% (105) 7554-Region: West 24% (106) 14% (60) 49% (214) 13% (56) 435Party: Democrat/Leans Democrat 9% (76) 9% (79) 74% (658) 9% (76) 888Party: Republican/Leans Republican 57% (460) 20% (160) 14% (114) 10% (80) 814Note: Row proportions may total to larger than one-hundred percent due to rounding. For more information visit MorningConsultIntelligence.com.
Page 242
242
Morning ConsultTable POL15
Table POL15: How likely do you think it is that former President Donald Trump will be reinstated as U.S. President this year, if at all?
Demographic Very likelySomewhatlikely Not very likely Not likely at all
Don’t know /No opinion Total N
Registered Voters 10% (203) 9% (180) 13% (262) 59% (1177) 8% (168) 1990Gender: Male 11% (104) 8% (78) 12% (110) 62% (577) 6% (58) 927Gender: Female 9% (99) 10% (102) 14% (152) 56% (600) 10% (110) 1063Age: 18-34 15% (70) 16% (73) 13% (57) 42% (191) 14% (65) 456Age: 35-44 13% (40) 13% (39) 13% (38) 51% (152) 11% (32) 300Age: 45-64 10% (71) 7% (51) 14% (100) 64% (464) 6% (43) 730Age: 65+ 4% (22) 3% (17) 13% (67) 73% (370) 6% (28) 504GenZers: 1997-2012 10% (17) 17% (29) 16% (28) 40% (67) 17% (28) 169Millennials: 1981-1996 17% (82) 15% (73) 12% (56) 44% (211) 12% (57) 480GenXers: 1965-1980 10% (55) 7% (39) 12% (64) 62% (325) 8% (42) 525Baby Boomers: 1946-1964 6% (45) 5% (37) 14% (107) 70% (520) 5% (37) 746PID: Dem (no lean) 7% (50) 6% (43) 7% (56) 77% (575) 4% (27) 752PID: Ind (no lean) 7% (41) 10% (58) 11% (64) 59% (342) 13% (72) 578PID: Rep (no lean) 17% (111) 12% (79) 22% (142) 39% (259) 10% (69) 661PID/Gender: DemMen 11% (38) 6% (21) 8% (27) 74% (264) 2% (9) 359PID/Gender: DemWomen 3% (12) 6% (22) 7% (29) 79% (311) 5% (18) 393PID/Gender: Ind Men 6% (16) 10% (28) 10% (27) 64% (172) 9% (25) 267PID/Gender: Ind Women 8% (26) 10% (30) 12% (37) 55% (170) 15% (47) 311PID/Gender: Rep Men 17% (50) 10% (30) 19% (57) 47% (141) 8% (24) 301PID/Gender: Rep Women 17% (61) 14% (49) 24% (86) 33% (118) 13% (45) 360Ideo: Liberal (1-3) 7% (41) 5% (32) 7% (42) 76% (444) 5% (28) 587Ideo: Moderate (4) 8% (46) 10% (52) 10% (56) 65% (352) 6% (33) 539Ideo: Conservative (5-7) 13% (98) 12% (88) 21% (157) 45% (335) 9% (65) 742Educ: < College 10% (126) 10% (125) 13% (164) 55% (667) 11% (130) 1213Educ: Bachelors degree 9% (44) 7% (33) 14% (68) 65% (319) 5% (25) 489Educ: Post-grad 11% (32) 8% (22) 11% (31) 66% (191) 4% (13) 288Income: Under 50k 10% (97) 11% (108) 11% (111) 57% (567) 11% (108) 991Income: 50k-100k 10% (63) 8% (54) 16% (100) 61% (388) 5% (35) 640Income: 100k+ 12% (43) 5% (18) 14% (52) 62% (221) 7% (25) 359Ethnicity: White 11% (178) 9% (146) 14% (216) 58% (916) 8% (128) 1584Ethnicity: Hispanic 5% (10) 12% (23) 14% (27) 54% (106) 15% (30) 196Ethnicity: Black 7% (18) 9% (22) 9% (22) 67% (163) 7% (18) 243
Continued on next page
Page 243
National Tracking Poll #210636, June, 2021
243
Table POL15
Table POL15: How likely do you think it is that former President Donald Trump will be reinstated as U.S. President this year, if at all?
Demographic Very likelySomewhatlikely Not very likely Not likely at all
Don’t know /No opinion Total N
Registered Voters 10% (203) 9% (180) 13% (262) 59% (1177) 8% (168) 1990Ethnicity: Other 4% (7) 7% (12) 15% (24) 60% (98) 14% (22) 163All Christian 10% (92) 8% (78) 16% (150) 59% (571) 8% (73) 964All Non-Christian 23% (28) 6% (7) 7% (8) 62% (75) 2% (3) 121Atheist 4% (3) 7% (5) 14% (10) 72% (53) 4% (3) 73Agnostic/Nothing in particular 7% (33) 9% (44) 10% (48) 65% (323) 9% (46) 495Something Else 14% (47) 13% (45) 14% (46) 46% (155) 13% (43) 337Religious Non-Protestant/Catholic 23% (32) 7% (9) 8% (12) 60% (84) 2% (3) 140Evangelical 17% (94) 12% (64) 16% (85) 46% (250) 10% (54) 547Non-Evangelical 5% (37) 8% (57) 15% (105) 64% (461) 8% (61) 721Community: Urban 15% (80) 11% (61) 9% (50) 57% (304) 7% (35) 529Community: Suburban 6% (63) 7% (70) 14% (144) 64% (637) 8% (84) 998Community: Rural 13% (60) 11% (49) 15% (69) 51% (236) 11% (49) 464Employ: Private Sector 12% (74) 12% (75) 14% (87) 57% (353) 5% (33) 622Employ: Government 22% (28) 11% (14) 12% (16) 44% (56) 11% (14) 129Employ: Self-Employed 19% (30) 12% (19) 10% (16) 49% (77) 10% (16) 157Employ: Homemaker 9% (11) 11% (14) 19% (23) 44% (55) 18% (22) 127Employ: Retired 6% (32) 4% (23) 13% (73) 73% (425) 5% (28) 581Employ: Unemployed 4% (9) 10% (22) 13% (29) 57% (123) 15% (32) 215Employ: Other 12% (14) 7% (8) 9% (10) 59% (66) 14% (15) 113Military HH: Yes 11% (40) 7% (26) 15% (53) 60% (216) 8% (27) 361Military HH: No 10% (163) 9% (154) 13% (209) 59% (961) 9% (141) 1629RD/WT: Right Direction 7% (70) 6% (56) 7% (69) 75% (703) 5% (44) 941RD/WT: Wrong Track 13% (133) 12% (124) 18% (193) 45% (473) 12% (125) 1049Biden Job Approve 8% (79) 6% (64) 7% (75) 76% (787) 3% (32) 1037Biden Job Disapprove 14% (122) 12% (103) 21% (178) 41% (356) 11% (99) 857Biden Job Strongly Approve 10% (58) 4% (22) 4% (22) 79% (433) 3% (14) 548Biden Job Somewhat Approve 4% (21) 9% (43) 11% (53) 72% (354) 4% (18) 489Biden Job Somewhat Disapprove 6% (13) 12% (26) 20% (45) 51% (114) 11% (26) 223Biden Job Strongly Disapprove 17% (109) 12% (77) 21% (134) 38% (242) 12% (73) 634Favorable of Biden 7% (69) 6% (58) 7% (75) 77% (805) 4% (41) 1048Unfavorable of Biden 15% (125) 13% (109) 22% (184) 40% (339) 11% (98) 855
Continued on next page
Page 244
244
Morning ConsultTable POL15
Table POL15: How likely do you think it is that former President Donald Trump will be reinstated as U.S. President this year, if at all?
Demographic Very likelySomewhatlikely Not very likely Not likely at all
Don’t know /No opinion Total N
Registered Voters 10% (203) 9% (180) 13% (262) 59% (1177) 8% (168) 1990Very Favorable of Biden 9% (51) 4% (24) 4% (26) 80% (476) 3% (17) 593Somewhat Favorable of Biden 4% (18) 7% (34) 11% (49) 72% (330) 5% (25) 455Somewhat Unfavorable of Biden 6% (12) 14% (26) 22% (41) 48% (92) 11% (20) 190Very Unfavorable of Biden 17% (114) 13% (83) 21% (143) 37% (247) 12% (78) 664#1 Issue: Economy 9% (70) 10% (75) 16% (118) 57% (434) 9% (66) 763#1 Issue: Security 17% (58) 12% (42) 17% (59) 43% (149) 12% (41) 349#1 Issue: Health Care 13% (30) 9% (20) 7% (17) 66% (155) 5% (11) 233#1 Issue: Medicare / Social Security 6% (16) 6% (15) 9% (23) 75% (195) 5% (13) 261#1 Issue: Women’s Issues 2% (2) 9% (9) 12% (13) 62% (63) 15% (16) 103#1 Issue: Education 9% (8) 9% (8) 14% (12) 61% (52) 7% (6) 86#1 Issue: Energy 12% (10) 6% (5) 13% (11) 63% (54) 6% (6) 86#1 Issue: Other 9% (9) 6% (6) 8% (9) 68% (74) 9% (10) 1092020 Vote: Joe Biden 6% (52) 5% (48) 6% (55) 80% (715) 3% (28) 8972020 Vote: Donald Trump 16% (134) 12% (99) 21% (170) 40% (324) 11% (91) 8182020 Vote: Didn’t Vote 7% (17) 13% (31) 14% (33) 48% (115) 18% (43) 2392018 House Vote: Democrat 5% (34) 5% (35) 5% (36) 83% (571) 2% (11) 6872018 House Vote: Republican 17% (115) 11% (74) 20% (141) 43% (294) 10% (66) 6902018 House Vote: Someone else 5% (2) 5% (2) 6% (3) 67% (33) 17% (8) 502016 Vote: Hillary Clinton 5% (33) 4% (24) 6% (36) 83% (526) 2% (13) 6312016 Vote: Donald Trump 16% (121) 12% (90) 20% (152) 44% (335) 9% (70) 7682016 Vote: Other 3% (3) 8% (8) 8% (9) 68% (72) 14% (15) 1072016 Vote: Didn’t Vote 9% (46) 12% (57) 14% (66) 50% (244) 15% (70) 483Voted in 2014: Yes 11% (137) 7% (94) 13% (169) 63% (818) 6% (79) 1297Voted in 2014: No 9% (66) 12% (86) 14% (94) 52% (358) 13% (89) 6934-Region: Northeast 14% (47) 8% (27) 12% (40) 59% (204) 8% (27) 3444-Region: Midwest 11% (49) 8% (38) 14% (63) 61% (276) 6% (29) 4554-Region: South 9% (71) 10% (74) 14% (105) 57% (432) 10% (75) 7554-Region: West 8% (37) 10% (42) 12% (54) 61% (265) 9% (37) 435Party: Democrat/Leans Democrat 6% (53) 6% (50) 7% (63) 78% (690) 4% (32) 888Party: Republican/Leans Republican 16% (129) 12% (96) 21% (169) 41% (333) 11% (86) 814Note: Row proportions may total to larger than one-hundred percent due to rounding. For more information visit MorningConsultIntelligence.com.
Page 245
National Tracking Poll #210636, June, 2021
245
Table POL16
Table POL16: As you may know, Senate Republicans have introduced a nearly $1 trillion plan to improve America’s infrastructure. Do you supportor oppose the Senate Republicans’ infrastructure plan?
DemographicStronglysupport
Somewhatsupport
Somewhatoppose
Stronglyoppose
Don’t know /No opinion Total N
Registered Voters 17% (346) 31% (614) 16% (309) 14% (270) 23% (451) 1990Gender: Male 20% (189) 33% (303) 15% (136) 16% (144) 17% (154) 927Gender: Female 15% (157) 29% (310) 16% (173) 12% (126) 28% (297) 1063Age: 18-34 20% (92) 27% (125) 13% (59) 9% (42) 30% (138) 456Age: 35-44 18% (55) 30% (91) 13% (40) 10% (30) 28% (84) 300Age: 45-64 17% (121) 31% (229) 16% (119) 17% (123) 19% (139) 730Age: 65+ 16% (78) 33% (169) 18% (91) 15% (76) 18% (90) 504GenZers: 1997-2012 15% (25) 28% (47) 10% (18) 7% (12) 40% (67) 169Millennials: 1981-1996 21% (102) 31% (150) 13% (64) 10% (48) 24% (116) 480GenXers: 1965-1980 17% (88) 29% (150) 15% (81) 17% (87) 23% (119) 525Baby Boomers: 1946-1964 16% (118) 32% (239) 19% (140) 15% (111) 19% (138) 746PID: Dem (no lean) 14% (108) 22% (167) 19% (146) 21% (157) 23% (172) 752PID: Ind (no lean) 13% (77) 34% (199) 13% (75) 10% (56) 29% (170) 578PID: Rep (no lean) 24% (161) 37% (248) 13% (87) 9% (56) 17% (109) 661PID/Gender: DemMen 20% (73) 23% (81) 19% (66) 23% (84) 15% (55) 359PID/Gender: DemWomen 9% (36) 22% (85) 20% (80) 19% (74) 30% (118) 393PID/Gender: Ind Men 14% (38) 40% (108) 11% (30) 11% (30) 23% (61) 267PID/Gender: Ind Women 13% (39) 29% (91) 15% (45) 8% (26) 35% (109) 311PID/Gender: Rep Men 26% (79) 38% (114) 13% (40) 10% (30) 13% (38) 301PID/Gender: Rep Women 23% (82) 37% (134) 13% (47) 7% (26) 20% (71) 360Ideo: Liberal (1-3) 14% (80) 24% (139) 21% (123) 20% (120) 21% (125) 587Ideo: Moderate (4) 15% (81) 32% (173) 15% (80) 13% (71) 25% (134) 539Ideo: Conservative (5-7) 23% (169) 38% (283) 13% (100) 9% (68) 16% (122) 742Educ: < College 17% (200) 30% (361) 15% (184) 13% (152) 26% (316) 1213Educ: Bachelors degree 17% (84) 32% (157) 16% (80) 16% (80) 18% (87) 489Educ: Post-grad 21% (61) 33% (96) 16% (45) 13% (38) 17% (48) 288Income: Under 50k 17% (169) 28% (277) 16% (157) 14% (142) 25% (246) 991Income: 50k-100k 16% (104) 32% (202) 16% (100) 14% (87) 23% (147) 640Income: 100k+ 20% (73) 38% (135) 14% (51) 11% (41) 16% (59) 359Ethnicity: White 18% (290) 32% (509) 15% (241) 12% (197) 22% (346) 1584Ethnicity: Hispanic 11% (22) 33% (64) 12% (24) 14% (28) 30% (59) 196
Continued on next page
Page 246
246
Morning ConsultTable POL16
Table POL16: As you may know, Senate Republicans have introduced a nearly $1 trillion plan to improve America’s infrastructure. Do you supportor oppose the Senate Republicans’ infrastructure plan?
DemographicStronglysupport
Somewhatsupport
Somewhatoppose
Stronglyoppose
Don’t know /No opinion Total N
Registered Voters 17% (346) 31% (614) 16% (309) 14% (270) 23% (451) 1990Ethnicity: Black 14% (34) 25% (60) 16% (39) 20% (49) 25% (60) 243Ethnicity: Other 13% (21) 27% (44) 18% (29) 15% (24) 28% (45) 163All Christian 20% (193) 35% (338) 15% (146) 12% (119) 17% (167) 964All Non-Christian 26% (32) 31% (37) 11% (13) 16% (19) 17% (21) 121Atheist 12% (9) 18% (13) 21% (15) 27% (20) 22% (16) 73Agnostic/Nothing in particular 12% (57) 27% (131) 19% (93) 14% (68) 29% (146) 495Something Else 16% (55) 28% (93) 12% (42) 13% (44) 30% (102) 337Religious Non-Protestant/Catholic 26% (37) 32% (45) 12% (17) 14% (20) 16% (22) 140Evangelical 23% (124) 34% (184) 14% (75) 11% (59) 19% (106) 547Non-Evangelical 16% (118) 33% (236) 15% (108) 14% (100) 22% (159) 721Community: Urban 22% (115) 28% (148) 14% (73) 16% (85) 20% (107) 529Community: Suburban 16% (159) 33% (327) 14% (144) 13% (130) 24% (238) 998Community: Rural 15% (72) 30% (139) 20% (92) 12% (55) 23% (107) 464Employ: Private Sector 17% (106) 30% (184) 17% (107) 16% (98) 20% (127) 622Employ: Government 27% (34) 30% (39) 11% (14) 12% (16) 20% (25) 129Employ: Self-Employed 26% (41) 24% (38) 13% (20) 16% (25) 21% (34) 157Employ: Homemaker 20% (25) 33% (42) 11% (14) 4% (5) 32% (40) 127Employ: Retired 15% (88) 35% (203) 18% (102) 15% (86) 18% (103) 581Employ: Unemployed 14% (29) 29% (63) 14% (30) 11% (23) 32% (69) 215Employ: Other 15% (17) 29% (32) 14% (16) 13% (14) 29% (33) 113Military HH: Yes 25% (91) 35% (126) 12% (44) 11% (40) 17% (61) 361Military HH: No 16% (255) 30% (488) 16% (265) 14% (230) 24% (391) 1629RD/WT: Right Direction 17% (158) 26% (243) 17% (161) 18% (170) 22% (210) 941RD/WT: Wrong Track 18% (188) 35% (371) 14% (148) 10% (100) 23% (241) 1049Biden Job Approve 16% (167) 27% (283) 18% (187) 17% (181) 21% (219) 1037Biden Job Disapprove 20% (174) 36% (306) 14% (120) 10% (88) 20% (169) 857Biden Job Strongly Approve 21% (116) 19% (103) 18% (98) 23% (128) 19% (103) 548Biden Job Somewhat Approve 10% (51) 37% (180) 18% (88) 11% (53) 24% (116) 489Biden Job Somewhat Disapprove 13% (30) 40% (89) 17% (38) 6% (12) 24% (54) 223Biden Job Strongly Disapprove 23% (145) 34% (218) 13% (82) 12% (76) 18% (114) 634
Continued on next page
Page 247
National Tracking Poll #210636, June, 2021
247
Table POL16
Table POL16: As you may know, Senate Republicans have introduced a nearly $1 trillion plan to improve America’s infrastructure. Do you supportor oppose the Senate Republicans’ infrastructure plan?
DemographicStronglysupport
Somewhatsupport
Somewhatoppose
Stronglyoppose
Don’t know /No opinion Total N
Registered Voters 17% (346) 31% (614) 16% (309) 14% (270) 23% (451) 1990Favorable of Biden 15% (161) 27% (284) 18% (189) 18% (184) 22% (230) 1048Unfavorable of Biden 20% (173) 37% (319) 13% (113) 9% (79) 20% (170) 855Very Favorable of Biden 18% (107) 19% (115) 19% (114) 24% (140) 20% (118) 593Somewhat Favorable of Biden 12% (54) 37% (170) 17% (76) 10% (43) 25% (112) 455Somewhat Unfavorable of Biden 13% (25) 44% (84) 13% (25) 4% (8) 25% (48) 190Very Unfavorable of Biden 22% (148) 35% (236) 13% (88) 11% (71) 18% (122) 664#1 Issue: Economy 15% (114) 33% (255) 17% (129) 11% (83) 24% (182) 763#1 Issue: Security 25% (87) 36% (125) 11% (37) 9% (32) 20% (68) 349#1 Issue: Health Care 19% (45) 25% (59) 12% (29) 23% (53) 21% (48) 233#1 Issue: Medicare / Social Security 19% (48) 27% (72) 17% (46) 17% (43) 20% (52) 261#1 Issue: Women’s Issues 13% (13) 22% (23) 17% (17) 13% (13) 36% (37) 103#1 Issue: Education 15% (13) 33% (29) 17% (14) 11% (9) 25% (21) 86#1 Issue: Energy 22% (19) 31% (26) 16% (14) 12% (10) 19% (17) 86#1 Issue: Other 6% (7) 23% (25) 22% (24) 24% (26) 25% (27) 1092020 Vote: Joe Biden 14% (124) 25% (228) 19% (168) 20% (176) 22% (200) 8972020 Vote: Donald Trump 23% (192) 38% (308) 13% (105) 9% (74) 17% (139) 8182020 Vote: Didn’t Vote 11% (27) 29% (69) 12% (28) 7% (17) 41% (98) 2392018 House Vote: Democrat 13% (89) 24% (164) 20% (136) 23% (161) 20% (136) 6872018 House Vote: Republican 24% (162) 39% (269) 13% (89) 8% (56) 16% (113) 6902018 House Vote: Someone else 21% (10) 23% (11) 8% (4) 15% (7) 33% (17) 502016 Vote: Hillary Clinton 13% (81) 22% (142) 20% (128) 23% (148) 21% (132) 6312016 Vote: Donald Trump 23% (178) 38% (295) 13% (97) 9% (69) 17% (128) 7682016 Vote: Other 14% (15) 32% (34) 18% (19) 11% (12) 25% (27) 1072016 Vote: Didn’t Vote 15% (71) 29% (142) 14% (65) 8% (40) 34% (165) 483Voted in 2014: Yes 19% (245) 31% (402) 16% (206) 16% (210) 18% (234) 1297Voted in 2014: No 15% (101) 31% (211) 15% (103) 9% (60) 31% (217) 6934-Region: Northeast 16% (55) 34% (117) 14% (48) 10% (36) 26% (88) 3444-Region: Midwest 16% (71) 31% (140) 17% (75) 17% (77) 20% (92) 4554-Region: South 20% (149) 32% (242) 14% (109) 12% (91) 22% (165) 7554-Region: West 16% (70) 26% (115) 18% (77) 15% (67) 25% (107) 435
Continued on next page
Page 248
248
Morning ConsultTable POL16
Table POL16: As you may know, Senate Republicans have introduced a nearly $1 trillion plan to improve America’s infrastructure. Do you supportor oppose the Senate Republicans’ infrastructure plan?
DemographicStronglysupport
Somewhatsupport
Somewhatoppose
Stronglyoppose
Don’t know /No opinion Total N
Registered Voters 17% (346) 31% (614) 16% (309) 14% (270) 23% (451) 1990Party: Democrat/Leans Democrat 14% (125) 24% (209) 19% (170) 20% (177) 23% (207) 888Party: Republican/Leans Republican 22% (180) 38% (311) 13% (108) 8% (67) 18% (147) 814Note: Row proportions may total to larger than one-hundred percent due to rounding. For more information visit MorningConsultIntelligence.com.
Page 249
National Tracking Poll #210636, June, 2021
249
Table POL17
Table POL17: As you may know, President Biden has introduced a $2.3 trillion plan to improve America’s infrastructure. Do you support or opposeBiden’s infrastructure plan?
DemographicStronglysupport
Somewhatsupport
Somewhatoppose
Stronglyoppose
Don’t know /No opinion Total N
Registered Voters 27% (542) 25% (491) 11% (227) 23% (449) 14% (281) 1990Gender: Male 30% (282) 26% (240) 9% (86) 25% (235) 9% (85) 927Gender: Female 24% (260) 24% (251) 13% (141) 20% (215) 18% (196) 1063Age: 18-34 25% (115) 30% (136) 10% (48) 11% (50) 24% (108) 456Age: 35-44 30% (90) 26% (77) 9% (27) 15% (46) 20% (59) 300Age: 45-64 25% (182) 24% (174) 13% (96) 28% (204) 10% (74) 730Age: 65+ 31% (155) 20% (103) 11% (56) 30% (149) 8% (41) 504GenZers: 1997-2012 18% (31) 28% (48) 9% (16) 9% (16) 35% (59) 169Millennials: 1981-1996 29% (140) 29% (140) 11% (51) 13% (64) 18% (86) 480GenXers: 1965-1980 27% (143) 25% (133) 11% (59) 23% (121) 13% (69) 525Baby Boomers: 1946-1964 28% (209) 21% (157) 12% (93) 30% (225) 8% (62) 746PID: Dem (no lean) 50% (378) 33% (250) 4% (29) 4% (27) 9% (68) 752PID: Ind (no lean) 20% (118) 25% (146) 12% (71) 19% (111) 23% (132) 578PID: Rep (no lean) 7% (46) 14% (94) 19% (127) 47% (312) 12% (82) 661PID/Gender: DemMen 55% (197) 32% (115) 3% (10) 5% (20) 5% (17) 359PID/Gender: DemWomen 46% (180) 34% (135) 5% (19) 2% (7) 13% (51) 393PID/Gender: Ind Men 22% (59) 29% (78) 11% (28) 23% (62) 15% (40) 267PID/Gender: Ind Women 19% (59) 22% (68) 14% (42) 16% (49) 30% (92) 311PID/Gender: Rep Men 8% (25) 16% (47) 16% (47) 51% (153) 9% (28) 301PID/Gender: Rep Women 6% (21) 13% (47) 22% (80) 44% (159) 15% (53) 360Ideo: Liberal (1-3) 50% (293) 30% (179) 6% (35) 4% (22) 10% (58) 587Ideo: Moderate (4) 27% (143) 34% (183) 9% (48) 13% (69) 18% (95) 539Ideo: Conservative (5-7) 12% (88) 13% (99) 18% (136) 47% (350) 9% (69) 742Educ: < College 23% (282) 25% (304) 12% (150) 22% (270) 17% (207) 1213Educ: Bachelors degree 34% (167) 23% (113) 11% (52) 23% (113) 9% (43) 489Educ: Post-grad 32% (93) 26% (74) 8% (24) 23% (66) 11% (31) 288Income: Under 50k 28% (273) 24% (240) 11% (105) 21% (207) 17% (167) 991Income: 50k-100k 24% (154) 28% (179) 11% (70) 25% (163) 12% (74) 640Income: 100k+ 32% (116) 20% (72) 14% (52) 22% (80) 11% (40) 359Ethnicity: White 26% (409) 22% (345) 13% (208) 26% (411) 13% (212) 1584Ethnicity: Hispanic 30% (59) 33% (64) 6% (11) 9% (17) 22% (44) 196
Continued on next page
Page 250
250
Morning ConsultTable POL17
Table POL17: As you may know, President Biden has introduced a $2.3 trillion plan to improve America’s infrastructure. Do you support or opposeBiden’s infrastructure plan?
DemographicStronglysupport
Somewhatsupport
Somewhatoppose
Stronglyoppose
Don’t know /No opinion Total N
Registered Voters 27% (542) 25% (491) 11% (227) 23% (449) 14% (281) 1990Ethnicity: Black 38% (91) 37% (89) 4% (10) 6% (15) 16% (38) 243Ethnicity: Other 26% (42) 35% (57) 6% (9) 14% (23) 19% (31) 163All Christian 23% (222) 24% (228) 13% (127) 30% (287) 10% (101) 964All Non-Christian 48% (58) 23% (27) 7% (9) 15% (18) 7% (9) 121Atheist 41% (30) 26% (19) 8% (6) 12% (9) 12% (9) 73Agnostic/Nothing in particular 30% (149) 28% (138) 9% (44) 14% (69) 19% (95) 495Something Else 25% (83) 23% (78) 12% (41) 20% (67) 20% (67) 337Religious Non-Protestant/Catholic 43% (60) 23% (32) 8% (12) 19% (26) 7% (10) 140Evangelical 20% (111) 16% (90) 15% (80) 35% (192) 14% (75) 547Non-Evangelical 26% (189) 28% (204) 12% (84) 21% (153) 13% (90) 721Community: Urban 38% (201) 30% (159) 7% (38) 13% (67) 12% (64) 529Community: Suburban 24% (242) 24% (237) 11% (113) 26% (262) 14% (143) 998Community: Rural 21% (99) 20% (94) 16% (75) 26% (121) 16% (75) 464Employ: Private Sector 28% (175) 26% (162) 10% (62) 22% (140) 13% (83) 622Employ: Government 33% (42) 24% (30) 11% (14) 21% (27) 12% (15) 129Employ: Self-Employed 31% (49) 20% (32) 10% (16) 24% (37) 14% (22) 157Employ: Homemaker 19% (24) 21% (27) 16% (21) 22% (28) 21% (27) 127Employ: Retired 29% (168) 20% (118) 13% (77) 30% (172) 8% (46) 581Employ: Unemployed 24% (51) 33% (71) 11% (24) 11% (24) 21% (46) 215Employ: Other 21% (24) 34% (38) 3% (4) 15% (17) 27% (30) 113Military HH: Yes 26% (92) 18% (64) 17% (60) 29% (104) 11% (41) 361Military HH: No 28% (450) 26% (427) 10% (166) 21% (346) 15% (240) 1629RD/WT: Right Direction 48% (451) 33% (313) 5% (45) 3% (32) 11% (100) 941RD/WT: Wrong Track 9% (91) 17% (178) 17% (181) 40% (417) 17% (181) 1049Biden Job Approve 48% (498) 36% (370) 5% (48) 3% (26) 9% (96) 1037Biden Job Disapprove 5% (42) 12% (101) 20% (175) 49% (420) 14% (119) 857Biden Job Strongly Approve 68% (373) 24% (130) 1% (7) 3% (15) 4% (23) 548Biden Job Somewhat Approve 26% (125) 49% (240) 8% (41) 2% (11) 15% (73) 489Biden Job Somewhat Disapprove 9% (20) 25% (57) 35% (79) 11% (25) 19% (43) 223Biden Job Strongly Disapprove 4% (22) 7% (44) 15% (97) 62% (395) 12% (76) 634
Continued on next page
Page 251
National Tracking Poll #210636, June, 2021
251
Table POL17
Table POL17: As you may know, President Biden has introduced a $2.3 trillion plan to improve America’s infrastructure. Do you support or opposeBiden’s infrastructure plan?
DemographicStronglysupport
Somewhatsupport
Somewhatoppose
Stronglyoppose
Don’t know /No opinion Total N
Registered Voters 27% (542) 25% (491) 11% (227) 23% (449) 14% (281) 1990Favorable of Biden 47% (492) 36% (377) 5% (52) 2% (26) 10% (101) 1048Unfavorable of Biden 5% (41) 12% (103) 20% (171) 49% (415) 15% (125) 855Very Favorable of Biden 65% (387) 26% (155) 1% (9) 2% (14) 5% (29) 593Somewhat Favorable of Biden 23% (105) 49% (222) 10% (43) 3% (12) 16% (72) 455Somewhat Unfavorable of Biden 11% (21) 27% (51) 32% (61) 9% (17) 21% (40) 190Very Unfavorable of Biden 3% (20) 8% (52) 17% (110) 60% (398) 13% (84) 664#1 Issue: Economy 22% (167) 26% (197) 12% (88) 26% (199) 15% (112) 763#1 Issue: Security 14% (48) 15% (53) 17% (58) 44% (153) 11% (37) 349#1 Issue: Health Care 42% (99) 32% (74) 8% (18) 4% (10) 14% (32) 233#1 Issue: Medicare / Social Security 37% (96) 25% (65) 11% (29) 17% (44) 10% (27) 261#1 Issue: Women’s Issues 35% (36) 20% (20) 8% (8) 7% (8) 30% (31) 103#1 Issue: Education 28% (24) 34% (29) 10% (9) 11% (9) 17% (15) 86#1 Issue: Energy 39% (33) 33% (28) 9% (8) 4% (3) 16% (14) 86#1 Issue: Other 35% (38) 22% (24) 8% (9) 22% (24) 14% (15) 1092020 Vote: Joe Biden 48% (434) 36% (323) 4% (37) 2% (20) 9% (83) 8972020 Vote: Donald Trump 8% (63) 12% (94) 21% (168) 49% (399) 12% (95) 8182020 Vote: Didn’t Vote 17% (40) 27% (65) 6% (16) 11% (25) 39% (93) 2392018 House Vote: Democrat 52% (359) 33% (228) 4% (27) 4% (26) 7% (47) 6872018 House Vote: Republican 7% (51) 13% (87) 20% (135) 50% (342) 11% (75) 6902018 House Vote: Someone else 21% (11) 25% (12) 7% (3) 10% (5) 38% (19) 502016 Vote: Hillary Clinton 53% (336) 32% (199) 3% (21) 4% (24) 8% (50) 6312016 Vote: Donald Trump 9% (67) 14% (107) 18% (136) 47% (363) 12% (95) 7682016 Vote: Other 24% (26) 37% (39) 14% (15) 13% (14) 13% (14) 1072016 Vote: Didn’t Vote 23% (113) 30% (146) 11% (54) 10% (48) 25% (122) 483Voted in 2014: Yes 30% (387) 23% (294) 11% (140) 27% (355) 9% (122) 1297Voted in 2014: No 22% (155) 28% (196) 13% (87) 14% (95) 23% (160) 6934-Region: Northeast 33% (114) 25% (87) 10% (36) 17% (58) 14% (50) 3444-Region: Midwest 25% (114) 28% (125) 11% (50) 25% (113) 12% (53) 4554-Region: South 26% (194) 23% (175) 12% (87) 25% (189) 15% (110) 7554-Region: West 28% (121) 24% (102) 12% (54) 21% (89) 16% (69) 435
Continued on next page
Page 252
252
Morning ConsultTable POL17
Table POL17: As you may know, President Biden has introduced a $2.3 trillion plan to improve America’s infrastructure. Do you support or opposeBiden’s infrastructure plan?
DemographicStronglysupport
Somewhatsupport
Somewhatoppose
Stronglyoppose
Don’t know /No opinion Total N
Registered Voters 27% (542) 25% (491) 11% (227) 23% (449) 14% (281) 1990Party: Democrat/Leans Democrat 49% (436) 34% (306) 4% (35) 3% (27) 9% (84) 888Party: Republican/Leans Republican 7% (53) 14% (115) 20% (163) 46% (371) 14% (111) 814Note: Row proportions may total to larger than one-hundred percent due to rounding. For more information visit MorningConsultIntelligence.com.
Page 253
National Tracking Poll #210636, June, 2021
253
Table POL18_1
Table POL18_1: Would you support or oppose the following potential sources of funding for U.S. infrastructure investments?A carbon tax, impacting all greenhouse gas emitters
DemographicStronglysupport
Somewhatsupport
Somewhatoppose
Stronglyoppose
Don’t Know /No Opinion Total N
Registered Voters 20% (392) 26% (518) 15% (300) 22% (433) 17% (346) 1990Gender: Male 23% (213) 27% (250) 15% (140) 23% (218) 11% (107) 927Gender: Female 17% (179) 25% (268) 15% (161) 20% (216) 23% (239) 1063Age: 18-34 20% (93) 24% (111) 15% (67) 15% (67) 26% (118) 456Age: 35-44 23% (70) 25% (74) 11% (34) 19% (57) 22% (65) 300Age: 45-64 18% (128) 26% (189) 18% (128) 24% (173) 15% (111) 730Age: 65+ 20% (101) 29% (144) 14% (71) 27% (136) 10% (51) 504GenZers: 1997-2012 19% (32) 21% (36) 12% (20) 14% (24) 34% (57) 169Millennials: 1981-1996 21% (100) 26% (126) 15% (70) 17% (82) 21% (102) 480GenXers: 1965-1980 21% (112) 26% (136) 16% (82) 19% (100) 18% (95) 525Baby Boomers: 1946-1964 19% (140) 26% (197) 16% (121) 27% (203) 11% (85) 746PID: Dem (no lean) 33% (251) 33% (245) 11% (83) 7% (54) 16% (119) 752PID: Ind (no lean) 16% (90) 26% (150) 15% (89) 23% (131) 20% (117) 578PID: Rep (no lean) 8% (51) 19% (123) 19% (128) 38% (249) 17% (110) 661PID/Gender: DemMen 39% (138) 33% (118) 12% (43) 7% (25) 10% (35) 359PID/Gender: DemWomen 29% (113) 32% (127) 10% (40) 7% (29) 21% (84) 393PID/Gender: Ind Men 17% (47) 27% (73) 16% (42) 27% (71) 13% (33) 267PID/Gender: Ind Women 14% (44) 25% (77) 15% (47) 19% (60) 27% (83) 311PID/Gender: Rep Men 9% (28) 20% (59) 18% (54) 40% (122) 13% (38) 301PID/Gender: Rep Women 6% (22) 18% (64) 21% (74) 35% (127) 20% (72) 360Ideo: Liberal (1-3) 38% (222) 29% (172) 11% (66) 8% (47) 14% (81) 587Ideo: Moderate (4) 18% (97) 33% (180) 14% (73) 13% (68) 22% (121) 539Ideo: Conservative (5-7) 8% (62) 21% (153) 20% (146) 41% (302) 11% (80) 742Educ: < College 16% (197) 25% (299) 16% (189) 22% (264) 22% (264) 1213Educ: Bachelors degree 22% (109) 28% (138) 15% (75) 22% (109) 12% (58) 489Educ: Post-grad 30% (86) 28% (81) 13% (36) 21% (61) 8% (24) 288Income: Under 50k 18% (174) 25% (249) 14% (138) 22% (214) 22% (216) 991Income: 50k-100k 21% (138) 27% (174) 16% (105) 22% (141) 13% (83) 640Income: 100k+ 23% (81) 27% (95) 16% (57) 22% (78) 13% (47) 359Ethnicity: White 19% (300) 25% (401) 15% (245) 24% (387) 16% (251) 1584Ethnicity: Hispanic 25% (50) 25% (50) 9% (18) 15% (30) 25% (48) 196
Continued on next page
Page 254
254
Morning ConsultTable POL18_1
Table POL18_1: Would you support or oppose the following potential sources of funding for U.S. infrastructure investments?A carbon tax, impacting all greenhouse gas emitters
DemographicStronglysupport
Somewhatsupport
Somewhatoppose
Stronglyoppose
Don’t Know /No Opinion Total N
Registered Voters 20% (392) 26% (518) 15% (300) 22% (433) 17% (346) 1990Ethnicity: Black 24% (57) 29% (71) 13% (30) 8% (18) 27% (66) 243Ethnicity: Other 21% (35) 28% (46) 15% (25) 17% (28) 18% (29) 163All Christian 16% (157) 27% (264) 16% (157) 27% (261) 13% (126) 964All Non-Christian 32% (39) 27% (32) 10% (12) 18% (21) 14% (17) 121Atheist 36% (27) 29% (21) 15% (11) 10% (8) 10% (7) 73Agnostic/Nothing in particular 22% (107) 27% (134) 15% (75) 16% (77) 21% (102) 495Something Else 19% (63) 20% (67) 13% (45) 20% (67) 28% (94) 337Religious Non-Protestant/Catholic 28% (39) 28% (39) 12% (17) 18% (25) 15% (21) 140Evangelical 15% (82) 23% (126) 14% (74) 33% (179) 16% (87) 547Non-Evangelical 19% (134) 27% (196) 17% (121) 20% (141) 18% (129) 721Community: Urban 29% (156) 29% (154) 11% (56) 14% (73) 17% (90) 529Community: Suburban 18% (183) 25% (253) 15% (147) 24% (240) 17% (174) 998Community: Rural 11% (53) 24% (111) 21% (97) 26% (121) 18% (81) 464Employ: Private Sector 22% (137) 25% (155) 15% (91) 22% (138) 16% (101) 622Employ: Government 24% (31) 26% (34) 17% (22) 20% (26) 12% (16) 129Employ: Self-Employed 23% (37) 27% (42) 16% (25) 22% (35) 12% (18) 157Employ: Homemaker 14% (18) 28% (35) 12% (15) 19% (24) 27% (35) 127Employ: Retired 19% (113) 28% (160) 16% (91) 26% (152) 11% (65) 581Employ: Unemployed 17% (37) 25% (54) 14% (30) 15% (33) 28% (61) 215Employ: Other 10% (11) 22% (25) 16% (18) 17% (19) 35% (39) 113Military HH: Yes 18% (64) 24% (86) 18% (67) 28% (100) 12% (45) 361Military HH: No 20% (328) 27% (433) 14% (233) 20% (334) 18% (301) 1629RD/WT: Right Direction 32% (297) 32% (299) 11% (106) 8% (78) 17% (162) 941RD/WT: Wrong Track 9% (95) 21% (220) 19% (194) 34% (356) 18% (184) 1049Biden Job Approve 32% (334) 34% (354) 11% (110) 7% (75) 16% (165) 1037Biden Job Disapprove 6% (52) 18% (151) 21% (180) 41% (349) 15% (125) 857Biden Job Strongly Approve 39% (214) 33% (183) 7% (38) 6% (32) 15% (81) 548Biden Job Somewhat Approve 25% (120) 35% (171) 15% (71) 9% (43) 17% (84) 489Biden Job Somewhat Disapprove 8% (18) 31% (69) 25% (56) 17% (38) 19% (42) 223Biden Job Strongly Disapprove 5% (34) 13% (82) 20% (124) 49% (310) 13% (83) 634
Continued on next page
Page 255
National Tracking Poll #210636, June, 2021
255
Table POL18_1
Table POL18_1: Would you support or oppose the following potential sources of funding for U.S. infrastructure investments?A carbon tax, impacting all greenhouse gas emitters
DemographicStronglysupport
Somewhatsupport
Somewhatoppose
Stronglyoppose
Don’t Know /No Opinion Total N
Registered Voters 20% (392) 26% (518) 15% (300) 22% (433) 17% (346) 1990Favorable of Biden 32% (331) 34% (352) 11% (111) 8% (81) 16% (173) 1048Unfavorable of Biden 6% (52) 18% (151) 22% (185) 40% (341) 15% (127) 855Very Favorable of Biden 38% (226) 32% (191) 8% (50) 6% (38) 15% (87) 593Somewhat Favorable of Biden 23% (105) 35% (161) 13% (61) 9% (43) 19% (85) 455Somewhat Unfavorable of Biden 8% (16) 31% (58) 25% (47) 17% (32) 20% (37) 190Very Unfavorable of Biden 6% (37) 14% (92) 21% (138) 46% (308) 13% (89) 664#1 Issue: Economy 14% (103) 26% (198) 18% (134) 25% (191) 18% (138) 763#1 Issue: Security 8% (29) 22% (76) 15% (54) 37% (129) 18% (62) 349#1 Issue: Health Care 32% (75) 30% (70) 13% (31) 9% (21) 16% (36) 233#1 Issue: Medicare / Social Security 28% (72) 29% (75) 15% (38) 15% (40) 14% (36) 261#1 Issue: Women’s Issues 32% (32) 28% (29) 7% (7) 8% (8) 26% (27) 103#1 Issue: Education 21% (18) 37% (32) 9% (8) 12% (11) 20% (17) 86#1 Issue: Energy 36% (31) 24% (20) 15% (13) 10% (9) 15% (13) 86#1 Issue: Other 29% (31) 18% (20) 15% (16) 23% (25) 16% (17) 1092020 Vote: Joe Biden 34% (307) 34% (303) 10% (92) 7% (61) 15% (134) 8972020 Vote: Donald Trump 6% (48) 18% (149) 20% (165) 41% (333) 15% (123) 8182020 Vote: Didn’t Vote 14% (33) 23% (56) 16% (38) 13% (30) 34% (82) 2392018 House Vote: Democrat 36% (247) 34% (234) 11% (77) 7% (46) 12% (82) 6872018 House Vote: Republican 8% (54) 18% (125) 19% (132) 42% (288) 13% (91) 6902018 House Vote: Someone else 11% (6) 24% (12) 13% (7) 19% (10) 32% (16) 502016 Vote: Hillary Clinton 36% (229) 34% (215) 9% (59) 7% (42) 14% (86) 6312016 Vote: Donald Trump 8% (64) 19% (142) 19% (150) 39% (303) 14% (108) 7682016 Vote: Other 18% (20) 23% (25) 27% (29) 21% (23) 11% (12) 1072016 Vote: Didn’t Vote 16% (79) 28% (136) 13% (63) 14% (66) 29% (139) 483Voted in 2014: Yes 22% (281) 25% (327) 16% (204) 25% (321) 13% (165) 1297Voted in 2014: No 16% (112) 28% (191) 14% (96) 16% (113) 26% (181) 6934-Region: Northeast 24% (82) 30% (103) 12% (42) 17% (58) 17% (59) 3444-Region: Midwest 17% (79) 26% (117) 17% (77) 22% (101) 18% (81) 4554-Region: South 18% (135) 26% (194) 15% (111) 23% (177) 18% (139) 7554-Region: West 22% (96) 24% (105) 16% (71) 22% (98) 15% (66) 435
Continued on next page
Page 256
256
Morning ConsultTable POL18_1
Table POL18_1: Would you support or oppose the following potential sources of funding for U.S. infrastructure investments?A carbon tax, impacting all greenhouse gas emitters
DemographicStronglysupport
Somewhatsupport
Somewhatoppose
Stronglyoppose
Don’t Know /No Opinion Total N
Registered Voters 20% (392) 26% (518) 15% (300) 22% (433) 17% (346) 1990Party: Democrat/Leans Democrat 34% (299) 34% (298) 10% (93) 7% (63) 15% (136) 888Party: Republican/Leans Republican 7% (58) 18% (150) 20% (162) 38% (310) 17% (135) 814Note: Row proportions may total to larger than one-hundred percent due to rounding. For more information visit MorningConsultIntelligence.com.
Page 257
National Tracking Poll #210636, June, 2021
257
Table POL18_2
Table POL18_2: Would you support or oppose the following potential sources of funding for U.S. infrastructure investments?A ’vehicle miles traveled’ tax (e.g. a mileage tax), impacting the drivers of all types of vehicles
DemographicStronglysupport
Somewhatsupport
Somewhatoppose
Stronglyoppose
Don’t Know /No Opinion Total N
Registered Voters 7% (139) 16% (310) 17% (348) 46% (919) 14% (274) 1990Gender: Male 11% (98) 19% (179) 16% (148) 43% (403) 11% (98) 927Gender: Female 4% (41) 12% (131) 19% (200) 49% (516) 17% (176) 1063Age: 18-34 9% (39) 16% (75) 16% (75) 37% (170) 21% (98) 456Age: 35-44 8% (24) 14% (43) 13% (39) 46% (139) 18% (54) 300Age: 45-64 5% (35) 14% (101) 19% (139) 51% (371) 12% (84) 730Age: 65+ 8% (41) 18% (91) 19% (95) 47% (239) 8% (38) 504GenZers: 1997-2012 4% (6) 14% (24) 16% (28) 39% (66) 27% (45) 169Millennials: 1981-1996 10% (49) 17% (80) 15% (73) 41% (195) 17% (84) 480GenXers: 1965-1980 5% (28) 14% (75) 18% (93) 47% (246) 16% (83) 525Baby Boomers: 1946-1964 7% (51) 16% (117) 19% (141) 51% (378) 8% (58) 746PID: Dem (no lean) 10% (78) 21% (156) 19% (139) 35% (265) 15% (114) 752PID: Ind (no lean) 7% (39) 15% (84) 19% (107) 46% (264) 14% (83) 578PID: Rep (no lean) 3% (22) 11% (70) 15% (101) 59% (390) 12% (77) 661PID/Gender: DemMen 17% (60) 27% (96) 15% (55) 30% (107) 11% (41) 359PID/Gender: DemWomen 5% (18) 15% (60) 21% (84) 40% (157) 19% (73) 393PID/Gender: Ind Men 10% (27) 15% (41) 18% (47) 47% (125) 10% (27) 267PID/Gender: Ind Women 4% (12) 14% (43) 19% (61) 45% (139) 18% (56) 311PID/Gender: Rep Men 4% (12) 14% (43) 15% (47) 57% (171) 10% (30) 301PID/Gender: Rep Women 3% (10) 8% (28) 15% (55) 61% (220) 13% (47) 360Ideo: Liberal (1-3) 12% (68) 20% (116) 20% (120) 34% (201) 14% (83) 587Ideo: Moderate (4) 6% (35) 16% (84) 19% (104) 42% (227) 17% (89) 539Ideo: Conservative (5-7) 4% (32) 14% (101) 15% (109) 61% (451) 7% (50) 742Educ: < College 5% (64) 13% (154) 17% (212) 49% (589) 16% (194) 1213Educ: Bachelors degree 8% (38) 19% (91) 18% (86) 45% (218) 11% (55) 489Educ: Post-grad 12% (36) 23% (65) 17% (50) 39% (113) 8% (24) 288Income: Under 50k 5% (54) 15% (147) 16% (162) 47% (462) 17% (166) 991Income: 50k-100k 8% (52) 15% (95) 20% (125) 46% (296) 11% (72) 640Income: 100k+ 9% (33) 19% (68) 17% (61) 45% (161) 10% (36) 359Ethnicity: White 7% (118) 15% (234) 17% (275) 49% (774) 12% (183) 1584Ethnicity: Hispanic 11% (21) 18% (35) 10% (20) 36% (71) 25% (49) 196
Continued on next page
Page 258
258
Morning ConsultTable POL18_2
Table POL18_2: Would you support or oppose the following potential sources of funding for U.S. infrastructure investments?A ’vehicle miles traveled’ tax (e.g. a mileage tax), impacting the drivers of all types of vehicles
DemographicStronglysupport
Somewhatsupport
Somewhatoppose
Stronglyoppose
Don’t Know /No Opinion Total N
Registered Voters 7% (139) 16% (310) 17% (348) 46% (919) 14% (274) 1990Ethnicity: Black 6% (14) 17% (42) 18% (43) 33% (80) 26% (62) 243Ethnicity: Other 4% (7) 21% (34) 18% (30) 40% (65) 17% (28) 163All Christian 7% (66) 16% (152) 20% (189) 49% (474) 9% (83) 964All Non-Christian 12% (15) 22% (26) 13% (15) 36% (43) 17% (21) 121Atheist 5% (3) 30% (22) 13% (10) 38% (28) 15% (11) 73Agnostic/Nothing in particular 6% (32) 15% (75) 18% (90) 42% (207) 19% (92) 495Something Else 7% (22) 11% (36) 13% (45) 50% (167) 20% (67) 337Religious Non-Protestant/Catholic 11% (15) 22% (32) 13% (19) 37% (52) 17% (24) 140Evangelical 8% (45) 13% (71) 14% (75) 55% (299) 10% (56) 547Non-Evangelical 6% (42) 15% (109) 21% (151) 46% (328) 13% (91) 721Community: Urban 12% (64) 21% (109) 14% (73) 37% (194) 17% (89) 529Community: Suburban 6% (57) 14% (140) 20% (196) 48% (475) 13% (129) 998Community: Rural 4% (17) 13% (61) 17% (79) 54% (250) 12% (56) 464Employ: Private Sector 7% (46) 17% (103) 16% (102) 47% (294) 12% (77) 622Employ: Government 12% (16) 17% (21) 14% (18) 47% (60) 10% (13) 129Employ: Self-Employed 8% (13) 19% (30) 16% (25) 45% (70) 12% (20) 157Employ: Homemaker 4% (5) 9% (11) 17% (21) 55% (69) 16% (20) 127Employ: Retired 8% (44) 16% (92) 20% (114) 48% (280) 9% (50) 581Employ: Unemployed 4% (9) 15% (32) 21% (46) 36% (77) 24% (51) 215Employ: Other 3% (3) 13% (15) 15% (17) 42% (47) 27% (31) 113Military HH: Yes 7% (27) 13% (47) 21% (75) 47% (171) 12% (42) 361Military HH: No 7% (112) 16% (263) 17% (273) 46% (748) 14% (232) 1629RD/WT: Right Direction 11% (106) 21% (196) 19% (179) 33% (313) 16% (148) 941RD/WT: Wrong Track 3% (33) 11% (114) 16% (169) 58% (606) 12% (126) 1049Biden Job Approve 11% (110) 21% (221) 20% (207) 34% (350) 14% (149) 1037Biden Job Disapprove 3% (25) 9% (81) 15% (133) 63% (540) 9% (79) 857Biden Job Strongly Approve 15% (82) 22% (122) 18% (99) 30% (163) 15% (81) 548Biden Job Somewhat Approve 6% (28) 20% (99) 22% (108) 38% (187) 14% (68) 489Biden Job Somewhat Disapprove 3% (7) 16% (35) 21% (46) 50% (112) 10% (23) 223Biden Job Strongly Disapprove 3% (17) 7% (46) 14% (87) 67% (428) 9% (56) 634
Continued on next page
Page 259
National Tracking Poll #210636, June, 2021
259
Table POL18_2
Table POL18_2: Would you support or oppose the following potential sources of funding for U.S. infrastructure investments?A ’vehicle miles traveled’ tax (e.g. a mileage tax), impacting the drivers of all types of vehicles
DemographicStronglysupport
Somewhatsupport
Somewhatoppose
Stronglyoppose
Don’t Know /No Opinion Total N
Registered Voters 7% (139) 16% (310) 17% (348) 46% (919) 14% (274) 1990Favorable of Biden 10% (105) 21% (219) 20% (208) 35% (362) 15% (154) 1048Unfavorable of Biden 3% (28) 10% (84) 15% (131) 62% (532) 9% (80) 855Very Favorable of Biden 14% (86) 21% (124) 19% (112) 31% (182) 15% (88) 593Somewhat Favorable of Biden 4% (19) 21% (95) 21% (96) 39% (180) 14% (66) 455Somewhat Unfavorable of Biden 6% (11) 13% (25) 20% (39) 48% (91) 13% (24) 190Very Unfavorable of Biden 2% (16) 9% (59) 14% (92) 66% (441) 8% (56) 664#1 Issue: Economy 5% (36) 16% (123) 15% (115) 50% (379) 14% (110) 763#1 Issue: Security 6% (21) 12% (42) 15% (51) 55% (191) 12% (43) 349#1 Issue: Health Care 14% (33) 19% (44) 21% (49) 33% (76) 14% (32) 233#1 Issue: Medicare / Social Security 8% (21) 18% (46) 21% (54) 46% (120) 7% (20) 261#1 Issue: Women’s Issues 6% (6) 12% (12) 22% (22) 35% (36) 26% (26) 103#1 Issue: Education 8% (7) 17% (15) 17% (15) 40% (34) 17% (14) 86#1 Issue: Energy 11% (9) 17% (15) 19% (17) 35% (30) 18% (16) 86#1 Issue: Other 5% (5) 12% (13) 23% (25) 48% (52) 12% (14) 1092020 Vote: Joe Biden 11% (96) 23% (202) 19% (170) 34% (304) 14% (125) 8972020 Vote: Donald Trump 3% (28) 11% (88) 14% (118) 63% (512) 9% (73) 8182020 Vote: Didn’t Vote 6% (14) 6% (15) 22% (52) 37% (88) 29% (70) 2392018 House Vote: Democrat 12% (79) 22% (150) 20% (135) 34% (237) 13% (86) 6872018 House Vote: Republican 4% (27) 11% (74) 16% (108) 62% (427) 8% (54) 6902018 House Vote: Someone else 6% (3) 3% (1) 18% (9) 48% (24) 25% (12) 502016 Vote: Hillary Clinton 11% (66) 22% (139) 21% (131) 32% (204) 14% (91) 6312016 Vote: Donald Trump 4% (34) 11% (87) 15% (117) 61% (467) 8% (63) 7682016 Vote: Other 5% (5) 10% (10) 18% (19) 55% (59) 13% (14) 1072016 Vote: Didn’t Vote 7% (33) 15% (73) 17% (81) 39% (189) 22% (107) 483Voted in 2014: Yes 8% (101) 16% (203) 18% (230) 48% (626) 11% (137) 1297Voted in 2014: No 5% (37) 15% (107) 17% (118) 42% (294) 20% (137) 6934-Region: Northeast 7% (24) 19% (66) 19% (65) 39% (134) 16% (55) 3444-Region: Midwest 6% (28) 16% (71) 17% (79) 51% (233) 10% (44) 4554-Region: South 6% (46) 14% (102) 18% (135) 48% (360) 15% (112) 7554-Region: West 9% (41) 16% (71) 16% (69) 44% (191) 14% (62) 435
Continued on next page
Page 260
260
Morning ConsultTable POL18_2
Table POL18_2: Would you support or oppose the following potential sources of funding for U.S. infrastructure investments?A ’vehicle miles traveled’ tax (e.g. a mileage tax), impacting the drivers of all types of vehicles
DemographicStronglysupport
Somewhatsupport
Somewhatoppose
Stronglyoppose
Don’t Know /No Opinion Total N
Registered Voters 7% (139) 16% (310) 17% (348) 46% (919) 14% (274) 1990Party: Democrat/Leans Democrat 11% (96) 21% (191) 19% (167) 35% (307) 14% (127) 888Party: Republican/Leans Republican 3% (27) 11% (87) 15% (119) 60% (490) 11% (90) 814Note: Row proportions may total to larger than one-hundred percent due to rounding. For more information visit MorningConsultIntelligence.com.
Page 261
National Tracking Poll #210636, June, 2021
261
Table POL18_3
Table POL18_3: Would you support or oppose the following potential sources of funding for U.S. infrastructure investments?A gasoline tax, impacting the drivers of all conventional cars and trucks
DemographicStronglysupport
Somewhatsupport
Somewhatoppose
Stronglyoppose
Don’t Know /No Opinion Total N
Registered Voters 8% (154) 16% (326) 21% (419) 43% (854) 12% (238) 1990Gender: Male 12% (111) 19% (173) 20% (186) 41% (377) 9% (79) 927Gender: Female 4% (43) 14% (153) 22% (233) 45% (477) 15% (158) 1063Age: 18-34 9% (42) 19% (87) 18% (81) 34% (155) 20% (91) 456Age: 35-44 11% (33) 18% (54) 16% (49) 39% (118) 15% (45) 300Age: 45-64 7% (49) 12% (89) 23% (169) 48% (349) 10% (74) 730Age: 65+ 6% (29) 19% (97) 24% (120) 46% (231) 5% (27) 504GenZers: 1997-2012 6% (9) 19% (32) 18% (30) 32% (55) 26% (43) 169Millennials: 1981-1996 11% (54) 18% (88) 18% (87) 37% (176) 16% (74) 480GenXers: 1965-1980 8% (43) 13% (68) 21% (110) 44% (231) 14% (72) 525Baby Boomers: 1946-1964 6% (42) 17% (127) 24% (178) 47% (353) 6% (46) 746PID: Dem (no lean) 11% (86) 25% (186) 23% (172) 29% (219) 12% (88) 752PID: Ind (no lean) 7% (42) 13% (75) 22% (128) 43% (251) 14% (81) 578PID: Rep (no lean) 4% (26) 10% (64) 18% (119) 58% (384) 10% (68) 661PID/Gender: DemMen 19% (68) 29% (104) 19% (67) 26% (93) 8% (27) 359PID/Gender: DemWomen 5% (18) 21% (82) 27% (105) 32% (126) 16% (61) 393PID/Gender: Ind Men 10% (26) 13% (36) 22% (59) 44% (118) 11% (30) 267PID/Gender: Ind Women 5% (16) 13% (39) 22% (70) 43% (134) 17% (52) 311PID/Gender: Rep Men 6% (18) 11% (34) 20% (61) 55% (167) 8% (23) 301PID/Gender: Rep Women 2% (8) 9% (31) 16% (58) 60% (217) 13% (45) 360Ideo: Liberal (1-3) 13% (78) 26% (152) 19% (114) 28% (167) 13% (76) 587Ideo: Moderate (4) 7% (36) 15% (81) 28% (150) 36% (195) 14% (77) 539Ideo: Conservative (5-7) 5% (37) 12% (88) 18% (136) 59% (438) 6% (43) 742Educ: < College 5% (66) 14% (171) 19% (235) 47% (567) 14% (174) 1213Educ: Bachelors degree 9% (44) 20% (98) 23% (111) 40% (194) 8% (42) 489Educ: Post-grad 15% (43) 20% (57) 25% (72) 32% (93) 8% (23) 288Income: Under 50k 6% (61) 16% (155) 19% (192) 43% (430) 15% (153) 991Income: 50k-100k 7% (48) 18% (115) 22% (143) 43% (277) 9% (57) 640Income: 100k+ 12% (45) 16% (57) 23% (84) 41% (146) 8% (27) 359Ethnicity: White 7% (118) 16% (246) 21% (337) 45% (721) 10% (163) 1584Ethnicity: Hispanic 10% (20) 19% (36) 22% (44) 27% (53) 22% (43) 196
Continued on next page
Page 262
262
Morning ConsultTable POL18_3
Table POL18_3: Would you support or oppose the following potential sources of funding for U.S. infrastructure investments?A gasoline tax, impacting the drivers of all conventional cars and trucks
DemographicStronglysupport
Somewhatsupport
Somewhatoppose
Stronglyoppose
Don’t Know /No Opinion Total N
Registered Voters 8% (154) 16% (326) 21% (419) 43% (854) 12% (238) 1990Ethnicity: Black 11% (26) 16% (38) 21% (50) 32% (79) 21% (50) 243Ethnicity: Other 6% (10) 26% (42) 20% (33) 33% (54) 15% (25) 163All Christian 6% (62) 17% (165) 21% (207) 47% (453) 8% (78) 964All Non-Christian 21% (26) 24% (30) 14% (17) 26% (32) 14% (17) 121Atheist 11% (8) 29% (21) 23% (17) 30% (22) 7% (5) 73Agnostic/Nothing in particular 7% (35) 16% (77) 22% (110) 39% (192) 16% (82) 495Something Else 7% (23) 10% (34) 20% (69) 46% (155) 17% (56) 337Religious Non-Protestant/Catholic 19% (27) 23% (33) 16% (23) 28% (39) 14% (19) 140Evangelical 8% (43) 12% (68) 17% (92) 53% (287) 10% (57) 547Non-Evangelical 5% (39) 17% (123) 24% (175) 43% (309) 10% (74) 721Community: Urban 14% (75) 21% (113) 21% (112) 31% (165) 12% (65) 529Community: Suburban 6% (63) 15% (154) 22% (219) 44% (443) 12% (118) 998Community: Rural 3% (16) 13% (60) 19% (88) 53% (246) 12% (55) 464Employ: Private Sector 10% (63) 17% (105) 20% (125) 44% (271) 9% (57) 622Employ: Government 13% (17) 15% (19) 26% (33) 32% (41) 14% (19) 129Employ: Self-Employed 11% (17) 14% (22) 20% (32) 43% (68) 12% (19) 157Employ: Homemaker 3% (3) 12% (15) 15% (19) 55% (70) 15% (19) 127Employ: Retired 6% (35) 19% (109) 24% (141) 46% (265) 5% (32) 581Employ: Unemployed 7% (14) 16% (35) 21% (45) 35% (74) 21% (46) 215Employ: Other 3% (4) 11% (12) 12% (13) 42% (47) 32% (37) 113Military HH: Yes 6% (21) 12% (42) 22% (79) 54% (194) 7% (25) 361Military HH: No 8% (132) 17% (284) 21% (340) 41% (660) 13% (212) 1629RD/WT: Right Direction 12% (116) 22% (209) 24% (224) 29% (273) 13% (120) 941RD/WT: Wrong Track 4% (38) 11% (117) 19% (195) 55% (581) 11% (118) 1049Biden Job Approve 13% (130) 25% (255) 23% (241) 28% (289) 12% (122) 1037Biden Job Disapprove 3% (24) 7% (63) 19% (166) 62% (531) 9% (74) 857Biden Job Strongly Approve 17% (95) 24% (131) 21% (115) 26% (140) 12% (67) 548Biden Job Somewhat Approve 7% (35) 25% (125) 26% (126) 30% (149) 11% (55) 489Biden Job Somewhat Disapprove 4% (9) 11% (24) 29% (65) 46% (102) 11% (24) 223Biden Job Strongly Disapprove 2% (14) 6% (39) 16% (101) 68% (429) 8% (50) 634
Continued on next page
Page 263
National Tracking Poll #210636, June, 2021
263
Table POL18_3
Table POL18_3: Would you support or oppose the following potential sources of funding for U.S. infrastructure investments?A gasoline tax, impacting the drivers of all conventional cars and trucks
DemographicStronglysupport
Somewhatsupport
Somewhatoppose
Stronglyoppose
Don’t Know /No Opinion Total N
Registered Voters 8% (154) 16% (326) 21% (419) 43% (854) 12% (238) 1990Favorable of Biden 12% (121) 24% (250) 23% (242) 29% (302) 13% (132) 1048Unfavorable of Biden 3% (29) 8% (67) 19% (165) 61% (523) 8% (70) 855Very Favorable of Biden 16% (93) 24% (144) 21% (127) 27% (159) 12% (69) 593Somewhat Favorable of Biden 6% (28) 23% (106) 25% (115) 31% (143) 14% (63) 455Somewhat Unfavorable of Biden 6% (11) 11% (22) 30% (57) 45% (85) 8% (15) 190Very Unfavorable of Biden 3% (18) 7% (46) 16% (108) 66% (438) 8% (55) 664#1 Issue: Economy 6% (44) 14% (108) 22% (167) 46% (354) 12% (91) 763#1 Issue: Security 7% (23) 12% (42) 18% (64) 53% (186) 10% (34) 349#1 Issue: Health Care 16% (38) 19% (45) 25% (57) 28% (66) 12% (28) 233#1 Issue: Medicare / Social Security 5% (14) 21% (54) 25% (64) 41% (107) 8% (22) 261#1 Issue: Women’s Issues 8% (8) 26% (27) 13% (14) 30% (31) 23% (23) 103#1 Issue: Education 13% (11) 12% (10) 25% (21) 35% (30) 16% (13) 86#1 Issue: Energy 17% (14) 21% (18) 17% (15) 29% (25) 17% (15) 86#1 Issue: Other 2% (2) 21% (23) 16% (17) 51% (56) 10% (11) 1092020 Vote: Joe Biden 13% (115) 25% (228) 24% (212) 27% (243) 11% (100) 8972020 Vote: Donald Trump 3% (27) 9% (71) 18% (149) 62% (504) 8% (67) 8182020 Vote: Didn’t Vote 4% (10) 10% (23) 21% (49) 39% (92) 27% (64) 2392018 House Vote: Democrat 13% (89) 25% (174) 24% (162) 29% (201) 9% (62) 6872018 House Vote: Republican 4% (27) 10% (67) 19% (134) 60% (413) 7% (49) 6902018 House Vote: Someone else 9% (4) 8% (4) 20% (10) 42% (21) 22% (11) 502016 Vote: Hillary Clinton 12% (77) 26% (164) 24% (149) 28% (174) 11% (68) 6312016 Vote: Donald Trump 5% (37) 10% (76) 19% (143) 59% (453) 8% (58) 7682016 Vote: Other 8% (9) 14% (15) 26% (28) 41% (45) 10% (11) 1072016 Vote: Didn’t Vote 6% (30) 15% (71) 20% (99) 38% (182) 21% (102) 483Voted in 2014: Yes 9% (112) 16% (210) 22% (283) 45% (588) 8% (105) 1297Voted in 2014: No 6% (42) 17% (116) 20% (136) 38% (266) 19% (133) 6934-Region: Northeast 11% (39) 18% (62) 24% (82) 34% (117) 12% (43) 3444-Region: Midwest 5% (25) 16% (72) 23% (106) 45% (206) 10% (47) 4554-Region: South 8% (58) 15% (113) 19% (143) 45% (337) 14% (104) 7554-Region: West 7% (31) 18% (79) 20% (88) 44% (193) 10% (44) 435
Continued on next page
Page 264
264
Morning ConsultTable POL18_3
Table POL18_3: Would you support or oppose the following potential sources of funding for U.S. infrastructure investments?A gasoline tax, impacting the drivers of all conventional cars and trucks
DemographicStronglysupport
Somewhatsupport
Somewhatoppose
Stronglyoppose
Don’t Know /No Opinion Total N
Registered Voters 8% (154) 16% (326) 21% (419) 43% (854) 12% (238) 1990Party: Democrat/Leans Democrat 12% (104) 25% (222) 23% (202) 29% (257) 12% (104) 888Party: Republican/Leans Republican 4% (36) 9% (74) 18% (148) 59% (481) 9% (75) 814Note: Row proportions may total to larger than one-hundred percent due to rounding. For more information visit MorningConsultIntelligence.com.
Page 265
National Tracking Poll #210636, June, 2021
265
Table POL18_4
Table POL18_4: Would you support or oppose the following potential sources of funding for U.S. infrastructure investments?A 25 percent tax rate for corporations for 15 years
DemographicStronglysupport
Somewhatsupport
Somewhatoppose
Stronglyoppose
Don’t Know /No Opinion Total N
Registered Voters 25% (495) 25% (496) 14% (286) 18% (355) 18% (357) 1990Gender: Male 27% (249) 26% (240) 14% (129) 20% (184) 13% (124) 927Gender: Female 23% (246) 24% (256) 15% (157) 16% (171) 22% (233) 1063Age: 18-34 21% (96) 26% (120) 13% (57) 13% (60) 27% (122) 456Age: 35-44 23% (69) 27% (80) 11% (32) 15% (45) 25% (74) 300Age: 45-64 26% (191) 24% (177) 16% (114) 20% (143) 15% (106) 730Age: 65+ 28% (139) 24% (119) 17% (83) 21% (107) 11% (55) 504GenZers: 1997-2012 16% (27) 28% (47) 10% (17) 13% (21) 34% (57) 169Millennials: 1981-1996 23% (112) 26% (124) 13% (62) 15% (71) 23% (111) 480GenXers: 1965-1980 25% (132) 26% (136) 13% (67) 17% (90) 19% (101) 525Baby Boomers: 1946-1964 28% (210) 23% (173) 18% (132) 20% (151) 11% (80) 746PID: Dem (no lean) 39% (296) 29% (221) 9% (67) 6% (46) 16% (122) 752PID: Ind (no lean) 20% (115) 28% (164) 13% (77) 17% (98) 22% (124) 578PID: Rep (no lean) 13% (85) 17% (111) 21% (142) 32% (212) 17% (111) 661PID/Gender: DemMen 43% (155) 30% (109) 8% (28) 7% (25) 12% (41) 359PID/Gender: DemWomen 36% (141) 28% (111) 10% (39) 5% (21) 21% (81) 393PID/Gender: Ind Men 19% (50) 30% (81) 15% (39) 20% (53) 16% (43) 267PID/Gender: Ind Women 21% (64) 27% (83) 12% (38) 14% (45) 26% (81) 311PID/Gender: Rep Men 15% (44) 16% (50) 21% (62) 35% (106) 13% (40) 301PID/Gender: Rep Women 11% (41) 17% (62) 22% (80) 29% (106) 20% (71) 360Ideo: Liberal (1-3) 42% (246) 30% (179) 7% (40) 7% (43) 14% (80) 587Ideo: Moderate (4) 25% (135) 28% (153) 15% (81) 11% (57) 21% (113) 539Ideo: Conservative (5-7) 14% (102) 19% (140) 21% (158) 33% (243) 13% (98) 742Educ: < College 23% (274) 25% (299) 13% (161) 18% (216) 22% (262) 1213Educ: Bachelors degree 27% (131) 25% (120) 17% (81) 18% (88) 14% (68) 489Educ: Post-grad 31% (90) 27% (77) 15% (44) 18% (51) 9% (27) 288Income: Under 50k 25% (248) 24% (236) 14% (136) 17% (171) 20% (200) 991Income: 50k-100k 24% (155) 26% (166) 14% (91) 20% (126) 16% (102) 640Income: 100k+ 26% (92) 26% (94) 16% (59) 16% (58) 15% (55) 359Ethnicity: White 23% (369) 25% (397) 16% (247) 20% (310) 16% (261) 1584Ethnicity: Hispanic 21% (42) 31% (60) 11% (21) 10% (20) 27% (53) 196
Continued on next page
Page 266
266
Morning ConsultTable POL18_4
Table POL18_4: Would you support or oppose the following potential sources of funding for U.S. infrastructure investments?A 25 percent tax rate for corporations for 15 years
DemographicStronglysupport
Somewhatsupport
Somewhatoppose
Stronglyoppose
Don’t Know /No Opinion Total N
Registered Voters 25% (495) 25% (496) 14% (286) 18% (355) 18% (357) 1990Ethnicity: Black 33% (79) 24% (59) 9% (23) 9% (22) 24% (59) 243Ethnicity: Other 29% (47) 25% (40) 10% (16) 14% (23) 23% (37) 163All Christian 22% (210) 25% (236) 18% (177) 21% (205) 14% (136) 964All Non-Christian 33% (39) 25% (30) 9% (11) 16% (19) 17% (21) 121Atheist 36% (26) 24% (17) 8% (6) 15% (11) 18% (13) 73Agnostic/Nothing in particular 28% (139) 29% (145) 9% (46) 13% (63) 21% (102) 495Something Else 24% (80) 20% (67) 14% (47) 17% (58) 25% (85) 337Religious Non-Protestant/Catholic 29% (41) 27% (37) 10% (14) 15% (22) 19% (26) 140Evangelical 18% (100) 21% (115) 19% (104) 24% (132) 17% (96) 547Non-Evangelical 26% (184) 24% (176) 16% (113) 18% (127) 17% (120) 721Community: Urban 29% (153) 28% (150) 11% (59) 14% (72) 18% (95) 529Community: Suburban 25% (250) 24% (243) 15% (151) 19% (187) 17% (166) 998Community: Rural 20% (92) 22% (103) 16% (76) 21% (96) 21% (96) 464Employ: Private Sector 24% (146) 29% (177) 16% (97) 17% (104) 16% (97) 622Employ: Government 25% (32) 25% (32) 15% (20) 18% (23) 17% (22) 129Employ: Self-Employed 24% (38) 30% (47) 15% (23) 16% (25) 15% (24) 157Employ: Homemaker 19% (24) 22% (27) 16% (20) 14% (17) 31% (39) 127Employ: Retired 28% (161) 23% (132) 15% (88) 24% (139) 11% (61) 581Employ: Unemployed 27% (58) 22% (46) 12% (26) 12% (26) 27% (59) 215Employ: Other 22% (25) 21% (24) 6% (6) 13% (15) 38% (43) 113Military HH: Yes 25% (92) 22% (81) 16% (59) 23% (82) 13% (48) 361Military HH: No 25% (403) 26% (415) 14% (227) 17% (273) 19% (309) 1629RD/WT: Right Direction 38% (353) 30% (284) 10% (93) 6% (59) 16% (152) 941RD/WT: Wrong Track 14% (142) 20% (213) 18% (194) 28% (296) 20% (205) 1049Biden Job Approve 38% (395) 31% (319) 10% (101) 6% (64) 15% (158) 1037Biden Job Disapprove 11% (95) 19% (162) 20% (172) 33% (286) 16% (141) 857Biden Job Strongly Approve 47% (256) 27% (150) 7% (39) 5% (26) 14% (78) 548Biden Job Somewhat Approve 28% (139) 34% (169) 13% (62) 8% (38) 16% (81) 489Biden Job Somewhat Disapprove 14% (30) 34% (76) 19% (42) 16% (35) 18% (40) 223Biden Job Strongly Disapprove 10% (65) 14% (87) 21% (131) 40% (251) 16% (101) 634
Continued on next page
Page 267
National Tracking Poll #210636, June, 2021
267
Table POL18_4
Table POL18_4: Would you support or oppose the following potential sources of funding for U.S. infrastructure investments?A 25 percent tax rate for corporations for 15 years
DemographicStronglysupport
Somewhatsupport
Somewhatoppose
Stronglyoppose
Don’t Know /No Opinion Total N
Registered Voters 25% (495) 25% (496) 14% (286) 18% (355) 18% (357) 1990Favorable of Biden 38% (397) 31% (320) 10% (100) 6% (66) 16% (165) 1048Unfavorable of Biden 11% (92) 19% (164) 21% (177) 33% (280) 17% (142) 855Very Favorable of Biden 46% (275) 29% (170) 7% (39) 5% (28) 14% (81) 593Somewhat Favorable of Biden 27% (122) 33% (151) 13% (61) 8% (38) 18% (84) 455Somewhat Unfavorable of Biden 13% (25) 36% (68) 20% (38) 14% (27) 17% (32) 190Very Unfavorable of Biden 10% (66) 14% (96) 21% (139) 38% (253) 17% (110) 664#1 Issue: Economy 21% (159) 23% (177) 16% (121) 21% (159) 19% (148) 763#1 Issue: Security 13% (45) 21% (73) 21% (73) 27% (93) 19% (65) 349#1 Issue: Health Care 36% (84) 29% (68) 9% (20) 10% (23) 16% (37) 233#1 Issue: Medicare / Social Security 36% (94) 28% (73) 12% (32) 13% (35) 10% (27) 261#1 Issue: Women’s Issues 28% (29) 29% (30) 8% (8) 9% (10) 26% (27) 103#1 Issue: Education 33% (28) 27% (23) 11% (10) 7% (6) 22% (19) 86#1 Issue: Energy 28% (24) 30% (26) 12% (10) 11% (9) 20% (17) 86#1 Issue: Other 30% (32) 25% (27) 11% (12) 19% (21) 15% (17) 1092020 Vote: Joe Biden 41% (368) 31% (274) 8% (75) 6% (50) 14% (129) 8972020 Vote: Donald Trump 11% (88) 19% (157) 21% (173) 33% (273) 16% (128) 8182020 Vote: Didn’t Vote 12% (29) 24% (58) 14% (33) 11% (26) 39% (93) 2392018 House Vote: Democrat 44% (301) 30% (204) 9% (62) 5% (37) 12% (83) 6872018 House Vote: Republican 11% (78) 19% (128) 21% (147) 34% (238) 14% (99) 6902018 House Vote: Someone else 28% (14) 21% (10) 12% (6) 11% (6) 28% (14) 502016 Vote: Hillary Clinton 44% (276) 30% (188) 8% (49) 5% (33) 14% (85) 6312016 Vote: Donald Trump 12% (92) 20% (152) 20% (157) 33% (256) 15% (111) 7682016 Vote: Other 26% (27) 24% (26) 22% (24) 12% (13) 16% (17) 1072016 Vote: Didn’t Vote 21% (100) 27% (130) 12% (56) 11% (54) 30% (144) 483Voted in 2014: Yes 28% (365) 23% (300) 15% (198) 20% (263) 13% (172) 1297Voted in 2014: No 19% (130) 28% (197) 13% (88) 13% (93) 27% (186) 6934-Region: Northeast 29% (99) 28% (98) 12% (43) 12% (40) 19% (65) 3444-Region: Midwest 24% (110) 25% (115) 14% (62) 19% (85) 19% (85) 4554-Region: South 22% (168) 25% (189) 16% (122) 19% (142) 18% (135) 7554-Region: West 27% (119) 22% (95) 14% (60) 20% (89) 17% (73) 435
Continued on next page
Page 268
268
Morning ConsultTable POL18_4
Table POL18_4: Would you support or oppose the following potential sources of funding for U.S. infrastructure investments?A 25 percent tax rate for corporations for 15 years
DemographicStronglysupport
Somewhatsupport
Somewhatoppose
Stronglyoppose
Don’t Know /No Opinion Total N
Registered Voters 25% (495) 25% (496) 14% (286) 18% (355) 18% (357) 1990Party: Democrat/Leans Democrat 39% (350) 31% (272) 9% (76) 6% (50) 16% (139) 888Party: Republican/Leans Republican 12% (99) 18% (145) 21% (171) 31% (254) 18% (145) 814Note: Row proportions may total to larger than one-hundred percent due to rounding. For more information visit MorningConsultIntelligence.com.
Page 269
National Tracking Poll #210636, June, 2021
269
Table POL18_5
Table POL18_5: Would you support or oppose the following potential sources of funding for U.S. infrastructure investments?A 28 percent tax rate for corporations for 15 years
DemographicStronglysupport
Somewhatsupport
Somewhatoppose
Stronglyoppose
Don’t Know /No Opinion Total N
Registered Voters 26% (518) 21% (410) 16% (319) 19% (380) 18% (364) 1990Gender: Male 28% (262) 22% (207) 15% (135) 22% (205) 13% (119) 927Gender: Female 24% (256) 19% (203) 17% (184) 16% (175) 23% (245) 1063Age: 18-34 21% (96) 23% (106) 15% (68) 15% (69) 26% (116) 456Age: 35-44 25% (76) 21% (64) 13% (38) 14% (43) 26% (79) 300Age: 45-64 28% (202) 20% (148) 17% (126) 21% (150) 14% (104) 730Age: 65+ 29% (144) 18% (91) 17% (87) 23% (118) 13% (64) 504GenZers: 1997-2012 15% (25) 21% (36) 13% (22) 18% (30) 34% (57) 169Millennials: 1981-1996 25% (120) 23% (112) 15% (74) 15% (70) 22% (104) 480GenXers: 1965-1980 26% (138) 21% (112) 15% (77) 18% (93) 20% (106) 525Baby Boomers: 1946-1964 30% (223) 19% (139) 18% (131) 22% (163) 12% (90) 746PID: Dem (no lean) 41% (308) 25% (188) 12% (87) 6% (44) 16% (124) 752PID: Ind (no lean) 23% (130) 22% (130) 16% (90) 19% (109) 21% (119) 578PID: Rep (no lean) 12% (79) 14% (91) 21% (141) 34% (227) 18% (122) 661PID/Gender: DemMen 44% (159) 28% (99) 10% (37) 7% (25) 11% (39) 359PID/Gender: DemWomen 38% (150) 23% (90) 13% (50) 5% (19) 21% (84) 393PID/Gender: Ind Men 25% (67) 22% (58) 14% (38) 25% (67) 14% (37) 267PID/Gender: Ind Women 20% (63) 23% (71) 17% (53) 13% (42) 26% (82) 311PID/Gender: Rep Men 12% (36) 16% (50) 20% (60) 37% (113) 14% (42) 301PID/Gender: Rep Women 12% (43) 12% (42) 23% (81) 32% (114) 22% (80) 360Ideo: Liberal (1-3) 45% (264) 26% (153) 8% (47) 6% (37) 15% (85) 587Ideo: Moderate (4) 28% (151) 23% (122) 19% (105) 9% (50) 21% (111) 539Ideo: Conservative (5-7) 11% (85) 16% (116) 22% (162) 37% (274) 14% (105) 742Educ: < College 24% (289) 20% (243) 17% (205) 17% (208) 22% (268) 1213Educ: Bachelors degree 30% (144) 21% (104) 15% (72) 21% (103) 13% (66) 489Educ: Post-grad 29% (84) 22% (62) 15% (42) 24% (69) 11% (31) 288Income: Under 50k 28% (277) 19% (184) 15% (153) 17% (172) 21% (204) 991Income: 50k-100k 24% (154) 23% (148) 16% (100) 21% (132) 16% (106) 640Income: 100k+ 24% (87) 21% (77) 18% (66) 21% (75) 15% (54) 359Ethnicity: White 25% (397) 20% (318) 17% (264) 21% (336) 17% (269) 1584Ethnicity: Hispanic 26% (50) 21% (41) 14% (28) 14% (28) 25% (48) 196
Continued on next page
Page 270
270
Morning ConsultTable POL18_5
Table POL18_5: Would you support or oppose the following potential sources of funding for U.S. infrastructure investments?A 28 percent tax rate for corporations for 15 years
DemographicStronglysupport
Somewhatsupport
Somewhatoppose
Stronglyoppose
Don’t Know /No Opinion Total N
Registered Voters 26% (518) 21% (410) 16% (319) 19% (380) 18% (364) 1990Ethnicity: Black 31% (75) 21% (51) 15% (36) 8% (19) 26% (62) 243Ethnicity: Other 28% (46) 25% (40) 12% (19) 15% (25) 20% (33) 163All Christian 21% (206) 20% (194) 19% (183) 24% (229) 16% (151) 964All Non-Christian 32% (39) 23% (28) 10% (12) 18% (22) 17% (21) 121Atheist 39% (29) 20% (14) 10% (7) 17% (12) 14% (10) 73Agnostic/Nothing in particular 32% (156) 23% (115) 13% (65) 11% (56) 21% (102) 495Something Else 26% (88) 17% (58) 15% (51) 18% (60) 24% (81) 337Religious Non-Protestant/Catholic 29% (41) 23% (32) 12% (17) 18% (25) 18% (25) 140Evangelical 19% (104) 16% (87) 19% (107) 28% (152) 18% (98) 547Non-Evangelical 26% (186) 22% (157) 16% (117) 18% (132) 18% (128) 721Community: Urban 33% (174) 22% (115) 15% (78) 14% (74) 17% (88) 529Community: Suburban 25% (251) 20% (201) 17% (171) 20% (200) 18% (175) 998Community: Rural 20% (92) 20% (94) 15% (69) 23% (107) 22% (101) 464Employ: Private Sector 25% (155) 24% (150) 16% (97) 20% (122) 16% (98) 622Employ: Government 25% (32) 26% (33) 11% (14) 23% (29) 16% (21) 129Employ: Self-Employed 27% (42) 21% (33) 18% (28) 19% (30) 15% (23) 157Employ: Homemaker 16% (20) 17% (22) 23% (29) 14% (18) 29% (37) 127Employ: Retired 30% (173) 17% (97) 18% (104) 24% (140) 12% (67) 581Employ: Unemployed 30% (64) 19% (40) 13% (29) 9% (19) 29% (63) 215Employ: Other 20% (23) 19% (22) 12% (13) 12% (14) 36% (41) 113Military HH: Yes 23% (82) 19% (70) 16% (58) 27% (97) 15% (55) 361Military HH: No 27% (436) 21% (339) 16% (261) 17% (283) 19% (310) 1629RD/WT: Right Direction 40% (377) 25% (235) 12% (113) 7% (63) 16% (153) 941RD/WT: Wrong Track 13% (141) 17% (175) 20% (206) 30% (317) 20% (211) 1049Biden Job Approve 40% (418) 25% (263) 12% (127) 7% (69) 16% (161) 1037Biden Job Disapprove 11% (95) 15% (130) 21% (180) 35% (304) 17% (148) 857Biden Job Strongly Approve 49% (271) 22% (121) 9% (48) 6% (30) 14% (78) 548Biden Job Somewhat Approve 30% (147) 29% (141) 16% (79) 8% (38) 17% (83) 489Biden Job Somewhat Disapprove 15% (34) 24% (53) 26% (57) 16% (36) 19% (43) 223Biden Job Strongly Disapprove 10% (61) 12% (77) 19% (123) 42% (267) 17% (106) 634
Continued on next page
Page 271
National Tracking Poll #210636, June, 2021
271
Table POL18_5
Table POL18_5: Would you support or oppose the following potential sources of funding for U.S. infrastructure investments?A 28 percent tax rate for corporations for 15 years
DemographicStronglysupport
Somewhatsupport
Somewhatoppose
Stronglyoppose
Don’t Know /No Opinion Total N
Registered Voters 26% (518) 21% (410) 16% (319) 19% (380) 18% (364) 1990Favorable of Biden 40% (416) 26% (271) 12% (123) 7% (69) 16% (169) 1048Unfavorable of Biden 11% (96) 15% (126) 22% (185) 35% (300) 17% (147) 855Very Favorable of Biden 49% (289) 23% (137) 9% (55) 4% (27) 14% (85) 593Somewhat Favorable of Biden 28% (126) 29% (133) 15% (68) 9% (43) 19% (84) 455Somewhat Unfavorable of Biden 16% (31) 22% (41) 28% (53) 14% (27) 20% (38) 190Very Unfavorable of Biden 10% (65) 13% (85) 20% (132) 41% (273) 16% (109) 664#1 Issue: Economy 21% (163) 18% (139) 19% (144) 22% (168) 20% (150) 763#1 Issue: Security 13% (44) 17% (58) 19% (66) 32% (110) 20% (71) 349#1 Issue: Health Care 40% (94) 25% (59) 13% (31) 8% (19) 13% (29) 233#1 Issue: Medicare / Social Security 39% (101) 25% (64) 15% (38) 11% (28) 11% (30) 261#1 Issue: Women’s Issues 27% (28) 26% (27) 11% (11) 9% (9) 27% (27) 103#1 Issue: Education 27% (23) 21% (18) 14% (12) 15% (13) 23% (20) 86#1 Issue: Energy 31% (26) 26% (22) 8% (7) 14% (12) 22% (18) 86#1 Issue: Other 35% (39) 20% (22) 8% (9) 19% (21) 17% (19) 1092020 Vote: Joe Biden 43% (383) 25% (225) 12% (104) 6% (50) 15% (135) 8972020 Vote: Donald Trump 11% (88) 16% (129) 21% (173) 36% (293) 17% (135) 8182020 Vote: Didn’t Vote 16% (38) 20% (49) 15% (37) 12% (29) 36% (87) 2392018 House Vote: Democrat 45% (309) 26% (176) 12% (83) 5% (34) 12% (84) 6872018 House Vote: Republican 11% (78) 14% (97) 21% (147) 38% (264) 15% (103) 6902018 House Vote: Someone else 29% (15) 20% (10) 10% (5) 10% (5) 30% (15) 502016 Vote: Hillary Clinton 45% (287) 25% (155) 11% (66) 5% (32) 14% (90) 6312016 Vote: Donald Trump 12% (96) 16% (121) 20% (156) 36% (276) 16% (119) 7682016 Vote: Other 28% (30) 18% (20) 23% (25) 14% (15) 17% (18) 1072016 Vote: Didn’t Vote 22% (106) 23% (114) 15% (71) 12% (57) 28% (136) 483Voted in 2014: Yes 29% (376) 19% (247) 16% (213) 22% (285) 14% (176) 1297Voted in 2014: No 20% (141) 23% (162) 15% (106) 14% (95) 27% (188) 6934-Region: Northeast 30% (102) 26% (90) 13% (44) 13% (44) 19% (64) 3444-Region: Midwest 24% (109) 21% (96) 17% (78) 20% (92) 18% (80) 4554-Region: South 24% (185) 19% (147) 17% (132) 20% (149) 19% (143) 7554-Region: West 28% (122) 18% (77) 15% (66) 22% (94) 18% (77) 435
Continued on next page
Page 272
272
Morning ConsultTable POL18_5
Table POL18_5: Would you support or oppose the following potential sources of funding for U.S. infrastructure investments?A 28 percent tax rate for corporations for 15 years
DemographicStronglysupport
Somewhatsupport
Somewhatoppose
Stronglyoppose
Don’t Know /No Opinion Total N
Registered Voters 26% (518) 21% (410) 16% (319) 19% (380) 18% (364) 1990Party: Democrat/Leans Democrat 42% (370) 25% (226) 12% (105) 5% (48) 16% (138) 888Party: Republican/Leans Republican 12% (98) 14% (113) 21% (171) 34% (278) 19% (153) 814Note: Row proportions may total to larger than one-hundred percent due to rounding. For more information visit MorningConsultIntelligence.com.
Page 273
National Tracking Poll #210636, June, 2021
273
Table POL18_6
Table POL18_6: Would you support or oppose the following potential sources of funding for U.S. infrastructure investments?A 15 percent minimum tax rate for corporations
DemographicStronglysupport
Somewhatsupport
Somewhatoppose
Stronglyoppose
Don’t Know /No Opinion Total N
Registered Voters 29% (578) 28% (549) 12% (242) 14% (277) 17% (345) 1990Gender: Male 33% (304) 27% (251) 12% (113) 15% (141) 13% (118) 927Gender: Female 26% (274) 28% (298) 12% (128) 13% (135) 21% (227) 1063Age: 18-34 24% (109) 25% (115) 13% (58) 12% (55) 26% (119) 456Age: 35-44 26% (79) 28% (84) 11% (32) 13% (40) 22% (66) 300Age: 45-64 30% (221) 27% (200) 12% (91) 15% (107) 15% (112) 730Age: 65+ 34% (169) 30% (150) 12% (61) 15% (75) 9% (48) 504GenZers: 1997-2012 19% (32) 26% (45) 12% (20) 14% (23) 29% (50) 169Millennials: 1981-1996 27% (129) 25% (119) 13% (62) 12% (58) 23% (112) 480GenXers: 1965-1980 27% (144) 29% (154) 11% (59) 13% (68) 19% (99) 525Baby Boomers: 1946-1964 34% (255) 28% (208) 12% (90) 15% (114) 10% (78) 746PID: Dem (no lean) 43% (323) 27% (202) 9% (64) 8% (57) 14% (105) 752PID: Ind (no lean) 26% (149) 30% (172) 11% (65) 13% (74) 20% (117) 578PID: Rep (no lean) 16% (106) 26% (175) 17% (112) 22% (145) 19% (123) 661PID/Gender: DemMen 49% (174) 25% (91) 10% (34) 7% (25) 10% (35) 359PID/Gender: DemWomen 38% (149) 28% (112) 8% (30) 8% (32) 18% (70) 393PID/Gender: Ind Men 28% (75) 31% (83) 10% (26) 17% (45) 15% (39) 267PID/Gender: Ind Women 24% (75) 29% (89) 13% (39) 9% (29) 25% (79) 311PID/Gender: Rep Men 18% (55) 26% (77) 18% (53) 24% (71) 15% (44) 301PID/Gender: Rep Women 14% (51) 27% (97) 16% (59) 21% (74) 22% (79) 360Ideo: Liberal (1-3) 48% (285) 25% (148) 6% (35) 8% (46) 13% (75) 587Ideo: Moderate (4) 29% (158) 31% (166) 13% (70) 9% (49) 18% (96) 539Ideo: Conservative (5-7) 16% (116) 29% (214) 17% (129) 23% (170) 15% (113) 742Educ: < College 26% (311) 27% (324) 13% (157) 14% (168) 21% (252) 1213Educ: Bachelors degree 33% (159) 28% (136) 12% (58) 14% (69) 14% (67) 489Educ: Post-grad 37% (108) 31% (89) 9% (27) 14% (39) 9% (25) 288Income: Under 50k 28% (273) 27% (269) 11% (109) 13% (132) 21% (207) 991Income: 50k-100k 30% (190) 27% (175) 13% (84) 15% (94) 15% (97) 640Income: 100k+ 32% (115) 29% (104) 14% (49) 14% (50) 11% (41) 359Ethnicity: White 29% (455) 28% (437) 13% (205) 15% (233) 16% (254) 1584Ethnicity: Hispanic 29% (58) 25% (48) 12% (23) 11% (22) 23% (46) 196
Continued on next page
Page 274
274
Morning ConsultTable POL18_6
Table POL18_6: Would you support or oppose the following potential sources of funding for U.S. infrastructure investments?A 15 percent minimum tax rate for corporations
DemographicStronglysupport
Somewhatsupport
Somewhatoppose
Stronglyoppose
Don’t Know /No Opinion Total N
Registered Voters 29% (578) 28% (549) 12% (242) 14% (277) 17% (345) 1990Ethnicity: Black 29% (70) 26% (63) 9% (21) 11% (26) 26% (62) 243Ethnicity: Other 32% (53) 29% (48) 10% (16) 11% (18) 18% (29) 163All Christian 26% (250) 30% (289) 15% (148) 15% (147) 14% (130) 964All Non-Christian 40% (49) 22% (27) 11% (13) 13% (15) 14% (17) 121Atheist 38% (28) 31% (22) 6% (4) 8% (6) 18% (13) 73Agnostic/Nothing in particular 33% (165) 25% (124) 10% (48) 12% (58) 20% (100) 495Something Else 26% (87) 25% (86) 9% (29) 15% (50) 25% (85) 337Religious Non-Protestant/Catholic 35% (49) 25% (35) 10% (14) 13% (18) 18% (25) 140Evangelical 21% (114) 28% (154) 15% (81) 19% (102) 18% (97) 547Non-Evangelical 31% (221) 29% (208) 13% (92) 13% (91) 15% (110) 721Community: Urban 33% (177) 28% (147) 11% (58) 11% (60) 17% (87) 529Community: Suburban 29% (294) 27% (270) 12% (117) 15% (153) 16% (164) 998Community: Rural 23% (108) 28% (132) 14% (67) 14% (64) 20% (94) 464Employ: Private Sector 28% (176) 29% (177) 11% (68) 16% (99) 16% (100) 622Employ: Government 26% (34) 32% (41) 13% (17) 14% (18) 15% (19) 129Employ: Self-Employed 33% (52) 29% (45) 13% (21) 12% (19) 13% (21) 157Employ: Homemaker 19% (24) 25% (31) 18% (23) 11% (14) 27% (34) 127Employ: Retired 34% (195) 28% (163) 11% (66) 17% (97) 10% (60) 581Employ: Unemployed 28% (60) 24% (52) 16% (35) 7% (14) 25% (53) 215Employ: Other 22% (25) 27% (30) 4% (5) 8% (9) 39% (44) 113Military HH: Yes 31% (111) 25% (91) 15% (52) 17% (63) 12% (44) 361Military HH: No 29% (467) 28% (458) 12% (189) 13% (214) 18% (301) 1629RD/WT: Right Direction 41% (388) 28% (265) 9% (84) 7% (69) 14% (136) 941RD/WT: Wrong Track 18% (190) 27% (284) 15% (158) 20% (207) 20% (209) 1049Biden Job Approve 43% (446) 28% (293) 8% (87) 7% (70) 14% (141) 1037Biden Job Disapprove 14% (122) 28% (238) 17% (148) 23% (199) 18% (150) 857Biden Job Strongly Approve 51% (278) 24% (130) 6% (34) 7% (38) 12% (68) 548Biden Job Somewhat Approve 34% (168) 33% (163) 11% (53) 7% (32) 15% (73) 489Biden Job Somewhat Disapprove 20% (45) 36% (80) 14% (30) 12% (26) 19% (42) 223Biden Job Strongly Disapprove 12% (77) 25% (157) 19% (118) 27% (173) 17% (109) 634
Continued on next page
Page 275
National Tracking Poll #210636, June, 2021
275
Table POL18_6
Table POL18_6: Would you support or oppose the following potential sources of funding for U.S. infrastructure investments?A 15 percent minimum tax rate for corporations
DemographicStronglysupport
Somewhatsupport
Somewhatoppose
Stronglyoppose
Don’t Know /No Opinion Total N
Registered Voters 29% (578) 28% (549) 12% (242) 14% (277) 17% (345) 1990Favorable of Biden 43% (448) 28% (299) 8% (81) 7% (72) 14% (148) 1048Unfavorable of Biden 14% (117) 27% (234) 18% (158) 23% (196) 18% (151) 855Very Favorable of Biden 51% (301) 24% (144) 6% (33) 8% (45) 12% (71) 593Somewhat Favorable of Biden 32% (147) 34% (155) 11% (48) 6% (27) 17% (78) 455Somewhat Unfavorable of Biden 19% (37) 39% (74) 16% (31) 9% (16) 17% (32) 190Very Unfavorable of Biden 12% (80) 24% (159) 19% (127) 27% (179) 18% (118) 664#1 Issue: Economy 25% (188) 29% (219) 14% (106) 15% (115) 18% (135) 763#1 Issue: Security 19% (65) 28% (98) 14% (49) 17% (61) 22% (76) 349#1 Issue: Health Care 41% (96) 29% (68) 6% (13) 11% (26) 13% (30) 233#1 Issue: Medicare / Social Security 40% (105) 27% (71) 11% (29) 12% (31) 10% (25) 261#1 Issue: Women’s Issues 29% (30) 28% (28) 10% (11) 7% (8) 25% (26) 103#1 Issue: Education 29% (25) 28% (24) 12% (10) 6% (5) 25% (21) 86#1 Issue: Energy 36% (31) 19% (16) 10% (8) 16% (14) 20% (17) 86#1 Issue: Other 35% (38) 22% (24) 14% (15) 16% (18) 13% (14) 1092020 Vote: Joe Biden 45% (408) 29% (260) 7% (61) 7% (59) 12% (110) 8972020 Vote: Donald Trump 14% (118) 28% (228) 18% (145) 23% (189) 17% (139) 8182020 Vote: Didn’t Vote 17% (41) 22% (54) 14% (33) 9% (22) 37% (89) 2392018 House Vote: Democrat 49% (333) 29% (197) 6% (42) 7% (47) 10% (68) 6872018 House Vote: Republican 15% (105) 28% (197) 18% (124) 23% (161) 15% (103) 6902018 House Vote: Someone else 38% (19) 19% (9) 9% (4) 8% (4) 26% (13) 502016 Vote: Hillary Clinton 49% (308) 27% (168) 6% (38) 7% (44) 12% (73) 6312016 Vote: Donald Trump 16% (119) 29% (223) 16% (125) 23% (175) 16% (125) 7682016 Vote: Other 35% (37) 27% (29) 16% (17) 10% (11) 11% (12) 1072016 Vote: Didn’t Vote 24% (114) 27% (129) 13% (61) 9% (45) 28% (135) 483Voted in 2014: Yes 33% (424) 28% (360) 12% (157) 15% (196) 12% (160) 1297Voted in 2014: No 22% (154) 27% (189) 12% (84) 12% (80) 27% (185) 6934-Region: Northeast 33% (115) 28% (96) 11% (38) 10% (35) 17% (60) 3444-Region: Midwest 30% (134) 28% (129) 14% (62) 13% (57) 16% (73) 4554-Region: South 26% (194) 29% (222) 12% (90) 14% (109) 19% (141) 7554-Region: West 31% (135) 23% (102) 12% (52) 17% (76) 16% (71) 435
Continued on next page
Page 276
276
Morning ConsultTable POL18_6
Table POL18_6: Would you support or oppose the following potential sources of funding for U.S. infrastructure investments?A 15 percent minimum tax rate for corporations
DemographicStronglysupport
Somewhatsupport
Somewhatoppose
Stronglyoppose
Don’t Know /No Opinion Total N
Registered Voters 29% (578) 28% (549) 12% (242) 14% (277) 17% (345) 1990Party: Democrat/Leans Democrat 44% (389) 28% (248) 8% (68) 7% (63) 13% (120) 888Party: Republican/Leans Republican 16% (127) 26% (216) 17% (134) 22% (181) 19% (156) 814Note: Row proportions may total to larger than one-hundred percent due to rounding. For more information visit MorningConsultIntelligence.com.
Page 277
National Tracking Poll #210636, June, 2021
277
Table POL19_1
Table POL19_1: How much have you seen, read, or heard about the following?Former President Donald Trump telling his allies that he believes he will be reinstated as president of the United States by August
Demographic A lot Some Not Much Nothing at all Total N
Registered Voters 18% (359) 29% (584) 23% (452) 30% (595) 1990Gender: Male 21% (191) 29% (266) 26% (238) 25% (233) 927Gender: Female 16% (168) 30% (318) 20% (214) 34% (362) 1063Age: 18-34 21% (97) 27% (124) 24% (108) 28% (127) 456Age: 35-44 19% (56) 30% (90) 19% (56) 32% (97) 300Age: 45-64 14% (102) 29% (214) 25% (183) 32% (231) 730Age: 65+ 21% (104) 31% (156) 21% (105) 28% (139) 504GenZers: 1997-2012 16% (26) 31% (52) 26% (45) 27% (46) 169Millennials: 1981-1996 22% (108) 27% (130) 21% (99) 30% (143) 480GenXers: 1965-1980 17% (90) 28% (148) 24% (128) 30% (160) 525Baby Boomers: 1946-1964 17% (126) 31% (233) 22% (165) 30% (222) 746PID: Dem (no lean) 27% (200) 33% (245) 19% (143) 22% (162) 752PID: Ind (no lean) 16% (92) 25% (146) 23% (134) 36% (207) 578PID: Rep (no lean) 10% (67) 29% (193) 26% (175) 34% (226) 661PID/Gender: DemMen 30% (107) 31% (112) 19% (67) 20% (72) 359PID/Gender: DemWomen 24% (93) 34% (133) 19% (76) 23% (90) 393PID/Gender: Ind Men 17% (46) 25% (66) 29% (78) 29% (77) 267PID/Gender: Ind Women 15% (45) 26% (80) 18% (55) 42% (130) 311PID/Gender: Rep Men 12% (37) 29% (87) 30% (92) 28% (85) 301PID/Gender: Rep Women 8% (30) 29% (105) 23% (83) 39% (142) 360Ideo: Liberal (1-3) 31% (179) 35% (204) 18% (104) 17% (101) 587Ideo: Moderate (4) 17% (90) 29% (156) 25% (132) 30% (161) 539Ideo: Conservative (5-7) 10% (76) 28% (208) 26% (191) 36% (267) 742Educ: < College 15% (186) 26% (318) 25% (301) 34% (407) 1213Educ: Bachelors degree 23% (111) 33% (162) 18% (86) 27% (130) 489Educ: Post-grad 22% (62) 36% (104) 22% (65) 20% (58) 288Income: Under 50k 17% (166) 29% (289) 23% (225) 31% (311) 991Income: 50k-100k 18% (113) 29% (188) 23% (146) 30% (192) 640Income: 100k+ 22% (80) 30% (107) 22% (80) 26% (92) 359Ethnicity: White 18% (289) 30% (473) 23% (357) 29% (465) 1584Ethnicity: Hispanic 18% (35) 28% (55) 25% (49) 29% (57) 196Ethnicity: Black 20% (48) 27% (65) 21% (52) 32% (78) 243
Continued on next page
Page 278
278
Morning ConsultTable POL19_1
Table POL19_1: How much have you seen, read, or heard about the following?Former President Donald Trump telling his allies that he believes he will be reinstated as president of the United States by August
Demographic A lot Some Not Much Nothing at all Total N
Registered Voters 18% (359) 29% (584) 23% (452) 30% (595) 1990Ethnicity: Other 14% (23) 28% (46) 27% (44) 32% (51) 163All Christian 17% (160) 30% (289) 24% (229) 30% (287) 964All Non-Christian 37% (44) 23% (28) 17% (21) 23% (28) 121Atheist 20% (14) 25% (18) 33% (24) 23% (17) 73Agnostic/Nothing in particular 17% (83) 31% (152) 22% (108) 31% (151) 495Something Else 17% (57) 29% (96) 21% (71) 33% (113) 337Religious Non-Protestant/Catholic 33% (47) 25% (36) 17% (24) 24% (33) 140Evangelical 16% (86) 28% (152) 24% (130) 33% (180) 547Non-Evangelical 17% (122) 31% (223) 23% (165) 29% (210) 721Community: Urban 24% (128) 27% (142) 25% (130) 24% (129) 529Community: Suburban 16% (159) 30% (302) 21% (208) 33% (328) 998Community: Rural 16% (72) 30% (140) 25% (114) 30% (138) 464Employ: Private Sector 18% (115) 31% (193) 24% (149) 26% (165) 622Employ: Government 21% (28) 30% (39) 21% (28) 27% (34) 129Employ: Self-Employed 22% (35) 37% (58) 21% (33) 20% (32) 157Employ: Homemaker 13% (17) 25% (32) 14% (17) 48% (61) 127Employ: Retired 19% (108) 29% (168) 23% (136) 29% (169) 581Employ: Unemployed 12% (27) 28% (59) 28% (59) 32% (69) 215Employ: Other 18% (20) 22% (24) 13% (15) 47% (53) 113Military HH: Yes 18% (65) 27% (96) 26% (94) 29% (107) 361Military HH: No 18% (294) 30% (487) 22% (358) 30% (489) 1629RD/WT: Right Direction 26% (241) 32% (299) 20% (186) 23% (216) 941RD/WT: Wrong Track 11% (118) 27% (285) 25% (266) 36% (379) 1049Biden Job Approve 27% (275) 32% (328) 21% (214) 21% (221) 1037Biden Job Disapprove 9% (79) 28% (240) 26% (223) 37% (315) 857Biden Job Strongly Approve 33% (178) 34% (184) 17% (92) 17% (94) 548Biden Job Somewhat Approve 20% (97) 29% (144) 25% (121) 26% (127) 489Biden Job Somewhat Disapprove 7% (15) 33% (74) 29% (65) 31% (70) 223Biden Job Strongly Disapprove 10% (65) 26% (166) 25% (158) 39% (245) 634Favorable of Biden 26% (271) 32% (333) 20% (211) 22% (233) 1048Unfavorable of Biden 9% (77) 28% (242) 26% (222) 37% (314) 855
Continued on next page
Page 279
National Tracking Poll #210636, June, 2021
279
Table POL19_1
Table POL19_1: How much have you seen, read, or heard about the following?Former President Donald Trump telling his allies that he believes he will be reinstated as president of the United States by August
Demographic A lot Some Not Much Nothing at all Total N
Registered Voters 18% (359) 29% (584) 23% (452) 30% (595) 1990Very Favorable of Biden 33% (193) 34% (204) 15% (88) 18% (108) 593Somewhat Favorable of Biden 17% (78) 28% (129) 27% (123) 28% (126) 455Somewhat Unfavorable of Biden 9% (17) 30% (57) 28% (52) 33% (64) 190Very Unfavorable of Biden 9% (60) 28% (185) 26% (169) 38% (250) 664#1 Issue: Economy 16% (122) 28% (216) 24% (183) 32% (243) 763#1 Issue: Security 14% (48) 29% (103) 22% (77) 35% (122) 349#1 Issue: Health Care 24% (56) 31% (72) 22% (52) 22% (52) 233#1 Issue: Medicare / Social Security 20% (53) 29% (77) 20% (52) 30% (78) 261#1 Issue: Women’s Issues 23% (23) 31% (32) 17% (18) 29% (30) 103#1 Issue: Education 12% (10) 38% (33) 24% (20) 26% (23) 86#1 Issue: Energy 24% (21) 21% (18) 35% (30) 20% (17) 86#1 Issue: Other 22% (24) 32% (35) 18% (19) 28% (31) 1092020 Vote: Joe Biden 27% (240) 36% (320) 19% (170) 19% (167) 8972020 Vote: Donald Trump 10% (85) 26% (210) 26% (213) 38% (311) 8182020 Vote: Didn’t Vote 12% (29) 19% (45) 25% (61) 43% (104) 2392018 House Vote: Democrat 27% (188) 36% (248) 17% (120) 19% (132) 6872018 House Vote: Republican 12% (79) 25% (175) 29% (197) 35% (239) 6902018 House Vote: Someone else 5% (2) 19% (10) 21% (10) 55% (27) 502016 Vote: Hillary Clinton 27% (168) 36% (227) 18% (111) 20% (125) 6312016 Vote: Donald Trump 11% (86) 27% (211) 27% (209) 34% (262) 7682016 Vote: Other 20% (22) 25% (27) 23% (25) 32% (34) 1072016 Vote: Didn’t Vote 17% (84) 25% (119) 22% (107) 36% (174) 483Voted in 2014: Yes 19% (246) 30% (390) 23% (303) 28% (358) 1297Voted in 2014: No 16% (113) 28% (193) 22% (149) 34% (237) 6934-Region: Northeast 24% (84) 31% (108) 21% (73) 23% (80) 3444-Region: Midwest 18% (83) 29% (133) 23% (104) 30% (136) 4554-Region: South 16% (118) 30% (225) 23% (176) 31% (237) 7554-Region: West 17% (74) 27% (119) 23% (99) 33% (143) 435Party: Democrat/Leans Democrat 26% (235) 33% (293) 19% (173) 21% (187) 888Party: Republican/Leans Republican 11% (89) 27% (224) 26% (213) 35% (287) 814Note: Row proportions may total to larger than one-hundred percent due to rounding. For more information visit MorningConsultIntelligence.com.
Page 280
280
Morning ConsultTable POL19_2
Table POL19_2: How much have you seen, read, or heard about the following?The U.S. economy adding 559,000 jobs in May, underperforming expectations
Demographic A lot Some Not Much Nothing at all Total N
Registered Voters 17% (343) 33% (665) 25% (492) 25% (490) 1990Gender: Male 23% (212) 36% (333) 23% (215) 18% (167) 927Gender: Female 12% (130) 31% (332) 26% (277) 30% (323) 1063Age: 18-34 17% (78) 27% (123) 24% (110) 32% (145) 456Age: 35-44 16% (47) 29% (86) 26% (78) 30% (90) 300Age: 45-64 16% (116) 33% (241) 26% (190) 25% (183) 730Age: 65+ 20% (102) 43% (215) 23% (115) 14% (72) 504GenZers: 1997-2012 11% (19) 24% (40) 25% (42) 41% (69) 169Millennials: 1981-1996 18% (88) 30% (145) 23% (111) 28% (136) 480GenXers: 1965-1980 19% (98) 28% (149) 26% (136) 27% (142) 525Baby Boomers: 1946-1964 17% (125) 40% (296) 25% (186) 19% (139) 746PID: Dem (no lean) 22% (164) 37% (276) 21% (158) 20% (153) 752PID: Ind (no lean) 14% (78) 31% (181) 28% (159) 27% (159) 578PID: Rep (no lean) 15% (100) 31% (208) 26% (175) 27% (178) 661PID/Gender: DemMen 30% (107) 37% (133) 17% (61) 16% (57) 359PID/Gender: DemWomen 15% (57) 36% (143) 25% (97) 25% (96) 393PID/Gender: Ind Men 19% (51) 35% (95) 27% (71) 19% (50) 267PID/Gender: Ind Women 9% (28) 28% (86) 28% (88) 35% (108) 311PID/Gender: Rep Men 18% (55) 35% (105) 27% (82) 20% (60) 301PID/Gender: Rep Women 13% (46) 29% (103) 26% (92) 33% (118) 360Ideo: Liberal (1-3) 22% (130) 35% (205) 23% (134) 20% (118) 587Ideo: Moderate (4) 14% (75) 35% (189) 25% (136) 26% (138) 539Ideo: Conservative (5-7) 17% (127) 35% (259) 26% (195) 22% (162) 742Educ: < College 13% (160) 30% (365) 27% (331) 29% (356) 1213Educ: Bachelors degree 23% (113) 36% (174) 22% (106) 20% (96) 489Educ: Post-grad 24% (70) 44% (126) 19% (55) 13% (38) 288Income: Under 50k 14% (139) 29% (292) 28% (280) 28% (280) 991Income: 50k-100k 18% (115) 36% (230) 23% (147) 23% (147) 640Income: 100k+ 25% (89) 40% (143) 18% (65) 17% (63) 359Ethnicity: White 17% (276) 34% (538) 25% (392) 24% (378) 1584Ethnicity: Hispanic 21% (41) 25% (49) 29% (56) 25% (50) 196Ethnicity: Black 19% (47) 29% (71) 24% (58) 28% (67) 243
Continued on next page
Page 281
National Tracking Poll #210636, June, 2021
281
Table POL19_2
Table POL19_2: How much have you seen, read, or heard about the following?The U.S. economy adding 559,000 jobs in May, underperforming expectations
Demographic A lot Some Not Much Nothing at all Total N
Registered Voters 17% (343) 33% (665) 25% (492) 25% (490) 1990Ethnicity: Other 12% (20) 34% (56) 26% (42) 28% (45) 163All Christian 18% (172) 37% (360) 24% (235) 20% (197) 964All Non-Christian 37% (44) 29% (35) 14% (17) 20% (25) 121Atheist 10% (8) 36% (26) 28% (20) 26% (19) 73Agnostic/Nothing in particular 14% (71) 29% (144) 27% (135) 29% (145) 495Something Else 14% (48) 30% (100) 25% (85) 31% (103) 337Religious Non-Protestant/Catholic 34% (48) 30% (42) 15% (21) 21% (29) 140Evangelical 18% (97) 33% (181) 25% (135) 25% (134) 547Non-Evangelical 16% (116) 37% (267) 25% (178) 22% (159) 721Community: Urban 21% (112) 32% (171) 25% (132) 21% (114) 529Community: Suburban 17% (174) 34% (341) 25% (247) 24% (235) 998Community: Rural 12% (57) 33% (152) 24% (113) 30% (141) 464Employ: Private Sector 18% (111) 34% (214) 27% (167) 21% (129) 622Employ: Government 21% (27) 27% (35) 23% (30) 29% (37) 129Employ: Self-Employed 20% (32) 30% (48) 22% (34) 28% (43) 157Employ: Homemaker 17% (22) 24% (30) 22% (28) 36% (46) 127Employ: Retired 18% (102) 42% (247) 24% (142) 16% (91) 581Employ: Unemployed 13% (28) 24% (52) 27% (58) 36% (77) 215Employ: Other 11% (12) 22% (25) 24% (27) 43% (48) 113Military HH: Yes 16% (59) 40% (143) 24% (87) 20% (73) 361Military HH: No 17% (284) 32% (522) 25% (406) 26% (417) 1629RD/WT: Right Direction 22% (202) 36% (343) 21% (201) 21% (195) 941RD/WT: Wrong Track 13% (140) 31% (322) 28% (292) 28% (295) 1049Biden Job Approve 21% (214) 36% (378) 23% (241) 20% (203) 1037Biden Job Disapprove 15% (127) 32% (276) 27% (230) 26% (224) 857Biden Job Strongly Approve 29% (157) 39% (212) 17% (92) 16% (86) 548Biden Job Somewhat Approve 12% (57) 34% (166) 30% (149) 24% (117) 489Biden Job Somewhat Disapprove 13% (30) 32% (71) 28% (62) 27% (61) 223Biden Job Strongly Disapprove 15% (97) 32% (205) 27% (168) 26% (163) 634Favorable of Biden 21% (220) 36% (380) 23% (244) 19% (204) 1048Unfavorable of Biden 14% (118) 32% (275) 27% (232) 27% (229) 855
Continued on next page
Page 282
282
Morning ConsultTable POL19_2
Table POL19_2: How much have you seen, read, or heard about the following?The U.S. economy adding 559,000 jobs in May, underperforming expectations
Demographic A lot Some Not Much Nothing at all Total N
Registered Voters 17% (343) 33% (665) 25% (492) 25% (490) 1990Very Favorable of Biden 28% (167) 38% (224) 19% (110) 16% (92) 593Somewhat Favorable of Biden 12% (54) 34% (157) 29% (133) 25% (112) 455Somewhat Unfavorable of Biden 12% (23) 29% (56) 26% (50) 32% (61) 190Very Unfavorable of Biden 14% (95) 33% (219) 27% (182) 25% (168) 664#1 Issue: Economy 18% (134) 32% (241) 24% (187) 26% (201) 763#1 Issue: Security 16% (55) 35% (122) 27% (94) 22% (78) 349#1 Issue: Health Care 21% (48) 37% (86) 21% (48) 22% (51) 233#1 Issue: Medicare / Social Security 16% (41) 39% (101) 21% (55) 24% (64) 261#1 Issue: Women’s Issues 15% (16) 31% (31) 26% (27) 28% (29) 103#1 Issue: Education 15% (13) 32% (27) 25% (21) 28% (24) 86#1 Issue: Energy 22% (19) 27% (23) 28% (24) 23% (19) 86#1 Issue: Other 16% (17) 30% (33) 33% (36) 22% (24) 1092020 Vote: Joe Biden 21% (186) 38% (339) 22% (198) 19% (174) 8972020 Vote: Donald Trump 16% (131) 32% (265) 26% (217) 25% (206) 8182020 Vote: Didn’t Vote 9% (22) 22% (53) 28% (68) 40% (97) 2392018 House Vote: Democrat 22% (153) 40% (277) 21% (145) 16% (111) 6872018 House Vote: Republican 17% (118) 35% (239) 26% (182) 22% (151) 6902018 House Vote: Someone else 15% (8) 15% (8) 27% (14) 42% (21) 502016 Vote: Hillary Clinton 21% (134) 41% (258) 21% (131) 17% (108) 6312016 Vote: Donald Trump 17% (130) 34% (262) 26% (202) 23% (174) 7682016 Vote: Other 15% (16) 36% (38) 28% (30) 21% (23) 1072016 Vote: Didn’t Vote 13% (62) 22% (107) 27% (130) 38% (185) 483Voted in 2014: Yes 20% (260) 37% (486) 24% (307) 19% (244) 1297Voted in 2014: No 12% (83) 26% (179) 27% (185) 35% (246) 6934-Region: Northeast 22% (77) 36% (124) 22% (74) 20% (69) 3444-Region: Midwest 13% (60) 36% (165) 24% (111) 26% (119) 4554-Region: South 17% (131) 34% (256) 24% (184) 24% (184) 7554-Region: West 17% (75) 27% (119) 28% (123) 27% (117) 435Party: Democrat/Leans Democrat 21% (186) 37% (327) 22% (191) 21% (184) 888Party: Republican/Leans Republican 15% (123) 34% (274) 26% (209) 25% (207) 814Note: Row proportions may total to larger than one-hundred percent due to rounding. For more information visit MorningConsultIntelligence.com.
Page 283
National Tracking Poll #210636, June, 2021
283
Table POL19_3
Table POL19_3: How much have you seen, read, or heard about the following?President Joe Biden ordering U.S. intelligence agencies to investigate the origins of the COVID-19 pandemic
Demographic A lot Some Not Much Nothing at all Total N
Registered Voters 20% (396) 37% (739) 21% (413) 22% (442) 1990Gender: Male 23% (216) 40% (374) 20% (181) 17% (156) 927Gender: Female 17% (180) 34% (366) 22% (231) 27% (286) 1063Age: 18-34 18% (82) 32% (144) 22% (102) 28% (129) 456Age: 35-44 18% (55) 36% (107) 19% (56) 28% (83) 300Age: 45-64 19% (136) 37% (269) 21% (155) 23% (170) 730Age: 65+ 24% (123) 44% (219) 20% (100) 12% (61) 504GenZers: 1997-2012 15% (25) 24% (41) 28% (47) 33% (57) 169Millennials: 1981-1996 20% (95) 33% (160) 19% (93) 27% (131) 480GenXers: 1965-1980 19% (102) 37% (194) 20% (107) 23% (122) 525Baby Boomers: 1946-1964 21% (159) 42% (310) 21% (153) 17% (123) 746PID: Dem (no lean) 28% (208) 42% (315) 14% (105) 16% (123) 752PID: Ind (no lean) 16% (94) 37% (215) 23% (133) 23% (136) 578PID: Rep (no lean) 14% (94) 32% (210) 26% (174) 28% (183) 661PID/Gender: DemMen 35% (124) 41% (147) 11% (38) 14% (50) 359PID/Gender: DemWomen 21% (84) 43% (167) 17% (67) 19% (74) 393PID/Gender: Ind Men 17% (46) 42% (113) 22% (59) 18% (48) 267PID/Gender: Ind Women 15% (48) 33% (101) 24% (74) 28% (87) 311PID/Gender: Rep Men 15% (46) 37% (113) 28% (84) 19% (58) 301PID/Gender: Rep Women 13% (48) 27% (97) 25% (90) 35% (125) 360Ideo: Liberal (1-3) 30% (174) 42% (248) 15% (91) 13% (75) 587Ideo: Moderate (4) 19% (102) 37% (201) 20% (106) 24% (130) 539Ideo: Conservative (5-7) 15% (109) 36% (264) 26% (191) 24% (178) 742Educ: < College 16% (192) 34% (411) 24% (285) 27% (324) 1213Educ: Bachelors degree 24% (116) 41% (199) 18% (86) 18% (87) 489Educ: Post-grad 30% (87) 45% (129) 14% (41) 11% (31) 288Income: Under 50k 18% (177) 35% (346) 23% (224) 25% (244) 991Income: 50k-100k 20% (126) 38% (243) 20% (130) 22% (140) 640Income: 100k+ 26% (93) 42% (150) 16% (58) 16% (58) 359Ethnicity: White 20% (317) 37% (593) 21% (337) 21% (337) 1584Ethnicity: Hispanic 21% (40) 37% (72) 18% (35) 24% (48) 196Ethnicity: Black 22% (54) 34% (83) 16% (38) 28% (67) 243
Continued on next page
Page 284
284
Morning ConsultTable POL19_3
Table POL19_3: How much have you seen, read, or heard about the following?President Joe Biden ordering U.S. intelligence agencies to investigate the origins of the COVID-19 pandemic
Demographic A lot Some Not Much Nothing at all Total N
Registered Voters 20% (396) 37% (739) 21% (413) 22% (442) 1990Ethnicity: Other 15% (24) 39% (63) 23% (37) 24% (39) 163All Christian 20% (192) 39% (375) 21% (206) 20% (191) 964All Non-Christian 41% (50) 30% (36) 15% (18) 14% (17) 121Atheist 25% (18) 38% (28) 15% (11) 22% (16) 73Agnostic/Nothing in particular 16% (79) 38% (187) 22% (110) 24% (120) 495Something Else 17% (56) 34% (114) 20% (69) 29% (98) 337Religious Non-Protestant/Catholic 38% (53) 30% (42) 17% (25) 15% (21) 140Evangelical 19% (104) 35% (190) 20% (107) 27% (147) 547Non-Evangelical 19% (136) 40% (290) 22% (160) 19% (135) 721Community: Urban 26% (137) 38% (202) 17% (92) 18% (97) 529Community: Suburban 19% (192) 39% (390) 20% (200) 22% (215) 998Community: Rural 14% (66) 32% (147) 26% (120) 28% (130) 464Employ: Private Sector 19% (116) 39% (243) 20% (122) 23% (140) 622Employ: Government 22% (28) 35% (45) 21% (27) 21% (27) 129Employ: Self-Employed 24% (38) 37% (58) 22% (34) 17% (27) 157Employ: Homemaker 16% (20) 29% (37) 22% (28) 32% (41) 127Employ: Retired 24% (140) 42% (246) 20% (115) 14% (80) 581Employ: Unemployed 13% (29) 33% (70) 23% (49) 31% (67) 215Employ: Other 13% (14) 26% (29) 25% (29) 36% (41) 113Military HH: Yes 21% (76) 38% (138) 24% (86) 17% (62) 361Military HH: No 20% (320) 37% (601) 20% (327) 23% (380) 1629RD/WT: Right Direction 27% (259) 40% (377) 15% (137) 18% (168) 941RD/WT: Wrong Track 13% (137) 35% (362) 26% (275) 26% (274) 1049Biden Job Approve 28% (289) 40% (416) 17% (173) 15% (158) 1037Biden Job Disapprove 12% (103) 37% (313) 26% (219) 26% (222) 857Biden Job Strongly Approve 38% (207) 41% (225) 8% (46) 13% (70) 548Biden Job Somewhat Approve 17% (83) 39% (191) 26% (128) 18% (88) 489Biden Job Somewhat Disapprove 10% (23) 41% (92) 26% (58) 22% (50) 223Biden Job Strongly Disapprove 13% (80) 35% (221) 25% (161) 27% (172) 634Favorable of Biden 28% (288) 40% (423) 17% (174) 16% (163) 1048Unfavorable of Biden 11% (97) 36% (308) 26% (222) 27% (228) 855
Continued on next page
Page 285
National Tracking Poll #210636, June, 2021
285
Table POL19_3
Table POL19_3: How much have you seen, read, or heard about the following?President Joe Biden ordering U.S. intelligence agencies to investigate the origins of the COVID-19 pandemic
Demographic A lot Some Not Much Nothing at all Total N
Registered Voters 20% (396) 37% (739) 21% (413) 22% (442) 1990Very Favorable of Biden 36% (216) 40% (238) 11% (64) 13% (75) 593Somewhat Favorable of Biden 16% (73) 41% (185) 24% (110) 19% (88) 455Somewhat Unfavorable of Biden 8% (16) 37% (71) 27% (51) 28% (53) 190Very Unfavorable of Biden 12% (81) 36% (237) 26% (171) 26% (175) 664#1 Issue: Economy 18% (137) 35% (267) 23% (179) 24% (181) 763#1 Issue: Security 14% (50) 38% (132) 24% (84) 24% (84) 349#1 Issue: Health Care 30% (70) 34% (80) 17% (40) 18% (43) 233#1 Issue: Medicare / Social Security 24% (62) 42% (109) 15% (40) 19% (50) 261#1 Issue: Women’s Issues 16% (17) 43% (44) 18% (19) 23% (24) 103#1 Issue: Education 21% (18) 38% (32) 11% (9) 31% (26) 86#1 Issue: Energy 21% (18) 28% (24) 25% (21) 26% (22) 86#1 Issue: Other 22% (24) 48% (52) 18% (20) 12% (13) 1092020 Vote: Joe Biden 29% (257) 43% (384) 15% (131) 14% (125) 8972020 Vote: Donald Trump 13% (107) 34% (282) 27% (220) 26% (210) 8182020 Vote: Didn’t Vote 11% (27) 26% (63) 21% (51) 41% (99) 2392018 House Vote: Democrat 29% (200) 43% (299) 14% (97) 13% (91) 6872018 House Vote: Republican 14% (98) 36% (249) 25% (173) 25% (170) 6902018 House Vote: Someone else 24% (12) 21% (10) 26% (13) 29% (14) 502016 Vote: Hillary Clinton 28% (176) 44% (277) 15% (94) 13% (84) 6312016 Vote: Donald Trump 15% (117) 37% (282) 25% (188) 24% (181) 7682016 Vote: Other 18% (20) 45% (49) 18% (19) 19% (20) 1072016 Vote: Didn’t Vote 17% (84) 27% (131) 23% (111) 33% (158) 483Voted in 2014: Yes 22% (287) 40% (513) 19% (247) 19% (250) 1297Voted in 2014: No 16% (109) 33% (226) 24% (165) 28% (192) 6934-Region: Northeast 28% (98) 38% (132) 17% (58) 17% (57) 3444-Region: Midwest 17% (78) 39% (179) 19% (86) 25% (112) 4554-Region: South 19% (141) 39% (293) 20% (149) 23% (172) 7554-Region: West 18% (79) 31% (135) 28% (120) 23% (102) 435Party: Democrat/Leans Democrat 27% (239) 42% (370) 15% (134) 16% (144) 888Party: Republican/Leans Republican 14% (111) 35% (283) 25% (205) 26% (215) 814Note: Row proportions may total to larger than one-hundred percent due to rounding. For more information visit MorningConsultIntelligence.com.
Page 286
286
Morning ConsultTable POL19_4
Table POL19_4: How much have you seen, read, or heard about the following?Dr. Anthony Fauci calling on China to release medical records of three people who worked at a lab in Wuhan, China and reportedly became seriouslyill in 2019 a month before COVID-19 cases were reported
Demographic A lot Some Not Much Nothing at all Total N
Registered Voters 16% (318) 32% (637) 23% (453) 29% (582) 1990Gender: Male 19% (172) 35% (320) 23% (213) 24% (222) 927Gender: Female 14% (146) 30% (317) 23% (240) 34% (360) 1063Age: 18-34 18% (80) 31% (141) 22% (99) 30% (136) 456Age: 35-44 18% (55) 31% (92) 20% (60) 31% (93) 300Age: 45-64 14% (102) 31% (228) 24% (175) 31% (225) 730Age: 65+ 16% (80) 35% (176) 24% (119) 26% (129) 504GenZers: 1997-2012 13% (22) 25% (42) 23% (39) 39% (67) 169Millennials: 1981-1996 20% (98) 31% (149) 21% (99) 28% (134) 480GenXers: 1965-1980 15% (76) 33% (173) 22% (114) 31% (161) 525Baby Boomers: 1946-1964 15% (111) 33% (247) 25% (184) 27% (204) 746PID: Dem (no lean) 22% (162) 38% (286) 19% (139) 22% (164) 752PID: Ind (no lean) 15% (85) 28% (160) 24% (138) 34% (195) 578PID: Rep (no lean) 11% (71) 29% (190) 27% (177) 34% (224) 661PID/Gender: DemMen 24% (87) 39% (139) 19% (67) 18% (66) 359PID/Gender: DemWomen 19% (76) 38% (147) 18% (72) 25% (98) 393PID/Gender: Ind Men 17% (46) 32% (85) 24% (63) 27% (72) 267PID/Gender: Ind Women 12% (38) 24% (75) 24% (75) 39% (123) 311PID/Gender: Rep Men 13% (39) 32% (96) 28% (83) 28% (84) 301PID/Gender: Rep Women 9% (32) 26% (94) 26% (93) 39% (140) 360Ideo: Liberal (1-3) 23% (133) 41% (243) 18% (108) 18% (104) 587Ideo: Moderate (4) 15% (80) 30% (163) 24% (132) 30% (164) 539Ideo: Conservative (5-7) 13% (94) 29% (212) 26% (191) 33% (245) 742Educ: < College 13% (152) 30% (361) 25% (306) 32% (394) 1213Educ: Bachelors degree 21% (101) 34% (166) 19% (94) 26% (129) 489Educ: Post-grad 22% (65) 38% (110) 19% (53) 21% (60) 288Income: Under 50k 15% (152) 30% (296) 22% (220) 33% (323) 991Income: 50k-100k 16% (105) 32% (203) 24% (154) 28% (178) 640Income: 100k+ 17% (61) 38% (137) 22% (79) 23% (82) 359Ethnicity: White 16% (255) 31% (492) 24% (374) 29% (464) 1584Ethnicity: Hispanic 16% (31) 35% (69) 19% (36) 30% (60) 196
Continued on next page
Page 287
National Tracking Poll #210636, June, 2021
287
Table POL19_4
Table POL19_4: How much have you seen, read, or heard about the following?Dr. Anthony Fauci calling on China to release medical records of three people who worked at a lab in Wuhan, China and reportedly became seriouslyill in 2019 a month before COVID-19 cases were reported
Demographic A lot Some Not Much Nothing at all Total N
Registered Voters 16% (318) 32% (637) 23% (453) 29% (582) 1990Ethnicity: Black 18% (44) 35% (86) 17% (42) 29% (71) 243Ethnicity: Other 12% (19) 36% (58) 23% (38) 29% (48) 163All Christian 15% (141) 32% (311) 24% (231) 29% (281) 964All Non-Christian 38% (46) 23% (28) 15% (19) 23% (28) 121Atheist 18% (13) 36% (26) 19% (14) 26% (19) 73Agnostic/Nothing in particular 13% (63) 35% (172) 25% (123) 28% (137) 495Something Else 16% (55) 30% (99) 20% (66) 35% (117) 337Religious Non-Protestant/Catholic 36% (50) 22% (31) 17% (24) 25% (35) 140Evangelical 15% (82) 31% (168) 22% (122) 32% (176) 547Non-Evangelical 15% (106) 33% (236) 23% (167) 29% (212) 721Community: Urban 23% (121) 36% (189) 21% (109) 21% (110) 529Community: Suburban 15% (145) 32% (317) 24% (239) 30% (296) 998Community: Rural 11% (52) 28% (130) 23% (105) 38% (176) 464Employ: Private Sector 16% (102) 35% (219) 23% (141) 26% (161) 622Employ: Government 25% (32) 32% (41) 18% (23) 25% (33) 129Employ: Self-Employed 24% (38) 34% (53) 19% (30) 23% (36) 157Employ: Homemaker 12% (16) 21% (27) 27% (34) 39% (50) 127Employ: Retired 15% (87) 34% (197) 25% (146) 26% (152) 581Employ: Unemployed 9% (19) 32% (69) 20% (43) 39% (83) 215Employ: Other 15% (17) 17% (19) 24% (27) 44% (50) 113Military HH: Yes 18% (64) 32% (115) 25% (90) 26% (93) 361Military HH: No 16% (254) 32% (522) 22% (364) 30% (490) 1629RD/WT: Right Direction 22% (207) 35% (333) 20% (187) 23% (214) 941RD/WT: Wrong Track 11% (111) 29% (303) 25% (266) 35% (368) 1049Biden Job Approve 22% (223) 36% (375) 21% (214) 22% (225) 1037Biden Job Disapprove 10% (89) 29% (252) 26% (222) 34% (293) 857Biden Job Strongly Approve 27% (149) 39% (213) 15% (84) 19% (102) 548Biden Job Somewhat Approve 15% (74) 33% (161) 27% (130) 25% (123) 489Biden Job Somewhat Disapprove 9% (19) 40% (89) 22% (48) 30% (67) 223Biden Job Strongly Disapprove 11% (70) 26% (163) 28% (174) 36% (226) 634
Continued on next page
Page 288
288
Morning ConsultTable POL19_4
Table POL19_4: How much have you seen, read, or heard about the following?Dr. Anthony Fauci calling on China to release medical records of three people who worked at a lab in Wuhan, China and reportedly became seriouslyill in 2019 a month before COVID-19 cases were reported
Demographic A lot Some Not Much Nothing at all Total N
Registered Voters 16% (318) 32% (637) 23% (453) 29% (582) 1990Favorable of Biden 21% (224) 37% (386) 20% (206) 22% (233) 1048Unfavorable of Biden 10% (88) 28% (240) 27% (232) 35% (295) 855Very Favorable of Biden 27% (160) 39% (230) 16% (95) 18% (109) 593Somewhat Favorable of Biden 14% (64) 34% (156) 24% (111) 27% (124) 455Somewhat Unfavorable of Biden 10% (19) 32% (61) 24% (45) 34% (65) 190Very Unfavorable of Biden 10% (69) 27% (179) 28% (187) 35% (229) 664#1 Issue: Economy 15% (114) 32% (242) 24% (182) 30% (226) 763#1 Issue: Security 14% (49) 27% (94) 27% (94) 32% (112) 349#1 Issue: Health Care 21% (48) 34% (80) 20% (48) 25% (58) 233#1 Issue: Medicare / Social Security 16% (42) 35% (92) 22% (56) 27% (70) 261#1 Issue: Women’s Issues 19% (19) 36% (37) 16% (16) 30% (31) 103#1 Issue: Education 9% (8) 39% (33) 17% (15) 35% (30) 86#1 Issue: Energy 24% (21) 26% (22) 22% (19) 28% (24) 86#1 Issue: Other 16% (17) 34% (37) 21% (23) 29% (32) 1092020 Vote: Joe Biden 22% (202) 37% (334) 19% (173) 21% (188) 8972020 Vote: Donald Trump 11% (87) 28% (230) 27% (221) 34% (281) 8182020 Vote: Didn’t Vote 10% (24) 27% (64) 20% (47) 43% (104) 2392018 House Vote: Democrat 24% (163) 38% (261) 20% (135) 19% (127) 6872018 House Vote: Republican 10% (72) 29% (201) 26% (182) 34% (234) 6902018 House Vote: Someone else 19% (9) 18% (9) 22% (11) 40% (20) 502016 Vote: Hillary Clinton 23% (145) 37% (237) 20% (124) 20% (126) 6312016 Vote: Donald Trump 12% (92) 29% (222) 27% (205) 32% (249) 7682016 Vote: Other 14% (15) 35% (37) 25% (27) 26% (28) 1072016 Vote: Didn’t Vote 14% (66) 29% (141) 20% (97) 37% (180) 483Voted in 2014: Yes 18% (231) 34% (435) 22% (291) 26% (341) 1297Voted in 2014: No 13% (87) 29% (202) 23% (162) 35% (242) 6934-Region: Northeast 23% (80) 32% (111) 19% (66) 25% (87) 3444-Region: Midwest 13% (58) 35% (161) 25% (112) 27% (125) 4554-Region: South 14% (107) 31% (234) 24% (179) 31% (236) 7554-Region: West 17% (73) 30% (131) 22% (97) 31% (134) 435
Continued on next page
Page 289
National Tracking Poll #210636, June, 2021
289
Table POL19_4
Table POL19_4: How much have you seen, read, or heard about the following?Dr. Anthony Fauci calling on China to release medical records of three people who worked at a lab in Wuhan, China and reportedly became seriouslyill in 2019 a month before COVID-19 cases were reported
Demographic A lot Some Not Much Nothing at all Total N
Registered Voters 16% (318) 32% (637) 23% (453) 29% (582) 1990Party: Democrat/Leans Democrat 21% (189) 38% (339) 19% (165) 22% (194) 888Party: Republican/Leans Republican 11% (92) 28% (231) 27% (220) 33% (270) 814Note: Row proportions may total to larger than one-hundred percent due to rounding. For more information visit MorningConsultIntelligence.com.
Page 290
290
Morning ConsultTable POL19_5
Table POL19_5: How much have you seen, read, or heard about the following?The White House releasing President Joe Biden’s fiscal year 2022 budget, which calls for $6 trillion in spending
Demographic A lot Some Not Much Nothing at all Total N
Registered Voters 16% (311) 31% (627) 25% (494) 28% (558) 1990Gender: Male 19% (178) 36% (332) 24% (222) 21% (196) 927Gender: Female 13% (134) 28% (295) 26% (273) 34% (361) 1063Age: 18-34 18% (80) 27% (123) 23% (105) 32% (147) 456Age: 35-44 17% (50) 27% (80) 25% (76) 31% (94) 300Age: 45-64 13% (94) 32% (235) 25% (180) 30% (220) 730Age: 65+ 17% (87) 37% (188) 26% (133) 19% (96) 504GenZers: 1997-2012 17% (29) 18% (31) 21% (36) 43% (73) 169Millennials: 1981-1996 18% (85) 30% (142) 24% (113) 29% (140) 480GenXers: 1965-1980 15% (78) 30% (160) 25% (132) 29% (154) 525Baby Boomers: 1946-1964 14% (105) 36% (267) 26% (193) 24% (181) 746PID: Dem (no lean) 21% (158) 36% (270) 22% (162) 22% (162) 752PID: Ind (no lean) 14% (79) 26% (153) 28% (164) 31% (182) 578PID: Rep (no lean) 11% (74) 31% (204) 25% (168) 32% (214) 661PID/Gender: DemMen 27% (97) 38% (138) 17% (61) 17% (62) 359PID/Gender: DemWomen 15% (60) 34% (132) 26% (101) 25% (100) 393PID/Gender: Ind Men 14% (37) 33% (89) 31% (84) 21% (57) 267PID/Gender: Ind Women 14% (42) 21% (64) 26% (80) 40% (124) 311PID/Gender: Rep Men 14% (43) 35% (105) 25% (76) 25% (77) 301PID/Gender: Rep Women 9% (31) 28% (99) 26% (92) 38% (137) 360Ideo: Liberal (1-3) 22% (131) 37% (216) 22% (128) 19% (113) 587Ideo: Moderate (4) 13% (71) 30% (162) 27% (147) 29% (159) 539Ideo: Conservative (5-7) 13% (99) 31% (232) 27% (198) 29% (213) 742Educ: < College 13% (154) 28% (343) 26% (320) 33% (395) 1213Educ: Bachelors degree 19% (91) 37% (180) 21% (103) 24% (115) 489Educ: Post-grad 23% (65) 36% (104) 25% (71) 17% (48) 288Income: Under 50k 13% (133) 29% (290) 25% (252) 32% (316) 991Income: 50k-100k 16% (104) 34% (215) 24% (152) 26% (168) 640Income: 100k+ 21% (74) 34% (121) 25% (91) 20% (73) 359Ethnicity: White 16% (253) 32% (502) 25% (393) 28% (436) 1584Ethnicity: Hispanic 18% (35) 30% (58) 21% (42) 31% (61) 196Ethnicity: Black 18% (44) 29% (71) 21% (51) 32% (77) 243
Continued on next page
Page 291
National Tracking Poll #210636, June, 2021
291
Table POL19_5
Table POL19_5: How much have you seen, read, or heard about the following?The White House releasing President Joe Biden’s fiscal year 2022 budget, which calls for $6 trillion in spending
Demographic A lot Some Not Much Nothing at all Total N
Registered Voters 16% (311) 31% (627) 25% (494) 28% (558) 1990Ethnicity: Other 9% (14) 33% (53) 31% (51) 28% (45) 163All Christian 15% (148) 34% (332) 25% (236) 26% (247) 964All Non-Christian 29% (35) 30% (36) 20% (25) 21% (25) 121Atheist 15% (11) 30% (22) 31% (23) 24% (18) 73Agnostic/Nothing in particular 14% (70) 29% (141) 28% (138) 30% (146) 495Something Else 14% (47) 28% (95) 22% (73) 36% (121) 337Religious Non-Protestant/Catholic 27% (38) 30% (42) 20% (28) 23% (32) 140Evangelical 17% (93) 30% (165) 21% (113) 32% (176) 547Non-Evangelical 13% (97) 35% (253) 26% (188) 25% (182) 721Community: Urban 21% (109) 33% (173) 23% (122) 24% (125) 529Community: Suburban 15% (149) 31% (313) 26% (262) 27% (273) 998Community: Rural 11% (52) 30% (141) 24% (111) 34% (160) 464Employ: Private Sector 16% (102) 35% (218) 23% (145) 25% (156) 622Employ: Government 23% (30) 28% (36) 22% (28) 27% (34) 129Employ: Self-Employed 22% (35) 31% (48) 28% (44) 19% (30) 157Employ: Homemaker 15% (18) 20% (25) 24% (30) 42% (53) 127Employ: Retired 15% (88) 36% (207) 28% (161) 22% (125) 581Employ: Unemployed 10% (22) 27% (57) 25% (54) 38% (82) 215Employ: Other 9% (10) 20% (23) 20% (23) 51% (57) 113Military HH: Yes 15% (56) 35% (126) 25% (89) 25% (90) 361Military HH: No 16% (255) 31% (500) 25% (405) 29% (468) 1629RD/WT: Right Direction 19% (181) 35% (334) 23% (217) 22% (210) 941RD/WT: Wrong Track 12% (130) 28% (293) 26% (278) 33% (348) 1049Biden Job Approve 19% (198) 35% (358) 24% (252) 22% (229) 1037Biden Job Disapprove 13% (110) 30% (257) 26% (225) 31% (266) 857Biden Job Strongly Approve 27% (148) 35% (194) 19% (106) 18% (100) 548Biden Job Somewhat Approve 10% (50) 34% (164) 30% (146) 26% (129) 489Biden Job Somewhat Disapprove 9% (21) 29% (65) 29% (65) 33% (73) 223Biden Job Strongly Disapprove 14% (89) 30% (192) 25% (160) 30% (193) 634Favorable of Biden 19% (200) 34% (356) 25% (260) 22% (233) 1048Unfavorable of Biden 12% (104) 30% (256) 26% (226) 31% (268) 855
Continued on next page
Page 292
292
Morning ConsultTable POL19_5
Table POL19_5: How much have you seen, read, or heard about the following?The White House releasing President Joe Biden’s fiscal year 2022 budget, which calls for $6 trillion in spending
Demographic A lot Some Not Much Nothing at all Total N
Registered Voters 16% (311) 31% (627) 25% (494) 28% (558) 1990Very Favorable of Biden 26% (156) 36% (211) 20% (121) 18% (105) 593Somewhat Favorable of Biden 10% (44) 32% (144) 31% (139) 28% (128) 455Somewhat Unfavorable of Biden 7% (13) 31% (59) 27% (51) 36% (68) 190Very Unfavorable of Biden 14% (91) 30% (198) 26% (175) 30% (201) 664#1 Issue: Economy 15% (113) 30% (230) 26% (202) 28% (217) 763#1 Issue: Security 15% (54) 31% (110) 25% (88) 28% (98) 349#1 Issue: Health Care 21% (48) 33% (78) 21% (48) 25% (59) 233#1 Issue: Medicare / Social Security 10% (26) 37% (97) 23% (61) 29% (77) 261#1 Issue: Women’s Issues 22% (22) 26% (26) 23% (23) 30% (31) 103#1 Issue: Education 20% (17) 28% (24) 19% (16) 33% (28) 86#1 Issue: Energy 21% (18) 21% (18) 27% (23) 32% (27) 86#1 Issue: Other 12% (13) 40% (44) 30% (32) 19% (20) 1092020 Vote: Joe Biden 20% (183) 36% (321) 23% (209) 20% (183) 8972020 Vote: Donald Trump 13% (104) 30% (243) 26% (214) 32% (258) 8182020 Vote: Didn’t Vote 9% (22) 22% (54) 24% (57) 44% (106) 2392018 House Vote: Democrat 21% (143) 39% (271) 21% (146) 18% (126) 6872018 House Vote: Republican 13% (91) 32% (219) 27% (189) 27% (190) 6902018 House Vote: Someone else 7% (4) 23% (11) 35% (18) 35% (17) 502016 Vote: Hillary Clinton 21% (130) 39% (244) 22% (138) 19% (119) 6312016 Vote: Donald Trump 13% (102) 30% (234) 27% (206) 29% (226) 7682016 Vote: Other 11% (12) 34% (36) 34% (36) 21% (23) 1072016 Vote: Didn’t Vote 14% (66) 23% (112) 24% (115) 39% (190) 483Voted in 2014: Yes 17% (224) 36% (469) 24% (312) 23% (292) 1297Voted in 2014: No 13% (87) 23% (158) 26% (183) 38% (266) 6934-Region: Northeast 20% (68) 35% (120) 26% (89) 19% (67) 3444-Region: Midwest 14% (66) 30% (138) 25% (113) 30% (138) 4554-Region: South 15% (113) 33% (247) 22% (170) 30% (226) 7554-Region: West 15% (64) 28% (122) 28% (123) 29% (126) 435Party: Democrat/Leans Democrat 20% (178) 35% (311) 23% (205) 22% (194) 888Party: Republican/Leans Republican 12% (97) 31% (249) 26% (215) 31% (253) 814Note: Row proportions may total to larger than one-hundred percent due to rounding. For more information visit MorningConsultIntelligence.com.
Page 293
National Tracking Poll #210636, June, 2021
293
Table POL19_6
Table POL19_6: How much have you seen, read, or heard about the following?Naomi Osaka withdrawing from the French Open amid a dispute about whether she should be required to speak with members of the media followingeach match
Demographic A lot Some Not Much Nothing at all Total N
Registered Voters 22% (440) 28% (560) 18% (349) 32% (640) 1990Gender: Male 27% (254) 32% (298) 18% (166) 23% (209) 927Gender: Female 17% (186) 25% (263) 17% (184) 41% (431) 1063Age: 18-34 23% (105) 21% (97) 19% (86) 37% (169) 456Age: 35-44 21% (63) 24% (73) 16% (47) 39% (117) 300Age: 45-64 19% (138) 31% (223) 16% (120) 34% (250) 730Age: 65+ 27% (135) 33% (167) 19% (98) 21% (104) 504GenZers: 1997-2012 18% (30) 13% (22) 24% (41) 45% (77) 169Millennials: 1981-1996 24% (113) 25% (120) 15% (73) 36% (173) 480GenXers: 1965-1980 22% (113) 29% (154) 16% (82) 34% (177) 525Baby Boomers: 1946-1964 22% (168) 33% (242) 18% (132) 27% (204) 746PID: Dem (no lean) 32% (242) 31% (236) 13% (95) 24% (179) 752PID: Ind (no lean) 18% (104) 28% (161) 19% (109) 35% (203) 578PID: Rep (no lean) 14% (94) 25% (163) 22% (146) 39% (258) 661PID/Gender: DemMen 39% (139) 33% (118) 12% (42) 17% (60) 359PID/Gender: DemWomen 26% (103) 30% (118) 13% (53) 30% (119) 393PID/Gender: Ind Men 22% (59) 34% (91) 18% (49) 25% (67) 267PID/Gender: Ind Women 14% (45) 22% (70) 19% (60) 44% (136) 311PID/Gender: Rep Men 19% (56) 29% (88) 25% (75) 27% (82) 301PID/Gender: Rep Women 11% (38) 21% (75) 20% (71) 49% (176) 360Ideo: Liberal (1-3) 34% (202) 32% (188) 13% (78) 20% (120) 587Ideo: Moderate (4) 20% (110) 29% (157) 21% (113) 30% (160) 539Ideo: Conservative (5-7) 16% (122) 28% (204) 19% (143) 37% (273) 742Educ: < College 17% (207) 25% (308) 20% (239) 38% (458) 1213Educ: Bachelors degree 28% (137) 32% (157) 13% (65) 26% (129) 489Educ: Post-grad 33% (96) 33% (95) 16% (45) 18% (53) 288Income: Under 50k 19% (188) 25% (249) 19% (189) 37% (365) 991Income: 50k-100k 22% (143) 30% (189) 19% (119) 30% (189) 640Income: 100k+ 31% (110) 34% (122) 12% (41) 24% (86) 359Ethnicity: White 20% (322) 28% (444) 19% (295) 33% (523) 1584Ethnicity: Hispanic 27% (52) 26% (50) 19% (37) 29% (56) 196
Continued on next page
Page 294
294
Morning ConsultTable POL19_6
Table POL19_6: How much have you seen, read, or heard about the following?Naomi Osaka withdrawing from the French Open amid a dispute about whether she should be required to speak with members of the media followingeach match
Demographic A lot Some Not Much Nothing at all Total N
Registered Voters 22% (440) 28% (560) 18% (349) 32% (640) 1990Ethnicity: Black 34% (83) 26% (64) 13% (31) 27% (64) 243Ethnicity: Other 22% (35) 32% (52) 14% (23) 32% (53) 163All Christian 21% (199) 31% (303) 19% (181) 29% (281) 964All Non-Christian 38% (46) 30% (37) 14% (17) 18% (22) 121Atheist 30% (22) 27% (20) 13% (10) 29% (22) 73Agnostic/Nothing in particular 23% (116) 28% (137) 15% (72) 34% (169) 495Something Else 17% (57) 19% (64) 21% (70) 43% (146) 337Religious Non-Protestant/Catholic 34% (47) 29% (41) 13% (18) 24% (34) 140Evangelical 18% (96) 26% (144) 17% (91) 40% (216) 547Non-Evangelical 21% (155) 30% (214) 22% (156) 27% (196) 721Community: Urban 29% (153) 31% (162) 15% (77) 26% (138) 529Community: Suburban 22% (216) 28% (284) 17% (174) 32% (324) 998Community: Rural 15% (71) 25% (115) 21% (99) 39% (179) 464Employ: Private Sector 23% (142) 27% (166) 16% (101) 34% (212) 622Employ: Government 28% (36) 28% (37) 15% (19) 29% (37) 129Employ: Self-Employed 19% (30) 31% (49) 19% (30) 31% (48) 157Employ: Homemaker 17% (22) 17% (22) 22% (27) 44% (56) 127Employ: Retired 25% (143) 33% (191) 20% (113) 23% (133) 581Employ: Unemployed 20% (43) 28% (60) 14% (30) 38% (82) 215Employ: Other 15% (17) 27% (31) 13% (14) 45% (50) 113Military HH: Yes 26% (94) 30% (109) 18% (64) 26% (94) 361Military HH: No 21% (346) 28% (451) 18% (285) 34% (546) 1629RD/WT: Right Direction 28% (267) 32% (306) 15% (144) 24% (225) 941RD/WT: Wrong Track 16% (173) 24% (255) 20% (206) 40% (415) 1049Biden Job Approve 30% (312) 32% (332) 16% (163) 22% (230) 1037Biden Job Disapprove 15% (125) 25% (213) 20% (170) 41% (349) 857Biden Job Strongly Approve 37% (201) 32% (178) 12% (67) 19% (101) 548Biden Job Somewhat Approve 23% (111) 31% (154) 20% (96) 26% (129) 489Biden Job Somewhat Disapprove 16% (35) 29% (64) 21% (48) 34% (76) 223Biden Job Strongly Disapprove 14% (90) 24% (149) 19% (122) 43% (273) 634
Continued on next page
Page 295
National Tracking Poll #210636, June, 2021
295
Table POL19_6
Table POL19_6: How much have you seen, read, or heard about the following?Naomi Osaka withdrawing from the French Open amid a dispute about whether she should be required to speak with members of the media followingeach match
Demographic A lot Some Not Much Nothing at all Total N
Registered Voters 22% (440) 28% (560) 18% (349) 32% (640) 1990Favorable of Biden 30% (313) 32% (332) 16% (170) 22% (234) 1048Unfavorable of Biden 14% (123) 25% (211) 19% (166) 41% (355) 855Very Favorable of Biden 36% (212) 30% (180) 13% (79) 20% (121) 593Somewhat Favorable of Biden 22% (100) 33% (151) 20% (91) 25% (113) 455Somewhat Unfavorable of Biden 16% (30) 27% (52) 19% (37) 38% (72) 190Very Unfavorable of Biden 14% (93) 24% (160) 19% (129) 43% (283) 664#1 Issue: Economy 20% (151) 29% (223) 18% (135) 33% (254) 763#1 Issue: Security 20% (70) 28% (96) 17% (59) 35% (123) 349#1 Issue: Health Care 30% (70) 27% (64) 17% (40) 25% (59) 233#1 Issue: Medicare / Social Security 22% (57) 34% (89) 15% (39) 29% (76) 261#1 Issue: Women’s Issues 28% (28) 16% (17) 25% (26) 31% (32) 103#1 Issue: Education 16% (14) 26% (22) 19% (16) 39% (34) 86#1 Issue: Energy 27% (23) 17% (15) 20% (17) 36% (31) 86#1 Issue: Other 25% (27) 31% (34) 15% (17) 29% (32) 1092020 Vote: Joe Biden 31% (279) 33% (298) 15% (131) 21% (189) 8972020 Vote: Donald Trump 15% (126) 26% (211) 20% (165) 39% (316) 8182020 Vote: Didn’t Vote 13% (32) 17% (42) 20% (47) 50% (119) 2392018 House Vote: Democrat 33% (224) 34% (236) 13% (92) 20% (135) 6872018 House Vote: Republican 17% (117) 27% (188) 21% (142) 35% (244) 6902018 House Vote: Someone else 19% (9) 15% (8) 18% (9) 47% (24) 502016 Vote: Hillary Clinton 31% (193) 36% (226) 14% (91) 19% (121) 6312016 Vote: Donald Trump 18% (137) 27% (205) 20% (151) 36% (274) 7682016 Vote: Other 22% (24) 31% (33) 12% (13) 35% (37) 1072016 Vote: Didn’t Vote 18% (86) 20% (96) 19% (94) 43% (208) 483Voted in 2014: Yes 25% (322) 31% (400) 16% (212) 28% (364) 1297Voted in 2014: No 17% (118) 23% (160) 20% (138) 40% (276) 6934-Region: Northeast 30% (103) 31% (108) 14% (48) 25% (86) 3444-Region: Midwest 18% (81) 30% (136) 17% (79) 35% (159) 4554-Region: South 22% (168) 26% (195) 19% (145) 33% (248) 7554-Region: West 20% (89) 28% (121) 18% (78) 34% (147) 435
Continued on next page
Page 296
296
Morning ConsultTable POL19_6
Table POL19_6: How much have you seen, read, or heard about the following?Naomi Osaka withdrawing from the French Open amid a dispute about whether she should be required to speak with members of the media followingeach match
Demographic A lot Some Not Much Nothing at all Total N
Registered Voters 22% (440) 28% (560) 18% (349) 32% (640) 1990Party: Democrat/Leans Democrat 31% (279) 31% (280) 13% (117) 24% (213) 888Party: Republican/Leans Republican 14% (117) 25% (206) 21% (172) 39% (319) 814Note: Row proportions may total to larger than one-hundred percent due to rounding. For more information visit MorningConsultIntelligence.com.
Page 297
National Tracking Poll #210636, June, 2021
297
Table POL19_7
Table POL19_7: How much have you seen, read, or heard about the following?Senate Republicans blocking a bipartisan bill that would form an independent commission to probe the Jan. 6 Capitol riot
Demographic A lot Some Not Much Nothing at all Total N
Registered Voters 27% (541) 32% (646) 18% (358) 22% (446) 1990Gender: Male 32% (296) 34% (318) 18% (165) 16% (148) 927Gender: Female 23% (244) 31% (327) 18% (193) 28% (298) 1063Age: 18-34 21% (95) 27% (125) 18% (81) 34% (155) 456Age: 35-44 21% (64) 37% (110) 16% (49) 26% (77) 300Age: 45-64 26% (189) 33% (239) 20% (143) 22% (159) 730Age: 65+ 38% (193) 34% (172) 17% (84) 11% (55) 504GenZers: 1997-2012 14% (24) 23% (39) 17% (28) 46% (77) 169Millennials: 1981-1996 23% (113) 31% (149) 18% (87) 27% (131) 480GenXers: 1965-1980 25% (129) 31% (165) 19% (101) 25% (130) 525Baby Boomers: 1946-1964 34% (256) 35% (260) 17% (129) 13% (100) 746PID: Dem (no lean) 38% (286) 32% (241) 12% (92) 18% (132) 752PID: Ind (no lean) 23% (136) 31% (182) 19% (110) 26% (151) 578PID: Rep (no lean) 18% (119) 34% (222) 24% (156) 25% (164) 661PID/Gender: DemMen 43% (153) 31% (111) 12% (45) 14% (51) 359PID/Gender: DemWomen 34% (133) 33% (131) 12% (48) 21% (81) 393PID/Gender: Ind Men 26% (70) 39% (105) 18% (47) 17% (45) 267PID/Gender: Ind Women 21% (66) 25% (77) 20% (62) 34% (105) 311PID/Gender: Rep Men 25% (74) 34% (103) 24% (73) 17% (51) 301PID/Gender: Rep Women 12% (45) 33% (119) 23% (83) 31% (113) 360Ideo: Liberal (1-3) 43% (253) 32% (187) 12% (69) 13% (78) 587Ideo: Moderate (4) 25% (136) 30% (159) 19% (104) 26% (140) 539Ideo: Conservative (5-7) 19% (142) 38% (285) 23% (170) 20% (145) 742Educ: < College 21% (255) 31% (372) 21% (253) 27% (333) 1213Educ: Bachelors degree 34% (167) 36% (175) 13% (63) 17% (84) 489Educ: Post-grad 41% (119) 34% (99) 14% (42) 10% (29) 288Income: Under 50k 23% (230) 31% (304) 20% (202) 26% (255) 991Income: 50k-100k 29% (184) 35% (221) 16% (103) 21% (131) 640Income: 100k+ 35% (126) 33% (120) 15% (54) 16% (59) 359Ethnicity: White 28% (441) 33% (526) 18% (280) 21% (338) 1584Ethnicity: Hispanic 25% (49) 30% (59) 13% (26) 32% (63) 196Ethnicity: Black 25% (62) 29% (70) 17% (40) 29% (71) 243
Continued on next page
Page 298
298
Morning ConsultTable POL19_7
Table POL19_7: How much have you seen, read, or heard about the following?Senate Republicans blocking a bipartisan bill that would form an independent commission to probe the Jan. 6 Capitol riot
Demographic A lot Some Not Much Nothing at all Total N
Registered Voters 27% (541) 32% (646) 18% (358) 22% (446) 1990Ethnicity: Other 23% (38) 30% (49) 23% (38) 23% (38) 163All Christian 27% (265) 37% (356) 17% (166) 18% (178) 964All Non-Christian 46% (56) 25% (30) 11% (14) 17% (21) 121Atheist 37% (27) 24% (18) 25% (19) 13% (9) 73Agnostic/Nothing in particular 24% (121) 31% (152) 19% (94) 26% (128) 495Something Else 21% (72) 27% (90) 19% (65) 33% (110) 337Religious Non-Protestant/Catholic 43% (61) 24% (34) 13% (18) 20% (28) 140Evangelical 22% (119) 35% (190) 18% (99) 25% (140) 547Non-Evangelical 29% (208) 34% (248) 18% (128) 19% (137) 721Community: Urban 32% (168) 33% (175) 16% (84) 19% (102) 529Community: Suburban 28% (280) 33% (329) 18% (175) 21% (213) 998Community: Rural 20% (92) 31% (142) 21% (99) 28% (131) 464Employ: Private Sector 25% (155) 34% (211) 21% (128) 21% (128) 622Employ: Government 31% (40) 33% (42) 14% (17) 23% (29) 129Employ: Self-Employed 36% (56) 32% (51) 12% (19) 20% (31) 157Employ: Homemaker 20% (25) 23% (29) 22% (28) 35% (44) 127Employ: Retired 34% (196) 37% (216) 17% (101) 12% (68) 581Employ: Unemployed 21% (45) 30% (64) 14% (30) 35% (75) 215Employ: Other 14% (16) 19% (21) 21% (24) 46% (52) 113Military HH: Yes 31% (112) 33% (118) 20% (74) 16% (58) 361Military HH: No 26% (428) 32% (528) 17% (284) 24% (388) 1629RD/WT: Right Direction 37% (344) 31% (295) 14% (130) 18% (172) 941RD/WT: Wrong Track 19% (197) 33% (351) 22% (228) 26% (274) 1049Biden Job Approve 38% (396) 30% (311) 14% (144) 18% (187) 1037Biden Job Disapprove 16% (141) 37% (316) 23% (199) 23% (201) 857Biden Job Strongly Approve 47% (256) 28% (155) 10% (54) 15% (83) 548Biden Job Somewhat Approve 29% (140) 32% (156) 18% (90) 21% (104) 489Biden Job Somewhat Disapprove 12% (28) 34% (75) 28% (62) 26% (58) 223Biden Job Strongly Disapprove 18% (113) 38% (241) 22% (137) 23% (143) 634Favorable of Biden 38% (398) 30% (319) 14% (144) 18% (188) 1048Unfavorable of Biden 16% (135) 36% (311) 23% (199) 25% (209) 855
Continued on next page
Page 299
National Tracking Poll #210636, June, 2021
299
Table POL19_7
Table POL19_7: How much have you seen, read, or heard about the following?Senate Republicans blocking a bipartisan bill that would form an independent commission to probe the Jan. 6 Capitol riot
Demographic A lot Some Not Much Nothing at all Total N
Registered Voters 27% (541) 32% (646) 18% (358) 22% (446) 1990Very Favorable of Biden 46% (276) 29% (173) 9% (54) 15% (90) 593Somewhat Favorable of Biden 27% (122) 32% (145) 20% (90) 22% (98) 455Somewhat Unfavorable of Biden 13% (25) 26% (50) 30% (58) 30% (58) 190Very Unfavorable of Biden 17% (110) 39% (261) 21% (142) 23% (152) 664#1 Issue: Economy 24% (181) 31% (233) 19% (147) 27% (202) 763#1 Issue: Security 22% (76) 38% (133) 20% (71) 20% (69) 349#1 Issue: Health Care 34% (79) 34% (80) 16% (38) 15% (36) 233#1 Issue: Medicare / Social Security 34% (88) 34% (89) 15% (39) 17% (45) 261#1 Issue: Women’s Issues 28% (29) 31% (32) 10% (10) 31% (32) 103#1 Issue: Education 23% (19) 36% (31) 11% (9) 30% (26) 86#1 Issue: Energy 31% (26) 22% (19) 20% (17) 27% (23) 86#1 Issue: Other 39% (42) 26% (28) 24% (26) 11% (12) 1092020 Vote: Joe Biden 42% (376) 31% (281) 12% (108) 15% (133) 8972020 Vote: Donald Trump 17% (136) 36% (295) 23% (187) 24% (200) 8182020 Vote: Didn’t Vote 9% (21) 26% (61) 22% (53) 43% (103) 2392018 House Vote: Democrat 44% (300) 32% (220) 12% (83) 12% (84) 6872018 House Vote: Republican 20% (140) 37% (254) 23% (158) 20% (138) 6902018 House Vote: Someone else 19% (9) 14% (7) 29% (14) 39% (19) 502016 Vote: Hillary Clinton 44% (275) 33% (207) 12% (76) 12% (73) 6312016 Vote: Donald Trump 20% (153) 37% (288) 22% (167) 21% (160) 7682016 Vote: Other 33% (35) 29% (31) 15% (16) 23% (25) 1072016 Vote: Didn’t Vote 16% (77) 25% (120) 20% (98) 39% (188) 483Voted in 2014: Yes 32% (421) 34% (447) 17% (221) 16% (209) 1297Voted in 2014: No 17% (120) 29% (198) 20% (137) 34% (238) 6934-Region: Northeast 33% (115) 34% (116) 14% (49) 18% (63) 3444-Region: Midwest 28% (127) 31% (141) 20% (92) 21% (95) 4554-Region: South 23% (171) 35% (265) 18% (134) 25% (186) 7554-Region: West 29% (128) 28% (123) 19% (82) 23% (102) 435Party: Democrat/Leans Democrat 39% (348) 32% (282) 12% (110) 17% (148) 888Party: Republican/Leans Republican 18% (145) 34% (279) 23% (191) 24% (198) 814Note: Row proportions may total to larger than one-hundred percent due to rounding. For more information visit MorningConsultIntelligence.com.
Page 300
300
Morning ConsultTable POL19_8
Table POL19_8: How much have you seen, read, or heard about the following?Facebook announcing that it plans to suspend former President Donald Trump from its platform for the next two years, at least
Demographic A lot Some Not Much Nothing at all Total N
Registered Voters 34% (679) 37% (744) 12% (246) 16% (321) 1990Gender: Male 36% (333) 40% (370) 12% (109) 12% (115) 927Gender: Female 33% (346) 35% (374) 13% (137) 19% (206) 1063Age: 18-34 28% (127) 33% (150) 14% (66) 25% (112) 456Age: 35-44 31% (94) 37% (111) 15% (46) 16% (49) 300Age: 45-64 33% (243) 40% (291) 12% (87) 15% (109) 730Age: 65+ 42% (214) 38% (193) 9% (46) 10% (51) 504GenZers: 1997-2012 22% (37) 33% (56) 17% (28) 28% (48) 169Millennials: 1981-1996 31% (148) 35% (166) 13% (62) 22% (103) 480GenXers: 1965-1980 34% (177) 36% (188) 15% (79) 15% (81) 525Baby Boomers: 1946-1964 38% (286) 41% (307) 9% (66) 12% (86) 746PID: Dem (no lean) 45% (336) 35% (260) 10% (72) 11% (84) 752PID: Ind (no lean) 27% (158) 40% (230) 13% (75) 20% (115) 578PID: Rep (no lean) 28% (185) 39% (255) 15% (99) 19% (122) 661PID/Gender: DemMen 49% (175) 36% (127) 7% (25) 9% (32) 359PID/Gender: DemWomen 41% (161) 34% (132) 12% (47) 13% (52) 393PID/Gender: Ind Men 29% (78) 42% (113) 15% (39) 14% (36) 267PID/Gender: Ind Women 26% (80) 38% (117) 11% (36) 25% (78) 311PID/Gender: Rep Men 27% (80) 43% (130) 15% (45) 16% (47) 301PID/Gender: Rep Women 29% (105) 35% (125) 15% (54) 21% (76) 360Ideo: Liberal (1-3) 47% (277) 36% (210) 9% (51) 8% (48) 587Ideo: Moderate (4) 30% (159) 39% (212) 14% (77) 17% (91) 539Ideo: Conservative (5-7) 30% (225) 40% (298) 13% (100) 16% (119) 742Educ: < College 29% (347) 38% (458) 14% (172) 19% (236) 1213Educ: Bachelors degree 42% (203) 36% (174) 9% (46) 13% (66) 489Educ: Post-grad 44% (128) 39% (112) 10% (28) 7% (20) 288Income: Under 50k 30% (302) 37% (367) 14% (142) 18% (180) 991Income: 50k-100k 35% (226) 37% (234) 12% (75) 16% (105) 640Income: 100k+ 42% (151) 40% (143) 8% (28) 10% (36) 359Ethnicity: White 34% (542) 39% (611) 12% (187) 15% (245) 1584Ethnicity: Hispanic 30% (58) 35% (68) 16% (31) 20% (39) 196Ethnicity: Black 39% (95) 28% (69) 14% (33) 19% (46) 243
Continued on next page
Page 301
National Tracking Poll #210636, June, 2021
301
Table POL19_8
Table POL19_8: How much have you seen, read, or heard about the following?Facebook announcing that it plans to suspend former President Donald Trump from its platform for the next two years, at least
Demographic A lot Some Not Much Nothing at all Total N
Registered Voters 34% (679) 37% (744) 12% (246) 16% (321) 1990Ethnicity: Other 26% (42) 40% (65) 16% (26) 19% (30) 163All Christian 35% (336) 40% (386) 11% (108) 14% (134) 964All Non-Christian 53% (65) 32% (39) 6% (7) 8% (10) 121Atheist 35% (26) 39% (29) 17% (12) 9% (7) 73Agnostic/Nothing in particular 30% (146) 38% (189) 14% (69) 18% (91) 495Something Else 31% (106) 30% (102) 15% (49) 24% (79) 337Religious Non-Protestant/Catholic 49% (68) 34% (48) 6% (8) 12% (16) 140Evangelical 36% (198) 34% (187) 14% (76) 16% (87) 547Non-Evangelical 33% (235) 40% (290) 11% (78) 16% (118) 721Community: Urban 38% (203) 37% (193) 11% (56) 14% (76) 529Community: Suburban 34% (337) 38% (383) 12% (119) 16% (159) 998Community: Rural 30% (139) 36% (168) 15% (70) 19% (86) 464Employ: Private Sector 31% (193) 39% (244) 15% (92) 15% (92) 622Employ: Government 36% (47) 37% (47) 10% (13) 17% (22) 129Employ: Self-Employed 38% (59) 35% (55) 13% (20) 14% (23) 157Employ: Homemaker 35% (45) 34% (43) 10% (13) 21% (26) 127Employ: Retired 41% (239) 39% (227) 9% (52) 11% (63) 581Employ: Unemployed 23% (50) 38% (82) 14% (31) 24% (52) 215Employ: Other 30% (34) 29% (33) 15% (17) 26% (30) 113Military HH: Yes 37% (135) 38% (139) 12% (43) 12% (44) 361Military HH: No 33% (543) 37% (606) 12% (203) 17% (277) 1629RD/WT: Right Direction 41% (383) 35% (332) 10% (97) 14% (129) 941RD/WT: Wrong Track 28% (295) 39% (412) 14% (149) 18% (192) 1049Biden Job Approve 42% (431) 36% (374) 11% (112) 12% (121) 1037Biden Job Disapprove 29% (245) 40% (341) 14% (123) 17% (147) 857Biden Job Strongly Approve 51% (280) 34% (187) 6% (34) 9% (48) 548Biden Job Somewhat Approve 31% (151) 38% (187) 16% (78) 15% (73) 489Biden Job Somewhat Disapprove 23% (52) 48% (107) 16% (35) 13% (29) 223Biden Job Strongly Disapprove 30% (193) 37% (234) 14% (88) 19% (118) 634Favorable of Biden 41% (431) 37% (386) 10% (109) 12% (123) 1048Unfavorable of Biden 28% (240) 39% (335) 14% (124) 18% (156) 855
Continued on next page
Page 302
302
Morning ConsultTable POL19_8
Table POL19_8: How much have you seen, read, or heard about the following?Facebook announcing that it plans to suspend former President Donald Trump from its platform for the next two years, at least
Demographic A lot Some Not Much Nothing at all Total N
Registered Voters 34% (679) 37% (744) 12% (246) 16% (321) 1990Very Favorable of Biden 51% (304) 33% (197) 7% (39) 9% (54) 593Somewhat Favorable of Biden 28% (127) 42% (189) 15% (70) 15% (69) 455Somewhat Unfavorable of Biden 22% (42) 44% (84) 14% (27) 19% (37) 190Very Unfavorable of Biden 30% (198) 38% (251) 15% (96) 18% (119) 664#1 Issue: Economy 32% (243) 38% (291) 13% (99) 17% (131) 763#1 Issue: Security 34% (117) 40% (139) 11% (39) 15% (54) 349#1 Issue: Health Care 41% (96) 37% (87) 13% (29) 9% (21) 233#1 Issue: Medicare / Social Security 37% (97) 36% (93) 9% (24) 18% (46) 261#1 Issue: Women’s Issues 27% (28) 37% (38) 13% (13) 23% (23) 103#1 Issue: Education 34% (29) 31% (26) 19% (17) 16% (13) 86#1 Issue: Energy 37% (32) 32% (28) 12% (10) 19% (16) 86#1 Issue: Other 34% (37) 38% (41) 13% (14) 16% (17) 1092020 Vote: Joe Biden 45% (401) 36% (327) 9% (79) 10% (90) 8972020 Vote: Donald Trump 28% (230) 39% (323) 14% (119) 18% (147) 8182020 Vote: Didn’t Vote 17% (40) 33% (79) 18% (42) 33% (78) 2392018 House Vote: Democrat 47% (324) 37% (254) 7% (48) 9% (62) 6872018 House Vote: Republican 30% (210) 40% (273) 14% (100) 15% (107) 6902018 House Vote: Someone else 25% (12) 20% (10) 21% (11) 34% (17) 502016 Vote: Hillary Clinton 47% (299) 37% (235) 7% (44) 8% (53) 6312016 Vote: Donald Trump 30% (233) 40% (304) 14% (106) 16% (124) 7682016 Vote: Other 28% (30) 39% (41) 16% (18) 17% (18) 1072016 Vote: Didn’t Vote 24% (117) 34% (164) 16% (78) 26% (125) 483Voted in 2014: Yes 39% (507) 38% (491) 10% (136) 13% (163) 1297Voted in 2014: No 25% (172) 37% (254) 16% (109) 23% (158) 6934-Region: Northeast 38% (130) 40% (136) 11% (38) 12% (40) 3444-Region: Midwest 35% (159) 39% (177) 13% (60) 13% (60) 4554-Region: South 33% (252) 36% (272) 13% (97) 18% (134) 7554-Region: West 32% (137) 37% (159) 12% (51) 20% (88) 435Party: Democrat/Leans Democrat 43% (384) 36% (321) 10% (86) 11% (97) 888Party: Republican/Leans Republican 27% (221) 40% (324) 15% (120) 18% (148) 814Note: Row proportions may total to larger than one-hundred percent due to rounding. For more information visit MorningConsultIntelligence.com.
Page 303
National Tracking Poll #210636, June, 2021
303
Table POL20
Table POL20: As you may know, Facebook announced that it plans to suspend former President Donald Trump from its platform for the next twoyears, at least. Do you support or oppose this suspension?
DemographicStronglysupport
Somewhatsupport
Somewhatoppose
Stronglyoppose
Don’t know /No opinion Total N
Registered Voters 41% (817) 10% (198) 8% (150) 32% (646) 9% (179) 1990Gender: Male 42% (386) 11% (99) 7% (65) 33% (304) 8% (73) 927Gender: Female 41% (432) 9% (98) 8% (84) 32% (342) 10% (106) 1063Age: 18-34 39% (176) 17% (78) 7% (33) 20% (91) 17% (77) 456Age: 35-44 41% (123) 9% (26) 8% (25) 30% (89) 12% (37) 300Age: 45-64 36% (265) 8% (59) 8% (57) 41% (299) 7% (50) 730Age: 65+ 50% (253) 7% (35) 7% (34) 33% (167) 3% (15) 504GenZers: 1997-2012 35% (60) 22% (38) 7% (11) 16% (27) 20% (33) 169Millennials: 1981-1996 40% (190) 12% (59) 8% (40) 26% (125) 14% (66) 480GenXers: 1965-1980 39% (205) 8% (44) 7% (38) 36% (188) 10% (50) 525Baby Boomers: 1946-1964 44% (331) 7% (50) 8% (58) 37% (279) 4% (29) 746PID: Dem (no lean) 72% (544) 14% (103) 4% (27) 4% (34) 6% (43) 752PID: Ind (no lean) 36% (206) 10% (58) 10% (57) 30% (171) 15% (85) 578PID: Rep (no lean) 10% (68) 5% (36) 10% (65) 67% (442) 8% (50) 661PID/Gender: DemMen 71% (256) 13% (48) 5% (17) 6% (22) 5% (16) 359PID/Gender: DemWomen 73% (288) 14% (55) 3% (11) 3% (12) 7% (27) 393PID/Gender: Ind Men 34% (90) 12% (31) 7% (19) 34% (92) 13% (34) 267PID/Gender: Ind Women 37% (115) 9% (27) 12% (38) 25% (79) 16% (51) 311PID/Gender: Rep Men 13% (40) 7% (20) 10% (30) 63% (190) 7% (22) 301PID/Gender: Rep Women 8% (28) 5% (16) 10% (35) 70% (252) 8% (28) 360Ideo: Liberal (1-3) 72% (420) 12% (72) 5% (28) 6% (35) 5% (31) 587Ideo: Moderate (4) 49% (266) 13% (68) 9% (47) 20% (106) 10% (52) 539Ideo: Conservative (5-7) 14% (102) 7% (51) 9% (69) 65% (481) 5% (40) 742Educ: < College 37% (447) 9% (106) 8% (98) 35% (423) 11% (139) 1213Educ: Bachelors degree 47% (228) 11% (55) 7% (34) 29% (143) 6% (29) 489Educ: Post-grad 49% (142) 13% (37) 6% (18) 28% (80) 4% (12) 288Income: Under 50k 42% (415) 10% (96) 6% (64) 31% (308) 11% (109) 991Income: 50k-100k 39% (248) 11% (70) 9% (57) 33% (213) 8% (53) 640Income: 100k+ 43% (154) 9% (32) 8% (29) 35% (125) 5% (18) 359Ethnicity: White 38% (609) 9% (140) 7% (118) 37% (593) 8% (124) 1584Ethnicity: Hispanic 43% (85) 14% (28) 9% (18) 16% (32) 17% (33) 196
Continued on next page
Page 304
304
Morning ConsultTable POL20
Table POL20: As you may know, Facebook announced that it plans to suspend former President Donald Trump from its platform for the next twoyears, at least. Do you support or oppose this suspension?
DemographicStronglysupport
Somewhatsupport
Somewhatoppose
Stronglyoppose
Don’t know /No opinion Total N
Registered Voters 41% (817) 10% (198) 8% (150) 32% (646) 9% (179) 1990Ethnicity: Black 56% (136) 12% (29) 8% (19) 9% (22) 15% (36) 243Ethnicity: Other 44% (72) 17% (28) 8% (13) 19% (30) 12% (20) 163All Christian 36% (349) 10% (100) 8% (77) 39% (374) 7% (63) 964All Non-Christian 61% (74) 14% (16) 3% (4) 15% (19) 6% (8) 121Atheist 59% (43) 7% (5) 4% (3) 23% (17) 7% (5) 73Agnostic/Nothing in particular 47% (231) 10% (52) 8% (39) 23% (116) 12% (57) 495Something Else 36% (120) 7% (24) 8% (26) 36% (120) 14% (46) 337Religious Non-Protestant/Catholic 55% (77) 13% (18) 4% (6) 19% (27) 9% (13) 140Evangelical 30% (164) 8% (43) 7% (38) 49% (269) 6% (32) 547Non-Evangelical 41% (297) 10% (76) 9% (63) 30% (214) 10% (71) 721Community: Urban 53% (278) 13% (67) 6% (32) 21% (111) 8% (41) 529Community: Suburban 40% (398) 10% (100) 7% (73) 34% (337) 9% (89) 998Community: Rural 31% (142) 7% (31) 9% (44) 43% (198) 10% (49) 464Employ: Private Sector 39% (243) 12% (75) 9% (56) 32% (199) 8% (49) 622Employ: Government 44% (56) 10% (12) 8% (10) 29% (38) 10% (13) 129Employ: Self-Employed 41% (65) 10% (16) 5% (9) 36% (56) 8% (12) 157Employ: Homemaker 26% (32) 6% (8) 9% (11) 42% (53) 17% (22) 127Employ: Retired 47% (272) 6% (36) 7% (38) 37% (214) 4% (21) 581Employ: Unemployed 41% (88) 14% (30) 7% (15) 23% (49) 15% (33) 215Employ: Other 39% (44) 10% (11) 6% (7) 26% (29) 20% (22) 113Military HH: Yes 35% (128) 10% (36) 7% (26) 41% (149) 6% (23) 361Military HH: No 42% (690) 10% (161) 8% (124) 31% (497) 10% (156) 1629RD/WT: Right Direction 69% (651) 12% (110) 4% (40) 6% (58) 9% (83) 941RD/WT: Wrong Track 16% (167) 8% (88) 10% (110) 56% (588) 9% (97) 1049Biden Job Approve 72% (745) 13% (131) 4% (41) 5% (51) 7% (69) 1037Biden Job Disapprove 7% (58) 6% (55) 12% (101) 68% (582) 7% (62) 857Biden Job Strongly Approve 86% (471) 6% (33) 1% (8) 3% (17) 4% (19) 548Biden Job Somewhat Approve 56% (273) 20% (98) 7% (34) 7% (34) 10% (50) 489Biden Job Somewhat Disapprove 17% (37) 14% (31) 25% (56) 31% (69) 13% (30) 223Biden Job Strongly Disapprove 3% (21) 4% (24) 7% (45) 81% (513) 5% (32) 634
Continued on next page
Page 305
National Tracking Poll #210636, June, 2021
305
Table POL20
Table POL20: As you may know, Facebook announced that it plans to suspend former President Donald Trump from its platform for the next twoyears, at least. Do you support or oppose this suspension?
DemographicStronglysupport
Somewhatsupport
Somewhatoppose
Stronglyoppose
Don’t know /No opinion Total N
Registered Voters 41% (817) 10% (198) 8% (150) 32% (646) 9% (179) 1990Favorable of Biden 71% (743) 12% (128) 4% (45) 5% (53) 8% (79) 1048Unfavorable of Biden 6% (53) 7% (57) 12% (99) 68% (580) 8% (66) 855Very Favorable of Biden 83% (494) 7% (44) 2% (11) 3% (20) 4% (24) 593Somewhat Favorable of Biden 55% (249) 18% (84) 8% (34) 7% (32) 12% (56) 455Somewhat Unfavorable of Biden 19% (36) 14% (27) 23% (45) 25% (48) 18% (34) 190Very Unfavorable of Biden 2% (16) 4% (30) 8% (54) 80% (532) 5% (32) 664#1 Issue: Economy 34% (257) 10% (77) 9% (70) 37% (283) 10% (76) 763#1 Issue: Security 18% (63) 7% (26) 6% (20) 60% (210) 9% (30) 349#1 Issue: Health Care 62% (145) 12% (28) 6% (14) 12% (28) 8% (18) 233#1 Issue: Medicare / Social Security 58% (151) 10% (26) 8% (22) 20% (53) 4% (9) 261#1 Issue: Women’s Issues 54% (56) 14% (14) 5% (5) 11% (12) 16% (16) 103#1 Issue: Education 48% (41) 12% (10) 9% (8) 17% (15) 13% (11) 86#1 Issue: Energy 60% (51) 8% (7) 5% (4) 16% (14) 12% (10) 86#1 Issue: Other 50% (55) 9% (10) 6% (6) 28% (30) 7% (7) 1092020 Vote: Joe Biden 77% (688) 13% (115) 3% (28) 3% (24) 5% (42) 8972020 Vote: Donald Trump 6% (52) 6% (49) 11% (90) 69% (563) 8% (64) 8182020 Vote: Didn’t Vote 28% (67) 12% (29) 12% (29) 20% (48) 27% (66) 2392018 House Vote: Democrat 77% (530) 11% (75) 5% (33) 4% (31) 3% (19) 6872018 House Vote: Republican 11% (74) 6% (38) 10% (66) 67% (464) 7% (48) 6902018 House Vote: Someone else 31% (15) 7% (3) 4% (2) 25% (13) 33% (16) 502016 Vote: Hillary Clinton 77% (489) 12% (75) 3% (21) 4% (26) 3% (20) 6312016 Vote: Donald Trump 12% (91) 6% (48) 10% (76) 65% (498) 7% (56) 7682016 Vote: Other 49% (52) 9% (9) 12% (13) 16% (17) 15% (16) 1072016 Vote: Didn’t Vote 38% (185) 14% (66) 8% (40) 22% (105) 18% (87) 483Voted in 2014: Yes 44% (568) 8% (107) 7% (91) 36% (461) 5% (69) 1297Voted in 2014: No 36% (249) 13% (90) 8% (59) 27% (185) 16% (110) 6934-Region: Northeast 47% (161) 14% (48) 8% (27) 26% (90) 5% (18) 3444-Region: Midwest 43% (195) 9% (43) 6% (27) 36% (163) 6% (27) 4554-Region: South 36% (270) 9% (67) 8% (61) 37% (277) 11% (81) 7554-Region: West 44% (191) 9% (40) 8% (34) 27% (117) 12% (53) 435
Continued on next page
Page 306
306
Morning ConsultTable POL20
Table POL20: As you may know, Facebook announced that it plans to suspend former President Donald Trump from its platform for the next twoyears, at least. Do you support or oppose this suspension?
DemographicStronglysupport
Somewhatsupport
Somewhatoppose
Stronglyoppose
Don’t know /No opinion Total N
Registered Voters 41% (817) 10% (198) 8% (150) 32% (646) 9% (179) 1990Party: Democrat/Leans Democrat 73% (647) 13% (117) 4% (38) 4% (37) 6% (50) 888Party: Republican/Leans Republican 10% (81) 6% (45) 10% (84) 66% (535) 8% (68) 814Note: Row proportions may total to larger than one-hundred percent due to rounding. For more information visit MorningConsultIntelligence.com.
Page 307
National Tracking Poll #210636, June, 2021
307
Table POLx_1
Table POLx_1: Next we will look at a list of names that are active in politics. It is a long list, please take the time to go through the list carefullyand give an individual answer for each name below. For each person, please indicate if you have a Very Favorable, Somewhat Favorable, SomewhatUnfavorable, or Very Unfavorable opinion of each If you have heard of the person, but do not have an opinion, please mark ’Heard Of, No Opinion.’ Ifyou have not heard of the person, please mark ’Never Heard Of.’Mitch McConnell
Demographic Total Favorable Total UnfavorableHeard Of, NoOpinion Never Heard Of Total N
Registered Voters 22% (447) 55% (1101) 16% (312) 7% (131) 1990Gender: Male 27% (247) 58% (539) 11% (100) 4% (41) 927Gender: Female 19% (199) 53% (562) 20% (211) 8% (90) 1063Age: 18-34 16% (72) 44% (201) 23% (105) 17% (78) 456Age: 35-44 21% (63) 51% (152) 20% (59) 9% (26) 300Age: 45-64 24% (173) 58% (423) 15% (108) 4% (26) 730Age: 65+ 28% (139) 65% (325) 8% (39) — (1) 504GenZers: 1997-2012 11% (19) 39% (66) 27% (47) 23% (38) 169Millennials: 1981-1996 21% (99) 47% (226) 20% (96) 12% (59) 480GenXers: 1965-1980 19% (99) 57% (300) 18% (95) 6% (31) 525Baby Boomers: 1946-1964 27% (204) 63% (471) 9% (68) — (3) 746PID: Dem (no lean) 12% (90) 68% (515) 12% (87) 8% (60) 752PID: Ind (no lean) 16% (93) 58% (335) 19% (108) 7% (41) 578PID: Rep (no lean) 40% (264) 38% (251) 18% (117) 4% (29) 661PID/Gender: DemMen 17% (61) 66% (239) 10% (35) 7% (24) 359PID/Gender: DemWomen 7% (29) 70% (276) 13% (51) 9% (37) 393PID/Gender: Ind Men 21% (56) 64% (170) 12% (31) 4% (10) 267PID/Gender: Ind Women 12% (38) 53% (165) 25% (77) 10% (32) 311PID/Gender: Rep Men 43% (130) 43% (130) 11% (33) 2% (7) 301PID/Gender: Rep Women 37% (133) 34% (121) 23% (83) 6% (22) 360Ideo: Liberal (1-3) 12% (68) 73% (428) 11% (62) 5% (28) 587Ideo: Moderate (4) 16% (84) 58% (312) 20% (106) 7% (37) 539Ideo: Conservative (5-7) 38% (285) 44% (328) 13% (94) 5% (35) 742Educ: < College 21% (254) 51% (621) 20% (241) 8% (98) 1213Educ: Bachelors degree 23% (111) 62% (304) 10% (49) 5% (24) 489Educ: Post-grad 28% (82) 61% (176) 8% (22) 3% (9) 288Income: Under 50k 19% (187) 53% (526) 20% (201) 8% (77) 991Income: 50k-100k 24% (156) 57% (367) 12% (74) 7% (43) 640Income: 100k+ 29% (104) 58% (207) 10% (36) 3% (12) 359
Continued on next page
Page 308
308
Morning ConsultTable POLx_1
Table POLx_1: Next we will look at a list of names that are active in politics. It is a long list, please take the time to go through the list carefullyand give an individual answer for each name below. For each person, please indicate if you have a Very Favorable, Somewhat Favorable, SomewhatUnfavorable, or Very Unfavorable opinion of each If you have heard of the person, but do not have an opinion, please mark ’Heard Of, No Opinion.’ Ifyou have not heard of the person, please mark ’Never Heard Of.’Mitch McConnell
Demographic Total Favorable Total UnfavorableHeard Of, NoOpinion Never Heard Of Total N
Registered Voters 22% (447) 55% (1101) 16% (312) 7% (131) 1990Ethnicity: White 25% (395) 55% (871) 15% (238) 5% (81) 1584Ethnicity: Hispanic 19% (37) 49% (97) 19% (37) 13% (25) 196Ethnicity: Black 12% (29) 55% (134) 19% (45) 14% (35) 243Ethnicity: Other 14% (23) 59% (96) 17% (28) 10% (16) 163All Christian 32% (305) 52% (505) 13% (121) 3% (33) 964All Non-Christian 23% (27) 58% (70) 12% (14) 8% (10) 121Atheist 14% (10) 69% (50) 17% (13) — (0) 73Agnostic/Nothing in particular 10% (51) 61% (301) 21% (103) 8% (40) 495Something Else 16% (53) 52% (174) 18% (61) 14% (48) 337Religious Non-Protestant/Catholic 24% (34) 56% (78) 13% (19) 7% (10) 140Evangelical 32% (176) 46% (250) 15% (81) 7% (41) 547Non-Evangelical 24% (172) 57% (414) 13% (96) 5% (39) 721Community: Urban 25% (133) 53% (278) 15% (80) 7% (38) 529Community: Suburban 22% (217) 58% (582) 14% (143) 6% (55) 998Community: Rural 21% (97) 52% (241) 19% (88) 8% (37) 464Employ: Private Sector 21% (129) 58% (363) 15% (91) 6% (39) 622Employ: Government 27% (35) 53% (68) 15% (20) 4% (5) 129Employ: Self-Employed 18% (29) 58% (91) 14% (22) 10% (15) 157Employ: Homemaker 31% (39) 40% (51) 20% (26) 9% (11) 127Employ: Retired 28% (163) 60% (346) 11% (63) 1% (8) 581Employ: Unemployed 16% (34) 50% (107) 19% (42) 15% (31) 215Employ: Other 10% (12) 46% (52) 29% (33) 14% (16) 113Military HH: Yes 33% (119) 56% (201) 9% (32) 3% (10) 361Military HH: No 20% (328) 55% (900) 17% (280) 7% (121) 1629RD/WT: Right Direction 14% (132) 65% (615) 14% (134) 6% (61) 941RD/WT: Wrong Track 30% (315) 46% (486) 17% (177) 7% (70) 1049Biden Job Approve 14% (141) 66% (689) 14% (147) 6% (61) 1037Biden Job Disapprove 35% (302) 47% (399) 13% (114) 5% (42) 857
Continued on next page
Page 309
National Tracking Poll #210636, June, 2021
309
Table POLx_1
Table POLx_1: Next we will look at a list of names that are active in politics. It is a long list, please take the time to go through the list carefullyand give an individual answer for each name below. For each person, please indicate if you have a Very Favorable, Somewhat Favorable, SomewhatUnfavorable, or Very Unfavorable opinion of each If you have heard of the person, but do not have an opinion, please mark ’Heard Of, No Opinion.’ Ifyou have not heard of the person, please mark ’Never Heard Of.’Mitch McConnell
Demographic Total Favorable Total UnfavorableHeard Of, NoOpinion Never Heard Of Total N
Registered Voters 22% (447) 55% (1101) 16% (312) 7% (131) 1990Biden Job Strongly Approve 15% (81) 70% (385) 9% (52) 6% (31) 548Biden Job Somewhat Approve 12% (59) 62% (304) 19% (95) 6% (30) 489Biden Job Somewhat Disapprove 26% (57) 49% (110) 17% (38) 8% (18) 223Biden Job Strongly Disapprove 39% (245) 46% (290) 12% (76) 4% (24) 634Favorable of Biden 14% (148) 66% (693) 14% (147) 6% (60) 1048Unfavorable of Biden 34% (292) 46% (396) 14% (121) 5% (46) 855Very Favorable of Biden 14% (83) 72% (430) 9% (54) 5% (27) 593Somewhat Favorable of Biden 14% (65) 58% (263) 21% (94) 7% (33) 455Somewhat Unfavorable of Biden 20% (39) 51% (96) 17% (33) 11% (22) 190Very Unfavorable of Biden 38% (254) 45% (300) 13% (87) 4% (24) 664#1 Issue: Economy 22% (167) 51% (388) 20% (151) 8% (58) 763#1 Issue: Security 41% (144) 45% (157) 9% (32) 5% (17) 349#1 Issue: Health Care 17% (40) 61% (143) 14% (32) 8% (19) 233#1 Issue: Medicare / Social Security 18% (47) 65% (170) 14% (37) 2% (6) 261#1 Issue: Women’s Issues 5% (5) 63% (64) 17% (18) 15% (15) 103#1 Issue: Education 22% (19) 47% (40) 18% (16) 13% (11) 86#1 Issue: Energy 14% (12) 74% (63) 9% (8) 3% (3) 86#1 Issue: Other 12% (13) 69% (76) 17% (19) 1% (1) 1092020 Vote: Joe Biden 11% (98) 72% (647) 11% (96) 6% (57) 8972020 Vote: Donald Trump 39% (315) 41% (338) 15% (126) 5% (39) 8182020 Vote: Didn’t Vote 12% (29) 38% (91) 36% (86) 14% (33) 2392018 House Vote: Democrat 10% (70) 77% (531) 8% (58) 4% (28) 6872018 House Vote: Republican 42% (290) 42% (287) 13% (88) 4% (25) 6902018 House Vote: Someone else 12% (6) 56% (28) 21% (11) 10% (5) 502016 Vote: Hillary Clinton 11% (67) 77% (487) 8% (53) 4% (24) 6312016 Vote: Donald Trump 40% (307) 43% (330) 13% (100) 4% (30) 7682016 Vote: Other 12% (13) 67% (71) 16% (18) 5% (5) 1072016 Vote: Didn’t Vote 12% (59) 44% (213) 29% (140) 15% (72) 483
Continued on next page
Page 310
310
Morning ConsultTable POLx_1
Table POLx_1: Next we will look at a list of names that are active in politics. It is a long list, please take the time to go through the list carefullyand give an individual answer for each name below. For each person, please indicate if you have a Very Favorable, Somewhat Favorable, SomewhatUnfavorable, or Very Unfavorable opinion of each If you have heard of the person, but do not have an opinion, please mark ’Heard Of, No Opinion.’ Ifyou have not heard of the person, please mark ’Never Heard Of.’Mitch McConnell
Demographic Total Favorable Total UnfavorableHeard Of, NoOpinion Never Heard Of Total N
Registered Voters 22% (447) 55% (1101) 16% (312) 7% (131) 1990Voted in 2014: Yes 26% (335) 59% (771) 11% (141) 4% (50) 1297Voted in 2014: No 16% (112) 48% (330) 25% (170) 12% (81) 6934-Region: Northeast 25% (86) 55% (191) 13% (44) 7% (24) 3444-Region: Midwest 20% (91) 59% (267) 16% (72) 5% (25) 4554-Region: South 25% (186) 50% (378) 17% (128) 8% (62) 7554-Region: West 19% (83) 61% (264) 16% (67) 5% (20) 435Party: Democrat/Leans Democrat 12% (103) 70% (622) 11% (98) 7% (65) 888Party: Republican/Leans Republican 38% (309) 40% (328) 17% (137) 5% (40) 814Note: Row proportions may total to larger than one-hundred percent due to rounding. For more information visit MorningConsultIntelligence.com.
Page 311
National Tracking Poll #210636, June, 2021
311
Table POLx_2
Table POLx_2: Favorability forNancy Pelosi
Demographic Total Favorable Total UnfavorableHeard Of, NoOpinion Never Heard Of Total N
Registered Voters 34% (670) 55% (1090) 9% (181) 3% (50) 1990Gender: Male 37% (344) 54% (501) 6% (58) 3% (24) 927Gender: Female 31% (325) 55% (589) 12% (123) 2% (25) 1063Age: 18-34 27% (123) 45% (206) 20% (92) 8% (35) 456Age: 35-44 35% (105) 54% (162) 9% (27) 2% (6) 300Age: 45-64 32% (235) 60% (437) 7% (50) 1% (9) 730Age: 65+ 41% (207) 57% (285) 2% (12) — (0) 504GenZers: 1997-2012 20% (33) 38% (64) 31% (53) 11% (19) 169Millennials: 1981-1996 33% (159) 50% (242) 12% (59) 4% (20) 480GenXers: 1965-1980 34% (180) 56% (292) 8% (42) 2% (11) 525Baby Boomers: 1946-1964 37% (274) 60% (446) 3% (25) — (0) 746PID: Dem (no lean) 65% (487) 21% (154) 11% (84) 4% (26) 752PID: Ind (no lean) 25% (145) 60% (347) 12% (69) 3% (17) 578PID: Rep (no lean) 6% (38) 89% (588) 4% (28) 1% (7) 661PID/Gender: DemMen 66% (236) 22% (79) 7% (27) 5% (17) 359PID/Gender: DemWomen 64% (251) 19% (75) 15% (57) 3% (10) 393PID/Gender: Ind Men 32% (85) 59% (159) 7% (20) 1% (4) 267PID/Gender: Ind Women 19% (60) 61% (188) 16% (49) 4% (13) 311PID/Gender: Rep Men 8% (23) 87% (262) 4% (12) 1% (4) 301PID/Gender: Rep Women 4% (15) 91% (326) 4% (16) 1% (3) 360Ideo: Liberal (1-3) 64% (379) 23% (136) 10% (59) 2% (14) 587Ideo: Moderate (4) 38% (207) 49% (266) 11% (58) 2% (8) 539Ideo: Conservative (5-7) 10% (71) 86% (638) 3% (23) 1% (10) 742Educ: < College 28% (341) 57% (694) 12% (144) 3% (33) 1213Educ: Bachelors degree 41% (201) 51% (249) 5% (26) 2% (12) 489Educ: Post-grad 44% (127) 51% (146) 4% (10) 2% (5) 288Income: Under 50k 33% (325) 53% (524) 11% (113) 3% (29) 991Income: 50k-100k 33% (209) 58% (368) 7% (48) 2% (15) 640Income: 100k+ 38% (136) 55% (198) 6% (20) 1% (5) 359Ethnicity: White 31% (484) 60% (955) 7% (116) 2% (29) 1584Ethnicity: Hispanic 35% (69) 46% (90) 15% (30) 3% (6) 196
Continued on next page
Page 312
312
Morning ConsultTable POLx_2
Table POLx_2: Favorability forNancy Pelosi
Demographic Total Favorable Total UnfavorableHeard Of, NoOpinion Never Heard Of Total N
Registered Voters 34% (670) 55% (1090) 9% (181) 3% (50) 1990Ethnicity: Black 53% (129) 25% (60) 16% (39) 6% (14) 243Ethnicity: Other 35% (57) 46% (75) 15% (25) 4% (7) 163All Christian 31% (302) 63% (604) 5% (51) 1% (6) 964All Non-Christian 49% (59) 38% (45) 5% (6) 9% (11) 121Atheist 47% (34) 36% (26) 17% (13) — (0) 73Agnostic/Nothing in particular 36% (177) 46% (227) 14% (71) 4% (20) 495Something Else 29% (97) 55% (186) 12% (41) 4% (12) 337Religious Non-Protestant/Catholic 45% (63) 42% (60) 5% (7) 8% (11) 140Evangelical 28% (151) 65% (354) 6% (33) 2% (10) 547Non-Evangelical 33% (238) 58% (419) 8% (55) 1% (9) 721Community: Urban 46% (243) 38% (203) 11% (59) 5% (24) 529Community: Suburban 31% (312) 59% (586) 9% (86) 1% (14) 998Community: Rural 25% (115) 65% (302) 8% (36) 3% (12) 464Employ: Private Sector 34% (210) 56% (346) 9% (58) 1% (8) 622Employ: Government 35% (45) 50% (65) 10% (12) 5% (6) 129Employ: Self-Employed 35% (55) 50% (79) 9% (14) 6% (9) 157Employ: Homemaker 22% (28) 68% (87) 9% (11) 1% (1) 127Employ: Retired 38% (222) 57% (333) 4% (23) — (3) 581Employ: Unemployed 28% (59) 51% (109) 13% (28) 8% (18) 215Employ: Other 32% (37) 45% (50) 19% (22) 4% (4) 113Military HH: Yes 30% (110) 63% (228) 6% (21) 1% (2) 361Military HH: No 34% (560) 53% (862) 10% (159) 3% (48) 1629RD/WT: Right Direction 62% (579) 25% (234) 11% (101) 3% (28) 941RD/WT: Wrong Track 9% (90) 82% (856) 8% (80) 2% (22) 1049Biden Job Approve 61% (636) 26% (268) 10% (107) 3% (27) 1037Biden Job Disapprove 3% (29) 92% (790) 3% (28) 1% (10) 857Biden Job Strongly Approve 79% (435) 11% (62) 7% (36) 3% (16) 548Biden Job Somewhat Approve 41% (201) 42% (206) 15% (71) 2% (10) 489Biden Job Somewhat Disapprove 7% (16) 84% (186) 6% (14) 3% (6) 223Biden Job Strongly Disapprove 2% (12) 95% (603) 2% (14) 1% (4) 634
Continued on next page
Page 313
National Tracking Poll #210636, June, 2021
313
Table POLx_2
Table POLx_2: Favorability forNancy Pelosi
Demographic Total Favorable Total UnfavorableHeard Of, NoOpinion Never Heard Of Total N
Registered Voters 34% (670) 55% (1090) 9% (181) 3% (50) 1990Favorable of Biden 62% (645) 25% (266) 11% (114) 2% (23) 1048Unfavorable of Biden 2% (17) 94% (803) 3% (25) 1% (10) 855Very Favorable of Biden 80% (475) 12% (69) 7% (39) 2% (10) 593Somewhat Favorable of Biden 37% (170) 43% (197) 17% (75) 3% (13) 455Somewhat Unfavorable of Biden 7% (14) 84% (160) 6% (11) 2% (5) 190Very Unfavorable of Biden — (3) 97% (642) 2% (14) 1% (5) 664#1 Issue: Economy 27% (208) 60% (458) 10% (78) 3% (19) 763#1 Issue: Security 15% (53) 80% (279) 4% (13) 1% (5) 349#1 Issue: Health Care 52% (122) 39% (92) 5% (11) 4% (8) 233#1 Issue: Medicare / Social Security 48% (125) 45% (116) 7% (18) 1% (2) 261#1 Issue: Women’s Issues 43% (44) 28% (29) 22% (23) 7% (7) 103#1 Issue: Education 34% (29) 39% (33) 20% (17) 8% (6) 86#1 Issue: Energy 46% (39) 35% (30) 17% (15) 2% (2) 86#1 Issue: Other 45% (49) 48% (52) 6% (6) 1% (1) 1092020 Vote: Joe Biden 65% (583) 22% (201) 10% (89) 3% (24) 8972020 Vote: Donald Trump 4% (32) 92% (751) 3% (27) 1% (8) 8182020 Vote: Didn’t Vote 21% (50) 46% (111) 26% (62) 7% (17) 2392018 House Vote: Democrat 70% (480) 23% (157) 6% (43) 1% (7) 6872018 House Vote: Republican 6% (40) 91% (626) 2% (13) 2% (11) 6902018 House Vote: Someone else 10% (5) 77% (38) 12% (6) 1% (0) 502016 Vote: Hillary Clinton 72% (457) 19% (122) 7% (44) 1% (7) 6312016 Vote: Donald Trump 7% (52) 89% (685) 3% (20) 1% (11) 7682016 Vote: Other 31% (33) 64% (68) 4% (5) 1% (1) 1072016 Vote: Didn’t Vote 26% (126) 44% (214) 23% (111) 6% (31) 483Voted in 2014: Yes 38% (489) 57% (735) 4% (57) 1% (17) 1297Voted in 2014: No 26% (180) 51% (355) 18% (124) 5% (33) 6934-Region: Northeast 40% (137) 46% (160) 10% (34) 4% (13) 3444-Region: Midwest 35% (161) 56% (254) 8% (35) 1% (4) 4554-Region: South 29% (221) 60% (450) 8% (64) 3% (21) 7554-Region: West 35% (150) 52% (226) 11% (48) 3% (11) 435
Continued on next page
Page 314
314
Morning ConsultTable POLx_2
Table POLx_2: Favorability forNancy Pelosi
Demographic Total Favorable Total UnfavorableHeard Of, NoOpinion Never Heard Of Total N
Registered Voters 34% (670) 55% (1090) 9% (181) 3% (50) 1990Party: Democrat/Leans Democrat 65% (574) 22% (191) 11% (95) 3% (28) 888Party: Republican/Leans Republican 6% (46) 89% (725) 4% (35) 1% (8) 814Note: Row proportions may total to larger than one-hundred percent due to rounding. For more information visit MorningConsultIntelligence.com.
Page 315
National Tracking Poll #210636, June, 2021
315
Table POLx_3
Table POLx_3: Favorability forCharles Schumer
Demographic Total Favorable Total UnfavorableHeard Of, NoOpinion Never Heard Of Total N
Registered Voters 28% (551) 43% (851) 19% (369) 11% (219) 1990Gender: Male 32% (301) 48% (449) 11% (106) 8% (71) 927Gender: Female 24% (250) 38% (402) 25% (263) 14% (147) 1063Age: 18-34 21% (96) 27% (123) 23% (106) 29% (131) 456Age: 35-44 26% (79) 38% (113) 27% (80) 10% (29) 300Age: 45-64 28% (202) 49% (358) 18% (131) 5% (40) 730Age: 65+ 35% (174) 51% (258) 10% (52) 4% (20) 504GenZers: 1997-2012 13% (22) 20% (34) 26% (44) 41% (69) 169Millennials: 1981-1996 27% (128) 33% (156) 24% (114) 17% (81) 480GenXers: 1965-1980 26% (137) 44% (230) 22% (115) 8% (43) 525Baby Boomers: 1946-1964 33% (245) 53% (392) 12% (89) 3% (20) 746PID: Dem (no lean) 51% (382) 19% (140) 18% (139) 12% (90) 752PID: Ind (no lean) 22% (125) 46% (264) 20% (115) 13% (74) 578PID: Rep (no lean) 7% (44) 68% (447) 17% (115) 8% (55) 661PID/Gender: DemMen 55% (199) 22% (79) 13% (45) 10% (35) 359PID/Gender: DemWomen 47% (183) 16% (61) 24% (94) 14% (55) 393PID/Gender: Ind Men 27% (72) 54% (144) 11% (29) 8% (22) 267PID/Gender: Ind Women 17% (53) 39% (120) 27% (85) 17% (52) 311PID/Gender: Rep Men 10% (30) 75% (226) 10% (31) 5% (14) 301PID/Gender: Rep Women 4% (14) 62% (221) 23% (84) 11% (40) 360Ideo: Liberal (1-3) 52% (308) 21% (124) 15% (90) 11% (66) 587Ideo: Moderate (4) 31% (166) 34% (183) 24% (129) 11% (60) 539Ideo: Conservative (5-7) 9% (67) 71% (526) 13% (98) 7% (52) 742Educ: < College 21% (253) 43% (522) 23% (278) 13% (161) 1213Educ: Bachelors degree 36% (177) 44% (216) 12% (60) 7% (36) 489Educ: Post-grad 42% (122) 39% (114) 11% (31) 8% (22) 288Income: Under 50k 25% (247) 39% (390) 22% (214) 14% (140) 991Income: 50k-100k 28% (178) 48% (306) 16% (102) 8% (54) 640Income: 100k+ 35% (126) 43% (155) 15% (53) 7% (25) 359Ethnicity: White 27% (428) 47% (737) 17% (270) 9% (149) 1584Ethnicity: Hispanic 26% (51) 30% (60) 27% (54) 16% (31) 196
Continued on next page
Page 316
316
Morning ConsultTable POLx_3
Table POLx_3: Favorability forCharles Schumer
Demographic Total Favorable Total UnfavorableHeard Of, NoOpinion Never Heard Of Total N
Registered Voters 28% (551) 43% (851) 19% (369) 11% (219) 1990Ethnicity: Black 34% (82) 24% (57) 27% (66) 15% (37) 243Ethnicity: Other 25% (41) 35% (57) 20% (32) 20% (33) 163All Christian 27% (265) 52% (502) 14% (140) 6% (58) 964All Non-Christian 43% (52) 31% (38) 12% (15) 14% (17) 121Atheist 43% (31) 33% (24) 15% (11) 9% (7) 73Agnostic/Nothing in particular 26% (128) 37% (182) 24% (121) 13% (64) 495Something Else 22% (76) 31% (105) 25% (83) 22% (73) 337Religious Non-Protestant/Catholic 41% (57) 31% (44) 14% (19) 14% (20) 140Evangelical 22% (123) 50% (273) 17% (93) 11% (58) 547Non-Evangelical 29% (206) 45% (324) 17% (125) 9% (67) 721Community: Urban 38% (201) 34% (180) 17% (88) 11% (60) 529Community: Suburban 26% (255) 46% (459) 18% (178) 11% (106) 998Community: Rural 21% (95) 46% (213) 22% (103) 11% (53) 464Employ: Private Sector 29% (178) 41% (257) 21% (128) 9% (57) 622Employ: Government 29% (37) 39% (50) 16% (21) 16% (20) 129Employ: Self-Employed 28% (44) 42% (67) 16% (25) 13% (21) 157Employ: Homemaker 16% (20) 45% (58) 26% (33) 12% (15) 127Employ: Retired 33% (194) 50% (291) 12% (70) 4% (26) 581Employ: Unemployed 21% (45) 38% (81) 23% (50) 18% (39) 215Employ: Other 18% (21) 31% (36) 27% (31) 23% (26) 113Military HH: Yes 24% (86) 56% (202) 14% (52) 6% (21) 361Military HH: No 29% (465) 40% (649) 19% (317) 12% (198) 1629RD/WT: Right Direction 50% (472) 20% (192) 19% (177) 11% (100) 941RD/WT: Wrong Track 8% (79) 63% (659) 18% (192) 11% (119) 1049Biden Job Approve 50% (517) 22% (225) 18% (185) 11% (111) 1037Biden Job Disapprove 4% (33) 72% (621) 16% (133) 8% (71) 857Biden Job Strongly Approve 65% (355) 15% (82) 13% (71) 7% (41) 548Biden Job Somewhat Approve 33% (162) 29% (143) 23% (114) 14% (70) 489Biden Job Somewhat Disapprove 6% (14) 55% (123) 22% (50) 16% (36) 223Biden Job Strongly Disapprove 3% (18) 79% (498) 13% (83) 5% (34) 634
Continued on next page
Page 317
National Tracking Poll #210636, June, 2021
317
Table POLx_3
Table POLx_3: Favorability forCharles Schumer
Demographic Total Favorable Total UnfavorableHeard Of, NoOpinion Never Heard Of Total N
Registered Voters 28% (551) 43% (851) 19% (369) 11% (219) 1990Favorable of Biden 49% (518) 21% (222) 19% (198) 11% (111) 1048Unfavorable of Biden 3% (30) 73% (621) 14% (124) 9% (80) 855Very Favorable of Biden 64% (378) 16% (94) 13% (75) 8% (46) 593Somewhat Favorable of Biden 31% (140) 28% (128) 27% (122) 14% (65) 455Somewhat Unfavorable of Biden 5% (10) 54% (103) 23% (44) 18% (33) 190Very Unfavorable of Biden 3% (20) 78% (518) 12% (80) 7% (47) 664#1 Issue: Economy 23% (174) 44% (336) 18% (141) 15% (113) 763#1 Issue: Security 15% (51) 68% (236) 13% (44) 5% (18) 349#1 Issue: Health Care 43% (100) 29% (68) 19% (44) 9% (21) 233#1 Issue: Medicare / Social Security 40% (103) 36% (93) 20% (51) 5% (13) 261#1 Issue: Women’s Issues 25% (26) 25% (26) 31% (32) 18% (19) 103#1 Issue: Education 25% (22) 29% (25) 22% (19) 24% (21) 86#1 Issue: Energy 45% (39) 24% (21) 21% (18) 9% (8) 86#1 Issue: Other 34% (37) 43% (47) 18% (20) 5% (5) 1092020 Vote: Joe Biden 52% (467) 21% (188) 16% (145) 11% (97) 8972020 Vote: Donald Trump 5% (44) 72% (586) 16% (127) 8% (62) 8182020 Vote: Didn’t Vote 16% (37) 23% (55) 39% (93) 23% (54) 2392018 House Vote: Democrat 57% (393) 21% (145) 14% (98) 7% (51) 6872018 House Vote: Republican 7% (47) 74% (511) 13% (93) 6% (39) 6902018 House Vote: Someone else 7% (3) 49% (25) 28% (14) 16% (8) 502016 Vote: Hillary Clinton 59% (370) 19% (123) 16% (99) 6% (39) 6312016 Vote: Donald Trump 8% (62) 73% (559) 13% (102) 6% (44) 7682016 Vote: Other 23% (24) 45% (49) 19% (20) 13% (14) 1072016 Vote: Didn’t Vote 19% (94) 25% (121) 30% (147) 25% (122) 483Voted in 2014: Yes 32% (418) 48% (623) 14% (181) 6% (76) 1297Voted in 2014: No 19% (133) 33% (228) 27% (188) 21% (143) 6934-Region: Northeast 39% (135) 39% (133) 14% (49) 8% (28) 3444-Region: Midwest 29% (133) 41% (185) 21% (96) 9% (41) 4554-Region: South 21% (159) 47% (359) 20% (150) 12% (87) 7554-Region: West 29% (124) 40% (175) 17% (74) 14% (62) 435
Continued on next page
Page 318
318
Morning ConsultTable POLx_3
Table POLx_3: Favorability forCharles Schumer
Demographic Total Favorable Total UnfavorableHeard Of, NoOpinion Never Heard Of Total N
Registered Voters 28% (551) 43% (851) 19% (369) 11% (219) 1990Party: Democrat/Leans Democrat 51% (455) 19% (170) 18% (159) 12% (104) 888Party: Republican/Leans Republican 7% (54) 69% (560) 16% (133) 8% (66) 814Note: Row proportions may total to larger than one-hundred percent due to rounding. For more information visit MorningConsultIntelligence.com.
Page 319
National Tracking Poll #210636, June, 2021
319
Table POLx_4
Table POLx_4: Favorability forMike Pence
Demographic Total Favorable Total UnfavorableHeard Of, NoOpinion Never Heard Of Total N
Registered Voters 40% (790) 49% (971) 9% (183) 2% (46) 1990Gender: Male 42% (390) 49% (457) 7% (62) 2% (18) 927Gender: Female 38% (400) 48% (514) 11% (121) 3% (28) 1063Age: 18-34 29% (130) 51% (232) 14% (63) 7% (31) 456Age: 35-44 35% (106) 49% (146) 14% (42) 2% (6) 300Age: 45-64 44% (323) 47% (341) 8% (57) 1% (9) 730Age: 65+ 46% (231) 50% (252) 4% (21) — (0) 504GenZers: 1997-2012 22% (37) 52% (88) 18% (31) 8% (14) 169Millennials: 1981-1996 35% (166) 48% (228) 13% (63) 5% (22) 480GenXers: 1965-1980 37% (192) 51% (266) 11% (58) 2% (10) 525Baby Boomers: 1946-1964 48% (358) 48% (357) 4% (30) — (0) 746PID: Dem (no lean) 17% (127) 72% (541) 8% (62) 3% (22) 752PID: Ind (no lean) 37% (213) 46% (265) 14% (82) 3% (18) 578PID: Rep (no lean) 68% (451) 25% (164) 6% (39) 1% (6) 661PID/Gender: DemMen 22% (78) 68% (244) 7% (26) 3% (12) 359PID/Gender: DemWomen 12% (49) 76% (298) 9% (36) 3% (10) 393PID/Gender: Ind Men 40% (108) 49% (130) 11% (28) — (1) 267PID/Gender: Ind Women 34% (105) 43% (135) 17% (54) 5% (17) 311PID/Gender: Rep Men 68% (205) 28% (83) 3% (8) 2% (5) 301PID/Gender: Rep Women 68% (246) 23% (81) 9% (31) — (1) 360Ideo: Liberal (1-3) 15% (86) 78% (458) 5% (29) 2% (15) 587Ideo: Moderate (4) 33% (176) 53% (285) 14% (76) — (3) 539Ideo: Conservative (5-7) 67% (497) 27% (203) 4% (28) 2% (14) 742Educ: < College 40% (489) 45% (548) 12% (146) 2% (29) 1213Educ: Bachelors degree 36% (178) 56% (272) 6% (28) 2% (10) 489Educ: Post-grad 43% (123) 52% (150) 3% (9) 2% (6) 288Income: Under 50k 36% (361) 49% (482) 12% (117) 3% (32) 991Income: 50k-100k 40% (259) 50% (318) 8% (52) 2% (11) 640Income: 100k+ 47% (170) 48% (171) 4% (15) 1% (3) 359Ethnicity: White 45% (706) 46% (726) 8% (125) 2% (28) 1584Ethnicity: Hispanic 26% (50) 57% (111) 13% (25) 5% (9) 196
Continued on next page
Page 320
320
Morning ConsultTable POLx_4
Table POLx_4: Favorability forMike Pence
Demographic Total Favorable Total UnfavorableHeard Of, NoOpinion Never Heard Of Total N
Registered Voters 40% (790) 49% (971) 9% (183) 2% (46) 1990Ethnicity: Black 16% (39) 65% (158) 14% (35) 4% (10) 243Ethnicity: Other 28% (45) 53% (86) 14% (23) 5% (9) 163All Christian 52% (499) 42% (408) 5% (49) 1% (7) 964All Non-Christian 32% (38) 52% (62) 8% (10) 9% (10) 121Atheist 19% (14) 79% (58) 2% (1) — (0) 73Agnostic/Nothing in particular 25% (123) 57% (282) 15% (74) 3% (16) 495Something Else 34% (116) 48% (161) 14% (48) 4% (12) 337Religious Non-Protestant/Catholic 36% (50) 48% (67) 9% (13) 7% (10) 140Evangelical 55% (299) 38% (207) 6% (31) 2% (11) 547Non-Evangelical 42% (300) 48% (349) 9% (63) 1% (9) 721Community: Urban 33% (172) 53% (281) 10% (54) 4% (21) 529Community: Suburban 40% (397) 51% (506) 8% (81) 1% (13) 998Community: Rural 48% (220) 40% (184) 10% (49) 2% (11) 464Employ: Private Sector 40% (251) 50% (311) 8% (49) 2% (12) 622Employ: Government 48% (62) 37% (47) 13% (16) 2% (3) 129Employ: Self-Employed 27% (43) 59% (93) 8% (13) 5% (8) 157Employ: Homemaker 50% (64) 36% (46) 12% (15) 2% (2) 127Employ: Retired 47% (273) 48% (278) 5% (29) — (1) 581Employ: Unemployed 24% (52) 51% (110) 18% (39) 6% (14) 215Employ: Other 28% (31) 51% (58) 15% (17) 6% (7) 113Military HH: Yes 50% (180) 42% (151) 8% (29) 1% (2) 361Military HH: No 37% (610) 50% (820) 9% (155) 3% (44) 1629RD/WT: Right Direction 23% (217) 65% (609) 10% (93) 2% (22) 941RD/WT: Wrong Track 55% (573) 35% (362) 9% (90) 2% (24) 1049Biden Job Approve 23% (238) 67% (691) 8% (87) 2% (21) 1037Biden Job Disapprove 62% (535) 30% (258) 6% (52) 1% (11) 857Biden Job Strongly Approve 22% (121) 69% (381) 6% (31) 3% (15) 548Biden Job Somewhat Approve 24% (117) 64% (311) 11% (56) 1% (5) 489Biden Job Somewhat Disapprove 51% (113) 39% (87) 7% (16) 3% (7) 223Biden Job Strongly Disapprove 67% (422) 27% (171) 6% (37) 1% (4) 634
Continued on next page
Page 321
National Tracking Poll #210636, June, 2021
321
Table POLx_4
Table POLx_4: Favorability forMike Pence
Demographic Total Favorable Total UnfavorableHeard Of, NoOpinion Never Heard Of Total N
Registered Voters 40% (790) 49% (971) 9% (183) 2% (46) 1990Favorable of Biden 23% (243) 67% (701) 8% (85) 2% (19) 1048Unfavorable of Biden 63% (538) 30% (253) 6% (51) 2% (13) 855Very Favorable of Biden 20% (116) 73% (433) 6% (33) 2% (10) 593Somewhat Favorable of Biden 28% (127) 59% (268) 11% (51) 2% (9) 455Somewhat Unfavorable of Biden 51% (96) 37% (70) 9% (17) 4% (8) 190Very Unfavorable of Biden 66% (441) 28% (183) 5% (34) 1% (5) 664#1 Issue: Economy 40% (308) 46% (353) 11% (84) 2% (18) 763#1 Issue: Security 63% (222) 30% (104) 6% (20) 1% (3) 349#1 Issue: Health Care 29% (67) 61% (142) 6% (14) 4% (9) 233#1 Issue: Medicare / Social Security 37% (96) 53% (138) 10% (25) — (1) 261#1 Issue: Women’s Issues 12% (12) 68% (70) 13% (13) 7% (7) 103#1 Issue: Education 32% (28) 51% (44) 11% (10) 5% (4) 86#1 Issue: Energy 29% (25) 61% (53) 8% (6) 2% (2) 86#1 Issue: Other 28% (31) 61% (67) 9% (10) 1% (1) 1092020 Vote: Joe Biden 17% (149) 74% (664) 7% (62) 2% (21) 8972020 Vote: Donald Trump 69% (561) 24% (199) 6% (45) 2% (13) 8182020 Vote: Didn’t Vote 29% (70) 37% (87) 30% (71) 4% (11) 2392018 House Vote: Democrat 17% (119) 76% (519) 6% (40) 1% (8) 6872018 House Vote: Republican 69% (478) 26% (178) 3% (22) 2% (13) 6902018 House Vote: Someone else 21% (10) 48% (24) 28% (14) 3% (2) 502016 Vote: Hillary Clinton 16% (100) 76% (479) 7% (45) 1% (7) 6312016 Vote: Donald Trump 69% (527) 27% (204) 3% (24) 2% (12) 7682016 Vote: Other 32% (34) 58% (62) 10% (10) 1% (1) 1072016 Vote: Didn’t Vote 26% (128) 47% (226) 21% (104) 5% (26) 483Voted in 2014: Yes 44% (569) 49% (637) 5% (71) 2% (20) 1297Voted in 2014: No 32% (221) 48% (334) 16% (112) 4% (26) 6934-Region: Northeast 36% (123) 53% (182) 8% (27) 4% (13) 3444-Region: Midwest 41% (186) 52% (237) 7% (31) — (1) 4554-Region: South 44% (334) 43% (324) 10% (77) 3% (21) 7554-Region: West 34% (147) 53% (228) 11% (49) 2% (11) 435
Continued on next page
Page 322
322
Morning ConsultTable POLx_4
Table POLx_4: Favorability forMike Pence
Demographic Total Favorable Total UnfavorableHeard Of, NoOpinion Never Heard Of Total N
Registered Voters 40% (790) 49% (971) 9% (183) 2% (46) 1990Party: Democrat/Leans Democrat 17% (148) 73% (648) 8% (70) 2% (22) 888Party: Republican/Leans Republican 68% (551) 25% (202) 6% (51) 1% (10) 814Note: Row proportions may total to larger than one-hundred percent due to rounding. For more information visit MorningConsultIntelligence.com.
Page 323
National Tracking Poll #210636, June, 2021
323
Table POLx_5
Table POLx_5: Favorability forDonald Trump
Demographic Total Favorable Total UnfavorableHeard Of, NoOpinion Never Heard Of Total N
Registered Voters 42% (831) 55% (1088) 3% (55) 1% (15) 1990Gender: Male 42% (393) 55% (507) 2% (20) 1% (7) 927Gender: Female 41% (438) 55% (581) 3% (36) 1% (8) 1063Age: 18-34 34% (156) 57% (259) 7% (31) 2% (11) 456Age: 35-44 47% (140) 50% (149) 3% (8) 1% (3) 300Age: 45-64 47% (343) 52% (376) 1% (10) — (1) 730Age: 65+ 38% (193) 60% (304) 1% (7) — (0) 504GenZers: 1997-2012 26% (44) 64% (109) 8% (13) 2% (3) 169Millennials: 1981-1996 44% (211) 49% (236) 5% (23) 2% (9) 480GenXers: 1965-1980 43% (225) 55% (289) 2% (8) — (2) 525Baby Boomers: 1946-1964 43% (319) 56% (416) 1% (10) — (0) 746PID: Dem (no lean) 8% (57) 90% (677) 1% (9) 1% (9) 752PID: Ind (no lean) 38% (221) 54% (314) 7% (38) 1% (5) 578PID: Rep (no lean) 84% (553) 15% (98) 1% (8) — (2) 661PID/Gender: DemMen 11% (39) 86% (308) 2% (7) 1% (5) 359PID/Gender: DemWomen 4% (18) 94% (369) 1% (3) 1% (3) 393PID/Gender: Ind Men 42% (112) 54% (145) 4% (10) — (0) 267PID/Gender: Ind Women 35% (109) 54% (168) 9% (28) 2% (5) 311PID/Gender: Rep Men 80% (242) 18% (54) 1% (3) 1% (2) 301PID/Gender: Rep Women 86% (311) 12% (44) 1% (5) — (0) 360Ideo: Liberal (1-3) 11% (65) 86% (504) 2% (11) 1% (8) 587Ideo: Moderate (4) 29% (158) 67% (362) 3% (18) — (1) 539Ideo: Conservative (5-7) 76% (566) 23% (167) 1% (7) — (2) 742Educ: < College 44% (539) 51% (623) 3% (41) 1% (9) 1213Educ: Bachelors degree 36% (176) 61% (298) 2% (10) 1% (5) 489Educ: Post-grad 40% (116) 58% (167) 2% (5) — (1) 288Income: Under 50k 40% (397) 56% (550) 4% (36) 1% (8) 991Income: 50k-100k 43% (275) 54% (347) 2% (13) 1% (4) 640Income: 100k+ 44% (159) 53% (191) 2% (7) 1% (3) 359Ethnicity: White 48% (756) 50% (791) 2% (30) 1% (8) 1584Ethnicity: Hispanic 24% (47) 70% (138) 5% (10) — (0) 196
Continued on next page
Page 324
324
Morning ConsultTable POLx_5
Table POLx_5: Favorability forDonald Trump
Demographic Total Favorable Total UnfavorableHeard Of, NoOpinion Never Heard Of Total N
Registered Voters 42% (831) 55% (1088) 3% (55) 1% (15) 1990Ethnicity: Black 12% (29) 79% (192) 7% (16) 2% (6) 243Ethnicity: Other 29% (47) 65% (106) 6% (10) 1% (1) 163All Christian 50% (479) 49% (470) 1% (14) — (1) 964All Non-Christian 29% (36) 63% (76) 4% (5) 3% (4) 121Atheist 19% (14) 79% (58) 2% (1) — (0) 73Agnostic/Nothing in particular 30% (147) 64% (318) 4% (22) 2% (8) 495Something Else 46% (156) 49% (166) 4% (12) 1% (2) 337Religious Non-Protestant/Catholic 34% (48) 59% (83) 4% (5) 3% (4) 140Evangelical 61% (332) 38% (206) 1% (8) — (1) 547Non-Evangelical 40% (288) 57% (412) 3% (19) — (2) 721Community: Urban 31% (166) 65% (342) 3% (16) 1% (5) 529Community: Suburban 41% (413) 56% (554) 2% (24) 1% (7) 998Community: Rural 54% (252) 41% (192) 4% (16) 1% (3) 464Employ: Private Sector 44% (271) 53% (330) 3% (18) — (3) 622Employ: Government 49% (62) 48% (62) 3% (4) — (0) 129Employ: Self-Employed 43% (67) 51% (81) 2% (3) 4% (7) 157Employ: Homemaker 50% (63) 47% (59) 3% (4) 1% (1) 127Employ: Retired 42% (243) 57% (330) 1% (9) — (0) 581Employ: Unemployed 32% (68) 63% (135) 5% (11) 1% (2) 215Employ: Other 39% (44) 54% (61) 4% (5) 3% (3) 113Military HH: Yes 51% (184) 46% (167) 2% (9) — (1) 361Military HH: No 40% (647) 57% (921) 3% (47) 1% (14) 1629RD/WT: Right Direction 14% (131) 83% (777) 3% (26) 1% (7) 941RD/WT: Wrong Track 67% (700) 30% (312) 3% (30) 1% (8) 1049Biden Job Approve 12% (126) 85% (886) 2% (17) 1% (8) 1037Biden Job Disapprove 79% (680) 19% (165) 1% (8) — (4) 857Biden Job Strongly Approve 9% (52) 88% (480) 2% (10) 1% (6) 548Biden Job Somewhat Approve 15% (74) 83% (406) 2% (8) — (2) 489Biden Job Somewhat Disapprove 50% (112) 45% (100) 3% (7) 2% (4) 223Biden Job Strongly Disapprove 90% (569) 10% (64) — (1) — (0) 634
Continued on next page
Page 325
National Tracking Poll #210636, June, 2021
325
Table POLx_5
Table POLx_5: Favorability forDonald Trump
Demographic Total Favorable Total UnfavorableHeard Of, NoOpinion Never Heard Of Total N
Registered Voters 42% (831) 55% (1088) 3% (55) 1% (15) 1990Favorable of Biden 12% (128) 86% (901) 1% (11) 1% (8) 1048Unfavorable of Biden 80% (684) 19% (162) 1% (5) — (4) 855Very Favorable of Biden 9% (52) 89% (527) 1% (8) 1% (6) 593Somewhat Favorable of Biden 17% (76) 82% (374) 1% (3) — (2) 455Somewhat Unfavorable of Biden 48% (91) 49% (93) 2% (3) 2% (4) 190Very Unfavorable of Biden 89% (593) 11% (70) — (1) — (0) 664#1 Issue: Economy 44% (337) 51% (392) 4% (28) 1% (6) 763#1 Issue: Security 72% (251) 27% (95) 1% (3) — (0) 349#1 Issue: Health Care 25% (59) 70% (162) 3% (8) 2% (4) 233#1 Issue: Medicare / Social Security 32% (85) 65% (170) 2% (6) — (1) 261#1 Issue: Women’s Issues 17% (17) 73% (75) 7% (7) 3% (3) 103#1 Issue: Education 27% (23) 71% (61) 2% (2) — (0) 86#1 Issue: Energy 27% (23) 73% (62) — (0) 1% (1) 86#1 Issue: Other 33% (36) 64% (70) 2% (2) — (0) 1092020 Vote: Joe Biden 6% (52) 92% (824) 1% (13) 1% (9) 8972020 Vote: Donald Trump 85% (697) 14% (111) 1% (9) — (2) 8182020 Vote: Didn’t Vote 32% (76) 53% (128) 13% (31) 2% (4) 2392018 House Vote: Democrat 7% (46) 91% (627) 1% (8) 1% (6) 6872018 House Vote: Republican 82% (563) 17% (118) 1% (9) — (0) 6902018 House Vote: Someone else 27% (13) 65% (33) 8% (4) — (0) 502016 Vote: Hillary Clinton 6% (35) 92% (578) 2% (12) 1% (6) 6312016 Vote: Donald Trump 81% (620) 18% (136) 1% (9) — (2) 7682016 Vote: Other 18% (19) 81% (87) 1% (2) — (0) 1072016 Vote: Didn’t Vote 32% (156) 59% (287) 7% (33) 1% (7) 483Voted in 2014: Yes 44% (565) 54% (706) 2% (20) 1% (7) 1297Voted in 2014: No 38% (267) 55% (382) 5% (36) 1% (8) 6934-Region: Northeast 36% (124) 60% (208) 2% (7) 2% (5) 3444-Region: Midwest 43% (195) 55% (252) 1% (6) 1% (3) 4554-Region: South 46% (349) 50% (376) 3% (24) 1% (7) 7554-Region: West 38% (163) 58% (253) 4% (19) — (0) 435
Continued on next page
Page 326
326
Morning ConsultTable POLx_5
Table POLx_5: Favorability forDonald Trump
Demographic Total Favorable Total UnfavorableHeard Of, NoOpinion Never Heard Of Total N
Registered Voters 42% (831) 55% (1088) 3% (55) 1% (15) 1990Party: Democrat/Leans Democrat 7% (65) 90% (801) 2% (14) 1% (9) 888Party: Republican/Leans Republican 82% (668) 16% (132) 1% (11) — (2) 814Note: Row proportions may total to larger than one-hundred percent due to rounding. For more information visit MorningConsultIntelligence.com.
Page 327
National Tracking Poll #210636, June, 2021
327
Table POLx_6
Table POLx_6: Favorability forRepublicans in Congress
Demographic Total Favorable Total UnfavorableHeard Of, NoOpinion Never Heard Of Total N
Registered Voters 36% (718) 55% (1101) 7% (134) 2% (36) 1990Gender: Male 37% (339) 57% (529) 5% (44) 2% (15) 927Gender: Female 36% (380) 54% (572) 8% (90) 2% (21) 1063Age: 18-34 28% (126) 53% (240) 14% (63) 6% (26) 456Age: 35-44 39% (118) 50% (150) 10% (29) 1% (3) 300Age: 45-64 42% (304) 53% (384) 5% (35) 1% (7) 730Age: 65+ 34% (171) 65% (326) 1% (7) — (0) 504GenZers: 1997-2012 23% (39) 54% (91) 18% (30) 6% (10) 169Millennials: 1981-1996 35% (170) 49% (236) 11% (53) 4% (20) 480GenXers: 1965-1980 37% (196) 55% (289) 6% (34) 1% (7) 525Baby Boomers: 1946-1964 38% (285) 60% (445) 2% (16) — (0) 746PID: Dem (no lean) 10% (73) 84% (635) 3% (25) 2% (18) 752PID: Ind (no lean) 27% (156) 56% (323) 15% (87) 2% (12) 578PID: Rep (no lean) 74% (489) 22% (143) 3% (22) 1% (6) 661PID/Gender: DemMen 14% (50) 80% (288) 3% (12) 3% (9) 359PID/Gender: DemWomen 6% (23) 88% (347) 3% (13) 2% (9) 393PID/Gender: Ind Men 31% (83) 59% (159) 8% (23) 1% (2) 267PID/Gender: Ind Women 23% (73) 53% (164) 21% (65) 3% (9) 311PID/Gender: Rep Men 68% (205) 27% (82) 3% (9) 1% (4) 301PID/Gender: Rep Women 79% (284) 17% (61) 3% (12) 1% (3) 360Ideo: Liberal (1-3) 12% (73) 83% (488) 3% (18) 1% (9) 587Ideo: Moderate (4) 26% (139) 63% (342) 10% (52) 1% (5) 539Ideo: Conservative (5-7) 64% (474) 31% (233) 3% (25) 1% (10) 742Educ: < College 38% (461) 52% (626) 8% (101) 2% (25) 1213Educ: Bachelors degree 32% (157) 61% (298) 5% (25) 2% (10) 489Educ: Post-grad 35% (100) 61% (177) 3% (8) 1% (2) 288Income: Under 50k 34% (339) 55% (550) 8% (78) 2% (23) 991Income: 50k-100k 37% (238) 55% (351) 6% (41) 2% (10) 640Income: 100k+ 39% (141) 56% (200) 4% (15) 1% (3) 359Ethnicity: White 41% (652) 52% (823) 6% (88) 1% (21) 1584Ethnicity: Hispanic 23% (45) 66% (129) 9% (17) 2% (4) 196
Continued on next page
Page 328
328
Morning ConsultTable POLx_6
Table POLx_6: Favorability forRepublicans in Congress
Demographic Total Favorable Total UnfavorableHeard Of, NoOpinion Never Heard Of Total N
Registered Voters 36% (718) 55% (1101) 7% (134) 2% (36) 1990Ethnicity: Black 14% (35) 73% (178) 9% (22) 3% (8) 243Ethnicity: Other 19% (32) 61% (100) 15% (24) 4% (7) 163All Christian 44% (427) 52% (497) 3% (34) 1% (7) 964All Non-Christian 23% (28) 64% (78) 7% (8) 6% (8) 121Atheist 19% (14) 72% (53) 8% (6) 1% (1) 73Agnostic/Nothing in particular 24% (121) 62% (307) 12% (58) 2% (10) 495Something Else 38% (129) 50% (167) 9% (29) 3% (12) 337Religious Non-Protestant/Catholic 29% (41) 59% (83) 7% (9) 5% (8) 140Evangelical 52% (286) 43% (233) 4% (21) 1% (7) 547Non-Evangelical 35% (254) 58% (416) 5% (39) 2% (11) 721Community: Urban 28% (149) 63% (333) 6% (34) 2% (12) 529Community: Suburban 36% (361) 55% (553) 6% (65) 2% (19) 998Community: Rural 45% (208) 46% (214) 8% (36) 1% (5) 464Employ: Private Sector 36% (222) 55% (341) 8% (49) 2% (10) 622Employ: Government 42% (54) 50% (64) 7% (9) 1% (1) 129Employ: Self-Employed 33% (52) 58% (91) 5% (7) 4% (7) 157Employ: Homemaker 49% (62) 40% (51) 10% (13) 1% (1) 127Employ: Retired 38% (223) 59% (344) 2% (14) — (1) 581Employ: Unemployed 25% (54) 60% (130) 9% (19) 6% (13) 215Employ: Other 35% (39) 46% (52) 16% (19) 3% (4) 113Military HH: Yes 44% (159) 51% (186) 4% (16) — (1) 361Military HH: No 34% (560) 56% (915) 7% (118) 2% (35) 1629RD/WT: Right Direction 17% (159) 75% (702) 6% (60) 2% (20) 941RD/WT: Wrong Track 53% (560) 38% (399) 7% (74) 2% (16) 1049Biden Job Approve 16% (167) 78% (805) 5% (50) 1% (15) 1037Biden Job Disapprove 62% (535) 32% (275) 5% (40) 1% (7) 857Biden Job Strongly Approve 13% (72) 82% (449) 3% (18) 2% (10) 548Biden Job Somewhat Approve 20% (96) 73% (357) 6% (32) 1% (5) 489Biden Job Somewhat Disapprove 42% (94) 45% (101) 10% (23) 2% (5) 223Biden Job Strongly Disapprove 70% (441) 27% (174) 3% (17) — (2) 634
Continued on next page
Page 329
National Tracking Poll #210636, June, 2021
329
Table POLx_6
Table POLx_6: Favorability forRepublicans in Congress
Demographic Total Favorable Total UnfavorableHeard Of, NoOpinion Never Heard Of Total N
Registered Voters 36% (718) 55% (1101) 7% (134) 2% (36) 1990Favorable of Biden 16% (169) 77% (811) 5% (51) 2% (17) 1048Unfavorable of Biden 63% (539) 31% (268) 5% (39) 1% (8) 855Very Favorable of Biden 12% (72) 84% (496) 3% (16) 1% (9) 593Somewhat Favorable of Biden 21% (97) 69% (314) 8% (36) 2% (9) 455Somewhat Unfavorable of Biden 40% (75) 47% (90) 10% (19) 3% (6) 190Very Unfavorable of Biden 70% (464) 27% (179) 3% (19) — (2) 664#1 Issue: Economy 38% (290) 52% (398) 8% (64) 2% (12) 763#1 Issue: Security 59% (208) 34% (119) 5% (17) 2% (6) 349#1 Issue: Health Care 27% (64) 65% (150) 6% (14) 2% (5) 233#1 Issue: Medicare / Social Security 33% (86) 63% (163) 4% (10) 1% (2) 261#1 Issue: Women’s Issues 8% (9) 75% (77) 11% (12) 5% (5) 103#1 Issue: Education 27% (23) 60% (51) 8% (7) 5% (4) 86#1 Issue: Energy 19% (16) 73% (62) 6% (6) 2% (2) 86#1 Issue: Other 22% (23) 73% (80) 4% (4) 1% (1) 1092020 Vote: Joe Biden 10% (93) 84% (752) 4% (37) 2% (15) 8972020 Vote: Donald Trump 69% (563) 25% (209) 5% (38) 1% (9) 8182020 Vote: Didn’t Vote 22% (53) 50% (120) 23% (55) 5% (12) 2392018 House Vote: Democrat 9% (63) 86% (593) 4% (24) 1% (7) 6872018 House Vote: Republican 70% (486) 26% (181) 2% (17) 1% (5) 6902018 House Vote: Someone else 11% (5) 69% (35) 16% (8) 4% (2) 502016 Vote: Hillary Clinton 9% (56) 86% (540) 5% (29) 1% (7) 6312016 Vote: Donald Trump 66% (508) 30% (229) 3% (25) 1% (6) 7682016 Vote: Other 24% (26) 74% (80) 1% (1) — (0) 1072016 Vote: Didn’t Vote 26% (128) 52% (253) 16% (79) 5% (23) 483Voted in 2014: Yes 39% (501) 57% (743) 3% (41) 1% (12) 1297Voted in 2014: No 31% (217) 52% (358) 13% (93) 4% (25) 6934-Region: Northeast 31% (105) 60% (208) 6% (22) 3% (9) 3444-Region: Midwest 37% (168) 58% (262) 5% (24) — (1) 4554-Region: South 43% (323) 47% (357) 7% (56) 3% (19) 7554-Region: West 28% (123) 63% (274) 7% (32) 2% (7) 435
Continued on next page
Page 330
330
Morning ConsultTable POLx_6
Table POLx_6: Favorability forRepublicans in Congress
Demographic Total Favorable Total UnfavorableHeard Of, NoOpinion Never Heard Of Total N
Registered Voters 36% (718) 55% (1101) 7% (134) 2% (36) 1990Party: Democrat/Leans Democrat 9% (83) 85% (753) 4% (34) 2% (18) 888Party: Republican/Leans Republican 71% (577) 24% (198) 4% (31) 1% (7) 814Note: Row proportions may total to larger than one-hundred percent due to rounding. For more information visit MorningConsultIntelligence.com.
Page 331
National Tracking Poll #210636, June, 2021
331
Table POLx_7
Table POLx_7: Favorability forDemocrats in Congress
Demographic Total Favorable Total UnfavorableHeard Of, NoOpinion Never Heard Of Total N
Registered Voters 45% (887) 47% (944) 6% (129) 2% (30) 1990Gender: Male 46% (422) 49% (452) 4% (41) 1% (13) 927Gender: Female 44% (465) 46% (492) 8% (88) 2% (18) 1063Age: 18-34 49% (222) 33% (152) 14% (63) 4% (19) 456Age: 35-44 49% (146) 41% (123) 9% (27) 1% (4) 300Age: 45-64 40% (294) 55% (401) 4% (28) 1% (7) 730Age: 65+ 45% (226) 53% (268) 2% (10) — (0) 504GenZers: 1997-2012 45% (77) 33% (55) 18% (31) 4% (7) 169Millennials: 1981-1996 50% (238) 36% (172) 11% (53) 3% (17) 480GenXers: 1965-1980 45% (234) 48% (255) 6% (29) 1% (7) 525Baby Boomers: 1946-1964 42% (314) 56% (418) 2% (14) — (0) 746PID: Dem (no lean) 85% (642) 11% (86) 2% (15) 1% (9) 752PID: Ind (no lean) 32% (185) 52% (299) 14% (83) 2% (11) 578PID: Rep (no lean) 9% (61) 85% (559) 5% (31) 2% (10) 661PID/Gender: DemMen 85% (304) 12% (41) 2% (8) 2% (6) 359PID/Gender: DemWomen 86% (338) 11% (44) 2% (8) 1% (3) 393PID/Gender: Ind Men 34% (90) 57% (153) 8% (22) 1% (2) 267PID/Gender: Ind Women 31% (95) 47% (145) 20% (61) 3% (9) 311PID/Gender: Rep Men 9% (28) 85% (257) 4% (12) 1% (4) 301PID/Gender: Rep Women 9% (32) 84% (302) 5% (19) 2% (6) 360Ideo: Liberal (1-3) 78% (460) 17% (98) 4% (24) 1% (5) 587Ideo: Moderate (4) 52% (281) 39% (212) 8% (41) 1% (5) 539Ideo: Conservative (5-7) 15% (112) 80% (594) 3% (25) 2% (12) 742Educ: < College 41% (493) 49% (600) 8% (98) 2% (22) 1213Educ: Bachelors degree 49% (241) 45% (218) 5% (23) 1% (7) 489Educ: Post-grad 53% (153) 44% (126) 3% (7) 1% (1) 288Income: Under 50k 45% (448) 45% (443) 8% (79) 2% (20) 991Income: 50k-100k 43% (276) 50% (318) 6% (38) 1% (9) 640Income: 100k+ 46% (164) 51% (183) 3% (11) — (1) 359Ethnicity: White 40% (630) 53% (842) 6% (89) 2% (24) 1584Ethnicity: Hispanic 55% (107) 33% (64) 12% (23) 1% (2) 196
Continued on next page
Page 332
332
Morning ConsultTable POLx_7
Table POLx_7: Favorability forDemocrats in Congress
Demographic Total Favorable Total UnfavorableHeard Of, NoOpinion Never Heard Of Total N
Registered Voters 45% (887) 47% (944) 6% (129) 2% (30) 1990Ethnicity: Black 71% (171) 20% (48) 9% (22) 1% (2) 243Ethnicity: Other 53% (86) 33% (54) 11% (18) 3% (5) 163All Christian 40% (382) 57% (545) 3% (32) — (5) 964All Non-Christian 68% (83) 21% (25) 6% (8) 4% (5) 121Atheist 60% (44) 37% (27) 2% (1) 1% (1) 73Agnostic/Nothing in particular 49% (241) 40% (196) 11% (53) 1% (5) 495Something Else 41% (138) 45% (150) 10% (34) 4% (15) 337Religious Non-Protestant/Catholic 61% (86) 29% (40) 6% (9) 4% (5) 140Evangelical 35% (194) 59% (322) 4% (21) 2% (10) 547Non-Evangelical 44% (314) 49% (353) 6% (45) 1% (9) 721Community: Urban 61% (322) 32% (171) 5% (28) 1% (8) 529Community: Suburban 42% (421) 50% (501) 7% (65) 1% (11) 998Community: Rural 31% (144) 59% (272) 8% (35) 3% (12) 464Employ: Private Sector 47% (290) 45% (282) 7% (42) 1% (8) 622Employ: Government 48% (62) 42% (54) 7% (9) 2% (3) 129Employ: Self-Employed 45% (70) 46% (73) 6% (9) 3% (5) 157Employ: Homemaker 38% (49) 52% (66) 9% (11) 1% (1) 127Employ: Retired 41% (241) 56% (324) 2% (14) — (2) 581Employ: Unemployed 47% (100) 40% (86) 10% (22) 3% (7) 215Employ: Other 48% (54) 33% (37) 16% (19) 3% (4) 113Military HH: Yes 36% (130) 60% (215) 4% (15) — (1) 361Military HH: No 47% (758) 45% (729) 7% (113) 2% (29) 1629RD/WT: Right Direction 77% (726) 16% (153) 5% (50) 1% (13) 941RD/WT: Wrong Track 15% (162) 75% (791) 8% (79) 2% (17) 1049Biden Job Approve 78% (811) 17% (178) 3% (36) 1% (13) 1037Biden Job Disapprove 7% (60) 87% (742) 5% (43) 1% (12) 857Biden Job Strongly Approve 91% (496) 6% (34) 2% (11) 1% (7) 548Biden Job Somewhat Approve 64% (314) 29% (144) 5% (25) 1% (6) 489Biden Job Somewhat Disapprove 16% (35) 71% (159) 10% (22) 3% (7) 223Biden Job Strongly Disapprove 4% (25) 92% (583) 3% (21) 1% (5) 634
Continued on next page
Page 333
National Tracking Poll #210636, June, 2021
333
Table POLx_7
Table POLx_7: Favorability forDemocrats in Congress
Demographic Total Favorable Total UnfavorableHeard Of, NoOpinion Never Heard Of Total N
Registered Voters 45% (887) 47% (944) 6% (129) 2% (30) 1990Favorable of Biden 79% (829) 16% (171) 4% (38) 1% (10) 1048Unfavorable of Biden 5% (44) 89% (758) 5% (46) 1% (8) 855Very Favorable of Biden 93% (551) 5% (32) 1% (8) — (2) 593Somewhat Favorable of Biden 61% (278) 31% (139) 7% (30) 2% (8) 455Somewhat Unfavorable of Biden 12% (24) 73% (138) 13% (25) 2% (3) 190Very Unfavorable of Biden 3% (20) 93% (619) 3% (20) 1% (5) 664#1 Issue: Economy 39% (299) 52% (394) 8% (63) 1% (8) 763#1 Issue: Security 22% (77) 72% (250) 5% (18) 1% (4) 349#1 Issue: Health Care 63% (146) 31% (72) 5% (12) 1% (3) 233#1 Issue: Medicare / Social Security 56% (145) 41% (107) 3% (8) — (1) 261#1 Issue: Women’s Issues 64% (66) 20% (21) 11% (11) 5% (5) 103#1 Issue: Education 58% (50) 25% (22) 9% (8) 7% (6) 86#1 Issue: Energy 59% (51) 32% (27) 7% (6) 2% (2) 86#1 Issue: Other 49% (53) 47% (51) 3% (3) 1% (1) 1092020 Vote: Joe Biden 81% (729) 15% (135) 3% (28) 1% (6) 8972020 Vote: Donald Trump 8% (64) 86% (700) 5% (41) 2% (13) 8182020 Vote: Didn’t Vote 36% (86) 36% (87) 24% (57) 4% (10) 2392018 House Vote: Democrat 83% (569) 15% (104) 2% (13) — (1) 6872018 House Vote: Republican 10% (70) 85% (586) 3% (22) 2% (12) 6902018 House Vote: Someone else 26% (13) 55% (27) 15% (7) 4% (2) 502016 Vote: Hillary Clinton 84% (530) 13% (80) 3% (19) — (1) 6312016 Vote: Donald Trump 12% (91) 83% (635) 4% (31) 1% (10) 7682016 Vote: Other 48% (51) 51% (55) 1% (1) — (0) 1072016 Vote: Didn’t Vote 44% (215) 36% (174) 16% (77) 4% (18) 483Voted in 2014: Yes 47% (606) 50% (648) 3% (33) 1% (11) 1297Voted in 2014: No 41% (282) 43% (296) 14% (95) 3% (19) 6934-Region: Northeast 53% (181) 41% (140) 6% (19) 1% (4) 3444-Region: Midwest 46% (211) 48% (217) 5% (23) 1% (5) 4554-Region: South 40% (304) 51% (382) 7% (53) 2% (16) 7554-Region: West 44% (191) 47% (204) 8% (34) 1% (6) 435
Continued on next page
Page 334
334
Morning ConsultTable POLx_7
Table POLx_7: Favorability forDemocrats in Congress
Demographic Total Favorable Total UnfavorableHeard Of, NoOpinion Never Heard Of Total N
Registered Voters 45% (887) 47% (944) 6% (129) 2% (30) 1990Party: Democrat/Leans Democrat 84% (746) 13% (112) 2% (21) 1% (9) 888Party: Republican/Leans Republican 9% (71) 85% (691) 5% (39) 2% (12) 814Note: Row proportions may total to larger than one-hundred percent due to rounding. For more information visit MorningConsultIntelligence.com.
Page 335
National Tracking Poll #210636, June, 2021
335
Table POLx_9
Table POLx_9: Favorability forKevin McCarthy
Demographic Total Favorable Total UnfavorableHeard Of, NoOpinion Never Heard Of Total N
Registered Voters 23% (459) 37% (732) 26% (512) 14% (286) 1990Gender: Male 30% (274) 42% (385) 18% (169) 11% (98) 927Gender: Female 17% (185) 33% (347) 32% (343) 18% (188) 1063Age: 18-34 16% (72) 26% (120) 30% (136) 28% (128) 456Age: 35-44 21% (62) 29% (86) 28% (85) 22% (67) 300Age: 45-64 23% (170) 40% (291) 27% (194) 10% (75) 730Age: 65+ 31% (155) 47% (235) 19% (97) 3% (17) 504GenZers: 1997-2012 9% (15) 21% (36) 37% (63) 33% (56) 169Millennials: 1981-1996 20% (95) 29% (140) 27% (131) 24% (114) 480GenXers: 1965-1980 21% (108) 35% (184) 29% (151) 16% (82) 525Baby Boomers: 1946-1964 29% (215) 46% (344) 21% (157) 4% (30) 746PID: Dem (no lean) 14% (107) 47% (357) 24% (179) 14% (108) 752PID: Ind (no lean) 17% (96) 38% (217) 28% (161) 18% (104) 578PID: Rep (no lean) 39% (256) 24% (158) 26% (172) 11% (74) 661PID/Gender: DemMen 21% (75) 50% (179) 17% (61) 12% (44) 359PID/Gender: DemWomen 8% (32) 45% (178) 30% (119) 16% (64) 393PID/Gender: Ind Men 23% (62) 45% (120) 21% (56) 11% (29) 267PID/Gender: Ind Women 11% (34) 31% (97) 34% (104) 24% (76) 311PID/Gender: Rep Men 45% (137) 29% (86) 17% (52) 9% (26) 301PID/Gender: Rep Women 33% (119) 20% (72) 33% (120) 13% (48) 360Ideo: Liberal (1-3) 12% (71) 54% (319) 19% (112) 15% (85) 587Ideo: Moderate (4) 14% (73) 39% (211) 32% (172) 15% (83) 539Ideo: Conservative (5-7) 41% (307) 25% (184) 23% (172) 11% (78) 742Educ: < College 21% (253) 32% (391) 30% (362) 17% (207) 1213Educ: Bachelors degree 25% (120) 45% (219) 20% (97) 11% (53) 489Educ: Post-grad 30% (86) 42% (122) 18% (53) 9% (27) 288Income: Under 50k 20% (195) 34% (335) 30% (296) 17% (165) 991Income: 50k-100k 26% (164) 39% (252) 23% (145) 12% (79) 640Income: 100k+ 28% (99) 40% (145) 20% (72) 12% (43) 359Ethnicity: White 25% (402) 37% (581) 25% (393) 13% (209) 1584Ethnicity: Hispanic 19% (37) 33% (65) 31% (60) 17% (34) 196
Continued on next page
Page 336
336
Morning ConsultTable POLx_9
Table POLx_9: Favorability forKevin McCarthy
Demographic Total Favorable Total UnfavorableHeard Of, NoOpinion Never Heard Of Total N
Registered Voters 23% (459) 37% (732) 26% (512) 14% (286) 1990Ethnicity: Black 14% (34) 38% (93) 33% (79) 15% (37) 243Ethnicity: Other 14% (23) 36% (59) 25% (41) 25% (40) 163All Christian 33% (320) 35% (339) 23% (219) 9% (85) 964All Non-Christian 23% (28) 44% (54) 19% (23) 13% (16) 121Atheist 14% (10) 49% (36) 25% (19) 11% (8) 73Agnostic/Nothing in particular 10% (52) 43% (215) 30% (148) 16% (81) 495Something Else 14% (48) 26% (89) 31% (103) 29% (97) 337Religious Non-Protestant/Catholic 22% (30) 41% (58) 22% (31) 16% (22) 140Evangelical 34% (186) 24% (133) 29% (159) 13% (69) 547Non-Evangelical 24% (174) 40% (289) 21% (154) 15% (105) 721Community: Urban 24% (127) 39% (208) 22% (118) 14% (76) 529Community: Suburban 23% (229) 38% (381) 25% (250) 14% (137) 998Community: Rural 22% (103) 31% (143) 31% (144) 16% (73) 464Employ: Private Sector 22% (136) 36% (225) 24% (152) 17% (108) 622Employ: Government 24% (31) 38% (49) 26% (33) 12% (16) 129Employ: Self-Employed 24% (37) 38% (60) 22% (35) 15% (24) 157Employ: Homemaker 22% (28) 20% (25) 37% (47) 21% (27) 127Employ: Retired 32% (185) 43% (249) 21% (121) 5% (27) 581Employ: Unemployed 11% (24) 36% (78) 34% (72) 19% (41) 215Employ: Other 11% (12) 29% (33) 34% (38) 26% (29) 113Military HH: Yes 33% (119) 35% (126) 23% (84) 9% (33) 361Military HH: No 21% (340) 37% (607) 26% (429) 16% (253) 1629RD/WT: Right Direction 15% (143) 47% (438) 24% (228) 14% (132) 941RD/WT: Wrong Track 30% (316) 28% (294) 27% (284) 15% (155) 1049Biden Job Approve 14% (150) 48% (501) 24% (247) 13% (139) 1037Biden Job Disapprove 36% (308) 26% (227) 25% (214) 13% (109) 857Biden Job Strongly Approve 16% (87) 55% (299) 20% (111) 9% (52) 548Biden Job Somewhat Approve 13% (63) 41% (202) 28% (136) 18% (88) 489Biden Job Somewhat Disapprove 20% (44) 32% (71) 29% (64) 20% (44) 223Biden Job Strongly Disapprove 42% (264) 25% (155) 24% (150) 10% (65) 634
Continued on next page
Page 337
National Tracking Poll #210636, June, 2021
337
Table POLx_9
Table POLx_9: Favorability forKevin McCarthy
Demographic Total Favorable Total UnfavorableHeard Of, NoOpinion Never Heard Of Total N
Registered Voters 23% (459) 37% (732) 26% (512) 14% (286) 1990Favorable of Biden 15% (158) 47% (496) 24% (249) 14% (146) 1048Unfavorable of Biden 35% (297) 27% (228) 25% (216) 13% (114) 855Very Favorable of Biden 16% (93) 55% (326) 19% (115) 10% (59) 593Somewhat Favorable of Biden 14% (65) 37% (170) 29% (133) 19% (87) 455Somewhat Unfavorable of Biden 17% (33) 33% (63) 27% (51) 23% (43) 190Very Unfavorable of Biden 40% (264) 25% (165) 25% (165) 11% (71) 664#1 Issue: Economy 21% (161) 34% (262) 28% (214) 17% (127) 763#1 Issue: Security 46% (159) 26% (90) 18% (64) 10% (36) 349#1 Issue: Health Care 17% (39) 45% (104) 24% (55) 15% (35) 233#1 Issue: Medicare / Social Security 18% (48) 48% (126) 26% (69) 7% (18) 261#1 Issue: Women’s Issues 7% (7) 36% (37) 32% (32) 26% (27) 103#1 Issue: Education 14% (12) 26% (22) 35% (30) 25% (21) 86#1 Issue: Energy 18% (16) 38% (33) 28% (24) 16% (14) 86#1 Issue: Other 16% (17) 54% (59) 22% (24) 8% (8) 1092020 Vote: Joe Biden 13% (115) 52% (466) 21% (193) 14% (124) 8972020 Vote: Donald Trump 38% (315) 24% (197) 26% (210) 12% (97) 8182020 Vote: Didn’t Vote 10% (25) 23% (54) 44% (105) 23% (56) 2392018 House Vote: Democrat 12% (83) 58% (397) 20% (137) 10% (71) 6872018 House Vote: Republican 42% (290) 26% (183) 23% (156) 9% (61) 6902018 House Vote: Someone else 10% (5) 34% (17) 28% (14) 29% (14) 502016 Vote: Hillary Clinton 12% (75) 57% (361) 22% (136) 9% (59) 6312016 Vote: Donald Trump 39% (300) 28% (214) 24% (183) 9% (70) 7682016 Vote: Other 16% (18) 40% (43) 22% (24) 21% (23) 1072016 Vote: Didn’t Vote 14% (65) 24% (114) 35% (169) 28% (135) 483Voted in 2014: Yes 27% (344) 43% (556) 22% (281) 9% (116) 1297Voted in 2014: No 17% (115) 25% (176) 33% (231) 25% (170) 6934-Region: Northeast 25% (86) 42% (146) 20% (69) 13% (43) 3444-Region: Midwest 19% (86) 40% (181) 30% (137) 11% (52) 4554-Region: South 26% (200) 30% (226) 26% (199) 17% (130) 7554-Region: West 20% (87) 41% (179) 25% (108) 14% (61) 435
Continued on next page
Page 338
338
Morning ConsultTable POLx_9
Table POLx_9: Favorability forKevin McCarthy
Demographic Total Favorable Total UnfavorableHeard Of, NoOpinion Never Heard Of Total N
Registered Voters 23% (459) 37% (732) 26% (512) 14% (286) 1990Party: Democrat/Leans Democrat 13% (118) 49% (434) 23% (207) 14% (129) 888Party: Republican/Leans Republican 37% (303) 25% (206) 26% (214) 11% (91) 814Note: Row proportions may total to larger than one-hundred percent due to rounding. For more information visit MorningConsultIntelligence.com.
Page 339
National Tracking Poll #210636, June, 2021
339
Table POLx_10
Table POLx_10: Favorability forJoe Biden
Demographic Total Favorable Total UnfavorableHeard Of, NoOpinion Never Heard Of Total N
Registered Voters 53% (1048) 43% (855) 4% (74) 1% (13) 1990Gender: Male 54% (500) 42% (394) 3% (24) 1% (9) 927Gender: Female 52% (548) 43% (461) 5% (50) — (4) 1063Age: 18-34 56% (255) 34% (153) 8% (38) 2% (10) 456Age: 35-44 56% (168) 41% (122) 3% (10) — (0) 300Age: 45-64 49% (361) 48% (349) 2% (17) — (3) 730Age: 65+ 52% (264) 46% (231) 2% (9) — (0) 504GenZers: 1997-2012 51% (86) 37% (62) 11% (18) 2% (3) 169Millennials: 1981-1996 57% (272) 36% (172) 6% (29) 1% (7) 480GenXers: 1965-1980 56% (292) 42% (221) 2% (9) 1% (3) 525Baby Boomers: 1946-1964 49% (367) 49% (362) 2% (17) — (0) 746PID: Dem (no lean) 92% (690) 7% (50) 1% (8) — (3) 752PID: Ind (no lean) 45% (263) 45% (259) 9% (52) 1% (4) 578PID: Rep (no lean) 14% (95) 83% (546) 2% (13) 1% (6) 661PID/Gender: DemMen 91% (327) 8% (27) 1% (2) 1% (2) 359PID/Gender: DemWomen 93% (363) 6% (23) 1% (6) — (1) 393PID/Gender: Ind Men 45% (120) 49% (131) 5% (13) 1% (3) 267PID/Gender: Ind Women 46% (143) 41% (127) 13% (39) — (1) 311PID/Gender: Rep Men 18% (54) 78% (235) 3% (8) 1% (4) 301PID/Gender: Rep Women 12% (42) 86% (311) 1% (5) 1% (2) 360Ideo: Liberal (1-3) 86% (503) 12% (72) 2% (10) — (2) 587Ideo: Moderate (4) 64% (345) 31% (169) 4% (21) 1% (4) 539Ideo: Conservative (5-7) 20% (148) 77% (572) 2% (16) 1% (6) 742Educ: < College 49% (591) 46% (556) 5% (59) 1% (7) 1213Educ: Bachelors degree 57% (278) 40% (196) 2% (9) 1% (6) 489Educ: Post-grad 62% (180) 36% (103) 2% (5) — (1) 288Income: Under 50k 53% (525) 41% (405) 5% (51) 1% (10) 991Income: 50k-100k 52% (336) 44% (283) 3% (19) — (2) 640Income: 100k+ 52% (187) 46% (166) 1% (4) — (2) 359Ethnicity: White 47% (747) 49% (782) 3% (43) 1% (12) 1584Ethnicity: Hispanic 63% (123) 28% (55) 7% (14) 1% (3) 196
Continued on next page
Page 340
340
Morning ConsultTable POLx_10
Table POLx_10: Favorability forJoe Biden
Demographic Total Favorable Total UnfavorableHeard Of, NoOpinion Never Heard Of Total N
Registered Voters 53% (1048) 43% (855) 4% (74) 1% (13) 1990Ethnicity: Black 83% (200) 12% (29) 6% (13) — (0) 243Ethnicity: Other 62% (101) 27% (44) 10% (17) 1% (1) 163All Christian 47% (450) 51% (487) 3% (24) — (2) 964All Non-Christian 69% (83) 23% (28) 5% (6) 4% (5) 121Atheist 75% (55) 25% (18) — (0) — (0) 73Agnostic/Nothing in particular 59% (294) 35% (174) 5% (26) — (1) 495Something Else 49% (166) 44% (148) 5% (17) 1% (5) 337Religious Non-Protestant/Catholic 65% (91) 28% (40) 4% (6) 3% (5) 140Evangelical 39% (212) 58% (316) 2% (14) 1% (6) 547Non-Evangelical 54% (387) 42% (304) 4% (28) — (1) 721Community: Urban 68% (360) 27% (144) 3% (15) 2% (9) 529Community: Suburban 50% (499) 47% (466) 3% (32) — (1) 998Community: Rural 41% (189) 53% (245) 6% (26) 1% (3) 464Employ: Private Sector 55% (343) 41% (255) 3% (19) 1% (5) 622Employ: Government 51% (66) 41% (53) 5% (6) 3% (4) 129Employ: Self-Employed 52% (82) 44% (69) 3% (5) 1% (1) 157Employ: Homemaker 41% (52) 55% (70) 4% (5) — (0) 127Employ: Retired 51% (296) 47% (272) 2% (12) — (2) 581Employ: Unemployed 55% (119) 37% (79) 8% (16) — (0) 215Employ: Other 56% (63) 35% (39) 8% (9) 1% (1) 113Military HH: Yes 41% (150) 55% (198) 2% (9) 1% (5) 361Military HH: No 55% (898) 40% (657) 4% (65) 1% (8) 1629RD/WT: Right Direction 91% (857) 5% (51) 3% (25) 1% (9) 941RD/WT: Wrong Track 18% (192) 77% (804) 5% (49) — (5) 1049Biden Job Approve 95% (986) 3% (35) 1% (10) 1% (6) 1037Biden Job Disapprove 5% (42) 93% (794) 2% (17) — (3) 857Biden Job Strongly Approve 97% (532) 1% (7) 1% (4) 1% (5) 548Biden Job Somewhat Approve 93% (455) 6% (27) 1% (6) — (1) 489Biden Job Somewhat Disapprove 13% (30) 82% (183) 4% (9) — (1) 223Biden Job Strongly Disapprove 2% (12) 96% (611) 1% (8) — (3) 634
Continued on next page
Page 341
National Tracking Poll #210636, June, 2021
341
Table POLx_10
Table POLx_10: Favorability forJoe Biden
Demographic Total Favorable Total UnfavorableHeard Of, NoOpinion Never Heard Of Total N
Registered Voters 53% (1048) 43% (855) 4% (74) 1% (13) 1990Favorable of Biden 100% (1048) — (0) — (0) — (0) 1048Unfavorable of Biden — (0) 100% (855) — (0) — (0) 855Very Favorable of Biden 100% (593) — (0) — (0) — (0) 593Somewhat Favorable of Biden 100% (455) — (0) — (0) — (0) 455Somewhat Unfavorable of Biden — (0) 100% (190) — (0) — (0) 190Very Unfavorable of Biden — (0) 100% (664) — (0) — (0) 664#1 Issue: Economy 46% (351) 48% (370) 5% (36) 1% (6) 763#1 Issue: Security 26% (92) 71% (247) 2% (8) 1% (2) 349#1 Issue: Health Care 74% (172) 24% (56) 1% (3) 1% (2) 233#1 Issue: Medicare / Social Security 65% (170) 31% (80) 3% (9) 1% (2) 261#1 Issue: Women’s Issues 70% (72) 21% (22) 8% (8) 1% (1) 103#1 Issue: Education 72% (61) 24% (21) 4% (4) — (0) 86#1 Issue: Energy 79% (68) 18% (16) 2% (2) 1% (1) 86#1 Issue: Other 57% (63) 40% (43) 3% (3) — (0) 1092020 Vote: Joe Biden 93% (839) 5% (46) 1% (10) — (3) 8972020 Vote: Donald Trump 12% (94) 85% (699) 2% (19) 1% (6) 8182020 Vote: Didn’t Vote 44% (106) 36% (87) 17% (42) 2% (5) 2392018 House Vote: Democrat 92% (629) 8% (52) 1% (5) — (1) 6872018 House Vote: Republican 15% (105) 82% (565) 2% (14) 1% (6) 6902018 House Vote: Someone else 33% (17) 55% (28) 11% (6) — (0) 502016 Vote: Hillary Clinton 93% (584) 6% (38) 1% (9) — (1) 6312016 Vote: Donald Trump 17% (134) 80% (612) 2% (15) 1% (6) 7682016 Vote: Other 56% (60) 40% (43) 4% (4) — (0) 1072016 Vote: Didn’t Vote 56% (270) 33% (162) 9% (45) 1% (6) 483Voted in 2014: Yes 53% (684) 45% (582) 2% (24) 1% (7) 1297Voted in 2014: No 53% (364) 39% (272) 7% (50) 1% (6) 6934-Region: Northeast 62% (214) 35% (120) 2% (7) 1% (3) 3444-Region: Midwest 55% (249) 43% (195) 2% (10) — (2) 4554-Region: South 48% (360) 49% (368) 3% (26) — (2) 7554-Region: West 52% (225) 40% (172) 7% (30) 2% (7) 435
Continued on next page
Page 342
342
Morning ConsultTable POLx_10
Table POLx_10: Favorability forJoe Biden
Demographic Total Favorable Total UnfavorableHeard Of, NoOpinion Never Heard Of Total N
Registered Voters 53% (1048) 43% (855) 4% (74) 1% (13) 1990Party: Democrat/Leans Democrat 91% (810) 7% (61) 2% (13) — (3) 888Party: Republican/Leans Republican 15% (119) 83% (672) 2% (16) 1% (6) 814Note: Row proportions may total to larger than one-hundred percent due to rounding. For more information visit MorningConsultIntelligence.com.
Page 343
National Tracking Poll #210636, June, 2021
343
Table POLx_11
Table POLx_11: Favorability forKamala Harris
Demographic Total Favorable Total UnfavorableHeard Of, NoOpinion Never Heard Of Total N
Registered Voters 46% (917) 45% (900) 7% (131) 2% (41) 1990Gender: Male 47% (431) 46% (424) 6% (51) 2% (20) 927Gender: Female 46% (486) 45% (476) 8% (80) 2% (21) 1063Age: 18-34 48% (217) 35% (159) 12% (57) 5% (23) 456Age: 35-44 51% (153) 40% (119) 7% (21) 2% (7) 300Age: 45-64 42% (306) 51% (374) 5% (39) 1% (11) 730Age: 65+ 48% (241) 49% (248) 3% (14) — (1) 504GenZers: 1997-2012 43% (72) 36% (62) 16% (27) 5% (9) 169Millennials: 1981-1996 50% (240) 37% (177) 9% (45) 4% (17) 480GenXers: 1965-1980 47% (244) 45% (234) 6% (32) 3% (14) 525Baby Boomers: 1946-1964 44% (331) 52% (388) 4% (26) — (0) 746PID: Dem (no lean) 86% (644) 9% (71) 3% (22) 2% (14) 752PID: Ind (no lean) 36% (207) 48% (277) 13% (74) 3% (19) 578PID: Rep (no lean) 10% (66) 84% (552) 5% (35) 1% (8) 661PID/Gender: DemMen 84% (302) 10% (35) 3% (12) 3% (10) 359PID/Gender: DemWomen 87% (342) 9% (36) 3% (10) 1% (4) 393PID/Gender: Ind Men 34% (91) 54% (145) 10% (27) 2% (5) 267PID/Gender: Ind Women 37% (116) 43% (133) 15% (47) 5% (14) 311PID/Gender: Rep Men 13% (38) 81% (245) 4% (12) 2% (6) 301PID/Gender: Rep Women 8% (28) 85% (307) 6% (22) 1% (3) 360Ideo: Liberal (1-3) 80% (472) 14% (81) 4% (22) 2% (12) 587Ideo: Moderate (4) 55% (297) 35% (186) 10% (51) 1% (5) 539Ideo: Conservative (5-7) 15% (111) 81% (599) 3% (19) 2% (14) 742Educ: < College 42% (508) 47% (569) 9% (107) 2% (30) 1213Educ: Bachelors degree 51% (248) 44% (215) 4% (17) 2% (8) 489Educ: Post-grad 56% (161) 40% (116) 2% (7) 1% (4) 288Income: Under 50k 46% (454) 42% (416) 9% (93) 3% (28) 991Income: 50k-100k 45% (291) 48% (310) 5% (30) 2% (10) 640Income: 100k+ 48% (172) 48% (174) 3% (9) 1% (4) 359Ethnicity: White 42% (658) 51% (806) 6% (89) 2% (31) 1584Ethnicity: Hispanic 54% (106) 31% (60) 10% (20) 5% (10) 196
Continued on next page
Page 344
344
Morning ConsultTable POLx_11
Table POLx_11: Favorability forKamala Harris
Demographic Total Favorable Total UnfavorableHeard Of, NoOpinion Never Heard Of Total N
Registered Voters 46% (917) 45% (900) 7% (131) 2% (41) 1990Ethnicity: Black 74% (179) 16% (39) 8% (20) 2% (5) 243Ethnicity: Other 49% (80) 34% (55) 14% (22) 3% (5) 163All Christian 41% (400) 53% (514) 4% (41) 1% (9) 964All Non-Christian 61% (74) 25% (30) 7% (8) 7% (9) 121Atheist 71% (52) 28% (21) 1% (1) — (0) 73Agnostic/Nothing in particular 51% (254) 35% (175) 11% (53) 3% (14) 495Something Else 41% (138) 48% (160) 8% (28) 3% (10) 337Religious Non-Protestant/Catholic 56% (79) 30% (42) 7% (10) 6% (9) 140Evangelical 35% (190) 60% (330) 3% (17) 2% (11) 547Non-Evangelical 46% (335) 46% (328) 7% (50) 1% (8) 721Community: Urban 60% (316) 30% (160) 6% (32) 4% (21) 529Community: Suburban 45% (445) 48% (480) 6% (58) 1% (14) 998Community: Rural 34% (156) 56% (260) 9% (41) 1% (7) 464Employ: Private Sector 50% (312) 43% (266) 5% (34) 2% (9) 622Employ: Government 46% (59) 46% (59) 7% (8) 1% (2) 129Employ: Self-Employed 43% (67) 44% (69) 9% (13) 4% (7) 157Employ: Homemaker 33% (42) 59% (74) 4% (5) 4% (5) 127Employ: Retired 46% (267) 50% (289) 4% (23) — (3) 581Employ: Unemployed 44% (95) 39% (83) 13% (29) 4% (8) 215Employ: Other 45% (51) 35% (39) 14% (15) 7% (7) 113Military HH: Yes 40% (144) 57% (205) 3% (11) 1% (2) 361Military HH: No 48% (774) 43% (695) 7% (120) 2% (39) 1629RD/WT: Right Direction 81% (759) 12% (111) 6% (53) 2% (18) 941RD/WT: Wrong Track 15% (159) 75% (789) 7% (78) 2% (23) 1049Biden Job Approve 83% (865) 11% (110) 5% (48) 1% (14) 1037Biden Job Disapprove 5% (42) 89% (766) 4% (37) 1% (12) 857Biden Job Strongly Approve 94% (514) 3% (17) 1% (6) 2% (11) 548Biden Job Somewhat Approve 72% (351) 19% (93) 9% (42) 1% (3) 489Biden Job Somewhat Disapprove 13% (30) 75% (168) 10% (21) 2% (4) 223Biden Job Strongly Disapprove 2% (12) 94% (598) 2% (15) 1% (8) 634
Continued on next page
Page 345
National Tracking Poll #210636, June, 2021
345
Table POLx_11
Table POLx_11: Favorability forKamala Harris
Demographic Total Favorable Total UnfavorableHeard Of, NoOpinion Never Heard Of Total N
Registered Voters 46% (917) 45% (900) 7% (131) 2% (41) 1990Favorable of Biden 84% (884) 10% (107) 4% (41) 2% (16) 1048Unfavorable of Biden 3% (26) 91% (778) 5% (39) 1% (12) 855Very Favorable of Biden 95% (562) 3% (19) 1% (6) 1% (6) 593Somewhat Favorable of Biden 71% (323) 19% (88) 8% (35) 2% (10) 455Somewhat Unfavorable of Biden 11% (21) 76% (145) 10% (19) 3% (5) 190Very Unfavorable of Biden 1% (5) 95% (633) 3% (20) 1% (7) 664#1 Issue: Economy 40% (306) 49% (376) 9% (71) 1% (11) 763#1 Issue: Security 23% (79) 74% (257) 2% (8) 2% (6) 349#1 Issue: Health Care 63% (147) 28% (64) 4% (10) 5% (12) 233#1 Issue: Medicare / Social Security 58% (150) 36% (95) 5% (14) 1% (2) 261#1 Issue: Women’s Issues 66% (68) 20% (20) 10% (11) 4% (4) 103#1 Issue: Education 61% (52) 32% (28) 4% (3) 3% (2) 86#1 Issue: Energy 69% (59) 20% (17) 8% (7) 4% (3) 86#1 Issue: Other 52% (57) 40% (44) 7% (7) 1% (1) 1092020 Vote: Joe Biden 86% (770) 9% (81) 3% (30) 2% (15) 8972020 Vote: Donald Trump 6% (51) 88% (717) 4% (35) 2% (15) 8182020 Vote: Didn’t Vote 37% (89) 32% (78) 26% (62) 4% (10) 2392018 House Vote: Democrat 87% (596) 10% (72) 2% (14) 1% (6) 6872018 House Vote: Republican 10% (67) 85% (586) 4% (24) 2% (13) 6902018 House Vote: Someone else 29% (15) 51% (26) 17% (8) 3% (2) 502016 Vote: Hillary Clinton 89% (559) 9% (54) 2% (14) 1% (4) 6312016 Vote: Donald Trump 12% (94) 82% (627) 4% (31) 2% (16) 7682016 Vote: Other 46% (49) 48% (51) 6% (7) — (0) 1072016 Vote: Didn’t Vote 44% (214) 35% (168) 16% (79) 4% (22) 483Voted in 2014: Yes 48% (621) 48% (617) 3% (42) 1% (18) 1297Voted in 2014: No 43% (297) 41% (283) 13% (89) 3% (24) 6934-Region: Northeast 55% (188) 37% (127) 6% (20) 3% (9) 3444-Region: Midwest 48% (218) 44% (201) 6% (27) 2% (9) 4554-Region: South 41% (313) 51% (383) 6% (44) 2% (15) 7554-Region: West 46% (200) 43% (188) 9% (40) 2% (8) 435
Continued on next page
Page 346
346
Morning ConsultTable POLx_11
Table POLx_11: Favorability forKamala Harris
Demographic Total Favorable Total UnfavorableHeard Of, NoOpinion Never Heard Of Total N
Registered Voters 46% (917) 45% (900) 7% (131) 2% (41) 1990Party: Democrat/Leans Democrat 85% (752) 10% (88) 4% (34) 2% (14) 888Party: Republican/Leans Republican 10% (81) 84% (680) 5% (41) 1% (12) 814Note: Row proportions may total to larger than one-hundred percent due to rounding. For more information visit MorningConsultIntelligence.com.
Page 347
National Tracking Poll #210636, June, 2021
347
Table POLx_12
Table POLx_12: Favorability forAnthony Fauci
Demographic Total Favorable Total UnfavorableHeard Of, NoOpinion Never Heard Of Total N
Registered Voters 45% (900) 37% (746) 10% (197) 7% (147) 1990Gender: Male 47% (434) 40% (374) 6% (56) 7% (63) 927Gender: Female 44% (466) 35% (372) 13% (141) 8% (84) 1063Age: 18-34 35% (158) 30% (139) 17% (77) 18% (82) 456Age: 35-44 45% (135) 35% (105) 13% (40) 7% (21) 300Age: 45-64 43% (313) 44% (324) 8% (55) 5% (38) 730Age: 65+ 58% (294) 36% (179) 5% (24) 1% (7) 504GenZers: 1997-2012 27% (45) 25% (42) 24% (41) 25% (42) 169Millennials: 1981-1996 40% (191) 34% (165) 14% (66) 12% (57) 480GenXers: 1965-1980 44% (230) 41% (215) 9% (46) 6% (34) 525Baby Boomers: 1946-1964 52% (391) 40% (298) 6% (43) 2% (14) 746PID: Dem (no lean) 71% (533) 13% (98) 8% (62) 8% (58) 752PID: Ind (no lean) 41% (234) 37% (214) 14% (79) 9% (50) 578PID: Rep (no lean) 20% (133) 66% (434) 8% (56) 6% (39) 661PID/Gender: DemMen 71% (254) 16% (58) 6% (20) 8% (28) 359PID/Gender: DemWomen 71% (280) 10% (41) 11% (42) 8% (30) 393PID/Gender: Ind Men 41% (109) 44% (117) 8% (20) 8% (21) 267PID/Gender: Ind Women 40% (125) 31% (97) 19% (59) 10% (30) 311PID/Gender: Rep Men 24% (71) 66% (199) 5% (16) 5% (15) 301PID/Gender: Rep Women 17% (61) 65% (234) 11% (40) 7% (24) 360Ideo: Liberal (1-3) 74% (432) 14% (81) 7% (40) 6% (34) 587Ideo: Moderate (4) 51% (276) 27% (147) 13% (72) 8% (43) 539Ideo: Conservative (5-7) 23% (170) 66% (492) 5% (41) 5% (40) 742Educ: < College 38% (464) 40% (482) 12% (148) 10% (118) 1213Educ: Bachelors degree 54% (262) 35% (172) 7% (34) 4% (21) 489Educ: Post-grad 60% (174) 32% (91) 5% (15) 3% (8) 288Income: Under 50k 42% (413) 36% (357) 13% (125) 10% (97) 991Income: 50k-100k 47% (302) 38% (243) 9% (59) 6% (36) 640Income: 100k+ 51% (185) 41% (147) 4% (13) 4% (15) 359Ethnicity: White 44% (704) 41% (647) 9% (135) 6% (99) 1584Ethnicity: Hispanic 40% (78) 34% (66) 17% (32) 9% (19) 196
Continued on next page
Page 348
348
Morning ConsultTable POLx_12
Table POLx_12: Favorability forAnthony Fauci
Demographic Total Favorable Total UnfavorableHeard Of, NoOpinion Never Heard Of Total N
Registered Voters 45% (900) 37% (746) 10% (197) 7% (147) 1990Ethnicity: Black 50% (120) 22% (53) 15% (35) 14% (34) 243Ethnicity: Other 47% (76) 29% (47) 16% (26) 9% (14) 163All Christian 46% (441) 44% (424) 6% (58) 4% (42) 964All Non-Christian 56% (68) 27% (33) 7% (9) 9% (11) 121Atheist 59% (43) 30% (22) 10% (7) 1% (0) 73Agnostic/Nothing in particular 46% (229) 29% (146) 14% (69) 10% (51) 495Something Else 35% (118) 36% (122) 16% (54) 13% (42) 337Religious Non-Protestant/Catholic 51% (72) 30% (43) 9% (12) 10% (14) 140Evangelical 32% (174) 53% (288) 8% (43) 8% (42) 547Non-Evangelical 52% (374) 34% (245) 9% (65) 5% (37) 721Community: Urban 54% (283) 28% (147) 9% (47) 10% (52) 529Community: Suburban 45% (445) 40% (402) 10% (99) 5% (52) 998Community: Rural 37% (172) 42% (196) 11% (51) 9% (43) 464Employ: Private Sector 45% (279) 39% (244) 9% (58) 7% (41) 622Employ: Government 41% (53) 40% (52) 15% (19) 4% (5) 129Employ: Self-Employed 39% (61) 38% (60) 10% (16) 13% (20) 157Employ: Homemaker 37% (47) 45% (57) 13% (16) 5% (7) 127Employ: Retired 55% (322) 38% (220) 5% (26) 2% (14) 581Employ: Unemployed 34% (73) 32% (69) 19% (40) 15% (32) 215Employ: Other 37% (42) 27% (31) 14% (16) 21% (24) 113Military HH: Yes 44% (158) 45% (164) 7% (27) 3% (12) 361Military HH: No 46% (742) 36% (582) 10% (169) 8% (135) 1629RD/WT: Right Direction 71% (668) 13% (124) 8% (78) 8% (71) 941RD/WT: Wrong Track 22% (232) 59% (622) 11% (119) 7% (76) 1049Biden Job Approve 73% (757) 11% (116) 8% (86) 7% (78) 1037Biden Job Disapprove 15% (130) 72% (613) 8% (72) 5% (41) 857Biden Job Strongly Approve 80% (440) 7% (39) 5% (29) 7% (40) 548Biden Job Somewhat Approve 65% (317) 16% (77) 12% (57) 8% (38) 489Biden Job Somewhat Disapprove 33% (73) 48% (107) 13% (28) 7% (16) 223Biden Job Strongly Disapprove 9% (58) 80% (507) 7% (44) 4% (26) 634
Continued on next page
Page 349
National Tracking Poll #210636, June, 2021
349
Table POLx_12
Table POLx_12: Favorability forAnthony Fauci
Demographic Total Favorable Total UnfavorableHeard Of, NoOpinion Never Heard Of Total N
Registered Voters 45% (900) 37% (746) 10% (197) 7% (147) 1990Favorable of Biden 74% (772) 11% (112) 9% (91) 7% (73) 1048Unfavorable of Biden 14% (116) 73% (625) 7% (64) 6% (50) 855Very Favorable of Biden 81% (478) 8% (47) 5% (31) 6% (36) 593Somewhat Favorable of Biden 65% (294) 14% (65) 13% (60) 8% (37) 455Somewhat Unfavorable of Biden 29% (56) 54% (102) 9% (16) 9% (16) 190Very Unfavorable of Biden 9% (60) 79% (523) 7% (48) 5% (34) 664#1 Issue: Economy 39% (296) 42% (317) 11% (80) 9% (69) 763#1 Issue: Security 28% (99) 64% (222) 3% (11) 5% (17) 349#1 Issue: Health Care 64% (148) 19% (45) 10% (23) 8% (18) 233#1 Issue: Medicare / Social Security 63% (163) 26% (67) 9% (24) 3% (7) 261#1 Issue: Women’s Issues 51% (52) 18% (19) 15% (16) 15% (16) 103#1 Issue: Education 47% (40) 19% (16) 24% (21) 10% (8) 86#1 Issue: Energy 50% (43) 29% (25) 11% (9) 10% (9) 86#1 Issue: Other 52% (57) 32% (35) 12% (13) 4% (4) 1092020 Vote: Joe Biden 76% (683) 11% (96) 7% (63) 6% (55) 8972020 Vote: Donald Trump 18% (146) 69% (566) 8% (64) 5% (42) 8182020 Vote: Didn’t Vote 24% (57) 29% (68) 28% (66) 20% (48) 2392018 House Vote: Democrat 79% (545) 10% (70) 7% (45) 4% (26) 6872018 House Vote: Republican 21% (143) 68% (471) 6% (40) 5% (35) 6902018 House Vote: Someone else 26% (13) 45% (23) 19% (10) 10% (5) 502016 Vote: Hillary Clinton 79% (499) 11% (68) 7% (41) 4% (22) 6312016 Vote: Donald Trump 23% (179) 65% (502) 7% (51) 5% (35) 7682016 Vote: Other 51% (55) 32% (34) 11% (12) 5% (6) 1072016 Vote: Didn’t Vote 34% (166) 29% (141) 19% (91) 17% (84) 483Voted in 2014: Yes 50% (646) 39% (510) 7% (89) 4% (52) 1297Voted in 2014: No 37% (254) 34% (236) 16% (108) 14% (96) 6934-Region: Northeast 54% (185) 32% (109) 8% (27) 7% (23) 3444-Region: Midwest 46% (210) 36% (166) 10% (47) 7% (33) 4554-Region: South 40% (299) 42% (318) 10% (75) 8% (64) 7554-Region: West 48% (207) 35% (153) 11% (47) 6% (28) 435
Continued on next page
Page 350
350
Morning ConsultTable POLx_12
Table POLx_12: Favorability forAnthony Fauci
Demographic Total Favorable Total UnfavorableHeard Of, NoOpinion Never Heard Of Total N
Registered Voters 45% (900) 37% (746) 10% (197) 7% (147) 1990Party: Democrat/Leans Democrat 72% (641) 13% (113) 8% (71) 7% (63) 888Party: Republican/Leans Republican 20% (161) 66% (535) 9% (70) 6% (48) 814Note: Row proportions may total to larger than one-hundred percent due to rounding. For more information visit MorningConsultIntelligence.com.
Page 351
National Tracking Poll #210636, June, 2021Respondent Demographics Summary
Respondent Demographics Summary
Summary Statistics of Survey Respondent DemographicsDemographic Group Frequency Percentage
xdemAll Registered Voters 1990 100%
xdemGender Gender: Male 927 47%Gender: Female 1063 53%
N 1990
age Age: 18-34 456 23%Age: 35-44 300 15%Age: 45-64 730 37%Age: 65+ 504 25%
N 1990
demAgeGeneration GenZers: 1997-2012 169 9%Millennials: 1981-1996 480 24%GenXers: 1965-1980 525 26%
Baby Boomers: 1946-1964 746 37%N 1920
xpid3 PID: Dem (no lean) 752 38%PID: Ind (no lean) 578 29%PID: Rep (no lean) 661 33%
N 1990
xpidGender PID/Gender: DemMen 359 18%PID/Gender: DemWomen 393 20%
PID/Gender: Ind Men 267 13%PID/Gender: Ind Women 311 16%
PID/Gender: Rep Men 301 15%PID/Gender: Rep Women 360 18%
N 1990
xdemIdeo3 Ideo: Liberal (1-3) 587 30%Ideo: Moderate (4) 539 27%
Ideo: Conservative (5-7) 742 37%N 1869
xeduc3 Educ: < College 1213 61%Educ: Bachelors degree 489 25%
Educ: Post-grad 288 14%N 1990
Continued on next page
351
Page 352
Morning ConsultRespondent Demographics Summary
Summary Statistics of Survey Respondent DemographicsDemographic Group Frequency Percentage
xdemInc3 Income: Under 50k 991 50%Income: 50k-100k 640 32%
Income: 100k+ 359 18%N 1990
xdemWhite Ethnicity: White 1584 80%
xdemHispBin Ethnicity: Hispanic 196 10%
demBlackBin Ethnicity: Black 243 12%
demRaceOther Ethnicity: Other 163 8%
xdemReligion All Christian 964 48%All Non-Christian 121 6%
Atheist 73 4%Agnostic/Nothing in particular 495 25%
Something Else 337 17%N 1990
xdemReligOther Religious Non-Protestant/Catholic 140 7%
xdemEvang Evangelical 547 28%Non-Evangelical 721 36%
N 1268
xdemUsr Community: Urban 529 27%Community: Suburban 998 50%
Community: Rural 464 23%N 1990
xdemEmploy Employ: Private Sector 622 31%Employ: Government 129 6%
Employ: Self-Employed 157 8%Employ: Homemaker 127 6%
Employ: Student 47 2%Employ: Retired 581 29%
Employ: Unemployed 215 11%Employ: Other 113 6%
N 1990
xdemMilHH1 Military HH: Yes 361 18%Military HH: No 1629 82%
N 1990
Continued on next page
352
Page 353
National Tracking Poll #210636, June, 2021Respondent Demographics Summary
Summary Statistics of Survey Respondent DemographicsDemographic Group Frequency Percentage
xnr1 RD/WT: Right Direction 941 47%RD/WT: Wrong Track 1049 53%
N 1990
xdemBidenApprove Biden Job Approve 1037 52%Biden Job Disapprove 857 43%
N 1894
xdemBidenApprove2 Biden Job Strongly Approve 548 28%Biden Job Somewhat Approve 489 25%
Biden Job Somewhat Disapprove 223 11%Biden Job Strongly Disapprove 634 32%
N 1894
xdemBidenFav Favorable of Biden 1048 53%Unfavorable of Biden 855 43%
N 1903
xdemBidenFavFull Very Favorable of Biden 593 30%Somewhat Favorable of Biden 455 23%
Somewhat Unfavorable of Biden 190 10%Very Unfavorable of Biden 664 33%
N 1903
xnr3 #1 Issue: Economy 763 38%#1 Issue: Security 349 18%
#1 Issue: Health Care 233 12%#1 Issue: Medicare / Social Security 261 13%
#1 Issue: Women’s Issues 103 5%#1 Issue: Education 86 4%
#1 Issue: Energy 86 4%#1 Issue: Other 109 5%
N 1990
xsubVote20O 2020 Vote: Joe Biden 897 45%2020 Vote: Donald Trump 818 41%
2020 Vote: Other 33 2%2020 Vote: Didn’t Vote 239 12%
N 1988
xsubVote18O 2018 House Vote: Democrat 687 35%2018 House Vote: Republican 690 35%
2018 House Vote: Someone else 50 3%N 1427
Continued on next page
353
Page 354
Morning ConsultRespondent Demographics Summary
Summary Statistics of Survey Respondent DemographicsDemographic Group Frequency Percentage
xsubVote16O 2016 Vote: Hillary Clinton 631 32%2016 Vote: Donald Trump 768 39%
2016 Vote: Other 107 5%2016 Vote: Didn’t Vote 483 24%
N 1989
xsubVote14O Voted in 2014: Yes 1297 65%Voted in 2014: No 693 35%
N 1990
xreg4 4-Region: Northeast 344 17%4-Region: Midwest 455 23%
4-Region: South 755 38%4-Region: West 435 22%
N 1990
xdemPidLean Party: Democrat/Leans Democrat 888 45%Party: Republican/Leans Republican 814 41%
N 1702
Note: Group proportions may total to larger than one-hundred percent due to rounding. All statistics are calcu-lated with demographic post-stratification weights applied.
354
Page 355
National Tracking Poll #210636, June, 2021 355