Page 1
National Tracking Poll #2110084October 16-18, 2021
Crosstabulation Results
Methodology:This poll was conducted between October 16-October 18, 2021 among a sample of 1998 RegisteredVoters. The interviews were conducted online and the data were weighted to approximate a targetsample of Registered Voters based on gender by age, educational attainment, race, marital status,home ownership, race by educational attainment, 2020 presidential vote, and region. Results fromthe full survey have a margin of error of plus or minus 2 percentage points.
Page 2
Table Index
1 Table P1: Now, generally speaking, would you say that things in the country are going in theright direction, or have they pretty seriously gotten off on the wrong track? . . . . . . . . . . 8
2 Table nr2b: Do you approve or disapprove of the job Joe Biden is doing as President? . . . . 12
3 Table nr2bNET: Do you approve or disapprove of the job Joe Biden is doing as President? . . 15
4 Table P3: Now, thinking about your vote, what would you say is the top set of issues on yourmind when you cast your vote for federal offices such as U.S. Senate or Congress? . . . . . . . 18
5 Table POL1: Thinking about the November 2022 midterm elections for U.S. Congress, howenthusiastic would you say you are about voting in the midterm elections? . . . . . . . . . . 23
6 Table POL2: If the election for U.S. Congress in your district was held today, which one of thefollowing candidates are you most likely to vote for? . . . . . . . . . . . . . . . . . . . . . . 27
7 Table POL3_1: Do you approve or disapprove of how President Biden is handling each of thefollowing? The economy . . . . . . . . . . . . . . . . . . . . . . . . . . . . . . . . . . . . . 30
8 Table POL3_2: Do you approve or disapprove of how President Biden is handling each of thefollowing? Jobs . . . . . . . . . . . . . . . . . . . . . . . . . . . . . . . . . . . . . . . . . 34
9 Table POL3_3: Do you approve or disapprove of how President Biden is handling each of thefollowing? Health care . . . . . . . . . . . . . . . . . . . . . . . . . . . . . . . . . . . . . 38
10 Table POL3_4: Do you approve or disapprove of how President Biden is handling each of thefollowing? Immigration . . . . . . . . . . . . . . . . . . . . . . . . . . . . . . . . . . . . . 42
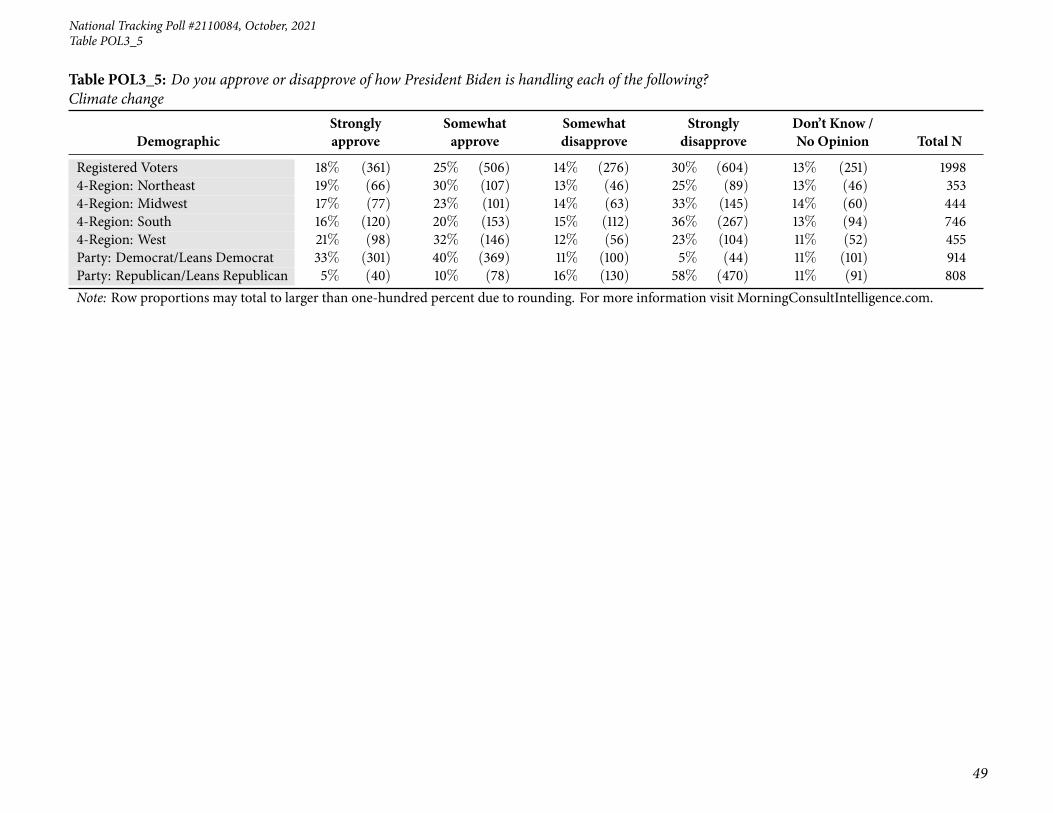
11 Table POL3_5: Do you approve or disapprove of how President Biden is handling each of thefollowing? Climate change . . . . . . . . . . . . . . . . . . . . . . . . . . . . . . . . . . . 46
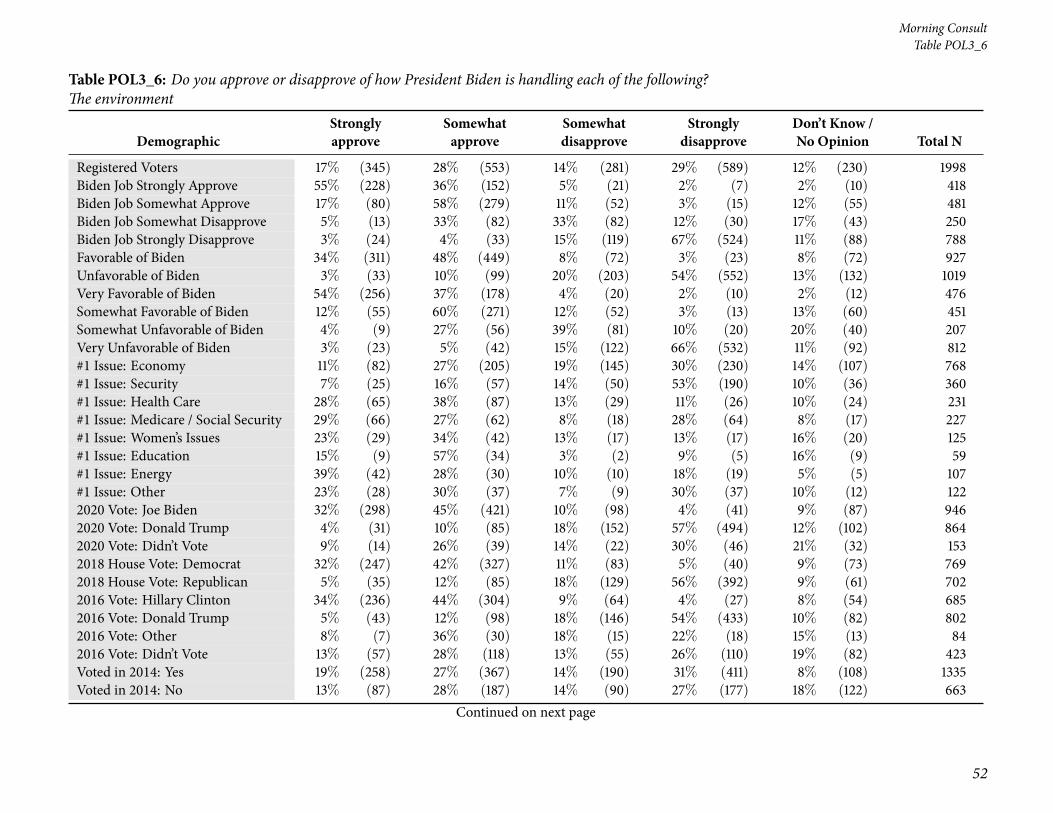
12 Table POL3_6: Do you approve or disapprove of how President Biden is handling each of thefollowing? The environment . . . . . . . . . . . . . . . . . . . . . . . . . . . . . . . . . . 50
13 Table POL3_7: Do you approve or disapprove of how President Biden is handling each of thefollowing? Energy . . . . . . . . . . . . . . . . . . . . . . . . . . . . . . . . . . . . . . . . 54
14 Table POL3_8: Do you approve or disapprove of how President Biden is handling each of thefollowing? Education . . . . . . . . . . . . . . . . . . . . . . . . . . . . . . . . . . . . . . 58
15 Table POL3_9: Do you approve or disapprove of how President Biden is handling each of thefollowing? National security . . . . . . . . . . . . . . . . . . . . . . . . . . . . . . . . . . 62
16 Table POL3_10: Do you approve or disapprove of how President Biden is handling each ofthe following? Gun policy . . . . . . . . . . . . . . . . . . . . . . . . . . . . . . . . . . . . 66
17 Table POL3_11: Do you approve or disapprove of how President Biden is handling each ofthe following? Protecting Medicare and Social Security . . . . . . . . . . . . . . . . . . . . 70
2
Page 3
National Tracking Poll #2110084, October, 2021
18 Table POL3_12: Do you approve or disapprove of how President Biden is handling each ofthe following? Coronavirus . . . . . . . . . . . . . . . . . . . . . . . . . . . . . . . . . . . 74
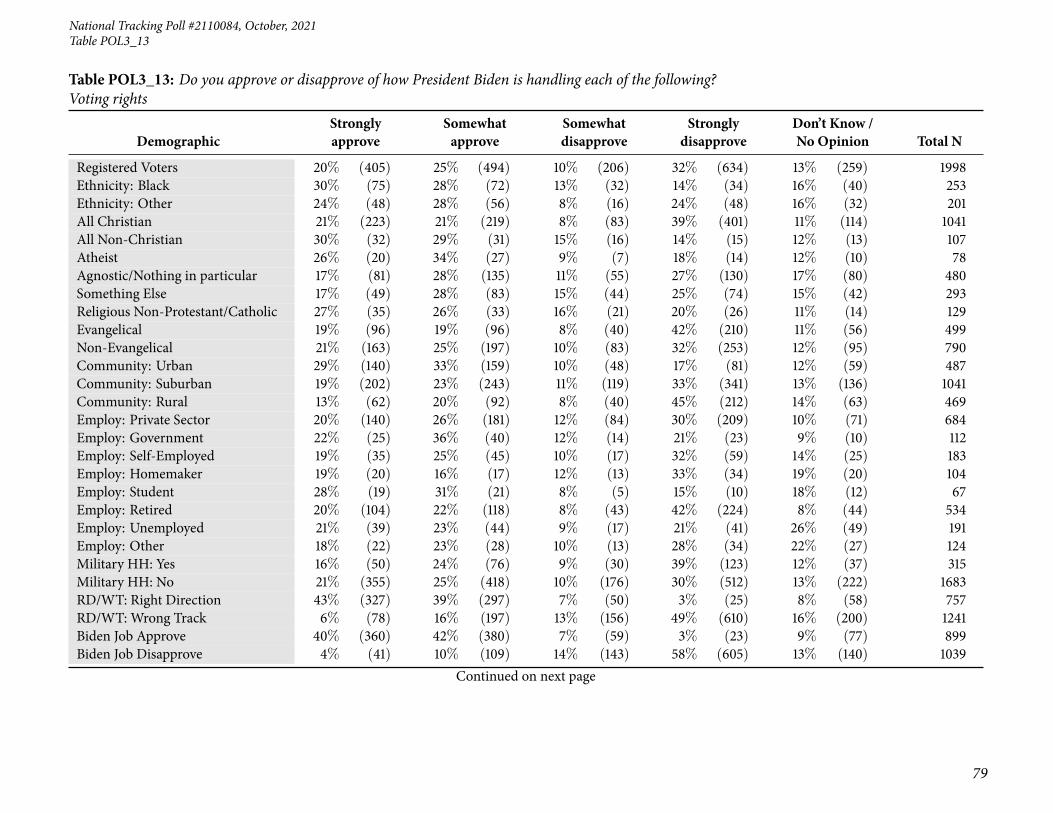
19 Table POL3_13: Do you approve or disapprove of how President Biden is handling each ofthe following? Voting rights . . . . . . . . . . . . . . . . . . . . . . . . . . . . . . . . . . . 78
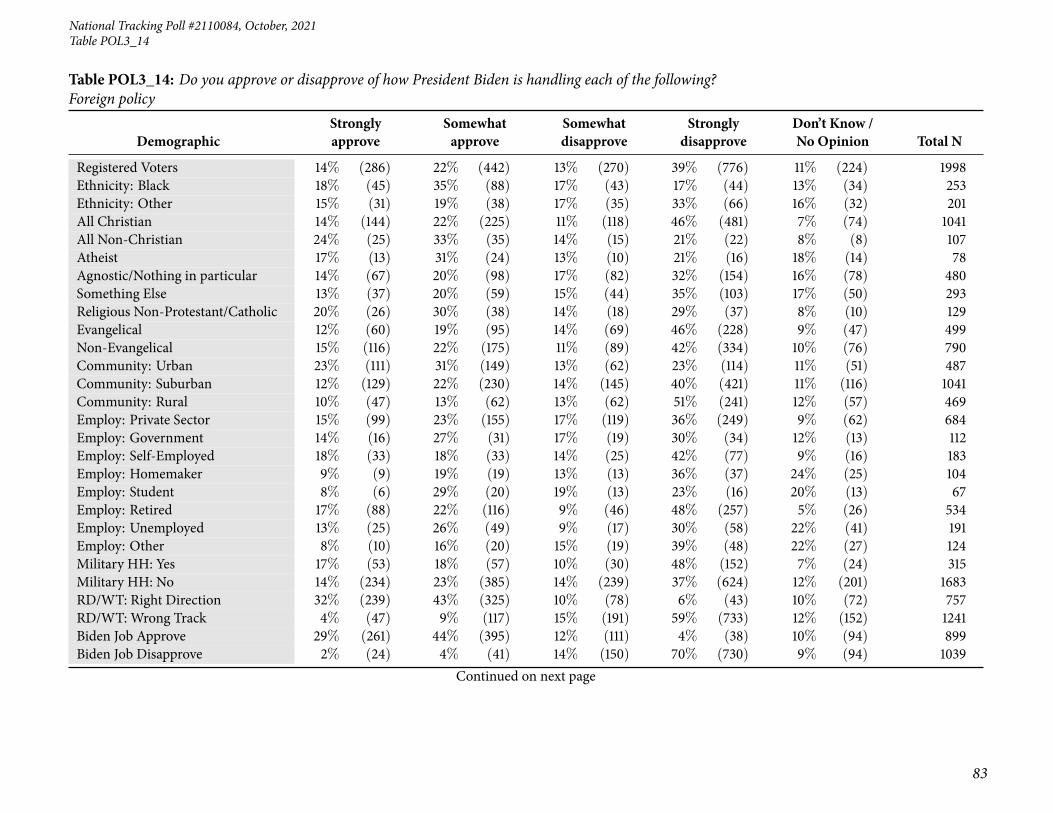
20 Table POL3_14: Do you approve or disapprove of how President Biden is handling each ofthe following? Foreign policy . . . . . . . . . . . . . . . . . . . . . . . . . . . . . . . . . . 82
21 Table POL4_1: How would you rate each of the following on their handling of the coron-avirus? President Joe Biden . . . . . . . . . . . . . . . . . . . . . . . . . . . . . . . . . . . 86
22 Table POL4_2: How would you rate each of the following on their handling of the coron-avirus? Congress . . . . . . . . . . . . . . . . . . . . . . . . . . . . . . . . . . . . . . . . 90
23 Table POL4_3: How would you rate each of the following on their handling of the coron-avirus? Congressional Democrats . . . . . . . . . . . . . . . . . . . . . . . . . . . . . . . 94
24 Table POL4_4: How would you rate each of the following on their handling of the coron-avirus? Congressional Republicans . . . . . . . . . . . . . . . . . . . . . . . . . . . . . . . 98
25 Table POL4_5: How would you rate each of the following on their handling of the coron-avirus? The World Health Organization (WHO) . . . . . . . . . . . . . . . . . . . . . . . . 102
26 Table POL4_6: How would you rate each of the following on their handling of the coron-avirus? The Centers for Disease Control and Prevention (CDC) . . . . . . . . . . . . . . . . 106
27 Table POL4_7: How would you rate each of the following on their handling of the coron-avirus? Your state’s governor . . . . . . . . . . . . . . . . . . . . . . . . . . . . . . . . . . 110
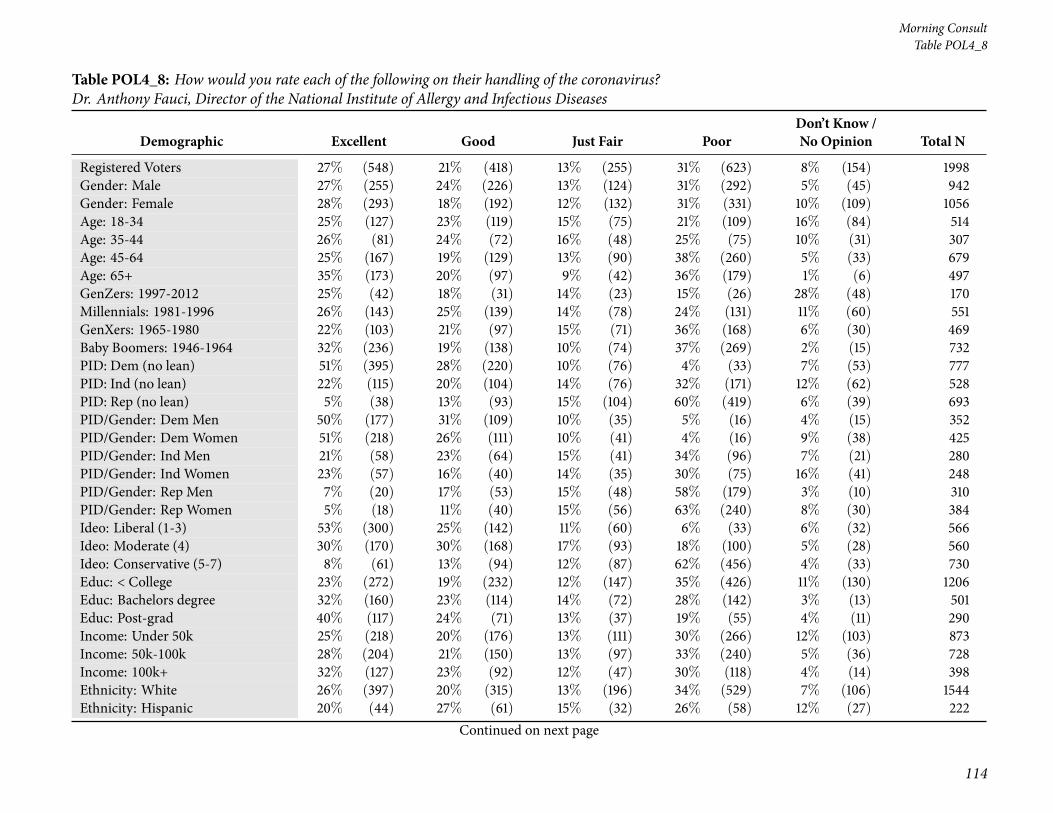
28 Table POL4_8: How would you rate each of the following on their handling of the coron-avirus? Dr. Anthony Fauci, Director of the National Institute of Allergy and Infectious Diseases 114
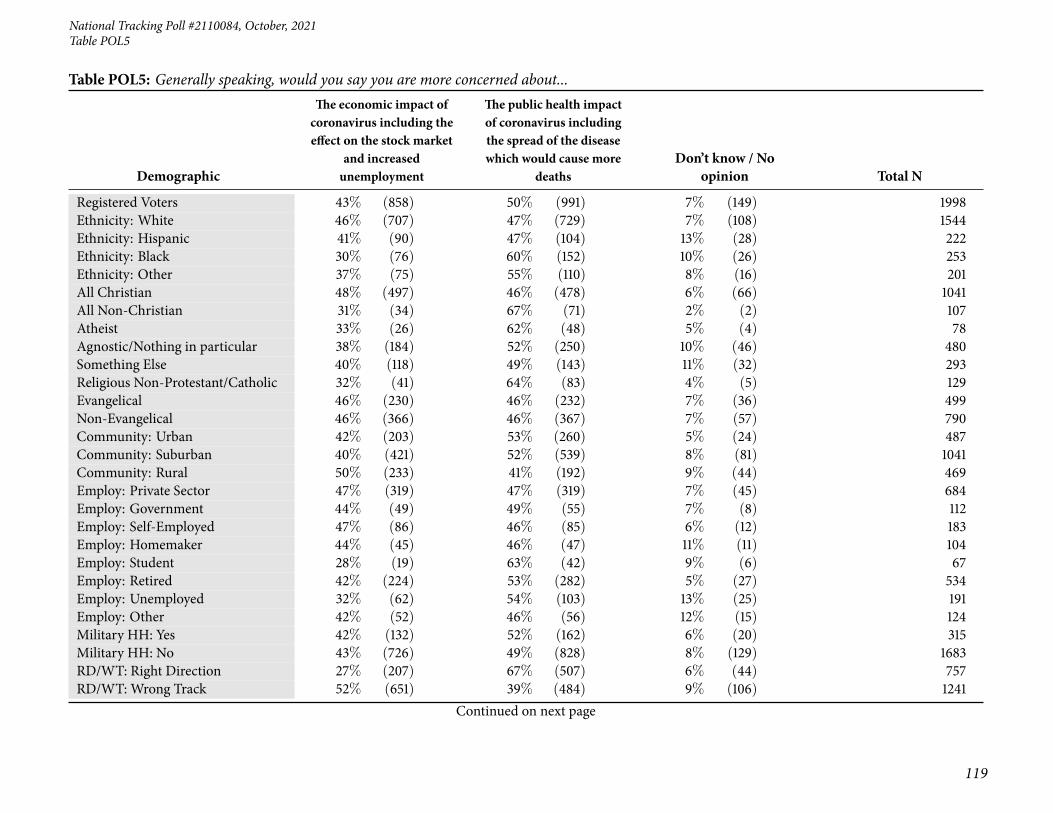
29 Table POL5: Generally speaking, would you say you are more concerned about... . . . . . . 118
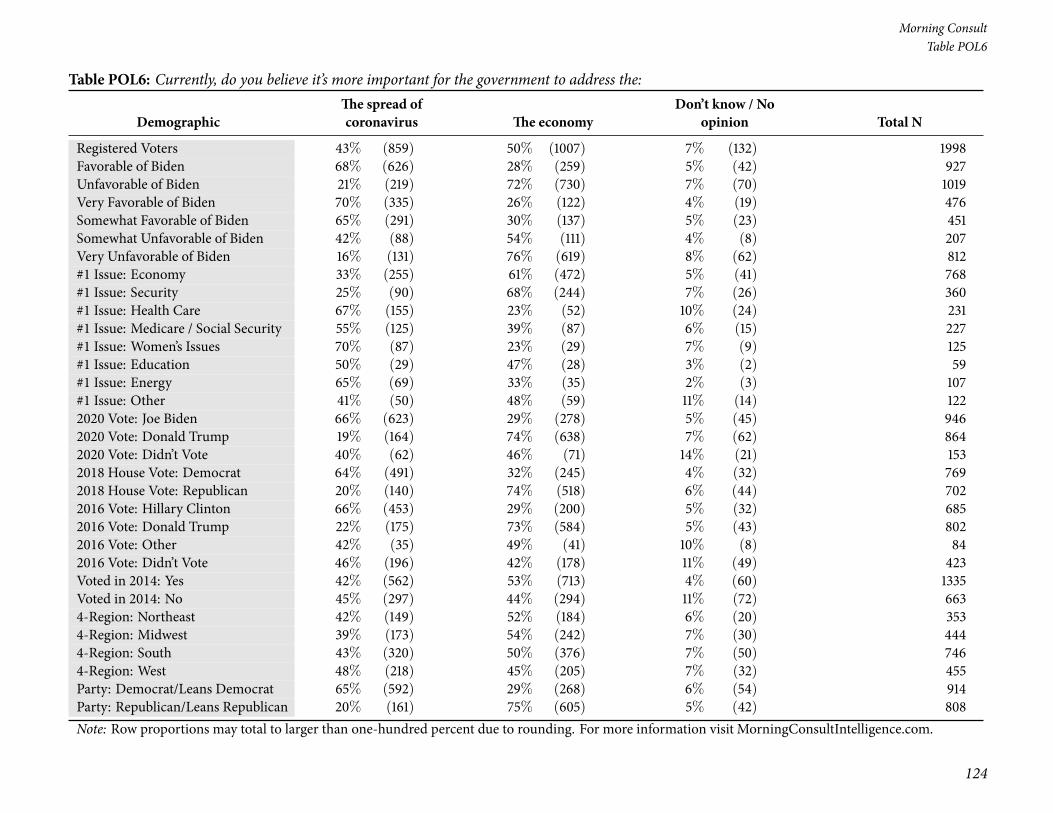
30 Table POL6: Currently, do you believe it’s more important for the government to address the: 122
31 Table POL7: Even if neither is exactly correct, which of the following comes closest to youropinion? . . . . . . . . . . . . . . . . . . . . . . . . . . . . . . . . . . . . . . . . . . . . . 125
32 Table POL8_1: Howmuch have you seen, read, or heard about the following? The upcominginternational climate change conference, COP26, in Glasgow, Scotland . . . . . . . . . . . . 129
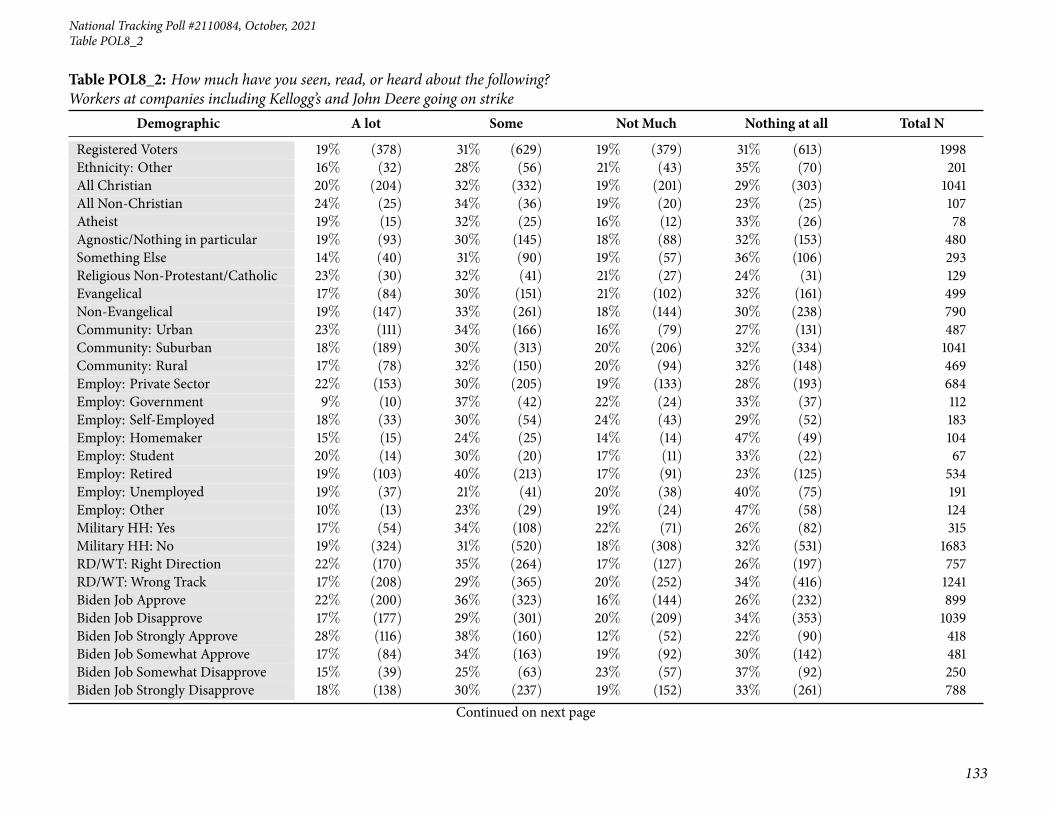
33 Table POL8_2: How much have you seen, read, or heard about the following? Workers atcompanies including Kellogg’s and John Deere going on strike . . . . . . . . . . . . . . . . . 132
34 Table POL8_3: How much have you seen, read, or heard about the following? Former Presi-dent Donald Trump saying ’if we don’t solve the presidential election fraud of 2020, Republi-cans will not be voting in 2022 or 2024’ . . . . . . . . . . . . . . . . . . . . . . . . . . . . 135
35 Table POL8_4: How much have you seen, read, or heard about the following? Consumerprices in September 2021 rising 5.4% from a year ago, matching a 13-year high in inflation . 138
3
Page 4
Morning Consult
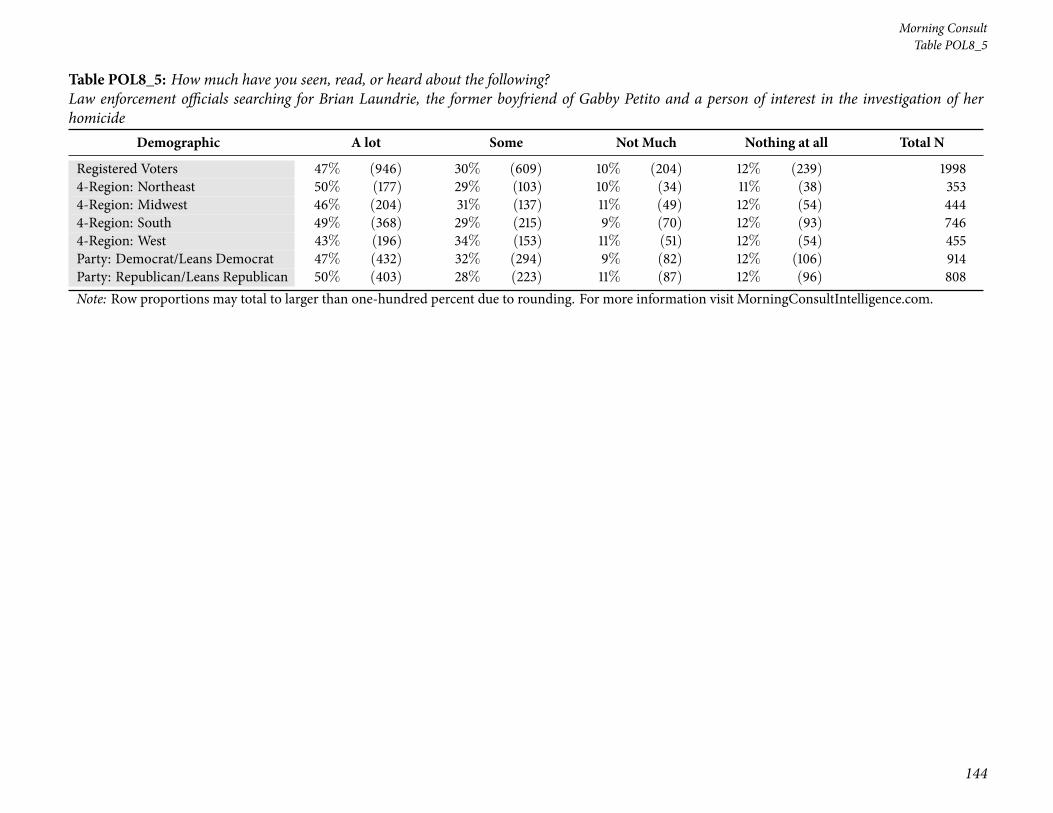
36 Table POL8_5: How much have you seen, read, or heard about the following? Law enforce-ment officials searching for Brian Laundrie, the former boyfriend of Gabby Petito and a personof interest in the investigation of her homicide . . . . . . . . . . . . . . . . . . . . . . . . . 141
37 Table POL9: Who would you say is most responsible for the current state of the economy? . 145
38 Table POL10_1: How concerned are you, if at all, about each of the following? TheU.S. economy148
39 TablePOL10_2: How concerned are you, if at all, about each of the following? TheCOVID-19pandemic . . . . . . . . . . . . . . . . . . . . . . . . . . . . . . . . . . . . . . . . . . . . 152
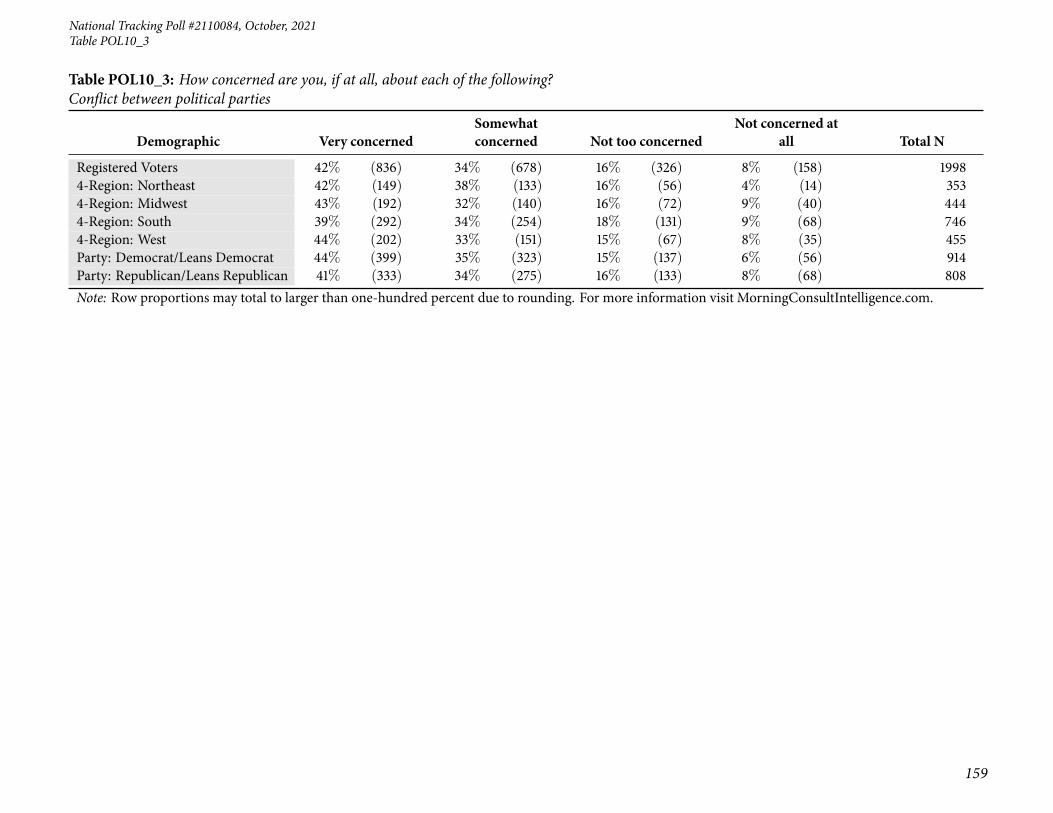
40 Table POL10_3: How concerned are you, if at all, about each of the following? Conflictbetween political parties . . . . . . . . . . . . . . . . . . . . . . . . . . . . . . . . . . . . 156
41 Table POL10_4: How concerned are you, if at all, about each of the following? Inflation . . 160
42 Table POL10_5: How concerned are you, if at all, about each of the following? Illegal immi-gration at the U.S.-Mexico border . . . . . . . . . . . . . . . . . . . . . . . . . . . . . . . 164
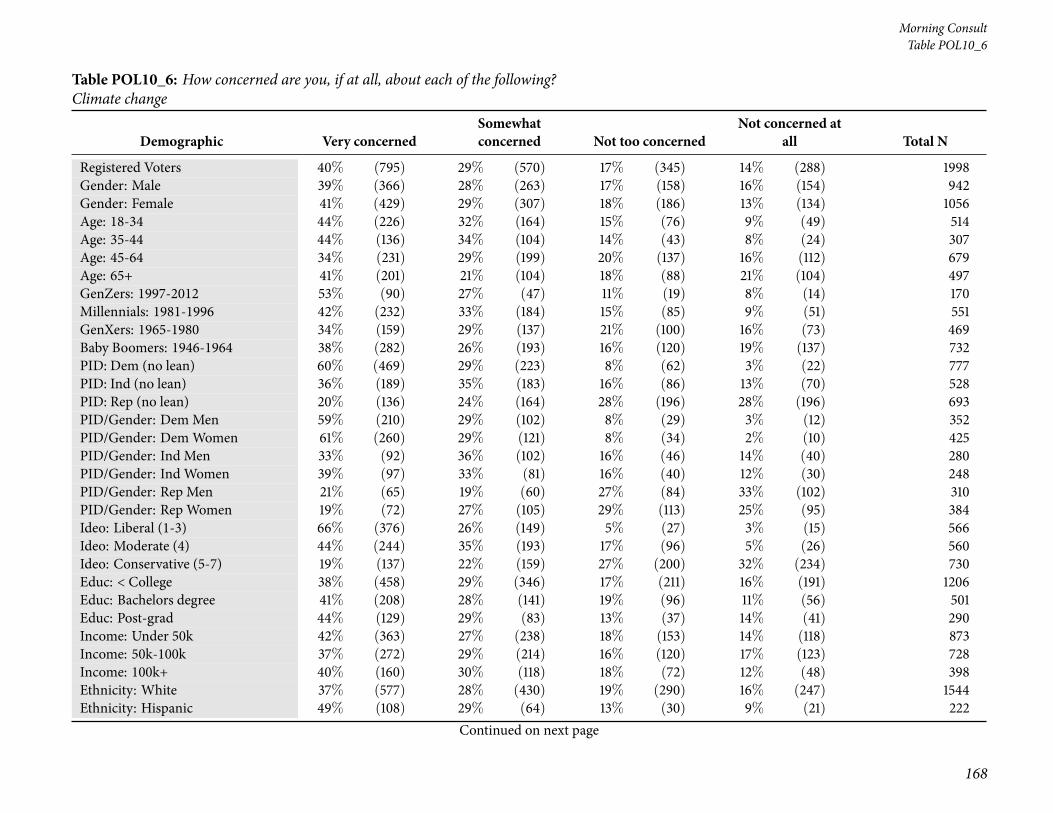
43 Table POL10_6: How concerned are you, if at all, about each of the following? Climate change 168
44 Table POL10_7: How concerned are you, if at all, about each of the following? Politicalcorrectness . . . . . . . . . . . . . . . . . . . . . . . . . . . . . . . . . . . . . . . . . . . 172
45 Table POL10_8: How concerned are you, if at all, about each of the following? Terrorism inthe United States . . . . . . . . . . . . . . . . . . . . . . . . . . . . . . . . . . . . . . . . 176
46 Table POL10_9: How concerned are you, if at all, about each of the following? Economicinequality . . . . . . . . . . . . . . . . . . . . . . . . . . . . . . . . . . . . . . . . . . . . 180
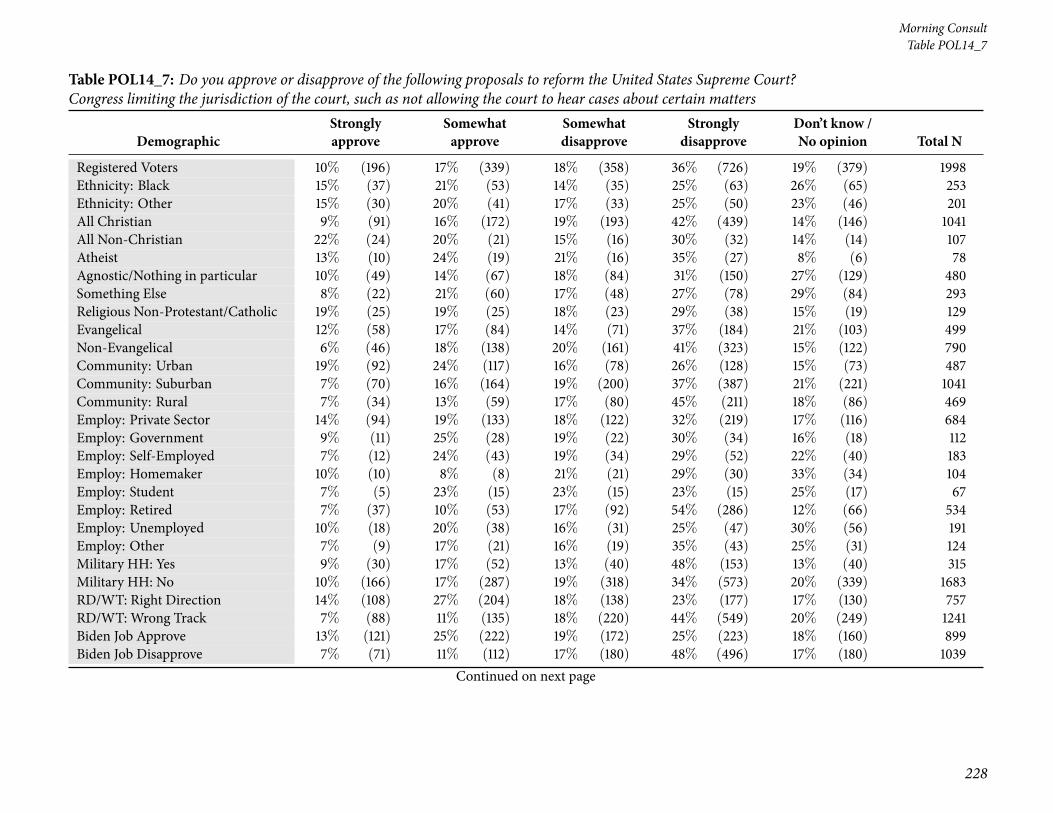
47 Table POL10_10: How concerned are you, if at all, about each of the following? Cyber-attackson the United States . . . . . . . . . . . . . . . . . . . . . . . . . . . . . . . . . . . . . . . 184
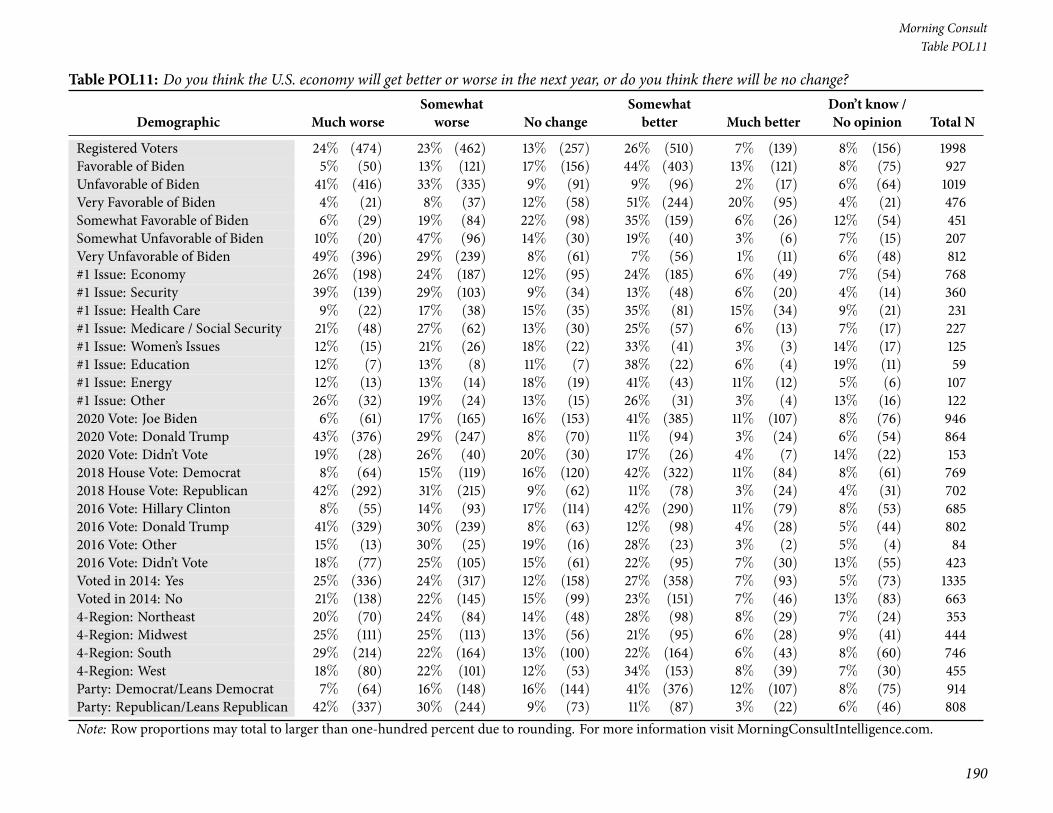
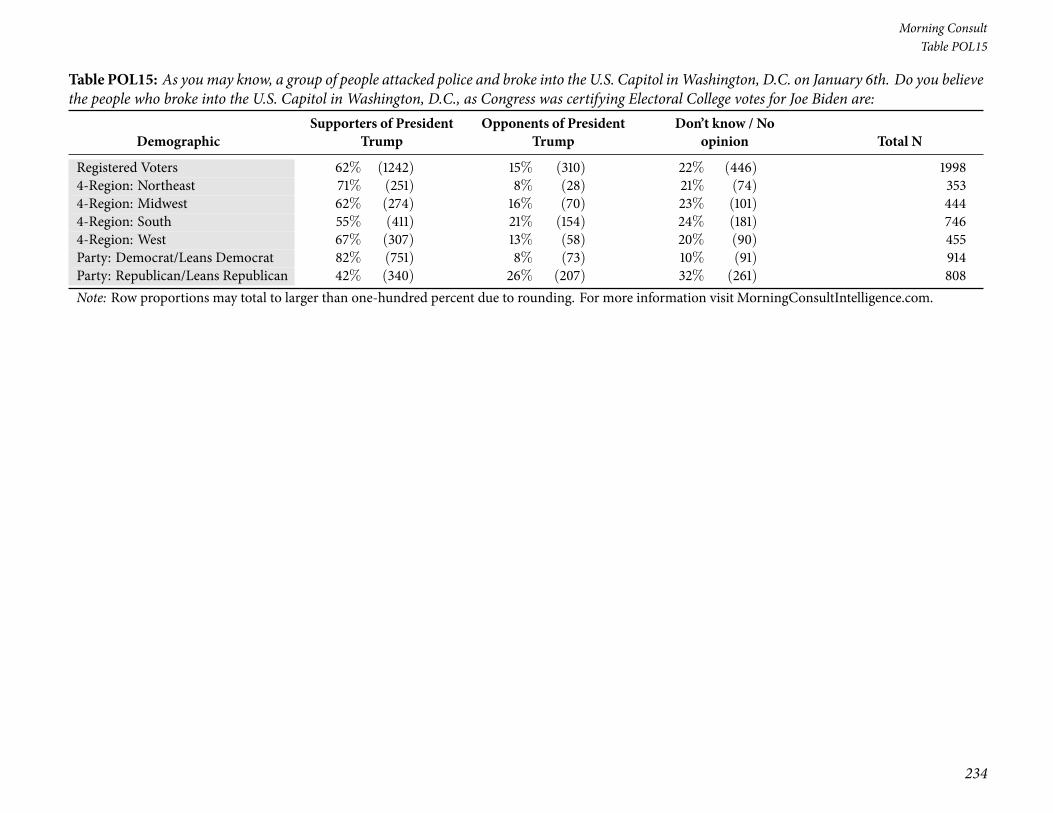
48 Table POL11: Do you think the U.S. economy will get better or worse in the next year, or doyou think there will be no change? . . . . . . . . . . . . . . . . . . . . . . . . . . . . . . . 188
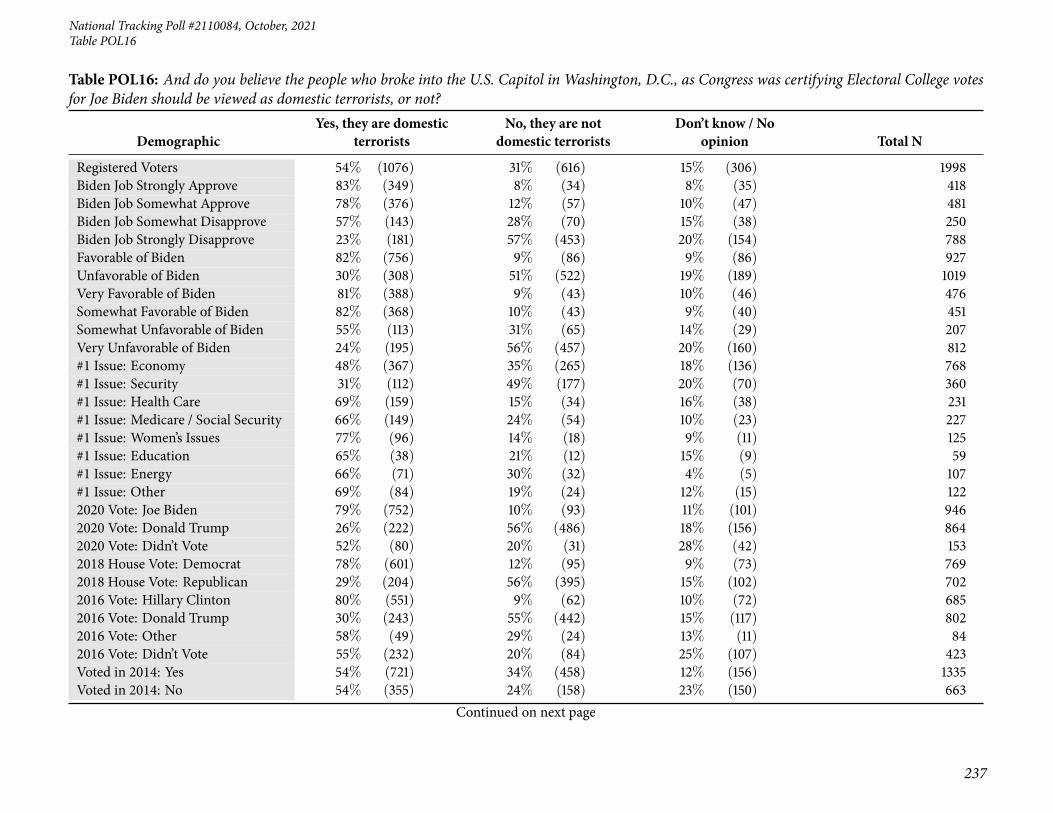
49 Table POL12_1: As you may know, inflation matched a 13-year high in the United States. Towhat extent do you think each of the following is responsible for the increasing inflation in theU.S. economy? Americans returning to pre-pandemic behaviors . . . . . . . . . . . . . . . . 191
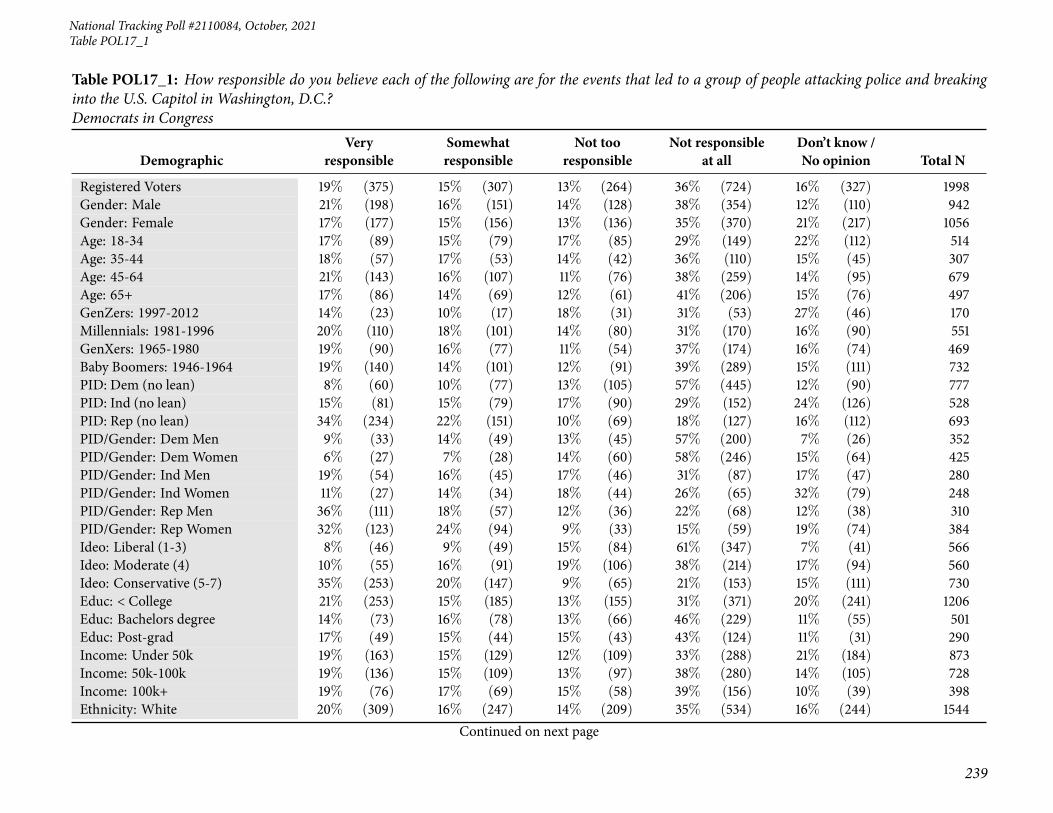
50 Table POL12_2: As you may know, inflation matched a 13-year high in the United States. Towhat extent do you think each of the following is responsible for the increasing inflation in theU.S. economy? The Biden administration’s policies . . . . . . . . . . . . . . . . . . . . . . . 195
51 Table POL13: Do you support or oppose holding social media platforms legally responsible forany harm that happens to users as a result of the personalized algorithms these social mediacompanies use to make recommendations for users? . . . . . . . . . . . . . . . . . . . . . . 199
52 TablePOL14_1: Do you approve or disapprove of the following proposals to reform theUnitedStates Supreme Court? Expanding the number of justices on the court . . . . . . . . . . . . 203
53 TablePOL14_2: Do you approve or disapprove of the following proposals to reform theUnitedStates Supreme Court? Adding term limits for justices . . . . . . . . . . . . . . . . . . . . . 207
4
Page 5
National Tracking Poll #2110084, October, 2021
54 TablePOL14_3: Do you approve or disapprove of the following proposals to reform theUnitedStates Supreme Court? Binding justices to a code of ethics . . . . . . . . . . . . . . . . . . . 211
55 TablePOL14_4: Do you approve or disapprove of the following proposals to reform theUnitedStates Supreme Court? Adopting transparency measures, such as live-streaming of oral argu-ments and decisions . . . . . . . . . . . . . . . . . . . . . . . . . . . . . . . . . . . . . . . 215
56 TablePOL14_5: Do you approve or disapprove of the following proposals to reform theUnitedStates Supreme Court? Balancing the court with equal numbers of Democrats, Republicans,and Independents . . . . . . . . . . . . . . . . . . . . . . . . . . . . . . . . . . . . . . . . 219
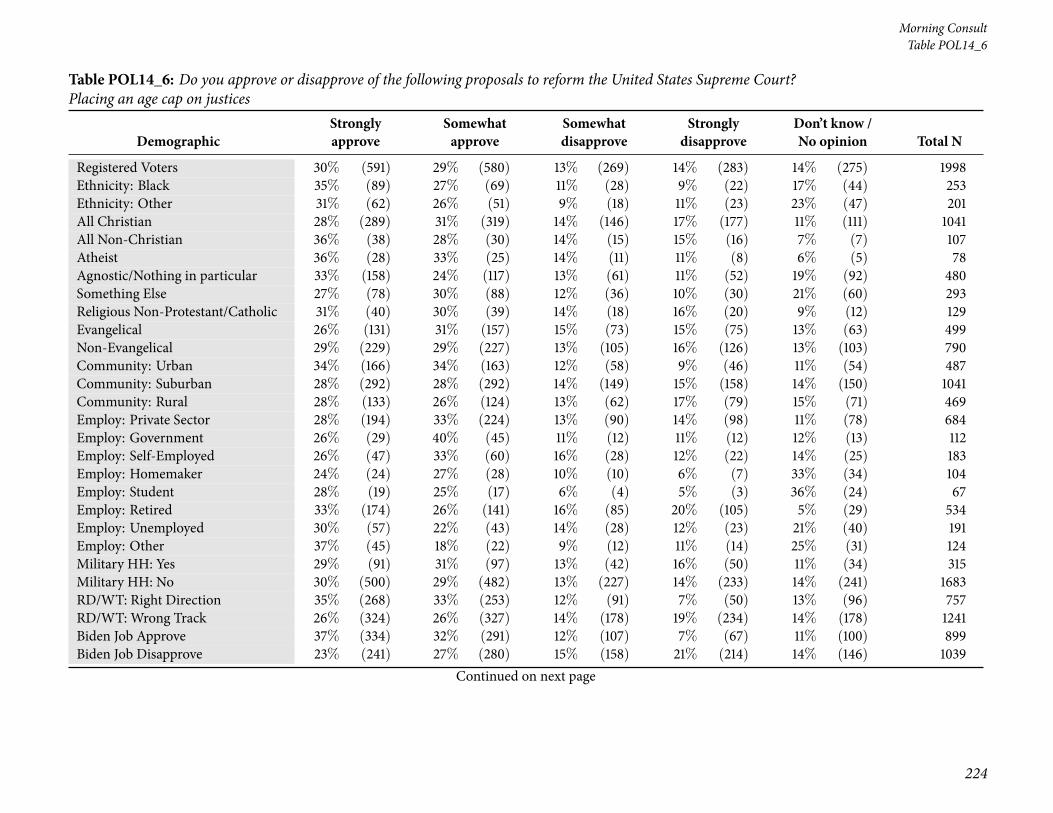
57 TablePOL14_6: Do you approve or disapprove of the following proposals to reform theUnitedStates Supreme Court? Placing an age cap on justices . . . . . . . . . . . . . . . . . . . . . 223
58 TablePOL14_7: Do you approve or disapprove of the following proposals to reform theUnitedStates Supreme Court? Congress limiting the jurisdiction of the court, such as not allowing thecourt to hear cases about certain matters . . . . . . . . . . . . . . . . . . . . . . . . . . . . 227
59 Table POL15: As you may know, a group of people attacked police and broke into the U.S.Capitol in Washington, D.C. on January 6th. Do you believe the people who broke into theU.S. Capitol in Washington, D.C., as Congress was certifying Electoral College votes for JoeBiden are: . . . . . . . . . . . . . . . . . . . . . . . . . . . . . . . . . . . . . . . . . . . . 231
60 Table POL16: And do you believe the people who broke into the U.S. Capitol in Washington,D.C., as Congress was certifying Electoral College votes for Joe Biden should be viewed asdomestic terrorists, or not? . . . . . . . . . . . . . . . . . . . . . . . . . . . . . . . . . . . 235
61 Table POL17_1: How responsible do you believe each of the following are for the events thatled to a group of people attacking police and breaking into the U.S. Capitol in Washington,D.C.? Democrats in Congress . . . . . . . . . . . . . . . . . . . . . . . . . . . . . . . . . . 239
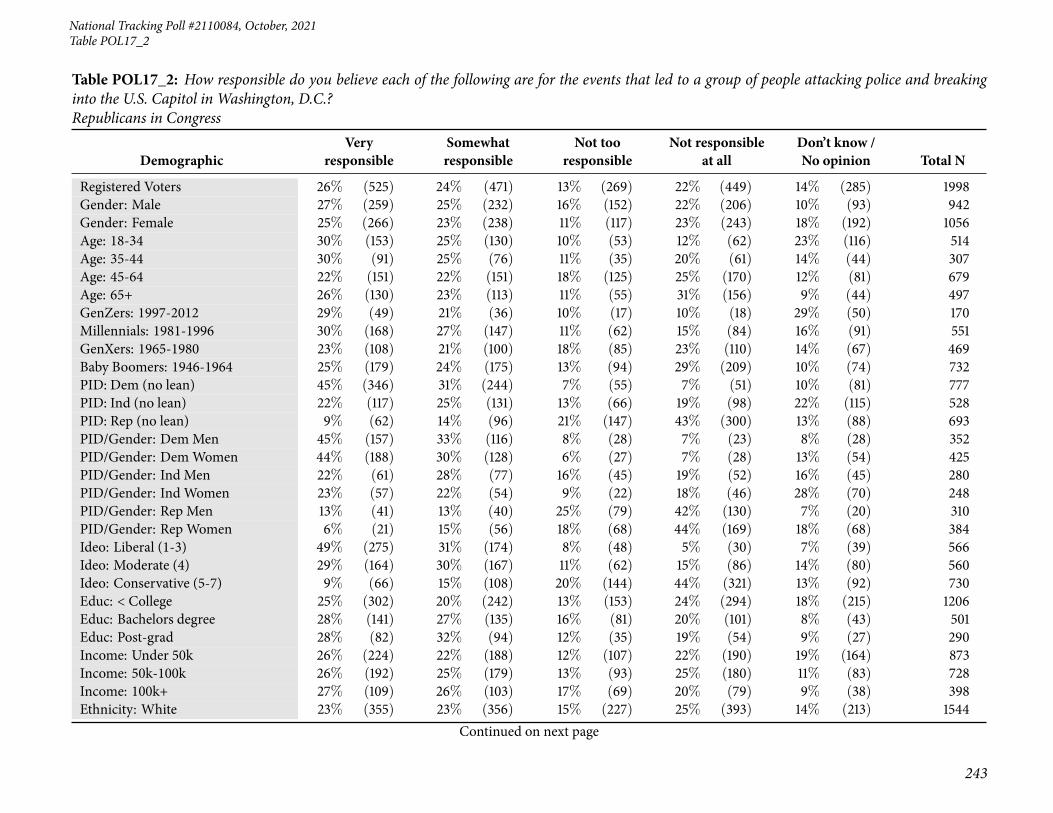
62 Table POL17_2: How responsible do you believe each of the following are for the events thatled to a group of people attacking police and breaking into the U.S. Capitol in Washington,D.C.? Republicans in Congress . . . . . . . . . . . . . . . . . . . . . . . . . . . . . . . . . 243
63 Table POL17_3: How responsible do you believe each of the following are for the events thatled to a group of people attacking police and breaking into the U.S. Capitol in Washington,D.C.? Sen. Ted Cruz . . . . . . . . . . . . . . . . . . . . . . . . . . . . . . . . . . . . . . 247
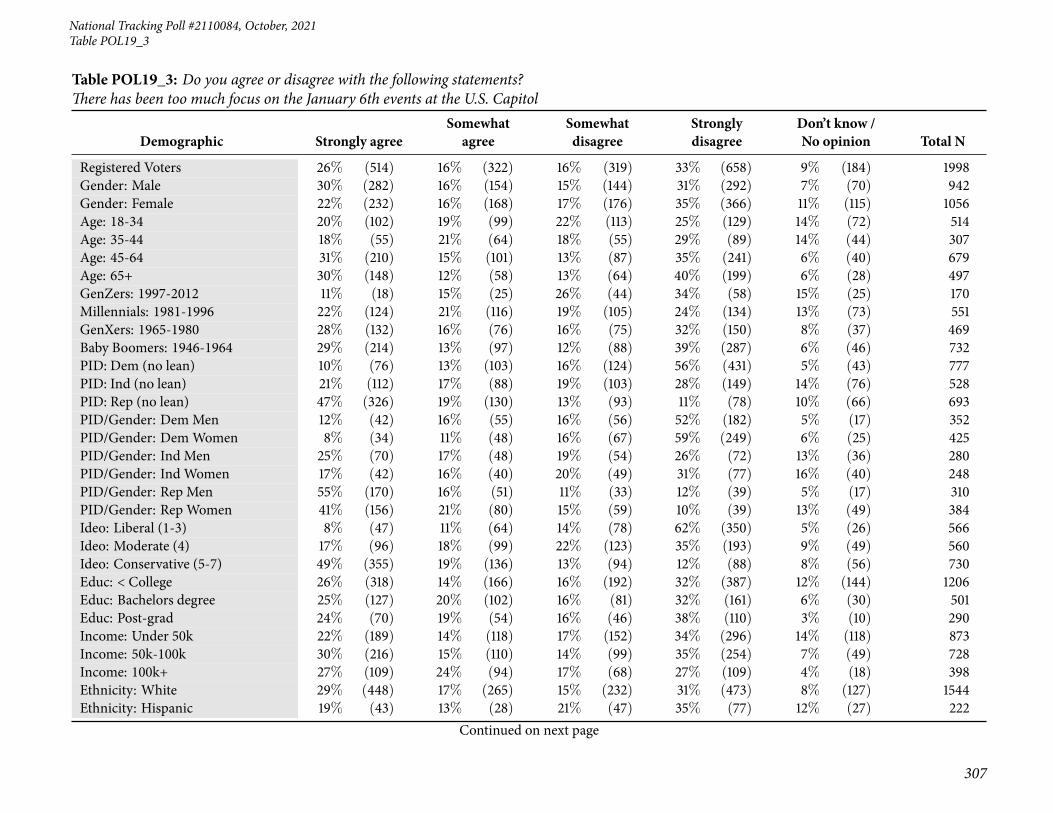
64 Table POL17_4: How responsible do you believe each of the following are for the events thatled to a group of people attacking police and breaking into the U.S. Capitol in Washington,D.C.? Sen. Josh Hawley . . . . . . . . . . . . . . . . . . . . . . . . . . . . . . . . . . . . . 251
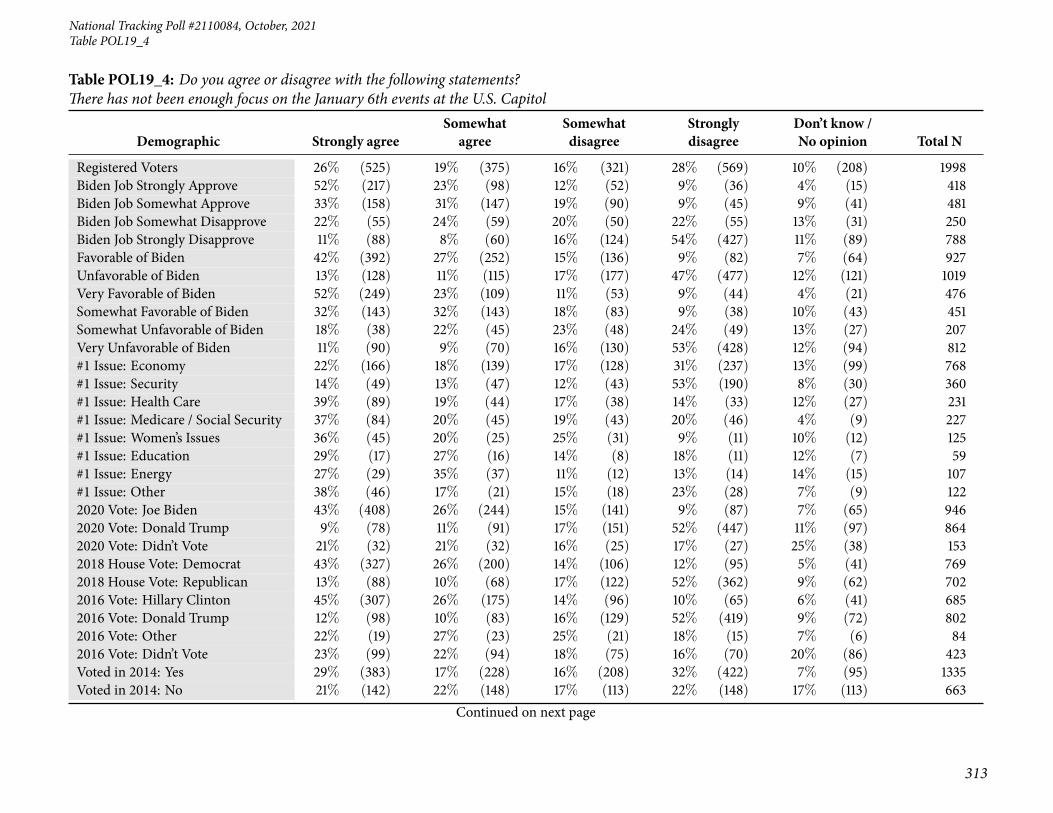
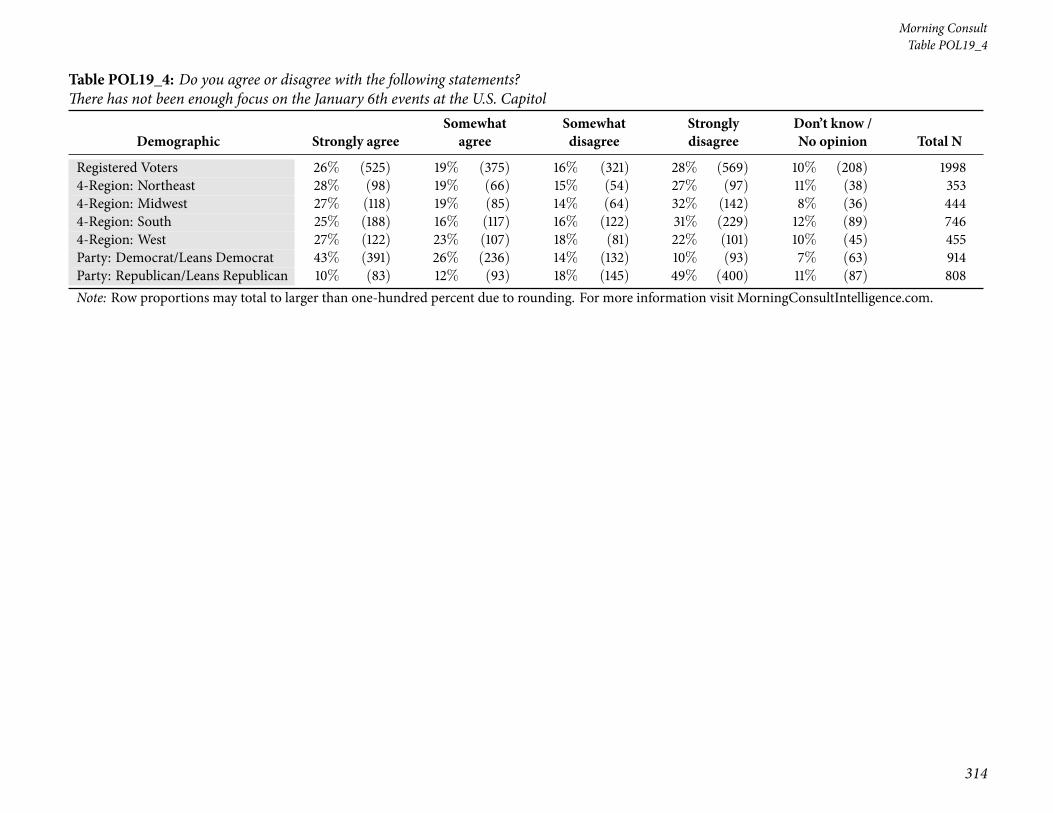
65 Table POL17_5: How responsible do you believe each of the following are for the events thatled to a group of people attacking police and breaking into the U.S. Capitol in Washington,D.C.? Local law enforcement . . . . . . . . . . . . . . . . . . . . . . . . . . . . . . . . . . 255
66 Table POL17_6: How responsible do you believe each of the following are for the events thatled to a group of people attacking police and breaking into the U.S. Capitol in Washington,D.C.? Defense Department . . . . . . . . . . . . . . . . . . . . . . . . . . . . . . . . . . . 259
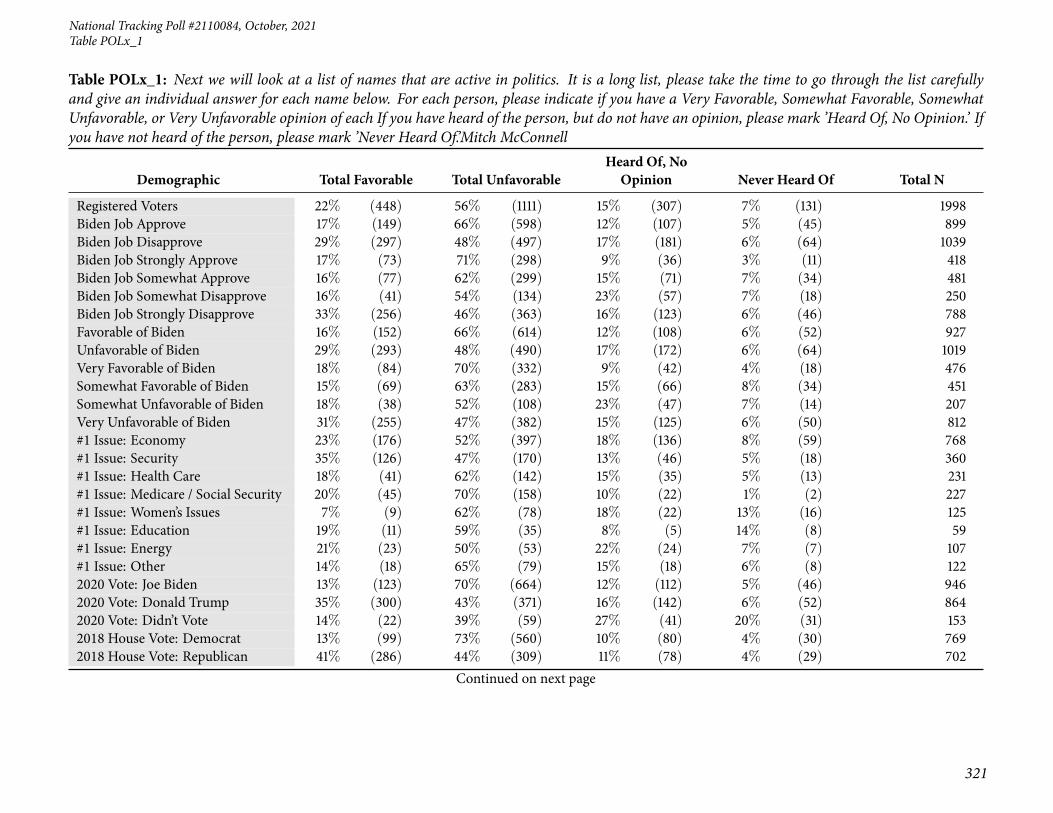
5
Page 6
Morning Consult
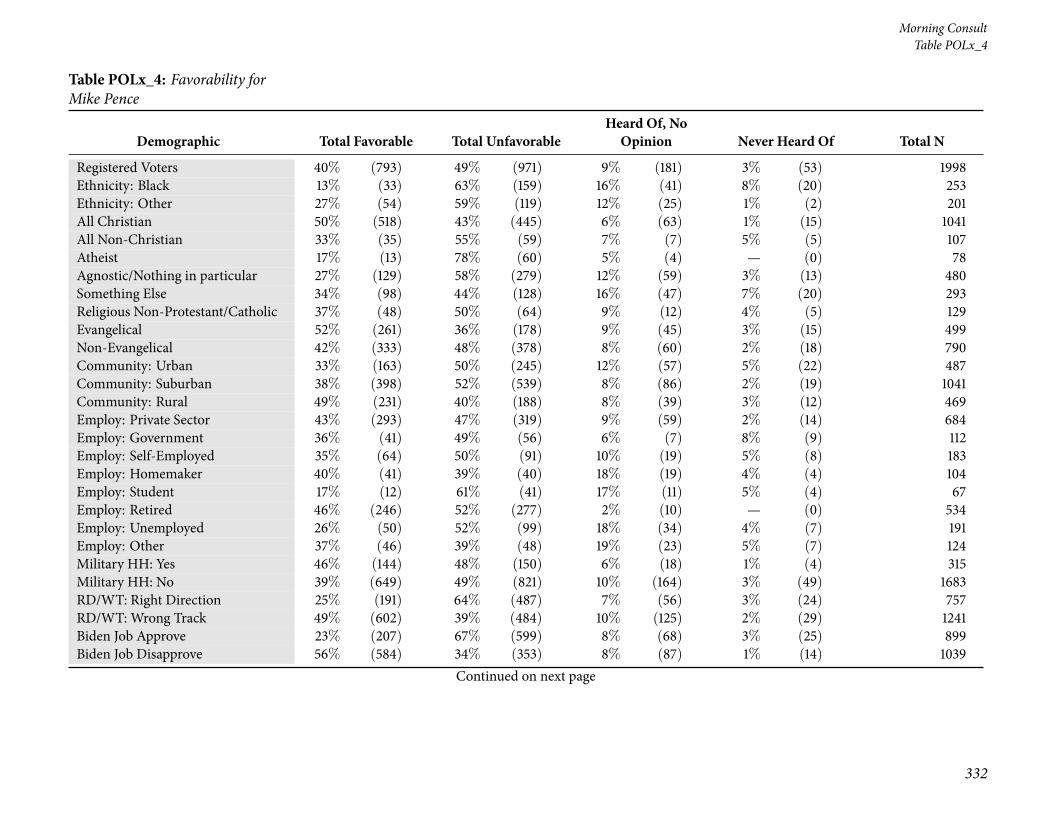
67 Table POL17_7: How responsible do you believe each of the following are for the events thatled to a group of people attacking police and breaking into the U.S. Capitol in Washington,D.C.? Donald Trump . . . . . . . . . . . . . . . . . . . . . . . . . . . . . . . . . . . . . . 263
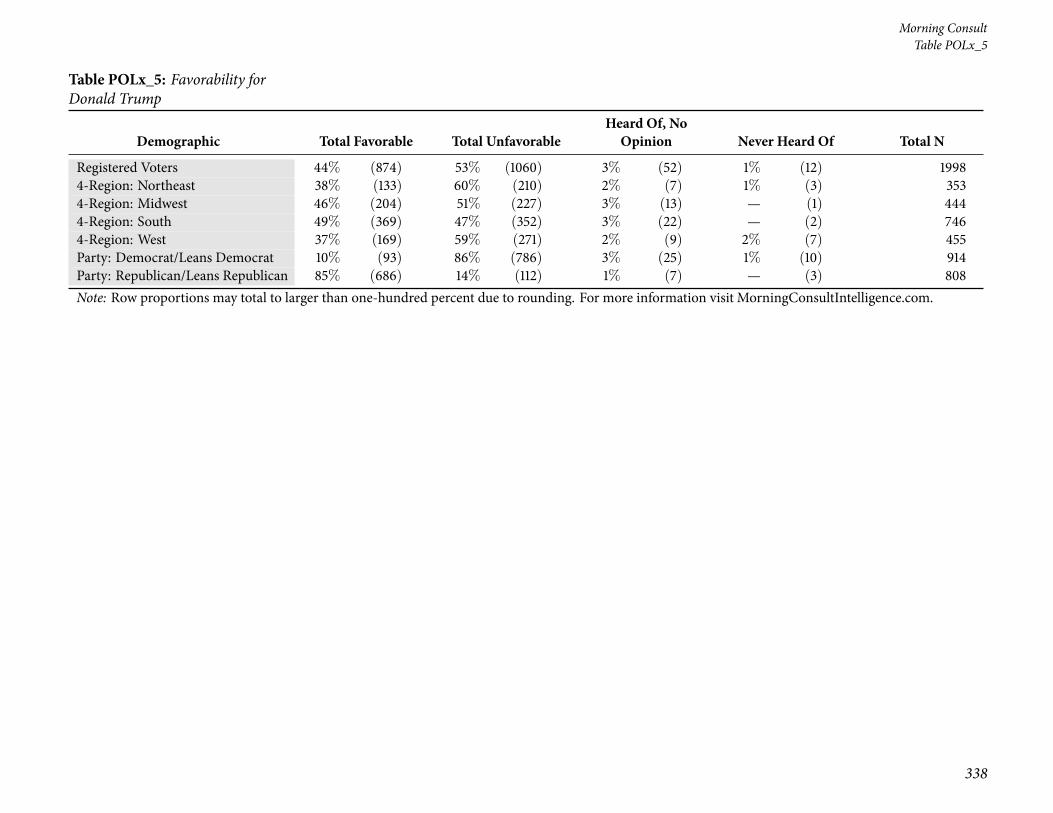
68 Table POL17_8: How responsible do you believe each of the following are for the events thatled to a group of people attacking police and breaking into the U.S. Capitol in Washington,D.C.? Mike Pence . . . . . . . . . . . . . . . . . . . . . . . . . . . . . . . . . . . . . . . . 267
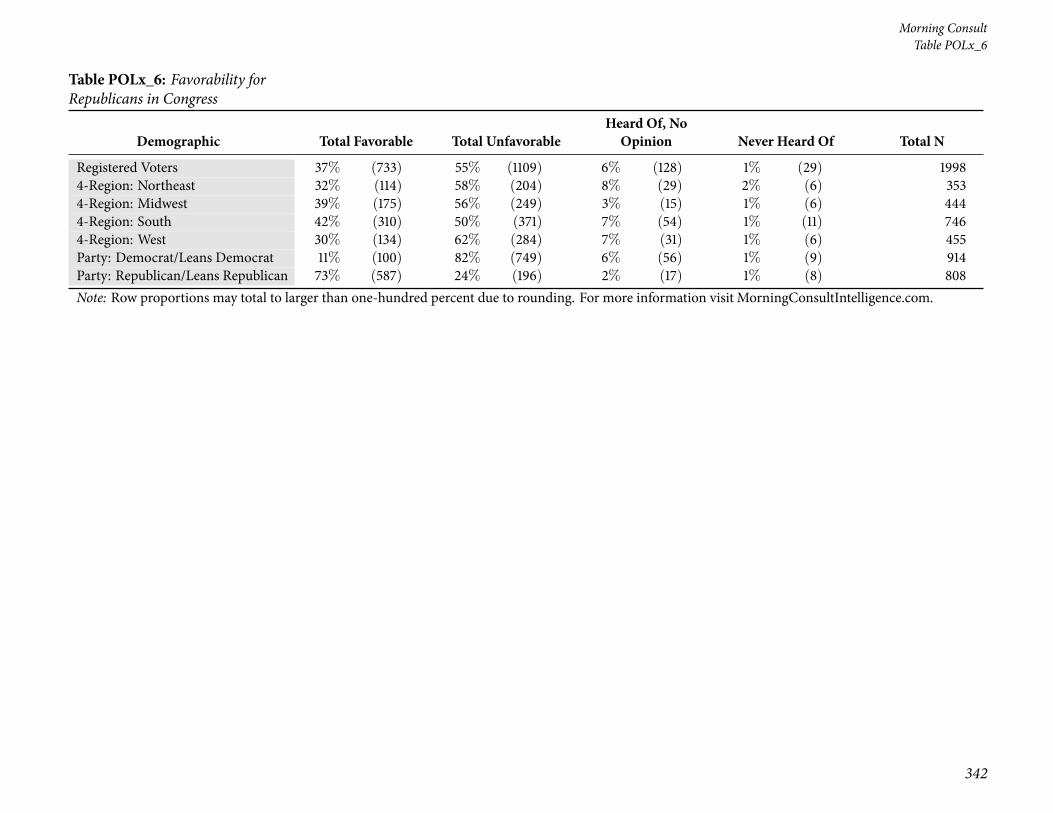
69 Table POL17_9: How responsible do you believe each of the following are for the events thatled to a group of people attacking police and breaking into the U.S. Capitol in Washington,D.C.? President Joe Biden . . . . . . . . . . . . . . . . . . . . . . . . . . . . . . . . . . . . 271
70 Table POL17_10: How responsible do you believe each of the following are for the events thatled to a group of people attacking police and breaking into the U.S. Capitol in Washington,D.C.? The people who broke into the U.S. Capitol . . . . . . . . . . . . . . . . . . . . . . . 275
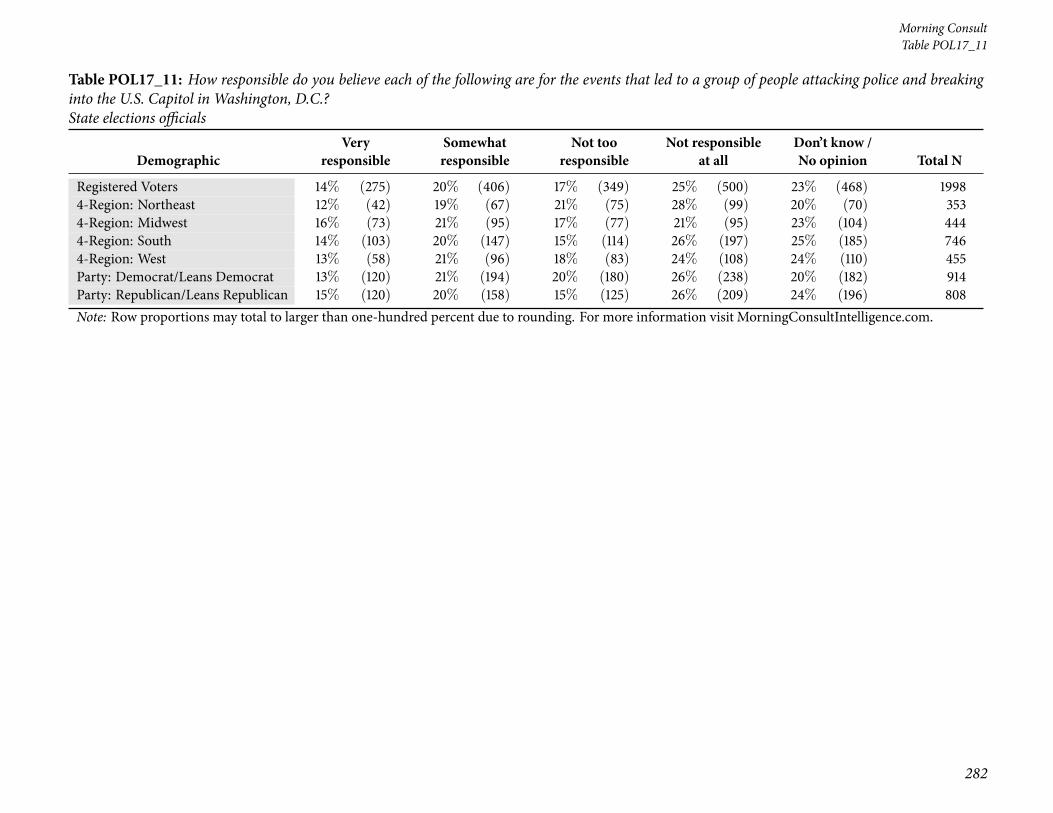
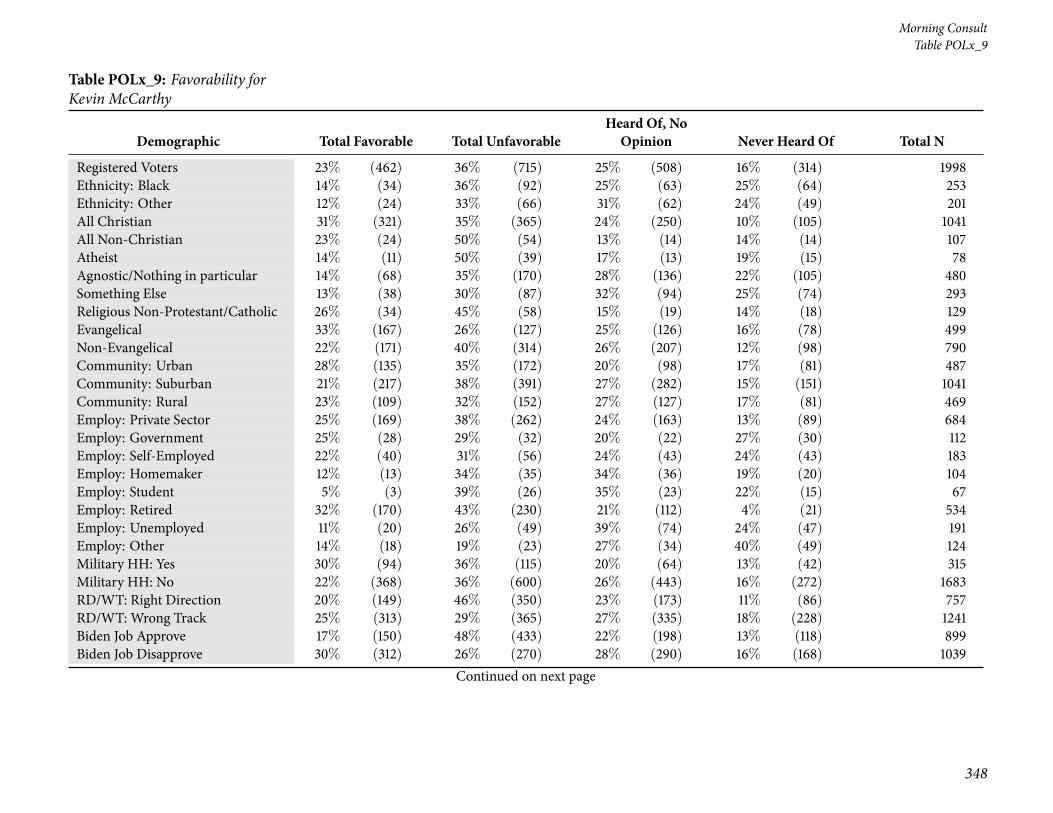
71 Table POL17_11: How responsible do you believe each of the following are for the events thatled to a group of people attacking police and breaking into the U.S. Capitol in Washington,D.C.? State elections officials . . . . . . . . . . . . . . . . . . . . . . . . . . . . . . . . . . 279
72 Table POL17_12: How responsible do you believe each of the following are for the events thatled to a group of people attacking police and breaking into the U.S. Capitol in Washington,D.C.? State legislators . . . . . . . . . . . . . . . . . . . . . . . . . . . . . . . . . . . . . . 283
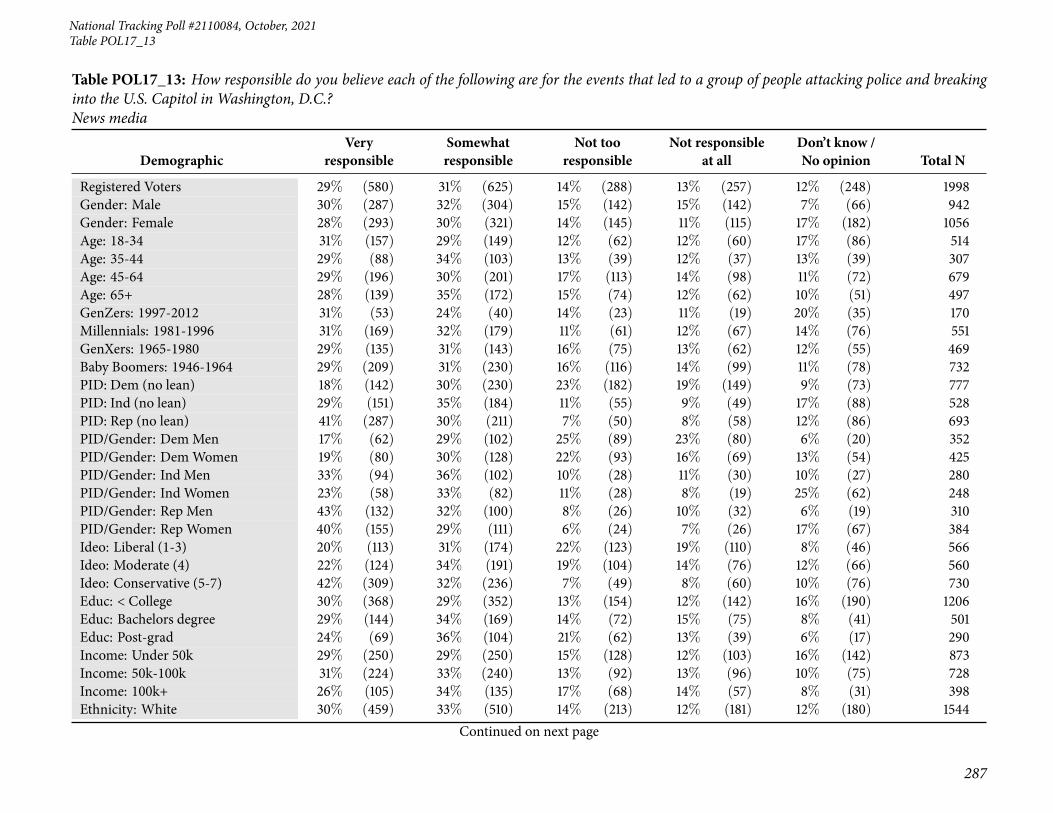
73 Table POL17_13: How responsible do you believe each of the following are for the events thatled to a group of people attacking police and breaking into the U.S. Capitol in Washington,D.C.? News media . . . . . . . . . . . . . . . . . . . . . . . . . . . . . . . . . . . . . . . 287
74 Table POL17_14: How responsible do you believe each of the following are for the events thatled to a group of people attacking police and breaking into the U.S. Capitol in Washington,D.C.? Social media companies . . . . . . . . . . . . . . . . . . . . . . . . . . . . . . . . . 291
75 Table POL18: And specifically, how important is it for the federal government to continue toinvestigate the events that occurred in the U.S. Capitol in Washington, D.C. on January 6th? . 295
76 Table POL19_1: Do you agree or disagree with the following statements? The people whobroke into the U.S. Capitol are representative of the Republican Party . . . . . . . . . . . . . 299
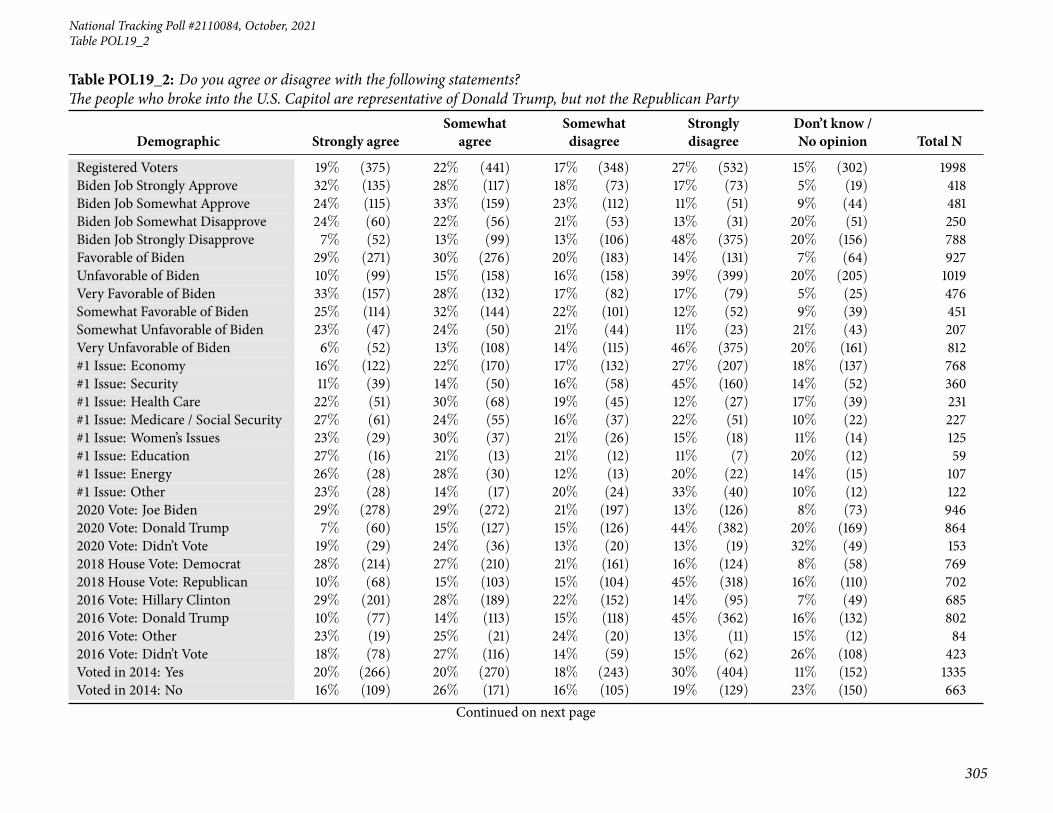
77 Table POL19_2: Do you agree or disagree with the following statements? The people whobroke into the U.S. Capitol are representative of Donald Trump, but not the Republican Party 303
78 Table POL19_3: Do you agree or disagree with the following statements? There has been toomuch focus on the January 6th events at the U.S. Capitol . . . . . . . . . . . . . . . . . . . 307
79 Table POL19_4: Do you agree or disagree with the following statements? There has not beenenough focus on the January 6th events at the U.S. Capitol . . . . . . . . . . . . . . . . . . 311
6
Page 7
National Tracking Poll #2110084, October, 2021
80 Table POL20: As you may know, House Speaker Nancy Pelosi (D-Calif.) appointed sevenDemocrats and two Republicans to serve on a special congressional committee to investigatethe events that occurred at the U.S. Capitol on January 6th.Based on what you know, do youapprove or disapprove of the special congressional committee investigating the events that oc-curred at the U.S. Capitol on January 6th? . . . . . . . . . . . . . . . . . . . . . . . . . . . 315
81 Table POLx_1: Next we will look at a list of names that are active in politics. It is a longlist, please take the time to go through the list carefully and give an individual answer foreach name below. For each person, please indicate if you have a Very Favorable, SomewhatFavorable, Somewhat Unfavorable, or Very Unfavorable opinion of each If you have heard ofthe person, but do not have an opinion, please mark ’Heard Of, No Opinion.’ If you have notheard of the person, please mark ’Never Heard Of.’Mitch McConnell . . . . . . . . . . . . . 319
82 Table POLx_2: Favorability for Nancy Pelosi . . . . . . . . . . . . . . . . . . . . . . . . . 323
83 Table POLx_3: Favorability for Charles Schumer . . . . . . . . . . . . . . . . . . . . . . . 327
84 Table POLx_4: Favorability for Mike Pence . . . . . . . . . . . . . . . . . . . . . . . . . . 331
85 Table POLx_5: Favorability for Donald Trump . . . . . . . . . . . . . . . . . . . . . . . . 335
86 Table POLx_6: Favorability for Republicans in Congress . . . . . . . . . . . . . . . . . . . 339
87 Table POLx_7: Favorability for Democrats in Congress . . . . . . . . . . . . . . . . . . . . 343
88 Table POLx_9: Favorability for Kevin McCarthy . . . . . . . . . . . . . . . . . . . . . . . 347
89 Table POLx_10: Favorability for Joe Biden . . . . . . . . . . . . . . . . . . . . . . . . . . 351
90 Table POLx_11: Favorability for Kamala Harris . . . . . . . . . . . . . . . . . . . . . . . 355
91 Table POLx_12: Favorability for Pope Francis . . . . . . . . . . . . . . . . . . . . . . . . 359
92 Summary Statistics of Survey Respondent Demographics . . . . . . . . . . . . . . . . . 363
7
Page 8
8
Morning ConsultTable P1
Crosstabulation Results by Respondent Demographics
Table P1: Now, generally speaking, would you say that things in the country are going in the right direction, or have they pretty seriously gotten off onthe wrong track?
Demographic Right Direction Wrong Track Total N
Registered Voters 38% (757) 62% (1241) 1998Gender: Male 44% (417) 56% (525) 942Gender: Female 32% (340) 68% (716) 1056Age: 18-34 44% (226) 56% (288) 514Age: 35-44 46% (141) 54% (166) 307Age: 45-64 33% (222) 67% (457) 679Age: 65+ 34% (168) 66% (329) 497GenZers: 1997-2012 37% (62) 63% (108) 170Millennials: 1981-1996 48% (267) 52% (284) 551GenXers: 1965-1980 34% (158) 66% (311) 469Baby Boomers: 1946-1964 34% (246) 66% (486) 732PID: Dem (no lean) 69% (534) 31% (243) 777PID: Ind (no lean) 28% (149) 72% (379) 528PID: Rep (no lean) 11% (74) 89% (619) 693PID/Gender: DemMen 78% (274) 22% (78) 352PID/Gender: DemWomen 61% (260) 39% (165) 425PID/Gender: Ind Men 33% (93) 67% (187) 280PID/Gender: Ind Women 23% (56) 77% (192) 248PID/Gender: Rep Men 16% (50) 84% (260) 310PID/Gender: Rep Women 6% (25) 94% (359) 384Ideo: Liberal (1-3) 67% (377) 33% (189) 566Ideo: Moderate (4) 48% (271) 52% (289) 560Ideo: Conservative (5-7) 11% (79) 89% (651) 730Educ: < College 32% (390) 68% (816) 1206Educ: Bachelors degree 43% (213) 57% (288) 501Educ: Post-grad 53% (154) 47% (136) 290Income: Under 50k 35% (305) 65% (568) 873Income: 50k-100k 35% (257) 65% (471) 728Income: 100k+ 49% (196) 51% (202) 398
Continued on next page
Page 9
National Tracking Poll #2110084, October, 2021
9
Table P1
Table P1: Now, generally speaking, would you say that things in the country are going in the right direction, or have they pretty seriously gotten off onthe wrong track?
Demographic Right Direction Wrong Track Total N
Registered Voters 38% (757) 62% (1241) 1998Ethnicity: White 35% (543) 65% (1000) 1544Ethnicity: Hispanic 46% (102) 54% (120) 222Ethnicity: Black 57% (143) 43% (110) 253Ethnicity: Other 35% (71) 65% (130) 201All Christian 36% (377) 64% (664) 1041All Non-Christian 58% (62) 42% (45) 107Atheist 56% (43) 44% (34) 78Agnostic/Nothing in particular 37% (179) 63% (301) 480Something Else 33% (96) 67% (197) 293Religious Non-Protestant/Catholic 51% (65) 49% (64) 129Evangelical 33% (164) 67% (334) 499Non-Evangelical 36% (287) 64% (502) 790Community: Urban 58% (285) 42% (203) 487Community: Suburban 35% (364) 65% (677) 1041Community: Rural 23% (109) 77% (361) 469Employ: Private Sector 42% (286) 58% (398) 684Employ: Government 53% (59) 47% (53) 112Employ: Self-Employed 33% (60) 67% (123) 183Employ: Homemaker 24% (25) 76% (79) 104Employ: Student 43% (29) 57% (38) 67Employ: Retired 34% (181) 66% (353) 534Employ: Unemployed 45% (86) 55% (104) 191Employ: Other 25% (31) 75% (92) 124Military HH: Yes 33% (103) 67% (212) 315Military HH: No 39% (654) 61% (1029) 1683RD/WT: Right Direction 100% (757) — (0) 757RD/WT: Wrong Track — (0) 100% (1241) 1241Biden Job Approve 76% (680) 24% (219) 899Biden Job Disapprove 6% (61) 94% (978) 1039
Continued on next page
Page 10
10
Morning ConsultTable P1
Table P1: Now, generally speaking, would you say that things in the country are going in the right direction, or have they pretty seriously gotten off onthe wrong track?
Demographic Right Direction Wrong Track Total N
Registered Voters 38% (757) 62% (1241) 1998Biden Job Strongly Approve 89% (372) 11% (47) 418Biden Job Somewhat Approve 64% (309) 36% (172) 481Biden Job Somewhat Disapprove 13% (32) 87% (219) 250Biden Job Strongly Disapprove 4% (29) 96% (759) 788Favorable of Biden 73% (677) 27% (250) 927Unfavorable of Biden 6% (63) 94% (956) 1019Very Favorable of Biden 87% (413) 13% (63) 476Somewhat Favorable of Biden 58% (264) 42% (187) 451Somewhat Unfavorable of Biden 16% (33) 84% (175) 207Very Unfavorable of Biden 4% (30) 96% (782) 812#1 Issue: Economy 31% (240) 69% (529) 768#1 Issue: Security 20% (71) 80% (289) 360#1 Issue: Health Care 62% (143) 38% (88) 231#1 Issue: Medicare / Social Security 43% (98) 57% (129) 227#1 Issue: Women’s Issues 50% (63) 50% (62) 125#1 Issue: Education 54% (32) 46% (28) 59#1 Issue: Energy 57% (61) 43% (46) 107#1 Issue: Other 42% (51) 58% (71) 1222020 Vote: Joe Biden 66% (627) 34% (319) 9462020 Vote: Donald Trump 9% (80) 91% (784) 8642020 Vote: Didn’t Vote 29% (45) 71% (108) 1532018 House Vote: Democrat 66% (504) 34% (265) 7692018 House Vote: Republican 11% (78) 89% (624) 7022016 Vote: Hillary Clinton 68% (468) 32% (216) 6852016 Vote: Donald Trump 13% (100) 87% (702) 8022016 Vote: Other 32% (27) 68% (57) 842016 Vote: Didn’t Vote 38% (159) 62% (264) 423Voted in 2014: Yes 39% (518) 61% (817) 1335Voted in 2014: No 36% (240) 64% (423) 663
Continued on next page
Page 11
National Tracking Poll #2110084, October, 2021
11
Table P1
Table P1: Now, generally speaking, would you say that things in the country are going in the right direction, or have they pretty seriously gotten off onthe wrong track?
Demographic Right Direction Wrong Track Total N
Registered Voters 38% (757) 62% (1241) 19984-Region: Northeast 42% (149) 58% (204) 3534-Region: Midwest 35% (154) 65% (291) 4444-Region: South 33% (245) 67% (500) 7464-Region: West 46% (210) 54% (246) 455Party: Democrat/Leans Democrat 67% (615) 33% (299) 914Party: Republican/Leans Republican 10% (83) 90% (725) 808Note: Row proportions may total to larger than one-hundred percent due to rounding. For more information visit MorningConsultIntelligence.com.
Page 12
12
Morning ConsultTable nr2b
Table nr2b: Do you approve or disapprove of the job Joe Biden is doing as President?
DemographicStronglyApprove
SomewhatApprove
SomewhatDisapprove
StronglyDisapprove
Don’t Know /No Opinion Total N
Registered Voters 21% (418) 24% (481) 13% (250) 39% (788) 3% (60) 1998Gender: Male 26% (243) 22% (212) 11% (106) 38% (360) 2% (21) 942Gender: Female 17% (175) 25% (269) 14% (144) 41% (429) 4% (39) 1056Age: 18-34 20% (103) 29% (148) 16% (84) 28% (142) 7% (38) 514Age: 35-44 24% (73) 32% (98) 14% (44) 27% (83) 3% (10) 307Age: 45-64 18% (120) 21% (143) 12% (84) 47% (320) 2% (12) 679Age: 65+ 24% (122) 19% (93) 8% (38) 49% (244) — (0) 497GenZers: 1997-2012 11% (18) 33% (56) 20% (33) 23% (39) 14% (24) 170Millennials: 1981-1996 26% (144) 28% (154) 14% (76) 29% (158) 4% (20) 551GenXers: 1965-1980 14% (67) 25% (116) 15% (71) 43% (202) 3% (13) 469Baby Boomers: 1946-1964 23% (171) 20% (147) 9% (63) 47% (348) — (3) 732PID: Dem (no lean) 44% (342) 40% (314) 9% (70) 5% (36) 2% (14) 777PID: Ind (no lean) 9% (48) 25% (131) 19% (103) 38% (201) 8% (44) 528PID: Rep (no lean) 4% (28) 5% (36) 11% (78) 79% (551) — (1) 693PID/Gender: DemMen 55% (192) 33% (117) 6% (21) 4% (15) 2% (6) 352PID/Gender: DemWomen 35% (149) 46% (197) 12% (49) 5% (21) 2% (8) 425PID/Gender: Ind Men 10% (28) 26% (73) 17% (48) 42% (117) 5% (13) 280PID/Gender: Ind Women 8% (20) 24% (58) 22% (54) 34% (84) 13% (31) 248PID/Gender: Rep Men 7% (23) 7% (22) 12% (37) 73% (227) — (1) 310PID/Gender: Rep Women 1% (5) 4% (14) 11% (41) 84% (323) — (0) 384Ideo: Liberal (1-3) 42% (236) 40% (226) 11% (62) 6% (32) 2% (10) 566Ideo: Moderate (4) 23% (128) 35% (193) 19% (107) 21% (118) 2% (14) 560Ideo: Conservative (5-7) 6% (42) 6% (42) 8% (61) 80% (583) — (3) 730Educ: < College 18% (215) 22% (262) 12% (139) 45% (539) 4% (52) 1206Educ: Bachelors degree 23% (115) 26% (130) 15% (73) 35% (175) 1% (7) 501Educ: Post-grad 30% (88) 30% (88) 13% (38) 26% (75) — (1) 290Income: Under 50k 18% (158) 25% (214) 14% (123) 38% (331) 5% (46) 873Income: 50k-100k 21% (155) 22% (159) 12% (87) 43% (316) 1% (10) 728Income: 100k+ 26% (105) 27% (107) 10% (40) 36% (142) 1% (4) 398Ethnicity: White 20% (310) 21% (318) 12% (183) 45% (702) 2% (30) 1544Ethnicity: Hispanic 19% (43) 30% (66) 12% (28) 34% (75) 5% (11) 222Ethnicity: Black 28% (71) 41% (105) 13% (33) 11% (28) 7% (17) 253
Continued on next page
Page 13
National Tracking Poll #2110084, October, 2021
13
Table nr2b
Table nr2b: Do you approve or disapprove of the job Joe Biden is doing as President?
DemographicStronglyApprove
SomewhatApprove
SomewhatDisapprove
StronglyDisapprove
Don’t Know /No Opinion Total N
Registered Voters 21% (418) 24% (481) 13% (250) 39% (788) 3% (60) 1998Ethnicity: Other 18% (36) 29% (59) 18% (35) 29% (58) 6% (12) 201All Christian 22% (224) 21% (218) 10% (99) 47% (489) 1% (10) 1041All Non-Christian 38% (41) 30% (32) 12% (13) 18% (19) 2% (2) 107Atheist 25% (19) 39% (31) 15% (12) 21% (16) — (0) 78Agnostic/Nothing in particular 17% (83) 29% (140) 16% (75) 31% (150) 7% (32) 480Something Else 17% (51) 21% (61) 17% (51) 39% (114) 5% (16) 293Religious Non-Protestant/Catholic 33% (43) 26% (33) 14% (18) 26% (33) 2% (2) 129Evangelical 18% (92) 18% (90) 13% (63) 48% (241) 3% (13) 499Non-Evangelical 21% (170) 23% (183) 10% (78) 44% (345) 2% (14) 790Community: Urban 33% (161) 29% (139) 12% (59) 22% (108) 4% (21) 487Community: Suburban 19% (196) 26% (274) 13% (135) 40% (415) 2% (21) 1041Community: Rural 13% (61) 14% (68) 12% (56) 57% (266) 4% (18) 469Employ: Private Sector 22% (149) 27% (183) 14% (98) 36% (244) 2% (11) 684Employ: Government 23% (26) 28% (32) 17% (20) 26% (29) 5% (6) 112Employ: Self-Employed 17% (32) 26% (47) 12% (23) 40% (73) 4% (8) 183Employ: Homemaker 12% (12) 23% (24) 9% (10) 55% (57) 1% (1) 104Employ: Student 16% (11) 43% (29) 14% (10) 17% (11) 10% (7) 67Employ: Retired 26% (137) 17% (92) 8% (42) 49% (261) — (1) 534Employ: Unemployed 22% (42) 26% (50) 12% (23) 30% (58) 9% (18) 191Employ: Other 7% (9) 20% (25) 22% (27) 44% (55) 7% (8) 124Military HH: Yes 26% (81) 13% (42) 11% (36) 47% (148) 3% (8) 315Military HH: No 20% (337) 26% (439) 13% (214) 38% (640) 3% (52) 1683RD/WT: Right Direction 49% (372) 41% (309) 4% (32) 4% (29) 2% (16) 757RD/WT: Wrong Track 4% (47) 14% (172) 18% (219) 61% (759) 4% (44) 1241Biden Job Approve 47% (418) 53% (481) — (0) — (0) — (0) 899Biden Job Disapprove — (0) — (0) 24% (250) 76% (788) — (0) 1039Biden Job Strongly Approve 100% (418) — (0) — (0) — (0) — (0) 418Biden Job Somewhat Approve — (0) 100% (481) — (0) — (0) — (0) 481Biden Job Somewhat Disapprove — (0) — (0) 100% (250) — (0) — (0) 250Biden Job Strongly Disapprove — (0) — (0) — (0) 100% (788) — (0) 788
Continued on next page
Page 14
14
Morning ConsultTable nr2b
Table nr2b: Do you approve or disapprove of the job Joe Biden is doing as President?
DemographicStronglyApprove
SomewhatApprove
SomewhatDisapprove
StronglyDisapprove
Don’t Know /No Opinion Total N
Registered Voters 21% (418) 24% (481) 13% (250) 39% (788) 3% (60) 1998Favorable of Biden 44% (406) 48% (442) 4% (41) 1% (13) 3% (26) 927Unfavorable of Biden 1% (8) 2% (25) 20% (205) 76% (771) 1% (9) 1019Very Favorable of Biden 80% (380) 17% (80) — (2) 2% (11) 1% (3) 476Somewhat Favorable of Biden 6% (26) 80% (362) 9% (39) — (1) 5% (23) 451Somewhat Unfavorable of Biden 1% (2) 10% (20) 81% (167) 8% (16) 1% (2) 207Very Unfavorable of Biden 1% (7) 1% (5) 5% (38) 93% (755) 1% (7) 812#1 Issue: Economy 13% (99) 26% (202) 16% (121) 43% (328) 2% (18) 768#1 Issue: Security 12% (43) 7% (26) 10% (34) 70% (253) 1% (2) 360#1 Issue: Health Care 37% (86) 28% (65) 12% (29) 16% (38) 6% (14) 231#1 Issue: Medicare / Social Security 33% (74) 25% (56) 9% (20) 32% (72) 2% (5) 227#1 Issue: Women’s Issues 23% (29) 40% (50) 12% (15) 16% (20) 9% (11) 125#1 Issue: Education 30% (17) 38% (22) 10% (6) 17% (10) 6% (3) 59#1 Issue: Energy 31% (34) 33% (36) 13% (14) 19% (20) 3% (3) 107#1 Issue: Other 30% (36) 18% (22) 9% (11) 39% (48) 4% (5) 1222020 Vote: Joe Biden 40% (378) 41% (388) 12% (118) 4% (41) 2% (21) 9462020 Vote: Donald Trump 3% (26) 6% (51) 10% (89) 79% (686) 1% (12) 8642020 Vote: Didn’t Vote 9% (14) 23% (36) 23% (35) 30% (47) 14% (22) 1532018 House Vote: Democrat 43% (332) 38% (289) 10% (79) 7% (55) 2% (14) 7692018 House Vote: Republican 4% (29) 7% (52) 10% (73) 77% (542) 1% (5) 7022016 Vote: Hillary Clinton 46% (312) 39% (265) 9% (64) 5% (34) 1% (9) 6852016 Vote: Donald Trump 5% (39) 9% (71) 11% (85) 75% (600) 1% (6) 8022016 Vote: Other 8% (7) 30% (25) 21% (17) 35% (29) 7% (6) 842016 Vote: Didn’t Vote 14% (59) 28% (117) 20% (84) 29% (123) 9% (39) 423Voted in 2014: Yes 25% (335) 22% (299) 10% (137) 41% (554) 1% (10) 1335Voted in 2014: No 12% (83) 27% (182) 17% (113) 35% (235) 8% (50) 6634-Region: Northeast 26% (93) 24% (84) 12% (44) 35% (124) 2% (8) 3534-Region: Midwest 19% (86) 23% (104) 13% (56) 41% (182) 4% (17) 4444-Region: South 17% (124) 23% (168) 12% (89) 46% (341) 3% (23) 7464-Region: West 25% (116) 27% (124) 13% (61) 31% (141) 3% (13) 455Party: Democrat/Leans Democrat 41% (375) 41% (373) 11% (101) 5% (42) 3% (23) 914Party: Republican/Leans Republican 4% (30) 5% (42) 13% (101) 78% (633) — (2) 808Note: Row proportions may total to larger than one-hundred percent due to rounding. For more information visit MorningConsultIntelligence.com.
Page 15
National Tracking Poll #2110084, October, 2021
15
Table nr2bNET
Table nr2bNET: Do you approve or disapprove of the job Joe Biden is doing as President?
Demographic Total Approve Total DisapproveDon’t Know / No
Opinion Total N
Registered Voters 45% (899) 52% (1039) 3% (60) 1998Gender: Male 48% (455) 49% (466) 2% (21) 942Gender: Female 42% (444) 54% (573) 4% (39) 1056Age: 18-34 49% (251) 44% (225) 7% (38) 514Age: 35-44 56% (171) 41% (127) 3% (10) 307Age: 45-64 39% (263) 60% (404) 2% (12) 679Age: 65+ 43% (215) 57% (282) — (0) 497GenZers: 1997-2012 43% (74) 42% (72) 14% (24) 170Millennials: 1981-1996 54% (298) 42% (234) 4% (20) 551GenXers: 1965-1980 39% (183) 58% (273) 3% (13) 469Baby Boomers: 1946-1964 43% (318) 56% (410) — (3) 732PID: Dem (no lean) 84% (656) 14% (107) 2% (14) 777PID: Ind (no lean) 34% (179) 58% (304) 8% (44) 528PID: Rep (no lean) 9% (64) 91% (628) — (1) 693PID/Gender: DemMen 88% (310) 10% (36) 2% (6) 352PID/Gender: DemWomen 82% (346) 17% (70) 2% (8) 425PID/Gender: Ind Men 36% (101) 59% (166) 5% (13) 280PID/Gender: Ind Women 32% (79) 56% (138) 13% (31) 248PID/Gender: Rep Men 14% (44) 85% (264) — (1) 310PID/Gender: Rep Women 5% (19) 95% (364) — (0) 384Ideo: Liberal (1-3) 82% (462) 17% (94) 2% (10) 566Ideo: Moderate (4) 57% (321) 40% (225) 2% (14) 560Ideo: Conservative (5-7) 11% (84) 88% (644) — (3) 730Educ: < College 40% (477) 56% (678) 4% (52) 1206Educ: Bachelors degree 49% (245) 50% (249) 1% (7) 501Educ: Post-grad 61% (177) 39% (112) — (1) 290Income: Under 50k 43% (372) 52% (454) 5% (46) 873Income: 50k-100k 43% (315) 55% (403) 1% (10) 728Income: 100k+ 53% (212) 46% (182) 1% (4) 398Ethnicity: White 41% (628) 57% (885) 2% (30) 1544Ethnicity: Hispanic 49% (109) 46% (103) 5% (11) 222Ethnicity: Black 69% (176) 24% (60) 7% (17) 253
Continued on next page
Page 16
16
Morning ConsultTable nr2bNET
Table nr2bNET: Do you approve or disapprove of the job Joe Biden is doing as President?
Demographic Total Approve Total DisapproveDon’t Know / No
Opinion Total N
Registered Voters 45% (899) 52% (1039) 3% (60) 1998Ethnicity: Other 47% (95) 47% (94) 6% (12) 201All Christian 42% (442) 57% (589) 1% (10) 1041All Non-Christian 68% (72) 30% (32) 2% (2) 107Atheist 64% (50) 36% (28) — (0) 78Agnostic/Nothing in particular 46% (223) 47% (225) 7% (32) 480Something Else 38% (112) 56% (165) 5% (16) 293Religious Non-Protestant/Catholic 59% (76) 39% (51) 2% (2) 129Evangelical 37% (182) 61% (304) 3% (13) 499Non-Evangelical 45% (352) 54% (424) 2% (14) 790Community: Urban 62% (300) 34% (167) 4% (21) 487Community: Suburban 45% (470) 53% (550) 2% (21) 1041Community: Rural 28% (129) 69% (322) 4% (18) 469Employ: Private Sector 48% (331) 50% (342) 2% (11) 684Employ: Government 51% (57) 43% (49) 5% (6) 112Employ: Self-Employed 43% (79) 52% (96) 4% (8) 183Employ: Homemaker 35% (36) 64% (67) 1% (1) 104Employ: Student 59% (40) 31% (21) 10% (7) 67Employ: Retired 43% (229) 57% (303) — (1) 534Employ: Unemployed 48% (92) 42% (80) 9% (18) 191Employ: Other 27% (34) 66% (82) 7% (8) 124Military HH: Yes 39% (123) 58% (184) 3% (8) 315Military HH: No 46% (776) 51% (855) 3% (52) 1683RD/WT: Right Direction 90% (680) 8% (61) 2% (16) 757RD/WT: Wrong Track 18% (219) 79% (978) 4% (44) 1241Biden Job Approve 100% (899) — (0) — (0) 899Biden Job Disapprove — (0) 100% (1039) — (0) 1039Biden Job Strongly Approve 100% (418) — (0) — (0) 418Biden Job Somewhat Approve 100% (481) — (0) — (0) 481Biden Job Somewhat Disapprove — (0) 100% (250) — (0) 250Biden Job Strongly Disapprove — (0) 100% (788) — (0) 788
Continued on next page
Page 17
National Tracking Poll #2110084, October, 2021
17
Table nr2bNET
Table nr2bNET: Do you approve or disapprove of the job Joe Biden is doing as President?
Demographic Total Approve Total DisapproveDon’t Know / No
Opinion Total N
Registered Voters 45% (899) 52% (1039) 3% (60) 1998Favorable of Biden 91% (847) 6% (53) 3% (26) 927Unfavorable of Biden 3% (33) 96% (977) 1% (9) 1019Very Favorable of Biden 97% (460) 3% (13) 1% (3) 476Somewhat Favorable of Biden 86% (388) 9% (40) 5% (23) 451Somewhat Unfavorable of Biden 11% (22) 89% (184) 1% (2) 207Very Unfavorable of Biden 1% (12) 98% (793) 1% (7) 812#1 Issue: Economy 39% (301) 59% (450) 2% (18) 768#1 Issue: Security 19% (70) 80% (288) 1% (2) 360#1 Issue: Health Care 65% (151) 29% (66) 6% (14) 231#1 Issue: Medicare / Social Security 57% (130) 41% (92) 2% (5) 227#1 Issue: Women’s Issues 64% (79) 28% (35) 9% (11) 125#1 Issue: Education 67% (40) 27% (16) 6% (3) 59#1 Issue: Energy 65% (69) 32% (35) 3% (3) 107#1 Issue: Other 48% (59) 48% (58) 4% (5) 1222020 Vote: Joe Biden 81% (766) 17% (159) 2% (21) 9462020 Vote: Donald Trump 9% (77) 90% (775) 1% (12) 8642020 Vote: Didn’t Vote 32% (49) 53% (82) 14% (22) 1532018 House Vote: Democrat 81% (621) 17% (134) 2% (14) 7692018 House Vote: Republican 11% (81) 88% (616) 1% (5) 7022016 Vote: Hillary Clinton 84% (577) 14% (98) 1% (9) 6852016 Vote: Donald Trump 14% (111) 85% (685) 1% (6) 8022016 Vote: Other 38% (32) 55% (46) 7% (6) 842016 Vote: Didn’t Vote 42% (176) 49% (207) 9% (39) 423Voted in 2014: Yes 47% (634) 52% (691) 1% (10) 1335Voted in 2014: No 40% (265) 53% (348) 8% (50) 6634-Region: Northeast 50% (177) 48% (168) 2% (8) 3534-Region: Midwest 43% (190) 54% (238) 4% (17) 4444-Region: South 39% (292) 58% (431) 3% (23) 7464-Region: West 53% (240) 44% (202) 3% (13) 455Party: Democrat/Leans Democrat 82% (748) 16% (143) 3% (23) 914Party: Republican/Leans Republican 9% (72) 91% (734) — (2) 808Note: Row proportions may total to larger than one-hundred percent due to rounding. For more information visit MorningConsultIntelligence.com.
Page 18
18
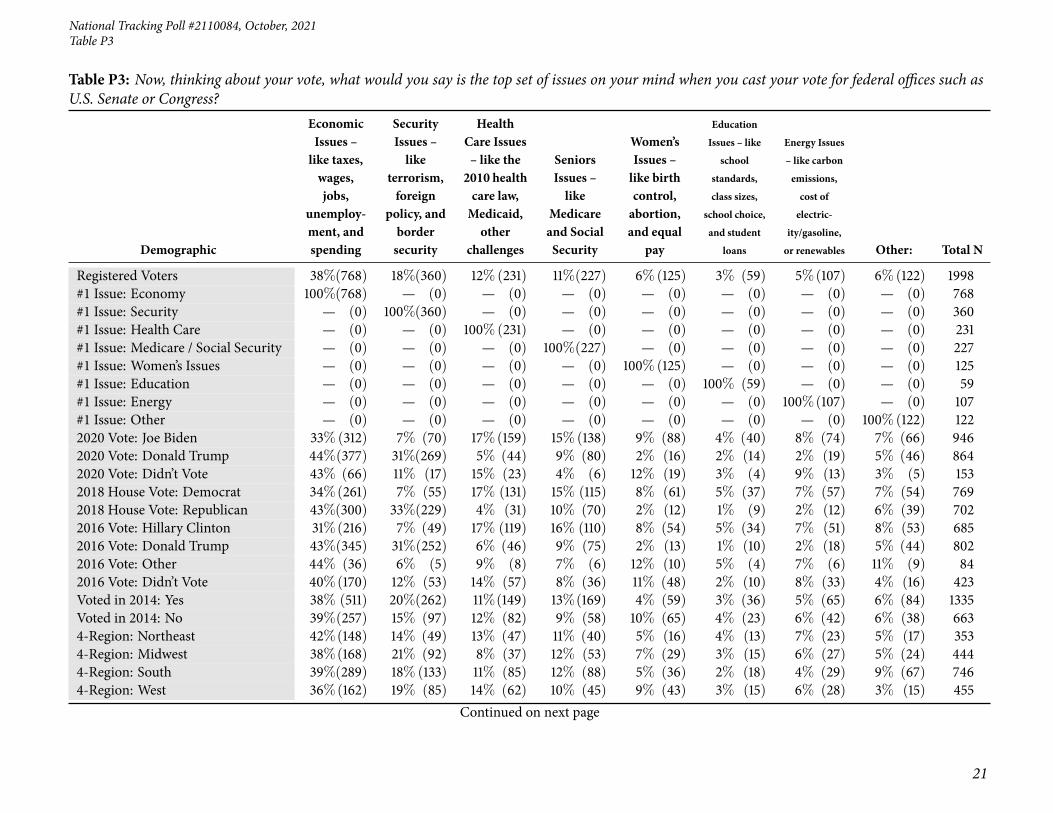
Morning ConsultTable P3
Table P3: Now, thinking about your vote, what would you say is the top set of issues on your mind when you cast your vote for federal offices such asU.S. Senate or Congress?
Demographic
EconomicIssues –like taxes,wages,jobs,
unemploy-ment, andspending
SecurityIssues –like
terrorism,foreign
policy, andbordersecurity
HealthCare Issues– like the2010 healthcare law,Medicaid,other
challenges
SeniorsIssues –like
Medicareand SocialSecurity
Women’sIssues –like birthcontrol,abortion,and equal
pay
EducationIssues – like
schoolstandards,class sizes,
school choice,and student
loans
Energy Issues– like carbonemissions,cost ofelectric-
ity/gasoline,or renewables Other: Total N
Registered Voters 38%(768) 18%(360) 12%(231) 11%(227) 6%(125) 3% (59) 5%(107) 6%(122) 1998Gender: Male 39%(366) 18%(174) 14%(127) 12% (110) 2% (17) 3% (25) 7% (62) 6% (60) 942Gender: Female 38%(402) 18%(186) 10%(103) 11% (117) 10%(107) 3% (34) 4% (44) 6% (62) 1056Age: 18-34 40%(206) 11% (55) 15% (75) 2% (9) 14% (70) 7% (35) 10% (51) 3% (14) 514Age: 35-44 49%(149) 14% (43) 17% (52) 3% (9) 5% (16) 4% (13) 6% (19) 2% (6) 307Age: 45-64 44%(296) 18%(120) 10% (69) 11% (74) 4% (28) 1% (7) 3% (19) 10% (67) 679Age: 65+ 23% (116) 29%(142) 7% (35) 27%(135) 2% (11) 1% (5) 4% (18) 7% (35) 497GenZers: 1997-2012 33% (57) 7% (11) 10% (17) 2% (4) 25% (42) 10% (17) 10% (16) 3% (6) 170Millennials: 1981-1996 45%(247) 13% (72) 17% (96) 2% (10) 7% (38) 5% (26) 9% (49) 2% (13) 551GenXers: 1965-1980 50%(236) 18% (85) 10% (47) 5% (23) 4% (19) 2% (10) 3% (13) 8% (36) 469Baby Boomers: 1946-1964 29%(213) 22%(164) 9% (66) 23%(169) 3% (22) 1% (6) 3% (25) 9% (66) 732PID: Dem (no lean) 31%(241) 7% (57) 16%(128) 15% (119) 10% (79) 4% (33) 9% (69) 6% (50) 777PID: Ind (no lean) 41%(218) 18% (94) 12% (65) 8% (42) 6% (33) 4% (19) 4% (21) 7% (36) 528PID: Rep (no lean) 45%(309) 30%(208) 6% (38) 9% (65) 2% (13) 1% (7) 2% (17) 5% (36) 693PID/Gender: DemMen 29%(103) 10% (34) 21% (74) 15% (54) 3% (11) 4% (13) 10% (36) 7% (26) 352PID/Gender: DemWomen 32%(138) 5% (23) 13% (54) 15% (65) 16% (67) 5% (20) 8% (33) 6% (24) 425PID/Gender: Ind Men 44%(122) 19% (54) 12% (33) 7% (20) 2% (5) 3% (10) 5% (15) 8% (21) 280PID/Gender: Ind Women 39% (96) 16% (40) 13% (32) 9% (22) 11% (28) 4% (10) 2% (6) 6% (14) 248PID/Gender: Rep Men 45% (141) 27% (85) 7% (21) 12% (36) — (1) 1% (2) 4% (11) 4% (13) 310PID/Gender: Rep Women 44%(169) 32%(123) 4% (17) 8% (29) 3% (12) 1% (5) 1% (6) 6% (23) 384Ideo: Liberal (1-3) 28% (161) 6% (33) 18% (101) 14% (79) 12% (71) 5% (28) 10% (54) 7% (40) 566Ideo: Moderate (4) 43%(238) 15% (82) 11% (64) 12% (68) 5% (27) 2% (12) 7% (38) 5% (30) 560Ideo: Conservative (5-7) 42%(303) 32%(230) 5% (40) 10% (71) 2% (17) 1% (8) 2% (13) 6% (47) 730
Continued on next page
Page 19
National Tracking Poll #2110084, October, 2021
19
Table P3
Table P3: Now, thinking about your vote, what would you say is the top set of issues on your mind when you cast your vote for federal offices such asU.S. Senate or Congress?
Demographic
EconomicIssues –like taxes,wages,jobs,
unemploy-ment, andspending
SecurityIssues –like
terrorism,foreign
policy, andbordersecurity
HealthCare Issues– like the2010 healthcare law,Medicaid,other
challenges
SeniorsIssues –like
Medicareand SocialSecurity
Women’sIssues –like birthcontrol,abortion,and equal
pay
EducationIssues – like
schoolstandards,class sizes,
school choice,and student
loans
Energy Issues– like carbonemissions,cost ofelectric-
ity/gasoline,or renewables Other: Total N
Registered Voters 38%(768) 18%(360) 12%(231) 11%(227) 6%(125) 3% (59) 5%(107) 6%(122) 1998Educ: < College 39%(470) 19%(230) 10%(125) 12%(148) 6% (76) 2% (28) 5% (55) 6% (75) 1206Educ: Bachelors degree 38%(190) 18% (90) 13% (63) 9% (46) 6% (29) 4% (21) 7% (34) 6% (29) 501Educ: Post-grad 37%(108) 14% (40) 15% (44) 11% (33) 7% (20) 4% (11) 6% (17) 6% (18) 290Income: Under 50k 36%(310) 16% (141) 12% (101) 15%(129) 7% (61) 3% (23) 6% (50) 6% (56) 873Income: 50k-100k 39%(282) 21%(155) 11% (80) 9% (68) 6% (47) 3% (23) 3% (25) 6% (46) 728Income: 100k+ 44%(175) 16% (64) 12% (49) 7% (29) 4% (16) 3% (13) 8% (31) 5% (20) 398Ethnicity: White 38%(581) 20%(304) 12% (181) 12%(190) 5% (77) 2% (36) 5% (83) 6% (91) 1544Ethnicity: Hispanic 43% (95) 13% (29) 14% (31) 4% (10) 10% (22) 6% (13) 6% (13) 4% (10) 222Ethnicity: Black 41%(105) 9% (22) 9% (22) 12% (30) 13% (34) 4% (10) 2% (6) 10% (25) 253Ethnicity: Other 41% (83) 17% (33) 14% (28) 3% (6) 7% (13) 7% (14) 9% (17) 3% (6) 201All Christian 38%(397) 22%(228) 10%(105) 13%(132) 5% (50) 2% (20) 4% (44) 6% (66) 1041All Non-Christian 29% (31) 12% (13) 15% (16) 16% (17) 5% (5) 4% (4) 10% (10) 9% (10) 107Atheist 33% (26) 7% (6) 20% (16) 3% (2) 17% (14) 5% (4) 8% (7) 5% (4) 78Agnostic/Nothing in particular 40%(190) 14% (69) 14% (66) 8% (39) 8% (39) 5% (24) 6% (29) 5% (24) 480Something Else 43%(125) 15% (44) 10% (28) 12% (36) 6% (17) 2% (7) 6% (17) 6% (19) 293Religious Non-Protestant/Catholic 29% (37) 13% (17) 14% (18) 18% (23) 5% (6) 3% (4) 9% (11) 9% (12) 129Evangelical 38%(192) 22% (110) 11% (55) 12% (58) 3% (17) 2% (11) 5% (24) 6% (31) 499Non-Evangelical 39% (311) 20%(155) 10% (76) 13%(103) 6% (47) 2% (14) 4% (33) 6% (50) 790Community: Urban 37% (181) 17% (84) 16% (78) 9% (45) 5% (22) 5% (25) 7% (35) 3% (17) 487Community: Suburban 39%(410) 17%(174) 10%(103) 12%(122) 8% (79) 3% (31) 5% (51) 7% (71) 1041Community: Rural 38%(178) 22% (101) 10% (49) 13% (59) 5% (24) 1% (3) 4% (21) 7% (34) 469
Continued on next page
Page 20
20
Morning ConsultTable P3
Table P3: Now, thinking about your vote, what would you say is the top set of issues on your mind when you cast your vote for federal offices such asU.S. Senate or Congress?
Demographic
EconomicIssues –like taxes,wages,jobs,
unemploy-ment, andspending
SecurityIssues –like
terrorism,foreign
policy, andbordersecurity
HealthCare Issues– like the2010 healthcare law,Medicaid,other
challenges
SeniorsIssues –like
Medicareand SocialSecurity
Women’sIssues –like birthcontrol,abortion,and equal
pay
EducationIssues – like
schoolstandards,class sizes,
school choice,and student
loans
Energy Issues– like carbonemissions,cost ofelectric-
ity/gasoline,or renewables Other: Total N
Registered Voters 38%(768) 18%(360) 12%(231) 11%(227) 6%(125) 3% (59) 5%(107) 6%(122) 1998Employ: Private Sector 50%(345) 14% (95) 13% (87) 5% (34) 5% (37) 3% (20) 5% (36) 5% (31) 684Employ: Government 49% (55) 11% (12) 17% (19) 4% (4) 7% (8) 6% (7) 3% (3) 4% (4) 112Employ: Self-Employed 42% (76) 13% (23) 14% (26) 3% (5) 4% (8) 5% (9) 12% (22) 7% (13) 183Employ: Homemaker 38% (40) 21% (21) 10% (10) 5% (6) 11% (12) 3% (3) 3% (3) 9% (9) 104Employ: Student 31% (21) 4% (3) 21% (14) — (0) 24% (16) 7% (5) 9% (6) 4% (3) 67Employ: Retired 23%(125) 29%(156) 7% (36) 26%(136) 3% (14) — (2) 4% (22) 8% (44) 534Employ: Unemployed 35% (68) 18% (34) 13% (25) 12% (22) 9% (16) 4% (7) 4% (7) 6% (11) 191Employ: Other 32% (40) 13% (16) 11% (14) 15% (19) 11% (14) 5% (6) 6% (8) 6% (7) 124Military HH: Yes 31% (97) 27% (84) 12% (38) 13% (39) 4% (13) 2% (6) 5% (15) 7% (22) 315Military HH: No 40%(671) 16%(275) 11%(193) 11%(187) 7% (112) 3% (53) 5% (92) 6%(100) 1683RD/WT: Right Direction 32%(240) 9% (71) 19%(143) 13% (98) 8% (63) 4% (32) 8% (61) 7% (51) 757RD/WT: Wrong Track 43%(529) 23%(289) 7% (88) 10%(129) 5% (62) 2% (28) 4% (46) 6% (71) 1241Biden Job Approve 34%(301) 8% (70) 17% (151) 14%(130) 9% (79) 4% (40) 8% (69) 7% (59) 899Biden Job Disapprove 43%(450) 28%(288) 6% (66) 9% (92) 3% (35) 2% (16) 3% (35) 6% (58) 1039Biden Job Strongly Approve 24% (99) 10% (43) 21% (86) 18% (74) 7% (29) 4% (17) 8% (34) 9% (36) 418Biden Job Somewhat Approve 42%(202) 5% (26) 14% (65) 12% (56) 10% (50) 5% (22) 7% (36) 5% (22) 481Biden Job Somewhat Disapprove 48% (121) 14% (34) 11% (29) 8% (20) 6% (15) 2% (6) 6% (14) 4% (11) 250Biden Job Strongly Disapprove 42%(328) 32%(253) 5% (38) 9% (72) 3% (20) 1% (10) 3% (20) 6% (48) 788Favorable of Biden 32%(299) 8% (72) 17%(160) 15%(136) 9% (88) 4% (41) 7% (66) 7% (65) 927Unfavorable of Biden 44%(451) 28%(285) 6% (60) 9% (87) 3% (31) 2% (17) 3% (33) 5% (55) 1019Very Favorable of Biden 24% (114) 9% (44) 19% (89) 18% (86) 7% (33) 6% (28) 8% (40) 9% (42) 476Somewhat Favorable of Biden 41%(186) 6% (28) 16% (71) 11% (50) 12% (54) 3% (13) 6% (26) 5% (24) 451Somewhat Unfavorable of Biden 52%(108) 13% (27) 8% (17) 8% (16) 6% (12) 3% (6) 7% (14) 4% (8) 207Very Unfavorable of Biden 42%(344) 32%(257) 5% (43) 9% (71) 2% (20) 1% (11) 2% (19) 6% (47) 812
Continued on next page
Page 21
National Tracking Poll #2110084, October, 2021
21
Table P3
Table P3: Now, thinking about your vote, what would you say is the top set of issues on your mind when you cast your vote for federal offices such asU.S. Senate or Congress?
Demographic
EconomicIssues –like taxes,wages,jobs,
unemploy-ment, andspending
SecurityIssues –like
terrorism,foreign
policy, andbordersecurity
HealthCare Issues– like the2010 healthcare law,Medicaid,other
challenges
SeniorsIssues –like
Medicareand SocialSecurity
Women’sIssues –like birthcontrol,abortion,and equal
pay
EducationIssues – like
schoolstandards,class sizes,
school choice,and student
loans
Energy Issues– like carbonemissions,cost ofelectric-
ity/gasoline,or renewables Other: Total N
Registered Voters 38%(768) 18%(360) 12%(231) 11%(227) 6%(125) 3% (59) 5%(107) 6%(122) 1998#1 Issue: Economy 100%(768) — (0) — (0) — (0) — (0) — (0) — (0) — (0) 768#1 Issue: Security — (0) 100%(360) — (0) — (0) — (0) — (0) — (0) — (0) 360#1 Issue: Health Care — (0) — (0) 100%(231) — (0) — (0) — (0) — (0) — (0) 231#1 Issue: Medicare / Social Security — (0) — (0) — (0) 100%(227) — (0) — (0) — (0) — (0) 227#1 Issue: Women’s Issues — (0) — (0) — (0) — (0) 100%(125) — (0) — (0) — (0) 125#1 Issue: Education — (0) — (0) — (0) — (0) — (0) 100% (59) — (0) — (0) 59#1 Issue: Energy — (0) — (0) — (0) — (0) — (0) — (0) 100%(107) — (0) 107#1 Issue: Other — (0) — (0) — (0) — (0) — (0) — (0) — (0) 100%(122) 1222020 Vote: Joe Biden 33%(312) 7% (70) 17%(159) 15%(138) 9% (88) 4% (40) 8% (74) 7% (66) 9462020 Vote: Donald Trump 44%(377) 31%(269) 5% (44) 9% (80) 2% (16) 2% (14) 2% (19) 5% (46) 8642020 Vote: Didn’t Vote 43% (66) 11% (17) 15% (23) 4% (6) 12% (19) 3% (4) 9% (13) 3% (5) 1532018 House Vote: Democrat 34%(261) 7% (55) 17% (131) 15% (115) 8% (61) 5% (37) 7% (57) 7% (54) 7692018 House Vote: Republican 43%(300) 33%(229) 4% (31) 10% (70) 2% (12) 1% (9) 2% (12) 6% (39) 7022016 Vote: Hillary Clinton 31%(216) 7% (49) 17% (119) 16% (110) 8% (54) 5% (34) 7% (51) 8% (53) 6852016 Vote: Donald Trump 43%(345) 31%(252) 6% (46) 9% (75) 2% (13) 1% (10) 2% (18) 5% (44) 8022016 Vote: Other 44% (36) 6% (5) 9% (8) 7% (6) 12% (10) 5% (4) 7% (6) 11% (9) 842016 Vote: Didn’t Vote 40%(170) 12% (53) 14% (57) 8% (36) 11% (48) 2% (10) 8% (33) 4% (16) 423Voted in 2014: Yes 38% (511) 20%(262) 11%(149) 13%(169) 4% (59) 3% (36) 5% (65) 6% (84) 1335Voted in 2014: No 39%(257) 15% (97) 12% (82) 9% (58) 10% (65) 4% (23) 6% (42) 6% (38) 6634-Region: Northeast 42%(148) 14% (49) 13% (47) 11% (40) 5% (16) 4% (13) 7% (23) 5% (17) 3534-Region: Midwest 38%(168) 21% (92) 8% (37) 12% (53) 7% (29) 3% (15) 6% (27) 5% (24) 4444-Region: South 39%(289) 18%(133) 11% (85) 12% (88) 5% (36) 2% (18) 4% (29) 9% (67) 7464-Region: West 36%(162) 19% (85) 14% (62) 10% (45) 9% (43) 3% (15) 6% (28) 3% (15) 455
Continued on next page
Page 22
22
Morning ConsultTable P3
Table P3: Now, thinking about your vote, what would you say is the top set of issues on your mind when you cast your vote for federal offices such asU.S. Senate or Congress?
Demographic
EconomicIssues –like taxes,wages,jobs,
unemploy-ment, andspending
SecurityIssues –like
terrorism,foreign
policy, andbordersecurity
HealthCare Issues– like the2010 healthcare law,Medicaid,other
challenges
SeniorsIssues –like
Medicareand SocialSecurity
Women’sIssues –like birthcontrol,abortion,and equal
pay
EducationIssues – like
schoolstandards,class sizes,
school choice,and student
loans
Energy Issues– like carbonemissions,cost ofelectric-
ity/gasoline,or renewables Other: Total N
Registered Voters 38%(768) 18%(360) 12%(231) 11%(227) 6%(125) 3% (59) 5%(107) 6%(122) 1998Party: Democrat/Leans Democrat 32%(288) 8% (73) 17%(158) 14%(128) 10% (91) 4% (37) 8% (75) 7% (64) 914Party: Republican/Leans Republican 44%(359) 30%(244) 5% (43) 9% (74) 2% (15) 2% (14) 2% (20) 5% (38) 808Note: Row proportions may total to larger than one-hundred percent due to rounding. For more information visit MorningConsultIntelligence.com.
Page 23
National Tracking Poll #2110084, October, 2021
23
Table POL1
Table POL1: Thinking about the November 2022 midterm elections for U.S. Congress, how enthusiastic would you say you are about voting in themidterm elections?
DemographicExtremelyenthusiastic
Veryenthusiastic
Somewhatenthusiastic
Not tooenthusiastic
Not at allenthusiastic Total N
Registered Voters 27% (544) 20% (393) 25% (508) 19% (376) 9% (177) 1998Gender: Male 32% (301) 23% (215) 24% (222) 16% (148) 6% (55) 942Gender: Female 23% (243) 17% (178) 27% (287) 22% (228) 11% (121) 1056Age: 18-34 20% (104) 19% (96) 28% (145) 22% (111) 11% (58) 514Age: 35-44 21% (64) 18% (54) 29% (88) 20% (61) 13% (40) 307Age: 45-64 26% (176) 21% (144) 25% (168) 20% (136) 8% (56) 679Age: 65+ 40% (200) 20% (99) 21% (107) 14% (68) 5% (23) 497GenZers: 1997-2012 14% (23) 16% (28) 35% (59) 18% (31) 17% (29) 170Millennials: 1981-1996 24% (134) 20% (108) 26% (143) 21% (114) 10% (53) 551GenXers: 1965-1980 21% (100) 17% (82) 27% (128) 23% (109) 11% (50) 469Baby Boomers: 1946-1964 34% (248) 22% (161) 22% (163) 16% (116) 6% (43) 732PID: Dem (no lean) 27% (213) 25% (190) 26% (202) 17% (135) 5% (37) 777PID: Ind (no lean) 17% (90) 14% (72) 28% (146) 26% (135) 16% (85) 528PID: Rep (no lean) 35% (242) 19% (131) 23% (161) 15% (106) 8% (54) 693PID/Gender: DemMen 31% (110) 27% (96) 24% (85) 13% (45) 4% (16) 352PID/Gender: DemWomen 24% (102) 22% (95) 27% (116) 21% (90) 5% (21) 425PID/Gender: Ind Men 21% (60) 17% (47) 27% (77) 24% (68) 10% (29) 280PID/Gender: Ind Women 12% (30) 10% (25) 28% (69) 27% (67) 23% (57) 248PID/Gender: Rep Men 42% (131) 24% (73) 19% (59) 11% (35) 4% (11) 310PID/Gender: Rep Women 29% (110) 15% (58) 26% (101) 18% (71) 11% (43) 384Ideo: Liberal (1-3) 29% (164) 25% (139) 26% (144) 16% (88) 5% (30) 566Ideo: Moderate (4) 17% (94) 20% (110) 29% (162) 27% (149) 8% (45) 560Ideo: Conservative (5-7) 37% (271) 19% (139) 21% (154) 14% (104) 8% (62) 730Educ: < College 25% (296) 17% (209) 27% (321) 21% (252) 11% (128) 1206Educ: Bachelors degree 29% (145) 22% (110) 27% (135) 16% (83) 6% (28) 501Educ: Post-grad 35% (103) 25% (73) 18% (52) 14% (42) 7% (21) 290Income: Under 50k 23% (202) 16% (140) 28% (249) 22% (189) 11% (94) 873Income: 50k-100k 29% (211) 21% (151) 23% (170) 18% (131) 9% (65) 728Income: 100k+ 33% (132) 26% (103) 22% (89) 14% (57) 4% (17) 398Ethnicity: White 29% (447) 20% (316) 25% (384) 18% (276) 8% (121) 1544Ethnicity: Hispanic 24% (54) 11% (23) 35% (77) 18% (40) 12% (28) 222
Continued on next page
Page 24
24
Morning ConsultTable POL1
Table POL1: Thinking about the November 2022 midterm elections for U.S. Congress, how enthusiastic would you say you are about voting in themidterm elections?
DemographicExtremelyenthusiastic
Veryenthusiastic
Somewhatenthusiastic
Not tooenthusiastic
Not at allenthusiastic Total N
Registered Voters 27% (544) 20% (393) 25% (508) 19% (376) 9% (177) 1998Ethnicity: Black 25% (63) 18% (47) 23% (58) 23% (59) 11% (27) 253Ethnicity: Other 17% (35) 15% (30) 33% (66) 21% (41) 14% (28) 201All Christian 32% (330) 20% (213) 25% (257) 17% (179) 6% (63) 1041All Non-Christian 32% (35) 23% (24) 26% (28) 13% (14) 6% (6) 107Atheist 24% (19) 20% (15) 25% (20) 18% (14) 13% (10) 78Agnostic/Nothing in particular 21% (99) 21% (99) 26% (123) 21% (99) 12% (60) 480Something Else 21% (62) 14% (42) 27% (80) 24% (71) 13% (38) 293Religious Non-Protestant/Catholic 35% (45) 19% (25) 27% (35) 12% (16) 6% (8) 129Evangelical 32% (160) 20% (98) 25% (125) 16% (81) 7% (35) 499Non-Evangelical 27% (210) 19% (149) 26% (202) 21% (164) 8% (64) 790Community: Urban 29% (141) 25% (123) 25% (122) 14% (70) 6% (31) 487Community: Suburban 26% (275) 19% (199) 26% (269) 18% (190) 10% (107) 1041Community: Rural 27% (127) 15% (71) 25% (117) 25% (116) 8% (39) 469Employ: Private Sector 27% (184) 21% (141) 25% (168) 20% (136) 8% (54) 684Employ: Government 24% (26) 33% (38) 22% (25) 17% (19) 4% (4) 112Employ: Self-Employed 29% (53) 22% (41) 17% (31) 23% (42) 9% (16) 183Employ: Homemaker 16% (16) 15% (15) 30% (31) 20% (21) 19% (20) 104Employ: Student 9% (6) 15% (10) 47% (31) 20% (13) 10% (6) 67Employ: Retired 39% (206) 22% (120) 23% (120) 13% (68) 4% (20) 534Employ: Unemployed 16% (30) 10% (18) 32% (62) 27% (51) 16% (30) 191Employ: Other 19% (23) 8% (10) 31% (39) 21% (26) 21% (26) 124Military HH: Yes 37% (116) 16% (51) 27% (86) 14% (45) 5% (17) 315Military HH: No 25% (428) 20% (342) 25% (422) 20% (331) 9% (160) 1683RD/WT: Right Direction 28% (212) 25% (191) 27% (207) 14% (106) 5% (41) 757RD/WT: Wrong Track 27% (332) 16% (202) 24% (301) 22% (270) 11% (135) 1241Biden Job Approve 27% (239) 25% (224) 28% (254) 16% (143) 4% (38) 899Biden Job Disapprove 29% (305) 16% (164) 23% (237) 20% (211) 12% (121) 1039
Continued on next page
Page 25
National Tracking Poll #2110084, October, 2021
25
Table POL1
Table POL1: Thinking about the November 2022 midterm elections for U.S. Congress, how enthusiastic would you say you are about voting in themidterm elections?
DemographicExtremelyenthusiastic
Veryenthusiastic
Somewhatenthusiastic
Not tooenthusiastic
Not at allenthusiastic Total N
Registered Voters 27% (544) 20% (393) 25% (508) 19% (376) 9% (177) 1998Biden Job Strongly Approve 39% (163) 30% (124) 22% (92) 8% (34) 1% (6) 418Biden Job Somewhat Approve 16% (76) 21% (101) 34% (162) 23% (109) 7% (33) 481Biden Job Somewhat Disapprove 7% (18) 11% (27) 29% (72) 39% (98) 14% (36) 250Biden Job Strongly Disapprove 36% (287) 17% (136) 21% (166) 14% (114) 11% (85) 788Favorable of Biden 26% (241) 25% (227) 28% (260) 16% (150) 5% (48) 927Unfavorable of Biden 29% (300) 16% (159) 23% (231) 21% (212) 11% (117) 1019Very Favorable of Biden 36% (169) 30% (144) 23% (108) 8% (40) 3% (14) 476Somewhat Favorable of Biden 16% (72) 18% (83) 34% (152) 24% (110) 8% (35) 451Somewhat Unfavorable of Biden 7% (14) 12% (26) 26% (54) 42% (86) 13% (28) 207Very Unfavorable of Biden 35% (286) 16% (134) 22% (178) 15% (126) 11% (89) 812#1 Issue: Economy 25% (192) 16% (124) 26% (197) 24% (182) 10% (74) 768#1 Issue: Security 35% (127) 22% (79) 22% (78) 15% (53) 6% (22) 360#1 Issue: Health Care 22% (51) 21% (48) 27% (63) 19% (44) 11% (25) 231#1 Issue: Medicare / Social Security 28% (64) 24% (54) 26% (58) 15% (34) 7% (15) 227#1 Issue: Women’s Issues 22% (27) 19% (24) 28% (35) 16% (20) 15% (18) 125#1 Issue: Education 14% (8) 26% (16) 23% (13) 22% (13) 16% (9) 59#1 Issue: Energy 28% (30) 25% (27) 27% (28) 13% (14) 7% (7) 107#1 Issue: Other 36% (44) 18% (22) 28% (34) 13% (16) 5% (6) 1222020 Vote: Joe Biden 24% (227) 24% (225) 28% (269) 18% (171) 6% (54) 9462020 Vote: Donald Trump 34% (296) 19% (162) 21% (182) 17% (150) 9% (74) 8642020 Vote: Didn’t Vote 11% (16) 3% (4) 31% (47) 30% (45) 26% (40) 1532018 House Vote: Democrat 27% (210) 24% (183) 28% (216) 17% (130) 4% (30) 7692018 House Vote: Republican 38% (265) 21% (148) 22% (154) 14% (100) 5% (35) 7022016 Vote: Hillary Clinton 28% (191) 25% (172) 26% (178) 17% (115) 4% (29) 6852016 Vote: Donald Trump 37% (294) 20% (156) 21% (170) 15% (119) 8% (62) 8022016 Vote: Other 15% (13) 14% (12) 34% (29) 26% (21) 11% (9) 842016 Vote: Didn’t Vote 10% (44) 12% (51) 31% (130) 29% (121) 18% (76) 423Voted in 2014: Yes 34% (455) 22% (298) 24% (316) 16% (208) 4% (58) 1335Voted in 2014: No 13% (89) 14% (95) 29% (192) 25% (168) 18% (118) 663
Continued on next page
Page 26
26
Morning ConsultTable POL1
Table POL1: Thinking about the November 2022 midterm elections for U.S. Congress, how enthusiastic would you say you are about voting in themidterm elections?
DemographicExtremelyenthusiastic
Veryenthusiastic
Somewhatenthusiastic
Not tooenthusiastic
Not at allenthusiastic Total N
Registered Voters 27% (544) 20% (393) 25% (508) 19% (376) 9% (177) 19984-Region: Northeast 20% (69) 18% (62) 29% (104) 23% (80) 11% (38) 3534-Region: Midwest 27% (120) 19% (85) 26% (114) 18% (81) 10% (43) 4444-Region: South 31% (229) 18% (137) 25% (186) 18% (136) 8% (57) 7464-Region: West 28% (125) 24% (109) 23% (104) 17% (79) 8% (38) 455Party: Democrat/Leans Democrat 25% (231) 23% (212) 28% (252) 18% (169) 6% (51) 914Party: Republican/Leans Republican 33% (270) 18% (146) 23% (188) 16% (128) 9% (76) 808Note: Row proportions may total to larger than one-hundred percent due to rounding. For more information visit MorningConsultIntelligence.com.
Page 27
National Tracking Poll #2110084, October, 2021
27
Table POL2
Table POL2: If the election for U.S. Congress in your district was held today, which one of the following candidates are you most likely to vote for?
Demographic Democratic candidate Republican candidateDon’t know / No
opinion Total N
Registered Voters 45% (890) 40% (807) 15% (301) 1998Gender: Male 45% (426) 42% (392) 13% (124) 942Gender: Female 44% (464) 39% (416) 17% (177) 1056Age: 18-34 53% (275) 28% (145) 18% (94) 514Age: 35-44 48% (147) 31% (96) 21% (64) 307Age: 45-64 39% (266) 47% (319) 14% (94) 679Age: 65+ 40% (201) 50% (248) 10% (48) 497GenZers: 1997-2012 53% (90) 21% (35) 26% (45) 170Millennials: 1981-1996 52% (287) 32% (175) 16% (89) 551GenXers: 1965-1980 40% (190) 42% (198) 17% (81) 469Baby Boomers: 1946-1964 40% (293) 49% (357) 11% (81) 732PID: Dem (no lean) 92% (711) 2% (19) 6% (47) 777PID: Ind (no lean) 31% (162) 28% (149) 41% (217) 528PID: Rep (no lean) 2% (16) 92% (640) 5% (37) 693PID/Gender: DemMen 93% (329) 3% (11) 4% (13) 352PID/Gender: DemWomen 90% (382) 2% (8) 8% (35) 425PID/Gender: Ind Men 32% (89) 32% (90) 36% (100) 280PID/Gender: Ind Women 30% (73) 24% (59) 47% (116) 248PID/Gender: Rep Men 3% (8) 94% (291) 4% (11) 310PID/Gender: Rep Women 2% (8) 91% (349) 7% (26) 384Ideo: Liberal (1-3) 87% (492) 5% (29) 8% (45) 566Ideo: Moderate (4) 54% (305) 26% (146) 19% (109) 560Ideo: Conservative (5-7) 8% (61) 83% (607) 9% (62) 730Educ: < College 39% (475) 43% (518) 18% (213) 1206Educ: Bachelors degree 49% (245) 39% (196) 12% (59) 501Educ: Post-grad 58% (169) 32% (93) 10% (28) 290Income: Under 50k 43% (376) 38% (333) 19% (164) 873Income: 50k-100k 43% (310) 43% (312) 14% (105) 728Income: 100k+ 51% (204) 41% (162) 8% (32) 398Ethnicity: White 40% (617) 47% (720) 13% (206) 1544Ethnicity: Hispanic 49% (109) 30% (67) 21% (46) 222Ethnicity: Black 69% (175) 8% (21) 23% (57) 253
Continued on next page
Page 28
28
Morning ConsultTable POL2
Table POL2: If the election for U.S. Congress in your district was held today, which one of the following candidates are you most likely to vote for?
Demographic Democratic candidate Republican candidateDon’t know / No
opinion Total N
Registered Voters 45% (890) 40% (807) 15% (301) 1998Ethnicity: Other 48% (97) 33% (66) 19% (38) 201All Christian 39% (404) 51% (527) 11% (111) 1041All Non-Christian 67% (71) 20% (21) 13% (14) 107Atheist 72% (55) 18% (14) 11% (8) 78Agnostic/Nothing in particular 50% (240) 29% (139) 21% (101) 480Something Else 41% (120) 36% (107) 23% (66) 293Religious Non-Protestant/Catholic 57% (73) 29% (37) 15% (19) 129Evangelical 35% (177) 50% (249) 15% (73) 499Non-Evangelical 42% (332) 45% (359) 12% (99) 790Community: Urban 61% (295) 25% (121) 15% (72) 487Community: Suburban 44% (458) 41% (429) 15% (154) 1041Community: Rural 29% (136) 55% (258) 16% (75) 469Employ: Private Sector 47% (321) 39% (268) 14% (95) 684Employ: Government 50% (56) 38% (43) 12% (13) 112Employ: Self-Employed 46% (84) 39% (71) 16% (28) 183Employ: Homemaker 36% (37) 41% (43) 23% (23) 104Employ: Student 59% (40) 18% (12) 23% (16) 67Employ: Retired 40% (214) 52% (275) 8% (45) 534Employ: Unemployed 51% (98) 27% (51) 22% (42) 191Employ: Other 32% (39) 37% (45) 31% (39) 124Military HH: Yes 38% (119) 45% (142) 17% (54) 315Military HH: No 46% (770) 40% (666) 15% (247) 1683RD/WT: Right Direction 81% (616) 9% (70) 9% (72) 757RD/WT: Wrong Track 22% (274) 59% (737) 18% (229) 1241Biden Job Approve 84% (759) 7% (62) 9% (79) 899Biden Job Disapprove 11% (118) 72% (745) 17% (176) 1039Biden Job Strongly Approve 94% (393) 4% (18) 2% (7) 418Biden Job Somewhat Approve 76% (366) 9% (44) 15% (71) 481Biden Job Somewhat Disapprove 35% (88) 30% (76) 35% (87) 250Biden Job Strongly Disapprove 4% (31) 85% (669) 11% (89) 788
Continued on next page
Page 29
National Tracking Poll #2110084, October, 2021
29
Table POL2
Table POL2: If the election for U.S. Congress in your district was held today, which one of the following candidates are you most likely to vote for?
Demographic Democratic candidate Republican candidateDon’t know / No
opinion Total N
Registered Voters 45% (890) 40% (807) 15% (301) 1998Favorable of Biden 83% (770) 7% (61) 10% (97) 927Unfavorable of Biden 10% (105) 73% (742) 17% (172) 1019Very Favorable of Biden 94% (447) 3% (16) 3% (13) 476Somewhat Favorable of Biden 72% (323) 10% (44) 19% (84) 451Somewhat Unfavorable of Biden 36% (75) 31% (64) 33% (67) 207Very Unfavorable of Biden 4% (29) 83% (677) 13% (105) 812#1 Issue: Economy 38% (295) 44% (342) 17% (132) 768#1 Issue: Security 17% (61) 73% (262) 10% (36) 360#1 Issue: Health Care 67% (154) 19% (44) 14% (32) 231#1 Issue: Medicare / Social Security 52% (118) 32% (72) 16% (37) 227#1 Issue: Women’s Issues 71% (89) 11% (14) 18% (22) 125#1 Issue: Education 59% (35) 14% (8) 27% (16) 59#1 Issue: Energy 71% (76) 21% (23) 8% (8) 107#1 Issue: Other 50% (62) 35% (42) 15% (18) 1222020 Vote: Joe Biden 84% (795) 5% (44) 11% (107) 9462020 Vote: Donald Trump 5% (46) 83% (718) 12% (99) 8642020 Vote: Didn’t Vote 30% (46) 24% (36) 46% (70) 1532018 House Vote: Democrat 87% (665) 3% (20) 11% (84) 7692018 House Vote: Republican 4% (26) 89% (626) 7% (50) 7022016 Vote: Hillary Clinton 86% (590) 3% (23) 11% (72) 6852016 Vote: Donald Trump 10% (78) 80% (643) 10% (81) 8022016 Vote: Other 39% (32) 30% (25) 31% (26) 842016 Vote: Didn’t Vote 44% (187) 27% (114) 29% (122) 423Voted in 2014: Yes 46% (609) 44% (589) 10% (136) 1335Voted in 2014: No 42% (280) 33% (218) 25% (164) 6634-Region: Northeast 47% (165) 34% (118) 20% (70) 3534-Region: Midwest 44% (197) 43% (193) 12% (54) 4444-Region: South 39% (290) 46% (340) 15% (116) 7464-Region: West 52% (237) 34% (156) 14% (62) 455Party: Democrat/Leans Democrat 90% (820) 2% (20) 8% (74) 914Party: Republican/Leans Republican 3% (24) 89% (723) 8% (61) 808Note: Row proportions may total to larger than one-hundred percent due to rounding. For more information visit MorningConsultIntelligence.com.
Page 30
30
Morning ConsultTable POL3_1
Table POL3_1: Do you approve or disapprove of how President Biden is handling each of the following?The economy
DemographicStronglyapprove
Somewhatapprove
Somewhatdisapprove
Stronglydisapprove
Don’t Know /No Opinion Total N
Registered Voters 17% (343) 24% (483) 12% (246) 39% (780) 7% (146) 1998Gender: Male 19% (182) 26% (245) 12% (108) 38% (359) 5% (48) 942Gender: Female 15% (161) 23% (238) 13% (137) 40% (421) 9% (98) 1056Age: 18-34 16% (82) 28% (142) 12% (63) 30% (153) 14% (75) 514Age: 35-44 23% (71) 28% (87) 14% (44) 27% (82) 7% (23) 307Age: 45-64 13% (89) 22% (150) 14% (93) 46% (311) 5% (37) 679Age: 65+ 20% (102) 21% (104) 9% (46) 47% (234) 2% (12) 497GenZers: 1997-2012 12% (20) 28% (48) 13% (22) 23% (39) 24% (42) 170Millennials: 1981-1996 21% (118) 27% (150) 13% (69) 30% (164) 9% (51) 551GenXers: 1965-1980 12% (57) 24% (111) 15% (69) 43% (199) 7% (33) 469Baby Boomers: 1946-1964 18% (128) 23% (165) 11% (80) 47% (340) 2% (18) 732PID: Dem (no lean) 34% (262) 43% (332) 9% (69) 7% (56) 7% (58) 777PID: Ind (no lean) 9% (47) 20% (106) 19% (101) 39% (204) 13% (69) 528PID: Rep (no lean) 5% (34) 7% (45) 11% (76) 75% (520) 3% (18) 693PID/Gender: DemMen 38% (134) 43% (151) 7% (24) 7% (25) 5% (19) 352PID/Gender: DemWomen 30% (128) 43% (181) 11% (45) 7% (31) 9% (39) 425PID/Gender: Ind Men 9% (25) 24% (66) 17% (47) 42% (116) 9% (25) 280PID/Gender: Ind Women 9% (23) 16% (40) 22% (54) 35% (88) 18% (44) 248PID/Gender: Rep Men 8% (23) 9% (28) 12% (37) 70% (218) 1% (4) 310PID/Gender: Rep Women 3% (11) 5% (17) 10% (39) 79% (302) 4% (15) 384Ideo: Liberal (1-3) 33% (188) 39% (222) 12% (69) 9% (50) 7% (38) 566Ideo: Moderate (4) 18% (100) 34% (190) 19% (104) 24% (133) 6% (32) 560Ideo: Conservative (5-7) 6% (43) 7% (52) 8% (60) 76% (554) 3% (21) 730Educ: < College 16% (192) 20% (243) 11% (137) 43% (523) 9% (112) 1206Educ: Bachelors degree 17% (87) 28% (141) 13% (65) 36% (182) 5% (25) 501Educ: Post-grad 22% (64) 34% (99) 15% (44) 26% (75) 3% (9) 290Income: Under 50k 16% (138) 24% (205) 12% (103) 38% (336) 10% (91) 873Income: 50k-100k 17% (125) 24% (174) 12% (86) 42% (308) 5% (33) 728Income: 100k+ 20% (80) 26% (103) 14% (56) 34% (136) 5% (22) 398Ethnicity: White 15% (239) 22% (339) 13% (199) 43% (668) 6% (98) 1544Ethnicity: Hispanic 13% (29) 29% (65) 14% (32) 29% (65) 14% (32) 222
Continued on next page
Page 31
National Tracking Poll #2110084, October, 2021
31
Table POL3_1
Table POL3_1: Do you approve or disapprove of how President Biden is handling each of the following?The economy
DemographicStronglyapprove
Somewhatapprove
Somewhatdisapprove
Stronglydisapprove
Don’t Know /No Opinion Total N
Registered Voters 17% (343) 24% (483) 12% (246) 39% (780) 7% (146) 1998Ethnicity: Black 25% (62) 40% (102) 9% (22) 15% (39) 11% (28) 253Ethnicity: Other 21% (41) 21% (42) 12% (25) 36% (73) 10% (20) 201All Christian 17% (172) 22% (232) 11% (115) 46% (475) 5% (48) 1041All Non-Christian 29% (30) 37% (39) 9% (9) 20% (22) 6% (6) 107Atheist 18% (14) 35% (27) 21% (16) 20% (16) 5% (4) 78Agnostic/Nothing in particular 17% (80) 24% (115) 14% (66) 33% (158) 13% (60) 480Something Else 16% (46) 24% (69) 13% (39) 38% (110) 10% (28) 293Religious Non-Protestant/Catholic 25% (32) 32% (42) 9% (12) 28% (37) 6% (7) 129Evangelical 15% (76) 21% (105) 11% (56) 45% (222) 8% (39) 499Non-Evangelical 17% (135) 24% (187) 11% (91) 43% (343) 4% (35) 790Community: Urban 26% (129) 32% (154) 13% (64) 22% (109) 7% (32) 487Community: Suburban 15% (158) 25% (265) 12% (128) 40% (413) 7% (78) 1041Community: Rural 12% (56) 14% (64) 12% (54) 55% (258) 8% (36) 469Employ: Private Sector 17% (114) 26% (176) 15% (106) 37% (254) 5% (34) 684Employ: Government 15% (16) 38% (43) 13% (14) 27% (30) 8% (9) 112Employ: Self-Employed 20% (37) 22% (40) 10% (18) 40% (73) 9% (16) 183Employ: Homemaker 17% (18) 14% (15) 12% (12) 46% (48) 10% (11) 104Employ: Student 11% (8) 38% (25) 14% (9) 21% (14) 17% (11) 67Employ: Retired 20% (108) 21% (109) 7% (40) 49% (263) 3% (14) 534Employ: Unemployed 15% (28) 30% (56) 11% (22) 27% (51) 18% (34) 191Employ: Other 11% (14) 15% (19) 20% (24) 40% (49) 14% (17) 124Military HH: Yes 18% (57) 20% (64) 10% (31) 47% (149) 5% (14) 315Military HH: No 17% (286) 25% (419) 13% (215) 38% (632) 8% (131) 1683RD/WT: Right Direction 37% (284) 45% (342) 8% (58) 3% (22) 7% (52) 757RD/WT: Wrong Track 5% (59) 11% (141) 15% (188) 61% (759) 8% (94) 1241Biden Job Approve 35% (316) 48% (431) 9% (84) 1% (13) 6% (56) 899Biden Job Disapprove 2% (26) 4% (46) 15% (156) 73% (757) 5% (54) 1039
Continued on next page
Page 32
32
Morning ConsultTable POL3_1
Table POL3_1: Do you approve or disapprove of how President Biden is handling each of the following?The economy
DemographicStronglyapprove
Somewhatapprove
Somewhatdisapprove
Stronglydisapprove
Don’t Know /No Opinion Total N
Registered Voters 17% (343) 24% (483) 12% (246) 39% (780) 7% (146) 1998Biden Job Strongly Approve 60% (251) 34% (143) 4% (15) 1% (3) 2% (6) 418Biden Job Somewhat Approve 14% (65) 60% (288) 14% (69) 2% (10) 10% (49) 481Biden Job Somewhat Disapprove 2% (5) 14% (34) 46% (116) 28% (71) 10% (24) 250Biden Job Strongly Disapprove 3% (21) 2% (12) 5% (40) 87% (686) 4% (30) 788Favorable of Biden 34% (318) 46% (427) 10% (91) 2% (21) 8% (70) 927Unfavorable of Biden 2% (24) 4% (44) 15% (151) 74% (750) 5% (50) 1019Very Favorable of Biden 59% (282) 34% (161) 4% (19) 1% (7) 2% (8) 476Somewhat Favorable of Biden 8% (36) 59% (267) 16% (72) 3% (15) 14% (62) 451Somewhat Unfavorable of Biden 3% (6) 13% (27) 47% (98) 28% (58) 9% (18) 207Very Unfavorable of Biden 2% (19) 2% (17) 6% (52) 85% (692) 4% (32) 812#1 Issue: Economy 11% (87) 23% (176) 15% (115) 45% (349) 5% (41) 768#1 Issue: Security 7% (25) 13% (46) 9% (31) 66% (238) 6% (20) 360#1 Issue: Health Care 28% (65) 33% (76) 14% (32) 16% (37) 9% (22) 231#1 Issue: Medicare / Social Security 25% (57) 28% (63) 9% (20) 31% (70) 7% (16) 227#1 Issue: Women’s Issues 27% (34) 27% (34) 16% (19) 13% (17) 17% (21) 125#1 Issue: Education 28% (17) 29% (17) 18% (11) 13% (7) 12% (7) 59#1 Issue: Energy 30% (32) 37% (39) 7% (7) 20% (21) 7% (8) 107#1 Issue: Other 22% (27) 27% (33) 8% (10) 34% (41) 9% (11) 1222020 Vote: Joe Biden 32% (301) 42% (394) 13% (120) 7% (62) 7% (68) 9462020 Vote: Donald Trump 3% (30) 7% (61) 10% (86) 75% (647) 5% (39) 8642020 Vote: Didn’t Vote 6% (10) 16% (25) 21% (31) 35% (54) 22% (33) 1532018 House Vote: Democrat 33% (257) 40% (304) 11% (84) 9% (71) 7% (52) 7692018 House Vote: Republican 4% (29) 7% (51) 12% (83) 74% (518) 3% (20) 7022016 Vote: Hillary Clinton 36% (245) 41% (282) 10% (71) 6% (42) 6% (44) 6852016 Vote: Donald Trump 5% (40) 9% (75) 10% (83) 71% (573) 4% (31) 8022016 Vote: Other 9% (7) 20% (17) 27% (23) 37% (31) 7% (6) 842016 Vote: Didn’t Vote 12% (49) 26% (108) 16% (67) 32% (134) 15% (65) 423Voted in 2014: Yes 20% (264) 24% (316) 12% (156) 41% (549) 4% (50) 1335Voted in 2014: No 12% (79) 25% (167) 14% (90) 35% (231) 15% (96) 663
Continued on next page
Page 33
National Tracking Poll #2110084, October, 2021
33
Table POL3_1
Table POL3_1: Do you approve or disapprove of how President Biden is handling each of the following?The economy
DemographicStronglyapprove
Somewhatapprove
Somewhatdisapprove
Stronglydisapprove
Don’t Know /No Opinion Total N
Registered Voters 17% (343) 24% (483) 12% (246) 39% (780) 7% (146) 19984-Region: Northeast 19% (66) 28% (100) 14% (49) 34% (121) 5% (17) 3534-Region: Midwest 16% (70) 19% (86) 12% (55) 44% (195) 9% (39) 4444-Region: South 16% (120) 22% (161) 10% (73) 45% (333) 8% (58) 7464-Region: West 19% (87) 30% (136) 15% (69) 29% (131) 7% (33) 455Party: Democrat/Leans Democrat 32% (293) 41% (379) 11% (104) 7% (68) 8% (71) 914Party: Republican/Leans Republican 4% (34) 7% (54) 11% (92) 74% (598) 4% (30) 808Note: Row proportions may total to larger than one-hundred percent due to rounding. For more information visit MorningConsultIntelligence.com.
Page 34
34
Morning ConsultTable POL3_2
Table POL3_2: Do you approve or disapprove of how President Biden is handling each of the following?Jobs
DemographicStronglyapprove
Somewhatapprove
Somewhatdisapprove
Stronglydisapprove
Don’t Know /No Opinion Total N
Registered Voters 18% (352) 26% (529) 12% (236) 35% (708) 9% (173) 1998Gender: Male 19% (183) 28% (261) 11% (101) 37% (345) 6% (52) 942Gender: Female 16% (169) 25% (268) 13% (136) 34% (363) 11% (121) 1056Age: 18-34 17% (88) 31% (158) 12% (60) 26% (134) 14% (74) 514Age: 35-44 22% (66) 30% (94) 13% (41) 25% (75) 10% (30) 307Age: 45-64 13% (90) 24% (162) 15% (104) 41% (278) 6% (44) 679Age: 65+ 22% (108) 23% (115) 6% (30) 44% (220) 5% (24) 497GenZers: 1997-2012 17% (29) 25% (43) 15% (26) 22% (37) 20% (35) 170Millennials: 1981-1996 20% (109) 32% (179) 9% (52) 27% (149) 11% (61) 551GenXers: 1965-1980 12% (59) 26% (122) 18% (83) 37% (171) 7% (34) 469Baby Boomers: 1946-1964 18% (133) 24% (172) 10% (72) 43% (314) 6% (41) 732PID: Dem (no lean) 35% (269) 42% (330) 9% (71) 5% (40) 9% (67) 777PID: Ind (no lean) 10% (51) 26% (137) 14% (75) 36% (188) 15% (77) 528PID: Rep (no lean) 5% (32) 9% (62) 13% (90) 69% (480) 4% (29) 693PID/Gender: DemMen 38% (135) 42% (149) 8% (29) 6% (21) 5% (18) 352PID/Gender: DemWomen 32% (134) 43% (181) 10% (42) 4% (19) 11% (48) 425PID/Gender: Ind Men 10% (28) 26% (74) 13% (35) 41% (114) 10% (29) 280PID/Gender: Ind Women 9% (22) 26% (64) 16% (40) 30% (74) 19% (48) 248PID/Gender: Rep Men 7% (20) 12% (39) 12% (36) 68% (210) 2% (5) 310PID/Gender: Rep Women 3% (12) 6% (23) 14% (54) 70% (270) 6% (25) 384Ideo: Liberal (1-3) 34% (192) 41% (230) 10% (56) 7% (38) 9% (50) 566Ideo: Moderate (4) 19% (105) 37% (208) 15% (84) 22% (123) 7% (40) 560Ideo: Conservative (5-7) 6% (45) 10% (70) 11% (77) 69% (503) 5% (35) 730Educ: < College 17% (201) 23% (279) 11% (131) 39% (473) 10% (123) 1206Educ: Bachelors degree 15% (73) 33% (164) 13% (63) 33% (165) 7% (36) 501Educ: Post-grad 27% (78) 30% (87) 15% (42) 24% (70) 5% (13) 290Income: Under 50k 17% (153) 25% (223) 11% (95) 35% (307) 11% (96) 873Income: 50k-100k 17% (124) 25% (184) 12% (91) 38% (273) 8% (56) 728Income: 100k+ 19% (75) 31% (123) 13% (51) 32% (128) 5% (21) 398Ethnicity: White 16% (252) 25% (381) 12% (179) 39% (609) 8% (122) 1544Ethnicity: Hispanic 17% (38) 28% (63) 12% (27) 31% (69) 12% (26) 222
Continued on next page
Page 35
National Tracking Poll #2110084, October, 2021
35
Table POL3_2
Table POL3_2: Do you approve or disapprove of how President Biden is handling each of the following?Jobs
DemographicStronglyapprove
Somewhatapprove
Somewhatdisapprove
Stronglydisapprove
Don’t Know /No Opinion Total N
Registered Voters 18% (352) 26% (529) 12% (236) 35% (708) 9% (173) 1998Ethnicity: Black 24% (60) 40% (100) 11% (27) 14% (35) 12% (30) 253Ethnicity: Other 20% (40) 24% (47) 15% (29) 32% (64) 10% (21) 201All Christian 18% (189) 24% (249) 10% (99) 43% (443) 6% (61) 1041All Non-Christian 25% (26) 37% (39) 16% (17) 13% (14) 9% (10) 107Atheist 21% (17) 37% (29) 11% (8) 20% (16) 11% (8) 78Agnostic/Nothing in particular 16% (79) 29% (137) 12% (60) 30% (144) 13% (60) 480Something Else 14% (42) 26% (75) 18% (52) 31% (90) 11% (33) 293Religious Non-Protestant/Catholic 23% (29) 33% (42) 15% (19) 19% (24) 11% (14) 129Evangelical 16% (79) 21% (107) 14% (68) 41% (204) 8% (41) 499Non-Evangelical 18% (144) 26% (205) 10% (77) 40% (316) 6% (47) 790Community: Urban 26% (125) 35% (169) 11% (54) 19% (92) 9% (46) 487Community: Suburban 16% (166) 28% (290) 12% (122) 36% (375) 9% (89) 1041Community: Rural 13% (61) 15% (70) 13% (60) 51% (241) 8% (38) 469Employ: Private Sector 16% (108) 29% (200) 15% (105) 33% (223) 7% (48) 684Employ: Government 17% (19) 37% (42) 13% (15) 25% (28) 7% (8) 112Employ: Self-Employed 20% (37) 24% (43) 14% (25) 32% (59) 10% (19) 183Employ: Homemaker 15% (16) 19% (20) 12% (12) 39% (40) 15% (15) 104Employ: Student 11% (8) 39% (26) 14% (9) 18% (12) 18% (12) 67Employ: Retired 22% (115) 22% (115) 6% (33) 47% (252) 4% (19) 534Employ: Unemployed 17% (32) 27% (52) 12% (23) 25% (48) 18% (35) 191Employ: Other 14% (17) 24% (30) 11% (14) 36% (45) 14% (18) 124Military HH: Yes 20% (62) 19% (59) 9% (29) 45% (142) 7% (23) 315Military HH: No 17% (290) 28% (471) 12% (207) 34% (565) 9% (150) 1683RD/WT: Right Direction 39% (294) 45% (340) 6% (48) 3% (23) 7% (52) 757RD/WT: Wrong Track 5% (58) 15% (189) 15% (188) 55% (684) 10% (121) 1241Biden Job Approve 36% (323) 48% (431) 8% (73) 2% (14) 7% (58) 899Biden Job Disapprove 3% (28) 9% (93) 15% (156) 66% (684) 8% (78) 1039
Continued on next page
Page 36
36
Morning ConsultTable POL3_2
Table POL3_2: Do you approve or disapprove of how President Biden is handling each of the following?Jobs
DemographicStronglyapprove
Somewhatapprove
Somewhatdisapprove
Stronglydisapprove
Don’t Know /No Opinion Total N
Registered Voters 18% (352) 26% (529) 12% (236) 35% (708) 9% (173) 1998Biden Job Strongly Approve 57% (239) 36% (151) 4% (16) 1% (3) 2% (9) 418Biden Job Somewhat Approve 18% (84) 58% (280) 12% (57) 2% (11) 10% (49) 481Biden Job Somewhat Disapprove 3% (9) 26% (66) 37% (92) 18% (46) 15% (38) 250Biden Job Strongly Disapprove 2% (19) 3% (27) 8% (64) 81% (638) 5% (39) 788Favorable of Biden 36% (331) 47% (432) 9% (79) 2% (15) 7% (69) 927Unfavorable of Biden 2% (20) 9% (90) 15% (150) 67% (683) 7% (76) 1019Very Favorable of Biden 58% (276) 35% (166) 3% (16) 1% (6) 3% (12) 476Somewhat Favorable of Biden 12% (56) 59% (266) 14% (64) 2% (8) 13% (57) 451Somewhat Unfavorable of Biden 2% (5) 25% (53) 39% (82) 17% (34) 16% (34) 207Very Unfavorable of Biden 2% (15) 5% (38) 8% (68) 80% (649) 5% (42) 812#1 Issue: Economy 12% (93) 24% (182) 16% (124) 40% (310) 8% (59) 768#1 Issue: Security 8% (29) 17% (60) 9% (32) 61% (220) 5% (19) 360#1 Issue: Health Care 26% (60) 40% (92) 7% (16) 16% (37) 11% (26) 231#1 Issue: Medicare / Social Security 27% (61) 30% (68) 7% (15) 30% (68) 7% (15) 227#1 Issue: Women’s Issues 27% (34) 31% (38) 17% (21) 11% (14) 14% (18) 125#1 Issue: Education 28% (17) 39% (23) 7% (4) 10% (6) 15% (9) 59#1 Issue: Energy 32% (34) 31% (33) 13% (14) 13% (14) 11% (12) 107#1 Issue: Other 20% (25) 27% (33) 7% (9) 32% (39) 13% (16) 1222020 Vote: Joe Biden 32% (301) 44% (418) 10% (97) 5% (47) 9% (83) 9462020 Vote: Donald Trump 4% (38) 9% (74) 12% (101) 69% (599) 6% (53) 8642020 Vote: Didn’t Vote 8% (12) 21% (32) 20% (30) 32% (48) 20% (31) 1532018 House Vote: Democrat 34% (262) 41% (317) 9% (72) 7% (56) 8% (61) 7692018 House Vote: Republican 5% (34) 10% (73) 12% (86) 68% (478) 4% (31) 7022016 Vote: Hillary Clinton 37% (250) 43% (293) 8% (57) 5% (37) 7% (48) 6852016 Vote: Donald Trump 6% (45) 12% (94) 12% (98) 65% (524) 5% (41) 8022016 Vote: Other 9% (7) 20% (17) 25% (21) 33% (27) 14% (12) 842016 Vote: Didn’t Vote 11% (47) 30% (125) 14% (58) 28% (119) 17% (73) 423Voted in 2014: Yes 21% (276) 25% (333) 11% (150) 38% (504) 5% (73) 1335Voted in 2014: No 12% (77) 30% (197) 13% (86) 31% (204) 15% (100) 663
Continued on next page
Page 37
National Tracking Poll #2110084, October, 2021
37
Table POL3_2
Table POL3_2: Do you approve or disapprove of how President Biden is handling each of the following?Jobs
DemographicStronglyapprove
Somewhatapprove
Somewhatdisapprove
Stronglydisapprove
Don’t Know /No Opinion Total N
Registered Voters 18% (352) 26% (529) 12% (236) 35% (708) 9% (173) 19984-Region: Northeast 19% (69) 30% (107) 13% (46) 30% (107) 7% (25) 3534-Region: Midwest 17% (75) 22% (97) 14% (61) 39% (174) 9% (38) 4444-Region: South 17% (123) 22% (168) 11% (78) 41% (304) 10% (72) 7464-Region: West 19% (85) 35% (159) 11% (51) 27% (123) 8% (38) 455Party: Democrat/Leans Democrat 33% (303) 43% (391) 10% (92) 5% (48) 9% (80) 914Party: Republican/Leans Republican 4% (32) 10% (77) 13% (107) 68% (548) 5% (43) 808Note: Row proportions may total to larger than one-hundred percent due to rounding. For more information visit MorningConsultIntelligence.com.
Page 38
38
Morning ConsultTable POL3_3
Table POL3_3: Do you approve or disapprove of how President Biden is handling each of the following?Health care
DemographicStronglyapprove
Somewhatapprove
Somewhatdisapprove
Stronglydisapprove
Don’t Know /No Opinion Total N
Registered Voters 19% (370) 27% (538) 13% (269) 32% (639) 9% (182) 1998Gender: Male 21% (195) 29% (271) 13% (123) 31% (289) 7% (64) 942Gender: Female 17% (175) 25% (267) 14% (146) 33% (350) 11% (119) 1056Age: 18-34 20% (103) 28% (145) 15% (77) 24% (126) 12% (63) 514Age: 35-44 18% (56) 34% (104) 14% (42) 23% (72) 10% (32) 307Age: 45-64 15% (101) 26% (173) 16% (109) 35% (238) 8% (57) 679Age: 65+ 22% (109) 23% (115) 8% (41) 41% (203) 6% (30) 497GenZers: 1997-2012 15% (26) 31% (52) 14% (23) 25% (43) 15% (26) 170Millennials: 1981-1996 22% (120) 30% (166) 14% (80) 23% (127) 11% (59) 551GenXers: 1965-1980 13% (61) 27% (129) 17% (81) 32% (148) 10% (49) 469Baby Boomers: 1946-1964 19% (142) 24% (176) 11% (79) 40% (293) 6% (43) 732PID: Dem (no lean) 36% (280) 42% (329) 8% (65) 6% (44) 8% (59) 777PID: Ind (no lean) 10% (53) 25% (132) 19% (99) 32% (170) 14% (74) 528PID: Rep (no lean) 5% (37) 11% (77) 15% (106) 61% (425) 7% (49) 693PID/Gender: DemMen 39% (138) 43% (152) 8% (28) 6% (20) 4% (16) 352PID/Gender: DemWomen 34% (143) 42% (178) 9% (37) 6% (24) 10% (43) 425PID/Gender: Ind Men 12% (35) 25% (69) 19% (52) 32% (89) 12% (35) 280PID/Gender: Ind Women 7% (18) 25% (63) 19% (47) 32% (80) 16% (39) 248PID/Gender: Rep Men 7% (22) 16% (51) 14% (43) 58% (180) 4% (13) 310PID/Gender: Rep Women 4% (14) 7% (26) 16% (62) 64% (246) 9% (36) 384Ideo: Liberal (1-3) 36% (202) 40% (227) 10% (56) 8% (43) 7% (39) 566Ideo: Moderate (4) 19% (105) 39% (218) 16% (90) 17% (94) 10% (54) 560Ideo: Conservative (5-7) 7% (49) 10% (71) 14% (105) 63% (457) 7% (48) 730Educ: < College 17% (201) 23% (280) 13% (158) 37% (441) 10% (126) 1206Educ: Bachelors degree 16% (82) 32% (163) 16% (78) 28% (140) 8% (39) 501Educ: Post-grad 30% (87) 33% (95) 12% (34) 20% (58) 6% (17) 290Income: Under 50k 18% (160) 26% (227) 13% (116) 32% (283) 10% (87) 873Income: 50k-100k 17% (126) 26% (187) 12% (88) 35% (252) 10% (74) 728Income: 100k+ 21% (84) 31% (125) 16% (65) 26% (103) 5% (21) 398Ethnicity: White 17% (266) 25% (387) 14% (209) 35% (546) 9% (136) 1544Ethnicity: Hispanic 24% (53) 24% (53) 15% (34) 27% (59) 10% (22) 222
Continued on next page
Page 39
National Tracking Poll #2110084, October, 2021
39
Table POL3_3
Table POL3_3: Do you approve or disapprove of how President Biden is handling each of the following?Health care
DemographicStronglyapprove
Somewhatapprove
Somewhatdisapprove
Stronglydisapprove
Don’t Know /No Opinion Total N
Registered Voters 19% (370) 27% (538) 13% (269) 32% (639) 9% (182) 1998Ethnicity: Black 25% (63) 40% (100) 11% (29) 14% (36) 10% (25) 253Ethnicity: Other 21% (42) 25% (50) 16% (32) 28% (56) 11% (21) 201All Christian 19% (201) 24% (249) 12% (129) 36% (378) 8% (84) 1041All Non-Christian 30% (32) 34% (36) 10% (11) 18% (19) 7% (8) 107Atheist 18% (14) 42% (32) 14% (11) 21% (16) 5% (4) 78Agnostic/Nothing in particular 15% (72) 31% (149) 14% (67) 27% (131) 13% (61) 480Something Else 17% (50) 24% (72) 18% (51) 32% (95) 9% (25) 293Religious Non-Protestant/Catholic 27% (35) 30% (39) 13% (17) 20% (25) 10% (13) 129Evangelical 17% (84) 24% (118) 12% (60) 40% (199) 7% (37) 499Non-Evangelical 20% (155) 24% (193) 14% (112) 34% (265) 8% (65) 790Community: Urban 26% (127) 35% (171) 11% (55) 19% (92) 9% (41) 487Community: Suburban 18% (185) 27% (286) 14% (145) 32% (337) 9% (89) 1041Community: Rural 12% (58) 17% (81) 15% (70) 45% (209) 11% (52) 469Employ: Private Sector 17% (114) 30% (207) 16% (108) 29% (196) 9% (58) 684Employ: Government 20% (22) 31% (35) 21% (24) 20% (23) 8% (9) 112Employ: Self-Employed 19% (34) 29% (53) 13% (25) 30% (55) 9% (16) 183Employ: Homemaker 15% (15) 21% (22) 17% (18) 33% (35) 14% (15) 104Employ: Student 21% (14) 32% (21) 16% (11) 16% (11) 15% (10) 67Employ: Retired 22% (115) 23% (123) 7% (35) 43% (230) 6% (30) 534Employ: Unemployed 23% (44) 24% (46) 10% (20) 29% (54) 14% (27) 191Employ: Other 9% (12) 25% (31) 24% (30) 28% (35) 13% (17) 124Military HH: Yes 19% (60) 24% (75) 9% (30) 39% (122) 9% (27) 315Military HH: No 18% (309) 27% (462) 14% (240) 31% (517) 9% (155) 1683RD/WT: Right Direction 40% (303) 43% (328) 8% (57) 2% (18) 7% (51) 757RD/WT: Wrong Track 5% (66) 17% (210) 17% (212) 50% (620) 11% (132) 1241Biden Job Approve 37% (335) 47% (423) 8% (75) 1% (12) 6% (54) 899Biden Job Disapprove 3% (34) 11% (111) 18% (188) 59% (611) 9% (96) 1039
Continued on next page
Page 40
40
Morning ConsultTable POL3_3
Table POL3_3: Do you approve or disapprove of how President Biden is handling each of the following?Health care
DemographicStronglyapprove
Somewhatapprove
Somewhatdisapprove
Stronglydisapprove
Don’t Know /No Opinion Total N
Registered Voters 19% (370) 27% (538) 13% (269) 32% (639) 9% (182) 1998Biden Job Strongly Approve 60% (251) 33% (140) 3% (13) — (2) 3% (12) 418Biden Job Somewhat Approve 17% (84) 59% (283) 13% (62) 2% (10) 9% (42) 481Biden Job Somewhat Disapprove 5% (13) 29% (72) 38% (94) 16% (39) 13% (32) 250Biden Job Strongly Disapprove 3% (21) 5% (39) 12% (93) 73% (572) 8% (63) 788Favorable of Biden 37% (341) 46% (423) 9% (81) 2% (21) 7% (61) 927Unfavorable of Biden 3% (27) 10% (107) 18% (183) 59% (605) 10% (98) 1019Very Favorable of Biden 60% (284) 32% (153) 4% (18) 1% (7) 3% (14) 476Somewhat Favorable of Biden 13% (57) 60% (269) 14% (63) 3% (14) 10% (47) 451Somewhat Unfavorable of Biden 4% (8) 27% (56) 41% (86) 13% (26) 15% (32) 207Very Unfavorable of Biden 2% (19) 6% (51) 12% (97) 71% (579) 8% (66) 812#1 Issue: Economy 13% (97) 26% (196) 18% (141) 33% (254) 10% (79) 768#1 Issue: Security 8% (28) 16% (58) 10% (36) 57% (204) 9% (34) 360#1 Issue: Health Care 29% (67) 35% (82) 11% (25) 17% (39) 8% (18) 231#1 Issue: Medicare / Social Security 29% (65) 28% (64) 9% (21) 27% (60) 7% (16) 227#1 Issue: Women’s Issues 32% (40) 31% (39) 12% (15) 16% (19) 9% (11) 125#1 Issue: Education 16% (9) 47% (28) 13% (8) 11% (7) 13% (8) 59#1 Issue: Energy 32% (34) 39% (42) 10% (10) 13% (14) 6% (7) 107#1 Issue: Other 23% (29) 24% (30) 10% (12) 34% (42) 9% (11) 1222020 Vote: Joe Biden 33% (313) 44% (412) 11% (107) 4% (39) 8% (75) 9462020 Vote: Donald Trump 4% (38) 10% (90) 15% (128) 62% (533) 9% (74) 8642020 Vote: Didn’t Vote 10% (15) 20% (30) 19% (28) 34% (52) 17% (26) 1532018 House Vote: Democrat 34% (262) 43% (327) 10% (76) 6% (47) 7% (57) 7692018 House Vote: Republican 5% (34) 11% (80) 16% (115) 60% (421) 7% (50) 7022016 Vote: Hillary Clinton 36% (247) 44% (299) 9% (63) 4% (30) 7% (46) 6852016 Vote: Donald Trump 6% (46) 12% (99) 16% (130) 58% (464) 8% (63) 8022016 Vote: Other 11% (9) 32% (27) 14% (12) 29% (24) 14% (12) 842016 Vote: Didn’t Vote 16% (66) 27% (113) 15% (63) 29% (121) 14% (61) 423Voted in 2014: Yes 21% (281) 27% (355) 13% (167) 34% (453) 6% (79) 1335Voted in 2014: No 13% (89) 28% (183) 15% (102) 28% (186) 16% (103) 663
Continued on next page
Page 41
National Tracking Poll #2110084, October, 2021
41
Table POL3_3
Table POL3_3: Do you approve or disapprove of how President Biden is handling each of the following?Health care
DemographicStronglyapprove
Somewhatapprove
Somewhatdisapprove
Stronglydisapprove
Don’t Know /No Opinion Total N
Registered Voters 19% (370) 27% (538) 13% (269) 32% (639) 9% (182) 19984-Region: Northeast 21% (74) 30% (107) 12% (43) 24% (84) 13% (45) 3534-Region: Midwest 16% (69) 25% (112) 14% (62) 37% (163) 9% (38) 4444-Region: South 18% (135) 22% (166) 14% (102) 38% (283) 8% (59) 7464-Region: West 20% (91) 34% (153) 14% (62) 24% (109) 9% (40) 455Party: Democrat/Leans Democrat 34% (313) 43% (389) 10% (87) 6% (52) 8% (73) 914Party: Republican/Leans Republican 5% (38) 12% (93) 16% (126) 60% (485) 8% (66) 808Note: Row proportions may total to larger than one-hundred percent due to rounding. For more information visit MorningConsultIntelligence.com.
Page 42
42
Morning ConsultTable POL3_4
Table POL3_4: Do you approve or disapprove of how President Biden is handling each of the following?Immigration
DemographicStronglyapprove
Somewhatapprove
Somewhatdisapprove
Stronglydisapprove
Don’t Know /No Opinion Total N
Registered Voters 12% (236) 23% (460) 15% (290) 42% (845) 8% (167) 1998Gender: Male 14% (127) 24% (223) 17% (155) 41% (386) 5% (50) 942Gender: Female 10% (109) 22% (237) 13% (134) 43% (459) 11% (117) 1056Age: 18-34 12% (63) 28% (146) 16% (83) 27% (141) 16% (81) 514Age: 35-44 17% (51) 27% (84) 16% (48) 32% (97) 9% (27) 307Age: 45-64 10% (67) 18% (125) 15% (100) 51% (343) 6% (43) 679Age: 65+ 11% (54) 21% (105) 12% (58) 53% (264) 3% (16) 497GenZers: 1997-2012 9% (15) 29% (49) 15% (26) 23% (40) 24% (41) 170Millennials: 1981-1996 16% (88) 28% (155) 15% (85) 30% (163) 11% (60) 551GenXers: 1965-1980 10% (47) 22% (102) 16% (76) 46% (215) 7% (31) 469Baby Boomers: 1946-1964 11% (77) 20% (145) 13% (94) 52% (383) 4% (33) 732PID: Dem (no lean) 24% (184) 40% (311) 17% (131) 10% (74) 10% (76) 777PID: Ind (no lean) 5% (26) 22% (114) 18% (97) 41% (219) 14% (71) 528PID: Rep (no lean) 4% (26) 5% (34) 9% (61) 80% (552) 3% (20) 693PID/Gender: DemMen 27% (95) 41% (144) 18% (65) 9% (33) 4% (15) 352PID/Gender: DemWomen 21% (89) 39% (167) 16% (66) 10% (41) 14% (61) 425PID/Gender: Ind Men 5% (13) 21% (58) 22% (62) 42% (117) 11% (30) 280PID/Gender: Ind Women 5% (13) 23% (56) 14% (35) 41% (101) 17% (42) 248PID/Gender: Rep Men 6% (19) 6% (20) 9% (29) 76% (236) 2% (6) 310PID/Gender: Rep Women 2% (7) 4% (14) 8% (32) 82% (316) 4% (14) 384Ideo: Liberal (1-3) 22% (126) 39% (220) 20% (112) 10% (56) 9% (52) 566Ideo: Moderate (4) 12% (67) 31% (173) 21% (115) 29% (163) 8% (43) 560Ideo: Conservative (5-7) 5% (39) 6% (41) 6% (44) 80% (581) 4% (26) 730Educ: < College 10% (125) 20% (244) 14% (171) 45% (545) 10% (120) 1206Educ: Bachelors degree 13% (64) 25% (127) 14% (69) 42% (208) 7% (33) 501Educ: Post-grad 16% (47) 30% (89) 17% (49) 32% (92) 5% (14) 290Income: Under 50k 10% (87) 23% (205) 14% (120) 42% (365) 11% (96) 873Income: 50k-100k 12% (89) 21% (156) 14% (99) 45% (328) 8% (55) 728Income: 100k+ 15% (60) 25% (99) 18% (70) 38% (152) 4% (16) 398Ethnicity: White 11% (171) 21% (328) 13% (195) 48% (741) 7% (108) 1544Ethnicity: Hispanic 12% (27) 28% (63) 15% (33) 30% (66) 15% (33) 222
Continued on next page
Page 43
National Tracking Poll #2110084, October, 2021
43
Table POL3_4
Table POL3_4: Do you approve or disapprove of how President Biden is handling each of the following?Immigration
DemographicStronglyapprove
Somewhatapprove
Somewhatdisapprove
Stronglydisapprove
Don’t Know /No Opinion Total N
Registered Voters 12% (236) 23% (460) 15% (290) 42% (845) 8% (167) 1998Ethnicity: Black 14% (36) 36% (91) 23% (58) 14% (35) 13% (34) 253Ethnicity: Other 14% (29) 20% (41) 18% (37) 34% (69) 13% (26) 201All Christian 12% (130) 20% (213) 12% (129) 49% (510) 6% (60) 1041All Non-Christian 18% (19) 37% (39) 16% (17) 24% (26) 6% (7) 107Atheist 11% (9) 34% (26) 16% (13) 25% (19) 14% (11) 78Agnostic/Nothing in particular 10% (46) 25% (120) 17% (81) 35% (169) 14% (65) 480Something Else 11% (33) 21% (62) 17% (51) 42% (122) 9% (25) 293Religious Non-Protestant/Catholic 15% (19) 32% (41) 16% (21) 31% (40) 6% (8) 129Evangelical 13% (64) 19% (96) 12% (62) 50% (250) 5% (27) 499Non-Evangelical 12% (94) 21% (168) 14% (110) 46% (361) 7% (56) 790Community: Urban 19% (94) 29% (143) 18% (89) 25% (120) 9% (42) 487Community: Suburban 10% (107) 24% (245) 14% (141) 44% (458) 9% (89) 1041Community: Rural 7% (35) 15% (72) 13% (60) 57% (266) 8% (37) 469Employ: Private Sector 14% (97) 24% (163) 15% (106) 40% (271) 7% (48) 684Employ: Government 14% (15) 32% (36) 16% (18) 31% (35) 7% (8) 112Employ: Self-Employed 13% (24) 25% (45) 16% (28) 41% (75) 6% (11) 183Employ: Homemaker 10% (11) 14% (14) 13% (14) 46% (48) 16% (17) 104Employ: Student 4% (3) 33% (22) 15% (10) 21% (14) 26% (18) 67Employ: Retired 11% (59) 20% (107) 13% (72) 53% (282) 3% (15) 534Employ: Unemployed 9% (17) 28% (52) 15% (28) 32% (60) 17% (32) 191Employ: Other 9% (11) 16% (20) 11% (14) 48% (60) 15% (19) 124Military HH: Yes 11% (34) 18% (58) 15% (47) 51% (160) 5% (16) 315Military HH: No 12% (202) 24% (402) 14% (243) 41% (685) 9% (151) 1683RD/WT: Right Direction 26% (199) 45% (341) 14% (108) 6% (48) 8% (61) 757RD/WT: Wrong Track 3% (37) 10% (119) 15% (182) 64% (797) 9% (107) 1241Biden Job Approve 24% (214) 45% (403) 18% (158) 5% (49) 8% (75) 899Biden Job Disapprove 2% (22) 4% (46) 12% (125) 76% (787) 6% (59) 1039
Continued on next page
Page 44
44
Morning ConsultTable POL3_4
Table POL3_4: Do you approve or disapprove of how President Biden is handling each of the following?Immigration
DemographicStronglyapprove
Somewhatapprove
Somewhatdisapprove
Stronglydisapprove
Don’t Know /No Opinion Total N
Registered Voters 12% (236) 23% (460) 15% (290) 42% (845) 8% (167) 1998Biden Job Strongly Approve 41% (170) 42% (177) 11% (45) 3% (11) 4% (16) 418Biden Job Somewhat Approve 9% (44) 47% (226) 24% (113) 8% (38) 12% (60) 481Biden Job Somewhat Disapprove 3% (7) 14% (35) 36% (89) 37% (92) 11% (27) 250Biden Job Strongly Disapprove 2% (15) 2% (12) 4% (35) 88% (694) 4% (32) 788Favorable of Biden 24% (218) 44% (409) 17% (161) 5% (47) 10% (91) 927Unfavorable of Biden 2% (17) 4% (40) 12% (122) 77% (785) 5% (54) 1019Very Favorable of Biden 40% (188) 43% (202) 10% (46) 3% (13) 6% (26) 476Somewhat Favorable of Biden 7% (30) 46% (207) 26% (115) 8% (35) 14% (65) 451Somewhat Unfavorable of Biden 2% (5) 12% (25) 36% (74) 40% (82) 10% (21) 207Very Unfavorable of Biden 1% (12) 2% (16) 6% (48) 87% (703) 4% (33) 812#1 Issue: Economy 8% (64) 21% (160) 17% (134) 46% (357) 7% (53) 768#1 Issue: Security 5% (18) 9% (33) 7% (25) 74% (265) 5% (18) 360#1 Issue: Health Care 17% (40) 36% (82) 17% (40) 18% (41) 12% (28) 231#1 Issue: Medicare / Social Security 18% (40) 25% (56) 11% (24) 40% (90) 7% (16) 227#1 Issue: Women’s Issues 14% (17) 28% (35) 20% (25) 17% (21) 22% (27) 125#1 Issue: Education 21% (12) 37% (22) 11% (7) 14% (9) 16% (10) 59#1 Issue: Energy 26% (28) 31% (33) 19% (20) 17% (18) 7% (7) 107#1 Issue: Other 14% (17) 31% (38) 13% (15) 36% (44) 7% (8) 1222020 Vote: Joe Biden 21% (200) 41% (385) 19% (179) 10% (91) 10% (90) 9462020 Vote: Donald Trump 3% (26) 6% (48) 8% (65) 80% (687) 4% (37) 8642020 Vote: Didn’t Vote 5% (8) 15% (23) 24% (37) 33% (50) 23% (35) 1532018 House Vote: Democrat 22% (171) 39% (300) 20% (151) 11% (84) 8% (62) 7692018 House Vote: Republican 4% (27) 6% (45) 9% (62) 78% (549) 3% (18) 7022016 Vote: Hillary Clinton 24% (166) 43% (293) 17% (120) 8% (54) 8% (52) 6852016 Vote: Donald Trump 4% (30) 7% (56) 10% (77) 76% (608) 4% (30) 8022016 Vote: Other 2% (1) 17% (15) 29% (24) 40% (34) 11% (9) 842016 Vote: Didn’t Vote 9% (36) 23% (97) 16% (66) 35% (149) 18% (75) 423Voted in 2014: Yes 13% (176) 23% (307) 14% (187) 45% (600) 5% (65) 1335Voted in 2014: No 9% (60) 23% (153) 15% (103) 37% (245) 15% (103) 663
Continued on next page
Page 45
National Tracking Poll #2110084, October, 2021
45
Table POL3_4
Table POL3_4: Do you approve or disapprove of how President Biden is handling each of the following?Immigration
DemographicStronglyapprove
Somewhatapprove
Somewhatdisapprove
Stronglydisapprove
Don’t Know /No Opinion Total N
Registered Voters 12% (236) 23% (460) 15% (290) 42% (845) 8% (167) 19984-Region: Northeast 12% (44) 27% (96) 13% (46) 37% (130) 10% (36) 3534-Region: Midwest 11% (49) 21% (94) 16% (70) 44% (194) 8% (37) 4444-Region: South 12% (88) 19% (141) 14% (107) 48% (359) 7% (50) 7464-Region: West 12% (55) 28% (128) 15% (66) 35% (162) 10% (44) 455Party: Democrat/Leans Democrat 22% (200) 40% (368) 18% (163) 10% (91) 10% (92) 914Party: Republican/Leans Republican 3% (26) 5% (42) 10% (77) 79% (635) 3% (28) 808Note: Row proportions may total to larger than one-hundred percent due to rounding. For more information visit MorningConsultIntelligence.com.
Page 46
46
Morning ConsultTable POL3_5
Table POL3_5: Do you approve or disapprove of how President Biden is handling each of the following?Climate change
DemographicStronglyapprove
Somewhatapprove
Somewhatdisapprove
Stronglydisapprove
Don’t Know /No Opinion Total N
Registered Voters 18% (361) 25% (506) 14% (276) 30% (604) 13% (251) 1998Gender: Male 20% (186) 28% (260) 14% (128) 31% (290) 8% (78) 942Gender: Female 17% (175) 23% (246) 14% (149) 30% (314) 16% (174) 1056Age: 18-34 17% (86) 28% (142) 14% (71) 23% (118) 19% (97) 514Age: 35-44 19% (58) 31% (94) 15% (46) 23% (71) 12% (38) 307Age: 45-64 16% (107) 23% (157) 17% (113) 33% (227) 11% (76) 679Age: 65+ 22% (110) 23% (112) 9% (46) 38% (188) 8% (41) 497GenZers: 1997-2012 14% (24) 27% (46) 14% (23) 21% (36) 25% (42) 170Millennials: 1981-1996 19% (107) 29% (163) 14% (75) 23% (127) 15% (80) 551GenXers: 1965-1980 13% (59) 26% (123) 17% (80) 31% (145) 13% (61) 469Baby Boomers: 1946-1964 21% (150) 22% (164) 12% (88) 37% (267) 9% (63) 732PID: Dem (no lean) 34% (266) 41% (320) 10% (76) 4% (31) 11% (84) 777PID: Ind (no lean) 11% (58) 24% (125) 16% (85) 30% (160) 19% (100) 528PID: Rep (no lean) 5% (37) 9% (61) 17% (115) 60% (413) 10% (67) 693PID/Gender: DemMen 38% (134) 42% (148) 10% (36) 3% (11) 7% (23) 352PID/Gender: DemWomen 31% (132) 40% (172) 9% (40) 5% (20) 14% (61) 425PID/Gender: Ind Men 11% (31) 25% (70) 17% (47) 33% (92) 14% (39) 280PID/Gender: Ind Women 11% (27) 22% (54) 15% (38) 27% (68) 24% (61) 248PID/Gender: Rep Men 7% (22) 13% (41) 14% (45) 60% (187) 5% (15) 310PID/Gender: Rep Women 4% (15) 5% (20) 18% (71) 59% (226) 14% (52) 384Ideo: Liberal (1-3) 36% (204) 38% (215) 10% (54) 6% (37) 10% (57) 566Ideo: Moderate (4) 19% (105) 34% (191) 18% (99) 17% (95) 13% (70) 560Ideo: Conservative (5-7) 6% (46) 11% (77) 14% (101) 61% (445) 8% (61) 730Educ: < College 17% (199) 20% (247) 13% (152) 35% (419) 16% (189) 1206Educ: Bachelors degree 18% (91) 32% (161) 16% (80) 26% (133) 7% (36) 501Educ: Post-grad 24% (70) 34% (99) 15% (44) 18% (52) 9% (26) 290Income: Under 50k 17% (146) 24% (212) 12% (106) 31% (270) 16% (139) 873Income: 50k-100k 19% (136) 23% (168) 14% (101) 33% (239) 12% (84) 728Income: 100k+ 20% (79) 32% (126) 17% (69) 24% (95) 7% (28) 398Ethnicity: White 17% (267) 24% (369) 14% (217) 33% (509) 12% (182) 1544Ethnicity: Hispanic 15% (33) 27% (61) 15% (33) 26% (59) 16% (36) 222
Continued on next page
Page 47
National Tracking Poll #2110084, October, 2021
47
Table POL3_5
Table POL3_5: Do you approve or disapprove of how President Biden is handling each of the following?Climate change
DemographicStronglyapprove
Somewhatapprove
Somewhatdisapprove
Stronglydisapprove
Don’t Know /No Opinion Total N
Registered Voters 18% (361) 25% (506) 14% (276) 30% (604) 13% (251) 1998Ethnicity: Black 22% (55) 33% (85) 14% (35) 16% (40) 15% (39) 253Ethnicity: Other 19% (39) 26% (52) 12% (25) 27% (55) 15% (30) 201All Christian 18% (191) 24% (245) 14% (141) 34% (354) 11% (111) 1041All Non-Christian 29% (31) 35% (37) 9% (9) 17% (18) 10% (11) 107Atheist 18% (14) 38% (29) 14% (11) 20% (16) 10% (8) 78Agnostic/Nothing in particular 16% (78) 27% (131) 13% (64) 26% (124) 17% (82) 480Something Else 16% (48) 22% (63) 17% (51) 31% (92) 13% (39) 293Religious Non-Protestant/Catholic 26% (33) 32% (41) 7% (9) 22% (29) 13% (16) 129Evangelical 16% (79) 20% (99) 14% (70) 39% (195) 11% (56) 499Non-Evangelical 19% (151) 25% (196) 15% (120) 30% (237) 11% (87) 790Community: Urban 26% (127) 33% (158) 13% (63) 18% (85) 11% (53) 487Community: Suburban 17% (177) 26% (269) 13% (135) 32% (334) 12% (127) 1041Community: Rural 12% (57) 17% (79) 17% (78) 39% (185) 15% (71) 469Employ: Private Sector 18% (124) 28% (193) 16% (107) 27% (185) 11% (75) 684Employ: Government 18% (20) 37% (41) 16% (17) 18% (21) 12% (13) 112Employ: Self-Employed 24% (43) 17% (30) 16% (29) 26% (48) 18% (32) 183Employ: Homemaker 15% (16) 17% (17) 19% (20) 32% (33) 17% (17) 104Employ: Student 13% (9) 35% (24) 13% (9) 17% (12) 21% (14) 67Employ: Retired 21% (114) 23% (120) 10% (54) 41% (216) 5% (29) 534Employ: Unemployed 12% (24) 28% (53) 12% (22) 26% (49) 22% (43) 191Employ: Other 9% (11) 22% (27) 14% (17) 33% (40) 23% (28) 124Military HH: Yes 16% (51) 23% (72) 15% (47) 37% (117) 9% (28) 315Military HH: No 18% (309) 26% (434) 14% (229) 29% (487) 13% (223) 1683RD/WT: Right Direction 37% (278) 44% (330) 9% (65) 3% (20) 9% (65) 757RD/WT: Wrong Track 7% (83) 14% (176) 17% (211) 47% (584) 15% (186) 1241Biden Job Approve 36% (320) 45% (406) 9% (84) 1% (10) 9% (80) 899Biden Job Disapprove 4% (40) 9% (97) 18% (187) 56% (583) 13% (132) 1039
Continued on next page
Page 48
48
Morning ConsultTable POL3_5
Table POL3_5: Do you approve or disapprove of how President Biden is handling each of the following?Climate change
DemographicStronglyapprove
Somewhatapprove
Somewhatdisapprove
Stronglydisapprove
Don’t Know /No Opinion Total N
Registered Voters 18% (361) 25% (506) 14% (276) 30% (604) 13% (251) 1998Biden Job Strongly Approve 55% (228) 38% (157) 4% (17) — (2) 3% (14) 418Biden Job Somewhat Approve 19% (92) 52% (248) 14% (67) 2% (8) 14% (66) 481Biden Job Somewhat Disapprove 6% (16) 25% (63) 32% (80) 16% (39) 21% (52) 250Biden Job Strongly Disapprove 3% (24) 4% (34) 14% (107) 69% (543) 10% (80) 788Favorable of Biden 35% (325) 44% (412) 9% (86) 1% (13) 10% (92) 927Unfavorable of Biden 3% (33) 8% (86) 18% (186) 57% (582) 13% (132) 1019Very Favorable of Biden 55% (262) 36% (170) 4% (18) 1% (5) 4% (21) 476Somewhat Favorable of Biden 14% (63) 54% (241) 15% (68) 2% (8) 16% (71) 451Somewhat Unfavorable of Biden 6% (12) 22% (45) 38% (79) 13% (26) 22% (46) 207Very Unfavorable of Biden 3% (22) 5% (41) 13% (107) 68% (556) 11% (86) 812#1 Issue: Economy 11% (82) 24% (187) 18% (140) 32% (243) 15% (117) 768#1 Issue: Security 9% (34) 14% (51) 13% (48) 53% (190) 10% (37) 360#1 Issue: Health Care 25% (59) 40% (92) 11% (25) 14% (32) 10% (23) 231#1 Issue: Medicare / Social Security 30% (68) 26% (58) 6% (14) 31% (70) 8% (17) 227#1 Issue: Women’s Issues 24% (30) 33% (41) 16% (20) 13% (16) 14% (18) 125#1 Issue: Education 38% (22) 28% (17) 9% (6) 8% (5) 17% (10) 59#1 Issue: Energy 35% (38) 32% (34) 11% (12) 12% (13) 10% (10) 107#1 Issue: Other 23% (28) 22% (27) 10% (12) 30% (36) 16% (19) 1222020 Vote: Joe Biden 32% (305) 41% (389) 12% (109) 4% (40) 11% (102) 9462020 Vote: Donald Trump 4% (36) 10% (87) 15% (129) 59% (507) 12% (105) 8642020 Vote: Didn’t Vote 10% (16) 17% (26) 18% (28) 31% (47) 24% (37) 1532018 House Vote: Democrat 33% (257) 41% (317) 11% (87) 5% (38) 9% (71) 7692018 House Vote: Republican 5% (34) 12% (84) 16% (115) 58% (405) 9% (64) 7022016 Vote: Hillary Clinton 35% (241) 43% (295) 11% (72) 4% (26) 7% (51) 6852016 Vote: Donald Trump 6% (49) 12% (94) 16% (129) 55% (444) 11% (86) 8022016 Vote: Other 9% (8) 32% (27) 20% (17) 24% (20) 16% (13) 842016 Vote: Didn’t Vote 14% (59) 21% (89) 14% (59) 27% (113) 24% (102) 423Voted in 2014: Yes 20% (267) 27% (359) 14% (182) 31% (419) 8% (109) 1335Voted in 2014: No 14% (94) 22% (147) 14% (95) 28% (185) 21% (142) 663
Continued on next page
Page 49
National Tracking Poll #2110084, October, 2021
49
Table POL3_5
Table POL3_5: Do you approve or disapprove of how President Biden is handling each of the following?Climate change
DemographicStronglyapprove
Somewhatapprove
Somewhatdisapprove
Stronglydisapprove
Don’t Know /No Opinion Total N
Registered Voters 18% (361) 25% (506) 14% (276) 30% (604) 13% (251) 19984-Region: Northeast 19% (66) 30% (107) 13% (46) 25% (89) 13% (46) 3534-Region: Midwest 17% (77) 23% (101) 14% (63) 33% (145) 14% (60) 4444-Region: South 16% (120) 20% (153) 15% (112) 36% (267) 13% (94) 7464-Region: West 21% (98) 32% (146) 12% (56) 23% (104) 11% (52) 455Party: Democrat/Leans Democrat 33% (301) 40% (369) 11% (100) 5% (44) 11% (101) 914Party: Republican/Leans Republican 5% (40) 10% (78) 16% (130) 58% (470) 11% (91) 808Note: Row proportions may total to larger than one-hundred percent due to rounding. For more information visit MorningConsultIntelligence.com.
Page 50
50
Morning ConsultTable POL3_6
Table POL3_6: Do you approve or disapprove of how President Biden is handling each of the following?The environment
DemographicStronglyapprove
Somewhatapprove
Somewhatdisapprove
Stronglydisapprove
Don’t Know /No Opinion Total N
Registered Voters 17% (345) 28% (553) 14% (281) 29% (589) 12% (230) 1998Gender: Male 19% (178) 30% (284) 15% (139) 29% (269) 8% (72) 942Gender: Female 16% (168) 26% (270) 13% (141) 30% (319) 15% (158) 1056Age: 18-34 15% (80) 33% (170) 13% (68) 23% (118) 15% (80) 514Age: 35-44 19% (60) 32% (100) 14% (42) 23% (70) 12% (36) 307Age: 45-64 14% (95) 25% (173) 19% (127) 31% (207) 11% (78) 679Age: 65+ 22% (112) 22% (111) 9% (44) 39% (193) 7% (37) 497GenZers: 1997-2012 10% (16) 35% (59) 15% (25) 20% (34) 21% (36) 170Millennials: 1981-1996 20% (109) 33% (180) 12% (66) 23% (129) 12% (69) 551GenXers: 1965-1980 12% (59) 29% (137) 16% (75) 29% (136) 13% (62) 469Baby Boomers: 1946-1964 19% (142) 23% (165) 14% (104) 36% (262) 8% (59) 732PID: Dem (no lean) 33% (259) 43% (334) 8% (65) 5% (42) 10% (77) 777PID: Ind (no lean) 10% (52) 27% (144) 18% (95) 27% (141) 18% (96) 528PID: Rep (no lean) 5% (34) 11% (75) 17% (121) 59% (406) 8% (57) 693PID/Gender: DemMen 37% (129) 43% (150) 9% (31) 5% (17) 7% (25) 352PID/Gender: DemWomen 31% (131) 43% (184) 8% (33) 6% (25) 12% (53) 425PID/Gender: Ind Men 10% (29) 30% (83) 20% (57) 26% (74) 13% (37) 280PID/Gender: Ind Women 9% (23) 25% (61) 16% (38) 27% (67) 24% (59) 248PID/Gender: Rep Men 6% (19) 16% (51) 17% (51) 57% (178) 3% (11) 310PID/Gender: Rep Women 4% (15) 6% (25) 18% (70) 60% (228) 12% (46) 384Ideo: Liberal (1-3) 32% (180) 42% (236) 10% (55) 8% (43) 9% (52) 566Ideo: Moderate (4) 20% (109) 38% (211) 18% (100) 15% (84) 10% (56) 560Ideo: Conservative (5-7) 6% (46) 11% (81) 15% (107) 59% (432) 9% (65) 730Educ: < College 15% (186) 24% (284) 13% (160) 34% (410) 14% (166) 1206Educ: Bachelors degree 17% (84) 34% (169) 16% (81) 26% (129) 8% (38) 501Educ: Post-grad 26% (75) 35% (100) 14% (40) 17% (50) 9% (25) 290Income: Under 50k 16% (137) 28% (243) 12% (101) 31% (268) 14% (125) 873Income: 50k-100k 17% (127) 24% (176) 16% (119) 32% (229) 10% (76) 728Income: 100k+ 20% (81) 34% (134) 15% (61) 23% (92) 7% (30) 398Ethnicity: White 17% (259) 25% (390) 15% (231) 32% (500) 11% (164) 1544Ethnicity: Hispanic 15% (34) 31% (69) 13% (29) 25% (56) 16% (35) 222
Continued on next page
Page 51
National Tracking Poll #2110084, October, 2021
51
Table POL3_6
Table POL3_6: Do you approve or disapprove of how President Biden is handling each of the following?The environment
DemographicStronglyapprove
Somewhatapprove
Somewhatdisapprove
Stronglydisapprove
Don’t Know /No Opinion Total N
Registered Voters 17% (345) 28% (553) 14% (281) 29% (589) 12% (230) 1998Ethnicity: Black 21% (53) 39% (99) 15% (37) 13% (32) 13% (32) 253Ethnicity: Other 17% (34) 32% (64) 6% (13) 28% (56) 17% (34) 201All Christian 18% (190) 25% (265) 13% (138) 34% (350) 10% (99) 1041All Non-Christian 31% (33) 34% (36) 15% (16) 14% (15) 7% (7) 107Atheist 22% (17) 31% (24) 18% (14) 19% (15) 10% (8) 78Agnostic/Nothing in particular 14% (66) 30% (143) 14% (70) 25% (122) 17% (79) 480Something Else 14% (40) 29% (85) 15% (43) 30% (88) 12% (37) 293Religious Non-Protestant/Catholic 27% (35) 31% (40) 13% (17) 21% (27) 8% (10) 129Evangelical 17% (84) 21% (106) 16% (78) 38% (189) 8% (41) 499Non-Evangelical 18% (139) 29% (228) 13% (101) 29% (232) 11% (90) 790Community: Urban 25% (121) 35% (169) 13% (62) 17% (85) 10% (50) 487Community: Suburban 16% (169) 28% (293) 14% (148) 30% (315) 11% (117) 1041Community: Rural 12% (55) 20% (92) 15% (71) 40% (189) 13% (63) 469Employ: Private Sector 18% (125) 30% (205) 15% (104) 27% (187) 9% (63) 684Employ: Government 12% (13) 42% (47) 19% (21) 16% (18) 11% (13) 112Employ: Self-Employed 16% (30) 28% (51) 18% (33) 24% (44) 14% (25) 183Employ: Homemaker 14% (14) 16% (17) 18% (19) 35% (36) 17% (18) 104Employ: Student 9% (6) 43% (29) 15% (10) 18% (12) 15% (10) 67Employ: Retired 22% (116) 21% (112) 11% (59) 39% (209) 7% (37) 534Employ: Unemployed 14% (27) 30% (57) 12% (24) 24% (46) 19% (36) 191Employ: Other 11% (13) 28% (35) 9% (12) 29% (35) 23% (28) 124Military HH: Yes 17% (54) 21% (67) 13% (40) 40% (126) 9% (28) 315Military HH: No 17% (292) 29% (487) 14% (240) 27% (462) 12% (202) 1683RD/WT: Right Direction 36% (274) 46% (346) 9% (67) 3% (22) 7% (49) 757RD/WT: Wrong Track 6% (72) 17% (208) 17% (213) 46% (567) 15% (181) 1241Biden Job Approve 34% (308) 48% (431) 8% (73) 2% (22) 7% (65) 899Biden Job Disapprove 4% (37) 11% (115) 19% (201) 53% (555) 13% (131) 1039
Continued on next page
Page 52
52
Morning ConsultTable POL3_6
Table POL3_6: Do you approve or disapprove of how President Biden is handling each of the following?The environment
DemographicStronglyapprove
Somewhatapprove
Somewhatdisapprove
Stronglydisapprove
Don’t Know /No Opinion Total N
Registered Voters 17% (345) 28% (553) 14% (281) 29% (589) 12% (230) 1998Biden Job Strongly Approve 55% (228) 36% (152) 5% (21) 2% (7) 2% (10) 418Biden Job Somewhat Approve 17% (80) 58% (279) 11% (52) 3% (15) 12% (55) 481Biden Job Somewhat Disapprove 5% (13) 33% (82) 33% (82) 12% (30) 17% (43) 250Biden Job Strongly Disapprove 3% (24) 4% (33) 15% (119) 67% (524) 11% (88) 788Favorable of Biden 34% (311) 48% (449) 8% (72) 3% (23) 8% (72) 927Unfavorable of Biden 3% (33) 10% (99) 20% (203) 54% (552) 13% (132) 1019Very Favorable of Biden 54% (256) 37% (178) 4% (20) 2% (10) 2% (12) 476Somewhat Favorable of Biden 12% (55) 60% (271) 12% (52) 3% (13) 13% (60) 451Somewhat Unfavorable of Biden 4% (9) 27% (56) 39% (81) 10% (20) 20% (40) 207Very Unfavorable of Biden 3% (23) 5% (42) 15% (122) 66% (532) 11% (92) 812#1 Issue: Economy 11% (82) 27% (205) 19% (145) 30% (230) 14% (107) 768#1 Issue: Security 7% (25) 16% (57) 14% (50) 53% (190) 10% (36) 360#1 Issue: Health Care 28% (65) 38% (87) 13% (29) 11% (26) 10% (24) 231#1 Issue: Medicare / Social Security 29% (66) 27% (62) 8% (18) 28% (64) 8% (17) 227#1 Issue: Women’s Issues 23% (29) 34% (42) 13% (17) 13% (17) 16% (20) 125#1 Issue: Education 15% (9) 57% (34) 3% (2) 9% (5) 16% (9) 59#1 Issue: Energy 39% (42) 28% (30) 10% (10) 18% (19) 5% (5) 107#1 Issue: Other 23% (28) 30% (37) 7% (9) 30% (37) 10% (12) 1222020 Vote: Joe Biden 32% (298) 45% (421) 10% (98) 4% (41) 9% (87) 9462020 Vote: Donald Trump 4% (31) 10% (85) 18% (152) 57% (494) 12% (102) 8642020 Vote: Didn’t Vote 9% (14) 26% (39) 14% (22) 30% (46) 21% (32) 1532018 House Vote: Democrat 32% (247) 42% (327) 11% (83) 5% (40) 9% (73) 7692018 House Vote: Republican 5% (35) 12% (85) 18% (129) 56% (392) 9% (61) 7022016 Vote: Hillary Clinton 34% (236) 44% (304) 9% (64) 4% (27) 8% (54) 6852016 Vote: Donald Trump 5% (43) 12% (98) 18% (146) 54% (433) 10% (82) 8022016 Vote: Other 8% (7) 36% (30) 18% (15) 22% (18) 15% (13) 842016 Vote: Didn’t Vote 13% (57) 28% (118) 13% (55) 26% (110) 19% (82) 423Voted in 2014: Yes 19% (258) 27% (367) 14% (190) 31% (411) 8% (108) 1335Voted in 2014: No 13% (87) 28% (187) 14% (90) 27% (177) 18% (122) 663
Continued on next page
Page 53
National Tracking Poll #2110084, October, 2021
53
Table POL3_6
Table POL3_6: Do you approve or disapprove of how President Biden is handling each of the following?The environment
DemographicStronglyapprove
Somewhatapprove
Somewhatdisapprove
Stronglydisapprove
Don’t Know /No Opinion Total N
Registered Voters 17% (345) 28% (553) 14% (281) 29% (589) 12% (230) 19984-Region: Northeast 20% (70) 30% (106) 15% (53) 20% (72) 14% (51) 3534-Region: Midwest 18% (79) 23% (104) 14% (63) 32% (144) 12% (55) 4444-Region: South 16% (118) 23% (168) 15% (110) 36% (270) 11% (80) 7464-Region: West 17% (78) 39% (175) 12% (55) 23% (103) 10% (44) 455Party: Democrat/Leans Democrat 32% (290) 44% (398) 10% (89) 5% (50) 10% (88) 914Party: Republican/Leans Republican 4% (36) 11% (91) 17% (138) 57% (460) 10% (83) 808Note: Row proportions may total to larger than one-hundred percent due to rounding. For more information visit MorningConsultIntelligence.com.
Page 54
54
Morning ConsultTable POL3_7
Table POL3_7: Do you approve or disapprove of how President Biden is handling each of the following?Energy
DemographicStronglyapprove
Somewhatapprove
Somewhatdisapprove
Stronglydisapprove
Don’t Know /No Opinion Total N
Registered Voters 17% (339) 25% (506) 12% (247) 33% (651) 13% (255) 1998Gender: Male 19% (176) 27% (255) 14% (128) 33% (306) 8% (76) 942Gender: Female 15% (162) 24% (251) 11% (120) 33% (344) 17% (179) 1056Age: 18-34 20% (100) 26% (136) 13% (65) 22% (112) 20% (101) 514Age: 35-44 18% (55) 31% (96) 12% (37) 25% (77) 14% (42) 307Age: 45-64 13% (90) 22% (153) 14% (97) 39% (262) 11% (77) 679Age: 65+ 19% (93) 24% (122) 10% (48) 40% (200) 7% (35) 497GenZers: 1997-2012 17% (29) 26% (45) 10% (17) 18% (30) 29% (49) 170Millennials: 1981-1996 21% (114) 28% (157) 12% (66) 24% (134) 14% (80) 551GenXers: 1965-1980 11% (53) 26% (124) 14% (65) 35% (164) 13% (63) 469Baby Boomers: 1946-1964 17% (125) 23% (167) 12% (90) 40% (291) 8% (59) 732PID: Dem (no lean) 33% (258) 40% (310) 8% (65) 5% (38) 14% (105) 777PID: Ind (no lean) 8% (44) 26% (137) 16% (83) 31% (165) 19% (98) 528PID: Rep (no lean) 5% (36) 9% (59) 14% (99) 64% (447) 7% (52) 693PID/Gender: DemMen 37% (129) 39% (139) 9% (32) 5% (19) 9% (33) 352PID/Gender: DemWomen 30% (129) 40% (171) 8% (33) 4% (19) 17% (72) 425PID/Gender: Ind Men 9% (24) 26% (73) 20% (55) 33% (93) 12% (35) 280PID/Gender: Ind Women 8% (20) 26% (64) 11% (28) 29% (73) 26% (64) 248PID/Gender: Rep Men 7% (22) 14% (44) 13% (40) 63% (195) 3% (9) 310PID/Gender: Rep Women 4% (14) 4% (15) 15% (59) 66% (252) 11% (43) 384Ideo: Liberal (1-3) 33% (184) 40% (224) 10% (56) 6% (36) 12% (66) 566Ideo: Moderate (4) 19% (108) 33% (187) 18% (101) 17% (95) 12% (69) 560Ideo: Conservative (5-7) 5% (38) 10% (73) 10% (76) 67% (487) 8% (57) 730Educ: < College 15% (185) 22% (262) 12% (142) 36% (433) 15% (184) 1206Educ: Bachelors degree 16% (81) 29% (147) 13% (63) 32% (160) 10% (52) 501Educ: Post-grad 25% (73) 34% (97) 15% (42) 20% (58) 7% (20) 290Income: Under 50k 15% (131) 25% (220) 12% (101) 32% (279) 16% (142) 873Income: 50k-100k 17% (124) 24% (173) 13% (98) 34% (251) 11% (82) 728Income: 100k+ 21% (83) 28% (113) 12% (49) 30% (121) 8% (32) 398Ethnicity: White 15% (236) 25% (384) 12% (188) 36% (559) 11% (177) 1544Ethnicity: Hispanic 18% (40) 30% (66) 11% (24) 24% (52) 18% (41) 222
Continued on next page
Page 55
National Tracking Poll #2110084, October, 2021
55
Table POL3_7
Table POL3_7: Do you approve or disapprove of how President Biden is handling each of the following?Energy
DemographicStronglyapprove
Somewhatapprove
Somewhatdisapprove
Stronglydisapprove
Don’t Know /No Opinion Total N
Registered Voters 17% (339) 25% (506) 12% (247) 33% (651) 13% (255) 1998Ethnicity: Black 26% (66) 29% (73) 14% (36) 13% (34) 17% (44) 253Ethnicity: Other 18% (37) 24% (49) 12% (23) 29% (58) 17% (34) 201All Christian 17% (182) 24% (248) 11% (110) 38% (401) 10% (100) 1041All Non-Christian 32% (34) 29% (30) 11% (12) 19% (20) 10% (11) 107Atheist 15% (11) 43% (33) 12% (9) 19% (14) 12% (10) 78Agnostic/Nothing in particular 14% (67) 25% (122) 16% (75) 26% (126) 19% (91) 480Something Else 15% (44) 25% (73) 14% (42) 31% (90) 15% (44) 293Religious Non-Protestant/Catholic 28% (36) 25% (32) 12% (16) 21% (27) 14% (18) 129Evangelical 15% (76) 21% (103) 11% (54) 41% (206) 12% (60) 499Non-Evangelical 18% (139) 26% (209) 12% (92) 35% (274) 10% (76) 790Community: Urban 26% (126) 30% (148) 12% (59) 20% (99) 11% (54) 487Community: Suburban 16% (163) 26% (275) 11% (112) 34% (350) 14% (141) 1041Community: Rural 10% (49) 18% (83) 16% (76) 43% (202) 13% (59) 469Employ: Private Sector 18% (124) 27% (182) 13% (90) 30% (205) 12% (83) 684Employ: Government 19% (22) 33% (37) 8% (9) 27% (30) 12% (14) 112Employ: Self-Employed 20% (37) 20% (36) 16% (30) 31% (57) 13% (23) 183Employ: Homemaker 14% (14) 18% (19) 17% (18) 32% (33) 19% (20) 104Employ: Student 16% (11) 39% (26) 13% (9) 14% (10) 18% (12) 67Employ: Retired 18% (93) 23% (124) 11% (57) 43% (229) 6% (30) 534Employ: Unemployed 13% (24) 27% (52) 11% (21) 24% (45) 26% (49) 191Employ: Other 11% (13) 25% (31) 11% (13) 34% (42) 20% (25) 124Military HH: Yes 16% (50) 19% (60) 15% (47) 41% (130) 9% (29) 315Military HH: No 17% (289) 27% (447) 12% (201) 31% (521) 13% (226) 1683RD/WT: Right Direction 36% (275) 42% (320) 8% (60) 3% (26) 10% (76) 757RD/WT: Wrong Track 5% (64) 15% (186) 15% (187) 50% (624) 14% (179) 1241Biden Job Approve 33% (301) 46% (413) 7% (62) 3% (25) 11% (98) 899Biden Job Disapprove 4% (38) 9% (89) 17% (181) 59% (617) 11% (114) 1039
Continued on next page
Page 56
56
Morning ConsultTable POL3_7
Table POL3_7: Do you approve or disapprove of how President Biden is handling each of the following?Energy
DemographicStronglyapprove
Somewhatapprove
Somewhatdisapprove
Stronglydisapprove
Don’t Know /No Opinion Total N
Registered Voters 17% (339) 25% (506) 12% (247) 33% (651) 13% (255) 1998Biden Job Strongly Approve 53% (223) 37% (153) 4% (18) 1% (5) 5% (19) 418Biden Job Somewhat Approve 16% (77) 54% (260) 9% (44) 4% (20) 16% (79) 481Biden Job Somewhat Disapprove 5% (14) 24% (60) 35% (89) 14% (36) 21% (52) 250Biden Job Strongly Disapprove 3% (24) 4% (29) 12% (93) 74% (581) 8% (61) 788Favorable of Biden 33% (307) 45% (419) 7% (64) 3% (23) 12% (114) 927Unfavorable of Biden 3% (31) 7% (75) 18% (181) 61% (619) 11% (113) 1019Very Favorable of Biden 55% (262) 36% (170) 3% (15) 1% (7) 5% (22) 476Somewhat Favorable of Biden 10% (45) 55% (249) 11% (49) 4% (16) 20% (92) 451Somewhat Unfavorable of Biden 4% (9) 22% (45) 40% (82) 13% (28) 21% (44) 207Very Unfavorable of Biden 3% (22) 4% (30) 12% (99) 73% (592) 9% (70) 812#1 Issue: Economy 11% (88) 22% (173) 16% (125) 35% (272) 14% (111) 768#1 Issue: Security 8% (28) 14% (49) 11% (38) 60% (216) 8% (28) 360#1 Issue: Health Care 23% (54) 40% (92) 11% (25) 12% (28) 13% (31) 231#1 Issue: Medicare / Social Security 25% (56) 28% (64) 8% (19) 28% (63) 11% (25) 227#1 Issue: Women’s Issues 27% (33) 31% (39) 10% (12) 11% (13) 22% (27) 125#1 Issue: Education 27% (16) 34% (20) 10% (6) 8% (5) 22% (13) 59#1 Issue: Energy 34% (37) 34% (37) 10% (10) 14% (15) 8% (8) 107#1 Issue: Other 22% (26) 27% (33) 10% (13) 31% (38) 10% (12) 1222020 Vote: Joe Biden 30% (286) 43% (409) 10% (92) 4% (40) 13% (120) 9462020 Vote: Donald Trump 5% (40) 7% (64) 14% (123) 64% (554) 10% (83) 8642020 Vote: Didn’t Vote 8% (12) 18% (27) 16% (25) 29% (45) 29% (44) 1532018 House Vote: Democrat 31% (235) 42% (320) 10% (79) 6% (43) 12% (91) 7692018 House Vote: Republican 5% (33) 11% (76) 15% (102) 63% (445) 7% (46) 7022016 Vote: Hillary Clinton 33% (226) 43% (293) 10% (66) 4% (24) 11% (76) 6852016 Vote: Donald Trump 5% (43) 10% (82) 14% (114) 61% (492) 9% (71) 8022016 Vote: Other 7% (6) 23% (19) 28% (24) 29% (24) 13% (11) 842016 Vote: Didn’t Vote 15% (63) 26% (109) 10% (43) 26% (110) 23% (98) 423Voted in 2014: Yes 19% (251) 26% (345) 12% (164) 35% (468) 8% (107) 1335Voted in 2014: No 13% (88) 24% (162) 13% (83) 28% (182) 22% (148) 663
Continued on next page
Page 57
National Tracking Poll #2110084, October, 2021
57
Table POL3_7
Table POL3_7: Do you approve or disapprove of how President Biden is handling each of the following?Energy
DemographicStronglyapprove
Somewhatapprove
Somewhatdisapprove
Stronglydisapprove
Don’t Know /No Opinion Total N
Registered Voters 17% (339) 25% (506) 12% (247) 33% (651) 13% (255) 19984-Region: Northeast 18% (62) 33% (118) 13% (44) 26% (91) 11% (38) 3534-Region: Midwest 14% (64) 23% (102) 12% (55) 35% (154) 16% (70) 4444-Region: South 16% (119) 19% (145) 14% (101) 38% (286) 13% (94) 7464-Region: West 21% (94) 31% (142) 10% (48) 26% (119) 12% (53) 455Party: Democrat/Leans Democrat 31% (286) 41% (376) 9% (84) 5% (44) 14% (124) 914Party: Republican/Leans Republican 5% (37) 9% (74) 14% (116) 63% (511) 9% (71) 808Note: Row proportions may total to larger than one-hundred percent due to rounding. For more information visit MorningConsultIntelligence.com.
Page 58
58
Morning ConsultTable POL3_8
Table POL3_8: Do you approve or disapprove of how President Biden is handling each of the following?Education
DemographicStronglyapprove
Somewhatapprove
Somewhatdisapprove
Stronglydisapprove
Don’t Know /No Opinion Total N
Registered Voters 18% (358) 27% (531) 11% (221) 31% (629) 13% (259) 1998Gender: Male 19% (183) 28% (268) 10% (97) 32% (298) 10% (96) 942Gender: Female 17% (175) 25% (263) 12% (124) 31% (331) 15% (163) 1056Age: 18-34 19% (100) 29% (148) 11% (57) 25% (127) 16% (83) 514Age: 35-44 22% (67) 30% (93) 12% (36) 24% (72) 13% (39) 307Age: 45-64 13% (89) 27% (181) 12% (81) 35% (236) 14% (93) 679Age: 65+ 21% (103) 22% (109) 9% (47) 39% (194) 9% (44) 497GenZers: 1997-2012 18% (31) 26% (45) 13% (23) 20% (34) 22% (38) 170Millennials: 1981-1996 22% (123) 30% (166) 9% (52) 25% (139) 13% (72) 551GenXers: 1965-1980 12% (58) 28% (130) 13% (63) 32% (150) 15% (69) 469Baby Boomers: 1946-1964 17% (127) 25% (180) 11% (78) 38% (274) 10% (72) 732PID: Dem (no lean) 36% (276) 40% (311) 7% (52) 5% (36) 13% (102) 777PID: Ind (no lean) 9% (50) 26% (139) 14% (74) 30% (161) 20% (104) 528PID: Rep (no lean) 5% (32) 12% (81) 14% (94) 62% (433) 8% (53) 693PID/Gender: DemMen 39% (139) 40% (142) 4% (15) 5% (17) 11% (40) 352PID/Gender: DemWomen 32% (138) 40% (170) 9% (37) 4% (18) 15% (62) 425PID/Gender: Ind Men 8% (23) 28% (79) 15% (43) 34% (96) 14% (40) 280PID/Gender: Ind Women 11% (27) 24% (60) 13% (31) 26% (65) 26% (64) 248PID/Gender: Rep Men 7% (21) 15% (48) 13% (39) 60% (185) 5% (16) 310PID/Gender: Rep Women 3% (10) 9% (34) 14% (55) 65% (248) 10% (37) 384Ideo: Liberal (1-3) 35% (200) 36% (204) 9% (54) 7% (38) 13% (71) 566Ideo: Moderate (4) 18% (99) 38% (213) 14% (78) 16% (89) 15% (82) 560Ideo: Conservative (5-7) 6% (45) 12% (86) 11% (77) 64% (469) 7% (55) 730Educ: < College 16% (199) 24% (288) 10% (121) 35% (422) 15% (176) 1206Educ: Bachelors degree 17% (86) 29% (144) 12% (60) 30% (151) 12% (59) 501Educ: Post-grad 25% (73) 34% (99) 13% (39) 19% (56) 8% (23) 290Income: Under 50k 16% (144) 28% (241) 10% (88) 31% (271) 15% (129) 873Income: 50k-100k 18% (133) 24% (176) 11% (80) 34% (247) 13% (91) 728Income: 100k+ 20% (81) 29% (114) 13% (53) 28% (111) 10% (39) 398Ethnicity: White 17% (262) 25% (382) 11% (174) 35% (537) 12% (188) 1544Ethnicity: Hispanic 19% (43) 35% (78) 6% (14) 26% (58) 13% (29) 222
Continued on next page
Page 59
National Tracking Poll #2110084, October, 2021
59
Table POL3_8
Table POL3_8: Do you approve or disapprove of how President Biden is handling each of the following?Education
DemographicStronglyapprove
Somewhatapprove
Somewhatdisapprove
Stronglydisapprove
Don’t Know /No Opinion Total N
Registered Voters 18% (358) 27% (531) 11% (221) 31% (629) 13% (259) 1998Ethnicity: Black 24% (60) 40% (102) 10% (25) 13% (32) 14% (35) 253Ethnicity: Other 18% (36) 24% (48) 10% (21) 30% (60) 18% (36) 201All Christian 17% (179) 26% (271) 9% (96) 37% (386) 10% (109) 1041All Non-Christian 27% (28) 31% (33) 16% (17) 17% (18) 10% (11) 107Atheist 20% (15) 29% (23) 10% (7) 18% (14) 24% (18) 78Agnostic/Nothing in particular 18% (88) 24% (117) 12% (58) 27% (128) 19% (89) 480Something Else 16% (46) 30% (89) 14% (42) 29% (84) 11% (32) 293Religious Non-Protestant/Catholic 24% (31) 27% (35) 14% (19) 23% (30) 11% (15) 129Evangelical 14% (72) 25% (123) 11% (55) 39% (195) 11% (53) 499Non-Evangelical 18% (142) 29% (227) 10% (79) 33% (259) 10% (83) 790Community: Urban 27% (131) 34% (163) 10% (48) 16% (79) 14% (66) 487Community: Suburban 16% (165) 27% (286) 12% (121) 33% (342) 12% (127) 1041Community: Rural 13% (62) 17% (82) 11% (52) 44% (209) 14% (65) 469Employ: Private Sector 18% (122) 29% (197) 11% (77) 30% (203) 12% (84) 684Employ: Government 18% (20) 36% (40) 11% (12) 24% (27) 13% (14) 112Employ: Self-Employed 16% (29) 30% (54) 8% (15) 29% (54) 17% (31) 183Employ: Homemaker 17% (18) 15% (16) 22% (23) 32% (33) 14% (14) 104Employ: Student 18% (12) 32% (22) 18% (12) 14% (9) 18% (12) 67Employ: Retired 20% (107) 21% (110) 10% (51) 42% (224) 8% (41) 534Employ: Unemployed 19% (36) 31% (59) 8% (14) 23% (44) 20% (37) 191Employ: Other 12% (14) 27% (34) 13% (16) 28% (35) 20% (25) 124Military HH: Yes 18% (58) 20% (64) 13% (39) 37% (118) 11% (36) 315Military HH: No 18% (300) 28% (467) 11% (181) 30% (511) 13% (223) 1683RD/WT: Right Direction 39% (298) 42% (316) 6% (45) 2% (15) 11% (83) 757RD/WT: Wrong Track 5% (60) 17% (215) 14% (175) 50% (614) 14% (176) 1241Biden Job Approve 36% (323) 45% (407) 6% (56) 2% (14) 11% (99) 899Biden Job Disapprove 3% (34) 11% (118) 15% (159) 58% (606) 12% (122) 1039
Continued on next page
Page 60
60
Morning ConsultTable POL3_8
Table POL3_8: Do you approve or disapprove of how President Biden is handling each of the following?Education
DemographicStronglyapprove
Somewhatapprove
Somewhatdisapprove
Stronglydisapprove
Don’t Know /No Opinion Total N
Registered Voters 18% (358) 27% (531) 11% (221) 31% (629) 13% (259) 1998Biden Job Strongly Approve 57% (240) 33% (139) 3% (12) 1% (2) 6% (25) 418Biden Job Somewhat Approve 17% (84) 56% (267) 9% (45) 2% (12) 15% (73) 481Biden Job Somewhat Disapprove 5% (12) 28% (69) 32% (81) 15% (36) 21% (52) 250Biden Job Strongly Disapprove 3% (22) 6% (49) 10% (77) 72% (570) 9% (70) 788Favorable of Biden 35% (326) 45% (414) 6% (60) 2% (15) 12% (112) 927Unfavorable of Biden 3% (30) 11% (108) 15% (154) 59% (606) 12% (122) 1019Very Favorable of Biden 57% (273) 33% (156) 3% (15) 1% (5) 6% (27) 476Somewhat Favorable of Biden 12% (52) 57% (258) 10% (45) 2% (11) 19% (85) 451Somewhat Unfavorable of Biden 4% (9) 25% (53) 36% (75) 11% (24) 23% (47) 207Very Unfavorable of Biden 3% (21) 7% (55) 10% (79) 72% (582) 9% (75) 812#1 Issue: Economy 12% (94) 28% (212) 13% (99) 35% (271) 12% (92) 768#1 Issue: Security 9% (32) 15% (52) 9% (33) 56% (203) 11% (40) 360#1 Issue: Health Care 25% (58) 35% (81) 13% (30) 11% (26) 16% (37) 231#1 Issue: Medicare / Social Security 24% (54) 30% (68) 7% (17) 28% (63) 11% (25) 227#1 Issue: Women’s Issues 29% (36) 33% (42) 10% (12) 12% (15) 16% (20) 125#1 Issue: Education 33% (19) 29% (17) 16% (9) 9% (6) 13% (8) 59#1 Issue: Energy 31% (34) 32% (34) 11% (12) 11% (12) 14% (15) 107#1 Issue: Other 25% (31) 21% (25) 7% (9) 28% (35) 18% (22) 1222020 Vote: Joe Biden 32% (302) 42% (397) 8% (75) 4% (41) 14% (130) 9462020 Vote: Donald Trump 4% (34) 12% (104) 13% (108) 62% (537) 9% (80) 8642020 Vote: Didn’t Vote 11% (17) 18% (27) 17% (27) 27% (42) 27% (41) 1532018 House Vote: Democrat 33% (251) 41% (315) 9% (68) 6% (47) 11% (88) 7692018 House Vote: Republican 5% (32) 13% (89) 13% (90) 61% (430) 9% (61) 7022016 Vote: Hillary Clinton 35% (241) 43% (292) 7% (51) 4% (30) 10% (71) 6852016 Vote: Donald Trump 6% (47) 12% (99) 13% (106) 58% (469) 10% (81) 8022016 Vote: Other 8% (7) 29% (24) 17% (14) 28% (23) 18% (15) 842016 Vote: Didn’t Vote 14% (61) 27% (114) 12% (49) 25% (107) 22% (92) 423Voted in 2014: Yes 19% (251) 27% (360) 11% (144) 34% (457) 9% (124) 1335Voted in 2014: No 16% (107) 26% (172) 12% (77) 26% (173) 20% (135) 663
Continued on next page
Page 61
National Tracking Poll #2110084, October, 2021
61
Table POL3_8
Table POL3_8: Do you approve or disapprove of how President Biden is handling each of the following?Education
DemographicStronglyapprove
Somewhatapprove
Somewhatdisapprove
Stronglydisapprove
Don’t Know /No Opinion Total N
Registered Voters 18% (358) 27% (531) 11% (221) 31% (629) 13% (259) 19984-Region: Northeast 20% (69) 34% (121) 10% (35) 24% (84) 12% (44) 3534-Region: Midwest 16% (73) 24% (106) 13% (56) 34% (150) 14% (60) 4444-Region: South 16% (123) 23% (169) 12% (90) 38% (281) 11% (83) 7464-Region: West 20% (93) 30% (135) 9% (40) 25% (115) 16% (72) 455Party: Democrat/Leans Democrat 34% (306) 41% (374) 8% (69) 5% (42) 14% (123) 914Party: Republican/Leans Republican 4% (34) 12% (94) 13% (109) 62% (498) 9% (74) 808Note: Row proportions may total to larger than one-hundred percent due to rounding. For more information visit MorningConsultIntelligence.com.
Page 62
62
Morning ConsultTable POL3_9
Table POL3_9: Do you approve or disapprove of how President Biden is handling each of the following?National security
DemographicStronglyapprove
Somewhatapprove
Somewhatdisapprove
Stronglydisapprove
Don’t Know /No Opinion Total N
Registered Voters 17% (342) 24% (483) 12% (236) 38% (760) 9% (178) 1998Gender: Male 19% (183) 26% (244) 11% (107) 38% (355) 6% (53) 942Gender: Female 15% (159) 23% (239) 12% (128) 38% (405) 12% (125) 1056Age: 18-34 19% (95) 23% (117) 13% (68) 28% (143) 18% (91) 514Age: 35-44 19% (59) 32% (99) 10% (32) 28% (85) 10% (32) 307Age: 45-64 13% (88) 24% (166) 13% (91) 44% (296) 6% (38) 679Age: 65+ 20% (99) 20% (101) 9% (44) 47% (236) 3% (16) 497GenZers: 1997-2012 13% (23) 19% (31) 14% (24) 25% (43) 29% (49) 170Millennials: 1981-1996 21% (118) 28% (155) 11% (61) 28% (153) 12% (64) 551GenXers: 1965-1980 13% (61) 26% (121) 13% (61) 40% (187) 8% (38) 469Baby Boomers: 1946-1964 17% (124) 22% (162) 11% (82) 46% (339) 3% (25) 732PID: Dem (no lean) 35% (269) 40% (309) 9% (72) 7% (54) 9% (74) 777PID: Ind (no lean) 7% (36) 24% (126) 16% (85) 37% (196) 16% (85) 528PID: Rep (no lean) 5% (37) 7% (49) 11% (78) 73% (510) 3% (19) 693PID/Gender: DemMen 38% (135) 42% (147) 6% (23) 9% (32) 5% (16) 352PID/Gender: DemWomen 32% (134) 38% (162) 12% (49) 5% (22) 14% (58) 425PID/Gender: Ind Men 8% (24) 24% (66) 15% (41) 41% (116) 12% (33) 280PID/Gender: Ind Women 5% (12) 24% (60) 18% (45) 32% (80) 21% (51) 248PID/Gender: Rep Men 8% (25) 10% (31) 14% (44) 67% (207) 1% (3) 310PID/Gender: Rep Women 3% (13) 5% (17) 9% (35) 79% (303) 4% (16) 384Ideo: Liberal (1-3) 34% (193) 37% (212) 12% (69) 8% (44) 9% (49) 566Ideo: Moderate (4) 17% (97) 33% (185) 15% (85) 24% (137) 10% (55) 560Ideo: Conservative (5-7) 6% (43) 8% (61) 9% (67) 74% (539) 3% (19) 730Educ: < College 15% (181) 22% (265) 11% (129) 41% (499) 11% (132) 1206Educ: Bachelors degree 18% (89) 26% (132) 13% (66) 37% (186) 6% (28) 501Educ: Post-grad 25% (72) 30% (86) 14% (41) 26% (75) 6% (17) 290Income: Under 50k 15% (133) 24% (214) 11% (95) 37% (319) 13% (112) 873Income: 50k-100k 17% (125) 23% (165) 12% (87) 42% (303) 7% (48) 728Income: 100k+ 21% (84) 26% (104) 13% (53) 35% (138) 4% (17) 398Ethnicity: White 16% (250) 22% (332) 11% (177) 43% (664) 8% (120) 1544Ethnicity: Hispanic 14% (31) 31% (68) 12% (26) 29% (63) 15% (33) 222
Continued on next page
Page 63
National Tracking Poll #2110084, October, 2021
63
Table POL3_9
Table POL3_9: Do you approve or disapprove of how President Biden is handling each of the following?National security
DemographicStronglyapprove
Somewhatapprove
Somewhatdisapprove
Stronglydisapprove
Don’t Know /No Opinion Total N
Registered Voters 17% (342) 24% (483) 12% (236) 38% (760) 9% (178) 1998Ethnicity: Black 20% (50) 44% (112) 13% (32) 11% (27) 13% (33) 253Ethnicity: Other 21% (42) 19% (39) 13% (26) 34% (69) 12% (25) 201All Christian 18% (182) 22% (224) 11% (110) 45% (468) 5% (57) 1041All Non-Christian 27% (29) 30% (32) 16% (17) 23% (25) 4% (4) 107Atheist 15% (11) 34% (26) 19% (15) 19% (15) 13% (10) 78Agnostic/Nothing in particular 14% (67) 28% (135) 11% (55) 30% (146) 16% (77) 480Something Else 18% (53) 22% (66) 13% (38) 36% (106) 10% (30) 293Religious Non-Protestant/Catholic 24% (31) 27% (34) 16% (20) 30% (39) 4% (5) 129Evangelical 16% (79) 20% (100) 11% (55) 45% (226) 8% (37) 499Non-Evangelical 19% (147) 23% (181) 11% (84) 42% (330) 6% (48) 790Community: Urban 26% (127) 32% (156) 11% (56) 21% (104) 9% (45) 487Community: Suburban 15% (158) 25% (259) 13% (132) 39% (401) 9% (91) 1041Community: Rural 12% (57) 15% (69) 10% (47) 54% (255) 9% (41) 469Employ: Private Sector 17% (119) 25% (173) 16% (109) 34% (234) 7% (50) 684Employ: Government 16% (18) 35% (40) 6% (6) 34% (38) 9% (10) 112Employ: Self-Employed 22% (40) 20% (37) 13% (23) 36% (65) 10% (18) 183Employ: Homemaker 17% (18) 17% (18) 14% (14) 39% (40) 13% (13) 104Employ: Student 12% (8) 20% (14) 19% (13) 25% (17) 23% (16) 67Employ: Retired 18% (97) 21% (114) 8% (42) 49% (263) 3% (18) 534Employ: Unemployed 14% (26) 31% (60) 9% (17) 29% (55) 17% (33) 191Employ: Other 14% (17) 23% (29) 8% (10) 38% (47) 16% (20) 124Military HH: Yes 17% (55) 23% (71) 6% (20) 50% (159) 3% (11) 315Military HH: No 17% (287) 24% (412) 13% (216) 36% (601) 10% (167) 1683RD/WT: Right Direction 38% (285) 42% (317) 8% (61) 3% (26) 9% (69) 757RD/WT: Wrong Track 5% (57) 13% (166) 14% (175) 59% (734) 9% (109) 1241Biden Job Approve 35% (310) 46% (414) 9% (79) 2% (22) 8% (74) 899Biden Job Disapprove 3% (31) 6% (66) 15% (154) 70% (724) 6% (64) 1039
Continued on next page
Page 64
64
Morning ConsultTable POL3_9
Table POL3_9: Do you approve or disapprove of how President Biden is handling each of the following?National security
DemographicStronglyapprove
Somewhatapprove
Somewhatdisapprove
Stronglydisapprove
Don’t Know /No Opinion Total N
Registered Voters 17% (342) 24% (483) 12% (236) 38% (760) 9% (178) 1998Biden Job Strongly Approve 57% (238) 35% (148) 3% (11) 2% (7) 3% (14) 418Biden Job Somewhat Approve 15% (72) 55% (266) 14% (68) 3% (15) 12% (60) 481Biden Job Somewhat Disapprove 2% (4) 20% (51) 37% (92) 26% (65) 15% (38) 250Biden Job Strongly Disapprove 3% (27) 2% (15) 8% (62) 84% (658) 3% (26) 788Favorable of Biden 34% (315) 44% (409) 10% (89) 2% (21) 10% (93) 927Unfavorable of Biden 3% (26) 6% (62) 14% (144) 71% (724) 6% (62) 1019Very Favorable of Biden 55% (262) 35% (168) 3% (16) 2% (7) 5% (22) 476Somewhat Favorable of Biden 12% (53) 53% (241) 16% (72) 3% (13) 16% (71) 451Somewhat Unfavorable of Biden 1% (3) 18% (36) 38% (79) 29% (60) 14% (29) 207Very Unfavorable of Biden 3% (23) 3% (26) 8% (65) 82% (664) 4% (33) 812#1 Issue: Economy 11% (86) 24% (184) 15% (119) 42% (325) 7% (54) 768#1 Issue: Security 7% (24) 12% (43) 6% (22) 71% (254) 5% (17) 360#1 Issue: Health Care 25% (59) 36% (84) 13% (30) 12% (27) 13% (31) 231#1 Issue: Medicare / Social Security 29% (65) 22% (50) 11% (25) 30% (68) 8% (18) 227#1 Issue: Women’s Issues 23% (29) 29% (36) 13% (17) 14% (17) 21% (26) 125#1 Issue: Education 27% (16) 32% (19) 9% (5) 12% (7) 21% (12) 59#1 Issue: Energy 35% (38) 33% (35) 5% (6) 18% (19) 8% (9) 107#1 Issue: Other 21% (26) 26% (32) 10% (12) 35% (42) 8% (10) 1222020 Vote: Joe Biden 31% (292) 42% (394) 12% (111) 6% (54) 10% (94) 9462020 Vote: Donald Trump 4% (37) 7% (57) 11% (95) 74% (637) 4% (38) 8642020 Vote: Didn’t Vote 8% (12) 17% (26) 17% (26) 33% (50) 25% (38) 1532018 House Vote: Democrat 33% (256) 40% (309) 11% (87) 8% (61) 7% (55) 7692018 House Vote: Republican 5% (33) 8% (57) 10% (74) 74% (517) 3% (21) 7022016 Vote: Hillary Clinton 35% (242) 44% (302) 8% (57) 5% (36) 7% (48) 6852016 Vote: Donald Trump 5% (43) 8% (68) 12% (99) 70% (564) 3% (28) 8022016 Vote: Other 8% (7) 22% (18) 19% (16) 37% (31) 14% (12) 842016 Vote: Didn’t Vote 12% (49) 23% (95) 14% (61) 30% (129) 21% (89) 423Voted in 2014: Yes 20% (261) 25% (331) 11% (141) 41% (545) 4% (56) 1335Voted in 2014: No 12% (81) 23% (152) 14% (94) 32% (214) 18% (121) 663
Continued on next page
Page 65
National Tracking Poll #2110084, October, 2021
65
Table POL3_9
Table POL3_9: Do you approve or disapprove of how President Biden is handling each of the following?National security
DemographicStronglyapprove
Somewhatapprove
Somewhatdisapprove
Stronglydisapprove
Don’t Know /No Opinion Total N
Registered Voters 17% (342) 24% (483) 12% (236) 38% (760) 9% (178) 19984-Region: Northeast 17% (58) 33% (118) 12% (44) 30% (105) 8% (28) 3534-Region: Midwest 15% (67) 21% (95) 12% (54) 42% (185) 10% (43) 4444-Region: South 16% (117) 20% (146) 12% (92) 44% (327) 9% (63) 7464-Region: West 22% (100) 27% (123) 10% (45) 31% (143) 10% (44) 455Party: Democrat/Leans Democrat 32% (289) 41% (372) 10% (95) 7% (62) 11% (96) 914Party: Republican/Leans Republican 5% (39) 7% (57) 11% (93) 73% (587) 4% (32) 808Note: Row proportions may total to larger than one-hundred percent due to rounding. For more information visit MorningConsultIntelligence.com.
Page 66
66
Morning ConsultTable POL3_10
Table POL3_10: Do you approve or disapprove of how President Biden is handling each of the following?Gun policy
DemographicStronglyapprove
Somewhatapprove
Somewhatdisapprove
Stronglydisapprove
Don’t Know /No Opinion Total N
Registered Voters 13% (257) 21% (424) 15% (305) 38% (760) 13% (252) 1998Gender: Male 14% (136) 23% (215) 16% (150) 38% (358) 9% (83) 942Gender: Female 11% (121) 20% (209) 15% (155) 38% (402) 16% (169) 1056Age: 18-34 13% (68) 24% (121) 16% (83) 31% (162) 16% (81) 514Age: 35-44 15% (47) 26% (78) 16% (49) 29% (88) 15% (45) 307Age: 45-64 10% (69) 18% (126) 17% (115) 42% (288) 12% (81) 679Age: 65+ 15% (74) 20% (99) 12% (57) 45% (222) 9% (45) 497GenZers: 1997-2012 8% (13) 22% (37) 21% (35) 29% (49) 21% (36) 170Millennials: 1981-1996 17% (94) 25% (139) 14% (79) 30% (163) 14% (77) 551GenXers: 1965-1980 8% (38) 19% (91) 18% (85) 41% (192) 14% (63) 469Baby Boomers: 1946-1964 13% (95) 21% (150) 13% (95) 44% (324) 9% (68) 732PID: Dem (no lean) 26% (201) 36% (279) 15% (115) 9% (68) 15% (115) 777PID: Ind (no lean) 5% (26) 21% (109) 17% (92) 40% (210) 17% (91) 528PID: Rep (no lean) 4% (31) 5% (36) 14% (98) 70% (482) 7% (46) 693PID/Gender: DemMen 29% (101) 36% (127) 15% (54) 8% (28) 12% (41) 352PID/Gender: DemWomen 24% (100) 36% (151) 14% (60) 9% (39) 17% (73) 425PID/Gender: Ind Men 6% (16) 23% (64) 17% (47) 43% (121) 11% (31) 280PID/Gender: Ind Women 4% (9) 18% (45) 18% (45) 36% (88) 24% (60) 248PID/Gender: Rep Men 6% (19) 8% (24) 16% (49) 67% (208) 3% (10) 310PID/Gender: Rep Women 3% (11) 3% (13) 13% (50) 72% (274) 9% (36) 384Ideo: Liberal (1-3) 23% (130) 33% (188) 18% (105) 10% (58) 15% (86) 566Ideo: Moderate (4) 14% (78) 31% (175) 19% (105) 23% (130) 13% (72) 560Ideo: Conservative (5-7) 5% (38) 6% (43) 11% (80) 72% (523) 6% (46) 730Educ: < College 12% (140) 19% (226) 14% (168) 43% (519) 13% (153) 1206Educ: Bachelors degree 13% (66) 23% (117) 16% (82) 35% (174) 12% (62) 501Educ: Post-grad 18% (51) 28% (81) 19% (55) 23% (67) 13% (37) 290Income: Under 50k 11% (95) 24% (210) 13% (111) 39% (337) 14% (120) 873Income: 50k-100k 14% (99) 17% (123) 17% (126) 40% (291) 12% (89) 728Income: 100k+ 16% (64) 23% (91) 17% (68) 33% (132) 11% (43) 398Ethnicity: White 12% (192) 19% (291) 15% (231) 42% (647) 12% (183) 1544Ethnicity: Hispanic 17% (37) 22% (48) 19% (43) 31% (70) 11% (25) 222
Continued on next page
Page 67
National Tracking Poll #2110084, October, 2021
67
Table POL3_10
Table POL3_10: Do you approve or disapprove of how President Biden is handling each of the following?Gun policy
DemographicStronglyapprove
Somewhatapprove
Somewhatdisapprove
Stronglydisapprove
Don’t Know /No Opinion Total N
Registered Voters 13% (257) 21% (424) 15% (305) 38% (760) 13% (252) 1998Ethnicity: Black 14% (35) 36% (91) 18% (46) 18% (46) 14% (36) 253Ethnicity: Other 15% (30) 21% (43) 14% (29) 33% (67) 16% (33) 201All Christian 14% (142) 19% (201) 15% (156) 43% (445) 9% (98) 1041All Non-Christian 22% (23) 30% (32) 20% (21) 17% (18) 11% (12) 107Atheist 15% (12) 23% (18) 19% (15) 21% (17) 21% (16) 78Agnostic/Nothing in particular 10% (46) 23% (112) 16% (75) 34% (162) 17% (84) 480Something Else 12% (35) 20% (60) 13% (38) 40% (118) 14% (42) 293Religious Non-Protestant/Catholic 19% (24) 27% (34) 18% (24) 26% (33) 10% (13) 129Evangelical 13% (65) 16% (82) 13% (65) 47% (234) 11% (53) 499Non-Evangelical 13% (103) 22% (172) 16% (123) 39% (309) 10% (83) 790Community: Urban 20% (98) 27% (131) 16% (80) 24% (118) 12% (60) 487Community: Suburban 12% (126) 21% (217) 16% (162) 38% (397) 13% (140) 1041Community: Rural 7% (33) 16% (77) 13% (63) 52% (245) 11% (52) 469Employ: Private Sector 13% (90) 21% (147) 18% (125) 36% (249) 11% (74) 684Employ: Government 16% (18) 23% (26) 21% (24) 23% (26) 17% (19) 112Employ: Self-Employed 13% (24) 26% (48) 16% (28) 35% (64) 10% (18) 183Employ: Homemaker 13% (14) 16% (16) 15% (15) 34% (35) 22% (23) 104Employ: Student 8% (5) 21% (14) 19% (13) 27% (18) 25% (17) 67Employ: Retired 14% (75) 20% (106) 11% (58) 47% (252) 8% (43) 534Employ: Unemployed 12% (23) 23% (44) 16% (31) 33% (62) 16% (31) 191Employ: Other 7% (8) 19% (24) 10% (12) 42% (53) 22% (27) 124Military HH: Yes 12% (37) 15% (48) 14% (43) 48% (151) 11% (36) 315Military HH: No 13% (220) 22% (376) 16% (262) 36% (609) 13% (216) 1683RD/WT: Right Direction 28% (212) 40% (306) 13% (97) 6% (45) 13% (97) 757RD/WT: Wrong Track 4% (45) 10% (119) 17% (208) 58% (714) 12% (154) 1241Biden Job Approve 26% (230) 41% (372) 15% (137) 5% (43) 13% (118) 899Biden Job Disapprove 3% (27) 4% (44) 16% (164) 67% (700) 10% (103) 1039
Continued on next page
Page 68
68
Morning ConsultTable POL3_10
Table POL3_10: Do you approve or disapprove of how President Biden is handling each of the following?Gun policy
DemographicStronglyapprove
Somewhatapprove
Somewhatdisapprove
Stronglydisapprove
Don’t Know /No Opinion Total N
Registered Voters 13% (257) 21% (424) 15% (305) 38% (760) 13% (252) 1998Biden Job Strongly Approve 43% (182) 38% (159) 8% (35) 3% (12) 7% (30) 418Biden Job Somewhat Approve 10% (48) 44% (212) 21% (102) 6% (31) 18% (88) 481Biden Job Somewhat Disapprove 3% (8) 12% (31) 38% (94) 25% (63) 21% (54) 250Biden Job Strongly Disapprove 2% (19) 2% (13) 9% (70) 81% (636) 6% (50) 788Favorable of Biden 25% (235) 41% (376) 15% (141) 5% (48) 14% (127) 927Unfavorable of Biden 2% (22) 4% (39) 15% (157) 69% (701) 10% (100) 1019Very Favorable of Biden 43% (204) 36% (172) 9% (44) 5% (22) 7% (34) 476Somewhat Favorable of Biden 7% (30) 45% (204) 21% (97) 6% (26) 21% (93) 451Somewhat Unfavorable of Biden 3% (6) 11% (23) 37% (76) 27% (57) 22% (46) 207Very Unfavorable of Biden 2% (16) 2% (15) 10% (81) 79% (644) 7% (55) 812#1 Issue: Economy 9% (71) 18% (138) 19% (144) 42% (320) 12% (95) 768#1 Issue: Security 5% (18) 10% (36) 12% (44) 64% (230) 8% (31) 360#1 Issue: Health Care 19% (44) 33% (77) 14% (33) 16% (38) 17% (39) 231#1 Issue: Medicare / Social Security 23% (52) 23% (52) 9% (21) 34% (77) 11% (25) 227#1 Issue: Women’s Issues 16% (20) 22% (27) 25% (31) 20% (25) 17% (22) 125#1 Issue: Education 8% (4) 46% (27) 14% (8) 11% (7) 21% (13) 59#1 Issue: Energy 27% (29) 31% (33) 11% (12) 21% (23) 10% (11) 107#1 Issue: Other 14% (18) 28% (34) 9% (12) 34% (41) 15% (18) 1222020 Vote: Joe Biden 24% (224) 36% (341) 17% (159) 8% (79) 15% (141) 9462020 Vote: Donald Trump 3% (22) 7% (58) 13% (111) 70% (608) 7% (65) 8642020 Vote: Didn’t Vote 6% (9) 14% (21) 18% (28) 39% (60) 23% (35) 1532018 House Vote: Democrat 24% (181) 37% (283) 17% (130) 9% (72) 13% (102) 7692018 House Vote: Republican 4% (26) 7% (48) 14% (97) 69% (484) 6% (45) 7022016 Vote: Hillary Clinton 26% (177) 39% (264) 15% (101) 7% (48) 14% (94) 6852016 Vote: Donald Trump 5% (37) 6% (52) 15% (117) 67% (540) 7% (56) 8022016 Vote: Other 5% (4) 24% (20) 23% (19) 30% (25) 18% (15) 842016 Vote: Didn’t Vote 9% (39) 20% (86) 15% (65) 35% (146) 20% (86) 423Voted in 2014: Yes 15% (199) 22% (289) 15% (200) 39% (521) 9% (126) 1335Voted in 2014: No 9% (58) 20% (136) 16% (105) 36% (238) 19% (126) 663
Continued on next page
Page 69
National Tracking Poll #2110084, October, 2021
69
Table POL3_10
Table POL3_10: Do you approve or disapprove of how President Biden is handling each of the following?Gun policy
DemographicStronglyapprove
Somewhatapprove
Somewhatdisapprove
Stronglydisapprove
Don’t Know /No Opinion Total N
Registered Voters 13% (257) 21% (424) 15% (305) 38% (760) 13% (252) 19984-Region: Northeast 17% (58) 24% (84) 17% (61) 28% (98) 14% (51) 3534-Region: Midwest 10% (45) 20% (89) 15% (66) 42% (187) 13% (58) 4444-Region: South 12% (90) 17% (129) 14% (103) 45% (333) 12% (90) 7464-Region: West 14% (64) 27% (122) 16% (75) 31% (141) 12% (53) 455Party: Democrat/Leans Democrat 24% (216) 36% (329) 17% (153) 9% (81) 15% (135) 914Party: Republican/Leans Republican 4% (33) 5% (42) 13% (108) 70% (562) 8% (63) 808Note: Row proportions may total to larger than one-hundred percent due to rounding. For more information visit MorningConsultIntelligence.com.
Page 70
70
Morning ConsultTable POL3_11
Table POL3_11: Do you approve or disapprove of how President Biden is handling each of the following?Protecting Medicare and Social Security
DemographicStronglyapprove
Somewhatapprove
Somewhatdisapprove
Stronglydisapprove
Don’t Know /No Opinion Total N
Registered Voters 18% (368) 25% (496) 13% (263) 31% (624) 12% (247) 1998Gender: Male 20% (193) 26% (246) 14% (131) 29% (275) 10% (97) 942Gender: Female 17% (175) 24% (250) 13% (132) 33% (349) 14% (150) 1056Age: 18-34 20% (104) 27% (141) 12% (61) 24% (124) 17% (86) 514Age: 35-44 18% (56) 29% (88) 15% (46) 23% (72) 15% (45) 307Age: 45-64 16% (107) 24% (162) 15% (100) 34% (234) 11% (76) 679Age: 65+ 20% (101) 21% (105) 11% (56) 39% (195) 8% (40) 497GenZers: 1997-2012 15% (25) 29% (49) 14% (25) 20% (34) 22% (37) 170Millennials: 1981-1996 21% (118) 29% (157) 12% (64) 25% (135) 14% (77) 551GenXers: 1965-1980 14% (64) 24% (112) 17% (78) 31% (146) 15% (69) 469Baby Boomers: 1946-1964 20% (143) 22% (164) 12% (88) 38% (281) 8% (55) 732PID: Dem (no lean) 36% (278) 38% (293) 9% (71) 6% (49) 11% (86) 777PID: Ind (no lean) 10% (50) 23% (123) 17% (92) 30% (157) 20% (105) 528PID: Rep (no lean) 6% (40) 12% (80) 14% (100) 60% (418) 8% (56) 693PID/Gender: DemMen 39% (137) 37% (132) 10% (34) 6% (21) 8% (29) 352PID/Gender: DemWomen 33% (140) 38% (161) 9% (38) 7% (28) 13% (57) 425PID/Gender: Ind Men 10% (28) 23% (65) 17% (47) 33% (91) 17% (49) 280PID/Gender: Ind Women 9% (22) 24% (58) 18% (45) 26% (66) 23% (57) 248PID/Gender: Rep Men 9% (27) 16% (50) 16% (50) 53% (163) 6% (19) 310PID/Gender: Rep Women 3% (12) 8% (30) 13% (50) 67% (255) 10% (37) 384Ideo: Liberal (1-3) 32% (183) 39% (221) 10% (58) 7% (40) 11% (65) 566Ideo: Moderate (4) 21% (117) 32% (181) 17% (96) 16% (89) 14% (76) 560Ideo: Conservative (5-7) 8% (56) 11% (79) 12% (90) 62% (451) 8% (55) 730Educ: < College 17% (209) 21% (254) 13% (159) 36% (431) 13% (154) 1206Educ: Bachelors degree 16% (80) 31% (155) 12% (61) 28% (140) 13% (65) 501Educ: Post-grad 27% (79) 30% (87) 15% (43) 19% (54) 10% (28) 290Income: Under 50k 19% (167) 22% (192) 13% (109) 33% (291) 13% (114) 873Income: 50k-100k 16% (118) 25% (180) 15% (108) 32% (232) 12% (90) 728Income: 100k+ 21% (82) 31% (125) 12% (46) 25% (101) 11% (43) 398Ethnicity: White 17% (260) 24% (372) 13% (199) 35% (533) 12% (179) 1544Ethnicity: Hispanic 18% (40) 31% (70) 12% (26) 24% (54) 14% (32) 222
Continued on next page
Page 71
National Tracking Poll #2110084, October, 2021
71
Table POL3_11
Table POL3_11: Do you approve or disapprove of how President Biden is handling each of the following?Protecting Medicare and Social Security
DemographicStronglyapprove
Somewhatapprove
Somewhatdisapprove
Stronglydisapprove
Don’t Know /No Opinion Total N
Registered Voters 18% (368) 25% (496) 13% (263) 31% (624) 12% (247) 1998Ethnicity: Black 27% (68) 31% (78) 12% (30) 15% (38) 16% (39) 253Ethnicity: Other 20% (39) 23% (46) 17% (35) 26% (53) 14% (28) 201All Christian 18% (183) 24% (246) 12% (126) 36% (374) 11% (112) 1041All Non-Christian 25% (27) 37% (39) 12% (13) 12% (13) 13% (14) 107Atheist 14% (11) 40% (31) 10% (8) 17% (13) 18% (14) 78Agnostic/Nothing in particular 18% (88) 24% (117) 15% (74) 27% (130) 15% (71) 480Something Else 20% (59) 21% (63) 14% (42) 32% (94) 12% (35) 293Religious Non-Protestant/Catholic 22% (28) 32% (42) 12% (15) 20% (26) 14% (19) 129Evangelical 17% (84) 20% (99) 14% (67) 39% (193) 11% (56) 499Non-Evangelical 19% (148) 26% (204) 12% (95) 33% (260) 11% (84) 790Community: Urban 27% (130) 31% (150) 12% (59) 19% (94) 11% (54) 487Community: Suburban 17% (174) 27% (279) 13% (131) 31% (321) 13% (136) 1041Community: Rural 13% (63) 14% (67) 16% (73) 45% (210) 12% (56) 469Employ: Private Sector 19% (127) 26% (177) 14% (99) 29% (199) 12% (81) 684Employ: Government 19% (21) 30% (34) 11% (13) 24% (27) 16% (18) 112Employ: Self-Employed 19% (35) 24% (43) 18% (33) 32% (58) 7% (13) 183Employ: Homemaker 17% (17) 15% (16) 13% (14) 33% (35) 22% (22) 104Employ: Student 11% (8) 45% (30) 9% (6) 14% (9) 21% (14) 67Employ: Retired 19% (103) 22% (119) 11% (57) 41% (216) 7% (39) 534Employ: Unemployed 19% (35) 28% (53) 11% (22) 24% (45) 19% (36) 191Employ: Other 17% (21) 19% (24) 17% (21) 28% (34) 19% (23) 124Military HH: Yes 17% (52) 23% (73) 13% (42) 37% (117) 10% (31) 315Military HH: No 19% (316) 25% (423) 13% (221) 30% (508) 13% (215) 1683RD/WT: Right Direction 37% (283) 42% (319) 7% (55) 4% (28) 10% (72) 757RD/WT: Wrong Track 7% (85) 14% (177) 17% (209) 48% (596) 14% (174) 1241Biden Job Approve 35% (317) 44% (397) 8% (69) 3% (25) 10% (92) 899Biden Job Disapprove 5% (48) 9% (96) 18% (190) 56% (585) 12% (120) 1039
Continued on next page
Page 72
72
Morning ConsultTable POL3_11
Table POL3_11: Do you approve or disapprove of how President Biden is handling each of the following?Protecting Medicare and Social Security
DemographicStronglyapprove
Somewhatapprove
Somewhatdisapprove
Stronglydisapprove
Don’t Know /No Opinion Total N
Registered Voters 18% (368) 25% (496) 13% (263) 31% (624) 12% (247) 1998Biden Job Strongly Approve 53% (222) 38% (157) 3% (14) 1% (5) 5% (20) 418Biden Job Somewhat Approve 20% (95) 50% (239) 11% (54) 4% (20) 15% (72) 481Biden Job Somewhat Disapprove 5% (13) 22% (54) 37% (93) 17% (43) 19% (47) 250Biden Job Strongly Disapprove 4% (35) 5% (42) 12% (97) 69% (541) 9% (73) 788Favorable of Biden 35% (326) 43% (400) 7% (69) 4% (33) 11% (99) 927Unfavorable of Biden 4% (41) 9% (90) 19% (191) 57% (580) 11% (117) 1019Very Favorable of Biden 54% (256) 37% (176) 3% (15) 2% (8) 4% (20) 476Somewhat Favorable of Biden 15% (69) 50% (224) 12% (55) 6% (25) 17% (78) 451Somewhat Unfavorable of Biden 3% (7) 20% (42) 44% (91) 13% (28) 19% (40) 207Very Unfavorable of Biden 4% (34) 6% (48) 12% (99) 68% (552) 10% (77) 812#1 Issue: Economy 12% (96) 24% (182) 17% (134) 33% (257) 13% (100) 768#1 Issue: Security 8% (30) 16% (56) 11% (41) 55% (198) 10% (35) 360#1 Issue: Health Care 26% (59) 37% (85) 11% (26) 13% (29) 14% (32) 231#1 Issue: Medicare / Social Security 30% (69) 25% (57) 8% (19) 28% (64) 8% (18) 227#1 Issue: Women’s Issues 29% (37) 27% (33) 14% (17) 15% (18) 16% (20) 125#1 Issue: Education 22% (13) 33% (19) 9% (6) 11% (7) 24% (14) 59#1 Issue: Energy 35% (37) 32% (34) 9% (10) 13% (14) 11% (12) 107#1 Issue: Other 22% (27) 25% (30) 10% (12) 31% (38) 12% (15) 1222020 Vote: Joe Biden 31% (298) 40% (383) 10% (95) 6% (54) 12% (117) 9462020 Vote: Donald Trump 5% (47) 10% (85) 15% (132) 60% (515) 10% (85) 8642020 Vote: Didn’t Vote 14% (21) 15% (23) 19% (29) 29% (45) 23% (35) 1532018 House Vote: Democrat 32% (243) 40% (307) 10% (77) 8% (59) 11% (83) 7692018 House Vote: Republican 6% (44) 12% (87) 15% (103) 58% (407) 9% (60) 7022016 Vote: Hillary Clinton 35% (242) 41% (284) 9% (59) 5% (35) 9% (65) 6852016 Vote: Donald Trump 6% (51) 13% (103) 15% (120) 57% (456) 9% (72) 8022016 Vote: Other 9% (8) 22% (19) 20% (17) 27% (23) 21% (18) 842016 Vote: Didn’t Vote 15% (65) 21% (91) 15% (65) 26% (110) 22% (92) 423Voted in 2014: Yes 20% (268) 26% (344) 13% (172) 33% (444) 8% (107) 1335Voted in 2014: No 15% (99) 23% (152) 14% (92) 27% (180) 21% (140) 663
Continued on next page
Page 73
National Tracking Poll #2110084, October, 2021
73
Table POL3_11
Table POL3_11: Do you approve or disapprove of how President Biden is handling each of the following?Protecting Medicare and Social Security
DemographicStronglyapprove
Somewhatapprove
Somewhatdisapprove
Stronglydisapprove
Don’t Know /No Opinion Total N
Registered Voters 18% (368) 25% (496) 13% (263) 31% (624) 12% (247) 19984-Region: Northeast 18% (65) 30% (108) 14% (50) 22% (77) 15% (53) 3534-Region: Midwest 17% (78) 21% (95) 15% (66) 36% (161) 10% (45) 4444-Region: South 17% (130) 21% (157) 12% (86) 37% (276) 13% (96) 7464-Region: West 21% (95) 30% (137) 13% (61) 24% (109) 12% (53) 455Party: Democrat/Leans Democrat 33% (306) 39% (358) 10% (91) 6% (55) 11% (105) 914Party: Republican/Leans Republican 5% (42) 12% (94) 14% (117) 59% (476) 10% (79) 808Note: Row proportions may total to larger than one-hundred percent due to rounding. For more information visit MorningConsultIntelligence.com.
Page 74
74
Morning ConsultTable POL3_12
Table POL3_12: Do you approve or disapprove of how President Biden is handling each of the following?Coronavirus
DemographicStronglyapprove
Somewhatapprove
Somewhatdisapprove
Stronglydisapprove
Don’t Know /No Opinion Total N
Registered Voters 28% (551) 21% (427) 12% (249) 33% (662) 5% (109) 1998Gender: Male 29% (274) 23% (220) 12% (116) 31% (294) 4% (37) 942Gender: Female 26% (277) 20% (207) 13% (132) 35% (368) 7% (72) 1056Age: 18-34 24% (122) 25% (128) 13% (67) 28% (147) 10% (50) 514Age: 35-44 27% (84) 26% (81) 11% (35) 28% (87) 7% (21) 307Age: 45-64 26% (175) 20% (137) 14% (98) 35% (239) 4% (30) 679Age: 65+ 34% (170) 16% (80) 10% (50) 38% (190) 2% (8) 497GenZers: 1997-2012 21% (36) 18% (31) 19% (33) 25% (43) 16% (27) 170Millennials: 1981-1996 26% (144) 28% (155) 9% (50) 30% (163) 7% (39) 551GenXers: 1965-1980 22% (104) 23% (107) 15% (69) 34% (161) 6% (29) 469Baby Boomers: 1946-1964 33% (242) 17% (124) 12% (86) 37% (268) 2% (12) 732PID: Dem (no lean) 52% (402) 30% (230) 8% (63) 6% (49) 4% (33) 777PID: Ind (no lean) 20% (104) 22% (116) 14% (72) 34% (181) 10% (55) 528PID: Rep (no lean) 7% (45) 12% (81) 16% (114) 62% (432) 3% (21) 693PID/Gender: DemMen 53% (185) 31% (110) 8% (29) 5% (18) 3% (10) 352PID/Gender: DemWomen 51% (217) 28% (119) 8% (34) 7% (32) 5% (23) 425PID/Gender: Ind Men 21% (58) 22% (60) 12% (33) 37% (104) 9% (24) 280PID/Gender: Ind Women 18% (46) 22% (56) 15% (38) 31% (77) 13% (31) 248PID/Gender: Rep Men 10% (30) 16% (49) 17% (54) 56% (173) 1% (3) 310PID/Gender: Rep Women 4% (15) 8% (32) 16% (60) 67% (259) 5% (18) 384Ideo: Liberal (1-3) 49% (275) 30% (169) 10% (58) 8% (46) 3% (18) 566Ideo: Moderate (4) 34% (191) 29% (162) 15% (81) 19% (104) 4% (22) 560Ideo: Conservative (5-7) 9% (68) 11% (80) 12% (88) 65% (473) 3% (21) 730Educ: < College 25% (303) 18% (215) 12% (144) 38% (455) 7% (89) 1206Educ: Bachelors degree 27% (136) 27% (135) 15% (74) 28% (142) 3% (14) 501Educ: Post-grad 38% (112) 27% (77) 10% (30) 22% (65) 2% (6) 290Income: Under 50k 26% (229) 20% (172) 12% (107) 34% (296) 8% (68) 873Income: 50k-100k 28% (205) 22% (158) 12% (84) 34% (250) 4% (31) 728Income: 100k+ 29% (117) 24% (97) 14% (57) 29% (116) 3% (10) 398Ethnicity: White 26% (400) 21% (321) 13% (193) 36% (560) 5% (70) 1544Ethnicity: Hispanic 27% (60) 20% (45) 12% (26) 30% (66) 11% (25) 222
Continued on next page
Page 75
National Tracking Poll #2110084, October, 2021
75
Table POL3_12
Table POL3_12: Do you approve or disapprove of how President Biden is handling each of the following?Coronavirus
DemographicStronglyapprove
Somewhatapprove
Somewhatdisapprove
Stronglydisapprove
Don’t Know /No Opinion Total N
Registered Voters 28% (551) 21% (427) 12% (249) 33% (662) 5% (109) 1998Ethnicity: Black 37% (94) 25% (63) 12% (31) 17% (42) 9% (23) 253Ethnicity: Other 28% (57) 21% (43) 12% (24) 30% (60) 8% (16) 201All Christian 27% (285) 21% (215) 12% (124) 37% (382) 3% (35) 1041All Non-Christian 36% (38) 28% (30) 13% (13) 22% (23) 2% (2) 107Atheist 29% (22) 39% (30) 15% (12) 14% (11) 3% (3) 78Agnostic/Nothing in particular 26% (126) 21% (100) 12% (58) 30% (146) 10% (50) 480Something Else 27% (80) 18% (52) 14% (41) 34% (100) 7% (20) 293Religious Non-Protestant/Catholic 33% (42) 25% (33) 14% (18) 24% (31) 4% (5) 129Evangelical 25% (126) 17% (83) 13% (65) 41% (202) 4% (22) 499Non-Evangelical 29% (229) 22% (172) 12% (94) 34% (268) 3% (26) 790Community: Urban 37% (178) 27% (130) 12% (59) 19% (93) 6% (27) 487Community: Suburban 27% (281) 22% (226) 11% (118) 35% (363) 5% (53) 1041Community: Rural 20% (92) 15% (70) 15% (72) 44% (206) 6% (29) 469Employ: Private Sector 26% (180) 24% (162) 14% (98) 31% (210) 5% (34) 684Employ: Government 23% (26) 34% (38) 12% (13) 25% (28) 6% (7) 112Employ: Self-Employed 25% (46) 19% (35) 20% (37) 31% (57) 4% (8) 183Employ: Homemaker 23% (24) 14% (14) 17% (18) 39% (40) 8% (8) 104Employ: Student 29% (19) 26% (17) 11% (8) 21% (14) 13% (8) 67Employ: Retired 34% (182) 15% (81) 9% (49) 40% (215) 1% (6) 534Employ: Unemployed 26% (49) 29% (55) 8% (15) 25% (47) 12% (24) 191Employ: Other 21% (25) 19% (23) 9% (11) 41% (50) 12% (14) 124Military HH: Yes 28% (88) 18% (57) 14% (45) 36% (113) 4% (13) 315Military HH: No 28% (464) 22% (370) 12% (204) 33% (549) 6% (97) 1683RD/WT: Right Direction 56% (428) 30% (226) 5% (37) 4% (33) 5% (34) 757RD/WT: Wrong Track 10% (124) 16% (201) 17% (211) 51% (629) 6% (75) 1241Biden Job Approve 55% (493) 34% (306) 5% (45) 3% (30) 3% (25) 899Biden Job Disapprove 5% (56) 11% (113) 19% (198) 60% (624) 5% (47) 1039
Continued on next page
Page 76
76
Morning ConsultTable POL3_12
Table POL3_12: Do you approve or disapprove of how President Biden is handling each of the following?Coronavirus
DemographicStronglyapprove
Somewhatapprove
Somewhatdisapprove
Stronglydisapprove
Don’t Know /No Opinion Total N
Registered Voters 28% (551) 21% (427) 12% (249) 33% (662) 5% (109) 1998Biden Job Strongly Approve 77% (323) 19% (78) 2% (10) 1% (5) 1% (3) 418Biden Job Somewhat Approve 35% (170) 48% (229) 7% (35) 5% (24) 5% (23) 481Biden Job Somewhat Disapprove 13% (33) 25% (62) 37% (92) 17% (44) 8% (19) 250Biden Job Strongly Disapprove 3% (23) 7% (51) 13% (106) 74% (580) 3% (28) 788Favorable of Biden 55% (505) 33% (302) 6% (52) 3% (31) 4% (36) 927Unfavorable of Biden 4% (44) 11% (112) 19% (191) 61% (622) 5% (50) 1019Very Favorable of Biden 76% (362) 16% (78) 4% (19) 2% (8) 2% (8) 476Somewhat Favorable of Biden 32% (143) 50% (224) 7% (33) 5% (23) 6% (29) 451Somewhat Unfavorable of Biden 11% (23) 27% (55) 40% (83) 14% (30) 8% (16) 207Very Unfavorable of Biden 3% (21) 7% (57) 13% (108) 73% (592) 4% (34) 812#1 Issue: Economy 19% (143) 24% (182) 17% (128) 36% (276) 5% (39) 768#1 Issue: Security 13% (48) 12% (43) 13% (47) 58% (208) 4% (14) 360#1 Issue: Health Care 40% (91) 30% (69) 7% (17) 16% (37) 7% (17) 231#1 Issue: Medicare / Social Security 45% (101) 21% (47) 7% (15) 24% (55) 3% (8) 227#1 Issue: Women’s Issues 40% (50) 21% (26) 14% (18) 17% (21) 8% (10) 125#1 Issue: Education 35% (21) 24% (14) 11% (6) 11% (6) 20% (12) 59#1 Issue: Energy 51% (54) 26% (27) 5% (5) 16% (18) 2% (2) 107#1 Issue: Other 35% (43) 15% (18) 10% (12) 34% (41) 6% (7) 1222020 Vote: Joe Biden 52% (489) 31% (289) 9% (84) 5% (45) 4% (40) 9462020 Vote: Donald Trump 4% (38) 12% (104) 15% (128) 64% (553) 5% (40) 8642020 Vote: Didn’t Vote 13% (21) 17% (25) 20% (31) 34% (51) 16% (25) 1532018 House Vote: Democrat 52% (398) 28% (217) 9% (72) 7% (52) 4% (31) 7692018 House Vote: Republican 7% (48) 12% (88) 17% (116) 61% (429) 3% (21) 7022016 Vote: Hillary Clinton 55% (376) 29% (197) 8% (52) 5% (37) 3% (23) 6852016 Vote: Donald Trump 8% (62) 13% (104) 16% (129) 59% (476) 4% (31) 8022016 Vote: Other 22% (18) 25% (21) 16% (14) 29% (24) 8% (7) 842016 Vote: Didn’t Vote 22% (92) 24% (103) 13% (54) 29% (125) 12% (49) 423Voted in 2014: Yes 31% (407) 20% (266) 13% (175) 34% (450) 3% (36) 1335Voted in 2014: No 22% (144) 24% (160) 11% (74) 32% (212) 11% (73) 663
Continued on next page
Page 77
National Tracking Poll #2110084, October, 2021
77
Table POL3_12
Table POL3_12: Do you approve or disapprove of how President Biden is handling each of the following?Coronavirus
DemographicStronglyapprove
Somewhatapprove
Somewhatdisapprove
Stronglydisapprove
Don’t Know /No Opinion Total N
Registered Voters 28% (551) 21% (427) 12% (249) 33% (662) 5% (109) 19984-Region: Northeast 31% (108) 25% (89) 12% (43) 25% (87) 7% (26) 3534-Region: Midwest 25% (113) 18% (81) 13% (56) 38% (170) 6% (25) 4444-Region: South 25% (184) 18% (137) 13% (98) 39% (291) 5% (36) 7464-Region: West 32% (147) 26% (120) 11% (52) 25% (113) 5% (23) 455Party: Democrat/Leans Democrat 50% (454) 30% (277) 9% (80) 6% (58) 5% (45) 914Party: Republican/Leans Republican 6% (52) 12% (93) 16% (131) 62% (502) 4% (31) 808Note: Row proportions may total to larger than one-hundred percent due to rounding. For more information visit MorningConsultIntelligence.com.
Page 78
78
Morning ConsultTable POL3_13
Table POL3_13: Do you approve or disapprove of how President Biden is handling each of the following?Voting rights
DemographicStronglyapprove
Somewhatapprove
Somewhatdisapprove
Stronglydisapprove
Don’t Know /No Opinion Total N
Registered Voters 20% (405) 25% (494) 10% (206) 32% (634) 13% (259) 1998Gender: Male 22% (208) 27% (251) 10% (95) 33% (308) 9% (80) 942Gender: Female 19% (197) 23% (243) 11% (111) 31% (327) 17% (178) 1056Age: 18-34 24% (126) 27% (140) 10% (53) 21% (106) 18% (90) 514Age: 35-44 23% (70) 27% (84) 12% (36) 25% (77) 13% (40) 307Age: 45-64 16% (106) 24% (162) 11% (78) 38% (257) 11% (77) 679Age: 65+ 21% (104) 22% (108) 8% (39) 39% (194) 10% (52) 497GenZers: 1997-2012 27% (46) 24% (41) 9% (15) 15% (26) 25% (42) 170Millennials: 1981-1996 24% (134) 28% (155) 11% (60) 23% (126) 14% (78) 551GenXers: 1965-1980 14% (67) 27% (129) 13% (59) 34% (162) 11% (53) 469Baby Boomers: 1946-1964 19% (140) 21% (156) 9% (63) 40% (293) 11% (80) 732PID: Dem (no lean) 39% (302) 38% (293) 9% (71) 3% (26) 11% (85) 777PID: Ind (no lean) 12% (61) 26% (136) 11% (57) 31% (166) 21% (108) 528PID: Rep (no lean) 6% (42) 9% (65) 11% (79) 64% (442) 9% (65) 693PID/Gender: DemMen 41% (143) 38% (134) 10% (34) 4% (13) 8% (27) 352PID/Gender: DemWomen 37% (158) 37% (159) 9% (37) 3% (13) 14% (58) 425PID/Gender: Ind Men 13% (37) 27% (75) 10% (28) 37% (103) 13% (36) 280PID/Gender: Ind Women 10% (24) 24% (61) 11% (28) 25% (63) 29% (72) 248PID/Gender: Rep Men 9% (27) 13% (42) 11% (33) 62% (191) 5% (17) 310PID/Gender: Rep Women 4% (15) 6% (24) 12% (46) 65% (251) 13% (48) 384Ideo: Liberal (1-3) 36% (206) 38% (212) 11% (61) 5% (30) 10% (56) 566Ideo: Moderate (4) 23% (130) 33% (187) 12% (69) 17% (92) 14% (81) 560Ideo: Conservative (5-7) 8% (56) 10% (73) 9% (68) 65% (477) 8% (56) 730Educ: < College 18% (219) 22% (266) 9% (112) 35% (427) 15% (182) 1206Educ: Bachelors degree 21% (104) 27% (135) 12% (58) 29% (146) 12% (58) 501Educ: Post-grad 28% (81) 32% (93) 12% (36) 21% (61) 7% (19) 290Income: Under 50k 18% (160) 25% (216) 11% (100) 30% (260) 16% (137) 873Income: 50k-100k 20% (142) 24% (174) 9% (66) 36% (259) 12% (86) 728Income: 100k+ 26% (103) 26% (104) 10% (40) 29% (116) 9% (35) 398Ethnicity: White 18% (281) 24% (367) 10% (158) 36% (551) 12% (186) 1544Ethnicity: Hispanic 20% (43) 33% (73) 12% (26) 22% (48) 14% (32) 222
Continued on next page
Page 79
National Tracking Poll #2110084, October, 2021
79
Table POL3_13
Table POL3_13: Do you approve or disapprove of how President Biden is handling each of the following?Voting rights
DemographicStronglyapprove
Somewhatapprove
Somewhatdisapprove
Stronglydisapprove
Don’t Know /No Opinion Total N
Registered Voters 20% (405) 25% (494) 10% (206) 32% (634) 13% (259) 1998Ethnicity: Black 30% (75) 28% (72) 13% (32) 14% (34) 16% (40) 253Ethnicity: Other 24% (48) 28% (56) 8% (16) 24% (48) 16% (32) 201All Christian 21% (223) 21% (219) 8% (83) 39% (401) 11% (114) 1041All Non-Christian 30% (32) 29% (31) 15% (16) 14% (15) 12% (13) 107Atheist 26% (20) 34% (27) 9% (7) 18% (14) 12% (10) 78Agnostic/Nothing in particular 17% (81) 28% (135) 11% (55) 27% (130) 17% (80) 480Something Else 17% (49) 28% (83) 15% (44) 25% (74) 15% (42) 293Religious Non-Protestant/Catholic 27% (35) 26% (33) 16% (21) 20% (26) 11% (14) 129Evangelical 19% (96) 19% (96) 8% (40) 42% (210) 11% (56) 499Non-Evangelical 21% (163) 25% (197) 10% (83) 32% (253) 12% (95) 790Community: Urban 29% (140) 33% (159) 10% (48) 17% (81) 12% (59) 487Community: Suburban 19% (202) 23% (243) 11% (119) 33% (341) 13% (136) 1041Community: Rural 13% (62) 20% (92) 8% (40) 45% (212) 14% (63) 469Employ: Private Sector 20% (140) 26% (181) 12% (84) 30% (209) 10% (71) 684Employ: Government 22% (25) 36% (40) 12% (14) 21% (23) 9% (10) 112Employ: Self-Employed 19% (35) 25% (45) 10% (17) 32% (59) 14% (25) 183Employ: Homemaker 19% (20) 16% (17) 12% (13) 33% (34) 19% (20) 104Employ: Student 28% (19) 31% (21) 8% (5) 15% (10) 18% (12) 67Employ: Retired 20% (104) 22% (118) 8% (43) 42% (224) 8% (44) 534Employ: Unemployed 21% (39) 23% (44) 9% (17) 21% (41) 26% (49) 191Employ: Other 18% (22) 23% (28) 10% (13) 28% (34) 22% (27) 124Military HH: Yes 16% (50) 24% (76) 9% (30) 39% (123) 12% (37) 315Military HH: No 21% (355) 25% (418) 10% (176) 30% (512) 13% (222) 1683RD/WT: Right Direction 43% (327) 39% (297) 7% (50) 3% (25) 8% (58) 757RD/WT: Wrong Track 6% (78) 16% (197) 13% (156) 49% (610) 16% (200) 1241Biden Job Approve 40% (360) 42% (380) 7% (59) 3% (23) 9% (77) 899Biden Job Disapprove 4% (41) 10% (109) 14% (143) 58% (605) 13% (140) 1039
Continued on next page
Page 80
80
Morning ConsultTable POL3_13
Table POL3_13: Do you approve or disapprove of how President Biden is handling each of the following?Voting rights
DemographicStronglyapprove
Somewhatapprove
Somewhatdisapprove
Stronglydisapprove
Don’t Know /No Opinion Total N
Registered Voters 20% (405) 25% (494) 10% (206) 32% (634) 13% (259) 1998Biden Job Strongly Approve 60% (252) 31% (130) 5% (21) 1% (4) 3% (12) 418Biden Job Somewhat Approve 23% (108) 52% (250) 8% (38) 4% (19) 14% (65) 481Biden Job Somewhat Disapprove 7% (18) 27% (68) 29% (73) 10% (25) 26% (66) 250Biden Job Strongly Disapprove 3% (23) 5% (41) 9% (71) 74% (580) 9% (74) 788Favorable of Biden 40% (366) 42% (388) 7% (63) 2% (20) 10% (90) 927Unfavorable of Biden 4% (38) 10% (101) 14% (138) 59% (605) 13% (137) 1019Very Favorable of Biden 60% (285) 31% (148) 4% (21) 1% (7) 3% (16) 476Somewhat Favorable of Biden 18% (82) 53% (239) 9% (42) 3% (13) 17% (75) 451Somewhat Unfavorable of Biden 7% (16) 27% (55) 28% (57) 10% (22) 28% (57) 207Very Unfavorable of Biden 3% (22) 6% (46) 10% (81) 72% (584) 10% (79) 812#1 Issue: Economy 14% (108) 24% (188) 13% (100) 35% (272) 13% (101) 768#1 Issue: Security 7% (25) 17% (63) 8% (29) 56% (201) 12% (41) 360#1 Issue: Health Care 30% (70) 34% (79) 9% (22) 13% (29) 13% (30) 231#1 Issue: Medicare / Social Security 29% (66) 25% (57) 9% (21) 26% (59) 11% (24) 227#1 Issue: Women’s Issues 40% (50) 24% (30) 9% (11) 10% (13) 17% (21) 125#1 Issue: Education 34% (20) 24% (14) 10% (6) 12% (7) 21% (13) 59#1 Issue: Energy 36% (38) 33% (35) 10% (10) 11% (12) 11% (11) 107#1 Issue: Other 24% (29) 24% (29) 6% (7) 34% (41) 13% (16) 1222020 Vote: Joe Biden 36% (344) 39% (371) 10% (91) 4% (39) 11% (101) 9462020 Vote: Donald Trump 5% (40) 11% (91) 10% (87) 64% (550) 11% (96) 8642020 Vote: Didn’t Vote 12% (19) 15% (23) 17% (25) 23% (36) 33% (50) 1532018 House Vote: Democrat 37% (281) 39% (298) 10% (75) 6% (45) 9% (69) 7692018 House Vote: Republican 6% (40) 11% (79) 11% (77) 63% (442) 9% (64) 7022016 Vote: Hillary Clinton 39% (265) 39% (269) 10% (67) 4% (26) 8% (57) 6852016 Vote: Donald Trump 6% (45) 14% (108) 10% (81) 60% (483) 11% (86) 8022016 Vote: Other 17% (14) 22% (19) 21% (17) 28% (23) 13% (11) 842016 Vote: Didn’t Vote 19% (79) 23% (95) 10% (41) 24% (102) 25% (105) 423Voted in 2014: Yes 21% (286) 25% (336) 10% (135) 35% (467) 8% (111) 1335Voted in 2014: No 18% (119) 24% (158) 11% (71) 25% (167) 22% (147) 663
Continued on next page
Page 81
National Tracking Poll #2110084, October, 2021
81
Table POL3_13
Table POL3_13: Do you approve or disapprove of how President Biden is handling each of the following?Voting rights
DemographicStronglyapprove
Somewhatapprove
Somewhatdisapprove
Stronglydisapprove
Don’t Know /No Opinion Total N
Registered Voters 20% (405) 25% (494) 10% (206) 32% (634) 13% (259) 19984-Region: Northeast 24% (85) 31% (110) 8% (28) 24% (84) 13% (46) 3534-Region: Midwest 19% (83) 23% (102) 12% (53) 33% (148) 13% (59) 4444-Region: South 18% (131) 20% (151) 10% (77) 39% (288) 13% (99) 7464-Region: West 23% (106) 29% (132) 11% (48) 25% (115) 12% (55) 455Party: Democrat/Leans Democrat 37% (337) 39% (358) 9% (82) 4% (35) 11% (102) 914Party: Republican/Leans Republican 6% (45) 10% (79) 11% (91) 63% (510) 10% (83) 808Note: Row proportions may total to larger than one-hundred percent due to rounding. For more information visit MorningConsultIntelligence.com.
Page 82
82
Morning ConsultTable POL3_14
Table POL3_14: Do you approve or disapprove of how President Biden is handling each of the following?Foreign policy
DemographicStronglyapprove
Somewhatapprove
Somewhatdisapprove
Stronglydisapprove
Don’t Know /No Opinion Total N
Registered Voters 14% (286) 22% (442) 13% (270) 39% (776) 11% (224) 1998Gender: Male 16% (155) 24% (229) 13% (127) 39% (371) 6% (60) 942Gender: Female 12% (131) 20% (213) 14% (143) 38% (405) 16% (164) 1056Age: 18-34 14% (73) 21% (109) 18% (94) 29% (148) 18% (90) 514Age: 35-44 16% (50) 27% (82) 11% (35) 30% (92) 16% (48) 307Age: 45-64 12% (78) 21% (142) 15% (105) 43% (294) 9% (60) 679Age: 65+ 17% (85) 22% (108) 7% (36) 49% (243) 5% (26) 497GenZers: 1997-2012 11% (19) 23% (38) 17% (28) 24% (40) 26% (44) 170Millennials: 1981-1996 17% (95) 23% (127) 15% (84) 30% (168) 14% (78) 551GenXers: 1965-1980 10% (49) 21% (100) 17% (80) 40% (188) 11% (53) 469Baby Boomers: 1946-1964 15% (111) 22% (161) 10% (73) 47% (341) 6% (46) 732PID: Dem (no lean) 28% (220) 38% (299) 13% (101) 8% (64) 12% (94) 777PID: Ind (no lean) 7% (37) 19% (100) 18% (92) 38% (200) 18% (98) 528PID: Rep (no lean) 4% (29) 6% (43) 11% (77) 74% (512) 5% (33) 693PID/Gender: DemMen 33% (116) 40% (139) 11% (40) 9% (32) 7% (24) 352PID/Gender: DemWomen 24% (104) 38% (159) 14% (61) 7% (32) 16% (69) 425PID/Gender: Ind Men 7% (20) 22% (60) 18% (49) 42% (119) 11% (32) 280PID/Gender: Ind Women 7% (17) 16% (40) 17% (43) 33% (82) 27% (66) 248PID/Gender: Rep Men 6% (19) 9% (29) 12% (38) 71% (220) 1% (4) 310PID/Gender: Rep Women 3% (11) 4% (13) 10% (39) 76% (292) 8% (29) 384Ideo: Liberal (1-3) 29% (163) 36% (202) 15% (84) 10% (59) 10% (58) 566Ideo: Moderate (4) 14% (78) 30% (167) 18% (102) 24% (135) 14% (77) 560Ideo: Conservative (5-7) 5% (38) 7% (53) 8% (58) 75% (547) 5% (34) 730Educ: < College 13% (160) 19% (230) 13% (153) 41% (501) 14% (163) 1206Educ: Bachelors degree 13% (64) 27% (134) 15% (74) 38% (191) 8% (39) 501Educ: Post-grad 22% (63) 27% (78) 15% (43) 29% (84) 8% (22) 290Income: Under 50k 12% (105) 23% (198) 13% (113) 37% (326) 15% (131) 873Income: 50k-100k 16% (118) 19% (137) 12% (88) 43% (313) 10% (72) 728Income: 100k+ 16% (64) 27% (107) 17% (69) 34% (137) 5% (21) 398Ethnicity: White 14% (211) 20% (316) 12% (192) 43% (666) 10% (158) 1544Ethnicity: Hispanic 13% (30) 27% (59) 14% (32) 30% (67) 16% (34) 222
Continued on next page
Page 83
National Tracking Poll #2110084, October, 2021
83
Table POL3_14
Table POL3_14: Do you approve or disapprove of how President Biden is handling each of the following?Foreign policy
DemographicStronglyapprove
Somewhatapprove
Somewhatdisapprove
Stronglydisapprove
Don’t Know /No Opinion Total N
Registered Voters 14% (286) 22% (442) 13% (270) 39% (776) 11% (224) 1998Ethnicity: Black 18% (45) 35% (88) 17% (43) 17% (44) 13% (34) 253Ethnicity: Other 15% (31) 19% (38) 17% (35) 33% (66) 16% (32) 201All Christian 14% (144) 22% (225) 11% (118) 46% (481) 7% (74) 1041All Non-Christian 24% (25) 33% (35) 14% (15) 21% (22) 8% (8) 107Atheist 17% (13) 31% (24) 13% (10) 21% (16) 18% (14) 78Agnostic/Nothing in particular 14% (67) 20% (98) 17% (82) 32% (154) 16% (78) 480Something Else 13% (37) 20% (59) 15% (44) 35% (103) 17% (50) 293Religious Non-Protestant/Catholic 20% (26) 30% (38) 14% (18) 29% (37) 8% (10) 129Evangelical 12% (60) 19% (95) 14% (69) 46% (228) 9% (47) 499Non-Evangelical 15% (116) 22% (175) 11% (89) 42% (334) 10% (76) 790Community: Urban 23% (111) 31% (149) 13% (62) 23% (114) 11% (51) 487Community: Suburban 12% (129) 22% (230) 14% (145) 40% (421) 11% (116) 1041Community: Rural 10% (47) 13% (62) 13% (62) 51% (241) 12% (57) 469Employ: Private Sector 15% (99) 23% (155) 17% (119) 36% (249) 9% (62) 684Employ: Government 14% (16) 27% (31) 17% (19) 30% (34) 12% (13) 112Employ: Self-Employed 18% (33) 18% (33) 14% (25) 42% (77) 9% (16) 183Employ: Homemaker 9% (9) 19% (19) 13% (13) 36% (37) 24% (25) 104Employ: Student 8% (6) 29% (20) 19% (13) 23% (16) 20% (13) 67Employ: Retired 17% (88) 22% (116) 9% (46) 48% (257) 5% (26) 534Employ: Unemployed 13% (25) 26% (49) 9% (17) 30% (58) 22% (41) 191Employ: Other 8% (10) 16% (20) 15% (19) 39% (48) 22% (27) 124Military HH: Yes 17% (53) 18% (57) 10% (30) 48% (152) 7% (24) 315Military HH: No 14% (234) 23% (385) 14% (239) 37% (624) 12% (201) 1683RD/WT: Right Direction 32% (239) 43% (325) 10% (78) 6% (43) 10% (72) 757RD/WT: Wrong Track 4% (47) 9% (117) 15% (191) 59% (733) 12% (152) 1241Biden Job Approve 29% (261) 44% (395) 12% (111) 4% (38) 10% (94) 899Biden Job Disapprove 2% (24) 4% (41) 14% (150) 70% (730) 9% (94) 1039
Continued on next page
Page 84
84
Morning ConsultTable POL3_14
Table POL3_14: Do you approve or disapprove of how President Biden is handling each of the following?Foreign policy
DemographicStronglyapprove
Somewhatapprove
Somewhatdisapprove
Stronglydisapprove
Don’t Know /No Opinion Total N
Registered Voters 14% (286) 22% (442) 13% (270) 39% (776) 11% (224) 1998Biden Job Strongly Approve 50% (210) 37% (153) 5% (20) 2% (9) 6% (26) 418Biden Job Somewhat Approve 11% (51) 50% (242) 19% (91) 6% (29) 14% (68) 481Biden Job Somewhat Disapprove 1% (3) 10% (26) 41% (103) 28% (70) 19% (49) 250Biden Job Strongly Disapprove 3% (20) 2% (15) 6% (48) 84% (660) 6% (46) 788Favorable of Biden 29% (265) 43% (396) 13% (123) 4% (38) 11% (104) 927Unfavorable of Biden 2% (21) 4% (37) 14% (138) 72% (730) 9% (93) 1019Very Favorable of Biden 49% (232) 39% (185) 4% (21) 2% (9) 6% (29) 476Somewhat Favorable of Biden 7% (32) 47% (211) 23% (102) 7% (29) 17% (76) 451Somewhat Unfavorable of Biden 1% (1) 11% (22) 37% (76) 32% (65) 20% (42) 207Very Unfavorable of Biden 2% (20) 2% (14) 8% (62) 82% (665) 6% (51) 812#1 Issue: Economy 9% (72) 20% (155) 17% (132) 43% (331) 10% (79) 768#1 Issue: Security 7% (25) 11% (39) 8% (28) 68% (244) 7% (24) 360#1 Issue: Health Care 27% (63) 30% (69) 13% (31) 16% (36) 14% (32) 231#1 Issue: Medicare / Social Security 19% (44) 26% (60) 11% (24) 32% (72) 12% (26) 227#1 Issue: Women’s Issues 18% (22) 25% (32) 17% (21) 18% (23) 21% (26) 125#1 Issue: Education 21% (12) 33% (19) 10% (6) 14% (8) 23% (14) 59#1 Issue: Energy 27% (29) 35% (37) 13% (14) 17% (18) 8% (9) 107#1 Issue: Other 16% (20) 25% (30) 11% (13) 36% (44) 12% (15) 1222020 Vote: Joe Biden 26% (247) 39% (371) 16% (148) 7% (67) 12% (113) 9462020 Vote: Donald Trump 4% (30) 5% (47) 10% (84) 74% (643) 7% (60) 8642020 Vote: Didn’t Vote 5% (8) 14% (21) 21% (33) 31% (47) 29% (44) 1532018 House Vote: Democrat 28% (215) 38% (294) 15% (113) 9% (70) 10% (77) 7692018 House Vote: Republican 4% (28) 8% (57) 11% (74) 72% (506) 5% (37) 7022016 Vote: Hillary Clinton 29% (199) 40% (275) 14% (97) 5% (37) 11% (75) 6852016 Vote: Donald Trump 5% (37) 8% (67) 10% (80) 71% (569) 6% (49) 8022016 Vote: Other 6% (5) 22% (18) 21% (17) 41% (35) 10% (8) 842016 Vote: Didn’t Vote 10% (43) 19% (81) 17% (72) 32% (135) 22% (92) 423Voted in 2014: Yes 17% (225) 23% (305) 13% (168) 41% (550) 7% (87) 1335Voted in 2014: No 9% (61) 21% (136) 15% (102) 34% (226) 21% (137) 663
Continued on next page
Page 85
National Tracking Poll #2110084, October, 2021
85
Table POL3_14
Table POL3_14: Do you approve or disapprove of how President Biden is handling each of the following?Foreign policy
DemographicStronglyapprove
Somewhatapprove
Somewhatdisapprove
Stronglydisapprove
Don’t Know /No Opinion Total N
Registered Voters 14% (286) 22% (442) 13% (270) 39% (776) 11% (224) 19984-Region: Northeast 15% (52) 27% (95) 14% (50) 31% (110) 13% (47) 3534-Region: Midwest 14% (61) 18% (81) 14% (60) 43% (189) 12% (54) 4444-Region: South 13% (94) 19% (140) 13% (101) 45% (332) 11% (79) 7464-Region: West 18% (80) 28% (126) 13% (59) 32% (145) 10% (45) 455Party: Democrat/Leans Democrat 26% (242) 38% (346) 14% (129) 9% (82) 13% (115) 914Party: Republican/Leans Republican 4% (31) 7% (53) 11% (91) 72% (584) 6% (50) 808Note: Row proportions may total to larger than one-hundred percent due to rounding. For more information visit MorningConsultIntelligence.com.
Page 86
86
Morning ConsultTable POL4_1
Table POL4_1: How would you rate each of the following on their handling of the coronavirus?President Joe Biden
Demographic Excellent Good Just Fair PoorDon’t Know /No Opinion Total N
Registered Voters 22% (434) 21% (412) 15% (296) 39% (781) 4% (74) 1998Gender: Male 25% (236) 21% (200) 13% (123) 39% (364) 2% (18) 942Gender: Female 19% (198) 20% (213) 16% (173) 39% (417) 5% (56) 1056Age: 18-34 21% (109) 22% (114) 16% (82) 33% (171) 7% (38) 514Age: 35-44 21% (64) 28% (85) 16% (49) 30% (91) 6% (17) 307Age: 45-64 19% (127) 19% (128) 16% (109) 44% (301) 2% (15) 679Age: 65+ 27% (134) 17% (85) 11% (56) 44% (218) 1% (4) 497GenZers: 1997-2012 15% (26) 20% (34) 22% (38) 27% (47) 15% (26) 170Millennials: 1981-1996 24% (131) 25% (137) 14% (80) 32% (179) 4% (25) 551GenXers: 1965-1980 14% (68) 22% (102) 16% (77) 44% (204) 4% (17) 469Baby Boomers: 1946-1964 26% (190) 18% (129) 13% (92) 43% (316) 1% (5) 732PID: Dem (no lean) 45% (352) 33% (257) 14% (105) 5% (41) 3% (22) 777PID: Ind (no lean) 12% (63) 21% (111) 18% (96) 42% (219) 7% (37) 528PID: Rep (no lean) 3% (19) 6% (44) 14% (94) 75% (521) 2% (14) 693PID/Gender: DemMen 52% (182) 31% (109) 12% (41) 5% (17) 1% (4) 352PID/Gender: DemWomen 40% (171) 35% (148) 15% (64) 6% (24) 4% (18) 425PID/Gender: Ind Men 14% (40) 22% (62) 15% (42) 44% (124) 4% (12) 280PID/Gender: Ind Women 9% (23) 20% (49) 22% (54) 38% (95) 10% (26) 248PID/Gender: Rep Men 5% (15) 9% (29) 13% (40) 72% (224) 1% (2) 310PID/Gender: Rep Women 1% (4) 4% (15) 14% (55) 78% (297) 3% (12) 384Ideo: Liberal (1-3) 41% (230) 34% (192) 14% (81) 8% (47) 3% (15) 566Ideo: Moderate (4) 26% (144) 28% (155) 22% (122) 23% (130) 2% (9) 560Ideo: Conservative (5-7) 7% (48) 7% (49) 10% (72) 75% (549) 2% (13) 730Educ: < College 18% (223) 18% (212) 14% (171) 45% (538) 5% (63) 1206Educ: Bachelors degree 25% (125) 23% (117) 16% (82) 33% (167) 2% (10) 501Educ: Post-grad 30% (87) 29% (84) 15% (43) 26% (75) — (1) 290Income: Under 50k 19% (169) 21% (180) 15% (128) 40% (345) 6% (50) 873Income: 50k-100k 22% (158) 20% (145) 14% (102) 42% (307) 2% (16) 728Income: 100k+ 27% (107) 22% (87) 17% (66) 32% (128) 2% (8) 398Ethnicity: White 20% (313) 19% (296) 14% (216) 43% (661) 4% (57) 1544Ethnicity: Hispanic 17% (37) 23% (52) 17% (38) 33% (73) 10% (23) 222
Continued on next page
Page 87
National Tracking Poll #2110084, October, 2021
87
Table POL4_1
Table POL4_1: How would you rate each of the following on their handling of the coronavirus?President Joe Biden
Demographic Excellent Good Just Fair PoorDon’t Know /No Opinion Total N
Registered Voters 22% (434) 21% (412) 15% (296) 39% (781) 4% (74) 1998Ethnicity: Black 31% (79) 27% (70) 19% (49) 19% (47) 3% (9) 253Ethnicity: Other 21% (42) 23% (46) 15% (31) 36% (73) 4% (8) 201All Christian 23% (235) 19% (193) 12% (128) 44% (462) 2% (23) 1041All Non-Christian 31% (33) 33% (35) 14% (15) 21% (23) — (0) 107Atheist 24% (19) 33% (26) 18% (14) 24% (18) 1% (1) 78Agnostic/Nothing in particular 19% (90) 22% (105) 20% (94) 32% (153) 8% (38) 480Something Else 20% (58) 18% (53) 15% (45) 43% (125) 4% (12) 293Religious Non-Protestant/Catholic 27% (34) 29% (38) 14% (18) 30% (38) 1% (1) 129Evangelical 20% (99) 18% (87) 11% (55) 48% (240) 3% (17) 499Non-Evangelical 23% (181) 19% (152) 14% (112) 41% (328) 2% (17) 790Community: Urban 33% (162) 26% (124) 14% (66) 24% (118) 3% (16) 487Community: Suburban 19% (201) 21% (224) 17% (174) 39% (409) 3% (34) 1041Community: Rural 15% (70) 14% (65) 12% (56) 54% (254) 5% (24) 469Employ: Private Sector 22% (151) 21% (146) 16% (110) 37% (255) 3% (23) 684Employ: Government 20% (22) 30% (34) 16% (18) 29% (32) 5% (6) 112Employ: Self-Employed 19% (35) 19% (35) 20% (36) 38% (70) 4% (8) 183Employ: Homemaker 16% (17) 15% (16) 17% (17) 47% (49) 5% (5) 104Employ: Student 15% (10) 27% (18) 24% (16) 23% (16) 10% (7) 67Employ: Retired 28% (147) 17% (89) 9% (49) 46% (243) 1% (5) 534Employ: Unemployed 21% (39) 25% (47) 17% (33) 31% (59) 7% (13) 191Employ: Other 11% (14) 22% (27) 14% (18) 47% (58) 6% (8) 124Military HH: Yes 22% (69) 17% (54) 13% (40) 46% (145) 2% (7) 315Military HH: No 22% (365) 21% (358) 15% (256) 38% (636) 4% (68) 1683RD/WT: Right Direction 49% (369) 35% (267) 10% (77) 3% (24) 3% (20) 757RD/WT: Wrong Track 5% (65) 12% (146) 18% (219) 61% (757) 4% (55) 1241Biden Job Approve 46% (416) 38% (342) 13% (114) 2% (14) 1% (13) 899Biden Job Disapprove 2% (18) 6% (62) 17% (172) 73% (755) 3% (31) 1039
Continued on next page
Page 88
88
Morning ConsultTable POL4_1
Table POL4_1: How would you rate each of the following on their handling of the coronavirus?President Joe Biden
Demographic Excellent Good Just Fair PoorDon’t Know /No Opinion Total N
Registered Voters 22% (434) 21% (412) 15% (296) 39% (781) 4% (74) 1998Biden Job Strongly Approve 74% (311) 19% (81) 4% (17) 1% (6) 1% (3) 418Biden Job Somewhat Approve 22% (105) 54% (261) 20% (97) 2% (8) 2% (10) 481Biden Job Somewhat Disapprove 3% (8) 20% (51) 45% (114) 28% (70) 3% (8) 250Biden Job Strongly Disapprove 1% (10) 1% (12) 7% (58) 87% (685) 3% (23) 788Favorable of Biden 45% (420) 38% (356) 13% (116) 2% (16) 2% (19) 927Unfavorable of Biden 1% (11) 5% (54) 16% (165) 74% (755) 3% (34) 1019Very Favorable of Biden 74% (353) 21% (99) 3% (15) 2% (7) — (2) 476Somewhat Favorable of Biden 15% (67) 57% (257) 23% (102) 2% (8) 4% (17) 451Somewhat Unfavorable of Biden 3% (6) 19% (39) 49% (101) 26% (54) 4% (7) 207Very Unfavorable of Biden 1% (6) 2% (15) 8% (63) 86% (701) 3% (26) 812#1 Issue: Economy 15% (116) 19% (148) 19% (142) 44% (337) 3% (25) 768#1 Issue: Security 11% (39) 8% (29) 12% (41) 67% (241) 2% (9) 360#1 Issue: Health Care 34% (78) 28% (65) 16% (36) 17% (38) 6% (13) 231#1 Issue: Medicare / Social Security 36% (83) 23% (51) 9% (21) 30% (67) 2% (4) 227#1 Issue: Women’s Issues 23% (29) 30% (38) 23% (29) 17% (21) 7% (8) 125#1 Issue: Education 37% (22) 29% (17) 6% (4) 18% (11) 9% (6) 59#1 Issue: Energy 35% (37) 33% (35) 7% (8) 21% (22) 4% (4) 107#1 Issue: Other 25% (30) 24% (29) 11% (14) 36% (44) 4% (5) 1222020 Vote: Joe Biden 42% (394) 35% (335) 15% (144) 5% (50) 2% (23) 9462020 Vote: Donald Trump 3% (22) 6% (55) 13% (109) 75% (649) 3% (29) 8642020 Vote: Didn’t Vote 11% (16) 13% (20) 20% (31) 42% (65) 14% (21) 1532018 House Vote: Democrat 44% (341) 32% (245) 14% (106) 8% (61) 2% (15) 7692018 House Vote: Republican 4% (28) 8% (57) 13% (88) 74% (516) 2% (12) 7022016 Vote: Hillary Clinton 48% (327) 32% (216) 13% (87) 7% (46) 1% (9) 6852016 Vote: Donald Trump 5% (41) 9% (69) 14% (112) 70% (560) 3% (20) 8022016 Vote: Other 11% (10) 28% (23) 18% (15) 39% (33) 3% (3) 842016 Vote: Didn’t Vote 13% (54) 25% (105) 19% (81) 33% (141) 10% (42) 423Voted in 2014: Yes 26% (341) 19% (260) 13% (178) 40% (536) 2% (21) 1335Voted in 2014: No 14% (93) 23% (152) 18% (118) 37% (245) 8% (54) 663
Continued on next page
Page 89
National Tracking Poll #2110084, October, 2021
89
Table POL4_1
Table POL4_1: How would you rate each of the following on their handling of the coronavirus?President Joe Biden
Demographic Excellent Good Just Fair PoorDon’t Know /No Opinion Total N
Registered Voters 22% (434) 21% (412) 15% (296) 39% (781) 4% (74) 19984-Region: Northeast 26% (91) 21% (73) 16% (56) 33% (117) 4% (16) 3534-Region: Midwest 21% (93) 18% (80) 14% (64) 44% (194) 3% (13) 4444-Region: South 19% (140) 19% (144) 14% (106) 44% (327) 4% (29) 7464-Region: West 24% (110) 25% (115) 15% (70) 32% (143) 4% (16) 455Party: Democrat/Leans Democrat 43% (390) 34% (307) 15% (138) 6% (54) 3% (26) 914Party: Republican/Leans Republican 3% (22) 7% (59) 13% (106) 74% (600) 3% (22) 808Note: Row proportions may total to larger than one-hundred percent due to rounding. For more information visit MorningConsultIntelligence.com.
Page 90
90
Morning ConsultTable POL4_2
Table POL4_2: How would you rate each of the following on their handling of the coronavirus?Congress
Demographic Excellent Good Just Fair PoorDon’t Know /No Opinion Total N
Registered Voters 5% (95) 19% (387) 34% (674) 33% (654) 9% (188) 1998Gender: Male 7% (70) 20% (188) 34% (318) 33% (313) 6% (54) 942Gender: Female 2% (26) 19% (199) 34% (356) 32% (341) 13% (134) 1056Age: 18-34 9% (47) 19% (96) 29% (151) 25% (131) 17% (89) 514Age: 35-44 7% (21) 26% (81) 31% (96) 26% (79) 9% (29) 307Age: 45-64 2% (17) 19% (127) 35% (236) 38% (255) 6% (44) 679Age: 65+ 2% (10) 17% (82) 38% (190) 38% (188) 5% (26) 497GenZers: 1997-2012 5% (8) 15% (25) 30% (51) 23% (39) 27% (47) 170Millennials: 1981-1996 10% (56) 23% (125) 31% (170) 25% (138) 11% (62) 551GenXers: 1965-1980 3% (12) 22% (103) 31% (144) 37% (175) 8% (35) 469Baby Boomers: 1946-1964 2% (17) 17% (127) 38% (278) 37% (271) 5% (40) 732PID: Dem (no lean) 9% (70) 30% (233) 38% (298) 14% (109) 9% (67) 777PID: Ind (no lean) 1% (6) 17% (89) 28% (147) 40% (211) 14% (74) 528PID: Rep (no lean) 3% (19) 9% (65) 33% (229) 48% (333) 7% (47) 693PID/Gender: DemMen 14% (48) 32% (112) 35% (124) 12% (44) 7% (24) 352PID/Gender: DemWomen 5% (22) 29% (121) 41% (174) 15% (65) 10% (42) 425PID/Gender: Ind Men 1% (3) 17% (48) 33% (91) 42% (116) 8% (21) 280PID/Gender: Ind Women 1% (3) 17% (41) 23% (56) 38% (95) 21% (53) 248PID/Gender: Rep Men 6% (18) 9% (28) 33% (103) 49% (152) 3% (9) 310PID/Gender: Rep Women — (2) 10% (36) 33% (126) 47% (181) 10% (39) 384Ideo: Liberal (1-3) 9% (50) 29% (163) 37% (212) 19% (105) 6% (36) 566Ideo: Moderate (4) 4% (20) 24% (137) 39% (221) 23% (129) 10% (53) 560Ideo: Conservative (5-7) 3% (22) 10% (75) 30% (217) 52% (377) 5% (40) 730Educ: < College 3% (42) 17% (206) 32% (384) 35% (423) 12% (150) 1206Educ: Bachelors degree 5% (26) 20% (102) 36% (178) 34% (169) 5% (26) 501Educ: Post-grad 9% (27) 27% (79) 38% (112) 21% (61) 4% (12) 290Income: Under 50k 5% (44) 17% (150) 32% (281) 32% (281) 13% (117) 873Income: 50k-100k 3% (22) 18% (131) 37% (271) 34% (247) 8% (56) 728Income: 100k+ 7% (29) 26% (105) 31% (122) 32% (126) 4% (15) 398Ethnicity: White 4% (68) 18% (285) 34% (522) 35% (534) 9% (135) 1544Ethnicity: Hispanic 5% (12) 22% (49) 31% (69) 28% (62) 14% (31) 222
Continued on next page
Page 91
National Tracking Poll #2110084, October, 2021
91
Table POL4_2
Table POL4_2: How would you rate each of the following on their handling of the coronavirus?Congress
Demographic Excellent Good Just Fair PoorDon’t Know /No Opinion Total N
Registered Voters 5% (95) 19% (387) 34% (674) 33% (654) 9% (188) 1998Ethnicity: Black 7% (18) 23% (58) 36% (90) 20% (52) 14% (35) 253Ethnicity: Other 5% (10) 21% (43) 31% (62) 34% (68) 9% (18) 201All Christian 5% (57) 20% (207) 34% (355) 33% (348) 7% (74) 1041All Non-Christian 8% (8) 34% (36) 24% (26) 30% (32) 4% (4) 107Atheist 3% (2) 27% (21) 37% (29) 29% (22) 4% (3) 78Agnostic/Nothing in particular 4% (20) 15% (72) 36% (171) 31% (147) 14% (69) 480Something Else 3% (8) 17% (50) 32% (94) 35% (104) 13% (37) 293Religious Non-Protestant/Catholic 7% (9) 32% (42) 26% (34) 29% (37) 6% (7) 129Evangelical 6% (32) 21% (104) 27% (135) 35% (177) 10% (51) 499Non-Evangelical 4% (28) 18% (139) 38% (303) 33% (265) 7% (57) 790Community: Urban 11% (54) 29% (141) 28% (137) 22% (108) 10% (46) 487Community: Suburban 3% (28) 19% (196) 39% (401) 31% (323) 9% (92) 1041Community: Rural 3% (12) 11% (49) 29% (136) 47% (222) 11% (50) 469Employ: Private Sector 6% (44) 23% (155) 32% (221) 31% (212) 8% (52) 684Employ: Government 3% (3) 33% (37) 30% (34) 27% (30) 7% (8) 112Employ: Self-Employed 6% (11) 15% (27) 33% (60) 35% (65) 11% (20) 183Employ: Homemaker 1% (1) 12% (12) 34% (35) 37% (39) 16% (17) 104Employ: Student — (0) 25% (17) 34% (23) 27% (19) 13% (9) 67Employ: Retired 3% (17) 17% (88) 39% (206) 38% (204) 4% (19) 534Employ: Unemployed 8% (15) 18% (34) 30% (57) 22% (42) 22% (42) 191Employ: Other 4% (5) 14% (17) 30% (37) 35% (43) 18% (22) 124Military HH: Yes 2% (7) 21% (67) 34% (108) 35% (111) 7% (22) 315Military HH: No 5% (88) 19% (320) 34% (566) 32% (543) 10% (166) 1683RD/WT: Right Direction 11% (87) 36% (276) 32% (246) 12% (90) 8% (59) 757RD/WT: Wrong Track 1% (8) 9% (111) 35% (428) 45% (563) 10% (130) 1241Biden Job Approve 9% (80) 35% (310) 37% (330) 13% (120) 7% (59) 899Biden Job Disapprove 1% (15) 7% (71) 33% (339) 50% (521) 9% (92) 1039
Continued on next page
Page 92
92
Morning ConsultTable POL4_2
Table POL4_2: How would you rate each of the following on their handling of the coronavirus?Congress
Demographic Excellent Good Just Fair PoorDon’t Know /No Opinion Total N
Registered Voters 5% (95) 19% (387) 34% (674) 33% (654) 9% (188) 1998Biden Job Strongly Approve 15% (61) 41% (172) 31% (131) 9% (38) 4% (17) 418Biden Job Somewhat Approve 4% (19) 29% (139) 41% (199) 17% (83) 9% (42) 481Biden Job Somewhat Disapprove 1% (3) 15% (38) 43% (107) 31% (78) 10% (24) 250Biden Job Strongly Disapprove 2% (12) 4% (33) 29% (232) 56% (443) 9% (68) 788Favorable of Biden 9% (83) 33% (308) 37% (339) 14% (127) 7% (69) 927Unfavorable of Biden 1% (11) 7% (72) 32% (330) 50% (514) 9% (91) 1019Very Favorable of Biden 15% (73) 39% (184) 31% (147) 10% (50) 5% (22) 476Somewhat Favorable of Biden 2% (10) 27% (124) 43% (193) 17% (78) 10% (47) 451Somewhat Unfavorable of Biden — (1) 17% (36) 44% (92) 29% (61) 9% (19) 207Very Unfavorable of Biden 1% (11) 5% (37) 29% (238) 56% (453) 9% (73) 812#1 Issue: Economy 3% (21) 19% (147) 36% (275) 33% (257) 9% (68) 768#1 Issue: Security 5% (17) 11% (41) 30% (107) 47% (169) 7% (26) 360#1 Issue: Health Care 7% (17) 33% (76) 33% (76) 16% (38) 10% (24) 231#1 Issue: Medicare / Social Security 5% (12) 17% (39) 40% (90) 30% (68) 8% (17) 227#1 Issue: Women’s Issues 3% (4) 12% (16) 34% (43) 31% (39) 19% (23) 125#1 Issue: Education 13% (8) 29% (17) 18% (11) 30% (18) 10% (6) 59#1 Issue: Energy 10% (11) 27% (29) 31% (33) 19% (21) 12% (13) 107#1 Issue: Other 4% (5) 17% (21) 33% (40) 36% (44) 10% (12) 1222020 Vote: Joe Biden 7% (70) 30% (288) 38% (362) 17% (161) 7% (65) 9462020 Vote: Donald Trump 2% (21) 9% (79) 31% (264) 49% (426) 9% (74) 8642020 Vote: Didn’t Vote 3% (4) 11% (16) 26% (39) 34% (52) 27% (41) 1532018 House Vote: Democrat 8% (62) 30% (234) 38% (291) 18% (137) 6% (44) 7692018 House Vote: Republican 3% (18) 11% (74) 31% (219) 51% (355) 5% (35) 7022016 Vote: Hillary Clinton 9% (61) 30% (208) 40% (273) 16% (111) 5% (32) 6852016 Vote: Donald Trump 2% (18) 11% (91) 30% (243) 50% (400) 6% (50) 8022016 Vote: Other — (0) 16% (14) 36% (30) 39% (32) 9% (8) 842016 Vote: Didn’t Vote 4% (16) 17% (72) 30% (125) 26% (111) 23% (98) 423Voted in 2014: Yes 5% (70) 20% (271) 34% (448) 36% (477) 5% (69) 1335Voted in 2014: No 4% (26) 17% (115) 34% (227) 27% (176) 18% (119) 663
Continued on next page
Page 93
National Tracking Poll #2110084, October, 2021
93
Table POL4_2
Table POL4_2: How would you rate each of the following on their handling of the coronavirus?Congress
Demographic Excellent Good Just Fair PoorDon’t Know /No Opinion Total N
Registered Voters 5% (95) 19% (387) 34% (674) 33% (654) 9% (188) 19984-Region: Northeast 5% (19) 22% (78) 37% (129) 25% (89) 11% (38) 3534-Region: Midwest 4% (18) 16% (73) 33% (145) 38% (169) 9% (40) 4444-Region: South 4% (33) 17% (125) 34% (254) 36% (266) 9% (67) 7464-Region: West 6% (26) 24% (111) 32% (146) 29% (130) 9% (43) 455Party: Democrat/Leans Democrat 8% (73) 31% (279) 38% (349) 15% (140) 8% (74) 914Party: Republican/Leans Republican 3% (21) 9% (76) 32% (262) 48% (385) 8% (65) 808Note: Row proportions may total to larger than one-hundred percent due to rounding. For more information visit MorningConsultIntelligence.com.
Page 94
94
Morning ConsultTable POL4_3
Table POL4_3: How would you rate each of the following on their handling of the coronavirus?Congressional Democrats
Demographic Excellent Good Just Fair PoorDon’t Know /No Opinion Total N
Registered Voters 13% (253) 25% (501) 19% (381) 35% (709) 8% (154) 1998Gender: Male 15% (144) 25% (238) 18% (172) 36% (342) 5% (45) 942Gender: Female 10% (109) 25% (263) 20% (209) 35% (367) 10% (109) 1056Age: 18-34 15% (79) 23% (116) 21% (109) 25% (131) 16% (80) 514Age: 35-44 17% (51) 27% (81) 20% (62) 29% (88) 8% (24) 307Age: 45-64 9% (59) 27% (184) 19% (127) 41% (277) 5% (32) 679Age: 65+ 13% (64) 24% (120) 17% (83) 43% (213) 4% (17) 497GenZers: 1997-2012 12% (20) 19% (33) 25% (42) 18% (30) 27% (45) 170Millennials: 1981-1996 18% (100) 25% (138) 19% (104) 28% (156) 10% (54) 551GenXers: 1965-1980 7% (32) 28% (133) 21% (99) 38% (178) 6% (27) 469Baby Boomers: 1946-1964 12% (89) 25% (185) 16% (118) 43% (316) 3% (24) 732PID: Dem (no lean) 27% (213) 46% (354) 15% (117) 5% (42) 7% (51) 777PID: Ind (no lean) 5% (24) 20% (106) 24% (128) 38% (202) 13% (69) 528PID: Rep (no lean) 2% (16) 6% (42) 20% (137) 67% (465) 5% (34) 693PID/Gender: DemMen 33% (115) 46% (161) 13% (46) 4% (15) 4% (15) 352PID/Gender: DemWomen 23% (98) 45% (193) 17% (71) 6% (26) 9% (36) 425PID/Gender: Ind Men 5% (14) 20% (55) 26% (71) 42% (118) 8% (22) 280PID/Gender: Ind Women 4% (10) 20% (51) 23% (56) 34% (84) 19% (47) 248PID/Gender: Rep Men 5% (15) 7% (22) 18% (55) 68% (209) 3% (8) 310PID/Gender: Rep Women — (1) 5% (19) 21% (82) 67% (256) 7% (25) 384Ideo: Liberal (1-3) 26% (148) 42% (240) 19% (106) 8% (47) 4% (25) 566Ideo: Moderate (4) 11% (64) 34% (189) 26% (146) 21% (115) 8% (46) 560Ideo: Conservative (5-7) 5% (33) 7% (55) 16% (115) 68% (500) 4% (28) 730Educ: < College 11% (128) 22% (270) 18% (213) 39% (474) 10% (122) 1206Educ: Bachelors degree 14% (72) 27% (134) 21% (106) 33% (167) 4% (22) 501Educ: Post-grad 18% (53) 34% (98) 21% (62) 23% (68) 3% (10) 290Income: Under 50k 12% (102) 24% (208) 19% (168) 34% (297) 11% (98) 873Income: 50k-100k 13% (92) 23% (169) 18% (128) 41% (296) 6% (43) 728Income: 100k+ 15% (59) 31% (124) 21% (85) 29% (116) 3% (13) 398Ethnicity: White 12% (180) 23% (358) 19% (293) 39% (600) 7% (113) 1544Ethnicity: Hispanic 12% (26) 30% (66) 17% (38) 27% (60) 15% (33) 222
Continued on next page
Page 95
National Tracking Poll #2110084, October, 2021
95
Table POL4_3
Table POL4_3: How would you rate each of the following on their handling of the coronavirus?Congressional Democrats
Demographic Excellent Good Just Fair PoorDon’t Know /No Opinion Total N
Registered Voters 13% (253) 25% (501) 19% (381) 35% (709) 8% (154) 1998Ethnicity: Black 20% (50) 37% (93) 19% (49) 15% (38) 9% (23) 253Ethnicity: Other 12% (23) 25% (50) 19% (39) 35% (71) 9% (18) 201All Christian 13% (140) 23% (241) 18% (190) 40% (414) 5% (57) 1041All Non-Christian 19% (20) 38% (40) 17% (18) 23% (25) 3% (3) 107Atheist 13% (10) 45% (35) 14% (11) 23% (18) 5% (4) 78Agnostic/Nothing in particular 11% (53) 24% (114) 24% (115) 29% (141) 12% (57) 480Something Else 10% (30) 24% (71) 16% (47) 38% (112) 11% (33) 293Religious Non-Protestant/Catholic 16% (21) 33% (42) 18% (24) 28% (36) 5% (6) 129Evangelical 12% (59) 20% (99) 13% (66) 45% (222) 10% (52) 499Non-Evangelical 12% (98) 26% (208) 20% (162) 37% (288) 4% (34) 790Community: Urban 22% (106) 30% (144) 20% (97) 20% (97) 9% (42) 487Community: Suburban 11% (110) 27% (279) 20% (209) 36% (372) 7% (72) 1041Community: Rural 8% (36) 17% (78) 16% (75) 51% (240) 9% (40) 469Employ: Private Sector 14% (93) 26% (179) 21% (141) 33% (223) 7% (48) 684Employ: Government 16% (18) 35% (39) 16% (18) 24% (27) 9% (11) 112Employ: Self-Employed 15% (27) 17% (30) 23% (42) 36% (66) 9% (17) 183Employ: Homemaker 9% (9) 18% (19) 26% (27) 38% (39) 9% (10) 104Employ: Student 11% (7) 28% (19) 29% (19) 18% (12) 14% (9) 67Employ: Retired 13% (71) 25% (131) 14% (76) 46% (244) 2% (12) 534Employ: Unemployed 10% (20) 26% (50) 21% (40) 26% (50) 16% (30) 191Employ: Other 7% (9) 27% (34) 14% (18) 38% (47) 13% (16) 124Military HH: Yes 12% (38) 23% (71) 16% (50) 45% (141) 5% (16) 315Military HH: No 13% (215) 26% (430) 20% (331) 34% (568) 8% (138) 1683RD/WT: Right Direction 28% (215) 45% (343) 16% (122) 4% (28) 6% (49) 757RD/WT: Wrong Track 3% (38) 13% (158) 21% (259) 55% (681) 8% (105) 1241Biden Job Approve 27% (239) 47% (424) 18% (162) 3% (30) 5% (44) 899Biden Job Disapprove 1% (14) 7% (73) 20% (209) 65% (670) 7% (72) 1039
Continued on next page
Page 96
96
Morning ConsultTable POL4_3
Table POL4_3: How would you rate each of the following on their handling of the coronavirus?Congressional Democrats
Demographic Excellent Good Just Fair PoorDon’t Know /No Opinion Total N
Registered Voters 13% (253) 25% (501) 19% (381) 35% (709) 8% (154) 1998Biden Job Strongly Approve 45% (187) 42% (174) 10% (43) 1% (6) 2% (9) 418Biden Job Somewhat Approve 11% (52) 52% (250) 25% (119) 5% (25) 7% (35) 481Biden Job Somewhat Disapprove 1% (4) 20% (50) 43% (108) 25% (63) 10% (26) 250Biden Job Strongly Disapprove 1% (10) 3% (23) 13% (101) 77% (608) 6% (46) 788Favorable of Biden 26% (246) 46% (427) 18% (166) 4% (34) 6% (55) 927Unfavorable of Biden 1% (5) 7% (72) 20% (202) 66% (668) 7% (72) 1019Very Favorable of Biden 45% (215) 43% (203) 8% (37) 2% (12) 2% (9) 476Somewhat Favorable of Biden 7% (31) 50% (224) 29% (129) 5% (22) 10% (45) 451Somewhat Unfavorable of Biden 1% (2) 20% (41) 41% (85) 29% (59) 9% (19) 207Very Unfavorable of Biden — (3) 4% (31) 14% (116) 75% (609) 7% (53) 812#1 Issue: Economy 8% (65) 22% (167) 22% (171) 39% (302) 8% (64) 768#1 Issue: Security 6% (20) 12% (43) 16% (57) 62% (225) 4% (15) 360#1 Issue: Health Care 22% (50) 36% (83) 19% (43) 13% (31) 10% (23) 231#1 Issue: Medicare / Social Security 19% (43) 32% (71) 16% (36) 27% (62) 6% (15) 227#1 Issue: Women’s Issues 16% (19) 33% (42) 23% (29) 16% (20) 12% (15) 125#1 Issue: Education 29% (17) 30% (18) 14% (8) 16% (10) 10% (6) 59#1 Issue: Energy 21% (23) 37% (40) 15% (16) 19% (20) 8% (9) 107#1 Issue: Other 12% (15) 30% (37) 18% (21) 34% (41) 7% (8) 1222020 Vote: Joe Biden 24% (223) 45% (425) 20% (187) 6% (57) 6% (54) 9462020 Vote: Donald Trump 2% (18) 6% (55) 17% (150) 68% (583) 7% (58) 8642020 Vote: Didn’t Vote 7% (11) 12% (19) 22% (33) 35% (53) 24% (37) 1532018 House Vote: Democrat 25% (192) 44% (339) 18% (136) 8% (64) 5% (37) 7692018 House Vote: Republican 3% (18) 8% (56) 19% (134) 68% (477) 2% (16) 7022016 Vote: Hillary Clinton 27% (188) 48% (326) 15% (103) 7% (48) 3% (21) 6852016 Vote: Donald Trump 3% (24) 9% (69) 19% (151) 65% (519) 5% (40) 8022016 Vote: Other 3% (3) 16% (14) 40% (34) 34% (29) 6% (5) 842016 Vote: Didn’t Vote 9% (36) 22% (93) 22% (93) 26% (112) 21% (88) 423Voted in 2014: Yes 15% (197) 26% (341) 18% (236) 38% (513) 4% (49) 1335Voted in 2014: No 8% (56) 24% (160) 22% (145) 30% (197) 16% (105) 663
Continued on next page
Page 97
National Tracking Poll #2110084, October, 2021
97
Table POL4_3
Table POL4_3: How would you rate each of the following on their handling of the coronavirus?Congressional Democrats
Demographic Excellent Good Just Fair PoorDon’t Know /No Opinion Total N
Registered Voters 13% (253) 25% (501) 19% (381) 35% (709) 8% (154) 19984-Region: Northeast 13% (46) 27% (96) 22% (76) 31% (109) 8% (27) 3534-Region: Midwest 15% (65) 21% (94) 17% (76) 40% (177) 7% (33) 4444-Region: South 11% (81) 23% (169) 18% (137) 40% (298) 8% (60) 7464-Region: West 13% (61) 31% (143) 20% (92) 28% (126) 7% (33) 455Party: Democrat/Leans Democrat 25% (227) 45% (408) 18% (167) 6% (51) 7% (61) 914Party: Republican/Leans Republican 2% (17) 7% (56) 18% (150) 67% (538) 6% (48) 808Note: Row proportions may total to larger than one-hundred percent due to rounding. For more information visit MorningConsultIntelligence.com.
Page 98
98
Morning ConsultTable POL4_4
Table POL4_4: How would you rate each of the following on their handling of the coronavirus?Congressional Republicans
Demographic Excellent Good Just Fair PoorDon’t Know /No Opinion Total N
Registered Voters 6% (127) 16% (326) 28% (564) 41% (818) 8% (164) 1998Gender: Male 8% (75) 19% (177) 27% (254) 41% (389) 5% (47) 942Gender: Female 5% (52) 14% (149) 29% (309) 41% (429) 11% (117) 1056Age: 18-34 11% (54) 15% (77) 23% (121) 36% (185) 15% (77) 514Age: 35-44 8% (26) 17% (54) 26% (81) 39% (120) 9% (27) 307Age: 45-64 5% (35) 14% (94) 31% (212) 45% (304) 5% (34) 679Age: 65+ 2% (12) 20% (101) 30% (150) 42% (209) 5% (25) 497GenZers: 1997-2012 6% (10) 7% (12) 25% (42) 40% (67) 23% (38) 170Millennials: 1981-1996 12% (65) 20% (108) 24% (132) 34% (187) 11% (60) 551GenXers: 1965-1980 6% (29) 13% (63) 31% (147) 42% (199) 7% (32) 469Baby Boomers: 1946-1964 3% (20) 17% (124) 31% (227) 45% (333) 4% (28) 732PID: Dem (no lean) 4% (35) 8% (65) 20% (159) 60% (465) 7% (54) 777PID: Ind (no lean) 2% (11) 10% (51) 27% (143) 47% (249) 14% (74) 528PID: Rep (no lean) 12% (81) 30% (210) 38% (262) 15% (104) 5% (36) 693PID/Gender: DemMen 6% (20) 12% (44) 19% (65) 59% (208) 4% (15) 352PID/Gender: DemWomen 4% (15) 5% (21) 22% (93) 61% (257) 9% (38) 425PID/Gender: Ind Men 3% (9) 13% (36) 26% (73) 49% (136) 9% (26) 280PID/Gender: Ind Women 1% (3) 6% (15) 28% (70) 45% (113) 19% (48) 248PID/Gender: Rep Men 15% (47) 31% (97) 38% (117) 14% (44) 2% (5) 310PID/Gender: Rep Women 9% (34) 29% (113) 38% (146) 15% (59) 8% (31) 384Ideo: Liberal (1-3) 6% (33) 6% (36) 15% (84) 68% (383) 5% (30) 566Ideo: Moderate (4) 4% (20) 14% (81) 32% (179) 42% (234) 8% (45) 560Ideo: Conservative (5-7) 9% (65) 28% (205) 37% (268) 21% (157) 5% (35) 730Educ: < College 6% (69) 15% (181) 29% (355) 39% (472) 11% (129) 1206Educ: Bachelors degree 6% (32) 17% (87) 27% (135) 45% (226) 4% (21) 501Educ: Post-grad 9% (26) 20% (57) 25% (73) 41% (120) 5% (14) 290Income: Under 50k 7% (59) 15% (128) 29% (252) 38% (335) 11% (99) 873Income: 50k-100k 5% (38) 17% (122) 26% (189) 45% (331) 7% (48) 728Income: 100k+ 8% (31) 19% (76) 31% (123) 38% (152) 4% (16) 398Ethnicity: White 7% (103) 19% (296) 29% (455) 37% (577) 7% (113) 1544Ethnicity: Hispanic 4% (9) 13% (28) 26% (57) 47% (105) 11% (23) 222
Continued on next page
Page 99
National Tracking Poll #2110084, October, 2021
99
Table POL4_4
Table POL4_4: How would you rate each of the following on their handling of the coronavirus?Congressional Republicans
Demographic Excellent Good Just Fair PoorDon’t Know /No Opinion Total N
Registered Voters 6% (127) 16% (326) 28% (564) 41% (818) 8% (164) 1998Ethnicity: Black 6% (16) 4% (10) 22% (55) 55% (140) 12% (31) 253Ethnicity: Other 4% (8) 9% (19) 27% (54) 50% (100) 10% (20) 201All Christian 7% (69) 20% (210) 32% (328) 35% (369) 6% (66) 1041All Non-Christian 10% (11) 16% (17) 26% (28) 43% (46) 4% (5) 107Atheist 5% (4) 8% (6) 14% (11) 68% (53) 4% (3) 78Agnostic/Nothing in particular 5% (24) 13% (61) 23% (112) 47% (228) 11% (55) 480Something Else 7% (20) 11% (31) 29% (85) 42% (123) 12% (35) 293Religious Non-Protestant/Catholic 9% (11) 21% (26) 28% (36) 37% (48) 6% (8) 129Evangelical 9% (44) 21% (103) 34% (168) 28% (137) 9% (47) 499Non-Evangelical 5% (40) 16% (124) 29% (232) 44% (345) 6% (49) 790Community: Urban 11% (53) 16% (78) 24% (116) 39% (192) 10% (49) 487Community: Suburban 4% (42) 16% (170) 29% (304) 43% (449) 7% (77) 1041Community: Rural 7% (33) 17% (78) 31% (143) 38% (177) 8% (38) 469Employ: Private Sector 7% (50) 19% (130) 29% (195) 39% (264) 7% (44) 684Employ: Government 8% (9) 16% (18) 21% (24) 46% (52) 9% (10) 112Employ: Self-Employed 5% (10) 16% (29) 25% (46) 42% (77) 11% (21) 183Employ: Homemaker 8% (8) 13% (14) 27% (28) 36% (38) 16% (16) 104Employ: Student 1% (1) 6% (4) 29% (20) 48% (33) 15% (10) 67Employ: Retired 4% (20) 19% (102) 33% (175) 41% (220) 3% (16) 534Employ: Unemployed 5% (10) 7% (13) 28% (54) 44% (84) 15% (29) 191Employ: Other 16% (20) 12% (15) 17% (21) 41% (50) 14% (17) 124Military HH: Yes 4% (14) 23% (73) 25% (78) 42% (131) 6% (19) 315Military HH: No 7% (114) 15% (253) 29% (485) 41% (687) 9% (144) 1683RD/WT: Right Direction 9% (65) 12% (89) 20% (151) 53% (402) 7% (52) 757RD/WT: Wrong Track 5% (62) 19% (237) 33% (413) 34% (416) 9% (112) 1241Biden Job Approve 6% (52) 11% (96) 20% (184) 57% (515) 6% (52) 899Biden Job Disapprove 7% (75) 22% (228) 36% (370) 27% (282) 8% (83) 1039
Continued on next page
Page 100
100
Morning ConsultTable POL4_4
Table POL4_4: How would you rate each of the following on their handling of the coronavirus?Congressional Republicans
Demographic Excellent Good Just Fair PoorDon’t Know /No Opinion Total N
Registered Voters 6% (127) 16% (326) 28% (564) 41% (818) 8% (164) 1998Biden Job Strongly Approve 8% (33) 10% (41) 18% (73) 61% (254) 4% (18) 418Biden Job Somewhat Approve 4% (19) 12% (56) 23% (110) 54% (262) 7% (34) 481Biden Job Somewhat Disapprove 4% (10) 9% (22) 32% (81) 43% (108) 12% (29) 250Biden Job Strongly Disapprove 8% (66) 26% (206) 37% (289) 22% (174) 7% (54) 788Favorable of Biden 6% (51) 10% (90) 20% (190) 58% (537) 6% (59) 927Unfavorable of Biden 7% (75) 23% (230) 36% (366) 26% (269) 8% (78) 1019Very Favorable of Biden 9% (41) 9% (42) 17% (82) 61% (291) 4% (20) 476Somewhat Favorable of Biden 2% (10) 11% (48) 24% (108) 55% (246) 9% (39) 451Somewhat Unfavorable of Biden 4% (9) 12% (24) 34% (70) 39% (81) 11% (23) 207Very Unfavorable of Biden 8% (66) 25% (206) 36% (296) 23% (188) 7% (55) 812#1 Issue: Economy 5% (37) 18% (139) 34% (262) 34% (259) 9% (72) 768#1 Issue: Security 9% (33) 27% (95) 35% (127) 23% (82) 6% (22) 360#1 Issue: Health Care 6% (15) 14% (32) 15% (34) 55% (128) 10% (23) 231#1 Issue: Medicare / Social Security 9% (20) 9% (20) 22% (50) 54% (122) 6% (14) 227#1 Issue: Women’s Issues 4% (5) 4% (5) 18% (22) 65% (81) 9% (11) 125#1 Issue: Education 15% (9) 12% (7) 14% (8) 47% (28) 12% (7) 59#1 Issue: Energy 8% (8) 17% (18) 27% (29) 44% (47) 5% (5) 107#1 Issue: Other 1% (1) 7% (9) 26% (32) 59% (72) 7% (9) 1222020 Vote: Joe Biden 4% (38) 8% (77) 20% (191) 61% (578) 7% (62) 9462020 Vote: Donald Trump 10% (85) 27% (237) 37% (323) 19% (161) 7% (58) 8642020 Vote: Didn’t Vote 3% (5) 6% (10) 26% (40) 41% (63) 24% (36) 1532018 House Vote: Democrat 4% (30) 7% (55) 19% (150) 63% (487) 6% (48) 7692018 House Vote: Republican 11% (76) 29% (206) 38% (269) 19% (130) 3% (21) 7022016 Vote: Hillary Clinton 4% (28) 8% (53) 19% (129) 65% (445) 4% (29) 6852016 Vote: Donald Trump 9% (76) 26% (212) 38% (305) 21% (171) 5% (38) 8022016 Vote: Other 3% (2) 11% (9) 30% (25) 50% (42) 6% (5) 842016 Vote: Didn’t Vote 5% (21) 12% (49) 24% (104) 37% (158) 22% (92) 423Voted in 2014: Yes 6% (80) 18% (243) 29% (381) 42% (566) 5% (66) 1335Voted in 2014: No 7% (48) 12% (83) 28% (182) 38% (252) 15% (98) 663
Continued on next page
Page 101
National Tracking Poll #2110084, October, 2021
101
Table POL4_4
Table POL4_4: How would you rate each of the following on their handling of the coronavirus?Congressional Republicans
Demographic Excellent Good Just Fair PoorDon’t Know /No Opinion Total N
Registered Voters 6% (127) 16% (326) 28% (564) 41% (818) 8% (164) 19984-Region: Northeast 5% (17) 16% (56) 28% (100) 41% (144) 10% (36) 3534-Region: Midwest 5% (22) 16% (69) 27% (121) 45% (202) 7% (30) 4444-Region: South 7% (55) 18% (132) 30% (224) 37% (277) 8% (59) 7464-Region: West 7% (33) 15% (69) 26% (118) 43% (195) 9% (40) 455Party: Democrat/Leans Democrat 4% (39) 8% (72) 20% (187) 60% (552) 7% (64) 914Party: Republican/Leans Republican 11% (86) 28% (228) 38% (304) 17% (135) 7% (55) 808Note: Row proportions may total to larger than one-hundred percent due to rounding. For more information visit MorningConsultIntelligence.com.
Page 102
102
Morning ConsultTable POL4_5
Table POL4_5: How would you rate each of the following on their handling of the coronavirus?The World Health Organization (WHO)
Demographic Excellent Good Just Fair PoorDon’t Know /No Opinion Total N
Registered Voters 15% (303) 29% (571) 20% (395) 27% (542) 9% (186) 1998Gender: Male 17% (160) 29% (274) 19% (175) 29% (275) 6% (58) 942Gender: Female 14% (144) 28% (297) 21% (220) 25% (267) 12% (128) 1056Age: 18-34 22% (113) 27% (140) 17% (86) 17% (86) 18% (91) 514Age: 35-44 17% (52) 32% (99) 19% (57) 23% (70) 9% (29) 307Age: 45-64 11% (77) 26% (179) 23% (158) 33% (224) 6% (41) 679Age: 65+ 12% (62) 31% (153) 19% (94) 33% (162) 5% (26) 497GenZers: 1997-2012 22% (37) 24% (40) 15% (26) 9% (16) 30% (51) 170Millennials: 1981-1996 20% (111) 31% (173) 16% (90) 21% (117) 11% (60) 551GenXers: 1965-1980 11% (53) 27% (128) 20% (96) 32% (152) 8% (40) 469Baby Boomers: 1946-1964 13% (92) 29% (211) 23% (167) 32% (231) 4% (31) 732PID: Dem (no lean) 29% (227) 41% (319) 15% (117) 7% (55) 7% (58) 777PID: Ind (no lean) 9% (50) 29% (151) 20% (107) 27% (145) 14% (75) 528PID: Rep (no lean) 4% (27) 15% (101) 25% (170) 49% (342) 8% (53) 693PID/Gender: DemMen 32% (112) 41% (145) 14% (50) 7% (26) 6% (19) 352PID/Gender: DemWomen 27% (115) 41% (175) 16% (68) 7% (29) 9% (38) 425PID/Gender: Ind Men 9% (26) 30% (83) 21% (58) 32% (88) 8% (24) 280PID/Gender: Ind Women 9% (23) 27% (68) 20% (49) 23% (56) 21% (51) 248PID/Gender: Rep Men 7% (21) 15% (46) 22% (67) 52% (161) 5% (15) 310PID/Gender: Rep Women 1% (6) 14% (55) 27% (103) 47% (181) 10% (38) 384Ideo: Liberal (1-3) 31% (178) 40% (225) 16% (93) 7% (40) 5% (30) 566Ideo: Moderate (4) 15% (86) 39% (217) 23% (129) 15% (85) 7% (42) 560Ideo: Conservative (5-7) 4% (30) 16% (114) 21% (156) 52% (380) 7% (50) 730Educ: < College 14% (168) 25% (305) 19% (227) 30% (364) 12% (143) 1206Educ: Bachelors degree 16% (80) 33% (165) 20% (102) 24% (123) 6% (32) 501Educ: Post-grad 19% (55) 35% (102) 23% (66) 19% (56) 4% (12) 290Income: Under 50k 15% (127) 28% (241) 20% (176) 25% (218) 13% (111) 873Income: 50k-100k 15% (108) 27% (198) 20% (144) 30% (219) 8% (59) 728Income: 100k+ 17% (69) 33% (132) 19% (75) 27% (105) 4% (16) 398Ethnicity: White 15% (227) 28% (428) 20% (307) 29% (448) 9% (133) 1544Ethnicity: Hispanic 11% (25) 34% (75) 15% (33) 25% (56) 15% (33) 222
Continued on next page
Page 103
National Tracking Poll #2110084, October, 2021
103
Table POL4_5
Table POL4_5: How would you rate each of the following on their handling of the coronavirus?The World Health Organization (WHO)
Demographic Excellent Good Just Fair PoorDon’t Know /No Opinion Total N
Registered Voters 15% (303) 29% (571) 20% (395) 27% (542) 9% (186) 1998Ethnicity: Black 19% (49) 35% (89) 18% (45) 14% (37) 13% (34) 253Ethnicity: Other 14% (27) 27% (54) 21% (43) 29% (58) 9% (19) 201All Christian 15% (157) 29% (302) 19% (200) 30% (317) 6% (65) 1041All Non-Christian 20% (21) 37% (39) 20% (21) 18% (19) 5% (5) 107Atheist 22% (17) 40% (31) 19% (14) 13% (10) 6% (5) 78Agnostic/Nothing in particular 16% (75) 23% (112) 21% (99) 25% (119) 16% (74) 480Something Else 11% (33) 30% (87) 20% (60) 26% (77) 13% (37) 293Religious Non-Protestant/Catholic 17% (22) 37% (48) 21% (27) 19% (24) 6% (8) 129Evangelical 12% (62) 28% (138) 19% (96) 31% (154) 10% (48) 499Non-Evangelical 15% (121) 29% (233) 20% (155) 29% (232) 6% (49) 790Community: Urban 20% (100) 36% (174) 20% (98) 16% (79) 8% (37) 487Community: Suburban 14% (141) 29% (305) 20% (206) 28% (288) 10% (101) 1041Community: Rural 13% (62) 20% (93) 19% (91) 37% (175) 10% (48) 469Employ: Private Sector 16% (107) 30% (208) 18% (121) 27% (187) 9% (61) 684Employ: Government 16% (18) 31% (35) 17% (19) 19% (22) 16% (18) 112Employ: Self-Employed 14% (26) 25% (46) 23% (41) 29% (53) 9% (16) 183Employ: Homemaker 12% (12) 28% (29) 19% (20) 27% (28) 14% (14) 104Employ: Student 24% (16) 29% (20) 17% (11) 16% (11) 15% (10) 67Employ: Retired 14% (75) 27% (142) 23% (123) 33% (175) 3% (18) 534Employ: Unemployed 19% (36) 30% (57) 18% (34) 17% (33) 16% (31) 191Employ: Other 10% (13) 27% (34) 20% (25) 28% (34) 14% (17) 124Military HH: Yes 13% (41) 30% (94) 20% (64) 31% (97) 6% (20) 315Military HH: No 16% (262) 28% (478) 20% (331) 26% (446) 10% (167) 1683RD/WT: Right Direction 31% (238) 43% (323) 14% (103) 5% (35) 8% (58) 757RD/WT: Wrong Track 5% (66) 20% (249) 24% (292) 41% (507) 10% (128) 1241Biden Job Approve 30% (266) 45% (403) 16% (142) 4% (38) 6% (50) 899Biden Job Disapprove 3% (36) 16% (164) 23% (241) 48% (497) 10% (100) 1039
Continued on next page
Page 104
104
Morning ConsultTable POL4_5
Table POL4_5: How would you rate each of the following on their handling of the coronavirus?The World Health Organization (WHO)
Demographic Excellent Good Just Fair PoorDon’t Know /No Opinion Total N
Registered Voters 15% (303) 29% (571) 20% (395) 27% (542) 9% (186) 1998Biden Job Strongly Approve 40% (168) 42% (177) 12% (51) 2% (8) 3% (14) 418Biden Job Somewhat Approve 21% (99) 47% (225) 19% (91) 6% (30) 7% (36) 481Biden Job Somewhat Disapprove 8% (20) 32% (80) 32% (81) 18% (46) 10% (24) 250Biden Job Strongly Disapprove 2% (17) 11% (84) 20% (161) 57% (451) 10% (76) 788Favorable of Biden 29% (269) 44% (410) 16% (152) 4% (37) 6% (59) 927Unfavorable of Biden 3% (31) 15% (153) 23% (236) 49% (497) 10% (102) 1019Very Favorable of Biden 40% (191) 43% (203) 12% (55) 2% (7) 4% (19) 476Somewhat Favorable of Biden 17% (78) 46% (207) 21% (97) 7% (30) 9% (40) 451Somewhat Unfavorable of Biden 8% (16) 32% (66) 32% (67) 19% (40) 9% (19) 207Very Unfavorable of Biden 2% (15) 11% (86) 21% (170) 56% (457) 10% (83) 812#1 Issue: Economy 10% (74) 27% (210) 24% (185) 30% (229) 9% (70) 768#1 Issue: Security 10% (37) 15% (54) 17% (62) 50% (181) 7% (25) 360#1 Issue: Health Care 23% (53) 38% (89) 15% (36) 10% (24) 13% (30) 231#1 Issue: Medicare / Social Security 15% (35) 39% (89) 20% (44) 20% (46) 5% (12) 227#1 Issue: Women’s Issues 22% (28) 32% (40) 25% (31) 10% (12) 11% (14) 125#1 Issue: Education 30% (18) 35% (21) 12% (7) 10% (6) 13% (8) 59#1 Issue: Energy 34% (36) 37% (40) 7% (7) 13% (14) 9% (10) 107#1 Issue: Other 18% (23) 24% (29) 19% (23) 24% (30) 15% (18) 1222020 Vote: Joe Biden 27% (260) 42% (400) 17% (160) 6% (56) 7% (70) 9462020 Vote: Donald Trump 3% (24) 15% (129) 22% (192) 51% (441) 9% (78) 8642020 Vote: Didn’t Vote 10% (16) 22% (34) 20% (31) 24% (37) 23% (35) 1532018 House Vote: Democrat 26% (203) 43% (329) 16% (121) 9% (71) 6% (46) 7692018 House Vote: Republican 4% (31) 15% (106) 25% (175) 51% (356) 5% (34) 7022016 Vote: Hillary Clinton 29% (200) 43% (295) 16% (108) 7% (48) 5% (34) 6852016 Vote: Donald Trump 5% (41) 16% (125) 23% (183) 49% (396) 7% (57) 8022016 Vote: Other 7% (6) 28% (23) 33% (28) 21% (18) 10% (9) 842016 Vote: Didn’t Vote 13% (55) 30% (127) 18% (74) 19% (80) 20% (86) 423Voted in 2014: Yes 16% (213) 29% (381) 20% (273) 30% (401) 5% (66) 1335Voted in 2014: No 14% (90) 29% (190) 18% (122) 21% (141) 18% (120) 663
Continued on next page
Page 105
National Tracking Poll #2110084, October, 2021
105
Table POL4_5
Table POL4_5: How would you rate each of the following on their handling of the coronavirus?The World Health Organization (WHO)
Demographic Excellent Good Just Fair PoorDon’t Know /No Opinion Total N
Registered Voters 15% (303) 29% (571) 20% (395) 27% (542) 9% (186) 19984-Region: Northeast 15% (54) 36% (129) 17% (61) 24% (83) 7% (26) 3534-Region: Midwest 18% (81) 22% (100) 19% (83) 31% (139) 9% (42) 4444-Region: South 14% (103) 25% (189) 21% (157) 29% (215) 11% (81) 7464-Region: West 14% (66) 34% (154) 21% (94) 23% (105) 8% (37) 455Party: Democrat/Leans Democrat 27% (251) 43% (389) 15% (138) 7% (62) 8% (75) 914Party: Republican/Leans Republican 4% (31) 15% (120) 24% (198) 48% (389) 9% (70) 808Note: Row proportions may total to larger than one-hundred percent due to rounding. For more information visit MorningConsultIntelligence.com.
Page 106
106
Morning ConsultTable POL4_6
Table POL4_6: How would you rate each of the following on their handling of the coronavirus?The Centers for Disease Control and Prevention (CDC)
Demographic Excellent Good Just Fair PoorDon’t Know /No Opinion Total N
Registered Voters 21% (417) 30% (606) 20% (403) 23% (459) 6% (113) 1998Gender: Male 23% (212) 31% (296) 18% (171) 24% (223) 4% (40) 942Gender: Female 19% (205) 29% (310) 22% (233) 22% (236) 7% (73) 1056Age: 18-34 25% (130) 27% (141) 19% (96) 17% (87) 12% (60) 514Age: 35-44 22% (67) 32% (98) 20% (61) 21% (64) 6% (17) 307Age: 45-64 17% (115) 30% (201) 23% (157) 27% (186) 3% (20) 679Age: 65+ 21% (105) 33% (166) 18% (90) 24% (121) 3% (15) 497GenZers: 1997-2012 27% (46) 24% (41) 19% (33) 12% (20) 18% (30) 170Millennials: 1981-1996 24% (132) 31% (169) 18% (100) 20% (108) 8% (42) 551GenXers: 1965-1980 16% (74) 29% (135) 22% (103) 29% (137) 4% (21) 469Baby Boomers: 1946-1964 21% (151) 32% (237) 21% (150) 24% (178) 2% (16) 732PID: Dem (no lean) 38% (297) 39% (303) 14% (107) 5% (37) 4% (32) 777PID: Ind (no lean) 14% (75) 30% (158) 20% (105) 26% (135) 10% (55) 528PID: Rep (no lean) 6% (44) 21% (144) 28% (192) 41% (287) 4% (26) 693PID/Gender: DemMen 41% (143) 40% (140) 12% (41) 4% (15) 4% (13) 352PID/Gender: DemWomen 36% (154) 38% (163) 15% (66) 5% (22) 5% (19) 425PID/Gender: Ind Men 15% (43) 31% (88) 19% (54) 28% (78) 6% (18) 280PID/Gender: Ind Women 13% (32) 28% (70) 21% (51) 23% (57) 15% (37) 248PID/Gender: Rep Men 9% (26) 22% (68) 25% (76) 42% (130) 3% (9) 310PID/Gender: Rep Women 5% (18) 20% (76) 30% (116) 41% (157) 4% (17) 384Ideo: Liberal (1-3) 36% (206) 40% (229) 14% (76) 6% (33) 4% (21) 566Ideo: Moderate (4) 23% (131) 38% (215) 22% (120) 14% (76) 3% (18) 560Ideo: Conservative (5-7) 9% (65) 19% (139) 25% (181) 44% (318) 4% (28) 730Educ: < College 19% (228) 27% (328) 21% (250) 26% (315) 7% (86) 1206Educ: Bachelors degree 22% (110) 34% (170) 19% (98) 21% (106) 4% (18) 501Educ: Post-grad 27% (79) 37% (108) 19% (56) 13% (38) 3% (9) 290Income: Under 50k 20% (174) 29% (249) 20% (173) 23% (200) 9% (78) 873Income: 50k-100k 21% (150) 30% (219) 21% (152) 25% (179) 4% (27) 728Income: 100k+ 23% (93) 35% (138) 20% (78) 20% (81) 2% (8) 398Ethnicity: White 19% (290) 31% (472) 21% (323) 24% (377) 5% (82) 1544Ethnicity: Hispanic 17% (38) 29% (63) 26% (57) 22% (49) 7% (15) 222
Continued on next page
Page 107
National Tracking Poll #2110084, October, 2021
107
Table POL4_6
Table POL4_6: How would you rate each of the following on their handling of the coronavirus?The Centers for Disease Control and Prevention (CDC)
Demographic Excellent Good Just Fair PoorDon’t Know /No Opinion Total N
Registered Voters 21% (417) 30% (606) 20% (403) 23% (459) 6% (113) 1998Ethnicity: Black 34% (86) 32% (80) 14% (35) 13% (34) 7% (18) 253Ethnicity: Other 21% (42) 27% (53) 23% (45) 24% (48) 6% (12) 201All Christian 20% (212) 31% (323) 22% (226) 23% (236) 4% (45) 1041All Non-Christian 29% (31) 40% (43) 15% (16) 13% (14) 1% (2) 107Atheist 23% (18) 39% (30) 17% (13) 15% (12) 6% (5) 78Agnostic/Nothing in particular 21% (99) 28% (133) 20% (96) 23% (111) 8% (41) 480Something Else 19% (57) 26% (78) 18% (52) 29% (86) 7% (21) 293Religious Non-Protestant/Catholic 27% (34) 41% (52) 15% (20) 14% (18) 3% (4) 129Evangelical 21% (103) 28% (139) 20% (99) 26% (128) 6% (30) 499Non-Evangelical 20% (156) 31% (242) 22% (174) 24% (187) 4% (32) 790Community: Urban 30% (144) 32% (154) 19% (92) 14% (69) 6% (28) 487Community: Suburban 19% (198) 33% (345) 20% (210) 23% (238) 5% (50) 1041Community: Rural 16% (75) 23% (106) 21% (101) 32% (152) 8% (36) 469Employ: Private Sector 22% (150) 29% (198) 22% (148) 22% (153) 5% (35) 684Employ: Government 19% (21) 41% (46) 15% (17) 17% (19) 8% (9) 112Employ: Self-Employed 18% (32) 30% (55) 20% (36) 28% (51) 5% (9) 183Employ: Homemaker 13% (14) 28% (29) 20% (21) 29% (30) 9% (10) 104Employ: Student 30% (20) 24% (16) 22% (15) 11% (7) 13% (9) 67Employ: Retired 22% (118) 31% (164) 20% (109) 24% (129) 2% (13) 534Employ: Unemployed 22% (42) 33% (62) 20% (38) 18% (35) 7% (14) 191Employ: Other 16% (19) 28% (35) 16% (20) 28% (35) 12% (15) 124Military HH: Yes 17% (55) 33% (103) 18% (57) 26% (81) 6% (19) 315Military HH: No 22% (362) 30% (503) 21% (346) 22% (379) 6% (94) 1683RD/WT: Right Direction 41% (308) 41% (311) 11% (81) 3% (21) 5% (38) 757RD/WT: Wrong Track 9% (109) 24% (295) 26% (323) 35% (439) 6% (75) 1241Biden Job Approve 40% (356) 42% (378) 13% (113) 3% (23) 3% (29) 899Biden Job Disapprove 6% (60) 21% (221) 27% (279) 41% (426) 5% (53) 1039
Continued on next page
Page 108
108
Morning ConsultTable POL4_6
Table POL4_6: How would you rate each of the following on their handling of the coronavirus?The Centers for Disease Control and Prevention (CDC)
Demographic Excellent Good Just Fair PoorDon’t Know /No Opinion Total N
Registered Voters 21% (417) 30% (606) 20% (403) 23% (459) 6% (113) 1998Biden Job Strongly Approve 49% (204) 41% (171) 8% (33) 1% (3) 2% (8) 418Biden Job Somewhat Approve 32% (152) 43% (207) 17% (80) 4% (20) 5% (22) 481Biden Job Somewhat Disapprove 14% (36) 38% (94) 29% (72) 13% (33) 6% (15) 250Biden Job Strongly Disapprove 3% (24) 16% (127) 26% (207) 50% (393) 5% (38) 788Favorable of Biden 39% (358) 42% (391) 13% (118) 3% (28) 3% (32) 927Unfavorable of Biden 6% (57) 20% (206) 27% (280) 42% (423) 5% (53) 1019Very Favorable of Biden 51% (241) 39% (185) 7% (31) 2% (7) 2% (11) 476Somewhat Favorable of Biden 26% (117) 46% (206) 19% (87) 5% (21) 5% (21) 451Somewhat Unfavorable of Biden 14% (30) 37% (76) 32% (67) 12% (24) 5% (10) 207Very Unfavorable of Biden 3% (27) 16% (130) 26% (213) 49% (399) 5% (43) 812#1 Issue: Economy 16% (125) 28% (218) 24% (182) 26% (201) 6% (43) 768#1 Issue: Security 13% (47) 16% (56) 25% (91) 41% (147) 5% (17) 360#1 Issue: Health Care 26% (60) 44% (101) 12% (27) 10% (22) 8% (20) 231#1 Issue: Medicare / Social Security 27% (62) 40% (90) 16% (36) 12% (26) 5% (12) 227#1 Issue: Women’s Issues 29% (36) 30% (37) 25% (32) 9% (11) 7% (9) 125#1 Issue: Education 35% (21) 44% (26) 15% (9) 5% (3) 2% (1) 59#1 Issue: Energy 39% (42) 36% (38) 9% (9) 12% (13) 4% (5) 107#1 Issue: Other 20% (24) 31% (38) 14% (17) 30% (36) 5% (6) 1222020 Vote: Joe Biden 37% (348) 42% (395) 13% (119) 5% (44) 4% (41) 9462020 Vote: Donald Trump 5% (43) 20% (171) 28% (239) 43% (367) 5% (44) 8642020 Vote: Didn’t Vote 14% (21) 21% (32) 24% (37) 25% (38) 17% (26) 1532018 House Vote: Democrat 35% (269) 42% (327) 12% (95) 7% (56) 3% (23) 7692018 House Vote: Republican 7% (52) 21% (145) 27% (191) 42% (294) 3% (19) 7022016 Vote: Hillary Clinton 38% (261) 42% (288) 12% (84) 5% (33) 3% (18) 6852016 Vote: Donald Trump 8% (62) 22% (180) 25% (198) 42% (336) 3% (26) 8022016 Vote: Other 14% (12) 35% (30) 24% (20) 20% (17) 7% (6) 842016 Vote: Didn’t Vote 19% (79) 25% (107) 24% (100) 17% (73) 15% (64) 423Voted in 2014: Yes 22% (292) 32% (429) 19% (250) 24% (327) 3% (37) 1335Voted in 2014: No 19% (125) 27% (177) 23% (153) 20% (132) 11% (76) 663
Continued on next page
Page 109
National Tracking Poll #2110084, October, 2021
109
Table POL4_6
Table POL4_6: How would you rate each of the following on their handling of the coronavirus?The Centers for Disease Control and Prevention (CDC)
Demographic Excellent Good Just Fair PoorDon’t Know /No Opinion Total N
Registered Voters 21% (417) 30% (606) 20% (403) 23% (459) 6% (113) 19984-Region: Northeast 23% (81) 32% (114) 22% (78) 18% (63) 5% (18) 3534-Region: Midwest 21% (95) 26% (114) 17% (74) 30% (135) 6% (26) 4444-Region: South 18% (136) 32% (238) 21% (155) 23% (173) 6% (45) 7464-Region: West 23% (106) 31% (140) 21% (97) 19% (89) 5% (24) 455Party: Democrat/Leans Democrat 36% (331) 40% (363) 14% (131) 5% (48) 5% (42) 914Party: Republican/Leans Republican 7% (54) 21% (172) 27% (216) 41% (332) 4% (34) 808Note: Row proportions may total to larger than one-hundred percent due to rounding. For more information visit MorningConsultIntelligence.com.
Page 110
110
Morning ConsultTable POL4_7
Table POL4_7: How would you rate each of the following on their handling of the coronavirus?Your state’s governor
Demographic Excellent Good Just Fair PoorDon’t Know /No Opinion Total N
Registered Voters 20% (408) 29% (583) 16% (323) 28% (567) 6% (116) 1998Gender: Male 21% (196) 30% (285) 17% (161) 27% (259) 4% (41) 942Gender: Female 20% (213) 28% (298) 15% (162) 29% (308) 7% (75) 1056Age: 18-34 20% (105) 28% (145) 15% (78) 24% (122) 12% (64) 514Age: 35-44 21% (63) 25% (76) 19% (59) 29% (90) 6% (18) 307Age: 45-64 19% (129) 30% (207) 18% (121) 29% (196) 4% (26) 679Age: 65+ 22% (111) 31% (154) 13% (66) 32% (159) 1% (7) 497GenZers: 1997-2012 14% (24) 20% (34) 19% (32) 24% (41) 23% (39) 170Millennials: 1981-1996 23% (127) 29% (163) 16% (89) 24% (135) 7% (38) 551GenXers: 1965-1980 16% (73) 31% (145) 17% (78) 32% (148) 5% (25) 469Baby Boomers: 1946-1964 23% (171) 29% (215) 16% (115) 30% (219) 2% (13) 732PID: Dem (no lean) 30% (236) 30% (233) 14% (112) 20% (158) 5% (38) 777PID: Ind (no lean) 14% (73) 27% (140) 19% (100) 30% (160) 10% (55) 528PID: Rep (no lean) 14% (99) 30% (209) 16% (112) 36% (250) 3% (24) 693PID/Gender: DemMen 32% (111) 32% (114) 15% (53) 17% (61) 4% (13) 352PID/Gender: DemWomen 29% (125) 28% (120) 14% (60) 23% (96) 6% (25) 425PID/Gender: Ind Men 13% (38) 29% (80) 22% (61) 29% (83) 7% (19) 280PID/Gender: Ind Women 14% (36) 24% (60) 16% (39) 31% (78) 14% (36) 248PID/Gender: Rep Men 15% (47) 29% (91) 15% (48) 37% (115) 3% (9) 310PID/Gender: Rep Women 14% (52) 31% (118) 17% (64) 35% (135) 4% (15) 384Ideo: Liberal (1-3) 27% (155) 31% (173) 13% (71) 25% (141) 5% (26) 566Ideo: Moderate (4) 23% (130) 30% (170) 22% (122) 20% (113) 4% (25) 560Ideo: Conservative (5-7) 15% (109) 30% (220) 15% (109) 38% (276) 2% (16) 730Educ: < College 17% (208) 28% (336) 17% (202) 30% (364) 8% (97) 1206Educ: Bachelors degree 21% (108) 31% (157) 15% (78) 28% (143) 3% (16) 501Educ: Post-grad 32% (93) 31% (90) 15% (44) 21% (61) 1% (3) 290Income: Under 50k 18% (157) 26% (227) 18% (155) 29% (256) 9% (77) 873Income: 50k-100k 20% (146) 30% (216) 17% (121) 30% (218) 4% (27) 728Income: 100k+ 26% (105) 35% (140) 12% (48) 23% (93) 3% (12) 398Ethnicity: White 20% (307) 31% (474) 15% (230) 29% (453) 5% (80) 1544Ethnicity: Hispanic 16% (35) 27% (59) 19% (42) 28% (63) 11% (24) 222
Continued on next page
Page 111
National Tracking Poll #2110084, October, 2021
111
Table POL4_7
Table POL4_7: How would you rate each of the following on their handling of the coronavirus?Your state’s governor
Demographic Excellent Good Just Fair PoorDon’t Know /No Opinion Total N
Registered Voters 20% (408) 29% (583) 16% (323) 28% (567) 6% (116) 1998Ethnicity: Black 25% (63) 28% (70) 17% (42) 22% (57) 9% (22) 253Ethnicity: Other 19% (39) 19% (39) 26% (52) 29% (58) 7% (14) 201All Christian 22% (227) 32% (330) 15% (152) 28% (295) 4% (37) 1041All Non-Christian 24% (25) 35% (37) 8% (9) 30% (32) 3% (3) 107Atheist 24% (19) 29% (22) 19% (15) 26% (20) 2% (1) 78Agnostic/Nothing in particular 19% (91) 25% (120) 18% (87) 27% (130) 11% (51) 480Something Else 15% (45) 25% (73) 21% (61) 31% (90) 8% (24) 293Religious Non-Protestant/Catholic 22% (28) 37% (48) 8% (10) 29% (38) 4% (5) 129Evangelical 22% (110) 31% (156) 13% (63) 29% (142) 6% (28) 499Non-Evangelical 19% (151) 29% (226) 19% (147) 30% (235) 4% (30) 790Community: Urban 25% (123) 34% (167) 13% (65) 22% (106) 5% (27) 487Community: Suburban 20% (206) 28% (294) 18% (186) 29% (300) 5% (55) 1041Community: Rural 17% (79) 26% (122) 15% (72) 34% (162) 7% (34) 469Employ: Private Sector 21% (143) 32% (218) 17% (118) 26% (179) 4% (26) 684Employ: Government 27% (30) 38% (42) 13% (14) 17% (19) 5% (6) 112Employ: Self-Employed 16% (29) 30% (54) 18% (33) 30% (56) 6% (11) 183Employ: Homemaker 14% (14) 13% (13) 16% (17) 48% (50) 9% (9) 104Employ: Student 22% (15) 17% (12) 17% (11) 28% (19) 16% (11) 67Employ: Retired 25% (132) 27% (143) 15% (81) 31% (165) 2% (12) 534Employ: Unemployed 15% (29) 30% (57) 17% (33) 23% (43) 15% (28) 191Employ: Other 13% (16) 35% (43) 13% (16) 30% (37) 10% (12) 124Military HH: Yes 19% (58) 31% (99) 12% (39) 33% (103) 5% (16) 315Military HH: No 21% (350) 29% (484) 17% (285) 28% (464) 6% (100) 1683RD/WT: Right Direction 32% (246) 35% (264) 12% (91) 16% (123) 4% (33) 757RD/WT: Wrong Track 13% (163) 26% (319) 19% (233) 36% (444) 7% (83) 1241Biden Job Approve 31% (276) 34% (302) 14% (126) 19% (168) 3% (28) 899Biden Job Disapprove 13% (130) 26% (275) 18% (191) 37% (388) 5% (54) 1039
Continued on next page
Page 112
112
Morning ConsultTable POL4_7
Table POL4_7: How would you rate each of the following on their handling of the coronavirus?Your state’s governor
Demographic Excellent Good Just Fair PoorDon’t Know /No Opinion Total N
Registered Voters 20% (408) 29% (583) 16% (323) 28% (567) 6% (116) 1998Biden Job Strongly Approve 42% (176) 30% (124) 11% (46) 16% (66) 1% (6) 418Biden Job Somewhat Approve 21% (100) 37% (177) 16% (79) 21% (102) 5% (23) 481Biden Job Somewhat Disapprove 13% (33) 27% (68) 26% (64) 29% (73) 5% (13) 250Biden Job Strongly Disapprove 12% (97) 26% (207) 16% (127) 40% (316) 5% (41) 788Favorable of Biden 30% (280) 32% (301) 14% (132) 19% (175) 4% (40) 927Unfavorable of Biden 12% (126) 27% (273) 18% (185) 37% (380) 5% (55) 1019Very Favorable of Biden 42% (200) 32% (150) 9% (43) 15% (74) 2% (9) 476Somewhat Favorable of Biden 18% (79) 33% (151) 20% (89) 22% (101) 7% (31) 451Somewhat Unfavorable of Biden 12% (25) 29% (60) 27% (56) 28% (57) 5% (10) 207Very Unfavorable of Biden 12% (101) 26% (213) 16% (129) 40% (323) 6% (45) 812#1 Issue: Economy 16% (123) 32% (242) 17% (133) 30% (234) 5% (37) 768#1 Issue: Security 17% (62) 29% (105) 16% (57) 33% (118) 5% (17) 360#1 Issue: Health Care 29% (66) 28% (64) 12% (28) 22% (51) 9% (20) 231#1 Issue: Medicare / Social Security 25% (57) 29% (65) 17% (39) 26% (60) 3% (7) 227#1 Issue: Women’s Issues 35% (44) 14% (18) 15% (19) 27% (34) 9% (11) 125#1 Issue: Education 20% (12) 32% (19) 19% (11) 20% (12) 9% (6) 59#1 Issue: Energy 26% (28) 34% (36) 13% (13) 17% (18) 10% (11) 107#1 Issue: Other 14% (17) 28% (34) 19% (23) 33% (41) 6% (7) 1222020 Vote: Joe Biden 30% (287) 31% (290) 15% (140) 20% (189) 4% (40) 9462020 Vote: Donald Trump 12% (103) 30% (258) 18% (154) 35% (305) 5% (43) 8642020 Vote: Didn’t Vote 8% (13) 19% (29) 13% (19) 40% (61) 20% (30) 1532018 House Vote: Democrat 29% (221) 31% (238) 14% (106) 23% (175) 4% (30) 7692018 House Vote: Republican 16% (113) 30% (209) 17% (117) 35% (242) 3% (20) 7022016 Vote: Hillary Clinton 31% (213) 31% (214) 14% (94) 21% (145) 3% (19) 6852016 Vote: Donald Trump 15% (124) 28% (227) 18% (141) 35% (278) 4% (32) 8022016 Vote: Other 17% (14) 28% (23) 21% (17) 29% (24) 6% (5) 842016 Vote: Didn’t Vote 14% (58) 27% (114) 17% (71) 28% (119) 14% (60) 423Voted in 2014: Yes 23% (311) 30% (406) 15% (200) 29% (382) 3% (37) 1335Voted in 2014: No 15% (98) 27% (177) 19% (123) 28% (185) 12% (79) 663
Continued on next page
Page 113
National Tracking Poll #2110084, October, 2021
113
Table POL4_7
Table POL4_7: How would you rate each of the following on their handling of the coronavirus?Your state’s governor
Demographic Excellent Good Just Fair PoorDon’t Know /No Opinion Total N
Registered Voters 20% (408) 29% (583) 16% (323) 28% (567) 6% (116) 19984-Region: Northeast 21% (75) 33% (118) 15% (52) 25% (87) 6% (20) 3534-Region: Midwest 19% (86) 25% (111) 20% (88) 30% (134) 6% (26) 4444-Region: South 18% (132) 30% (224) 16% (121) 30% (225) 6% (43) 7464-Region: West 25% (115) 29% (130) 14% (63) 27% (121) 6% (27) 455Party: Democrat/Leans Democrat 29% (264) 30% (277) 15% (138) 21% (188) 5% (47) 914Party: Republican/Leans Republican 14% (112) 29% (238) 17% (137) 35% (286) 4% (35) 808Note: Row proportions may total to larger than one-hundred percent due to rounding. For more information visit MorningConsultIntelligence.com.
Page 114
114
Morning ConsultTable POL4_8
Table POL4_8: How would you rate each of the following on their handling of the coronavirus?Dr. Anthony Fauci, Director of the National Institute of Allergy and Infectious Diseases
Demographic Excellent Good Just Fair PoorDon’t Know /No Opinion Total N
Registered Voters 27% (548) 21% (418) 13% (255) 31% (623) 8% (154) 1998Gender: Male 27% (255) 24% (226) 13% (124) 31% (292) 5% (45) 942Gender: Female 28% (293) 18% (192) 12% (132) 31% (331) 10% (109) 1056Age: 18-34 25% (127) 23% (119) 15% (75) 21% (109) 16% (84) 514Age: 35-44 26% (81) 24% (72) 16% (48) 25% (75) 10% (31) 307Age: 45-64 25% (167) 19% (129) 13% (90) 38% (260) 5% (33) 679Age: 65+ 35% (173) 20% (97) 9% (42) 36% (179) 1% (6) 497GenZers: 1997-2012 25% (42) 18% (31) 14% (23) 15% (26) 28% (48) 170Millennials: 1981-1996 26% (143) 25% (139) 14% (78) 24% (131) 11% (60) 551GenXers: 1965-1980 22% (103) 21% (97) 15% (71) 36% (168) 6% (30) 469Baby Boomers: 1946-1964 32% (236) 19% (138) 10% (74) 37% (269) 2% (15) 732PID: Dem (no lean) 51% (395) 28% (220) 10% (76) 4% (33) 7% (53) 777PID: Ind (no lean) 22% (115) 20% (104) 14% (76) 32% (171) 12% (62) 528PID: Rep (no lean) 5% (38) 13% (93) 15% (104) 60% (419) 6% (39) 693PID/Gender: DemMen 50% (177) 31% (109) 10% (35) 5% (16) 4% (15) 352PID/Gender: DemWomen 51% (218) 26% (111) 10% (41) 4% (16) 9% (38) 425PID/Gender: Ind Men 21% (58) 23% (64) 15% (41) 34% (96) 7% (21) 280PID/Gender: Ind Women 23% (57) 16% (40) 14% (35) 30% (75) 16% (41) 248PID/Gender: Rep Men 7% (20) 17% (53) 15% (48) 58% (179) 3% (10) 310PID/Gender: Rep Women 5% (18) 11% (40) 15% (56) 63% (240) 8% (30) 384Ideo: Liberal (1-3) 53% (300) 25% (142) 11% (60) 6% (33) 6% (32) 566Ideo: Moderate (4) 30% (170) 30% (168) 17% (93) 18% (100) 5% (28) 560Ideo: Conservative (5-7) 8% (61) 13% (94) 12% (87) 62% (456) 4% (33) 730Educ: < College 23% (272) 19% (232) 12% (147) 35% (426) 11% (130) 1206Educ: Bachelors degree 32% (160) 23% (114) 14% (72) 28% (142) 3% (13) 501Educ: Post-grad 40% (117) 24% (71) 13% (37) 19% (55) 4% (11) 290Income: Under 50k 25% (218) 20% (176) 13% (111) 30% (266) 12% (103) 873Income: 50k-100k 28% (204) 21% (150) 13% (97) 33% (240) 5% (36) 728Income: 100k+ 32% (127) 23% (92) 12% (47) 30% (118) 4% (14) 398Ethnicity: White 26% (397) 20% (315) 13% (196) 34% (529) 7% (106) 1544Ethnicity: Hispanic 20% (44) 27% (61) 15% (32) 26% (58) 12% (27) 222
Continued on next page
Page 115
National Tracking Poll #2110084, October, 2021
115
Table POL4_8
Table POL4_8: How would you rate each of the following on their handling of the coronavirus?Dr. Anthony Fauci, Director of the National Institute of Allergy and Infectious Diseases
Demographic Excellent Good Just Fair PoorDon’t Know /No Opinion Total N
Registered Voters 27% (548) 21% (418) 13% (255) 31% (623) 8% (154) 1998Ethnicity: Black 41% (103) 20% (51) 13% (34) 15% (37) 11% (28) 253Ethnicity: Other 24% (49) 25% (51) 12% (25) 28% (56) 10% (20) 201All Christian 26% (269) 22% (230) 12% (124) 35% (366) 5% (52) 1041All Non-Christian 42% (45) 25% (26) 10% (11) 19% (20) 5% (5) 107Atheist 42% (32) 27% (21) 14% (11) 12% (9) 4% (3) 78Agnostic/Nothing in particular 27% (130) 18% (85) 16% (75) 26% (125) 14% (66) 480Something Else 25% (73) 19% (55) 12% (34) 35% (103) 10% (28) 293Religious Non-Protestant/Catholic 37% (48) 27% (34) 11% (14) 19% (25) 6% (8) 129Evangelical 21% (105) 20% (99) 12% (61) 38% (190) 9% (44) 499Non-Evangelical 28% (221) 22% (174) 12% (93) 34% (269) 4% (32) 790Community: Urban 35% (172) 24% (117) 13% (62) 19% (94) 9% (41) 487Community: Suburban 28% (293) 22% (226) 13% (135) 31% (321) 6% (67) 1041Community: Rural 18% (84) 16% (75) 12% (58) 44% (208) 10% (46) 469Employ: Private Sector 25% (171) 26% (175) 14% (94) 29% (196) 7% (47) 684Employ: Government 33% (37) 21% (23) 10% (11) 25% (28) 10% (12) 112Employ: Self-Employed 28% (52) 15% (27) 14% (26) 35% (63) 8% (15) 183Employ: Homemaker 18% (18) 17% (18) 17% (18) 37% (39) 10% (11) 104Employ: Student 28% (19) 21% (14) 19% (12) 13% (9) 19% (13) 67Employ: Retired 33% (175) 18% (94) 10% (55) 38% (205) 1% (5) 534Employ: Unemployed 24% (46) 22% (42) 15% (29) 22% (42) 16% (31) 191Employ: Other 24% (30) 19% (23) 8% (10) 33% (40) 17% (21) 124Military HH: Yes 26% (81) 19% (61) 10% (33) 39% (122) 6% (19) 315Military HH: No 28% (467) 21% (357) 13% (223) 30% (501) 8% (135) 1683RD/WT: Right Direction 53% (398) 28% (214) 11% (80) 3% (21) 6% (45) 757RD/WT: Wrong Track 12% (151) 16% (204) 14% (175) 48% (601) 9% (109) 1241Biden Job Approve 54% (485) 30% (270) 9% (80) 2% (22) 5% (43) 899Biden Job Disapprove 6% (58) 14% (145) 16% (165) 57% (592) 8% (80) 1039
Continued on next page
Page 116
116
Morning ConsultTable POL4_8
Table POL4_8: How would you rate each of the following on their handling of the coronavirus?Dr. Anthony Fauci, Director of the National Institute of Allergy and Infectious Diseases
Demographic Excellent Good Just Fair PoorDon’t Know /No Opinion Total N
Registered Voters 27% (548) 21% (418) 13% (255) 31% (623) 8% (154) 1998Biden Job Strongly Approve 66% (275) 23% (98) 7% (29) 1% (6) 3% (11) 418Biden Job Somewhat Approve 44% (210) 36% (172) 11% (51) 3% (15) 7% (32) 481Biden Job Somewhat Disapprove 14% (36) 30% (75) 28% (71) 16% (41) 11% (28) 250Biden Job Strongly Disapprove 3% (22) 9% (69) 12% (94) 70% (551) 7% (52) 788Favorable of Biden 53% (494) 29% (272) 9% (83) 3% (25) 6% (53) 927Unfavorable of Biden 5% (50) 14% (139) 16% (164) 58% (589) 8% (77) 1019Very Favorable of Biden 67% (318) 23% (108) 6% (28) 2% (8) 3% (14) 476Somewhat Favorable of Biden 39% (176) 37% (165) 12% (55) 4% (17) 9% (39) 451Somewhat Unfavorable of Biden 13% (27) 31% (65) 31% (65) 14% (29) 10% (21) 207Very Unfavorable of Biden 3% (23) 9% (74) 12% (99) 69% (560) 7% (55) 812#1 Issue: Economy 18% (141) 22% (166) 16% (123) 35% (266) 9% (72) 768#1 Issue: Security 13% (48) 12% (43) 12% (41) 58% (207) 6% (20) 360#1 Issue: Health Care 43% (98) 28% (64) 10% (22) 11% (26) 9% (21) 231#1 Issue: Medicare / Social Security 44% (99) 26% (58) 8% (17) 20% (46) 3% (7) 227#1 Issue: Women’s Issues 45% (55) 19% (23) 15% (18) 11% (14) 11% (14) 125#1 Issue: Education 41% (24) 20% (12) 10% (6) 15% (9) 15% (9) 59#1 Issue: Energy 39% (42) 31% (33) 12% (13) 13% (14) 5% (5) 107#1 Issue: Other 34% (41) 16% (19) 12% (14) 34% (41) 5% (6) 1222020 Vote: Joe Biden 51% (481) 29% (279) 11% (100) 3% (31) 6% (55) 9462020 Vote: Donald Trump 4% (36) 13% (113) 14% (121) 62% (537) 7% (57) 8642020 Vote: Didn’t Vote 16% (25) 13% (19) 19% (28) 28% (42) 25% (38) 1532018 House Vote: Democrat 51% (391) 26% (203) 10% (76) 7% (53) 6% (45) 7692018 House Vote: Republican 8% (53) 13% (90) 14% (100) 63% (439) 3% (20) 7022016 Vote: Hillary Clinton 56% (382) 26% (178) 8% (58) 5% (35) 5% (32) 6852016 Vote: Donald Trump 7% (60) 15% (117) 14% (114) 60% (478) 4% (34) 8022016 Vote: Other 21% (18) 29% (24) 17% (14) 28% (24) 6% (5) 842016 Vote: Didn’t Vote 20% (86) 23% (99) 16% (69) 20% (85) 20% (84) 423Voted in 2014: Yes 31% (408) 20% (269) 11% (150) 34% (459) 4% (50) 1335Voted in 2014: No 21% (141) 22% (149) 16% (105) 25% (164) 16% (104) 663
Continued on next page
Page 117
National Tracking Poll #2110084, October, 2021
117
Table POL4_8
Table POL4_8: How would you rate each of the following on their handling of the coronavirus?Dr. Anthony Fauci, Director of the National Institute of Allergy and Infectious Diseases
Demographic Excellent Good Just Fair PoorDon’t Know /No Opinion Total N
Registered Voters 27% (548) 21% (418) 13% (255) 31% (623) 8% (154) 19984-Region: Northeast 30% (107) 25% (87) 13% (47) 25% (88) 6% (23) 3534-Region: Midwest 28% (123) 18% (79) 11% (51) 36% (159) 7% (32) 4444-Region: South 23% (170) 20% (152) 14% (101) 34% (253) 9% (69) 7464-Region: West 32% (148) 22% (99) 12% (57) 27% (122) 7% (30) 455Party: Democrat/Leans Democrat 50% (454) 29% (261) 11% (97) 4% (38) 7% (63) 914Party: Republican/Leans Republican 6% (46) 13% (105) 15% (119) 60% (484) 7% (54) 808Note: Row proportions may total to larger than one-hundred percent due to rounding. For more information visit MorningConsultIntelligence.com.
Page 118
118
Morning ConsultTable POL5
Table POL5: Generally speaking, would you say you are more concerned about...
Demographic
The economic impact ofcoronavirus including theeffect on the stock market
and increasedunemployment
The public health impactof coronavirus includingthe spread of the diseasewhich would cause more
deathsDon’t know / No
opinion Total N
Registered Voters 43% (858) 50% (991) 7% (149) 1998Gender: Male 45% (427) 48% (454) 6% (60) 942Gender: Female 41% (430) 51% (536) 8% (89) 1056Age: 18-34 39% (203) 52% (269) 8% (42) 514Age: 35-44 43% (132) 48% (146) 9% (28) 307Age: 45-64 44% (301) 48% (324) 8% (54) 679Age: 65+ 45% (221) 50% (251) 5% (25) 497GenZers: 1997-2012 32% (54) 56% (96) 12% (21) 170Millennials: 1981-1996 45% (250) 48% (263) 7% (39) 551GenXers: 1965-1980 44% (207) 47% (220) 9% (42) 469Baby Boomers: 1946-1964 43% (318) 51% (374) 5% (40) 732PID: Dem (no lean) 25% (191) 70% (542) 6% (43) 777PID: Ind (no lean) 44% (230) 47% (249) 9% (49) 528PID: Rep (no lean) 63% (436) 29% (200) 8% (57) 693PID/Gender: DemMen 26% (90) 69% (244) 5% (18) 352PID/Gender: DemWomen 24% (101) 70% (298) 6% (25) 425PID/Gender: Ind Men 47% (132) 46% (129) 6% (18) 280PID/Gender: Ind Women 39% (98) 48% (120) 12% (31) 248PID/Gender: Rep Men 66% (205) 26% (81) 8% (24) 310PID/Gender: Rep Women 60% (232) 31% (119) 9% (33) 384Ideo: Liberal (1-3) 23% (128) 72% (410) 5% (28) 566Ideo: Moderate (4) 39% (220) 53% (297) 8% (42) 560Ideo: Conservative (5-7) 64% (471) 29% (214) 6% (46) 730Educ: < College 44% (525) 47% (562) 10% (119) 1206Educ: Bachelors degree 44% (219) 53% (264) 4% (19) 501Educ: Post-grad 39% (114) 57% (165) 4% (12) 290Income: Under 50k 41% (360) 50% (434) 9% (79) 873Income: 50k-100k 42% (308) 51% (368) 7% (51) 728Income: 100k+ 48% (190) 47% (188) 5% (19) 398
Continued on next page
Page 119
National Tracking Poll #2110084, October, 2021
119
Table POL5
Table POL5: Generally speaking, would you say you are more concerned about...
Demographic
The economic impact ofcoronavirus including theeffect on the stock market
and increasedunemployment
The public health impactof coronavirus includingthe spread of the diseasewhich would cause more
deathsDon’t know / No
opinion Total N
Registered Voters 43% (858) 50% (991) 7% (149) 1998Ethnicity: White 46% (707) 47% (729) 7% (108) 1544Ethnicity: Hispanic 41% (90) 47% (104) 13% (28) 222Ethnicity: Black 30% (76) 60% (152) 10% (26) 253Ethnicity: Other 37% (75) 55% (110) 8% (16) 201All Christian 48% (497) 46% (478) 6% (66) 1041All Non-Christian 31% (34) 67% (71) 2% (2) 107Atheist 33% (26) 62% (48) 5% (4) 78Agnostic/Nothing in particular 38% (184) 52% (250) 10% (46) 480Something Else 40% (118) 49% (143) 11% (32) 293Religious Non-Protestant/Catholic 32% (41) 64% (83) 4% (5) 129Evangelical 46% (230) 46% (232) 7% (36) 499Non-Evangelical 46% (366) 46% (367) 7% (57) 790Community: Urban 42% (203) 53% (260) 5% (24) 487Community: Suburban 40% (421) 52% (539) 8% (81) 1041Community: Rural 50% (233) 41% (192) 9% (44) 469Employ: Private Sector 47% (319) 47% (319) 7% (45) 684Employ: Government 44% (49) 49% (55) 7% (8) 112Employ: Self-Employed 47% (86) 46% (85) 6% (12) 183Employ: Homemaker 44% (45) 46% (47) 11% (11) 104Employ: Student 28% (19) 63% (42) 9% (6) 67Employ: Retired 42% (224) 53% (282) 5% (27) 534Employ: Unemployed 32% (62) 54% (103) 13% (25) 191Employ: Other 42% (52) 46% (56) 12% (15) 124Military HH: Yes 42% (132) 52% (162) 6% (20) 315Military HH: No 43% (726) 49% (828) 8% (129) 1683RD/WT: Right Direction 27% (207) 67% (507) 6% (44) 757RD/WT: Wrong Track 52% (651) 39% (484) 9% (106) 1241
Continued on next page
Page 120
120
Morning ConsultTable POL5
Table POL5: Generally speaking, would you say you are more concerned about...
Demographic
The economic impact ofcoronavirus including theeffect on the stock market
and increasedunemployment
The public health impactof coronavirus includingthe spread of the diseasewhich would cause more
deathsDon’t know / No
opinion Total N
Registered Voters 43% (858) 50% (991) 7% (149) 1998Biden Job Approve 26% (229) 70% (630) 4% (40) 899Biden Job Disapprove 60% (620) 32% (333) 8% (85) 1039Biden Job Strongly Approve 22% (91) 74% (310) 4% (17) 418Biden Job Somewhat Approve 29% (138) 67% (320) 5% (23) 481Biden Job Somewhat Disapprove 41% (102) 54% (134) 6% (14) 250Biden Job Strongly Disapprove 66% (518) 25% (199) 9% (71) 788Favorable of Biden 25% (236) 70% (650) 4% (41) 927Unfavorable of Biden 60% (613) 31% (319) 8% (86) 1019Very Favorable of Biden 24% (112) 73% (346) 4% (18) 476Somewhat Favorable of Biden 27% (124) 67% (304) 5% (24) 451Somewhat Unfavorable of Biden 44% (92) 51% (105) 5% (10) 207Very Unfavorable of Biden 64% (521) 26% (214) 9% (76) 812#1 Issue: Economy 55% (421) 39% (297) 6% (49) 768#1 Issue: Security 57% (204) 34% (122) 9% (34) 360#1 Issue: Health Care 18% (42) 74% (171) 8% (18) 231#1 Issue: Medicare / Social Security 33% (74) 63% (143) 4% (10) 227#1 Issue: Women’s Issues 21% (26) 69% (86) 10% (12) 125#1 Issue: Education 46% (27) 48% (28) 7% (4) 59#1 Issue: Energy 27% (29) 67% (72) 6% (6) 107#1 Issue: Other 28% (34) 58% (71) 14% (17) 1222020 Vote: Joe Biden 24% (231) 70% (662) 6% (52) 9462020 Vote: Donald Trump 64% (551) 28% (242) 8% (71) 8642020 Vote: Didn’t Vote 38% (58) 46% (71) 16% (24) 1532018 House Vote: Democrat 27% (207) 68% (526) 5% (36) 7692018 House Vote: Republican 63% (443) 30% (214) 6% (45) 702
Continued on next page
Page 121
National Tracking Poll #2110084, October, 2021
121
Table POL5
Table POL5: Generally speaking, would you say you are more concerned about...
Demographic
The economic impact ofcoronavirus including theeffect on the stock market
and increasedunemployment
The public health impactof coronavirus includingthe spread of the diseasewhich would cause more
deathsDon’t know / No
opinion Total N
Registered Voters 43% (858) 50% (991) 7% (149) 19982016 Vote: Hillary Clinton 26% (180) 69% (469) 5% (35) 6852016 Vote: Donald Trump 61% (487) 32% (253) 8% (62) 8022016 Vote: Other 39% (33) 52% (44) 9% (7) 842016 Vote: Didn’t Vote 37% (156) 52% (222) 11% (45) 423Voted in 2014: Yes 44% (586) 50% (671) 6% (78) 1335Voted in 2014: No 41% (271) 48% (320) 11% (71) 6634-Region: Northeast 41% (145) 52% (184) 7% (24) 3534-Region: Midwest 47% (208) 44% (194) 10% (42) 4444-Region: South 44% (328) 49% (363) 7% (54) 7464-Region: West 39% (176) 55% (250) 6% (29) 455Party: Democrat/Leans Democrat 24% (224) 70% (636) 6% (54) 914Party: Republican/Leans Republican 64% (517) 29% (231) 7% (60) 808Note: Row proportions may total to larger than one-hundred percent due to rounding. For more information visit MorningConsultIntelligence.com.
Page 122
122
Morning ConsultTable POL6
Table POL6: Currently, do you believe it’s more important for the government to address the:
DemographicThe spread ofcoronavirus The economy
Don’t know / Noopinion Total N
Registered Voters 43% (859) 50% (1007) 7% (132) 1998Gender: Male 44% (414) 51% (483) 5% (45) 942Gender: Female 42% (445) 50% (524) 8% (87) 1056Age: 18-34 49% (251) 43% (224) 8% (40) 514Age: 35-44 48% (149) 45% (139) 6% (19) 307Age: 45-64 37% (253) 55% (376) 7% (51) 679Age: 65+ 41% (206) 54% (269) 5% (23) 497GenZers: 1997-2012 55% (93) 35% (59) 10% (18) 170Millennials: 1981-1996 46% (252) 48% (266) 6% (34) 551GenXers: 1965-1980 39% (181) 54% (252) 8% (36) 469Baby Boomers: 1946-1964 40% (295) 54% (395) 6% (42) 732PID: Dem (no lean) 66% (511) 29% (224) 6% (43) 777PID: Ind (no lean) 39% (208) 52% (272) 9% (48) 528PID: Rep (no lean) 20% (141) 74% (512) 6% (41) 693PID/Gender: DemMen 67% (235) 29% (103) 4% (14) 352PID/Gender: DemWomen 65% (276) 28% (120) 7% (28) 425PID/Gender: Ind Men 40% (113) 52% (145) 8% (22) 280PID/Gender: Ind Women 38% (95) 51% (127) 11% (27) 248PID/Gender: Rep Men 21% (66) 76% (234) 3% (9) 310PID/Gender: Rep Women 19% (74) 72% (277) 8% (32) 384Ideo: Liberal (1-3) 68% (386) 27% (150) 5% (30) 566Ideo: Moderate (4) 48% (268) 44% (248) 8% (44) 560Ideo: Conservative (5-7) 21% (152) 75% (546) 4% (32) 730Educ: < College 39% (473) 52% (630) 8% (103) 1206Educ: Bachelors degree 49% (244) 47% (238) 4% (19) 501Educ: Post-grad 49% (141) 48% (139) 3% (10) 290Income: Under 50k 43% (376) 49% (426) 8% (71) 873Income: 50k-100k 42% (308) 51% (370) 7% (49) 728Income: 100k+ 44% (174) 53% (211) 3% (13) 398Ethnicity: White 39% (601) 55% (843) 6% (100) 1544Ethnicity: Hispanic 42% (92) 52% (115) 7% (15) 222Ethnicity: Black 65% (165) 27% (68) 8% (21) 253
Continued on next page
Page 123
National Tracking Poll #2110084, October, 2021
123
Table POL6
Table POL6: Currently, do you believe it’s more important for the government to address the:
DemographicThe spread ofcoronavirus The economy
Don’t know / Noopinion Total N
Registered Voters 43% (859) 50% (1007) 7% (132) 1998Ethnicity: Other 46% (93) 48% (97) 5% (11) 201All Christian 40% (413) 55% (575) 5% (54) 1041All Non-Christian 61% (65) 36% (38) 4% (4) 107Atheist 64% (50) 34% (27) 1% (1) 78Agnostic/Nothing in particular 45% (216) 45% (214) 10% (50) 480Something Else 39% (115) 53% (154) 8% (23) 293Religious Non-Protestant/Catholic 58% (75) 36% (47) 5% (7) 129Evangelical 35% (176) 58% (290) 6% (32) 499Non-Evangelical 42% (330) 53% (418) 5% (42) 790Community: Urban 51% (249) 45% (217) 4% (21) 487Community: Suburban 44% (458) 49% (513) 7% (70) 1041Community: Rural 32% (151) 59% (277) 9% (41) 469Employ: Private Sector 42% (288) 52% (354) 6% (41) 684Employ: Government 44% (50) 51% (58) 4% (5) 112Employ: Self-Employed 42% (76) 52% (95) 6% (12) 183Employ: Homemaker 42% (43) 47% (49) 11% (12) 104Employ: Student 59% (40) 27% (18) 15% (10) 67Employ: Retired 41% (220) 54% (289) 4% (24) 534Employ: Unemployed 50% (96) 40% (76) 10% (18) 191Employ: Other 37% (46) 54% (67) 8% (10) 124Military HH: Yes 42% (132) 51% (160) 7% (23) 315Military HH: No 43% (727) 50% (847) 6% (109) 1683RD/WT: Right Direction 64% (487) 30% (226) 6% (45) 757RD/WT: Wrong Track 30% (372) 63% (781) 7% (87) 1241Biden Job Approve 68% (615) 27% (244) 4% (40) 899Biden Job Disapprove 22% (226) 72% (745) 6% (67) 1039Biden Job Strongly Approve 73% (304) 23% (97) 4% (16) 418Biden Job Somewhat Approve 65% (311) 31% (147) 5% (23) 481Biden Job Somewhat Disapprove 43% (107) 52% (130) 5% (13) 250Biden Job Strongly Disapprove 15% (119) 78% (615) 7% (54) 788
Continued on next page
Page 124
124
Morning ConsultTable POL6
Table POL6: Currently, do you believe it’s more important for the government to address the:
DemographicThe spread ofcoronavirus The economy
Don’t know / Noopinion Total N
Registered Voters 43% (859) 50% (1007) 7% (132) 1998Favorable of Biden 68% (626) 28% (259) 5% (42) 927Unfavorable of Biden 21% (219) 72% (730) 7% (70) 1019Very Favorable of Biden 70% (335) 26% (122) 4% (19) 476Somewhat Favorable of Biden 65% (291) 30% (137) 5% (23) 451Somewhat Unfavorable of Biden 42% (88) 54% (111) 4% (8) 207Very Unfavorable of Biden 16% (131) 76% (619) 8% (62) 812#1 Issue: Economy 33% (255) 61% (472) 5% (41) 768#1 Issue: Security 25% (90) 68% (244) 7% (26) 360#1 Issue: Health Care 67% (155) 23% (52) 10% (24) 231#1 Issue: Medicare / Social Security 55% (125) 39% (87) 6% (15) 227#1 Issue: Women’s Issues 70% (87) 23% (29) 7% (9) 125#1 Issue: Education 50% (29) 47% (28) 3% (2) 59#1 Issue: Energy 65% (69) 33% (35) 2% (3) 107#1 Issue: Other 41% (50) 48% (59) 11% (14) 1222020 Vote: Joe Biden 66% (623) 29% (278) 5% (45) 9462020 Vote: Donald Trump 19% (164) 74% (638) 7% (62) 8642020 Vote: Didn’t Vote 40% (62) 46% (71) 14% (21) 1532018 House Vote: Democrat 64% (491) 32% (245) 4% (32) 7692018 House Vote: Republican 20% (140) 74% (518) 6% (44) 7022016 Vote: Hillary Clinton 66% (453) 29% (200) 5% (32) 6852016 Vote: Donald Trump 22% (175) 73% (584) 5% (43) 8022016 Vote: Other 42% (35) 49% (41) 10% (8) 842016 Vote: Didn’t Vote 46% (196) 42% (178) 11% (49) 423Voted in 2014: Yes 42% (562) 53% (713) 4% (60) 1335Voted in 2014: No 45% (297) 44% (294) 11% (72) 6634-Region: Northeast 42% (149) 52% (184) 6% (20) 3534-Region: Midwest 39% (173) 54% (242) 7% (30) 4444-Region: South 43% (320) 50% (376) 7% (50) 7464-Region: West 48% (218) 45% (205) 7% (32) 455Party: Democrat/Leans Democrat 65% (592) 29% (268) 6% (54) 914Party: Republican/Leans Republican 20% (161) 75% (605) 5% (42) 808Note: Row proportions may total to larger than one-hundred percent due to rounding. For more information visit MorningConsultIntelligence.com.
Page 125
National Tracking Poll #2110084, October, 2021
125
Table POL7
Table POL7: Even if neither is exactly correct, which of the following comes closest to your opinion?
Demographic
Americans shouldcontinue to social
distance for as long as isneeded to curb the spreadof coronavirus even if itmeans continued damage
to the economy
Americans should stopsocial distancing to
stimulate the economyeven if it means
increasing the spread ofcoronavirus
Don’t know / Noopinion Total N
Registered Voters 59% (1184) 29% (589) 11% (226) 1998Gender: Male 59% (553) 32% (306) 9% (83) 942Gender: Female 60% (631) 27% (283) 14% (143) 1056Age: 18-34 61% (313) 27% (137) 13% (65) 514Age: 35-44 63% (195) 25% (78) 11% (34) 307Age: 45-64 56% (379) 31% (214) 13% (86) 679Age: 65+ 60% (297) 32% (160) 8% (40) 497GenZers: 1997-2012 64% (109) 20% (34) 16% (27) 170Millennials: 1981-1996 60% (329) 29% (162) 11% (61) 551GenXers: 1965-1980 57% (268) 29% (138) 14% (63) 469Baby Boomers: 1946-1964 60% (438) 31% (226) 9% (67) 732PID: Dem (no lean) 83% (646) 9% (73) 8% (58) 777PID: Ind (no lean) 55% (292) 30% (157) 15% (79) 528PID: Rep (no lean) 35% (246) 52% (359) 13% (89) 693PID/Gender: DemMen 84% (296) 10% (36) 6% (20) 352PID/Gender: DemWomen 82% (350) 9% (36) 9% (38) 425PID/Gender: Ind Men 55% (155) 32% (91) 12% (35) 280PID/Gender: Ind Women 55% (137) 27% (66) 18% (44) 248PID/Gender: Rep Men 33% (102) 58% (179) 9% (29) 310PID/Gender: Rep Women 37% (144) 47% (180) 16% (60) 384Ideo: Liberal (1-3) 85% (479) 9% (52) 6% (35) 566Ideo: Moderate (4) 71% (397) 19% (106) 10% (57) 560Ideo: Conservative (5-7) 32% (236) 56% (406) 12% (88) 730Educ: < College 56% (677) 30% (358) 14% (172) 1206Educ: Bachelors degree 61% (306) 32% (160) 7% (36) 501Educ: Post-grad 69% (201) 24% (71) 6% (19) 290
Continued on next page
Page 126
126
Morning ConsultTable POL7
Table POL7: Even if neither is exactly correct, which of the following comes closest to your opinion?
Demographic
Americans shouldcontinue to social
distance for as long as isneeded to curb the spreadof coronavirus even if itmeans continued damage
to the economy
Americans should stopsocial distancing to
stimulate the economyeven if it means
increasing the spread ofcoronavirus
Don’t know / Noopinion Total N
Registered Voters 59% (1184) 29% (589) 11% (226) 1998Income: Under 50k 58% (504) 28% (244) 14% (125) 873Income: 50k-100k 61% (447) 30% (215) 9% (66) 728Income: 100k+ 58% (232) 33% (130) 9% (35) 398Ethnicity: White 56% (864) 33% (507) 11% (173) 1544Ethnicity: Hispanic 59% (132) 25% (55) 16% (35) 222Ethnicity: Black 79% (200) 11% (28) 10% (26) 253Ethnicity: Other 60% (120) 26% (53) 14% (28) 201All Christian 55% (572) 34% (356) 11% (113) 1041All Non-Christian 79% (84) 16% (17) 5% (5) 107Atheist 74% (57) 22% (17) 4% (3) 78Agnostic/Nothing in particular 62% (299) 23% (113) 14% (68) 480Something Else 59% (171) 29% (85) 12% (36) 293Religious Non-Protestant/Catholic 74% (96) 19% (24) 7% (9) 129Evangelical 52% (261) 35% (172) 13% (65) 499Non-Evangelical 58% (455) 33% (257) 10% (78) 790Community: Urban 70% (339) 23% (110) 8% (38) 487Community: Suburban 58% (601) 30% (314) 12% (127) 1041Community: Rural 52% (243) 35% (165) 13% (61) 469Employ: Private Sector 58% (395) 32% (221) 10% (68) 684Employ: Government 68% (76) 25% (28) 7% (8) 112Employ: Self-Employed 54% (98) 35% (64) 11% (21) 183Employ: Homemaker 51% (53) 29% (30) 20% (21) 104Employ: Student 71% (48) 13% (8) 17% (11) 67Employ: Retired 59% (314) 31% (167) 10% (53) 534Employ: Unemployed 68% (129) 18% (35) 14% (26) 191Employ: Other 57% (70) 29% (35) 15% (18) 124
Continued on next page
Page 127
National Tracking Poll #2110084, October, 2021
127
Table POL7
Table POL7: Even if neither is exactly correct, which of the following comes closest to your opinion?
Demographic
Americans shouldcontinue to social
distance for as long as isneeded to curb the spreadof coronavirus even if itmeans continued damage
to the economy
Americans should stopsocial distancing to
stimulate the economyeven if it means
increasing the spread ofcoronavirus
Don’t know / Noopinion Total N
Registered Voters 59% (1184) 29% (589) 11% (226) 1998Military HH: Yes 59% (185) 33% (104) 8% (25) 315Military HH: No 59% (998) 29% (484) 12% (201) 1683RD/WT: Right Direction 82% (622) 10% (79) 7% (56) 757RD/WT: Wrong Track 45% (561) 41% (509) 14% (170) 1241Biden Job Approve 85% (762) 9% (80) 6% (57) 899Biden Job Disapprove 38% (391) 49% (506) 14% (142) 1039Biden Job Strongly Approve 86% (360) 10% (41) 4% (17) 418Biden Job Somewhat Approve 83% (402) 8% (40) 8% (40) 481Biden Job Somewhat Disapprove 67% (168) 21% (53) 12% (29) 250Biden Job Strongly Disapprove 28% (223) 57% (453) 14% (112) 788Favorable of Biden 84% (778) 9% (83) 7% (66) 927Unfavorable of Biden 37% (381) 49% (499) 14% (139) 1019Very Favorable of Biden 87% (412) 8% (40) 5% (23) 476Somewhat Favorable of Biden 81% (365) 10% (43) 10% (43) 451Somewhat Unfavorable of Biden 67% (138) 23% (48) 10% (21) 207Very Unfavorable of Biden 30% (242) 56% (451) 15% (118) 812#1 Issue: Economy 53% (404) 35% (271) 12% (94) 768#1 Issue: Security 40% (143) 48% (174) 12% (43) 360#1 Issue: Health Care 75% (173) 14% (33) 10% (24) 231#1 Issue: Medicare / Social Security 74% (169) 17% (38) 9% (20) 227#1 Issue: Women’s Issues 77% (96) 14% (18) 9% (11) 125#1 Issue: Education 67% (40) 25% (15) 8% (5) 59#1 Issue: Energy 76% (82) 15% (16) 8% (9) 107#1 Issue: Other 64% (78) 19% (24) 17% (21) 122
Continued on next page
Page 128
128
Morning ConsultTable POL7
Table POL7: Even if neither is exactly correct, which of the following comes closest to your opinion?
Demographic
Americans shouldcontinue to social
distance for as long as isneeded to curb the spreadof coronavirus even if itmeans continued damage
to the economy
Americans should stopsocial distancing to
stimulate the economyeven if it means
increasing the spread ofcoronavirus
Don’t know / Noopinion Total N
Registered Voters 59% (1184) 29% (589) 11% (226) 19982020 Vote: Joe Biden 82% (780) 10% (93) 8% (73) 9462020 Vote: Donald Trump 35% (304) 52% (452) 12% (108) 8642020 Vote: Didn’t Vote 53% (81) 22% (33) 25% (38) 1532018 House Vote: Democrat 81% (622) 11% (87) 8% (60) 7692018 House Vote: Republican 37% (259) 52% (362) 11% (80) 7022016 Vote: Hillary Clinton 82% (563) 10% (67) 8% (55) 6852016 Vote: Donald Trump 38% (305) 51% (408) 11% (89) 8022016 Vote: Other 56% (47) 27% (23) 17% (14) 842016 Vote: Didn’t Vote 62% (263) 22% (91) 16% (68) 423Voted in 2014: Yes 59% (787) 32% (426) 9% (122) 1335Voted in 2014: No 60% (397) 24% (162) 16% (104) 6634-Region: Northeast 64% (225) 26% (93) 10% (35) 3534-Region: Midwest 55% (244) 33% (146) 12% (54) 4444-Region: South 59% (438) 28% (212) 13% (95) 7464-Region: West 61% (276) 30% (137) 9% (43) 455Party: Democrat/Leans Democrat 82% (752) 9% (85) 8% (77) 914Party: Republican/Leans Republican 35% (286) 53% (426) 12% (97) 808Note: Row proportions may total to larger than one-hundred percent due to rounding. For more information visit MorningConsultIntelligence.com.
Page 129
National Tracking Poll #2110084, October, 2021
129
Table POL8_1
Table POL8_1: How much have you seen, read, or heard about the following?The upcoming international climate change conference, COP26, in Glasgow, Scotland
Demographic A lot Some Not Much Nothing at all Total N
Registered Voters 8% (166) 21% (411) 30% (593) 41% (829) 1998Gender: Male 11% (107) 24% (224) 31% (293) 34% (318) 942Gender: Female 6% (59) 18% (187) 28% (300) 48% (510) 1056Age: 18-34 13% (66) 19% (98) 25% (130) 43% (221) 514Age: 35-44 13% (38) 23% (72) 27% (84) 37% (113) 307Age: 45-64 6% (44) 19% (128) 31% (212) 44% (296) 679Age: 65+ 4% (18) 23% (113) 34% (168) 40% (198) 497GenZers: 1997-2012 12% (20) 14% (24) 26% (44) 49% (83) 170Millennials: 1981-1996 13% (74) 23% (125) 24% (134) 40% (220) 551GenXers: 1965-1980 7% (35) 18% (87) 30% (142) 44% (206) 469Baby Boomers: 1946-1964 5% (35) 21% (156) 33% (239) 41% (302) 732PID: Dem (no lean) 13% (101) 27% (207) 28% (214) 33% (255) 777PID: Ind (no lean) 5% (28) 17% (92) 31% (166) 46% (242) 528PID: Rep (no lean) 5% (37) 16% (112) 31% (213) 48% (331) 693PID/Gender: DemMen 19% (68) 26% (92) 27% (96) 27% (96) 352PID/Gender: DemWomen 8% (34) 27% (115) 28% (117) 37% (159) 425PID/Gender: Ind Men 5% (15) 22% (62) 33% (93) 39% (110) 280PID/Gender: Ind Women 5% (13) 12% (30) 29% (73) 53% (132) 248PID/Gender: Rep Men 8% (24) 23% (70) 33% (103) 36% (112) 310PID/Gender: Rep Women 3% (12) 11% (42) 29% (110) 57% (219) 384Ideo: Liberal (1-3) 10% (58) 26% (147) 31% (174) 33% (187) 566Ideo: Moderate (4) 10% (56) 24% (135) 27% (152) 39% (216) 560Ideo: Conservative (5-7) 7% (48) 16% (118) 31% (225) 46% (339) 730Educ: < College 7% (79) 17% (203) 28% (335) 49% (590) 1206Educ: Bachelors degree 9% (46) 24% (121) 33% (167) 33% (168) 501Educ: Post-grad 14% (42) 30% (87) 32% (92) 24% (71) 290Income: Under 50k 7% (59) 19% (168) 26% (224) 48% (422) 873Income: 50k-100k 7% (48) 19% (139) 33% (243) 41% (298) 728Income: 100k+ 15% (59) 26% (104) 32% (125) 27% (109) 398Ethnicity: White 8% (122) 22% (332) 30% (462) 41% (628) 1544Ethnicity: Hispanic 11% (24) 20% (45) 21% (48) 48% (106) 222Ethnicity: Black 10% (25) 20% (50) 28% (72) 42% (107) 253
Continued on next page
Page 130
130
Morning ConsultTable POL8_1
Table POL8_1: How much have you seen, read, or heard about the following?The upcoming international climate change conference, COP26, in Glasgow, Scotland
Demographic A lot Some Not Much Nothing at all Total N
Registered Voters 8% (166) 21% (411) 30% (593) 41% (829) 1998Ethnicity: Other 9% (19) 14% (29) 30% (59) 47% (94) 201All Christian 9% (92) 21% (222) 30% (308) 40% (420) 1041All Non-Christian 21% (23) 26% (27) 33% (35) 20% (21) 107Atheist 9% (7) 17% (14) 35% (27) 38% (30) 78Agnostic/Nothing in particular 7% (35) 19% (92) 31% (148) 43% (205) 480Something Else 3% (10) 19% (56) 26% (75) 52% (152) 293Religious Non-Protestant/Catholic 18% (23) 25% (32) 32% (42) 25% (33) 129Evangelical 8% (38) 21% (103) 31% (154) 41% (204) 499Non-Evangelical 7% (56) 21% (166) 28% (218) 44% (350) 790Community: Urban 14% (70) 26% (125) 26% (129) 34% (164) 487Community: Suburban 7% (70) 21% (218) 29% (304) 43% (449) 1041Community: Rural 5% (26) 14% (68) 34% (160) 46% (216) 469Employ: Private Sector 13% (88) 24% (164) 29% (196) 34% (236) 684Employ: Government 8% (9) 21% (24) 37% (41) 34% (38) 112Employ: Self-Employed 14% (26) 26% (47) 27% (49) 33% (61) 183Employ: Homemaker 4% (4) 8% (8) 33% (34) 55% (57) 104Employ: Student 5% (3) 15% (10) 36% (24) 44% (29) 67Employ: Retired 4% (22) 20% (107) 35% (187) 41% (218) 534Employ: Unemployed 4% (8) 15% (28) 19% (36) 62% (119) 191Employ: Other 4% (6) 17% (21) 20% (25) 58% (72) 124Military HH: Yes 5% (15) 19% (61) 35% (111) 41% (129) 315Military HH: No 9% (151) 21% (350) 29% (482) 42% (700) 1683RD/WT: Right Direction 15% (110) 28% (215) 25% (192) 32% (240) 757RD/WT: Wrong Track 4% (56) 16% (195) 32% (401) 47% (588) 1241Biden Job Approve 13% (118) 28% (250) 29% (257) 30% (274) 899Biden Job Disapprove 5% (48) 15% (156) 31% (320) 49% (514) 1039Biden Job Strongly Approve 19% (79) 30% (125) 23% (94) 29% (120) 418Biden Job Somewhat Approve 8% (39) 26% (125) 34% (163) 32% (154) 481Biden Job Somewhat Disapprove 4% (9) 19% (48) 34% (84) 44% (109) 250Biden Job Strongly Disapprove 5% (39) 14% (108) 30% (237) 51% (404) 788
Continued on next page
Page 131
National Tracking Poll #2110084, October, 2021
131
Table POL8_1
Table POL8_1: How much have you seen, read, or heard about the following?The upcoming international climate change conference, COP26, in Glasgow, Scotland
Demographic A lot Some Not Much Nothing at all Total N
Registered Voters 8% (166) 21% (411) 30% (593) 41% (829) 1998Favorable of Biden 12% (116) 28% (257) 28% (258) 32% (296) 927Unfavorable of Biden 5% (50) 14% (146) 31% (316) 50% (508) 1019Very Favorable of Biden 19% (88) 29% (139) 24% (113) 28% (135) 476Somewhat Favorable of Biden 6% (27) 26% (118) 32% (145) 36% (161) 451Somewhat Unfavorable of Biden 5% (10) 18% (37) 32% (67) 45% (93) 207Very Unfavorable of Biden 5% (40) 13% (108) 31% (249) 51% (415) 812#1 Issue: Economy 7% (50) 20% (153) 32% (246) 41% (319) 768#1 Issue: Security 8% (28) 15% (53) 30% (107) 48% (172) 360#1 Issue: Health Care 11% (26) 27% (63) 27% (62) 34% (79) 231#1 Issue: Medicare / Social Security 8% (18) 22% (50) 33% (75) 37% (84) 227#1 Issue: Women’s Issues 6% (8) 20% (24) 26% (32) 48% (60) 125#1 Issue: Education 7% (4) 26% (15) 33% (20) 34% (20) 59#1 Issue: Energy 15% (16) 35% (37) 19% (21) 31% (33) 107#1 Issue: Other 13% (16) 12% (14) 25% (30) 50% (61) 1222020 Vote: Joe Biden 11% (108) 27% (256) 30% (281) 32% (300) 9462020 Vote: Donald Trump 6% (52) 16% (138) 32% (273) 46% (401) 8642020 Vote: Didn’t Vote 3% (4) 8% (12) 19% (28) 70% (108) 1532018 House Vote: Democrat 12% (94) 27% (206) 28% (218) 33% (251) 7692018 House Vote: Republican 6% (45) 17% (123) 34% (240) 42% (293) 7022016 Vote: Hillary Clinton 13% (88) 28% (192) 27% (185) 32% (220) 6852016 Vote: Donald Trump 6% (46) 17% (138) 34% (275) 43% (343) 8022016 Vote: Other 6% (5) 20% (17) 34% (29) 39% (33) 842016 Vote: Didn’t Vote 6% (27) 15% (64) 24% (100) 55% (232) 423Voted in 2014: Yes 9% (125) 23% (305) 31% (415) 37% (490) 1335Voted in 2014: No 6% (41) 16% (106) 27% (177) 51% (339) 6634-Region: Northeast 9% (33) 24% (84) 26% (93) 41% (144) 3534-Region: Midwest 7% (30) 18% (81) 30% (135) 45% (198) 4444-Region: South 8% (58) 20% (148) 33% (246) 39% (293) 7464-Region: West 10% (45) 21% (98) 26% (119) 43% (194) 455Party: Democrat/Leans Democrat 12% (112) 27% (245) 28% (255) 33% (302) 914Party: Republican/Leans Republican 5% (39) 15% (124) 32% (255) 48% (390) 808Note: Row proportions may total to larger than one-hundred percent due to rounding. For more information visit MorningConsultIntelligence.com.
Page 132
132
Morning ConsultTable POL8_2
Table POL8_2: How much have you seen, read, or heard about the following?Workers at companies including Kellogg’s and John Deere going on strike
Demographic A lot Some Not Much Nothing at all Total N
Registered Voters 19% (378) 31% (629) 19% (379) 31% (613) 1998Gender: Male 23% (218) 33% (310) 19% (180) 25% (234) 942Gender: Female 15% (160) 30% (319) 19% (199) 36% (378) 1056Age: 18-34 19% (96) 29% (148) 20% (103) 32% (167) 514Age: 35-44 17% (52) 27% (83) 17% (52) 39% (120) 307Age: 45-64 19% (131) 29% (200) 20% (135) 31% (214) 679Age: 65+ 20% (99) 40% (198) 18% (88) 23% (112) 497GenZers: 1997-2012 17% (28) 27% (46) 29% (48) 28% (48) 170Millennials: 1981-1996 20% (108) 28% (154) 15% (85) 37% (205) 551GenXers: 1965-1980 17% (77) 29% (136) 21% (99) 33% (157) 469Baby Boomers: 1946-1964 20% (148) 36% (264) 18% (135) 25% (185) 732PID: Dem (no lean) 22% (174) 32% (250) 17% (136) 28% (217) 777PID: Ind (no lean) 16% (85) 32% (168) 22% (117) 30% (158) 528PID: Rep (no lean) 17% (119) 30% (211) 18% (125) 34% (238) 693PID/Gender: DemMen 24% (84) 35% (122) 18% (63) 24% (84) 352PID/Gender: DemWomen 21% (90) 30% (128) 17% (73) 31% (134) 425PID/Gender: Ind Men 20% (57) 33% (92) 22% (61) 25% (69) 280PID/Gender: Ind Women 11% (28) 30% (75) 23% (56) 36% (88) 248PID/Gender: Rep Men 25% (77) 31% (96) 18% (56) 26% (81) 310PID/Gender: Rep Women 11% (42) 30% (115) 18% (69) 41% (156) 384Ideo: Liberal (1-3) 22% (127) 36% (203) 15% (86) 27% (150) 566Ideo: Moderate (4) 19% (107) 31% (176) 20% (113) 29% (164) 560Ideo: Conservative (5-7) 18% (134) 32% (231) 18% (131) 32% (234) 730Educ: < College 17% (207) 28% (339) 20% (242) 35% (419) 1206Educ: Bachelors degree 18% (92) 36% (179) 20% (99) 26% (131) 501Educ: Post-grad 27% (79) 38% (111) 13% (38) 22% (63) 290Income: Under 50k 17% (150) 28% (242) 22% (189) 33% (292) 873Income: 50k-100k 18% (130) 35% (256) 16% (118) 31% (225) 728Income: 100k+ 25% (99) 33% (131) 18% (72) 24% (96) 398Ethnicity: White 18% (283) 33% (517) 19% (293) 29% (450) 1544Ethnicity: Hispanic 15% (33) 24% (54) 29% (64) 32% (71) 222Ethnicity: Black 25% (63) 22% (56) 17% (42) 36% (92) 253
Continued on next page
Page 133
National Tracking Poll #2110084, October, 2021
133
Table POL8_2
Table POL8_2: How much have you seen, read, or heard about the following?Workers at companies including Kellogg’s and John Deere going on strike
Demographic A lot Some Not Much Nothing at all Total N
Registered Voters 19% (378) 31% (629) 19% (379) 31% (613) 1998Ethnicity: Other 16% (32) 28% (56) 21% (43) 35% (70) 201All Christian 20% (204) 32% (332) 19% (201) 29% (303) 1041All Non-Christian 24% (25) 34% (36) 19% (20) 23% (25) 107Atheist 19% (15) 32% (25) 16% (12) 33% (26) 78Agnostic/Nothing in particular 19% (93) 30% (145) 18% (88) 32% (153) 480Something Else 14% (40) 31% (90) 19% (57) 36% (106) 293Religious Non-Protestant/Catholic 23% (30) 32% (41) 21% (27) 24% (31) 129Evangelical 17% (84) 30% (151) 21% (102) 32% (161) 499Non-Evangelical 19% (147) 33% (261) 18% (144) 30% (238) 790Community: Urban 23% (111) 34% (166) 16% (79) 27% (131) 487Community: Suburban 18% (189) 30% (313) 20% (206) 32% (334) 1041Community: Rural 17% (78) 32% (150) 20% (94) 32% (148) 469Employ: Private Sector 22% (153) 30% (205) 19% (133) 28% (193) 684Employ: Government 9% (10) 37% (42) 22% (24) 33% (37) 112Employ: Self-Employed 18% (33) 30% (54) 24% (43) 29% (52) 183Employ: Homemaker 15% (15) 24% (25) 14% (14) 47% (49) 104Employ: Student 20% (14) 30% (20) 17% (11) 33% (22) 67Employ: Retired 19% (103) 40% (213) 17% (91) 23% (125) 534Employ: Unemployed 19% (37) 21% (41) 20% (38) 40% (75) 191Employ: Other 10% (13) 23% (29) 19% (24) 47% (58) 124Military HH: Yes 17% (54) 34% (108) 22% (71) 26% (82) 315Military HH: No 19% (324) 31% (520) 18% (308) 32% (531) 1683RD/WT: Right Direction 22% (170) 35% (264) 17% (127) 26% (197) 757RD/WT: Wrong Track 17% (208) 29% (365) 20% (252) 34% (416) 1241Biden Job Approve 22% (200) 36% (323) 16% (144) 26% (232) 899Biden Job Disapprove 17% (177) 29% (301) 20% (209) 34% (353) 1039Biden Job Strongly Approve 28% (116) 38% (160) 12% (52) 22% (90) 418Biden Job Somewhat Approve 17% (84) 34% (163) 19% (92) 30% (142) 481Biden Job Somewhat Disapprove 15% (39) 25% (63) 23% (57) 37% (92) 250Biden Job Strongly Disapprove 18% (138) 30% (237) 19% (152) 33% (261) 788
Continued on next page
Page 134
134
Morning ConsultTable POL8_2
Table POL8_2: How much have you seen, read, or heard about the following?Workers at companies including Kellogg’s and John Deere going on strike
Demographic A lot Some Not Much Nothing at all Total N
Registered Voters 19% (378) 31% (629) 19% (379) 31% (613) 1998Favorable of Biden 22% (202) 36% (330) 17% (155) 26% (239) 927Unfavorable of Biden 17% (174) 29% (293) 20% (206) 34% (345) 1019Very Favorable of Biden 27% (128) 38% (179) 13% (61) 23% (107) 476Somewhat Favorable of Biden 16% (74) 33% (151) 21% (94) 29% (132) 451Somewhat Unfavorable of Biden 18% (38) 26% (55) 23% (47) 33% (67) 207Very Unfavorable of Biden 17% (136) 29% (239) 20% (159) 34% (278) 812#1 Issue: Economy 19% (144) 30% (233) 19% (148) 32% (244) 768#1 Issue: Security 17% (60) 29% (103) 20% (74) 34% (123) 360#1 Issue: Health Care 17% (40) 41% (95) 16% (36) 26% (60) 231#1 Issue: Medicare / Social Security 24% (55) 32% (72) 19% (43) 25% (57) 227#1 Issue: Women’s Issues 20% (25) 35% (44) 19% (23) 27% (33) 125#1 Issue: Education 11% (6) 35% (20) 23% (14) 32% (19) 59#1 Issue: Energy 22% (23) 25% (27) 20% (21) 33% (35) 107#1 Issue: Other 20% (24) 29% (35) 17% (21) 34% (42) 1222020 Vote: Joe Biden 23% (214) 34% (323) 17% (157) 27% (252) 9462020 Vote: Donald Trump 17% (146) 31% (268) 21% (179) 31% (271) 8642020 Vote: Didn’t Vote 10% (15) 20% (31) 24% (36) 47% (72) 1532018 House Vote: Democrat 23% (180) 36% (279) 15% (114) 26% (196) 7692018 House Vote: Republican 18% (124) 33% (233) 21% (145) 28% (200) 7022016 Vote: Hillary Clinton 24% (168) 35% (243) 14% (95) 26% (180) 6852016 Vote: Donald Trump 18% (145) 32% (259) 20% (162) 30% (237) 8022016 Vote: Other 9% (8) 40% (33) 27% (23) 24% (20) 842016 Vote: Didn’t Vote 14% (58) 22% (91) 23% (99) 41% (174) 423Voted in 2014: Yes 21% (281) 35% (465) 18% (240) 26% (349) 1335Voted in 2014: No 15% (97) 25% (164) 21% (138) 40% (263) 6634-Region: Northeast 21% (73) 29% (102) 16% (58) 34% (119) 3534-Region: Midwest 21% (95) 33% (149) 21% (94) 24% (107) 4444-Region: South 18% (134) 31% (228) 18% (131) 34% (253) 7464-Region: West 17% (76) 33% (150) 21% (96) 29% (133) 455Party: Democrat/Leans Democrat 23% (210) 33% (299) 17% (160) 27% (245) 914Party: Republican/Leans Republican 16% (130) 30% (246) 19% (151) 35% (281) 808Note: Row proportions may total to larger than one-hundred percent due to rounding. For more information visit MorningConsultIntelligence.com.
Page 135
National Tracking Poll #2110084, October, 2021
135
Table POL8_3
Table POL8_3: How much have you seen, read, or heard about the following?Former President Donald Trump saying ’if we don’t solve the presidential election fraud of 2020, Republicans will not be voting in 2022 or 2024’
Demographic A lot Some Not Much Nothing at all Total N
Registered Voters 21% (421) 29% (585) 20% (408) 29% (584) 1998Gender: Male 24% (228) 32% (301) 21% (195) 23% (218) 942Gender: Female 18% (193) 27% (284) 20% (213) 35% (366) 1056Age: 18-34 22% (111) 28% (145) 22% (114) 28% (144) 514Age: 35-44 19% (60) 31% (95) 18% (54) 32% (98) 307Age: 45-64 19% (127) 29% (199) 21% (140) 31% (213) 679Age: 65+ 25% (123) 29% (146) 20% (100) 26% (129) 497GenZers: 1997-2012 13% (23) 26% (45) 24% (41) 36% (61) 170Millennials: 1981-1996 24% (133) 30% (168) 18% (102) 27% (149) 551GenXers: 1965-1980 15% (71) 26% (123) 26% (123) 32% (153) 469Baby Boomers: 1946-1964 25% (182) 29% (215) 17% (128) 28% (207) 732PID: Dem (no lean) 22% (170) 32% (250) 18% (140) 28% (217) 777PID: Ind (no lean) 17% (92) 27% (140) 24% (127) 32% (169) 528PID: Rep (no lean) 23% (159) 28% (195) 20% (141) 29% (198) 693PID/Gender: DemMen 25% (88) 37% (129) 15% (54) 23% (81) 352PID/Gender: DemWomen 19% (81) 28% (121) 20% (86) 32% (136) 425PID/Gender: Ind Men 18% (51) 27% (76) 26% (74) 28% (78) 280PID/Gender: Ind Women 16% (40) 26% (64) 21% (53) 37% (91) 248PID/Gender: Rep Men 29% (89) 31% (95) 22% (67) 19% (59) 310PID/Gender: Rep Women 18% (71) 26% (99) 19% (74) 36% (139) 384Ideo: Liberal (1-3) 25% (143) 31% (177) 19% (108) 24% (138) 566Ideo: Moderate (4) 18% (103) 31% (171) 21% (118) 30% (168) 560Ideo: Conservative (5-7) 22% (164) 28% (202) 21% (156) 29% (208) 730Educ: < College 19% (229) 27% (327) 20% (242) 34% (409) 1206Educ: Bachelors degree 23% (115) 31% (155) 21% (105) 25% (126) 501Educ: Post-grad 27% (78) 35% (103) 21% (61) 17% (49) 290Income: Under 50k 20% (175) 26% (226) 21% (186) 33% (286) 873Income: 50k-100k 21% (152) 29% (214) 20% (145) 30% (216) 728Income: 100k+ 24% (94) 36% (145) 19% (77) 21% (82) 398Ethnicity: White 22% (336) 29% (455) 21% (319) 28% (433) 1544Ethnicity: Hispanic 21% (48) 24% (54) 28% (61) 27% (59) 222Ethnicity: Black 18% (46) 29% (73) 19% (47) 34% (87) 253
Continued on next page
Page 136
136
Morning ConsultTable POL8_3
Table POL8_3: How much have you seen, read, or heard about the following?Former President Donald Trump saying ’if we don’t solve the presidential election fraud of 2020, Republicans will not be voting in 2022 or 2024’
Demographic A lot Some Not Much Nothing at all Total N
Registered Voters 21% (421) 29% (585) 20% (408) 29% (584) 1998Ethnicity: Other 19% (39) 28% (56) 21% (41) 32% (64) 201All Christian 21% (223) 29% (305) 20% (212) 29% (301) 1041All Non-Christian 29% (31) 35% (37) 19% (20) 17% (18) 107Atheist 22% (17) 37% (29) 18% (14) 23% (18) 78Agnostic/Nothing in particular 19% (92) 29% (141) 21% (103) 30% (143) 480Something Else 20% (57) 25% (72) 20% (59) 35% (104) 293Religious Non-Protestant/Catholic 26% (34) 34% (44) 18% (24) 21% (27) 129Evangelical 23% (113) 26% (129) 19% (95) 32% (161) 499Non-Evangelical 20% (157) 29% (233) 21% (168) 29% (232) 790Community: Urban 24% (119) 30% (148) 20% (97) 25% (123) 487Community: Suburban 20% (204) 30% (316) 20% (204) 31% (318) 1041Community: Rural 21% (99) 26% (120) 23% (107) 31% (143) 469Employ: Private Sector 19% (132) 31% (210) 23% (155) 27% (186) 684Employ: Government 22% (25) 31% (35) 19% (21) 28% (31) 112Employ: Self-Employed 28% (50) 31% (57) 16% (30) 25% (46) 183Employ: Homemaker 20% (21) 27% (27) 20% (21) 33% (34) 104Employ: Student 7% (5) 34% (23) 29% (20) 30% (20) 67Employ: Retired 24% (126) 30% (159) 19% (100) 28% (148) 534Employ: Unemployed 17% (32) 25% (48) 22% (41) 36% (69) 191Employ: Other 24% (30) 20% (24) 16% (20) 40% (49) 124Military HH: Yes 22% (68) 29% (93) 18% (57) 31% (96) 315Military HH: No 21% (353) 29% (492) 21% (351) 29% (488) 1683RD/WT: Right Direction 25% (191) 32% (239) 18% (140) 25% (188) 757RD/WT: Wrong Track 19% (231) 28% (346) 22% (268) 32% (396) 1241Biden Job Approve 25% (226) 31% (279) 18% (161) 26% (233) 899Biden Job Disapprove 19% (193) 28% (294) 22% (232) 31% (319) 1039Biden Job Strongly Approve 32% (133) 33% (137) 14% (57) 22% (91) 418Biden Job Somewhat Approve 19% (93) 30% (142) 22% (104) 30% (142) 481Biden Job Somewhat Disapprove 11% (28) 35% (87) 24% (60) 30% (76) 250Biden Job Strongly Disapprove 21% (165) 26% (207) 22% (173) 31% (244) 788
Continued on next page
Page 137
National Tracking Poll #2110084, October, 2021
137
Table POL8_3
Table POL8_3: How much have you seen, read, or heard about the following?Former President Donald Trump saying ’if we don’t solve the presidential election fraud of 2020, Republicans will not be voting in 2022 or 2024’
Demographic A lot Some Not Much Nothing at all Total N
Registered Voters 21% (421) 29% (585) 20% (408) 29% (584) 1998Favorable of Biden 24% (225) 32% (297) 18% (168) 26% (237) 927Unfavorable of Biden 19% (194) 27% (278) 23% (230) 31% (317) 1019Very Favorable of Biden 30% (143) 34% (161) 14% (67) 22% (105) 476Somewhat Favorable of Biden 18% (82) 30% (136) 22% (100) 29% (132) 451Somewhat Unfavorable of Biden 12% (24) 37% (76) 22% (45) 30% (62) 207Very Unfavorable of Biden 21% (170) 25% (202) 23% (184) 31% (255) 812#1 Issue: Economy 17% (130) 28% (215) 23% (180) 32% (243) 768#1 Issue: Security 20% (71) 30% (108) 21% (74) 29% (106) 360#1 Issue: Health Care 21% (48) 35% (80) 18% (41) 26% (61) 231#1 Issue: Medicare / Social Security 28% (62) 28% (63) 20% (45) 25% (56) 227#1 Issue: Women’s Issues 26% (32) 23% (29) 18% (22) 33% (42) 125#1 Issue: Education 16% (9) 38% (22) 13% (8) 34% (20) 59#1 Issue: Energy 28% (30) 29% (31) 19% (21) 23% (25) 107#1 Issue: Other 31% (38) 29% (35) 14% (17) 26% (32) 1222020 Vote: Joe Biden 24% (224) 31% (296) 19% (178) 26% (247) 9462020 Vote: Donald Trump 21% (182) 28% (244) 22% (191) 29% (248) 8642020 Vote: Didn’t Vote 8% (12) 26% (40) 16% (25) 50% (76) 1532018 House Vote: Democrat 24% (185) 31% (242) 17% (132) 27% (210) 7692018 House Vote: Republican 21% (150) 30% (209) 23% (159) 26% (183) 7022016 Vote: Hillary Clinton 23% (159) 32% (219) 17% (118) 28% (189) 6852016 Vote: Donald Trump 24% (189) 29% (236) 21% (171) 26% (207) 8022016 Vote: Other 15% (13) 22% (19) 30% (26) 32% (27) 842016 Vote: Didn’t Vote 14% (60) 26% (109) 22% (92) 38% (162) 423Voted in 2014: Yes 23% (306) 31% (409) 20% (269) 26% (351) 1335Voted in 2014: No 17% (115) 26% (175) 21% (139) 35% (233) 6634-Region: Northeast 21% (76) 30% (107) 17% (62) 31% (109) 3534-Region: Midwest 20% (90) 25% (111) 24% (107) 31% (136) 4444-Region: South 20% (146) 29% (217) 21% (156) 30% (226) 7464-Region: West 24% (109) 33% (149) 18% (84) 25% (113) 455Party: Democrat/Leans Democrat 22% (204) 32% (291) 18% (168) 27% (251) 914Party: Republican/Leans Republican 21% (170) 27% (222) 21% (171) 30% (244) 808Note: Row proportions may total to larger than one-hundred percent due to rounding. For more information visit MorningConsultIntelligence.com.
Page 138
138
Morning ConsultTable POL8_4
Table POL8_4: How much have you seen, read, or heard about the following?Consumer prices in September 2021 rising 5.4% from a year ago, matching a 13-year high in inflation
Demographic A lot Some Not Much Nothing at all Total N
Registered Voters 34% (671) 36% (714) 13% (262) 18% (350) 1998Gender: Male 36% (337) 39% (365) 12% (114) 13% (126) 942Gender: Female 32% (334) 33% (349) 14% (148) 21% (224) 1056Age: 18-34 29% (149) 32% (165) 14% (73) 25% (127) 514Age: 35-44 26% (81) 33% (102) 19% (58) 21% (66) 307Age: 45-64 34% (233) 35% (237) 13% (87) 18% (123) 679Age: 65+ 42% (208) 42% (211) 9% (44) 7% (35) 497GenZers: 1997-2012 22% (38) 29% (49) 17% (30) 32% (54) 170Millennials: 1981-1996 30% (168) 34% (185) 14% (77) 22% (121) 551GenXers: 1965-1980 31% (143) 34% (157) 16% (73) 20% (95) 469Baby Boomers: 1946-1964 38% (280) 41% (297) 11% (79) 10% (76) 732PID: Dem (no lean) 27% (206) 41% (322) 14% (106) 18% (142) 777PID: Ind (no lean) 30% (161) 33% (172) 16% (84) 21% (111) 528PID: Rep (no lean) 44% (304) 32% (221) 10% (71) 14% (97) 693PID/Gender: DemMen 29% (101) 45% (159) 13% (44) 14% (49) 352PID/Gender: DemWomen 25% (105) 38% (163) 15% (62) 22% (94) 425PID/Gender: Ind Men 33% (94) 34% (96) 14% (38) 18% (51) 280PID/Gender: Ind Women 27% (67) 30% (75) 19% (46) 24% (59) 248PID/Gender: Rep Men 46% (142) 36% (110) 10% (31) 8% (26) 310PID/Gender: Rep Women 42% (162) 29% (111) 10% (40) 19% (71) 384Ideo: Liberal (1-3) 27% (150) 40% (228) 14% (81) 19% (106) 566Ideo: Moderate (4) 29% (161) 39% (217) 16% (89) 17% (93) 560Ideo: Conservative (5-7) 47% (342) 33% (241) 9% (64) 11% (84) 730Educ: < College 31% (378) 34% (411) 13% (160) 21% (258) 1206Educ: Bachelors degree 35% (177) 36% (179) 14% (72) 14% (73) 501Educ: Post-grad 40% (116) 43% (124) 10% (30) 7% (20) 290Income: Under 50k 29% (250) 35% (303) 14% (118) 23% (201) 873Income: 50k-100k 35% (258) 36% (264) 13% (94) 15% (111) 728Income: 100k+ 41% (163) 37% (147) 13% (50) 10% (38) 398Ethnicity: White 36% (555) 36% (555) 12% (192) 16% (242) 1544Ethnicity: Hispanic 35% (78) 29% (65) 14% (32) 21% (48) 222Ethnicity: Black 22% (54) 37% (93) 16% (40) 26% (66) 253
Continued on next page
Page 139
National Tracking Poll #2110084, October, 2021
139
Table POL8_4
Table POL8_4: How much have you seen, read, or heard about the following?Consumer prices in September 2021 rising 5.4% from a year ago, matching a 13-year high in inflation
Demographic A lot Some Not Much Nothing at all Total N
Registered Voters 34% (671) 36% (714) 13% (262) 18% (350) 1998Ethnicity: Other 31% (62) 33% (66) 15% (30) 21% (43) 201All Christian 39% (406) 35% (364) 13% (131) 14% (141) 1041All Non-Christian 36% (39) 43% (46) 6% (7) 14% (15) 107Atheist 27% (21) 34% (26) 16% (12) 23% (18) 78Agnostic/Nothing in particular 28% (134) 34% (164) 15% (72) 23% (111) 480Something Else 25% (72) 39% (115) 14% (40) 23% (66) 293Religious Non-Protestant/Catholic 38% (49) 41% (53) 7% (10) 14% (18) 129Evangelical 35% (174) 34% (170) 13% (63) 18% (91) 499Non-Evangelical 36% (283) 37% (291) 13% (103) 14% (112) 790Community: Urban 33% (162) 39% (190) 12% (59) 16% (77) 487Community: Suburban 33% (345) 36% (375) 13% (138) 18% (183) 1041Community: Rural 35% (164) 32% (149) 14% (65) 19% (91) 469Employ: Private Sector 36% (248) 35% (237) 15% (104) 14% (95) 684Employ: Government 29% (33) 45% (50) 9% (10) 17% (19) 112Employ: Self-Employed 39% (71) 31% (57) 12% (21) 19% (34) 183Employ: Homemaker 22% (23) 36% (38) 17% (18) 25% (25) 104Employ: Student 15% (10) 30% (20) 22% (15) 33% (22) 67Employ: Retired 41% (221) 40% (214) 9% (50) 9% (48) 534Employ: Unemployed 18% (34) 35% (67) 13% (24) 34% (65) 191Employ: Other 26% (32) 25% (31) 15% (18) 34% (42) 124Military HH: Yes 40% (125) 35% (109) 8% (27) 17% (54) 315Military HH: No 32% (546) 36% (605) 14% (235) 18% (297) 1683RD/WT: Right Direction 26% (200) 42% (322) 13% (102) 18% (134) 757RD/WT: Wrong Track 38% (471) 32% (393) 13% (160) 17% (217) 1241Biden Job Approve 26% (235) 43% (385) 14% (123) 17% (156) 899Biden Job Disapprove 42% (432) 31% (320) 12% (126) 15% (161) 1039Biden Job Strongly Approve 29% (123) 45% (187) 13% (56) 13% (52) 418Biden Job Somewhat Approve 23% (112) 41% (198) 14% (68) 21% (103) 481Biden Job Somewhat Disapprove 28% (71) 36% (90) 18% (46) 17% (43) 250Biden Job Strongly Disapprove 46% (361) 29% (229) 10% (80) 15% (117) 788
Continued on next page
Page 140
140
Morning ConsultTable POL8_4
Table POL8_4: How much have you seen, read, or heard about the following?Consumer prices in September 2021 rising 5.4% from a year ago, matching a 13-year high in inflation
Demographic A lot Some Not Much Nothing at all Total N
Registered Voters 34% (671) 36% (714) 13% (262) 18% (350) 1998Favorable of Biden 27% (246) 42% (386) 13% (124) 18% (170) 927Unfavorable of Biden 41% (419) 31% (316) 12% (125) 16% (159) 1019Very Favorable of Biden 30% (142) 45% (214) 12% (58) 13% (61) 476Somewhat Favorable of Biden 23% (104) 38% (172) 15% (66) 24% (109) 451Somewhat Unfavorable of Biden 27% (55) 40% (83) 19% (39) 15% (30) 207Very Unfavorable of Biden 45% (364) 29% (232) 11% (86) 16% (129) 812#1 Issue: Economy 35% (272) 37% (282) 12% (93) 16% (121) 768#1 Issue: Security 41% (148) 31% (110) 13% (47) 15% (54) 360#1 Issue: Health Care 25% (57) 41% (94) 14% (32) 21% (48) 231#1 Issue: Medicare / Social Security 40% (91) 38% (85) 12% (27) 10% (23) 227#1 Issue: Women’s Issues 19% (24) 28% (35) 19% (24) 33% (42) 125#1 Issue: Education 19% (11) 43% (25) 14% (8) 24% (14) 59#1 Issue: Energy 24% (25) 43% (46) 15% (16) 18% (20) 107#1 Issue: Other 35% (43) 30% (36) 12% (15) 23% (28) 1222020 Vote: Joe Biden 27% (257) 41% (387) 15% (140) 17% (162) 9462020 Vote: Donald Trump 44% (382) 32% (280) 10% (89) 13% (112) 8642020 Vote: Didn’t Vote 15% (22) 25% (39) 16% (25) 44% (67) 1532018 House Vote: Democrat 28% (215) 42% (324) 14% (104) 16% (125) 7692018 House Vote: Republican 45% (317) 35% (249) 11% (76) 8% (59) 7022016 Vote: Hillary Clinton 29% (200) 41% (280) 14% (96) 16% (108) 6852016 Vote: Donald Trump 44% (351) 36% (286) 11% (88) 10% (77) 8022016 Vote: Other 30% (25) 33% (27) 15% (13) 22% (18) 842016 Vote: Didn’t Vote 22% (95) 28% (116) 15% (65) 35% (147) 423Voted in 2014: Yes 38% (505) 38% (508) 12% (160) 12% (162) 1335Voted in 2014: No 25% (166) 31% (207) 15% (102) 28% (188) 6634-Region: Northeast 34% (121) 39% (136) 11% (40) 16% (56) 3534-Region: Midwest 34% (150) 34% (152) 17% (74) 15% (69) 4444-Region: South 34% (255) 35% (262) 12% (88) 19% (141) 7464-Region: West 32% (145) 36% (165) 13% (60) 19% (85) 455Party: Democrat/Leans Democrat 27% (247) 41% (374) 14% (130) 18% (164) 914Party: Republican/Leans Republican 43% (349) 32% (260) 10% (84) 14% (115) 808Note: Row proportions may total to larger than one-hundred percent due to rounding. For more information visit MorningConsultIntelligence.com.
Page 141
National Tracking Poll #2110084, October, 2021
141
Table POL8_5
Table POL8_5: How much have you seen, read, or heard about the following?Law enforcement officials searching for Brian Laundrie, the former boyfriend of Gabby Petito and a person of interest in the investigation of herhomicide
Demographic A lot Some Not Much Nothing at all Total N
Registered Voters 47% (946) 30% (609) 10% (204) 12% (239) 1998Gender: Male 44% (417) 34% (324) 11% (100) 11% (101) 942Gender: Female 50% (529) 27% (285) 10% (104) 13% (138) 1056Age: 18-34 40% (208) 25% (131) 14% (73) 20% (103) 514Age: 35-44 42% (129) 28% (86) 13% (39) 17% (53) 307Age: 45-64 48% (327) 33% (226) 9% (62) 10% (65) 679Age: 65+ 57% (283) 33% (166) 6% (30) 4% (19) 497GenZers: 1997-2012 35% (60) 19% (32) 20% (34) 26% (44) 170Millennials: 1981-1996 43% (236) 28% (155) 12% (64) 17% (96) 551GenXers: 1965-1980 45% (210) 35% (162) 10% (47) 11% (51) 469Baby Boomers: 1946-1964 54% (396) 32% (235) 8% (57) 6% (44) 732PID: Dem (no lean) 48% (369) 32% (252) 9% (69) 11% (87) 777PID: Ind (no lean) 41% (219) 32% (170) 13% (68) 14% (71) 528PID: Rep (no lean) 52% (358) 27% (187) 10% (67) 12% (81) 693PID/Gender: DemMen 44% (153) 36% (126) 8% (29) 13% (44) 352PID/Gender: DemWomen 51% (216) 30% (127) 9% (39) 10% (42) 425PID/Gender: Ind Men 38% (108) 35% (99) 16% (44) 10% (29) 280PID/Gender: Ind Women 45% (111) 29% (71) 10% (24) 17% (42) 248PID/Gender: Rep Men 51% (156) 32% (99) 8% (26) 9% (28) 310PID/Gender: Rep Women 52% (201) 23% (88) 11% (41) 14% (53) 384Ideo: Liberal (1-3) 49% (275) 32% (180) 9% (52) 10% (59) 566Ideo: Moderate (4) 44% (248) 32% (177) 12% (66) 12% (68) 560Ideo: Conservative (5-7) 52% (381) 31% (225) 8% (61) 9% (63) 730Educ: < College 46% (561) 28% (342) 11% (129) 14% (174) 1206Educ: Bachelors degree 48% (241) 34% (169) 9% (43) 10% (48) 501Educ: Post-grad 49% (144) 34% (98) 11% (32) 6% (17) 290Income: Under 50k 43% (371) 30% (262) 11% (96) 16% (144) 873Income: 50k-100k 53% (385) 30% (217) 9% (69) 8% (57) 728Income: 100k+ 48% (190) 33% (130) 10% (39) 10% (39) 398Ethnicity: White 50% (768) 31% (484) 9% (133) 10% (159) 1544Ethnicity: Hispanic 37% (83) 32% (71) 17% (37) 14% (31) 222
Continued on next page
Page 142
142
Morning ConsultTable POL8_5
Table POL8_5: How much have you seen, read, or heard about the following?Law enforcement officials searching for Brian Laundrie, the former boyfriend of Gabby Petito and a person of interest in the investigation of herhomicide
Demographic A lot Some Not Much Nothing at all Total N
Registered Voters 47% (946) 30% (609) 10% (204) 12% (239) 1998Ethnicity: Black 41% (103) 23% (59) 18% (44) 19% (47) 253Ethnicity: Other 37% (75) 33% (66) 13% (27) 17% (34) 201All Christian 52% (539) 30% (317) 9% (91) 9% (94) 1041All Non-Christian 47% (50) 35% (37) 10% (11) 8% (8) 107Atheist 40% (31) 40% (31) 6% (5) 14% (11) 78Agnostic/Nothing in particular 41% (197) 29% (139) 13% (64) 17% (81) 480Something Else 44% (129) 29% (85) 12% (34) 15% (45) 293Religious Non-Protestant/Catholic 50% (64) 31% (40) 10% (13) 9% (12) 129Evangelical 48% (237) 28% (141) 9% (46) 15% (74) 499Non-Evangelical 51% (407) 32% (249) 9% (75) 8% (60) 790Community: Urban 46% (225) 28% (138) 14% (67) 12% (57) 487Community: Suburban 48% (497) 32% (333) 9% (95) 11% (116) 1041Community: Rural 48% (224) 29% (137) 9% (42) 14% (66) 469Employ: Private Sector 42% (287) 33% (226) 13% (90) 12% (81) 684Employ: Government 58% (65) 24% (27) 7% (8) 11% (12) 112Employ: Self-Employed 50% (91) 20% (36) 14% (25) 17% (31) 183Employ: Homemaker 47% (49) 35% (36) 4% (4) 14% (14) 104Employ: Student 30% (20) 28% (19) 22% (15) 19% (13) 67Employ: Retired 57% (303) 32% (171) 7% (35) 5% (25) 534Employ: Unemployed 42% (81) 32% (61) 8% (14) 18% (34) 191Employ: Other 40% (50) 26% (33) 10% (13) 23% (29) 124Military HH: Yes 51% (160) 33% (105) 6% (19) 10% (32) 315Military HH: No 47% (786) 30% (504) 11% (185) 12% (208) 1683RD/WT: Right Direction 45% (338) 33% (247) 10% (76) 13% (97) 757RD/WT: Wrong Track 49% (608) 29% (362) 10% (129) 11% (142) 1241Biden Job Approve 47% (420) 33% (300) 10% (87) 10% (93) 899Biden Job Disapprove 49% (511) 29% (301) 10% (107) 12% (120) 1039
Continued on next page
Page 143
National Tracking Poll #2110084, October, 2021
143
Table POL8_5
Table POL8_5: How much have you seen, read, or heard about the following?Law enforcement officials searching for Brian Laundrie, the former boyfriend of Gabby Petito and a person of interest in the investigation of herhomicide
Demographic A lot Some Not Much Nothing at all Total N
Registered Voters 47% (946) 30% (609) 10% (204) 12% (239) 1998Biden Job Strongly Approve 49% (205) 37% (156) 7% (28) 7% (28) 418Biden Job Somewhat Approve 45% (214) 30% (144) 12% (58) 13% (65) 481Biden Job Somewhat Disapprove 48% (119) 31% (78) 8% (19) 14% (34) 250Biden Job Strongly Disapprove 50% (392) 28% (223) 11% (88) 11% (86) 788Favorable of Biden 47% (436) 33% (305) 10% (89) 11% (97) 927Unfavorable of Biden 49% (499) 29% (293) 10% (105) 12% (122) 1019Very Favorable of Biden 50% (238) 33% (156) 10% (47) 7% (35) 476Somewhat Favorable of Biden 44% (198) 33% (149) 9% (42) 14% (62) 451Somewhat Unfavorable of Biden 50% (103) 30% (62) 6% (13) 14% (30) 207Very Unfavorable of Biden 49% (396) 29% (232) 11% (92) 11% (93) 812#1 Issue: Economy 46% (357) 29% (225) 12% (96) 12% (90) 768#1 Issue: Security 50% (180) 32% (115) 7% (26) 11% (38) 360#1 Issue: Health Care 45% (104) 31% (72) 6% (15) 17% (40) 231#1 Issue: Medicare / Social Security 53% (119) 31% (71) 8% (18) 8% (18) 227#1 Issue: Women’s Issues 49% (61) 32% (40) 9% (11) 10% (13) 125#1 Issue: Education 38% (23) 33% (19) 17% (10) 12% (7) 59#1 Issue: Energy 42% (45) 27% (29) 12% (13) 19% (20) 107#1 Issue: Other 46% (57) 30% (37) 13% (15) 11% (13) 1222020 Vote: Joe Biden 47% (442) 32% (306) 10% (94) 11% (104) 9462020 Vote: Donald Trump 49% (422) 30% (256) 11% (91) 11% (95) 8642020 Vote: Didn’t Vote 43% (66) 23% (35) 10% (15) 24% (37) 1532018 House Vote: Democrat 49% (373) 33% (254) 8% (59) 11% (83) 7692018 House Vote: Republican 52% (362) 31% (217) 10% (73) 7% (50) 7022016 Vote: Hillary Clinton 47% (320) 34% (232) 8% (57) 11% (75) 6852016 Vote: Donald Trump 52% (413) 30% (243) 10% (83) 8% (63) 8022016 Vote: Other 37% (31) 47% (39) 11% (9) 6% (5) 842016 Vote: Didn’t Vote 42% (179) 22% (94) 12% (53) 23% (97) 423Voted in 2014: Yes 50% (670) 33% (445) 8% (112) 8% (108) 1335Voted in 2014: No 42% (276) 25% (164) 14% (92) 20% (131) 663
Continued on next page
Page 144
144
Morning ConsultTable POL8_5
Table POL8_5: How much have you seen, read, or heard about the following?Law enforcement officials searching for Brian Laundrie, the former boyfriend of Gabby Petito and a person of interest in the investigation of herhomicide
Demographic A lot Some Not Much Nothing at all Total N
Registered Voters 47% (946) 30% (609) 10% (204) 12% (239) 19984-Region: Northeast 50% (177) 29% (103) 10% (34) 11% (38) 3534-Region: Midwest 46% (204) 31% (137) 11% (49) 12% (54) 4444-Region: South 49% (368) 29% (215) 9% (70) 12% (93) 7464-Region: West 43% (196) 34% (153) 11% (51) 12% (54) 455Party: Democrat/Leans Democrat 47% (432) 32% (294) 9% (82) 12% (106) 914Party: Republican/Leans Republican 50% (403) 28% (223) 11% (87) 12% (96) 808Note: Row proportions may total to larger than one-hundred percent due to rounding. For more information visit MorningConsultIntelligence.com.
Page 145
National Tracking Poll #2110084, October, 2021
145
Table POL9
Table POL9: Who would you say is most responsible for the current state of the economy?
Demographic Donald Trump Joe BidenDon’t know / No
opinion Total N
Registered Voters 31% (612) 52% (1039) 17% (347) 1998Gender: Male 28% (266) 56% (528) 16% (148) 942Gender: Female 33% (346) 48% (511) 19% (199) 1056Age: 18-34 34% (173) 46% (236) 20% (105) 514Age: 35-44 36% (110) 45% (139) 19% (58) 307Age: 45-64 28% (193) 54% (370) 17% (117) 679Age: 65+ 28% (137) 59% (294) 13% (67) 497GenZers: 1997-2012 32% (54) 39% (67) 29% (49) 170Millennials: 1981-1996 34% (187) 48% (266) 18% (98) 551GenXers: 1965-1980 31% (148) 51% (240) 17% (82) 469Baby Boomers: 1946-1964 28% (202) 57% (421) 15% (109) 732PID: Dem (no lean) 48% (376) 31% (241) 21% (160) 777PID: Ind (no lean) 28% (147) 48% (255) 24% (126) 528PID: Rep (no lean) 13% (89) 78% (543) 9% (61) 693PID/Gender: DemMen 44% (156) 37% (129) 19% (67) 352PID/Gender: DemWomen 52% (220) 26% (111) 22% (93) 425PID/Gender: Ind Men 23% (66) 57% (159) 20% (55) 280PID/Gender: Ind Women 33% (81) 38% (95) 29% (71) 248PID/Gender: Rep Men 14% (45) 77% (239) 8% (26) 310PID/Gender: Rep Women 12% (44) 79% (304) 9% (35) 384Ideo: Liberal (1-3) 49% (279) 31% (173) 20% (114) 566Ideo: Moderate (4) 38% (212) 43% (241) 19% (107) 560Ideo: Conservative (5-7) 12% (86) 78% (571) 10% (73) 730Educ: < College 30% (366) 53% (635) 17% (206) 1206Educ: Bachelors degree 32% (162) 51% (257) 17% (83) 501Educ: Post-grad 29% (85) 51% (147) 20% (59) 290Income: Under 50k 33% (287) 50% (438) 17% (148) 873Income: 50k-100k 28% (201) 53% (385) 19% (141) 728Income: 100k+ 31% (124) 54% (215) 15% (59) 398Ethnicity: White 29% (454) 55% (844) 16% (245) 1544Ethnicity: Hispanic 34% (75) 49% (108) 18% (40) 222Ethnicity: Black 34% (86) 39% (99) 27% (69) 253
Continued on next page
Page 146
146
Morning ConsultTable POL9
Table POL9: Who would you say is most responsible for the current state of the economy?
Demographic Donald Trump Joe BidenDon’t know / No
opinion Total N
Registered Voters 31% (612) 52% (1039) 17% (347) 1998Ethnicity: Other 36% (72) 48% (96) 16% (33) 201All Christian 26% (276) 59% (618) 14% (147) 1041All Non-Christian 34% (36) 48% (52) 18% (19) 107Atheist 52% (40) 28% (22) 20% (16) 78Agnostic/Nothing in particular 36% (175) 42% (199) 22% (106) 480Something Else 29% (85) 51% (148) 20% (60) 293Religious Non-Protestant/Catholic 34% (44) 47% (61) 19% (24) 129Evangelical 24% (119) 62% (309) 14% (71) 499Non-Evangelical 29% (228) 55% (435) 16% (127) 790Community: Urban 32% (157) 48% (231) 20% (99) 487Community: Suburban 32% (332) 49% (515) 19% (194) 1041Community: Rural 26% (124) 62% (292) 11% (54) 469Employ: Private Sector 31% (215) 52% (355) 17% (114) 684Employ: Government 34% (38) 49% (55) 17% (19) 112Employ: Self-Employed 24% (45) 56% (103) 19% (35) 183Employ: Homemaker 32% (33) 49% (51) 19% (20) 104Employ: Student 38% (26) 37% (25) 25% (17) 67Employ: Retired 27% (145) 59% (313) 14% (75) 534Employ: Unemployed 34% (65) 41% (79) 25% (47) 191Employ: Other 37% (45) 47% (58) 16% (20) 124Military HH: Yes 24% (76) 58% (182) 18% (57) 315Military HH: No 32% (536) 51% (856) 17% (290) 1683RD/WT: Right Direction 45% (339) 34% (260) 21% (158) 757RD/WT: Wrong Track 22% (273) 63% (778) 15% (189) 1241Biden Job Approve 50% (446) 31% (276) 20% (178) 899Biden Job Disapprove 14% (148) 73% (756) 13% (136) 1039Biden Job Strongly Approve 47% (195) 37% (153) 17% (70) 418Biden Job Somewhat Approve 52% (251) 25% (122) 22% (108) 481Biden Job Somewhat Disapprove 31% (79) 39% (97) 30% (74) 250Biden Job Strongly Disapprove 9% (69) 83% (658) 8% (61) 788
Continued on next page
Page 147
National Tracking Poll #2110084, October, 2021
147
Table POL9
Table POL9: Who would you say is most responsible for the current state of the economy?
Demographic Donald Trump Joe BidenDon’t know / No
opinion Total N
Registered Voters 31% (612) 52% (1039) 17% (347) 1998Favorable of Biden 50% (465) 30% (275) 20% (187) 927Unfavorable of Biden 14% (138) 74% (749) 13% (132) 1019Very Favorable of Biden 47% (225) 37% (174) 16% (77) 476Somewhat Favorable of Biden 53% (240) 22% (101) 24% (110) 451Somewhat Unfavorable of Biden 28% (58) 42% (86) 31% (63) 207Very Unfavorable of Biden 10% (80) 82% (663) 8% (68) 812#1 Issue: Economy 25% (193) 58% (449) 16% (127) 768#1 Issue: Security 19% (68) 71% (255) 10% (37) 360#1 Issue: Health Care 46% (107) 29% (67) 25% (57) 231#1 Issue: Medicare / Social Security 35% (78) 47% (106) 19% (43) 227#1 Issue: Women’s Issues 50% (62) 26% (32) 24% (30) 125#1 Issue: Education 44% (26) 33% (19) 23% (14) 59#1 Issue: Energy 41% (44) 44% (47) 15% (16) 107#1 Issue: Other 29% (35) 52% (63) 20% (24) 1222020 Vote: Joe Biden 49% (467) 30% (283) 21% (195) 9462020 Vote: Donald Trump 11% (96) 79% (681) 10% (87) 8642020 Vote: Didn’t Vote 27% (42) 39% (59) 34% (52) 1532018 House Vote: Democrat 46% (356) 34% (264) 19% (149) 7692018 House Vote: Republican 15% (103) 77% (541) 8% (57) 7022016 Vote: Hillary Clinton 50% (340) 31% (209) 20% (136) 6852016 Vote: Donald Trump 15% (117) 76% (611) 9% (74) 8022016 Vote: Other 31% (26) 44% (37) 25% (21) 842016 Vote: Didn’t Vote 30% (126) 42% (179) 28% (117) 423Voted in 2014: Yes 30% (404) 55% (741) 14% (190) 1335Voted in 2014: No 31% (208) 45% (298) 24% (157) 6634-Region: Northeast 33% (116) 50% (178) 17% (59) 3534-Region: Midwest 34% (153) 51% (225) 15% (67) 4444-Region: South 25% (190) 57% (424) 18% (132) 7464-Region: West 34% (154) 47% (212) 20% (89) 455Party: Democrat/Leans Democrat 48% (439) 31% (286) 21% (189) 914Party: Republican/Leans Republican 13% (104) 78% (627) 10% (77) 808Note: Row proportions may total to larger than one-hundred percent due to rounding. For more information visit MorningConsultIntelligence.com.
Page 148
148
Morning ConsultTable POL10_1
Table POL10_1: How concerned are you, if at all, about each of the following?The U.S. economy
Demographic Very concernedSomewhatconcerned Not too concerned
Not concerned atall Total N
Registered Voters 59% (1182) 33% (661) 6% (126) 1% (29) 1998Gender: Male 55% (521) 36% (339) 7% (67) 2% (14) 942Gender: Female 63% (661) 30% (322) 6% (59) 1% (14) 1056Age: 18-34 52% (265) 36% (183) 10% (49) 3% (17) 514Age: 35-44 55% (167) 37% (113) 7% (23) 1% (4) 307Age: 45-64 63% (431) 31% (209) 5% (34) 1% (6) 679Age: 65+ 64% (319) 31% (156) 4% (21) — (2) 497GenZers: 1997-2012 43% (73) 41% (69) 12% (20) 5% (8) 170Millennials: 1981-1996 56% (306) 35% (191) 8% (42) 2% (12) 551GenXers: 1965-1980 61% (287) 32% (149) 6% (29) 1% (4) 469Baby Boomers: 1946-1964 64% (466) 31% (230) 4% (32) 1% (4) 732PID: Dem (no lean) 47% (367) 42% (328) 9% (72) 1% (11) 777PID: Ind (no lean) 58% (305) 34% (177) 7% (35) 2% (10) 528PID: Rep (no lean) 74% (510) 22% (156) 3% (19) 1% (8) 693PID/Gender: DemMen 41% (145) 47% (164) 10% (37) 2% (7) 352PID/Gender: DemWomen 52% (221) 39% (164) 8% (35) 1% (4) 425PID/Gender: Ind Men 58% (161) 34% (95) 7% (19) 2% (5) 280PID/Gender: Ind Women 58% (144) 33% (83) 6% (16) 2% (5) 248PID/Gender: Rep Men 69% (215) 26% (81) 4% (11) 1% (3) 310PID/Gender: Rep Women 77% (295) 20% (75) 2% (8) 1% (5) 384Ideo: Liberal (1-3) 45% (255) 42% (240) 11% (62) 2% (9) 566Ideo: Moderate (4) 54% (303) 38% (214) 7% (39) 1% (3) 560Ideo: Conservative (5-7) 76% (553) 21% (155) 2% (14) 1% (8) 730Educ: < College 61% (736) 31% (371) 6% (78) 2% (22) 1206Educ: Bachelors degree 59% (297) 34% (173) 6% (30) — (1) 501Educ: Post-grad 52% (150) 40% (117) 6% (19) 2% (6) 290Income: Under 50k 61% (529) 31% (267) 7% (58) 2% (19) 873Income: 50k-100k 59% (432) 34% (249) 6% (42) 1% (4) 728Income: 100k+ 56% (221) 36% (145) 7% (26) 1% (6) 398Ethnicity: White 60% (925) 33% (503) 6% (96) 1% (20) 1544Ethnicity: Hispanic 56% (125) 38% (84) 4% (8) 2% (4) 222
Continued on next page
Page 149
National Tracking Poll #2110084, October, 2021
149
Table POL10_1
Table POL10_1: How concerned are you, if at all, about each of the following?The U.S. economy
Demographic Very concernedSomewhatconcerned Not too concerned
Not concerned atall Total N
Registered Voters 59% (1182) 33% (661) 6% (126) 1% (29) 1998Ethnicity: Black 55% (140) 36% (91) 7% (18) 2% (5) 253Ethnicity: Other 58% (117) 34% (68) 6% (13) 2% (4) 201All Christian 64% (666) 30% (314) 5% (55) 1% (7) 1041All Non-Christian 53% (56) 38% (41) 9% (9) — (0) 107Atheist 47% (36) 43% (34) 7% (6) 2% (2) 78Agnostic/Nothing in particular 49% (234) 40% (191) 9% (42) 3% (13) 480Something Else 65% (190) 28% (82) 5% (15) 2% (7) 293Religious Non-Protestant/Catholic 57% (73) 35% (45) 9% (11) — (0) 129Evangelical 69% (346) 25% (123) 5% (24) 1% (5) 499Non-Evangelical 61% (480) 33% (262) 5% (39) 1% (9) 790Community: Urban 56% (274) 33% (160) 9% (45) 2% (9) 487Community: Suburban 58% (602) 36% (372) 6% (59) 1% (9) 1041Community: Rural 65% (306) 28% (129) 5% (23) 2% (11) 469Employ: Private Sector 57% (392) 34% (234) 8% (55) — (3) 684Employ: Government 64% (72) 29% (32) 6% (6) 2% (2) 112Employ: Self-Employed 58% (106) 32% (59) 9% (16) 1% (2) 183Employ: Homemaker 57% (59) 32% (33) 7% (8) 4% (4) 104Employ: Student 47% (32) 40% (27) 10% (7) 3% (2) 67Employ: Retired 62% (333) 33% (177) 4% (20) 1% (4) 534Employ: Unemployed 55% (106) 34% (65) 6% (12) 4% (8) 191Employ: Other 67% (83) 27% (34) 2% (3) 3% (4) 124Military HH: Yes 59% (186) 36% (113) 4% (12) 1% (4) 315Military HH: No 59% (996) 33% (548) 7% (114) 1% (25) 1683RD/WT: Right Direction 41% (312) 46% (349) 11% (81) 2% (15) 757RD/WT: Wrong Track 70% (870) 25% (311) 4% (46) 1% (13) 1241Biden Job Approve 45% (401) 44% (399) 10% (89) 1% (10) 899Biden Job Disapprove 73% (761) 23% (236) 3% (30) 1% (12) 1039
Continued on next page
Page 150
150
Morning ConsultTable POL10_1
Table POL10_1: How concerned are you, if at all, about each of the following?The U.S. economy
Demographic Very concernedSomewhatconcerned Not too concerned
Not concerned atall Total N
Registered Voters 59% (1182) 33% (661) 6% (126) 1% (29) 1998Biden Job Strongly Approve 41% (171) 45% (190) 12% (51) 1% (6) 418Biden Job Somewhat Approve 48% (230) 44% (209) 8% (38) 1% (4) 481Biden Job Somewhat Disapprove 58% (146) 36% (90) 5% (12) 1% (2) 250Biden Job Strongly Disapprove 78% (615) 18% (145) 2% (18) 1% (11) 788Favorable of Biden 46% (424) 44% (405) 9% (86) 1% (12) 927Unfavorable of Biden 72% (736) 24% (240) 3% (31) 1% (12) 1019Very Favorable of Biden 45% (216) 42% (198) 11% (53) 2% (8) 476Somewhat Favorable of Biden 46% (208) 46% (206) 7% (33) 1% (4) 451Somewhat Unfavorable of Biden 53% (110) 41% (85) 5% (11) — (1) 207Very Unfavorable of Biden 77% (625) 19% (154) 3% (20) 1% (12) 812#1 Issue: Economy 66% (508) 30% (232) 3% (22) 1% (6) 768#1 Issue: Security 70% (251) 24% (85) 5% (18) 2% (6) 360#1 Issue: Health Care 39% (91) 46% (107) 13% (29) 2% (4) 231#1 Issue: Medicare / Social Security 60% (136) 34% (76) 6% (13) 1% (2) 227#1 Issue: Women’s Issues 36% (45) 50% (63) 10% (13) 3% (4) 125#1 Issue: Education 49% (29) 36% (21) 12% (7) 3% (2) 59#1 Issue: Energy 49% (53) 34% (37) 12% (13) 5% (5) 107#1 Issue: Other 57% (70) 33% (40) 10% (13) — (0) 1222020 Vote: Joe Biden 47% (446) 43% (405) 9% (85) 1% (10) 9462020 Vote: Donald Trump 74% (640) 21% (184) 3% (29) 1% (11) 8642020 Vote: Didn’t Vote 48% (74) 39% (60) 7% (11) 5% (8) 1532018 House Vote: Democrat 48% (371) 42% (327) 8% (63) 1% (8) 7692018 House Vote: Republican 76% (532) 20% (143) 3% (20) 1% (7) 7022016 Vote: Hillary Clinton 48% (332) 42% (285) 9% (59) 1% (8) 6852016 Vote: Donald Trump 76% (609) 20% (163) 3% (21) 1% (9) 8022016 Vote: Other 49% (41) 47% (39) 3% (2) 1% (1) 842016 Vote: Didn’t Vote 47% (197) 41% (173) 10% (42) 3% (11) 423Voted in 2014: Yes 63% (842) 31% (415) 5% (69) 1% (9) 1335Voted in 2014: No 51% (340) 37% (246) 9% (57) 3% (20) 663
Continued on next page
Page 151
National Tracking Poll #2110084, October, 2021
151
Table POL10_1
Table POL10_1: How concerned are you, if at all, about each of the following?The U.S. economy
Demographic Very concernedSomewhatconcerned Not too concerned
Not concerned atall Total N
Registered Voters 59% (1182) 33% (661) 6% (126) 1% (29) 19984-Region: Northeast 57% (201) 35% (123) 7% (25) 1% (4) 3534-Region: Midwest 61% (270) 32% (140) 7% (30) 1% (4) 4444-Region: South 65% (481) 28% (208) 5% (39) 2% (16) 7464-Region: West 50% (230) 42% (189) 7% (31) 1% (5) 455Party: Democrat/Leans Democrat 48% (434) 42% (384) 9% (83) 1% (13) 914Party: Republican/Leans Republican 73% (593) 23% (183) 3% (22) 1% (10) 808Note: Row proportions may total to larger than one-hundred percent due to rounding. For more information visit MorningConsultIntelligence.com.
Page 152
152
Morning ConsultTable POL10_2
Table POL10_2: How concerned are you, if at all, about each of the following?The COVID-19 pandemic
Demographic Very concernedSomewhatconcerned Not too concerned
Not concerned atall Total N
Registered Voters 47% (944) 28% (562) 16% (313) 9% (179) 1998Gender: Male 45% (428) 28% (266) 18% (165) 9% (83) 942Gender: Female 49% (517) 28% (296) 14% (148) 9% (96) 1056Age: 18-34 48% (248) 28% (142) 14% (71) 10% (53) 514Age: 35-44 50% (152) 33% (103) 10% (31) 7% (21) 307Age: 45-64 45% (305) 27% (187) 17% (116) 11% (71) 679Age: 65+ 48% (239) 26% (131) 19% (94) 7% (33) 497GenZers: 1997-2012 53% (91) 26% (44) 13% (23) 7% (12) 170Millennials: 1981-1996 46% (254) 31% (169) 13% (70) 11% (58) 551GenXers: 1965-1980 42% (199) 27% (129) 20% (94) 10% (48) 469Baby Boomers: 1946-1964 51% (370) 26% (194) 15% (109) 8% (59) 732PID: Dem (no lean) 65% (507) 26% (203) 7% (55) 1% (12) 777PID: Ind (no lean) 42% (224) 30% (157) 17% (87) 11% (59) 528PID: Rep (no lean) 31% (213) 29% (201) 25% (170) 16% (109) 693PID/Gender: DemMen 60% (210) 29% (104) 9% (31) 2% (7) 352PID/Gender: DemWomen 70% (296) 23% (100) 6% (24) 1% (5) 425PID/Gender: Ind Men 43% (120) 28% (79) 18% (49) 11% (31) 280PID/Gender: Ind Women 42% (104) 32% (78) 15% (38) 11% (28) 248PID/Gender: Rep Men 31% (97) 27% (83) 27% (84) 15% (45) 310PID/Gender: Rep Women 30% (116) 31% (118) 22% (86) 17% (64) 384Ideo: Liberal (1-3) 67% (378) 25% (141) 7% (38) 2% (10) 566Ideo: Moderate (4) 52% (290) 33% (185) 12% (65) 4% (20) 560Ideo: Conservative (5-7) 30% (216) 27% (196) 25% (184) 18% (134) 730Educ: < College 45% (537) 28% (339) 16% (197) 11% (133) 1206Educ: Bachelors degree 51% (256) 27% (134) 15% (76) 7% (35) 501Educ: Post-grad 52% (151) 30% (88) 14% (40) 4% (11) 290Income: Under 50k 48% (418) 27% (237) 15% (129) 10% (90) 873Income: 50k-100k 48% (350) 29% (209) 15% (106) 9% (63) 728Income: 100k+ 44% (176) 29% (116) 20% (78) 7% (27) 398Ethnicity: White 43% (666) 30% (459) 17% (269) 10% (150) 1544Ethnicity: Hispanic 53% (118) 23% (51) 12% (27) 12% (27) 222
Continued on next page
Page 153
National Tracking Poll #2110084, October, 2021
153
Table POL10_2
Table POL10_2: How concerned are you, if at all, about each of the following?The COVID-19 pandemic
Demographic Very concernedSomewhatconcerned Not too concerned
Not concerned atall Total N
Registered Voters 47% (944) 28% (562) 16% (313) 9% (179) 1998Ethnicity: Black 64% (163) 27% (69) 6% (14) 3% (7) 253Ethnicity: Other 58% (116) 17% (34) 15% (30) 11% (22) 201All Christian 43% (448) 30% (308) 19% (196) 9% (89) 1041All Non-Christian 62% (66) 26% (28) 8% (9) 4% (4) 107Atheist 60% (46) 28% (22) 5% (4) 7% (6) 78Agnostic/Nothing in particular 47% (224) 29% (140) 14% (65) 11% (51) 480Something Else 55% (160) 22% (64) 13% (39) 10% (30) 293Religious Non-Protestant/Catholic 62% (80) 25% (32) 9% (12) 4% (5) 129Evangelical 49% (245) 24% (119) 17% (85) 10% (49) 499Non-Evangelical 43% (342) 30% (238) 18% (141) 9% (68) 790Community: Urban 56% (273) 24% (117) 14% (69) 6% (28) 487Community: Suburban 46% (476) 31% (320) 16% (164) 8% (82) 1041Community: Rural 42% (195) 26% (124) 17% (80) 15% (70) 469Employ: Private Sector 44% (303) 30% (207) 18% (124) 7% (50) 684Employ: Government 52% (58) 32% (35) 9% (10) 8% (9) 112Employ: Self-Employed 50% (92) 28% (51) 16% (29) 6% (11) 183Employ: Homemaker 39% (40) 27% (28) 14% (14) 21% (22) 104Employ: Student 56% (38) 25% (17) 11% (8) 7% (5) 67Employ: Retired 47% (252) 27% (142) 17% (93) 9% (47) 534Employ: Unemployed 51% (96) 30% (57) 8% (16) 11% (21) 191Employ: Other 52% (65) 20% (25) 15% (19) 13% (16) 124Military HH: Yes 44% (138) 29% (93) 16% (51) 10% (33) 315Military HH: No 48% (806) 28% (469) 16% (261) 9% (147) 1683RD/WT: Right Direction 62% (471) 28% (215) 7% (56) 2% (15) 757RD/WT: Wrong Track 38% (473) 28% (346) 21% (257) 13% (164) 1241Biden Job Approve 66% (596) 27% (241) 6% (54) 1% (9) 899Biden Job Disapprove 32% (329) 28% (290) 25% (255) 16% (165) 1039
Continued on next page
Page 154
154
Morning ConsultTable POL10_2
Table POL10_2: How concerned are you, if at all, about each of the following?The COVID-19 pandemic
Demographic Very concernedSomewhatconcerned Not too concerned
Not concerned atall Total N
Registered Voters 47% (944) 28% (562) 16% (313) 9% (179) 1998Biden Job Strongly Approve 70% (293) 24% (99) 5% (23) 1% (4) 418Biden Job Somewhat Approve 63% (303) 30% (142) 6% (31) 1% (5) 481Biden Job Somewhat Disapprove 50% (126) 34% (85) 14% (34) 2% (5) 250Biden Job Strongly Disapprove 26% (202) 26% (205) 28% (221) 20% (160) 788Favorable of Biden 66% (615) 27% (249) 6% (52) 1% (10) 927Unfavorable of Biden 30% (308) 29% (291) 25% (256) 16% (164) 1019Very Favorable of Biden 71% (339) 22% (106) 5% (25) 1% (5) 476Somewhat Favorable of Biden 61% (276) 32% (143) 6% (27) 1% (5) 451Somewhat Unfavorable of Biden 47% (98) 35% (73) 16% (33) 2% (3) 207Very Unfavorable of Biden 26% (210) 27% (218) 28% (223) 20% (161) 812#1 Issue: Economy 41% (315) 32% (243) 17% (131) 10% (79) 768#1 Issue: Security 33% (118) 24% (88) 25% (91) 18% (63) 360#1 Issue: Health Care 61% (141) 28% (65) 8% (19) 3% (6) 231#1 Issue: Medicare / Social Security 62% (140) 27% (61) 7% (16) 5% (11) 227#1 Issue: Women’s Issues 57% (71) 31% (38) 6% (7) 7% (9) 125#1 Issue: Education 51% (30) 23% (14) 23% (13) 3% (2) 59#1 Issue: Energy 66% (70) 19% (20) 11% (12) 4% (5) 107#1 Issue: Other 49% (60) 27% (33) 19% (24) 4% (5) 1222020 Vote: Joe Biden 65% (618) 27% (254) 7% (64) 1% (10) 9462020 Vote: Donald Trump 29% (247) 29% (246) 26% (222) 17% (149) 8642020 Vote: Didn’t Vote 41% (63) 35% (53) 13% (20) 11% (17) 1532018 House Vote: Democrat 65% (498) 25% (194) 8% (63) 2% (13) 7692018 House Vote: Republican 29% (207) 30% (212) 25% (173) 16% (110) 7022016 Vote: Hillary Clinton 66% (452) 25% (171) 7% (51) 2% (11) 6852016 Vote: Donald Trump 30% (244) 29% (236) 24% (191) 16% (131) 8022016 Vote: Other 44% (37) 31% (26) 20% (17) 5% (4) 842016 Vote: Didn’t Vote 49% (209) 31% (129) 12% (52) 8% (33) 423Voted in 2014: Yes 48% (646) 27% (356) 17% (223) 8% (110) 1335Voted in 2014: No 45% (298) 31% (206) 14% (90) 11% (70) 663
Continued on next page
Page 155
National Tracking Poll #2110084, October, 2021
155
Table POL10_2
Table POL10_2: How concerned are you, if at all, about each of the following?The COVID-19 pandemic
Demographic Very concernedSomewhatconcerned Not too concerned
Not concerned atall Total N
Registered Voters 47% (944) 28% (562) 16% (313) 9% (179) 19984-Region: Northeast 50% (177) 31% (108) 13% (48) 6% (21) 3534-Region: Midwest 41% (184) 28% (122) 19% (86) 12% (52) 4444-Region: South 48% (361) 28% (205) 14% (107) 10% (72) 7464-Region: West 49% (222) 28% (126) 16% (72) 8% (34) 455Party: Democrat/Leans Democrat 64% (589) 27% (248) 7% (65) 1% (12) 914Party: Republican/Leans Republican 29% (237) 28% (230) 26% (211) 16% (130) 808Note: Row proportions may total to larger than one-hundred percent due to rounding. For more information visit MorningConsultIntelligence.com.
Page 156
156
Morning ConsultTable POL10_3
Table POL10_3: How concerned are you, if at all, about each of the following?Conflict between political parties
Demographic Very concernedSomewhatconcerned Not too concerned
Not concerned atall Total N
Registered Voters 42% (836) 34% (678) 16% (326) 8% (158) 1998Gender: Male 39% (371) 33% (313) 19% (183) 8% (75) 942Gender: Female 44% (465) 35% (365) 14% (143) 8% (83) 1056Age: 18-34 31% (159) 37% (188) 23% (117) 10% (49) 514Age: 35-44 37% (114) 36% (111) 17% (53) 10% (29) 307Age: 45-64 45% (306) 34% (228) 13% (89) 8% (56) 679Age: 65+ 52% (257) 30% (150) 14% (67) 5% (23) 497GenZers: 1997-2012 31% (52) 31% (53) 26% (44) 13% (22) 170Millennials: 1981-1996 33% (182) 38% (212) 20% (112) 8% (45) 551GenXers: 1965-1980 41% (194) 34% (158) 14% (68) 10% (49) 469Baby Boomers: 1946-1964 50% (369) 32% (236) 12% (91) 5% (36) 732PID: Dem (no lean) 44% (342) 34% (266) 15% (118) 7% (51) 777PID: Ind (no lean) 39% (206) 34% (180) 18% (94) 9% (48) 528PID: Rep (no lean) 42% (288) 33% (232) 16% (114) 9% (59) 693PID/Gender: DemMen 41% (143) 34% (121) 20% (70) 5% (19) 352PID/Gender: DemWomen 47% (199) 34% (146) 11% (48) 7% (32) 425PID/Gender: Ind Men 39% (109) 35% (98) 19% (52) 7% (20) 280PID/Gender: Ind Women 39% (97) 33% (81) 17% (42) 11% (28) 248PID/Gender: Rep Men 38% (119) 30% (94) 20% (61) 12% (36) 310PID/Gender: Rep Women 44% (170) 36% (138) 14% (53) 6% (23) 384Ideo: Liberal (1-3) 46% (261) 32% (180) 16% (91) 6% (34) 566Ideo: Moderate (4) 39% (216) 40% (223) 16% (89) 6% (32) 560Ideo: Conservative (5-7) 43% (316) 33% (243) 15% (107) 9% (64) 730Educ: < College 40% (484) 32% (389) 18% (216) 10% (117) 1206Educ: Bachelors degree 44% (219) 36% (181) 16% (78) 5% (23) 501Educ: Post-grad 46% (132) 37% (108) 11% (32) 6% (18) 290Income: Under 50k 38% (336) 33% (288) 19% (165) 10% (84) 873Income: 50k-100k 46% (331) 32% (236) 15% (112) 7% (48) 728Income: 100k+ 43% (169) 39% (155) 12% (49) 6% (25) 398Ethnicity: White 43% (663) 34% (531) 15% (231) 8% (118) 1544Ethnicity: Hispanic 43% (97) 35% (78) 13% (29) 8% (19) 222
Continued on next page
Page 157
National Tracking Poll #2110084, October, 2021
157
Table POL10_3
Table POL10_3: How concerned are you, if at all, about each of the following?Conflict between political parties
Demographic Very concernedSomewhatconcerned Not too concerned
Not concerned atall Total N
Registered Voters 42% (836) 34% (678) 16% (326) 8% (158) 1998Ethnicity: Black 33% (83) 31% (78) 25% (63) 11% (29) 253Ethnicity: Other 44% (89) 34% (69) 16% (32) 6% (11) 201All Christian 43% (446) 37% (386) 14% (142) 6% (67) 1041All Non-Christian 60% (64) 22% (24) 13% (14) 5% (5) 107Atheist 49% (38) 29% (22) 18% (14) 4% (3) 78Agnostic/Nothing in particular 37% (177) 31% (147) 21% (99) 12% (57) 480Something Else 38% (111) 34% (99) 19% (57) 9% (25) 293Religious Non-Protestant/Catholic 62% (79) 22% (28) 12% (15) 5% (6) 129Evangelical 43% (217) 36% (182) 14% (68) 6% (32) 499Non-Evangelical 40% (317) 37% (288) 16% (127) 7% (56) 790Community: Urban 41% (200) 35% (170) 17% (85) 7% (33) 487Community: Suburban 43% (445) 34% (354) 16% (166) 7% (77) 1041Community: Rural 41% (191) 33% (154) 16% (75) 10% (49) 469Employ: Private Sector 40% (273) 36% (245) 17% (114) 8% (52) 684Employ: Government 40% (45) 40% (45) 15% (17) 5% (6) 112Employ: Self-Employed 39% (72) 35% (64) 13% (23) 13% (24) 183Employ: Homemaker 35% (36) 40% (41) 16% (17) 9% (10) 104Employ: Student 40% (27) 31% (21) 24% (16) 5% (3) 67Employ: Retired 50% (264) 32% (170) 13% (67) 6% (33) 534Employ: Unemployed 29% (56) 36% (68) 23% (44) 12% (23) 191Employ: Other 51% (63) 20% (25) 22% (28) 7% (8) 124Military HH: Yes 48% (150) 29% (90) 15% (49) 8% (26) 315Military HH: No 41% (686) 35% (587) 16% (277) 8% (132) 1683RD/WT: Right Direction 43% (324) 35% (269) 15% (116) 6% (48) 757RD/WT: Wrong Track 41% (512) 33% (409) 17% (210) 9% (110) 1241Biden Job Approve 44% (400) 35% (314) 16% (143) 5% (42) 899Biden Job Disapprove 41% (422) 34% (349) 16% (171) 9% (96) 1039
Continued on next page
Page 158
158
Morning ConsultTable POL10_3
Table POL10_3: How concerned are you, if at all, about each of the following?Conflict between political parties
Demographic Very concernedSomewhatconcerned Not too concerned
Not concerned atall Total N
Registered Voters 42% (836) 34% (678) 16% (326) 8% (158) 1998Biden Job Strongly Approve 49% (206) 33% (139) 13% (54) 5% (19) 418Biden Job Somewhat Approve 40% (194) 36% (174) 19% (89) 5% (24) 481Biden Job Somewhat Disapprove 34% (86) 41% (101) 17% (44) 8% (20) 250Biden Job Strongly Disapprove 43% (337) 31% (248) 16% (127) 10% (77) 788Favorable of Biden 45% (420) 34% (315) 15% (141) 6% (51) 927Unfavorable of Biden 39% (402) 34% (347) 17% (172) 10% (97) 1019Very Favorable of Biden 52% (247) 30% (143) 12% (58) 6% (27) 476Somewhat Favorable of Biden 38% (173) 38% (171) 18% (83) 5% (24) 451Somewhat Unfavorable of Biden 35% (74) 40% (84) 18% (37) 6% (13) 207Very Unfavorable of Biden 41% (329) 32% (263) 17% (136) 10% (84) 812#1 Issue: Economy 39% (298) 36% (277) 17% (132) 8% (62) 768#1 Issue: Security 41% (149) 34% (121) 16% (59) 9% (31) 360#1 Issue: Health Care 42% (97) 34% (79) 17% (39) 7% (16) 231#1 Issue: Medicare / Social Security 52% (117) 30% (68) 13% (31) 5% (11) 227#1 Issue: Women’s Issues 40% (50) 32% (40) 16% (20) 11% (14) 125#1 Issue: Education 48% (29) 31% (19) 6% (4) 14% (8) 59#1 Issue: Energy 41% (44) 32% (34) 23% (25) 4% (4) 107#1 Issue: Other 43% (53) 33% (40) 14% (17) 10% (13) 1222020 Vote: Joe Biden 45% (428) 34% (322) 16% (150) 5% (46) 9462020 Vote: Donald Trump 41% (351) 35% (302) 16% (135) 9% (75) 8642020 Vote: Didn’t Vote 28% (43) 28% (43) 24% (36) 20% (31) 1532018 House Vote: Democrat 47% (359) 34% (260) 15% (114) 5% (36) 7692018 House Vote: Republican 43% (301) 34% (235) 15% (108) 8% (57) 7022016 Vote: Hillary Clinton 46% (313) 33% (228) 15% (104) 6% (40) 6852016 Vote: Donald Trump 43% (348) 33% (267) 14% (116) 9% (71) 8022016 Vote: Other 49% (41) 26% (22) 16% (13) 9% (7) 842016 Vote: Didn’t Vote 31% (132) 38% (160) 21% (91) 9% (40) 423Voted in 2014: Yes 45% (606) 33% (438) 15% (203) 7% (87) 1335Voted in 2014: No 35% (230) 36% (239) 19% (123) 11% (71) 663
Continued on next page
Page 159
National Tracking Poll #2110084, October, 2021
159
Table POL10_3
Table POL10_3: How concerned are you, if at all, about each of the following?Conflict between political parties
Demographic Very concernedSomewhatconcerned Not too concerned
Not concerned atall Total N
Registered Voters 42% (836) 34% (678) 16% (326) 8% (158) 19984-Region: Northeast 42% (149) 38% (133) 16% (56) 4% (14) 3534-Region: Midwest 43% (192) 32% (140) 16% (72) 9% (40) 4444-Region: South 39% (292) 34% (254) 18% (131) 9% (68) 7464-Region: West 44% (202) 33% (151) 15% (67) 8% (35) 455Party: Democrat/Leans Democrat 44% (399) 35% (323) 15% (137) 6% (56) 914Party: Republican/Leans Republican 41% (333) 34% (275) 16% (133) 8% (68) 808Note: Row proportions may total to larger than one-hundred percent due to rounding. For more information visit MorningConsultIntelligence.com.
Page 160
160
Morning ConsultTable POL10_4
Table POL10_4: How concerned are you, if at all, about each of the following?Inflation
Demographic Very concernedSomewhatconcerned Not too concerned
Not concerned atall Total N
Registered Voters 58% (1158) 31% (610) 9% (182) 2% (48) 1998Gender: Male 53% (501) 33% (308) 11% (107) 3% (26) 942Gender: Female 62% (657) 29% (302) 7% (75) 2% (22) 1056Age: 18-34 46% (235) 38% (197) 11% (59) 5% (24) 514Age: 35-44 55% (170) 31% (95) 11% (34) 2% (8) 307Age: 45-64 61% (414) 27% (186) 10% (65) 2% (14) 679Age: 65+ 68% (340) 26% (130) 5% (25) 1% (3) 497GenZers: 1997-2012 43% (73) 44% (75) 10% (17) 3% (5) 170Millennials: 1981-1996 50% (277) 34% (186) 12% (64) 4% (24) 551GenXers: 1965-1980 59% (275) 27% (125) 12% (55) 3% (14) 469Baby Boomers: 1946-1964 65% (477) 28% (208) 6% (42) 1% (5) 732PID: Dem (no lean) 44% (344) 40% (311) 13% (100) 3% (22) 777PID: Ind (no lean) 57% (300) 31% (166) 9% (49) 3% (13) 528PID: Rep (no lean) 74% (514) 19% (132) 5% (34) 2% (13) 693PID/Gender: DemMen 37% (131) 44% (154) 15% (53) 4% (14) 352PID/Gender: DemWomen 50% (214) 37% (157) 11% (47) 2% (7) 425PID/Gender: Ind Men 54% (151) 32% (91) 12% (33) 2% (6) 280PID/Gender: Ind Women 60% (149) 30% (75) 6% (16) 3% (8) 248PID/Gender: Rep Men 71% (219) 20% (63) 7% (22) 2% (6) 310PID/Gender: Rep Women 77% (295) 18% (69) 3% (12) 2% (7) 384Ideo: Liberal (1-3) 42% (239) 41% (230) 14% (77) 4% (20) 566Ideo: Moderate (4) 54% (304) 33% (187) 11% (61) 1% (8) 560Ideo: Conservative (5-7) 77% (559) 19% (139) 3% (22) 1% (10) 730Educ: < College 60% (720) 28% (341) 9% (115) 3% (31) 1206Educ: Bachelors degree 58% (293) 31% (154) 10% (48) 1% (5) 501Educ: Post-grad 50% (145) 39% (115) 7% (19) 4% (11) 290Income: Under 50k 57% (495) 31% (274) 9% (78) 3% (26) 873Income: 50k-100k 62% (451) 28% (200) 9% (62) 2% (14) 728Income: 100k+ 53% (212) 34% (135) 11% (42) 2% (8) 398Ethnicity: White 60% (921) 30% (458) 8% (129) 2% (36) 1544Ethnicity: Hispanic 55% (122) 36% (81) 6% (14) 3% (6) 222
Continued on next page
Page 161
National Tracking Poll #2110084, October, 2021
161
Table POL10_4
Table POL10_4: How concerned are you, if at all, about each of the following?Inflation
Demographic Very concernedSomewhatconcerned Not too concerned
Not concerned atall Total N
Registered Voters 58% (1158) 31% (610) 9% (182) 2% (48) 1998Ethnicity: Black 49% (125) 35% (90) 13% (33) 2% (5) 253Ethnicity: Other 56% (112) 31% (62) 10% (20) 3% (7) 201All Christian 63% (656) 29% (299) 7% (73) 1% (13) 1041All Non-Christian 50% (54) 37% (40) 10% (11) 2% (2) 107Atheist 35% (27) 42% (33) 17% (13) 5% (4) 78Agnostic/Nothing in particular 50% (241) 33% (158) 13% (62) 4% (19) 480Something Else 62% (181) 27% (80) 8% (23) 3% (9) 293Religious Non-Protestant/Catholic 53% (69) 35% (45) 10% (13) 2% (2) 129Evangelical 65% (324) 28% (139) 6% (28) 2% (8) 499Non-Evangelical 62% (488) 29% (228) 8% (61) 2% (12) 790Community: Urban 54% (265) 34% (167) 8% (41) 3% (14) 487Community: Suburban 57% (598) 31% (328) 9% (96) 2% (19) 1041Community: Rural 63% (295) 24% (114) 10% (45) 3% (15) 469Employ: Private Sector 55% (376) 32% (216) 12% (79) 2% (13) 684Employ: Government 49% (55) 34% (39) 12% (13) 5% (5) 112Employ: Self-Employed 57% (104) 28% (51) 13% (23) 2% (4) 183Employ: Homemaker 62% (64) 26% (27) 9% (9) 4% (4) 104Employ: Student 44% (30) 46% (31) 10% (7) — (0) 67Employ: Retired 66% (351) 28% (152) 5% (26) 1% (5) 534Employ: Unemployed 50% (96) 33% (63) 10% (18) 7% (13) 191Employ: Other 66% (82) 26% (32) 6% (7) 2% (3) 124Military HH: Yes 59% (185) 32% (100) 8% (26) 1% (4) 315Military HH: No 58% (973) 30% (510) 9% (156) 3% (44) 1683RD/WT: Right Direction 39% (299) 43% (326) 14% (107) 4% (27) 757RD/WT: Wrong Track 69% (859) 23% (284) 6% (76) 2% (21) 1241Biden Job Approve 42% (382) 42% (375) 14% (123) 2% (19) 899Biden Job Disapprove 73% (755) 20% (212) 5% (50) 2% (22) 1039
Continued on next page
Page 162
162
Morning ConsultTable POL10_4
Table POL10_4: How concerned are you, if at all, about each of the following?Inflation
Demographic Very concernedSomewhatconcerned Not too concerned
Not concerned atall Total N
Registered Voters 58% (1158) 31% (610) 9% (182) 2% (48) 1998Biden Job Strongly Approve 41% (173) 41% (169) 15% (65) 3% (11) 418Biden Job Somewhat Approve 43% (209) 43% (206) 12% (58) 2% (8) 481Biden Job Somewhat Disapprove 53% (132) 37% (93) 8% (19) 2% (6) 250Biden Job Strongly Disapprove 79% (622) 15% (119) 4% (31) 2% (16) 788Favorable of Biden 43% (398) 42% (389) 13% (118) 2% (22) 927Unfavorable of Biden 73% (742) 20% (199) 6% (57) 2% (21) 1019Very Favorable of Biden 42% (200) 41% (193) 14% (68) 3% (15) 476Somewhat Favorable of Biden 44% (198) 43% (196) 11% (50) 2% (7) 451Somewhat Unfavorable of Biden 54% (112) 37% (76) 8% (16) 1% (3) 207Very Unfavorable of Biden 78% (629) 15% (123) 5% (41) 2% (18) 812#1 Issue: Economy 63% (488) 28% (218) 6% (46) 2% (17) 768#1 Issue: Security 71% (256) 21% (76) 6% (20) 2% (7) 360#1 Issue: Health Care 41% (94) 42% (97) 14% (33) 3% (7) 231#1 Issue: Medicare / Social Security 63% (143) 28% (64) 8% (18) 1% (2) 227#1 Issue: Women’s Issues 35% (44) 44% (55) 15% (19) 5% (6) 125#1 Issue: Education 36% (21) 49% (29) 9% (5) 5% (3) 59#1 Issue: Energy 44% (47) 34% (36) 20% (21) 3% (3) 107#1 Issue: Other 53% (65) 28% (35) 17% (20) 1% (2) 1222020 Vote: Joe Biden 46% (431) 39% (369) 13% (125) 2% (20) 9462020 Vote: Donald Trump 74% (642) 20% (169) 4% (38) 2% (15) 8642020 Vote: Didn’t Vote 42% (65) 39% (60) 11% (17) 7% (11) 1532018 House Vote: Democrat 47% (361) 38% (296) 13% (97) 2% (16) 7692018 House Vote: Republican 74% (522) 19% (136) 4% (31) 2% (12) 7022016 Vote: Hillary Clinton 45% (308) 40% (271) 13% (86) 3% (19) 6852016 Vote: Donald Trump 75% (601) 18% (142) 5% (44) 2% (15) 8022016 Vote: Other 53% (44) 36% (30) 10% (8) 1% (1) 842016 Vote: Didn’t Vote 48% (202) 39% (165) 10% (42) 3% (13) 423Voted in 2014: Yes 61% (817) 29% (385) 8% (112) 2% (21) 1335Voted in 2014: No 51% (341) 34% (225) 11% (70) 4% (27) 663
Continued on next page
Page 163
National Tracking Poll #2110084, October, 2021
163
Table POL10_4
Table POL10_4: How concerned are you, if at all, about each of the following?Inflation
Demographic Very concernedSomewhatconcerned Not too concerned
Not concerned atall Total N
Registered Voters 58% (1158) 31% (610) 9% (182) 2% (48) 19984-Region: Northeast 56% (197) 33% (118) 9% (31) 2% (7) 3534-Region: Midwest 60% (265) 29% (131) 9% (40) 2% (9) 4444-Region: South 62% (459) 27% (203) 8% (60) 3% (24) 7464-Region: West 52% (236) 35% (158) 11% (51) 2% (9) 455Party: Democrat/Leans Democrat 45% (413) 39% (358) 13% (119) 3% (25) 914Party: Republican/Leans Republican 74% (595) 20% (160) 5% (39) 2% (14) 808Note: Row proportions may total to larger than one-hundred percent due to rounding. For more information visit MorningConsultIntelligence.com.
Page 164
164
Morning ConsultTable POL10_5
Table POL10_5: How concerned are you, if at all, about each of the following?Illegal immigration at the U.S.-Mexico border
Demographic Very concernedSomewhatconcerned Not too concerned
Not concerned atall Total N
Registered Voters 47% (940) 26% (516) 19% (377) 8% (166) 1998Gender: Male 46% (435) 27% (253) 19% (182) 8% (72) 942Gender: Female 48% (506) 25% (263) 18% (194) 9% (93) 1056Age: 18-34 30% (152) 28% (145) 25% (126) 18% (92) 514Age: 35-44 38% (116) 31% (94) 24% (75) 7% (23) 307Age: 45-64 53% (357) 25% (169) 17% (116) 5% (37) 679Age: 65+ 64% (316) 22% (108) 12% (59) 3% (14) 497GenZers: 1997-2012 22% (37) 22% (37) 33% (57) 23% (40) 170Millennials: 1981-1996 35% (193) 30% (167) 22% (122) 13% (70) 551GenXers: 1965-1980 47% (223) 25% (118) 21% (97) 7% (32) 469Baby Boomers: 1946-1964 60% (437) 24% (177) 13% (97) 3% (21) 732PID: Dem (no lean) 25% (196) 33% (259) 30% (230) 12% (91) 777PID: Ind (no lean) 41% (219) 29% (153) 20% (108) 9% (49) 528PID: Rep (no lean) 76% (526) 15% (104) 6% (38) 4% (26) 693PID/Gender: DemMen 26% (91) 32% (112) 31% (110) 11% (39) 352PID/Gender: DemWomen 25% (105) 35% (147) 28% (121) 12% (52) 425PID/Gender: Ind Men 41% (116) 31% (88) 20% (55) 8% (21) 280PID/Gender: Ind Women 41% (103) 26% (65) 21% (53) 11% (27) 248PID/Gender: Rep Men 73% (227) 17% (53) 6% (17) 4% (12) 310PID/Gender: Rep Women 78% (298) 13% (51) 5% (21) 4% (14) 384Ideo: Liberal (1-3) 20% (114) 32% (181) 32% (180) 16% (90) 566Ideo: Moderate (4) 39% (216) 34% (191) 22% (121) 6% (32) 560Ideo: Conservative (5-7) 77% (565) 15% (108) 5% (36) 3% (21) 730Educ: < College 49% (596) 24% (287) 17% (210) 9% (113) 1206Educ: Bachelors degree 47% (234) 26% (131) 21% (107) 6% (30) 501Educ: Post-grad 38% (111) 34% (98) 21% (60) 8% (22) 290Income: Under 50k 46% (403) 26% (224) 17% (151) 11% (95) 873Income: 50k-100k 48% (352) 26% (191) 19% (139) 6% (45) 728Income: 100k+ 47% (185) 25% (100) 22% (86) 6% (25) 398Ethnicity: White 51% (784) 25% (388) 17% (266) 7% (106) 1544Ethnicity: Hispanic 42% (94) 28% (63) 20% (45) 9% (20) 222
Continued on next page
Page 165
National Tracking Poll #2110084, October, 2021
165
Table POL10_5
Table POL10_5: How concerned are you, if at all, about each of the following?Illegal immigration at the U.S.-Mexico border
Demographic Very concernedSomewhatconcerned Not too concerned
Not concerned atall Total N
Registered Voters 47% (940) 26% (516) 19% (377) 8% (166) 1998Ethnicity: Black 33% (83) 29% (75) 27% (69) 11% (27) 253Ethnicity: Other 37% (73) 27% (54) 21% (41) 16% (33) 201All Christian 57% (595) 26% (268) 12% (125) 5% (54) 1041All Non-Christian 35% (37) 32% (34) 23% (25) 10% (10) 107Atheist 18% (14) 15% (12) 44% (34) 23% (18) 78Agnostic/Nothing in particular 34% (164) 25% (122) 28% (136) 12% (57) 480Something Else 44% (130) 27% (80) 19% (57) 9% (26) 293Religious Non-Protestant/Catholic 40% (51) 32% (41) 20% (26) 8% (10) 129Evangelical 60% (299) 26% (128) 10% (50) 4% (21) 499Non-Evangelical 51% (401) 26% (204) 16% (126) 7% (59) 790Community: Urban 40% (195) 30% (144) 21% (101) 10% (46) 487Community: Suburban 46% (479) 26% (269) 21% (215) 7% (78) 1041Community: Rural 57% (266) 22% (102) 13% (60) 9% (41) 469Employ: Private Sector 44% (301) 29% (200) 20% (139) 7% (45) 684Employ: Government 34% (39) 27% (30) 27% (31) 11% (13) 112Employ: Self-Employed 42% (77) 21% (38) 20% (37) 17% (32) 183Employ: Homemaker 46% (48) 21% (22) 19% (20) 14% (15) 104Employ: Student 24% (16) 32% (21) 24% (16) 20% (13) 67Employ: Retired 62% (330) 23% (124) 12% (63) 3% (16) 534Employ: Unemployed 37% (70) 25% (48) 27% (52) 11% (21) 191Employ: Other 48% (59) 27% (33) 16% (20) 10% (12) 124Military HH: Yes 56% (178) 24% (77) 13% (41) 6% (19) 315Military HH: No 45% (763) 26% (439) 20% (335) 9% (146) 1683RD/WT: Right Direction 25% (188) 34% (260) 30% (225) 11% (85) 757RD/WT: Wrong Track 61% (752) 21% (256) 12% (152) 6% (80) 1241Biden Job Approve 25% (225) 36% (320) 29% (260) 11% (95) 899Biden Job Disapprove 68% (702) 17% (181) 9% (98) 6% (58) 1039
Continued on next page
Page 166
166
Morning ConsultTable POL10_5
Table POL10_5: How concerned are you, if at all, about each of the following?Illegal immigration at the U.S.-Mexico border
Demographic Very concernedSomewhatconcerned Not too concerned
Not concerned atall Total N
Registered Voters 47% (940) 26% (516) 19% (377) 8% (166) 1998Biden Job Strongly Approve 29% (119) 33% (136) 28% (118) 11% (45) 418Biden Job Somewhat Approve 22% (106) 38% (183) 30% (142) 10% (50) 481Biden Job Somewhat Disapprove 35% (89) 31% (76) 25% (62) 9% (24) 250Biden Job Strongly Disapprove 78% (613) 13% (105) 5% (36) 4% (34) 788Favorable of Biden 25% (230) 35% (322) 29% (272) 11% (103) 927Unfavorable of Biden 68% (696) 17% (176) 9% (94) 5% (52) 1019Very Favorable of Biden 29% (138) 32% (154) 27% (127) 12% (56) 476Somewhat Favorable of Biden 20% (91) 37% (168) 32% (145) 10% (47) 451Somewhat Unfavorable of Biden 38% (78) 29% (60) 27% (56) 6% (13) 207Very Unfavorable of Biden 76% (618) 14% (116) 5% (39) 5% (39) 812#1 Issue: Economy 45% (348) 31% (237) 17% (133) 7% (51) 768#1 Issue: Security 78% (282) 13% (46) 6% (20) 3% (12) 360#1 Issue: Health Care 28% (65) 29% (66) 31% (71) 13% (29) 231#1 Issue: Medicare / Social Security 50% (113) 31% (70) 16% (37) 3% (7) 227#1 Issue: Women’s Issues 19% (24) 20% (25) 38% (47) 23% (29) 125#1 Issue: Education 28% (17) 24% (15) 28% (17) 19% (11) 59#1 Issue: Energy 32% (35) 28% (30) 27% (29) 13% (14) 107#1 Issue: Other 47% (57) 23% (28) 19% (23) 11% (13) 1222020 Vote: Joe Biden 26% (245) 33% (309) 30% (280) 12% (111) 9462020 Vote: Donald Trump 74% (638) 18% (152) 5% (45) 3% (30) 8642020 Vote: Didn’t Vote 28% (42) 28% (44) 31% (48) 13% (20) 1532018 House Vote: Democrat 25% (194) 32% (248) 32% (242) 11% (84) 7692018 House Vote: Republican 77% (538) 17% (118) 4% (25) 3% (20) 7022016 Vote: Hillary Clinton 25% (174) 32% (218) 31% (214) 12% (79) 6852016 Vote: Donald Trump 74% (594) 17% (137) 5% (44) 3% (27) 8022016 Vote: Other 31% (26) 41% (34) 18% (15) 10% (8) 842016 Vote: Didn’t Vote 34% (142) 30% (127) 24% (102) 12% (52) 423Voted in 2014: Yes 52% (697) 25% (329) 17% (221) 7% (88) 1335Voted in 2014: No 37% (243) 28% (187) 23% (156) 12% (78) 663
Continued on next page
Page 167
National Tracking Poll #2110084, October, 2021
167
Table POL10_5
Table POL10_5: How concerned are you, if at all, about each of the following?Illegal immigration at the U.S.-Mexico border
Demographic Very concernedSomewhatconcerned Not too concerned
Not concerned atall Total N
Registered Voters 47% (940) 26% (516) 19% (377) 8% (166) 19984-Region: Northeast 43% (151) 31% (110) 20% (70) 6% (22) 3534-Region: Midwest 46% (205) 22% (99) 22% (97) 10% (43) 4444-Region: South 52% (390) 24% (182) 16% (119) 7% (54) 7464-Region: West 43% (194) 27% (125) 20% (90) 10% (47) 455Party: Democrat/Leans Democrat 25% (225) 33% (303) 30% (276) 12% (110) 914Party: Republican/Leans Republican 74% (600) 16% (126) 7% (53) 4% (29) 808Note: Row proportions may total to larger than one-hundred percent due to rounding. For more information visit MorningConsultIntelligence.com.
Page 168
168
Morning ConsultTable POL10_6
Table POL10_6: How concerned are you, if at all, about each of the following?Climate change
Demographic Very concernedSomewhatconcerned Not too concerned
Not concerned atall Total N
Registered Voters 40% (795) 29% (570) 17% (345) 14% (288) 1998Gender: Male 39% (366) 28% (263) 17% (158) 16% (154) 942Gender: Female 41% (429) 29% (307) 18% (186) 13% (134) 1056Age: 18-34 44% (226) 32% (164) 15% (76) 9% (49) 514Age: 35-44 44% (136) 34% (104) 14% (43) 8% (24) 307Age: 45-64 34% (231) 29% (199) 20% (137) 16% (112) 679Age: 65+ 41% (201) 21% (104) 18% (88) 21% (104) 497GenZers: 1997-2012 53% (90) 27% (47) 11% (19) 8% (14) 170Millennials: 1981-1996 42% (232) 33% (184) 15% (85) 9% (51) 551GenXers: 1965-1980 34% (159) 29% (137) 21% (100) 16% (73) 469Baby Boomers: 1946-1964 38% (282) 26% (193) 16% (120) 19% (137) 732PID: Dem (no lean) 60% (469) 29% (223) 8% (62) 3% (22) 777PID: Ind (no lean) 36% (189) 35% (183) 16% (86) 13% (70) 528PID: Rep (no lean) 20% (136) 24% (164) 28% (196) 28% (196) 693PID/Gender: DemMen 59% (210) 29% (102) 8% (29) 3% (12) 352PID/Gender: DemWomen 61% (260) 29% (121) 8% (34) 2% (10) 425PID/Gender: Ind Men 33% (92) 36% (102) 16% (46) 14% (40) 280PID/Gender: Ind Women 39% (97) 33% (81) 16% (40) 12% (30) 248PID/Gender: Rep Men 21% (65) 19% (60) 27% (84) 33% (102) 310PID/Gender: Rep Women 19% (72) 27% (105) 29% (113) 25% (95) 384Ideo: Liberal (1-3) 66% (376) 26% (149) 5% (27) 3% (15) 566Ideo: Moderate (4) 44% (244) 35% (193) 17% (96) 5% (26) 560Ideo: Conservative (5-7) 19% (137) 22% (159) 27% (200) 32% (234) 730Educ: < College 38% (458) 29% (346) 17% (211) 16% (191) 1206Educ: Bachelors degree 41% (208) 28% (141) 19% (96) 11% (56) 501Educ: Post-grad 44% (129) 29% (83) 13% (37) 14% (41) 290Income: Under 50k 42% (363) 27% (238) 18% (153) 14% (118) 873Income: 50k-100k 37% (272) 29% (214) 16% (120) 17% (123) 728Income: 100k+ 40% (160) 30% (118) 18% (72) 12% (48) 398Ethnicity: White 37% (577) 28% (430) 19% (290) 16% (247) 1544Ethnicity: Hispanic 49% (108) 29% (64) 13% (30) 9% (21) 222
Continued on next page
Page 169
National Tracking Poll #2110084, October, 2021
169
Table POL10_6
Table POL10_6: How concerned are you, if at all, about each of the following?Climate change
Demographic Very concernedSomewhatconcerned Not too concerned
Not concerned atall Total N
Registered Voters 40% (795) 29% (570) 17% (345) 14% (288) 1998Ethnicity: Black 45% (114) 41% (104) 10% (24) 4% (11) 253Ethnicity: Other 52% (104) 18% (36) 15% (30) 15% (30) 201All Christian 36% (377) 27% (281) 18% (187) 19% (196) 1041All Non-Christian 49% (53) 30% (32) 18% (19) 3% (3) 107Atheist 66% (51) 19% (14) 9% (7) 7% (5) 78Agnostic/Nothing in particular 39% (186) 33% (157) 17% (82) 11% (55) 480Something Else 44% (128) 29% (86) 17% (50) 10% (29) 293Religious Non-Protestant/Catholic 49% (63) 29% (37) 16% (21) 6% (7) 129Evangelical 35% (176) 27% (134) 18% (92) 19% (96) 499Non-Evangelical 39% (311) 28% (218) 18% (139) 15% (121) 790Community: Urban 51% (246) 30% (145) 13% (64) 7% (32) 487Community: Suburban 39% (405) 29% (300) 18% (188) 14% (148) 1041Community: Rural 31% (144) 27% (125) 20% (92) 23% (108) 469Employ: Private Sector 37% (251) 31% (211) 20% (137) 12% (84) 684Employ: Government 44% (49) 27% (30) 22% (25) 7% (8) 112Employ: Self-Employed 45% (82) 27% (49) 15% (28) 13% (24) 183Employ: Homemaker 36% (38) 29% (30) 16% (16) 19% (20) 104Employ: Student 54% (36) 25% (17) 15% (10) 6% (4) 67Employ: Retired 38% (203) 24% (126) 17% (92) 21% (113) 534Employ: Unemployed 43% (82) 37% (71) 11% (20) 9% (18) 191Employ: Other 44% (55) 29% (36) 13% (15) 14% (17) 124Military HH: Yes 38% (120) 23% (74) 17% (53) 22% (68) 315Military HH: No 40% (675) 29% (496) 17% (292) 13% (220) 1683RD/WT: Right Direction 58% (437) 32% (244) 7% (53) 3% (23) 757RD/WT: Wrong Track 29% (358) 26% (327) 23% (291) 21% (265) 1241Biden Job Approve 60% (540) 30% (272) 8% (75) 1% (12) 899Biden Job Disapprove 23% (239) 26% (271) 25% (260) 26% (268) 1039
Continued on next page
Page 170
170
Morning ConsultTable POL10_6
Table POL10_6: How concerned are you, if at all, about each of the following?Climate change
Demographic Very concernedSomewhatconcerned Not too concerned
Not concerned atall Total N
Registered Voters 40% (795) 29% (570) 17% (345) 14% (288) 1998Biden Job Strongly Approve 64% (269) 26% (107) 8% (35) 2% (7) 418Biden Job Somewhat Approve 56% (271) 34% (165) 8% (40) 1% (6) 481Biden Job Somewhat Disapprove 44% (110) 36% (89) 16% (40) 4% (11) 250Biden Job Strongly Disapprove 16% (129) 23% (182) 28% (220) 33% (257) 788Favorable of Biden 61% (563) 30% (276) 8% (71) 2% (16) 927Unfavorable of Biden 22% (219) 26% (269) 26% (265) 26% (266) 1019Very Favorable of Biden 64% (306) 27% (129) 7% (33) 2% (8) 476Somewhat Favorable of Biden 57% (258) 33% (147) 8% (38) 2% (8) 451Somewhat Unfavorable of Biden 43% (88) 34% (71) 20% (41) 4% (7) 207Very Unfavorable of Biden 16% (131) 24% (198) 28% (224) 32% (259) 812#1 Issue: Economy 32% (244) 34% (259) 19% (144) 16% (121) 768#1 Issue: Security 20% (72) 26% (94) 25% (90) 29% (103) 360#1 Issue: Health Care 57% (131) 30% (69) 9% (22) 4% (9) 231#1 Issue: Medicare / Social Security 52% (117) 28% (62) 12% (28) 8% (19) 227#1 Issue: Women’s Issues 57% (71) 23% (29) 8% (10) 12% (15) 125#1 Issue: Education 40% (24) 43% (26) 15% (9) 2% (1) 59#1 Issue: Energy 77% (82) 10% (11) 10% (11) 3% (3) 107#1 Issue: Other 44% (54) 16% (19) 25% (31) 14% (17) 1222020 Vote: Joe Biden 59% (561) 31% (289) 8% (78) 2% (17) 9462020 Vote: Donald Trump 18% (159) 25% (219) 27% (237) 29% (249) 8642020 Vote: Didn’t Vote 39% (60) 34% (52) 16% (24) 11% (16) 1532018 House Vote: Democrat 59% (454) 31% (235) 8% (61) 2% (19) 7692018 House Vote: Republican 19% (135) 23% (161) 29% (202) 29% (203) 7022016 Vote: Hillary Clinton 61% (416) 29% (198) 9% (62) 1% (9) 6852016 Vote: Donald Trump 19% (154) 24% (195) 28% (227) 28% (226) 8022016 Vote: Other 36% (30) 36% (30) 9% (8) 19% (16) 842016 Vote: Didn’t Vote 45% (192) 34% (145) 11% (48) 9% (37) 423Voted in 2014: Yes 39% (523) 27% (357) 18% (242) 16% (214) 1335Voted in 2014: No 41% (272) 32% (213) 16% (103) 11% (75) 663
Continued on next page
Page 171
National Tracking Poll #2110084, October, 2021
171
Table POL10_6
Table POL10_6: How concerned are you, if at all, about each of the following?Climate change
Demographic Very concernedSomewhatconcerned Not too concerned
Not concerned atall Total N
Registered Voters 40% (795) 29% (570) 17% (345) 14% (288) 19984-Region: Northeast 41% (144) 33% (117) 14% (51) 11% (41) 3534-Region: Midwest 37% (166) 26% (117) 18% (80) 18% (81) 4444-Region: South 37% (277) 28% (211) 21% (157) 13% (100) 7464-Region: West 46% (207) 28% (125) 12% (57) 15% (66) 455Party: Democrat/Leans Democrat 60% (551) 29% (267) 8% (70) 3% (26) 914Party: Republican/Leans Republican 19% (157) 25% (201) 27% (219) 29% (231) 808Note: Row proportions may total to larger than one-hundred percent due to rounding. For more information visit MorningConsultIntelligence.com.
Page 172
172
Morning ConsultTable POL10_7
Table POL10_7: How concerned are you, if at all, about each of the following?Political correctness
Demographic Very concernedSomewhatconcerned Not too concerned
Not concerned atall Total N
Registered Voters 25% (499) 29% (575) 24% (485) 22% (440) 1998Gender: Male 26% (241) 27% (253) 23% (221) 24% (227) 942Gender: Female 24% (258) 30% (321) 25% (264) 20% (213) 1056Age: 18-34 26% (133) 35% (181) 21% (110) 18% (90) 514Age: 35-44 33% (100) 32% (98) 19% (57) 17% (51) 307Age: 45-64 21% (144) 26% (174) 27% (183) 26% (178) 679Age: 65+ 24% (121) 24% (121) 27% (135) 24% (120) 497GenZers: 1997-2012 26% (44) 36% (61) 18% (31) 20% (34) 170Millennials: 1981-1996 28% (157) 34% (186) 22% (121) 16% (87) 551GenXers: 1965-1980 21% (100) 26% (124) 25% (118) 27% (127) 469Baby Boomers: 1946-1964 25% (180) 25% (186) 26% (193) 23% (172) 732PID: Dem (no lean) 23% (177) 37% (284) 29% (223) 12% (93) 777PID: Ind (no lean) 21% (113) 30% (157) 24% (125) 25% (133) 528PID: Rep (no lean) 30% (209) 19% (133) 20% (136) 31% (215) 693PID/Gender: DemMen 22% (78) 34% (119) 29% (104) 15% (52) 352PID/Gender: DemWomen 23% (99) 39% (165) 28% (120) 10% (41) 425PID/Gender: Ind Men 26% (72) 27% (76) 22% (62) 25% (69) 280PID/Gender: Ind Women 16% (41) 33% (81) 25% (63) 25% (63) 248PID/Gender: Rep Men 29% (91) 19% (58) 18% (55) 34% (106) 310PID/Gender: Rep Women 31% (118) 20% (75) 21% (81) 28% (109) 384Ideo: Liberal (1-3) 22% (127) 33% (186) 30% (169) 15% (85) 566Ideo: Moderate (4) 21% (116) 37% (205) 29% (164) 13% (75) 560Ideo: Conservative (5-7) 30% (216) 19% (140) 18% (130) 33% (244) 730Educ: < College 28% (333) 29% (345) 21% (257) 23% (271) 1206Educ: Bachelors degree 20% (99) 28% (142) 29% (146) 23% (114) 501Educ: Post-grad 23% (67) 30% (88) 28% (81) 19% (54) 290Income: Under 50k 24% (213) 28% (248) 24% (206) 24% (205) 873Income: 50k-100k 27% (198) 29% (211) 24% (172) 20% (147) 728Income: 100k+ 22% (88) 29% (115) 27% (106) 22% (88) 398Ethnicity: White 23% (356) 29% (443) 24% (365) 25% (379) 1544Ethnicity: Hispanic 34% (75) 36% (79) 16% (35) 15% (33) 222
Continued on next page
Page 173
National Tracking Poll #2110084, October, 2021
173
Table POL10_7
Table POL10_7: How concerned are you, if at all, about each of the following?Political correctness
Demographic Very concernedSomewhatconcerned Not too concerned
Not concerned atall Total N
Registered Voters 25% (499) 29% (575) 24% (485) 22% (440) 1998Ethnicity: Black 32% (80) 30% (75) 27% (68) 12% (30) 253Ethnicity: Other 31% (63) 28% (57) 25% (51) 15% (30) 201All Christian 26% (267) 28% (296) 23% (237) 23% (241) 1041All Non-Christian 35% (38) 28% (30) 23% (24) 13% (14) 107Atheist 21% (16) 30% (24) 28% (22) 21% (16) 78Agnostic/Nothing in particular 21% (99) 27% (128) 27% (131) 25% (121) 480Something Else 27% (79) 33% (96) 24% (70) 16% (47) 293Religious Non-Protestant/Catholic 37% (48) 27% (35) 21% (27) 15% (19) 129Evangelical 29% (145) 29% (145) 21% (103) 21% (105) 499Non-Evangelical 24% (186) 30% (234) 25% (196) 22% (175) 790Community: Urban 30% (148) 36% (173) 22% (109) 12% (57) 487Community: Suburban 22% (232) 28% (288) 26% (274) 24% (247) 1041Community: Rural 25% (119) 24% (113) 22% (102) 29% (136) 469Employ: Private Sector 25% (174) 31% (209) 23% (160) 21% (140) 684Employ: Government 26% (29) 25% (28) 27% (30) 23% (25) 112Employ: Self-Employed 21% (39) 25% (46) 31% (56) 23% (42) 183Employ: Homemaker 25% (25) 31% (32) 22% (23) 22% (23) 104Employ: Student 26% (17) 41% (27) 20% (13) 14% (9) 67Employ: Retired 23% (123) 26% (139) 26% (136) 25% (135) 534Employ: Unemployed 28% (53) 30% (58) 17% (33) 25% (47) 191Employ: Other 31% (38) 28% (35) 26% (32) 15% (18) 124Military HH: Yes 27% (85) 27% (85) 17% (53) 29% (93) 315Military HH: No 25% (414) 29% (490) 26% (431) 21% (347) 1683RD/WT: Right Direction 21% (160) 38% (288) 30% (231) 10% (78) 757RD/WT: Wrong Track 27% (338) 23% (287) 20% (254) 29% (362) 1241Biden Job Approve 22% (196) 39% (349) 30% (266) 10% (88) 899Biden Job Disapprove 28% (293) 20% (208) 20% (208) 32% (330) 1039
Continued on next page
Page 174
174
Morning ConsultTable POL10_7
Table POL10_7: How concerned are you, if at all, about each of the following?Political correctness
Demographic Very concernedSomewhatconcerned Not too concerned
Not concerned atall Total N
Registered Voters 25% (499) 29% (575) 24% (485) 22% (440) 1998Biden Job Strongly Approve 26% (109) 37% (157) 27% (114) 9% (38) 418Biden Job Somewhat Approve 18% (87) 40% (192) 32% (152) 10% (50) 481Biden Job Somewhat Disapprove 16% (40) 30% (76) 32% (80) 22% (55) 250Biden Job Strongly Disapprove 32% (253) 17% (132) 16% (129) 35% (274) 788Favorable of Biden 21% (194) 39% (362) 29% (271) 11% (101) 927Unfavorable of Biden 29% (295) 19% (195) 20% (203) 32% (325) 1019Very Favorable of Biden 26% (123) 38% (183) 27% (127) 9% (44) 476Somewhat Favorable of Biden 16% (71) 40% (179) 32% (144) 13% (57) 451Somewhat Unfavorable of Biden 15% (32) 30% (61) 31% (64) 24% (50) 207Very Unfavorable of Biden 32% (263) 17% (134) 17% (138) 34% (276) 812#1 Issue: Economy 26% (197) 31% (238) 22% (170) 21% (163) 768#1 Issue: Security 30% (109) 17% (60) 22% (80) 31% (110) 360#1 Issue: Health Care 22% (50) 32% (75) 26% (59) 20% (47) 231#1 Issue: Medicare / Social Security 24% (55) 35% (78) 26% (58) 15% (34) 227#1 Issue: Women’s Issues 17% (21) 33% (41) 22% (27) 28% (35) 125#1 Issue: Education 21% (13) 45% (27) 19% (11) 15% (9) 59#1 Issue: Energy 24% (26) 36% (38) 29% (31) 11% (12) 107#1 Issue: Other 23% (28) 14% (17) 38% (46) 25% (30) 1222020 Vote: Joe Biden 21% (199) 36% (341) 30% (285) 13% (121) 9462020 Vote: Donald Trump 29% (254) 20% (176) 18% (156) 32% (278) 8642020 Vote: Didn’t Vote 24% (37) 29% (44) 25% (39) 22% (33) 1532018 House Vote: Democrat 22% (170) 37% (283) 29% (221) 12% (95) 7692018 House Vote: Republican 29% (206) 19% (134) 20% (137) 32% (225) 7022016 Vote: Hillary Clinton 21% (145) 37% (253) 30% (206) 12% (81) 6852016 Vote: Donald Trump 29% (236) 20% (161) 19% (149) 32% (256) 8022016 Vote: Other 20% (17) 27% (23) 27% (22) 25% (21) 842016 Vote: Didn’t Vote 23% (98) 32% (136) 25% (107) 19% (82) 423Voted in 2014: Yes 26% (346) 28% (376) 24% (317) 22% (297) 1335Voted in 2014: No 23% (153) 30% (199) 25% (168) 22% (143) 663
Continued on next page
Page 175
National Tracking Poll #2110084, October, 2021
175
Table POL10_7
Table POL10_7: How concerned are you, if at all, about each of the following?Political correctness
Demographic Very concernedSomewhatconcerned Not too concerned
Not concerned atall Total N
Registered Voters 25% (499) 29% (575) 24% (485) 22% (440) 19984-Region: Northeast 23% (79) 37% (132) 22% (77) 18% (64) 3534-Region: Midwest 23% (103) 25% (110) 25% (111) 27% (120) 4444-Region: South 26% (195) 26% (195) 25% (185) 23% (171) 7464-Region: West 27% (121) 30% (137) 24% (111) 19% (85) 455Party: Democrat/Leans Democrat 22% (197) 37% (337) 29% (266) 12% (114) 914Party: Republican/Leans Republican 30% (241) 19% (154) 20% (158) 32% (256) 808Note: Row proportions may total to larger than one-hundred percent due to rounding. For more information visit MorningConsultIntelligence.com.
Page 176
176
Morning ConsultTable POL10_8
Table POL10_8: How concerned are you, if at all, about each of the following?Terrorism in the United States
Demographic Very concernedSomewhatconcerned Not too concerned
Not concerned atall Total N
Registered Voters 44% (888) 37% (745) 15% (291) 4% (74) 1998Gender: Male 40% (373) 38% (362) 17% (165) 4% (42) 942Gender: Female 49% (515) 36% (383) 12% (127) 3% (31) 1056Age: 18-34 38% (195) 39% (198) 18% (92) 6% (29) 514Age: 35-44 43% (133) 40% (122) 13% (39) 4% (12) 307Age: 45-64 44% (299) 39% (264) 14% (96) 3% (21) 679Age: 65+ 52% (260) 32% (161) 13% (65) 2% (12) 497GenZers: 1997-2012 41% (69) 36% (60) 18% (31) 5% (9) 170Millennials: 1981-1996 39% (216) 39% (218) 16% (91) 5% (27) 551GenXers: 1965-1980 43% (200) 40% (190) 13% (61) 4% (18) 469Baby Boomers: 1946-1964 50% (367) 35% (256) 13% (93) 2% (16) 732PID: Dem (no lean) 38% (292) 40% (314) 19% (144) 3% (27) 777PID: Ind (no lean) 39% (208) 37% (193) 19% (101) 5% (26) 528PID: Rep (no lean) 56% (389) 34% (238) 7% (46) 3% (21) 693PID/Gender: DemMen 35% (125) 40% (142) 20% (72) 4% (14) 352PID/Gender: DemWomen 39% (167) 41% (172) 17% (72) 3% (12) 425PID/Gender: Ind Men 32% (89) 39% (108) 24% (66) 6% (17) 280PID/Gender: Ind Women 48% (118) 34% (85) 14% (35) 4% (9) 248PID/Gender: Rep Men 51% (159) 36% (113) 9% (27) 4% (11) 310PID/Gender: Rep Women 60% (229) 33% (125) 5% (19) 3% (10) 384Ideo: Liberal (1-3) 35% (198) 39% (220) 21% (117) 5% (31) 566Ideo: Moderate (4) 39% (220) 42% (233) 17% (94) 2% (13) 560Ideo: Conservative (5-7) 56% (409) 33% (243) 8% (55) 3% (22) 730Educ: < College 48% (576) 34% (412) 15% (175) 4% (42) 1206Educ: Bachelors degree 42% (212) 41% (204) 15% (73) 2% (12) 501Educ: Post-grad 34% (100) 44% (129) 15% (42) 7% (19) 290Income: Under 50k 48% (416) 35% (303) 15% (127) 3% (27) 873Income: 50k-100k 43% (311) 39% (281) 14% (100) 5% (35) 728Income: 100k+ 40% (161) 41% (161) 16% (64) 3% (11) 398Ethnicity: White 45% (694) 38% (586) 13% (206) 4% (57) 1544Ethnicity: Hispanic 43% (96) 42% (93) 10% (22) 5% (11) 222
Continued on next page
Page 177
National Tracking Poll #2110084, October, 2021
177
Table POL10_8
Table POL10_8: How concerned are you, if at all, about each of the following?Terrorism in the United States
Demographic Very concernedSomewhatconcerned Not too concerned
Not concerned atall Total N
Registered Voters 44% (888) 37% (745) 15% (291) 4% (74) 1998Ethnicity: Black 43% (108) 32% (81) 21% (53) 4% (10) 253Ethnicity: Other 43% (86) 39% (78) 16% (32) 3% (6) 201All Christian 50% (522) 36% (374) 11% (119) 2% (26) 1041All Non-Christian 43% (45) 38% (40) 19% (21) — (0) 107Atheist 17% (13) 40% (31) 29% (22) 14% (11) 78Agnostic/Nothing in particular 35% (170) 42% (200) 17% (81) 6% (28) 480Something Else 47% (138) 34% (99) 16% (48) 3% (8) 293Religious Non-Protestant/Catholic 47% (61) 36% (46) 17% (22) — (0) 129Evangelical 55% (272) 33% (165) 9% (46) 3% (16) 499Non-Evangelical 46% (361) 37% (294) 15% (117) 2% (17) 790Community: Urban 45% (220) 33% (162) 18% (86) 4% (20) 487Community: Suburban 43% (444) 40% (414) 15% (151) 3% (31) 1041Community: Rural 48% (224) 36% (169) 11% (54) 5% (23) 469Employ: Private Sector 37% (255) 43% (295) 16% (109) 4% (24) 684Employ: Government 40% (44) 38% (42) 18% (20) 5% (6) 112Employ: Self-Employed 37% (68) 38% (70) 20% (37) 4% (7) 183Employ: Homemaker 44% (46) 35% (36) 15% (16) 6% (6) 104Employ: Student 40% (27) 46% (31) 11% (7) 3% (2) 67Employ: Retired 55% (293) 30% (161) 13% (67) 2% (12) 534Employ: Unemployed 44% (83) 41% (79) 10% (18) 5% (10) 191Employ: Other 57% (71) 25% (31) 14% (17) 4% (5) 124Military HH: Yes 53% (167) 30% (94) 14% (46) 3% (9) 315Military HH: No 43% (721) 39% (651) 15% (246) 4% (65) 1683RD/WT: Right Direction 38% (285) 37% (282) 21% (158) 4% (33) 757RD/WT: Wrong Track 49% (603) 37% (464) 11% (133) 3% (41) 1241Biden Job Approve 38% (344) 39% (347) 20% (181) 3% (27) 899Biden Job Disapprove 51% (525) 36% (373) 10% (102) 4% (39) 1039
Continued on next page
Page 178
178
Morning ConsultTable POL10_8
Table POL10_8: How concerned are you, if at all, about each of the following?Terrorism in the United States
Demographic Very concernedSomewhatconcerned Not too concerned
Not concerned atall Total N
Registered Voters 44% (888) 37% (745) 15% (291) 4% (74) 1998Biden Job Strongly Approve 44% (186) 35% (148) 17% (71) 3% (14) 418Biden Job Somewhat Approve 33% (158) 41% (199) 23% (110) 3% (13) 481Biden Job Somewhat Disapprove 36% (90) 45% (112) 15% (38) 4% (10) 250Biden Job Strongly Disapprove 55% (435) 33% (261) 8% (65) 4% (28) 788Favorable of Biden 39% (358) 39% (359) 19% (180) 3% (30) 927Unfavorable of Biden 50% (510) 36% (368) 10% (102) 4% (39) 1019Very Favorable of Biden 48% (227) 32% (154) 17% (80) 3% (14) 476Somewhat Favorable of Biden 29% (131) 45% (205) 22% (99) 3% (16) 451Somewhat Unfavorable of Biden 37% (77) 44% (90) 15% (32) 4% (8) 207Very Unfavorable of Biden 53% (433) 34% (278) 9% (70) 4% (30) 812#1 Issue: Economy 38% (293) 43% (332) 15% (119) 3% (25) 768#1 Issue: Security 67% (242) 25% (88) 6% (20) 2% (9) 360#1 Issue: Health Care 35% (81) 37% (86) 24% (55) 4% (8) 231#1 Issue: Medicare / Social Security 46% (104) 40% (90) 11% (24) 4% (8) 227#1 Issue: Women’s Issues 28% (35) 43% (54) 18% (22) 11% (14) 125#1 Issue: Education 41% (24) 38% (22) 18% (11) 3% (2) 59#1 Issue: Energy 43% (46) 29% (31) 22% (24) 5% (6) 107#1 Issue: Other 51% (62) 34% (41) 14% (17) 2% (2) 1222020 Vote: Joe Biden 39% (368) 38% (359) 20% (187) 3% (33) 9462020 Vote: Donald Trump 53% (455) 37% (316) 8% (67) 3% (25) 8642020 Vote: Didn’t Vote 34% (52) 37% (56) 21% (32) 8% (13) 1532018 House Vote: Democrat 38% (292) 39% (299) 19% (150) 4% (29) 7692018 House Vote: Republican 55% (384) 36% (256) 6% (44) 3% (18) 7022016 Vote: Hillary Clinton 38% (257) 39% (268) 20% (134) 4% (26) 6852016 Vote: Donald Trump 54% (431) 35% (277) 9% (69) 3% (25) 8022016 Vote: Other 25% (21) 50% (42) 17% (15) 7% (6) 842016 Vote: Didn’t Vote 42% (175) 37% (156) 18% (74) 4% (16) 423Voted in 2014: Yes 46% (621) 37% (494) 13% (179) 3% (41) 1335Voted in 2014: No 40% (267) 38% (251) 17% (112) 5% (33) 663
Continued on next page
Page 179
National Tracking Poll #2110084, October, 2021
179
Table POL10_8
Table POL10_8: How concerned are you, if at all, about each of the following?Terrorism in the United States
Demographic Very concernedSomewhatconcerned Not too concerned
Not concerned atall Total N
Registered Voters 44% (888) 37% (745) 15% (291) 4% (74) 19984-Region: Northeast 40% (140) 42% (149) 16% (57) 2% (7) 3534-Region: Midwest 42% (186) 38% (170) 16% (72) 4% (17) 4444-Region: South 52% (385) 33% (244) 11% (84) 4% (33) 7464-Region: West 39% (177) 40% (183) 17% (78) 4% (17) 455Party: Democrat/Leans Democrat 38% (343) 39% (359) 19% (173) 4% (39) 914Party: Republican/Leans Republican 54% (439) 34% (279) 8% (68) 3% (22) 808Note: Row proportions may total to larger than one-hundred percent due to rounding. For more information visit MorningConsultIntelligence.com.
Page 180
180
Morning ConsultTable POL10_9
Table POL10_9: How concerned are you, if at all, about each of the following?Economic inequality
Demographic Very concernedSomewhatconcerned Not too concerned
Not concerned atall Total N
Registered Voters 35% (707) 33% (664) 20% (397) 11% (230) 1998Gender: Male 29% (271) 33% (308) 23% (219) 15% (144) 942Gender: Female 41% (436) 34% (356) 17% (178) 8% (86) 1056Age: 18-34 39% (201) 35% (181) 16% (80) 10% (53) 514Age: 35-44 44% (134) 35% (109) 13% (39) 8% (25) 307Age: 45-64 33% (225) 32% (218) 24% (165) 10% (71) 679Age: 65+ 30% (147) 31% (157) 23% (113) 16% (81) 497GenZers: 1997-2012 43% (73) 33% (56) 17% (30) 7% (12) 170Millennials: 1981-1996 40% (220) 35% (193) 14% (76) 11% (63) 551GenXers: 1965-1980 34% (160) 35% (164) 22% (104) 9% (41) 469Baby Boomers: 1946-1964 32% (234) 32% (232) 23% (165) 14% (101) 732PID: Dem (no lean) 48% (377) 38% (294) 11% (83) 3% (23) 777PID: Ind (no lean) 33% (172) 32% (169) 22% (116) 14% (71) 528PID: Rep (no lean) 23% (159) 29% (201) 29% (199) 19% (135) 693PID/Gender: DemMen 39% (138) 42% (147) 15% (51) 4% (15) 352PID/Gender: DemWomen 56% (238) 35% (147) 7% (31) 2% (8) 425PID/Gender: Ind Men 28% (78) 32% (91) 22% (60) 18% (51) 280PID/Gender: Ind Women 38% (94) 32% (78) 22% (55) 8% (21) 248PID/Gender: Rep Men 18% (55) 23% (70) 34% (107) 25% (78) 310PID/Gender: Rep Women 27% (104) 34% (130) 24% (92) 15% (57) 384Ideo: Liberal (1-3) 52% (293) 35% (197) 11% (62) 2% (14) 566Ideo: Moderate (4) 34% (190) 43% (239) 17% (95) 6% (36) 560Ideo: Conservative (5-7) 23% (167) 25% (185) 29% (213) 23% (165) 730Educ: < College 35% (420) 34% (407) 19% (227) 13% (152) 1206Educ: Bachelors degree 36% (181) 30% (152) 24% (120) 10% (48) 501Educ: Post-grad 36% (106) 36% (105) 17% (50) 10% (30) 290Income: Under 50k 40% (345) 31% (274) 16% (141) 13% (113) 873Income: 50k-100k 33% (243) 34% (245) 22% (159) 11% (81) 728Income: 100k+ 30% (120) 37% (145) 24% (97) 9% (36) 398Ethnicity: White 31% (471) 33% (516) 23% (358) 13% (200) 1544Ethnicity: Hispanic 40% (90) 32% (71) 14% (31) 14% (30) 222
Continued on next page
Page 181
National Tracking Poll #2110084, October, 2021
181
Table POL10_9
Table POL10_9: How concerned are you, if at all, about each of the following?Economic inequality
Demographic Very concernedSomewhatconcerned Not too concerned
Not concerned atall Total N
Registered Voters 35% (707) 33% (664) 20% (397) 11% (230) 1998Ethnicity: Black 62% (156) 31% (79) 4% (10) 3% (8) 253Ethnicity: Other 40% (80) 34% (69) 15% (29) 11% (22) 201All Christian 32% (328) 32% (333) 23% (238) 14% (142) 1041All Non-Christian 41% (43) 38% (41) 14% (15) 7% (7) 107Atheist 53% (41) 25% (19) 16% (12) 6% (5) 78Agnostic/Nothing in particular 36% (171) 34% (162) 19% (92) 11% (55) 480Something Else 42% (124) 37% (109) 13% (39) 7% (21) 293Religious Non-Protestant/Catholic 40% (52) 38% (49) 13% (17) 9% (12) 129Evangelical 36% (179) 33% (166) 20% (99) 11% (54) 499Non-Evangelical 32% (256) 33% (260) 22% (172) 13% (102) 790Community: Urban 43% (211) 34% (166) 14% (67) 9% (44) 487Community: Suburban 34% (352) 34% (357) 21% (216) 11% (116) 1041Community: Rural 31% (145) 30% (141) 24% (114) 15% (70) 469Employ: Private Sector 35% (241) 35% (239) 19% (133) 10% (71) 684Employ: Government 35% (39) 30% (34) 24% (27) 11% (12) 112Employ: Self-Employed 43% (79) 23% (43) 24% (44) 10% (18) 183Employ: Homemaker 39% (40) 36% (37) 15% (15) 11% (11) 104Employ: Student 42% (29) 44% (29) 13% (9) 1% (1) 67Employ: Retired 30% (157) 32% (170) 24% (126) 15% (81) 534Employ: Unemployed 41% (77) 33% (62) 14% (26) 13% (25) 191Employ: Other 37% (45) 40% (50) 14% (17) 9% (11) 124Military HH: Yes 33% (104) 30% (95) 21% (67) 16% (49) 315Military HH: No 36% (603) 34% (569) 20% (330) 11% (181) 1683RD/WT: Right Direction 43% (323) 41% (310) 13% (99) 3% (26) 757RD/WT: Wrong Track 31% (385) 29% (354) 24% (298) 16% (204) 1241Biden Job Approve 46% (416) 39% (352) 12% (112) 2% (19) 899Biden Job Disapprove 26% (271) 28% (290) 26% (274) 20% (204) 1039
Continued on next page
Page 182
182
Morning ConsultTable POL10_9
Table POL10_9: How concerned are you, if at all, about each of the following?Economic inequality
Demographic Very concernedSomewhatconcerned Not too concerned
Not concerned atall Total N
Registered Voters 35% (707) 33% (664) 20% (397) 11% (230) 1998Biden Job Strongly Approve 48% (200) 38% (159) 12% (50) 2% (9) 418Biden Job Somewhat Approve 45% (216) 40% (193) 13% (61) 2% (10) 481Biden Job Somewhat Disapprove 37% (93) 38% (95) 20% (50) 5% (12) 250Biden Job Strongly Disapprove 23% (177) 25% (195) 28% (224) 24% (191) 788Favorable of Biden 47% (432) 40% (367) 12% (109) 2% (19) 927Unfavorable of Biden 25% (256) 27% (277) 27% (280) 20% (206) 1019Very Favorable of Biden 49% (234) 39% (183) 10% (45) 3% (13) 476Somewhat Favorable of Biden 44% (198) 41% (184) 14% (64) 1% (6) 451Somewhat Unfavorable of Biden 37% (77) 34% (70) 23% (47) 6% (13) 207Very Unfavorable of Biden 22% (179) 26% (207) 29% (233) 24% (193) 812#1 Issue: Economy 36% (279) 34% (261) 19% (143) 11% (86) 768#1 Issue: Security 21% (76) 26% (94) 30% (108) 23% (81) 360#1 Issue: Health Care 43% (100) 37% (84) 17% (39) 3% (8) 231#1 Issue: Medicare / Social Security 35% (78) 38% (86) 18% (40) 10% (22) 227#1 Issue: Women’s Issues 43% (54) 34% (42) 14% (18) 9% (11) 125#1 Issue: Education 35% (21) 44% (26) 8% (5) 12% (7) 59#1 Issue: Energy 53% (57) 28% (30) 15% (16) 4% (4) 107#1 Issue: Other 36% (44) 33% (41) 23% (28) 9% (10) 1222020 Vote: Joe Biden 46% (431) 40% (382) 12% (113) 2% (21) 9462020 Vote: Donald Trump 22% (193) 26% (226) 29% (254) 22% (191) 8642020 Vote: Didn’t Vote 47% (73) 28% (43) 16% (24) 9% (14) 1532018 House Vote: Democrat 46% (354) 39% (297) 11% (87) 4% (31) 7692018 House Vote: Republican 22% (152) 28% (194) 30% (208) 21% (147) 7022016 Vote: Hillary Clinton 49% (334) 38% (260) 12% (80) 2% (11) 6852016 Vote: Donald Trump 23% (187) 28% (222) 28% (221) 21% (172) 8022016 Vote: Other 27% (22) 36% (30) 18% (15) 20% (17) 842016 Vote: Didn’t Vote 38% (161) 36% (152) 19% (79) 7% (30) 423Voted in 2014: Yes 36% (477) 32% (421) 20% (271) 12% (166) 1335Voted in 2014: No 35% (230) 37% (243) 19% (126) 10% (64) 663
Continued on next page
Page 183
National Tracking Poll #2110084, October, 2021
183
Table POL10_9
Table POL10_9: How concerned are you, if at all, about each of the following?Economic inequality
Demographic Very concernedSomewhatconcerned Not too concerned
Not concerned atall Total N
Registered Voters 35% (707) 33% (664) 20% (397) 11% (230) 19984-Region: Northeast 36% (128) 33% (117) 23% (81) 7% (26) 3534-Region: Midwest 36% (161) 33% (147) 18% (79) 13% (57) 4444-Region: South 36% (270) 31% (232) 21% (154) 12% (89) 7464-Region: West 32% (148) 37% (168) 18% (83) 13% (57) 455Party: Democrat/Leans Democrat 48% (441) 38% (348) 11% (97) 3% (28) 914Party: Republican/Leans Republican 22% (182) 29% (234) 28% (226) 21% (167) 808Note: Row proportions may total to larger than one-hundred percent due to rounding. For more information visit MorningConsultIntelligence.com.
Page 184
184
Morning ConsultTable POL10_10
Table POL10_10: How concerned are you, if at all, about each of the following?Cyber-attacks on the United States
Demographic Very concernedSomewhatconcerned Not too concerned
Not concerned atall Total N
Registered Voters 46% (928) 39% (783) 11% (216) 4% (71) 1998Gender: Male 45% (425) 39% (368) 12% (116) 3% (32) 942Gender: Female 48% (503) 39% (415) 9% (99) 4% (39) 1056Age: 18-34 31% (160) 44% (229) 17% (86) 8% (40) 514Age: 35-44 46% (142) 40% (122) 12% (38) 2% (5) 307Age: 45-64 51% (346) 37% (250) 9% (61) 3% (23) 679Age: 65+ 56% (280) 37% (183) 6% (31) 1% (3) 497GenZers: 1997-2012 27% (47) 47% (81) 14% (24) 11% (19) 170Millennials: 1981-1996 38% (212) 41% (226) 16% (90) 4% (24) 551GenXers: 1965-1980 47% (221) 39% (182) 10% (47) 4% (19) 469Baby Boomers: 1946-1964 56% (407) 36% (265) 7% (51) 1% (9) 732PID: Dem (no lean) 45% (353) 40% (310) 11% (87) 3% (27) 777PID: Ind (no lean) 41% (217) 41% (219) 12% (66) 5% (26) 528PID: Rep (no lean) 52% (358) 37% (255) 9% (63) 3% (18) 693PID/Gender: DemMen 42% (149) 42% (148) 11% (39) 4% (15) 352PID/Gender: DemWomen 48% (203) 38% (161) 11% (48) 3% (12) 425PID/Gender: Ind Men 42% (118) 39% (108) 15% (42) 4% (12) 280PID/Gender: Ind Women 40% (99) 45% (111) 10% (24) 6% (14) 248PID/Gender: Rep Men 51% (158) 36% (112) 11% (35) 2% (5) 310PID/Gender: Rep Women 52% (200) 37% (143) 7% (27) 3% (13) 384Ideo: Liberal (1-3) 42% (239) 40% (225) 13% (71) 6% (31) 566Ideo: Moderate (4) 43% (243) 44% (247) 11% (61) 1% (8) 560Ideo: Conservative (5-7) 55% (402) 34% (250) 8% (60) 2% (18) 730Educ: < College 46% (560) 39% (469) 10% (125) 4% (52) 1206Educ: Bachelors degree 49% (246) 38% (189) 12% (60) 1% (6) 501Educ: Post-grad 42% (121) 43% (126) 11% (31) 4% (13) 290Income: Under 50k 47% (411) 37% (321) 12% (104) 4% (37) 873Income: 50k-100k 46% (333) 42% (305) 10% (74) 2% (16) 728Income: 100k+ 46% (184) 40% (158) 9% (37) 5% (19) 398Ethnicity: White 46% (715) 41% (633) 10% (148) 3% (46) 1544Ethnicity: Hispanic 45% (100) 36% (80) 14% (31) 5% (11) 222
Continued on next page
Page 185
National Tracking Poll #2110084, October, 2021
185
Table POL10_10
Table POL10_10: How concerned are you, if at all, about each of the following?Cyber-attacks on the United States
Demographic Very concernedSomewhatconcerned Not too concerned
Not concerned atall Total N
Registered Voters 46% (928) 39% (783) 11% (216) 4% (71) 1998Ethnicity: Black 51% (128) 31% (77) 12% (31) 7% (17) 253Ethnicity: Other 42% (84) 36% (72) 18% (36) 4% (8) 201All Christian 50% (517) 40% (419) 8% (87) 2% (19) 1041All Non-Christian 49% (52) 38% (41) 9% (10) 4% (4) 107Atheist 42% (32) 33% (26) 15% (12) 9% (7) 78Agnostic/Nothing in particular 38% (182) 39% (186) 17% (84) 6% (28) 480Something Else 49% (145) 38% (112) 8% (24) 4% (12) 293Religious Non-Protestant/Catholic 52% (67) 36% (47) 9% (11) 3% (4) 129Evangelical 50% (251) 37% (185) 10% (50) 2% (12) 499Non-Evangelical 49% (388) 41% (327) 7% (56) 2% (19) 790Community: Urban 46% (224) 36% (175) 13% (65) 5% (24) 487Community: Suburban 47% (490) 41% (424) 10% (100) 3% (27) 1041Community: Rural 46% (214) 39% (184) 11% (51) 4% (20) 469Employ: Private Sector 40% (275) 42% (286) 14% (98) 4% (25) 684Employ: Government 44% (49) 43% (49) 10% (11) 3% (3) 112Employ: Self-Employed 43% (79) 39% (72) 10% (19) 7% (13) 183Employ: Homemaker 52% (53) 35% (37) 8% (8) 5% (5) 104Employ: Student 42% (28) 39% (26) 13% (9) 6% (4) 67Employ: Retired 55% (295) 37% (196) 7% (36) 1% (6) 534Employ: Unemployed 41% (77) 39% (75) 14% (27) 6% (11) 191Employ: Other 56% (70) 34% (42) 5% (7) 4% (5) 124Military HH: Yes 57% (179) 31% (97) 10% (31) 3% (8) 315Military HH: No 44% (749) 41% (686) 11% (185) 4% (63) 1683RD/WT: Right Direction 43% (329) 41% (311) 11% (85) 4% (33) 757RD/WT: Wrong Track 48% (599) 38% (472) 11% (131) 3% (39) 1241Biden Job Approve 44% (395) 41% (372) 12% (107) 3% (25) 899Biden Job Disapprove 50% (517) 37% (381) 10% (104) 3% (36) 1039
Continued on next page
Page 186
186
Morning ConsultTable POL10_10
Table POL10_10: How concerned are you, if at all, about each of the following?Cyber-attacks on the United States
Demographic Very concernedSomewhatconcerned Not too concerned
Not concerned atall Total N
Registered Voters 46% (928) 39% (783) 11% (216) 4% (71) 1998Biden Job Strongly Approve 49% (203) 38% (160) 10% (43) 3% (11) 418Biden Job Somewhat Approve 40% (192) 44% (212) 13% (64) 3% (14) 481Biden Job Somewhat Disapprove 39% (98) 44% (110) 14% (36) 3% (7) 250Biden Job Strongly Disapprove 53% (419) 34% (271) 9% (68) 4% (29) 788Favorable of Biden 44% (409) 42% (389) 11% (100) 3% (29) 927Unfavorable of Biden 50% (506) 37% (373) 10% (106) 3% (34) 1019Very Favorable of Biden 52% (246) 36% (173) 8% (37) 4% (20) 476Somewhat Favorable of Biden 36% (163) 48% (215) 14% (64) 2% (9) 451Somewhat Unfavorable of Biden 42% (86) 42% (88) 15% (31) 1% (3) 207Very Unfavorable of Biden 52% (420) 35% (285) 9% (76) 4% (31) 812#1 Issue: Economy 43% (334) 41% (315) 13% (96) 3% (23) 768#1 Issue: Security 59% (213) 31% (113) 7% (26) 2% (8) 360#1 Issue: Health Care 40% (93) 45% (104) 12% (27) 3% (7) 231#1 Issue: Medicare / Social Security 56% (127) 36% (82) 6% (13) 2% (4) 227#1 Issue: Women’s Issues 25% (31) 49% (61) 16% (21) 9% (12) 125#1 Issue: Education 32% (19) 43% (26) 12% (7) 13% (7) 59#1 Issue: Energy 46% (49) 32% (34) 19% (20) 3% (4) 107#1 Issue: Other 50% (61) 40% (48) 5% (6) 5% (7) 1222020 Vote: Joe Biden 45% (421) 41% (385) 12% (113) 3% (26) 9462020 Vote: Donald Trump 49% (426) 38% (327) 10% (82) 3% (29) 8642020 Vote: Didn’t Vote 42% (64) 37% (56) 12% (19) 9% (13) 1532018 House Vote: Democrat 47% (358) 38% (293) 12% (94) 3% (25) 7692018 House Vote: Republican 53% (372) 38% (269) 7% (49) 2% (11) 7022016 Vote: Hillary Clinton 46% (318) 39% (270) 11% (76) 3% (21) 6852016 Vote: Donald Trump 52% (414) 37% (296) 9% (71) 3% (20) 8022016 Vote: Other 40% (34) 41% (34) 13% (11) 6% (5) 842016 Vote: Didn’t Vote 38% (159) 43% (183) 13% (56) 6% (25) 423Voted in 2014: Yes 51% (685) 37% (492) 9% (127) 2% (31) 1335Voted in 2014: No 37% (243) 44% (291) 13% (89) 6% (40) 663
Continued on next page
Page 187
National Tracking Poll #2110084, October, 2021
187
Table POL10_10
Table POL10_10: How concerned are you, if at all, about each of the following?Cyber-attacks on the United States
Demographic Very concernedSomewhatconcerned Not too concerned
Not concerned atall Total N
Registered Voters 46% (928) 39% (783) 11% (216) 4% (71) 19984-Region: Northeast 42% (149) 45% (158) 11% (39) 2% (7) 3534-Region: Midwest 44% (197) 39% (172) 14% (60) 4% (16) 4444-Region: South 51% (383) 37% (273) 8% (61) 4% (29) 7464-Region: West 44% (199) 40% (182) 12% (55) 4% (20) 455Party: Democrat/Leans Democrat 46% (417) 39% (359) 12% (106) 4% (33) 914Party: Republican/Leans Republican 50% (406) 38% (309) 9% (72) 3% (21) 808Note: Row proportions may total to larger than one-hundred percent due to rounding. For more information visit MorningConsultIntelligence.com.
Page 188
188
Morning ConsultTable POL11
Table POL11: Do you think the U.S. economy will get better or worse in the next year, or do you think there will be no change?
Demographic Much worseSomewhatworse No change
Somewhatbetter Much better
Don’t know /No opinion Total N
Registered Voters 24% (474) 23% (462) 13% (257) 26% (510) 7% (139) 8% (156) 1998Gender: Male 20% (191) 21% (199) 13% (122) 31% (290) 10% (92) 5% (48) 942Gender: Female 27% (283) 25% (264) 13% (135) 21% (220) 4% (47) 10% (107) 1056Age: 18-34 17% (89) 17% (88) 14% (73) 30% (154) 10% (49) 12% (61) 514Age: 35-44 21% (65) 19% (59) 9% (28) 29% (88) 13% (40) 9% (27) 307Age: 45-64 28% (193) 24% (166) 14% (96) 23% (155) 5% (33) 5% (36) 679Age: 65+ 26% (128) 30% (149) 12% (60) 23% (112) 4% (17) 6% (31) 497GenZers: 1997-2012 17% (29) 22% (37) 14% (24) 24% (42) 5% (9) 18% (30) 170Millennials: 1981-1996 19% (105) 16% (88) 12% (65) 32% (176) 13% (70) 9% (48) 551GenXers: 1965-1980 26% (121) 24% (113) 15% (69) 22% (105) 5% (25) 8% (36) 469Baby Boomers: 1946-1964 27% (197) 28% (207) 13% (93) 22% (164) 5% (34) 5% (37) 732PID: Dem (no lean) 7% (53) 16% (122) 16% (122) 41% (321) 13% (97) 8% (62) 777PID: Ind (no lean) 23% (122) 26% (138) 14% (73) 21% (112) 4% (21) 12% (62) 528PID: Rep (no lean) 43% (300) 29% (202) 9% (62) 11% (77) 3% (21) 5% (32) 693PID/Gender: DemMen 4% (14) 10% (34) 16% (57) 47% (166) 17% (61) 6% (21) 352PID/Gender: DemWomen 9% (38) 21% (88) 15% (65) 37% (155) 9% (37) 10% (41) 425PID/Gender: Ind Men 22% (61) 28% (78) 11% (30) 28% (79) 5% (13) 6% (18) 280PID/Gender: Ind Women 24% (61) 24% (60) 17% (43) 13% (32) 3% (8) 18% (44) 248PID/Gender: Rep Men 37% (116) 28% (86) 11% (35) 14% (45) 6% (19) 3% (10) 310PID/Gender: Rep Women 48% (184) 30% (115) 7% (28) 8% (32) 1% (2) 6% (22) 384Ideo: Liberal (1-3) 8% (45) 15% (86) 14% (82) 41% (231) 13% (73) 9% (49) 566Ideo: Moderate (4) 13% (74) 27% (152) 16% (90) 32% (177) 6% (35) 6% (33) 560Ideo: Conservative (5-7) 44% (323) 28% (204) 8% (60) 12% (86) 3% (23) 5% (35) 730Educ: < College 27% (328) 23% (282) 12% (149) 22% (269) 5% (66) 9% (112) 1206Educ: Bachelors degree 21% (104) 25% (126) 12% (61) 30% (148) 7% (36) 5% (26) 501Educ: Post-grad 14% (42) 19% (55) 16% (47) 32% (93) 13% (37) 6% (18) 290Income: Under 50k 24% (213) 24% (213) 14% (123) 23% (202) 5% (42) 9% (80) 873Income: 50k-100k 25% (182) 24% (176) 13% (95) 24% (172) 7% (50) 7% (53) 728Income: 100k+ 20% (80) 19% (74) 10% (40) 34% (135) 12% (47) 6% (22) 398Ethnicity: White 26% (407) 24% (376) 12% (182) 24% (363) 6% (100) 7% (115) 1544Ethnicity: Hispanic 20% (46) 19% (41) 11% (25) 26% (57) 9% (21) 15% (33) 222Ethnicity: Black 10% (26) 16% (39) 20% (50) 36% (91) 9% (24) 9% (23) 253
Continued on next page
Page 189
National Tracking Poll #2110084, October, 2021
189
Table POL11
Table POL11: Do you think the U.S. economy will get better or worse in the next year, or do you think there will be no change?
Demographic Much worseSomewhatworse No change
Somewhatbetter Much better
Don’t know /No opinion Total N
Registered Voters 24% (474) 23% (462) 13% (257) 26% (510) 7% (139) 8% (156) 1998Ethnicity: Other 21% (42) 23% (47) 12% (25) 28% (55) 7% (15) 9% (18) 201All Christian 26% (271) 25% (259) 11% (118) 25% (260) 7% (75) 6% (58) 1041All Non-Christian 16% (17) 12% (13) 18% (20) 32% (34) 14% (15) 8% (8) 107Atheist 15% (12) 20% (15) 16% (12) 39% (30) 5% (4) 6% (5) 78Agnostic/Nothing in particular 21% (100) 21% (101) 14% (67) 25% (119) 6% (30) 13% (62) 480Something Else 26% (75) 25% (74) 14% (40) 22% (65) 5% (15) 8% (23) 293Religious Non-Protestant/Catholic 18% (23) 16% (21) 15% (20) 31% (40) 12% (16) 8% (11) 129Evangelical 27% (136) 26% (130) 11% (57) 20% (101) 9% (44) 6% (29) 499Non-Evangelical 26% (202) 24% (192) 12% (99) 26% (206) 5% (42) 6% (49) 790Community: Urban 12% (58) 17% (84) 16% (76) 33% (161) 15% (72) 8% (37) 487Community: Suburban 24% (248) 24% (253) 13% (133) 27% (281) 4% (45) 8% (81) 1041Community: Rural 36% (169) 27% (126) 10% (48) 14% (68) 5% (22) 8% (37) 469Employ: Private Sector 21% (142) 22% (152) 14% (92) 28% (191) 9% (62) 6% (44) 684Employ: Government 20% (22) 14% (16) 18% (21) 33% (37) 8% (9) 6% (7) 112Employ: Self-Employed 23% (42) 22% (41) 10% (18) 30% (56) 7% (13) 7% (13) 183Employ: Homemaker 33% (34) 21% (22) 17% (18) 14% (14) 5% (5) 11% (11) 104Employ: Student 12% (8) 28% (19) 19% (13) 18% (12) 7% (5) 17% (12) 67Employ: Retired 29% (156) 28% (149) 11% (58) 23% (121) 5% (27) 4% (22) 534Employ: Unemployed 20% (39) 17% (32) 13% (25) 28% (54) 6% (11) 16% (30) 191Employ: Other 25% (31) 24% (30) 10% (13) 20% (25) 6% (7) 14% (17) 124Military HH: Yes 28% (89) 22% (68) 15% (48) 25% (79) 5% (17) 5% (15) 315Military HH: No 23% (386) 23% (394) 12% (209) 26% (431) 7% (122) 8% (141) 1683RD/WT: Right Direction 4% (29) 9% (71) 14% (109) 50% (377) 16% (121) 7% (50) 757RD/WT: Wrong Track 36% (445) 32% (391) 12% (148) 11% (132) 1% (18) 9% (106) 1241Biden Job Approve 5% (45) 13% (114) 16% (147) 45% (405) 14% (124) 7% (64) 899Biden Job Disapprove 41% (424) 33% (341) 9% (98) 10% (99) 1% (15) 6% (61) 1039Biden Job Strongly Approve 4% (16) 6% (27) 14% (57) 50% (211) 22% (91) 4% (17) 418Biden Job Somewhat Approve 6% (30) 18% (86) 19% (90) 40% (194) 7% (33) 10% (47) 481Biden Job Somewhat Disapprove 10% (24) 44% (111) 17% (43) 20% (51) 1% (2) 8% (19) 250Biden Job Strongly Disapprove 51% (400) 29% (230) 7% (56) 6% (48) 2% (13) 5% (42) 788
Continued on next page
Page 190
190
Morning ConsultTable POL11
Table POL11: Do you think the U.S. economy will get better or worse in the next year, or do you think there will be no change?
Demographic Much worseSomewhatworse No change
Somewhatbetter Much better
Don’t know /No opinion Total N
Registered Voters 24% (474) 23% (462) 13% (257) 26% (510) 7% (139) 8% (156) 1998Favorable of Biden 5% (50) 13% (121) 17% (156) 44% (403) 13% (121) 8% (75) 927Unfavorable of Biden 41% (416) 33% (335) 9% (91) 9% (96) 2% (17) 6% (64) 1019Very Favorable of Biden 4% (21) 8% (37) 12% (58) 51% (244) 20% (95) 4% (21) 476Somewhat Favorable of Biden 6% (29) 19% (84) 22% (98) 35% (159) 6% (26) 12% (54) 451Somewhat Unfavorable of Biden 10% (20) 47% (96) 14% (30) 19% (40) 3% (6) 7% (15) 207Very Unfavorable of Biden 49% (396) 29% (239) 8% (61) 7% (56) 1% (11) 6% (48) 812#1 Issue: Economy 26% (198) 24% (187) 12% (95) 24% (185) 6% (49) 7% (54) 768#1 Issue: Security 39% (139) 29% (103) 9% (34) 13% (48) 6% (20) 4% (14) 360#1 Issue: Health Care 9% (22) 17% (38) 15% (35) 35% (81) 15% (34) 9% (21) 231#1 Issue: Medicare / Social Security 21% (48) 27% (62) 13% (30) 25% (57) 6% (13) 7% (17) 227#1 Issue: Women’s Issues 12% (15) 21% (26) 18% (22) 33% (41) 3% (3) 14% (17) 125#1 Issue: Education 12% (7) 13% (8) 11% (7) 38% (22) 6% (4) 19% (11) 59#1 Issue: Energy 12% (13) 13% (14) 18% (19) 41% (43) 11% (12) 5% (6) 107#1 Issue: Other 26% (32) 19% (24) 13% (15) 26% (31) 3% (4) 13% (16) 1222020 Vote: Joe Biden 6% (61) 17% (165) 16% (153) 41% (385) 11% (107) 8% (76) 9462020 Vote: Donald Trump 43% (376) 29% (247) 8% (70) 11% (94) 3% (24) 6% (54) 8642020 Vote: Didn’t Vote 19% (28) 26% (40) 20% (30) 17% (26) 4% (7) 14% (22) 1532018 House Vote: Democrat 8% (64) 15% (119) 16% (120) 42% (322) 11% (84) 8% (61) 7692018 House Vote: Republican 42% (292) 31% (215) 9% (62) 11% (78) 3% (24) 4% (31) 7022016 Vote: Hillary Clinton 8% (55) 14% (93) 17% (114) 42% (290) 11% (79) 8% (53) 6852016 Vote: Donald Trump 41% (329) 30% (239) 8% (63) 12% (98) 4% (28) 5% (44) 8022016 Vote: Other 15% (13) 30% (25) 19% (16) 28% (23) 3% (2) 5% (4) 842016 Vote: Didn’t Vote 18% (77) 25% (105) 15% (61) 22% (95) 7% (30) 13% (55) 423Voted in 2014: Yes 25% (336) 24% (317) 12% (158) 27% (358) 7% (93) 5% (73) 1335Voted in 2014: No 21% (138) 22% (145) 15% (99) 23% (151) 7% (46) 13% (83) 6634-Region: Northeast 20% (70) 24% (84) 14% (48) 28% (98) 8% (29) 7% (24) 3534-Region: Midwest 25% (111) 25% (113) 13% (56) 21% (95) 6% (28) 9% (41) 4444-Region: South 29% (214) 22% (164) 13% (100) 22% (164) 6% (43) 8% (60) 7464-Region: West 18% (80) 22% (101) 12% (53) 34% (153) 8% (39) 7% (30) 455Party: Democrat/Leans Democrat 7% (64) 16% (148) 16% (144) 41% (376) 12% (107) 8% (75) 914Party: Republican/Leans Republican 42% (337) 30% (244) 9% (73) 11% (87) 3% (22) 6% (46) 808Note: Row proportions may total to larger than one-hundred percent due to rounding. For more information visit MorningConsultIntelligence.com.
Page 191
National Tracking Poll #2110084, October, 2021
191
Table POL12_1
Table POL12_1: As you may know, inflation matched a 13-year high in the United States. To what extent do you think each of the following isresponsible for the increasing inflation in the U.S. economy?Americans returning to pre-pandemic behaviors
DemographicVery
responsibleSomewhatresponsible
Not tooresponsible
Not responsibleat all
Don’t know /No opinion Total N
Registered Voters 20% (391) 28% (569) 21% (412) 17% (347) 14% (280) 1998Gender: Male 20% (188) 30% (282) 21% (200) 19% (181) 10% (91) 942Gender: Female 19% (203) 27% (287) 20% (211) 16% (166) 18% (189) 1056Age: 18-34 28% (142) 29% (152) 16% (84) 10% (54) 16% (83) 514Age: 35-44 21% (66) 32% (98) 20% (61) 13% (39) 14% (43) 307Age: 45-64 16% (108) 25% (173) 23% (155) 21% (144) 15% (99) 679Age: 65+ 15% (75) 30% (147) 22% (112) 22% (110) 11% (54) 497GenZers: 1997-2012 24% (41) 27% (46) 17% (29) 10% (16) 22% (38) 170Millennials: 1981-1996 26% (144) 31% (172) 17% (96) 12% (66) 13% (73) 551GenXers: 1965-1980 17% (78) 28% (131) 23% (106) 18% (83) 15% (71) 469Baby Boomers: 1946-1964 16% (118) 27% (198) 22% (161) 22% (161) 13% (93) 732PID: Dem (no lean) 24% (188) 36% (283) 17% (135) 8% (62) 14% (110) 777PID: Ind (no lean) 18% (93) 30% (158) 18% (97) 16% (86) 18% (94) 528PID: Rep (no lean) 16% (110) 19% (128) 26% (180) 29% (199) 11% (76) 693PID/Gender: DemMen 27% (95) 37% (130) 17% (62) 8% (27) 11% (39) 352PID/Gender: DemWomen 22% (92) 36% (153) 17% (73) 8% (35) 17% (71) 425PID/Gender: Ind Men 19% (53) 32% (90) 20% (55) 18% (51) 11% (31) 280PID/Gender: Ind Women 16% (41) 28% (69) 17% (41) 14% (35) 25% (62) 248PID/Gender: Rep Men 13% (40) 20% (63) 27% (83) 33% (103) 7% (20) 310PID/Gender: Rep Women 18% (70) 17% (65) 25% (97) 25% (96) 14% (55) 384Ideo: Liberal (1-3) 23% (132) 39% (218) 15% (84) 9% (49) 15% (83) 566Ideo: Moderate (4) 23% (127) 32% (181) 24% (132) 10% (56) 11% (64) 560Ideo: Conservative (5-7) 16% (113) 19% (141) 24% (174) 31% (229) 10% (72) 730Educ: < College 20% (239) 26% (309) 21% (256) 18% (213) 16% (188) 1206Educ: Bachelors degree 20% (99) 32% (160) 18% (90) 18% (88) 13% (64) 501Educ: Post-grad 18% (52) 35% (100) 22% (65) 15% (45) 10% (28) 290Income: Under 50k 21% (181) 27% (239) 20% (176) 17% (146) 15% (131) 873Income: 50k-100k 19% (141) 28% (203) 21% (149) 18% (134) 14% (101) 728Income: 100k+ 17% (69) 32% (127) 22% (87) 17% (67) 12% (47) 398Ethnicity: White 18% (278) 28% (438) 21% (325) 20% (302) 13% (202) 1544
Continued on next page
Page 192
192
Morning ConsultTable POL12_1
Table POL12_1: As you may know, inflation matched a 13-year high in the United States. To what extent do you think each of the following isresponsible for the increasing inflation in the U.S. economy?Americans returning to pre-pandemic behaviors
DemographicVery
responsibleSomewhatresponsible
Not tooresponsible
Not responsibleat all
Don’t know /No opinion Total N
Registered Voters 20% (391) 28% (569) 21% (412) 17% (347) 14% (280) 1998Ethnicity: Hispanic 31% (68) 26% (58) 20% (44) 8% (18) 16% (35) 222Ethnicity: Black 26% (65) 34% (87) 15% (37) 7% (19) 18% (45) 253Ethnicity: Other 24% (48) 22% (44) 25% (50) 13% (26) 16% (33) 201All Christian 18% (183) 27% (285) 24% (251) 19% (199) 12% (123) 1041All Non-Christian 27% (28) 34% (36) 17% (18) 12% (13) 10% (11) 107Atheist 19% (15) 43% (33) 10% (8) 15% (12) 13% (10) 78Agnostic/Nothing in particular 20% (98) 26% (125) 17% (83) 16% (78) 20% (96) 480Something Else 23% (67) 31% (90) 18% (52) 15% (44) 14% (40) 293Religious Non-Protestant/Catholic 27% (35) 33% (43) 16% (21) 13% (17) 11% (14) 129Evangelical 20% (102) 28% (141) 19% (94) 20% (99) 13% (63) 499Non-Evangelical 17% (135) 28% (217) 26% (202) 18% (140) 12% (96) 790Community: Urban 29% (143) 29% (143) 17% (81) 9% (46) 15% (75) 487Community: Suburban 15% (153) 31% (328) 21% (217) 20% (204) 13% (140) 1041Community: Rural 20% (95) 21% (98) 24% (114) 21% (97) 14% (65) 469Employ: Private Sector 21% (143) 30% (207) 21% (143) 17% (116) 11% (75) 684Employ: Government 18% (20) 31% (35) 24% (27) 16% (18) 10% (11) 112Employ: Self-Employed 22% (40) 27% (49) 25% (46) 13% (23) 14% (25) 183Employ: Homemaker 18% (18) 27% (28) 19% (20) 17% (18) 19% (20) 104Employ: Student 22% (15) 38% (25) 13% (9) 9% (6) 18% (12) 67Employ: Retired 16% (83) 26% (136) 22% (120) 24% (131) 12% (64) 534Employ: Unemployed 22% (43) 28% (54) 14% (27) 10% (19) 25% (48) 191Employ: Other 23% (28) 28% (34) 15% (19) 14% (17) 21% (25) 124Military HH: Yes 18% (57) 24% (76) 22% (69) 23% (71) 13% (42) 315Military HH: No 20% (334) 29% (493) 20% (343) 16% (276) 14% (237) 1683RD/WT: Right Direction 26% (198) 40% (301) 16% (119) 5% (41) 13% (98) 757RD/WT: Wrong Track 16% (193) 22% (268) 24% (293) 25% (306) 15% (181) 1241Biden Job Approve 24% (217) 40% (361) 17% (157) 6% (51) 13% (113) 899Biden Job Disapprove 16% (168) 18% (190) 24% (250) 28% (293) 13% (139) 1039
Continued on next page
Page 193
National Tracking Poll #2110084, October, 2021
193
Table POL12_1
Table POL12_1: As you may know, inflation matched a 13-year high in the United States. To what extent do you think each of the following isresponsible for the increasing inflation in the U.S. economy?Americans returning to pre-pandemic behaviors
DemographicVery
responsibleSomewhatresponsible
Not tooresponsible
Not responsibleat all
Don’t know /No opinion Total N
Registered Voters 20% (391) 28% (569) 21% (412) 17% (347) 14% (280) 1998Biden Job Strongly Approve 30% (127) 39% (162) 15% (64) 5% (20) 11% (46) 418Biden Job Somewhat Approve 19% (90) 41% (199) 19% (93) 6% (31) 14% (68) 481Biden Job Somewhat Disapprove 18% (46) 32% (81) 21% (52) 16% (40) 13% (31) 250Biden Job Strongly Disapprove 15% (122) 14% (109) 25% (197) 32% (253) 14% (108) 788Favorable of Biden 24% (227) 40% (369) 17% (156) 6% (53) 13% (122) 927Unfavorable of Biden 16% (160) 18% (185) 24% (249) 28% (287) 14% (138) 1019Very Favorable of Biden 31% (149) 39% (186) 14% (67) 5% (25) 10% (49) 476Somewhat Favorable of Biden 17% (77) 41% (183) 20% (89) 6% (29) 16% (73) 451Somewhat Unfavorable of Biden 19% (38) 33% (68) 24% (50) 13% (27) 12% (24) 207Very Unfavorable of Biden 15% (122) 14% (118) 25% (199) 32% (259) 14% (114) 812#1 Issue: Economy 17% (133) 30% (229) 23% (179) 17% (127) 13% (100) 768#1 Issue: Security 19% (69) 13% (48) 23% (84) 33% (120) 11% (39) 360#1 Issue: Health Care 19% (45) 38% (89) 19% (43) 6% (14) 18% (41) 231#1 Issue: Medicare / Social Security 21% (48) 32% (73) 18% (41) 16% (36) 13% (29) 227#1 Issue: Women’s Issues 27% (34) 38% (47) 7% (9) 10% (13) 18% (22) 125#1 Issue: Education 9% (5) 38% (23) 26% (16) 4% (2) 22% (13) 59#1 Issue: Energy 31% (33) 31% (33) 11% (12) 13% (14) 13% (14) 107#1 Issue: Other 19% (24) 23% (28) 23% (28) 17% (21) 18% (21) 1222020 Vote: Joe Biden 24% (230) 39% (365) 17% (160) 7% (62) 14% (129) 9462020 Vote: Donald Trump 16% (135) 17% (150) 26% (222) 29% (253) 12% (105) 8642020 Vote: Didn’t Vote 15% (23) 30% (45) 14% (22) 17% (25) 25% (38) 1532018 House Vote: Democrat 23% (175) 38% (294) 18% (139) 6% (50) 14% (110) 7692018 House Vote: Republican 17% (122) 18% (123) 25% (177) 30% (210) 10% (70) 7022016 Vote: Hillary Clinton 23% (156) 40% (271) 17% (119) 7% (45) 14% (93) 6852016 Vote: Donald Trump 18% (142) 19% (150) 24% (194) 29% (229) 11% (86) 8022016 Vote: Other 15% (13) 27% (22) 22% (18) 15% (13) 21% (18) 842016 Vote: Didn’t Vote 19% (79) 29% (123) 18% (78) 14% (60) 20% (83) 423Voted in 2014: Yes 19% (258) 28% (380) 22% (293) 19% (251) 12% (154) 1335Voted in 2014: No 20% (133) 29% (189) 18% (118) 15% (96) 19% (126) 663
Continued on next page
Page 194
194
Morning ConsultTable POL12_1
Table POL12_1: As you may know, inflation matched a 13-year high in the United States. To what extent do you think each of the following isresponsible for the increasing inflation in the U.S. economy?Americans returning to pre-pandemic behaviors
DemographicVery
responsibleSomewhatresponsible
Not tooresponsible
Not responsibleat all
Don’t know /No opinion Total N
Registered Voters 20% (391) 28% (569) 21% (412) 17% (347) 14% (280) 19984-Region: Northeast 18% (63) 31% (109) 22% (79) 15% (51) 14% (51) 3534-Region: Midwest 21% (93) 26% (117) 22% (97) 19% (86) 12% (52) 4444-Region: South 17% (126) 30% (224) 19% (144) 18% (135) 16% (117) 7464-Region: West 24% (110) 26% (119) 20% (92) 16% (74) 13% (60) 455Party: Democrat/Leans Democrat 24% (216) 39% (352) 17% (152) 8% (71) 14% (124) 914Party: Republican/Leans Republican 16% (128) 18% (147) 26% (209) 29% (231) 11% (93) 808Note: Row proportions may total to larger than one-hundred percent due to rounding. For more information visit MorningConsultIntelligence.com.
Page 195
National Tracking Poll #2110084, October, 2021
195
Table POL12_2
Table POL12_2: As you may know, inflation matched a 13-year high in the United States. To what extent do you think each of the following isresponsible for the increasing inflation in the U.S. economy?The Biden administration’s policies
DemographicVery
responsibleSomewhatresponsible
Not tooresponsible
Not responsibleat all
Don’t know /No opinion Total N
Registered Voters 40% (791) 22% (436) 18% (351) 10% (207) 11% (213) 1998Gender: Male 41% (390) 23% (212) 18% (170) 11% (102) 7% (68) 942Gender: Female 38% (401) 21% (224) 17% (181) 10% (105) 14% (146) 1056Age: 18-34 26% (136) 31% (157) 16% (81) 10% (53) 17% (87) 514Age: 35-44 34% (105) 23% (69) 19% (57) 11% (33) 14% (42) 307Age: 45-64 47% (317) 19% (132) 17% (117) 8% (57) 8% (57) 679Age: 65+ 47% (234) 16% (77) 19% (95) 13% (63) 5% (27) 497GenZers: 1997-2012 15% (26) 30% (52) 20% (34) 10% (17) 25% (42) 170Millennials: 1981-1996 34% (185) 28% (155) 16% (87) 10% (54) 13% (71) 551GenXers: 1965-1980 42% (199) 21% (98) 16% (74) 10% (49) 11% (49) 469Baby Boomers: 1946-1964 47% (343) 17% (121) 19% (142) 11% (79) 6% (46) 732PID: Dem (no lean) 16% (125) 25% (192) 30% (232) 15% (118) 14% (109) 777PID: Ind (no lean) 33% (175) 28% (149) 16% (82) 9% (47) 14% (74) 528PID: Rep (no lean) 71% (490) 14% (95) 5% (37) 6% (41) 4% (30) 693PID/Gender: DemMen 18% (63) 25% (88) 30% (104) 17% (61) 10% (36) 352PID/Gender: DemWomen 15% (62) 25% (104) 30% (128) 14% (57) 17% (73) 425PID/Gender: Ind Men 37% (104) 28% (79) 16% (44) 10% (29) 8% (23) 280PID/Gender: Ind Women 29% (71) 28% (70) 15% (38) 7% (18) 21% (52) 248PID/Gender: Rep Men 72% (222) 15% (45) 7% (21) 4% (12) 3% (9) 310PID/Gender: Rep Women 70% (268) 13% (50) 4% (15) 8% (29) 6% (22) 384Ideo: Liberal (1-3) 15% (84) 24% (138) 31% (176) 15% (87) 14% (80) 566Ideo: Moderate (4) 28% (155) 29% (164) 23% (131) 10% (57) 10% (54) 560Ideo: Conservative (5-7) 72% (523) 13% (91) 5% (33) 8% (56) 4% (26) 730Educ: < College 41% (494) 20% (242) 16% (194) 10% (124) 13% (152) 1206Educ: Bachelors degree 37% (187) 25% (127) 17% (87) 12% (58) 8% (42) 501Educ: Post-grad 38% (110) 23% (66) 24% (70) 9% (25) 7% (19) 290Income: Under 50k 36% (317) 22% (196) 18% (160) 9% (78) 14% (122) 873Income: 50k-100k 42% (304) 21% (150) 17% (121) 12% (88) 9% (64) 728Income: 100k+ 43% (171) 23% (90) 17% (69) 10% (40) 7% (27) 398Ethnicity: White 44% (679) 20% (316) 17% (259) 9% (144) 9% (145) 1544
Continued on next page
Page 196
196
Morning ConsultTable POL12_2
Table POL12_2: As you may know, inflation matched a 13-year high in the United States. To what extent do you think each of the following isresponsible for the increasing inflation in the U.S. economy?The Biden administration’s policies
DemographicVery
responsibleSomewhatresponsible
Not tooresponsible
Not responsibleat all
Don’t know /No opinion Total N
Registered Voters 40% (791) 22% (436) 18% (351) 10% (207) 11% (213) 1998Ethnicity: Hispanic 27% (60) 21% (48) 24% (54) 12% (27) 15% (34) 222Ethnicity: Black 23% (58) 26% (65) 23% (58) 13% (32) 16% (40) 253Ethnicity: Other 27% (54) 27% (54) 17% (34) 15% (30) 14% (29) 201All Christian 48% (497) 19% (201) 17% (173) 10% (100) 7% (71) 1041All Non-Christian 35% (37) 15% (16) 26% (27) 14% (15) 10% (11) 107Atheist 19% (14) 32% (25) 26% (20) 8% (6) 15% (12) 78Agnostic/Nothing in particular 29% (141) 23% (111) 17% (79) 14% (66) 17% (82) 480Something Else 35% (101) 28% (83) 18% (51) 7% (20) 13% (38) 293Religious Non-Protestant/Catholic 40% (52) 16% (20) 22% (28) 12% (15) 11% (14) 129Evangelical 49% (244) 22% (109) 14% (70) 7% (37) 8% (39) 499Non-Evangelical 42% (331) 20% (160) 19% (150) 10% (83) 8% (66) 790Community: Urban 34% (165) 26% (127) 17% (81) 13% (61) 11% (53) 487Community: Suburban 39% (406) 20% (212) 19% (203) 10% (104) 11% (116) 1041Community: Rural 47% (220) 21% (97) 14% (67) 9% (41) 9% (44) 469Employ: Private Sector 41% (278) 27% (183) 14% (93) 11% (75) 8% (55) 684Employ: Government 28% (31) 24% (26) 28% (31) 11% (12) 10% (12) 112Employ: Self-Employed 43% (78) 18% (33) 17% (31) 14% (25) 8% (15) 183Employ: Homemaker 46% (48) 20% (21) 13% (14) 9% (9) 11% (12) 104Employ: Student 17% (12) 34% (23) 22% (15) 4% (3) 22% (15) 67Employ: Retired 49% (260) 14% (73) 21% (113) 11% (57) 6% (30) 534Employ: Unemployed 23% (43) 19% (37) 20% (37) 10% (19) 29% (55) 191Employ: Other 34% (42) 31% (38) 13% (16) 6% (8) 17% (20) 124Military HH: Yes 44% (138) 19% (59) 18% (56) 10% (32) 9% (29) 315Military HH: No 39% (652) 22% (377) 18% (296) 10% (174) 11% (184) 1683RD/WT: Right Direction 16% (120) 26% (195) 30% (230) 15% (113) 13% (100) 757RD/WT: Wrong Track 54% (671) 19% (241) 10% (121) 8% (94) 9% (113) 1241Biden Job Approve 14% (122) 27% (240) 32% (288) 15% (138) 12% (111) 899Biden Job Disapprove 64% (663) 18% (183) 5% (56) 6% (67) 7% (70) 1039
Continued on next page
Page 197
National Tracking Poll #2110084, October, 2021
197
Table POL12_2
Table POL12_2: As you may know, inflation matched a 13-year high in the United States. To what extent do you think each of the following isresponsible for the increasing inflation in the U.S. economy?The Biden administration’s policies
DemographicVery
responsibleSomewhatresponsible
Not tooresponsible
Not responsibleat all
Don’t know /No opinion Total N
Registered Voters 40% (791) 22% (436) 18% (351) 10% (207) 11% (213) 1998Biden Job Strongly Approve 19% (80) 19% (78) 31% (131) 21% (87) 10% (42) 418Biden Job Somewhat Approve 9% (42) 34% (163) 33% (157) 11% (51) 14% (69) 481Biden Job Somewhat Disapprove 24% (60) 42% (105) 18% (46) 5% (12) 11% (27) 250Biden Job Strongly Disapprove 77% (603) 10% (78) 1% (10) 7% (55) 5% (43) 788Favorable of Biden 13% (122) 28% (258) 31% (292) 15% (138) 13% (117) 927Unfavorable of Biden 65% (661) 16% (162) 5% (55) 7% (67) 7% (73) 1019Very Favorable of Biden 20% (93) 19% (90) 30% (143) 21% (101) 10% (48) 476Somewhat Favorable of Biden 6% (28) 37% (168) 33% (149) 8% (37) 15% (69) 451Somewhat Unfavorable of Biden 25% (53) 39% (80) 19% (39) 5% (11) 11% (24) 207Very Unfavorable of Biden 75% (608) 10% (82) 2% (16) 7% (56) 6% (49) 812#1 Issue: Economy 41% (316) 26% (198) 17% (128) 7% (56) 9% (70) 768#1 Issue: Security 65% (235) 13% (46) 7% (25) 9% (32) 6% (22) 360#1 Issue: Health Care 20% (45) 23% (53) 22% (51) 15% (35) 20% (46) 231#1 Issue: Medicare / Social Security 39% (88) 16% (35) 25% (56) 9% (21) 12% (26) 227#1 Issue: Women’s Issues 15% (18) 28% (35) 30% (38) 13% (16) 14% (18) 125#1 Issue: Education 19% (12) 30% (18) 17% (10) 14% (8) 20% (12) 59#1 Issue: Energy 22% (24) 30% (32) 20% (22) 17% (18) 10% (11) 107#1 Issue: Other 44% (53) 16% (20) 17% (21) 15% (19) 7% (9) 1222020 Vote: Joe Biden 15% (137) 28% (260) 30% (285) 15% (141) 13% (122) 9462020 Vote: Donald Trump 69% (597) 15% (126) 5% (43) 6% (52) 5% (45) 8642020 Vote: Didn’t Vote 29% (45) 25% (38) 11% (17) 9% (13) 26% (40) 1532018 House Vote: Democrat 17% (129) 26% (201) 28% (218) 16% (126) 12% (94) 7692018 House Vote: Republican 70% (492) 14% (96) 7% (48) 5% (37) 4% (28) 7022016 Vote: Hillary Clinton 15% (102) 27% (183) 29% (200) 17% (118) 12% (82) 6852016 Vote: Donald Trump 68% (546) 14% (111) 7% (56) 6% (50) 5% (39) 8022016 Vote: Other 29% (24) 29% (25) 23% (19) 6% (5) 13% (11) 842016 Vote: Didn’t Vote 28% (117) 28% (117) 18% (75) 8% (32) 19% (82) 423Voted in 2014: Yes 43% (580) 19% (251) 19% (254) 11% (149) 8% (101) 1335Voted in 2014: No 32% (210) 28% (185) 15% (97) 9% (58) 17% (113) 663
Continued on next page
Page 198
198
Morning ConsultTable POL12_2
Table POL12_2: As you may know, inflation matched a 13-year high in the United States. To what extent do you think each of the following isresponsible for the increasing inflation in the U.S. economy?The Biden administration’s policies
DemographicVery
responsibleSomewhatresponsible
Not tooresponsible
Not responsibleat all
Don’t know /No opinion Total N
Registered Voters 40% (791) 22% (436) 18% (351) 10% (207) 11% (213) 19984-Region: Northeast 39% (139) 23% (81) 18% (64) 10% (36) 9% (33) 3534-Region: Midwest 41% (181) 24% (107) 16% (73) 9% (41) 10% (42) 4444-Region: South 43% (324) 21% (159) 15% (115) 9% (69) 11% (78) 7464-Region: West 32% (147) 20% (89) 22% (99) 13% (60) 13% (60) 455Party: Democrat/Leans Democrat 15% (141) 26% (240) 30% (275) 15% (137) 13% (122) 914Party: Republican/Leans Republican 69% (558) 15% (121) 5% (42) 6% (45) 5% (43) 808Note: Row proportions may total to larger than one-hundred percent due to rounding. For more information visit MorningConsultIntelligence.com.
Page 199
National Tracking Poll #2110084, October, 2021
199
Table POL13
Table POL13: Do you support or oppose holding social media platforms legally responsible for any harm that happens to users as a result of thepersonalized algorithms these social media companies use to make recommendations for users?
DemographicStronglysupport
Somewhatsupport
Somewhatoppose
Stronglyoppose
Don’t know /No opinion Total N
Registered Voters 31% (624) 29% (583) 11% (219) 10% (192) 19% (380) 1998Gender: Male 36% (343) 27% (254) 12% (111) 10% (97) 15% (137) 942Gender: Female 27% (281) 31% (329) 10% (108) 9% (94) 23% (243) 1056Age: 18-34 23% (118) 31% (161) 12% (63) 13% (68) 20% (104) 514Age: 35-44 25% (75) 35% (107) 10% (31) 11% (34) 20% (60) 307Age: 45-64 34% (230) 27% (186) 12% (82) 8% (57) 18% (125) 679Age: 65+ 40% (200) 26% (130) 9% (43) 7% (33) 18% (90) 497GenZers: 1997-2012 19% (32) 29% (49) 12% (20) 14% (24) 27% (46) 170Millennials: 1981-1996 26% (144) 32% (179) 12% (64) 13% (71) 17% (95) 551GenXers: 1965-1980 26% (123) 32% (150) 11% (52) 9% (41) 22% (103) 469Baby Boomers: 1946-1964 40% (289) 25% (185) 10% (77) 7% (54) 17% (128) 732PID: Dem (no lean) 33% (255) 36% (279) 9% (74) 6% (50) 15% (120) 777PID: Ind (no lean) 28% (150) 26% (138) 12% (63) 11% (56) 23% (122) 528PID: Rep (no lean) 32% (220) 24% (167) 12% (83) 12% (85) 20% (138) 693PID/Gender: DemMen 38% (135) 33% (115) 9% (33) 7% (25) 13% (44) 352PID/Gender: DemWomen 28% (120) 39% (164) 10% (40) 6% (25) 18% (75) 425PID/Gender: Ind Men 33% (91) 24% (67) 12% (33) 14% (39) 17% (49) 280PID/Gender: Ind Women 24% (58) 28% (70) 12% (29) 7% (17) 29% (73) 248PID/Gender: Rep Men 38% (117) 23% (72) 14% (45) 11% (33) 14% (43) 310PID/Gender: Rep Women 27% (103) 25% (95) 10% (38) 14% (52) 25% (95) 384Ideo: Liberal (1-3) 37% (209) 33% (187) 10% (56) 7% (40) 13% (74) 566Ideo: Moderate (4) 26% (147) 34% (191) 14% (76) 6% (36) 20% (110) 560Ideo: Conservative (5-7) 35% (253) 24% (174) 11% (78) 12% (91) 18% (134) 730Educ: < College 27% (329) 28% (338) 11% (132) 11% (137) 22% (271) 1206Educ: Bachelors degree 38% (191) 29% (147) 11% (56) 7% (37) 14% (71) 501Educ: Post-grad 36% (104) 34% (98) 11% (32) 6% (18) 13% (38) 290Income: Under 50k 28% (247) 26% (231) 12% (101) 11% (93) 23% (202) 873Income: 50k-100k 34% (246) 28% (205) 10% (71) 9% (67) 19% (138) 728Income: 100k+ 33% (131) 37% (147) 12% (47) 8% (32) 10% (40) 398Ethnicity: White 33% (513) 29% (443) 11% (169) 9% (139) 18% (278) 1544Ethnicity: Hispanic 25% (55) 27% (60) 10% (23) 22% (48) 17% (37) 222
Continued on next page
Page 200
200
Morning ConsultTable POL13
Table POL13: Do you support or oppose holding social media platforms legally responsible for any harm that happens to users as a result of thepersonalized algorithms these social media companies use to make recommendations for users?
DemographicStronglysupport
Somewhatsupport
Somewhatoppose
Stronglyoppose
Don’t know /No opinion Total N
Registered Voters 31% (624) 29% (583) 11% (219) 10% (192) 19% (380) 1998Ethnicity: Black 28% (71) 36% (91) 10% (24) 7% (19) 19% (49) 253Ethnicity: Other 20% (40) 24% (49) 13% (26) 17% (34) 26% (53) 201All Christian 32% (333) 30% (309) 11% (116) 9% (94) 18% (190) 1041All Non-Christian 48% (51) 24% (25) 13% (14) 8% (9) 7% (7) 107Atheist 28% (22) 36% (28) 10% (8) 8% (6) 17% (13) 78Agnostic/Nothing in particular 27% (132) 28% (135) 10% (48) 13% (61) 22% (103) 480Something Else 30% (87) 29% (85) 11% (33) 7% (21) 23% (66) 293Religious Non-Protestant/Catholic 48% (62) 24% (31) 12% (16) 9% (11) 7% (9) 129Evangelical 34% (169) 27% (137) 12% (60) 8% (39) 19% (94) 499Non-Evangelical 29% (231) 30% (241) 11% (86) 9% (72) 20% (160) 790Community: Urban 33% (163) 32% (157) 10% (46) 10% (47) 15% (74) 487Community: Suburban 32% (337) 29% (305) 12% (120) 9% (90) 18% (189) 1041Community: Rural 27% (125) 26% (121) 11% (52) 12% (55) 25% (117) 469Employ: Private Sector 33% (223) 30% (207) 12% (84) 9% (62) 16% (108) 684Employ: Government 23% (26) 40% (44) 15% (17) 7% (8) 14% (16) 112Employ: Self-Employed 33% (60) 29% (54) 10% (18) 11% (19) 17% (32) 183Employ: Homemaker 19% (20) 32% (33) 6% (6) 9% (10) 34% (35) 104Employ: Student 23% (16) 36% (24) 16% (11) 7% (4) 18% (12) 67Employ: Retired 41% (221) 26% (138) 9% (46) 7% (39) 17% (90) 534Employ: Unemployed 21% (41) 28% (53) 8% (15) 13% (26) 29% (56) 191Employ: Other 14% (17) 24% (29) 18% (22) 18% (23) 26% (32) 124Military HH: Yes 39% (124) 26% (82) 11% (33) 8% (25) 16% (50) 315Military HH: No 30% (500) 30% (501) 11% (186) 10% (167) 20% (330) 1683RD/WT: Right Direction 32% (242) 38% (287) 10% (78) 7% (51) 13% (99) 757RD/WT: Wrong Track 31% (383) 24% (296) 11% (141) 11% (140) 23% (281) 1241Biden Job Approve 32% (289) 37% (334) 11% (95) 6% (57) 14% (125) 899Biden Job Disapprove 32% (328) 23% (234) 12% (122) 13% (133) 21% (221) 1039
Continued on next page
Page 201
National Tracking Poll #2110084, October, 2021
201
Table POL13
Table POL13: Do you support or oppose holding social media platforms legally responsible for any harm that happens to users as a result of thepersonalized algorithms these social media companies use to make recommendations for users?
DemographicStronglysupport
Somewhatsupport
Somewhatoppose
Stronglyoppose
Don’t know /No opinion Total N
Registered Voters 31% (624) 29% (583) 11% (219) 10% (192) 19% (380) 1998Biden Job Strongly Approve 41% (171) 32% (132) 9% (39) 7% (30) 11% (46) 418Biden Job Somewhat Approve 24% (118) 42% (202) 12% (55) 6% (27) 17% (80) 481Biden Job Somewhat Disapprove 22% (56) 35% (87) 18% (45) 8% (19) 17% (43) 250Biden Job Strongly Disapprove 35% (272) 19% (147) 10% (77) 14% (114) 23% (179) 788Favorable of Biden 32% (295) 36% (332) 11% (101) 7% (65) 14% (134) 927Unfavorable of Biden 32% (324) 24% (240) 11% (109) 12% (127) 21% (219) 1019Very Favorable of Biden 38% (183) 36% (169) 9% (40) 7% (32) 11% (50) 476Somewhat Favorable of Biden 25% (112) 36% (162) 14% (61) 7% (32) 18% (83) 451Somewhat Unfavorable of Biden 23% (48) 38% (79) 17% (35) 5% (10) 18% (37) 207Very Unfavorable of Biden 34% (277) 20% (161) 9% (75) 14% (117) 22% (182) 812#1 Issue: Economy 26% (203) 31% (241) 11% (88) 11% (84) 20% (152) 768#1 Issue: Security 40% (143) 19% (67) 13% (47) 14% (50) 14% (52) 360#1 Issue: Health Care 28% (64) 31% (70) 13% (30) 11% (25) 18% (42) 231#1 Issue: Medicare / Social Security 39% (89) 27% (61) 8% (18) 4% (9) 22% (49) 227#1 Issue: Women’s Issues 29% (36) 37% (46) 10% (13) 5% (6) 19% (23) 125#1 Issue: Education 23% (14) 50% (29) 4% (2) 5% (3) 18% (11) 59#1 Issue: Energy 35% (37) 25% (27) 13% (14) 8% (8) 19% (21) 107#1 Issue: Other 32% (39) 34% (41) 5% (6) 6% (7) 24% (29) 1222020 Vote: Joe Biden 33% (308) 35% (330) 10% (98) 7% (67) 15% (142) 9462020 Vote: Donald Trump 31% (268) 24% (207) 12% (102) 12% (105) 21% (182) 8642020 Vote: Didn’t Vote 26% (40) 23% (36) 12% (18) 9% (14) 29% (45) 1532018 House Vote: Democrat 32% (249) 35% (266) 10% (78) 8% (64) 15% (112) 7692018 House Vote: Republican 36% (253) 25% (176) 11% (80) 9% (63) 19% (130) 7022016 Vote: Hillary Clinton 33% (229) 37% (256) 9% (63) 6% (40) 14% (98) 6852016 Vote: Donald Trump 35% (283) 24% (190) 12% (97) 12% (94) 17% (137) 8022016 Vote: Other 26% (22) 23% (20) 14% (12) 11% (9) 26% (22) 842016 Vote: Didn’t Vote 21% (91) 27% (116) 11% (45) 11% (48) 29% (123) 423Voted in 2014: Yes 35% (463) 30% (398) 11% (147) 8% (110) 16% (216) 1335Voted in 2014: No 24% (161) 28% (185) 11% (72) 12% (81) 25% (164) 663
Continued on next page
Page 202
202
Morning ConsultTable POL13
Table POL13: Do you support or oppose holding social media platforms legally responsible for any harm that happens to users as a result of thepersonalized algorithms these social media companies use to make recommendations for users?
DemographicStronglysupport
Somewhatsupport
Somewhatoppose
Stronglyoppose
Don’t know /No opinion Total N
Registered Voters 31% (624) 29% (583) 11% (219) 10% (192) 19% (380) 19984-Region: Northeast 26% (92) 31% (110) 14% (50) 7% (25) 21% (76) 3534-Region: Midwest 35% (154) 28% (123) 7% (30) 12% (55) 19% (83) 4444-Region: South 32% (239) 28% (206) 11% (85) 10% (75) 19% (141) 7464-Region: West 31% (140) 32% (144) 12% (55) 8% (37) 18% (80) 455Party: Democrat/Leans Democrat 32% (292) 36% (332) 10% (91) 7% (63) 15% (137) 914Party: Republican/Leans Republican 31% (251) 24% (191) 12% (100) 12% (95) 21% (171) 808Note: Row proportions may total to larger than one-hundred percent due to rounding. For more information visit MorningConsultIntelligence.com.
Page 203
National Tracking Poll #2110084, October, 2021
203
Table POL14_1
Table POL14_1: Do you approve or disapprove of the following proposals to reform the United States Supreme Court?Expanding the number of justices on the court
DemographicStronglyapprove
Somewhatapprove
Somewhatdisapprove
Stronglydisapprove
Don’t know /No opinion Total N
Registered Voters 18% (360) 22% (437) 13% (257) 28% (569) 19% (375) 1998Gender: Male 21% (199) 21% (193) 12% (110) 35% (331) 11% (107) 942Gender: Female 15% (161) 23% (244) 14% (147) 22% (237) 25% (267) 1056Age: 18-34 22% (112) 31% (160) 9% (44) 11% (56) 28% (143) 514Age: 35-44 26% (80) 27% (84) 11% (35) 12% (37) 23% (72) 307Age: 45-64 15% (99) 17% (113) 17% (117) 36% (242) 16% (109) 679Age: 65+ 14% (69) 16% (81) 12% (62) 47% (234) 10% (51) 497GenZers: 1997-2012 15% (26) 27% (45) 10% (18) 10% (18) 38% (64) 170Millennials: 1981-1996 26% (144) 32% (179) 8% (43) 11% (63) 22% (122) 551GenXers: 1965-1980 15% (70) 18% (84) 17% (79) 29% (134) 22% (102) 469Baby Boomers: 1946-1964 15% (111) 16% (119) 15% (112) 42% (310) 11% (81) 732PID: Dem (no lean) 29% (228) 33% (255) 14% (105) 7% (57) 17% (132) 777PID: Ind (no lean) 17% (90) 19% (99) 12% (63) 27% (142) 25% (134) 528PID: Rep (no lean) 6% (43) 12% (83) 13% (89) 53% (370) 16% (109) 693PID/Gender: DemMen 34% (121) 30% (104) 15% (53) 9% (32) 12% (41) 352PID/Gender: DemWomen 25% (107) 35% (151) 12% (52) 6% (24) 21% (90) 425PID/Gender: Ind Men 19% (52) 18% (51) 13% (37) 34% (95) 16% (45) 280PID/Gender: Ind Women 15% (37) 19% (48) 11% (26) 19% (47) 36% (89) 248PID/Gender: Rep Men 8% (26) 12% (38) 7% (21) 66% (204) 7% (21) 310PID/Gender: Rep Women 4% (17) 12% (45) 18% (68) 43% (166) 23% (88) 384Ideo: Liberal (1-3) 36% (201) 31% (174) 13% (74) 7% (37) 14% (80) 566Ideo: Moderate (4) 15% (87) 28% (159) 17% (93) 19% (106) 21% (115) 560Ideo: Conservative (5-7) 8% (55) 11% (83) 11% (77) 57% (418) 13% (98) 730Educ: < College 15% (179) 21% (256) 13% (161) 27% (321) 24% (288) 1206Educ: Bachelors degree 22% (109) 24% (119) 12% (58) 32% (160) 11% (56) 501Educ: Post-grad 25% (73) 21% (62) 13% (37) 30% (88) 10% (30) 290Income: Under 50k 17% (151) 22% (192) 14% (120) 22% (191) 25% (219) 873Income: 50k-100k 18% (131) 20% (143) 11% (82) 34% (249) 17% (122) 728Income: 100k+ 20% (78) 26% (102) 14% (55) 32% (129) 8% (33) 398Ethnicity: White 16% (248) 20% (314) 13% (201) 33% (517) 17% (265) 1544Ethnicity: Hispanic 24% (54) 25% (55) 13% (30) 17% (37) 21% (46) 222
Continued on next page
Page 204
204
Morning ConsultTable POL14_1
Table POL14_1: Do you approve or disapprove of the following proposals to reform the United States Supreme Court?Expanding the number of justices on the court
DemographicStronglyapprove
Somewhatapprove
Somewhatdisapprove
Stronglydisapprove
Don’t know /No opinion Total N
Registered Voters 18% (360) 22% (437) 13% (257) 28% (569) 19% (375) 1998Ethnicity: Black 27% (68) 27% (69) 12% (31) 8% (21) 26% (65) 253Ethnicity: Other 22% (45) 27% (54) 13% (26) 15% (31) 22% (45) 201All Christian 14% (149) 21% (218) 14% (144) 38% (393) 13% (138) 1041All Non-Christian 33% (35) 23% (25) 11% (12) 25% (27) 8% (8) 107Atheist 28% (22) 35% (27) 12% (10) 16% (12) 9% (7) 78Agnostic/Nothing in particular 23% (108) 21% (99) 11% (54) 18% (86) 28% (133) 480Something Else 16% (46) 23% (68) 13% (39) 17% (51) 30% (89) 293Religious Non-Protestant/Catholic 27% (35) 22% (28) 10% (14) 29% (37) 11% (15) 129Evangelical 15% (74) 22% (110) 12% (59) 33% (163) 19% (93) 499Non-Evangelical 15% (117) 20% (161) 15% (118) 34% (267) 16% (126) 790Community: Urban 28% (138) 33% (158) 13% (63) 14% (68) 12% (60) 487Community: Suburban 15% (160) 19% (199) 13% (137) 31% (326) 21% (219) 1041Community: Rural 13% (62) 17% (80) 12% (57) 37% (175) 20% (95) 469Employ: Private Sector 20% (139) 24% (166) 14% (97) 26% (178) 15% (103) 684Employ: Government 18% (21) 29% (33) 12% (14) 23% (25) 18% (20) 112Employ: Self-Employed 19% (35) 21% (38) 12% (21) 26% (48) 22% (40) 183Employ: Homemaker 18% (19) 23% (24) 9% (10) 16% (16) 34% (35) 104Employ: Student 16% (10) 33% (22) 7% (5) 11% (8) 33% (22) 67Employ: Retired 16% (83) 15% (82) 14% (72) 47% (252) 8% (44) 534Employ: Unemployed 20% (38) 26% (49) 11% (22) 11% (21) 32% (60) 191Employ: Other 12% (14) 18% (22) 14% (17) 17% (20) 40% (50) 124Military HH: Yes 16% (50) 18% (55) 11% (34) 43% (137) 12% (39) 315Military HH: No 18% (310) 23% (382) 13% (223) 26% (432) 20% (336) 1683RD/WT: Right Direction 29% (220) 34% (254) 15% (111) 6% (46) 17% (126) 757RD/WT: Wrong Track 11% (140) 15% (183) 12% (146) 42% (522) 20% (249) 1241Biden Job Approve 29% (258) 34% (304) 15% (132) 7% (62) 16% (143) 899Biden Job Disapprove 9% (96) 12% (123) 12% (124) 48% (501) 19% (195) 1039
Continued on next page
Page 205
National Tracking Poll #2110084, October, 2021
205
Table POL14_1
Table POL14_1: Do you approve or disapprove of the following proposals to reform the United States Supreme Court?Expanding the number of justices on the court
DemographicStronglyapprove
Somewhatapprove
Somewhatdisapprove
Stronglydisapprove
Don’t know /No opinion Total N
Registered Voters 18% (360) 22% (437) 13% (257) 28% (569) 19% (375) 1998Biden Job Strongly Approve 36% (150) 34% (143) 13% (52) 5% (21) 12% (52) 418Biden Job Somewhat Approve 23% (109) 33% (161) 17% (80) 8% (41) 19% (91) 481Biden Job Somewhat Disapprove 16% (39) 25% (62) 17% (42) 21% (52) 22% (55) 250Biden Job Strongly Disapprove 7% (57) 8% (61) 10% (82) 57% (449) 18% (139) 788Favorable of Biden 29% (266) 33% (309) 15% (138) 7% (64) 16% (150) 927Unfavorable of Biden 9% (90) 12% (122) 11% (115) 49% (499) 19% (193) 1019Very Favorable of Biden 36% (173) 33% (157) 13% (60) 4% (20) 14% (67) 476Somewhat Favorable of Biden 21% (93) 34% (152) 17% (78) 10% (44) 19% (83) 451Somewhat Unfavorable of Biden 15% (30) 26% (54) 16% (34) 22% (46) 21% (43) 207Very Unfavorable of Biden 7% (59) 8% (68) 10% (81) 56% (453) 18% (150) 812#1 Issue: Economy 13% (98) 24% (185) 15% (112) 29% (225) 19% (148) 768#1 Issue: Security 12% (43) 10% (37) 12% (42) 51% (182) 16% (56) 360#1 Issue: Health Care 27% (61) 32% (75) 12% (27) 9% (21) 20% (47) 231#1 Issue: Medicare / Social Security 23% (53) 18% (41) 11% (26) 30% (67) 18% (40) 227#1 Issue: Women’s Issues 28% (35) 24% (30) 8% (10) 14% (18) 26% (32) 125#1 Issue: Education 21% (12) 32% (19) 18% (11) 6% (4) 23% (14) 59#1 Issue: Energy 30% (32) 28% (30) 11% (11) 16% (17) 15% (16) 107#1 Issue: Other 21% (26) 17% (21) 15% (18) 29% (35) 18% (21) 1222020 Vote: Joe Biden 28% (266) 31% (298) 15% (143) 8% (78) 17% (161) 9462020 Vote: Donald Trump 7% (61) 11% (99) 11% (99) 53% (459) 17% (146) 8642020 Vote: Didn’t Vote 18% (27) 24% (36) 8% (13) 14% (22) 36% (55) 1532018 House Vote: Democrat 31% (235) 31% (238) 13% (102) 9% (71) 16% (122) 7692018 House Vote: Republican 7% (46) 10% (73) 13% (94) 59% (413) 11% (75) 7022016 Vote: Hillary Clinton 31% (214) 30% (207) 15% (105) 6% (43) 17% (115) 6852016 Vote: Donald Trump 9% (69) 12% (93) 12% (97) 56% (447) 12% (96) 8022016 Vote: Other 20% (16) 18% (15) 12% (10) 37% (31) 13% (11) 842016 Vote: Didn’t Vote 14% (61) 28% (119) 10% (43) 11% (48) 36% (153) 423Voted in 2014: Yes 19% (257) 20% (272) 13% (179) 35% (465) 12% (163) 1335Voted in 2014: No 16% (103) 25% (165) 12% (79) 16% (104) 32% (211) 663
Continued on next page
Page 206
206
Morning ConsultTable POL14_1
Table POL14_1: Do you approve or disapprove of the following proposals to reform the United States Supreme Court?Expanding the number of justices on the court
DemographicStronglyapprove
Somewhatapprove
Somewhatdisapprove
Stronglydisapprove
Don’t know /No opinion Total N
Registered Voters 18% (360) 22% (437) 13% (257) 28% (569) 19% (375) 19984-Region: Northeast 17% (61) 25% (87) 13% (48) 28% (99) 17% (59) 3534-Region: Midwest 16% (69) 22% (98) 13% (59) 30% (134) 19% (85) 4444-Region: South 19% (145) 18% (138) 12% (90) 31% (228) 19% (145) 7464-Region: West 19% (85) 25% (115) 13% (61) 24% (108) 19% (86) 455Party: Democrat/Leans Democrat 29% (267) 33% (299) 13% (118) 7% (68) 18% (162) 914Party: Republican/Leans Republican 6% (49) 12% (97) 13% (105) 53% (425) 16% (132) 808Note: Row proportions may total to larger than one-hundred percent due to rounding. For more information visit MorningConsultIntelligence.com.
Page 207
National Tracking Poll #2110084, October, 2021
207
Table POL14_2
Table POL14_2: Do you approve or disapprove of the following proposals to reform the United States Supreme Court?Adding term limits for justices
DemographicStronglyapprove
Somewhatapprove
Somewhatdisapprove
Stronglydisapprove
Don’t know /No opinion Total N
Registered Voters 35% (701) 28% (554) 11% (214) 12% (245) 14% (284) 1998Gender: Male 33% (310) 27% (251) 12% (116) 18% (167) 10% (99) 942Gender: Female 37% (391) 29% (303) 9% (98) 7% (78) 18% (186) 1056Age: 18-34 34% (174) 27% (140) 9% (44) 7% (35) 24% (121) 514Age: 35-44 39% (121) 31% (96) 7% (22) 5% (17) 16% (51) 307Age: 45-64 33% (221) 29% (196) 14% (92) 14% (94) 11% (75) 679Age: 65+ 37% (185) 24% (122) 11% (54) 20% (99) 7% (37) 497GenZers: 1997-2012 28% (48) 23% (40) 11% (18) 8% (13) 30% (52) 170Millennials: 1981-1996 38% (210) 28% (155) 8% (42) 7% (36) 20% (108) 551GenXers: 1965-1980 34% (159) 32% (151) 12% (57) 8% (37) 14% (65) 469Baby Boomers: 1946-1964 36% (261) 27% (195) 12% (87) 18% (133) 8% (56) 732PID: Dem (no lean) 47% (363) 30% (230) 8% (60) 5% (42) 11% (82) 777PID: Ind (no lean) 32% (166) 25% (133) 9% (49) 12% (62) 22% (118) 528PID: Rep (no lean) 25% (172) 28% (192) 15% (105) 20% (141) 12% (85) 693PID/Gender: DemMen 45% (159) 30% (104) 9% (33) 8% (26) 8% (30) 352PID/Gender: DemWomen 48% (205) 30% (126) 6% (27) 4% (16) 12% (52) 425PID/Gender: Ind Men 30% (85) 27% (74) 9% (26) 16% (46) 18% (49) 280PID/Gender: Ind Women 33% (82) 24% (58) 9% (23) 7% (17) 28% (68) 248PID/Gender: Rep Men 22% (67) 23% (72) 18% (56) 31% (95) 6% (19) 310PID/Gender: Rep Women 27% (105) 31% (119) 13% (48) 12% (46) 17% (65) 384Ideo: Liberal (1-3) 50% (281) 30% (172) 7% (39) 4% (24) 9% (50) 566Ideo: Moderate (4) 37% (206) 27% (148) 13% (72) 11% (61) 13% (73) 560Ideo: Conservative (5-7) 25% (181) 28% (203) 14% (99) 22% (158) 12% (90) 730Educ: < College 34% (413) 27% (329) 10% (127) 10% (123) 18% (215) 1206Educ: Bachelors degree 38% (189) 27% (134) 12% (59) 16% (78) 8% (41) 501Educ: Post-grad 34% (99) 31% (91) 10% (28) 15% (45) 10% (28) 290Income: Under 50k 33% (290) 24% (208) 11% (99) 11% (98) 20% (177) 873Income: 50k-100k 38% (276) 28% (204) 10% (71) 14% (99) 11% (77) 728Income: 100k+ 34% (135) 36% (142) 11% (43) 12% (47) 8% (30) 398Ethnicity: White 34% (531) 28% (430) 11% (169) 14% (216) 13% (197) 1544Ethnicity: Hispanic 35% (77) 26% (59) 8% (19) 7% (16) 23% (52) 222
Continued on next page
Page 208
208
Morning ConsultTable POL14_2
Table POL14_2: Do you approve or disapprove of the following proposals to reform the United States Supreme Court?Adding term limits for justices
DemographicStronglyapprove
Somewhatapprove
Somewhatdisapprove
Stronglydisapprove
Don’t know /No opinion Total N
Registered Voters 35% (701) 28% (554) 11% (214) 12% (245) 14% (284) 1998Ethnicity: Black 36% (92) 30% (75) 11% (28) 5% (14) 18% (45) 253Ethnicity: Other 39% (78) 24% (49) 8% (17) 8% (15) 21% (42) 201All Christian 32% (329) 31% (327) 11% (114) 15% (160) 11% (111) 1041All Non-Christian 50% (53) 22% (23) 7% (7) 17% (19) 4% (4) 107Atheist 50% (39) 23% (18) 11% (8) 10% (8) 7% (5) 78Agnostic/Nothing in particular 36% (173) 21% (103) 11% (51) 8% (39) 24% (113) 480Something Else 37% (107) 28% (83) 11% (32) 7% (19) 17% (50) 293Religious Non-Protestant/Catholic 42% (55) 25% (32) 9% (12) 18% (23) 6% (7) 129Evangelical 31% (155) 32% (159) 11% (55) 13% (63) 13% (67) 499Non-Evangelical 34% (269) 30% (235) 11% (84) 14% (110) 12% (91) 790Community: Urban 41% (199) 27% (134) 12% (57) 6% (31) 14% (66) 487Community: Suburban 34% (354) 28% (288) 10% (101) 14% (145) 15% (153) 1041Community: Rural 32% (148) 28% (132) 12% (55) 15% (69) 14% (65) 469Employ: Private Sector 36% (247) 30% (202) 11% (74) 12% (84) 11% (77) 684Employ: Government 27% (30) 39% (44) 11% (13) 7% (8) 15% (17) 112Employ: Self-Employed 33% (60) 32% (58) 8% (14) 11% (21) 17% (31) 183Employ: Homemaker 36% (37) 27% (28) 10% (10) 3% (3) 24% (25) 104Employ: Student 20% (14) 33% (22) 16% (11) 5% (4) 26% (17) 67Employ: Retired 37% (197) 24% (127) 13% (71) 20% (107) 6% (31) 534Employ: Unemployed 35% (67) 24% (46) 6% (11) 4% (8) 31% (59) 191Employ: Other 40% (50) 22% (27) 8% (10) 9% (11) 21% (26) 124Military HH: Yes 36% (114) 23% (73) 13% (40) 17% (54) 11% (34) 315Military HH: No 35% (587) 29% (481) 10% (173) 11% (191) 15% (250) 1683RD/WT: Right Direction 44% (330) 30% (230) 10% (75) 4% (31) 12% (91) 757RD/WT: Wrong Track 30% (371) 26% (324) 11% (138) 17% (214) 16% (193) 1241Biden Job Approve 46% (412) 30% (269) 9% (79) 5% (45) 10% (94) 899Biden Job Disapprove 27% (279) 27% (276) 12% (129) 19% (199) 15% (155) 1039
Continued on next page
Page 209
National Tracking Poll #2110084, October, 2021
209
Table POL14_2
Table POL14_2: Do you approve or disapprove of the following proposals to reform the United States Supreme Court?Adding term limits for justices
DemographicStronglyapprove
Somewhatapprove
Somewhatdisapprove
Stronglydisapprove
Don’t know /No opinion Total N
Registered Voters 35% (701) 28% (554) 11% (214) 12% (245) 14% (284) 1998Biden Job Strongly Approve 51% (212) 31% (128) 7% (31) 4% (15) 8% (32) 418Biden Job Somewhat Approve 42% (200) 29% (140) 10% (48) 6% (30) 13% (63) 481Biden Job Somewhat Disapprove 28% (71) 35% (87) 12% (31) 10% (24) 15% (37) 250Biden Job Strongly Disapprove 26% (208) 24% (189) 12% (98) 22% (175) 15% (118) 788Favorable of Biden 46% (424) 29% (273) 9% (85) 5% (43) 11% (101) 927Unfavorable of Biden 27% (272) 26% (268) 12% (123) 20% (200) 15% (156) 1019Very Favorable of Biden 51% (242) 29% (140) 7% (35) 4% (18) 9% (41) 476Somewhat Favorable of Biden 41% (183) 30% (133) 11% (50) 5% (25) 13% (60) 451Somewhat Unfavorable of Biden 32% (65) 32% (66) 12% (24) 12% (25) 13% (26) 207Very Unfavorable of Biden 25% (206) 25% (202) 12% (99) 22% (175) 16% (129) 812#1 Issue: Economy 31% (238) 31% (240) 10% (76) 12% (94) 16% (120) 768#1 Issue: Security 31% (110) 23% (82) 13% (46) 21% (77) 13% (46) 360#1 Issue: Health Care 40% (92) 28% (64) 10% (24) 6% (13) 16% (37) 231#1 Issue: Medicare / Social Security 50% (114) 24% (55) 7% (15) 9% (20) 9% (21) 227#1 Issue: Women’s Issues 41% (51) 26% (32) 11% (14) 3% (4) 19% (24) 125#1 Issue: Education 25% (15) 27% (16) 13% (8) 11% (7) 23% (14) 59#1 Issue: Energy 45% (49) 30% (33) 9% (9) 8% (9) 7% (7) 107#1 Issue: Other 27% (33) 26% (32) 17% (21) 18% (22) 12% (15) 1222020 Vote: Joe Biden 45% (426) 29% (272) 10% (90) 5% (52) 11% (106) 9462020 Vote: Donald Trump 25% (215) 27% (231) 13% (108) 21% (181) 15% (129) 8642020 Vote: Didn’t Vote 32% (48) 27% (41) 9% (14) 5% (7) 27% (42) 1532018 House Vote: Democrat 48% (369) 30% (229) 8% (62) 5% (38) 9% (71) 7692018 House Vote: Republican 25% (178) 26% (180) 15% (106) 24% (165) 10% (72) 7022016 Vote: Hillary Clinton 49% (333) 30% (202) 9% (58) 4% (28) 9% (63) 6852016 Vote: Donald Trump 25% (204) 27% (220) 13% (104) 23% (181) 12% (93) 8022016 Vote: Other 38% (32) 19% (16) 17% (14) 16% (13) 10% (9) 842016 Vote: Didn’t Vote 31% (130) 27% (116) 8% (34) 5% (23) 28% (120) 423Voted in 2014: Yes 37% (487) 28% (373) 11% (153) 16% (208) 9% (114) 1335Voted in 2014: No 32% (214) 27% (181) 9% (60) 6% (37) 26% (170) 663
Continued on next page
Page 210
210
Morning ConsultTable POL14_2
Table POL14_2: Do you approve or disapprove of the following proposals to reform the United States Supreme Court?Adding term limits for justices
DemographicStronglyapprove
Somewhatapprove
Somewhatdisapprove
Stronglydisapprove
Don’t know /No opinion Total N
Registered Voters 35% (701) 28% (554) 11% (214) 12% (245) 14% (284) 19984-Region: Northeast 37% (132) 30% (106) 12% (41) 11% (37) 11% (37) 3534-Region: Midwest 38% (168) 28% (124) 7% (33) 14% (62) 13% (58) 4444-Region: South 34% (253) 27% (198) 11% (83) 13% (99) 15% (113) 7464-Region: West 33% (149) 28% (126) 13% (57) 10% (47) 17% (76) 455Party: Democrat/Leans Democrat 45% (413) 29% (269) 8% (76) 5% (44) 12% (112) 914Party: Republican/Leans Republican 25% (199) 28% (223) 15% (123) 19% (157) 13% (105) 808Note: Row proportions may total to larger than one-hundred percent due to rounding. For more information visit MorningConsultIntelligence.com.
Page 211
National Tracking Poll #2110084, October, 2021
211
Table POL14_3
Table POL14_3: Do you approve or disapprove of the following proposals to reform the United States Supreme Court?Binding justices to a code of ethics
DemographicStronglyapprove
Somewhatapprove
Somewhatdisapprove
Stronglydisapprove
Don’t know /No opinion Total N
Registered Voters 44% (889) 26% (515) 6% (113) 7% (134) 17% (347) 1998Gender: Male 43% (408) 28% (262) 7% (62) 9% (89) 13% (121) 942Gender: Female 45% (480) 24% (253) 5% (51) 4% (45) 21% (227) 1056Age: 18-34 32% (163) 33% (167) 8% (40) 5% (26) 23% (118) 514Age: 35-44 41% (125) 26% (79) 6% (17) 3% (10) 25% (76) 307Age: 45-64 48% (328) 23% (154) 6% (37) 8% (56) 15% (104) 679Age: 65+ 55% (273) 23% (115) 4% (18) 9% (43) 10% (49) 497GenZers: 1997-2012 24% (41) 29% (49) 12% (21) 7% (12) 27% (46) 170Millennials: 1981-1996 38% (210) 30% (167) 5% (28) 4% (21) 23% (127) 551GenXers: 1965-1980 44% (207) 26% (120) 4% (17) 7% (34) 19% (91) 469Baby Boomers: 1946-1964 54% (393) 22% (160) 6% (43) 8% (55) 11% (80) 732PID: Dem (no lean) 53% (411) 25% (191) 5% (35) 3% (27) 15% (113) 777PID: Ind (no lean) 40% (213) 28% (146) 5% (25) 5% (25) 22% (118) 528PID: Rep (no lean) 38% (265) 26% (177) 8% (53) 12% (82) 17% (116) 693PID/Gender: DemMen 54% (192) 27% (94) 4% (14) 4% (15) 11% (39) 352PID/Gender: DemWomen 52% (219) 23% (98) 5% (21) 3% (12) 18% (74) 425PID/Gender: Ind Men 40% (113) 29% (81) 7% (19) 6% (16) 18% (50) 280PID/Gender: Ind Women 40% (100) 26% (66) 2% (5) 4% (9) 27% (68) 248PID/Gender: Rep Men 33% (104) 28% (87) 9% (29) 19% (58) 10% (32) 310PID/Gender: Rep Women 42% (161) 24% (90) 6% (24) 6% (24) 22% (84) 384Ideo: Liberal (1-3) 59% (334) 24% (135) 5% (27) 1% (7) 11% (63) 566Ideo: Moderate (4) 39% (221) 31% (174) 7% (37) 6% (32) 17% (97) 560Ideo: Conservative (5-7) 41% (298) 26% (193) 6% (43) 12% (87) 15% (109) 730Educ: < College 42% (501) 24% (292) 5% (64) 7% (87) 22% (262) 1206Educ: Bachelors degree 48% (241) 27% (136) 6% (31) 6% (29) 13% (64) 501Educ: Post-grad 51% (147) 30% (87) 6% (18) 6% (18) 7% (21) 290Income: Under 50k 42% (369) 23% (204) 6% (52) 7% (57) 22% (191) 873Income: 50k-100k 49% (358) 26% (186) 4% (32) 7% (49) 14% (103) 728Income: 100k+ 41% (162) 31% (125) 7% (29) 7% (28) 14% (54) 398Ethnicity: White 46% (716) 26% (406) 5% (81) 7% (109) 15% (232) 1544Ethnicity: Hispanic 38% (85) 23% (51) 6% (13) 7% (15) 26% (58) 222
Continued on next page
Page 212
212
Morning ConsultTable POL14_3
Table POL14_3: Do you approve or disapprove of the following proposals to reform the United States Supreme Court?Binding justices to a code of ethics
DemographicStronglyapprove
Somewhatapprove
Somewhatdisapprove
Stronglydisapprove
Don’t know /No opinion Total N
Registered Voters 44% (889) 26% (515) 6% (113) 7% (134) 17% (347) 1998Ethnicity: Black 45% (113) 18% (45) 9% (24) 5% (12) 23% (59) 253Ethnicity: Other 30% (60) 32% (63) 4% (7) 7% (14) 28% (57) 201All Christian 44% (455) 29% (302) 6% (59) 7% (77) 14% (148) 1041All Non-Christian 56% (60) 27% (29) 6% (6) 10% (10) 2% (2) 107Atheist 48% (37) 32% (25) 9% (7) 6% (4) 5% (4) 78Agnostic/Nothing in particular 46% (219) 17% (82) 6% (29) 6% (28) 25% (121) 480Something Else 40% (117) 27% (78) 4% (11) 5% (15) 24% (72) 293Religious Non-Protestant/Catholic 55% (71) 27% (34) 5% (6) 9% (12) 4% (6) 129Evangelical 38% (191) 29% (143) 7% (36) 6% (32) 19% (97) 499Non-Evangelical 45% (359) 28% (221) 4% (34) 7% (59) 15% (118) 790Community: Urban 45% (219) 29% (140) 8% (41) 4% (20) 14% (68) 487Community: Suburban 44% (458) 26% (268) 4% (46) 7% (76) 18% (193) 1041Community: Rural 45% (212) 23% (107) 5% (26) 8% (38) 18% (86) 469Employ: Private Sector 43% (296) 29% (199) 7% (47) 6% (38) 15% (104) 684Employ: Government 40% (45) 35% (39) 8% (9) 3% (3) 14% (16) 112Employ: Self-Employed 40% (72) 26% (47) 9% (16) 9% (16) 17% (31) 183Employ: Homemaker 30% (31) 25% (26) 6% (6) 6% (7) 33% (34) 104Employ: Student 36% (24) 28% (19) 3% (2) 10% (7) 24% (16) 67Employ: Retired 55% (293) 22% (117) 4% (20) 9% (47) 11% (56) 534Employ: Unemployed 41% (78) 21% (39) 3% (7) 4% (8) 31% (59) 191Employ: Other 40% (50) 23% (29) 5% (6) 7% (9) 25% (31) 124Military HH: Yes 47% (148) 26% (83) 4% (13) 8% (27) 14% (44) 315Military HH: No 44% (740) 26% (432) 6% (100) 6% (108) 18% (303) 1683RD/WT: Right Direction 52% (396) 26% (199) 6% (44) 2% (18) 13% (100) 757RD/WT: Wrong Track 40% (493) 25% (316) 6% (68) 9% (116) 20% (247) 1241Biden Job Approve 54% (485) 27% (243) 5% (41) 3% (25) 12% (105) 899Biden Job Disapprove 38% (393) 25% (263) 7% (71) 10% (107) 20% (204) 1039
Continued on next page
Page 213
National Tracking Poll #2110084, October, 2021
213
Table POL14_3
Table POL14_3: Do you approve or disapprove of the following proposals to reform the United States Supreme Court?Binding justices to a code of ethics
DemographicStronglyapprove
Somewhatapprove
Somewhatdisapprove
Stronglydisapprove
Don’t know /No opinion Total N
Registered Voters 44% (889) 26% (515) 6% (113) 7% (134) 17% (347) 1998Biden Job Strongly Approve 60% (251) 23% (98) 5% (21) 2% (7) 10% (42) 418Biden Job Somewhat Approve 49% (234) 30% (145) 4% (20) 4% (18) 13% (63) 481Biden Job Somewhat Disapprove 38% (95) 31% (78) 8% (20) 2% (6) 21% (51) 250Biden Job Strongly Disapprove 38% (298) 23% (185) 6% (51) 13% (101) 19% (153) 788Favorable of Biden 53% (495) 26% (246) 4% (40) 3% (23) 13% (123) 927Unfavorable of Biden 38% (385) 25% (258) 7% (69) 11% (108) 19% (198) 1019Very Favorable of Biden 60% (286) 23% (110) 4% (20) 2% (10) 10% (49) 476Somewhat Favorable of Biden 46% (209) 30% (135) 4% (20) 3% (13) 16% (74) 451Somewhat Unfavorable of Biden 42% (87) 30% (62) 10% (20) 2% (4) 16% (33) 207Very Unfavorable of Biden 37% (298) 24% (196) 6% (49) 13% (103) 20% (165) 812#1 Issue: Economy 40% (309) 29% (220) 5% (41) 6% (42) 20% (155) 768#1 Issue: Security 42% (152) 20% (72) 6% (23) 14% (51) 17% (62) 360#1 Issue: Health Care 45% (103) 31% (72) 6% (14) 2% (5) 16% (38) 231#1 Issue: Medicare / Social Security 57% (128) 24% (53) 5% (11) 5% (11) 10% (23) 227#1 Issue: Women’s Issues 49% (62) 22% (27) 3% (4) 6% (8) 20% (25) 125#1 Issue: Education 51% (30) 18% (11) 12% (7) 3% (2) 16% (10) 59#1 Issue: Energy 43% (46) 29% (31) 7% (8) 6% (6) 15% (16) 107#1 Issue: Other 48% (59) 24% (29) 4% (5) 8% (10) 16% (20) 1222020 Vote: Joe Biden 53% (505) 25% (241) 4% (43) 3% (27) 14% (130) 9462020 Vote: Donald Trump 37% (317) 27% (231) 7% (57) 11% (98) 19% (160) 8642020 Vote: Didn’t Vote 35% (54) 22% (33) 7% (11) 6% (9) 30% (46) 1532018 House Vote: Democrat 56% (433) 24% (186) 4% (34) 3% (25) 12% (92) 7692018 House Vote: Republican 39% (277) 27% (193) 7% (48) 12% (83) 14% (102) 7022016 Vote: Hillary Clinton 57% (393) 24% (161) 4% (31) 2% (15) 12% (85) 6852016 Vote: Donald Trump 41% (330) 26% (207) 7% (58) 12% (93) 14% (114) 8022016 Vote: Other 41% (34) 31% (26) 2% (2) 9% (7) 17% (15) 842016 Vote: Didn’t Vote 31% (131) 28% (120) 5% (22) 4% (17) 31% (132) 423Voted in 2014: Yes 49% (654) 24% (327) 6% (83) 7% (100) 13% (171) 1335Voted in 2014: No 35% (235) 28% (188) 4% (30) 5% (35) 27% (176) 663
Continued on next page
Page 214
214
Morning ConsultTable POL14_3
Table POL14_3: Do you approve or disapprove of the following proposals to reform the United States Supreme Court?Binding justices to a code of ethics
DemographicStronglyapprove
Somewhatapprove
Somewhatdisapprove
Stronglydisapprove
Don’t know /No opinion Total N
Registered Voters 44% (889) 26% (515) 6% (113) 7% (134) 17% (347) 19984-Region: Northeast 47% (167) 28% (100) 7% (25) 3% (9) 14% (51) 3534-Region: Midwest 46% (206) 23% (103) 7% (29) 9% (38) 15% (68) 4444-Region: South 45% (333) 23% (174) 6% (42) 6% (48) 20% (149) 7464-Region: West 40% (184) 30% (138) 3% (16) 8% (39) 17% (79) 455Party: Democrat/Leans Democrat 53% (485) 25% (228) 4% (40) 3% (27) 15% (134) 914Party: Republican/Leans Republican 38% (306) 27% (220) 7% (57) 11% (91) 17% (135) 808Note: Row proportions may total to larger than one-hundred percent due to rounding. For more information visit MorningConsultIntelligence.com.
Page 215
National Tracking Poll #2110084, October, 2021
215
Table POL14_4
Table POL14_4: Do you approve or disapprove of the following proposals to reform the United States Supreme Court?Adopting transparency measures, such as live-streaming of oral arguments and decisions
DemographicStronglyapprove
Somewhatapprove
Somewhatdisapprove
Stronglydisapprove
Don’t know /No opinion Total N
Registered Voters 30% (593) 36% (722) 10% (200) 7% (141) 17% (342) 1998Gender: Male 31% (290) 39% (364) 10% (92) 9% (85) 12% (110) 942Gender: Female 29% (303) 34% (357) 10% (108) 5% (56) 22% (232) 1056Age: 18-34 31% (161) 33% (168) 9% (46) 6% (32) 21% (107) 514Age: 35-44 33% (100) 34% (105) 8% (23) 3% (11) 22% (68) 307Age: 45-64 29% (197) 37% (253) 13% (85) 7% (45) 15% (99) 679Age: 65+ 27% (135) 39% (195) 9% (46) 11% (54) 14% (67) 497GenZers: 1997-2012 22% (38) 33% (56) 9% (15) 10% (17) 26% (44) 170Millennials: 1981-1996 35% (194) 33% (185) 7% (39) 4% (24) 20% (110) 551GenXers: 1965-1980 27% (129) 37% (174) 11% (54) 5% (22) 19% (91) 469Baby Boomers: 1946-1964 29% (213) 37% (274) 12% (91) 9% (65) 12% (89) 732PID: Dem (no lean) 39% (306) 35% (276) 7% (58) 3% (27) 14% (110) 777PID: Ind (no lean) 26% (136) 38% (199) 11% (56) 6% (34) 19% (103) 528PID: Rep (no lean) 22% (151) 36% (247) 12% (86) 12% (80) 19% (129) 693PID/Gender: DemMen 42% (149) 35% (124) 7% (23) 4% (16) 12% (41) 352PID/Gender: DemWomen 37% (157) 36% (152) 8% (35) 3% (11) 16% (69) 425PID/Gender: Ind Men 28% (80) 43% (119) 9% (25) 8% (22) 12% (34) 280PID/Gender: Ind Women 23% (56) 32% (79) 13% (31) 5% (12) 28% (69) 248PID/Gender: Rep Men 20% (62) 39% (121) 14% (44) 15% (47) 11% (35) 310PID/Gender: Rep Women 23% (89) 33% (126) 11% (42) 9% (33) 24% (94) 384Ideo: Liberal (1-3) 44% (251) 33% (188) 8% (48) 2% (12) 12% (68) 566Ideo: Moderate (4) 26% (144) 43% (240) 12% (66) 7% (37) 13% (73) 560Ideo: Conservative (5-7) 23% (170) 35% (259) 12% (84) 12% (89) 17% (128) 730Educ: < College 26% (310) 34% (416) 11% (128) 7% (83) 22% (269) 1206Educ: Bachelors degree 34% (171) 38% (189) 9% (45) 9% (47) 10% (49) 501Educ: Post-grad 39% (112) 40% (116) 9% (27) 4% (11) 8% (24) 290Income: Under 50k 28% (243) 32% (282) 9% (82) 7% (59) 24% (207) 873Income: 50k-100k 31% (223) 37% (273) 11% (77) 8% (55) 14% (100) 728Income: 100k+ 32% (127) 42% (167) 10% (41) 7% (27) 9% (35) 398Ethnicity: White 30% (458) 36% (554) 11% (171) 7% (108) 16% (253) 1544Ethnicity: Hispanic 33% (73) 30% (67) 10% (22) 4% (10) 23% (51) 222
Continued on next page
Page 216
216
Morning ConsultTable POL14_4
Table POL14_4: Do you approve or disapprove of the following proposals to reform the United States Supreme Court?Adopting transparency measures, such as live-streaming of oral arguments and decisions
DemographicStronglyapprove
Somewhatapprove
Somewhatdisapprove
Stronglydisapprove
Don’t know /No opinion Total N
Registered Voters 30% (593) 36% (722) 10% (200) 7% (141) 17% (342) 1998Ethnicity: Black 28% (72) 40% (101) 5% (14) 7% (17) 20% (51) 253Ethnicity: Other 32% (64) 33% (67) 8% (15) 8% (17) 19% (39) 201All Christian 28% (293) 39% (402) 11% (117) 8% (86) 14% (143) 1041All Non-Christian 47% (50) 31% (33) 7% (8) 10% (11) 4% (4) 107Atheist 41% (32) 27% (21) 15% (11) 10% (8) 8% (6) 78Agnostic/Nothing in particular 29% (139) 34% (165) 7% (36) 5% (23) 25% (118) 480Something Else 27% (79) 34% (101) 10% (28) 5% (14) 24% (71) 293Religious Non-Protestant/Catholic 42% (55) 36% (47) 7% (9) 9% (11) 5% (7) 129Evangelical 32% (157) 32% (161) 12% (58) 6% (28) 19% (94) 499Non-Evangelical 26% (202) 40% (317) 11% (84) 9% (71) 15% (116) 790Community: Urban 37% (181) 34% (166) 10% (49) 5% (23) 14% (68) 487Community: Suburban 29% (300) 40% (412) 9% (91) 6% (65) 17% (174) 1041Community: Rural 24% (112) 31% (143) 13% (60) 11% (53) 21% (100) 469Employ: Private Sector 33% (228) 36% (247) 12% (82) 6% (38) 13% (88) 684Employ: Government 25% (28) 43% (48) 12% (13) 4% (5) 17% (19) 112Employ: Self-Employed 28% (52) 45% (82) 4% (7) 8% (15) 15% (27) 183Employ: Homemaker 21% (22) 34% (35) 11% (11) 4% (4) 30% (31) 104Employ: Student 27% (18) 30% (20) 12% (8) 9% (6) 21% (14) 67Employ: Retired 30% (161) 37% (197) 10% (52) 10% (53) 13% (69) 534Employ: Unemployed 28% (54) 29% (55) 6% (12) 5% (9) 32% (61) 191Employ: Other 25% (31) 30% (37) 12% (14) 8% (10) 25% (31) 124Military HH: Yes 33% (104) 36% (113) 10% (30) 10% (32) 11% (36) 315Military HH: No 29% (489) 36% (608) 10% (170) 7% (110) 18% (306) 1683RD/WT: Right Direction 39% (294) 34% (258) 10% (75) 3% (25) 14% (106) 757RD/WT: Wrong Track 24% (299) 37% (463) 10% (126) 9% (116) 19% (236) 1241Biden Job Approve 38% (342) 38% (340) 9% (80) 3% (31) 12% (107) 899Biden Job Disapprove 23% (244) 35% (367) 11% (119) 10% (107) 19% (201) 1039
Continued on next page
Page 217
National Tracking Poll #2110084, October, 2021
217
Table POL14_4
Table POL14_4: Do you approve or disapprove of the following proposals to reform the United States Supreme Court?Adopting transparency measures, such as live-streaming of oral arguments and decisions
DemographicStronglyapprove
Somewhatapprove
Somewhatdisapprove
Stronglydisapprove
Don’t know /No opinion Total N
Registered Voters 30% (593) 36% (722) 10% (200) 7% (141) 17% (342) 1998Biden Job Strongly Approve 44% (184) 33% (136) 10% (43) 2% (9) 11% (46) 418Biden Job Somewhat Approve 33% (158) 42% (204) 8% (37) 5% (22) 13% (61) 481Biden Job Somewhat Disapprove 24% (59) 43% (107) 13% (33) 4% (11) 16% (40) 250Biden Job Strongly Disapprove 23% (185) 33% (260) 11% (86) 12% (97) 20% (161) 788Favorable of Biden 38% (354) 37% (338) 9% (83) 3% (29) 13% (122) 927Unfavorable of Biden 23% (233) 36% (365) 11% (116) 11% (108) 19% (196) 1019Very Favorable of Biden 44% (211) 32% (154) 8% (40) 4% (18) 11% (52) 476Somewhat Favorable of Biden 32% (143) 41% (184) 10% (43) 2% (11) 15% (70) 451Somewhat Unfavorable of Biden 22% (47) 46% (96) 14% (28) 4% (8) 14% (28) 207Very Unfavorable of Biden 23% (186) 33% (269) 11% (88) 12% (100) 21% (168) 812#1 Issue: Economy 27% (205) 40% (304) 11% (82) 5% (36) 18% (141) 768#1 Issue: Security 25% (90) 30% (109) 11% (39) 16% (56) 18% (66) 360#1 Issue: Health Care 37% (86) 33% (76) 9% (21) 5% (11) 16% (37) 231#1 Issue: Medicare / Social Security 36% (81) 34% (77) 12% (27) 4% (10) 14% (32) 227#1 Issue: Women’s Issues 29% (36) 36% (45) 6% (8) 7% (9) 21% (26) 125#1 Issue: Education 20% (12) 51% (30) 13% (7) 1% (1) 16% (9) 59#1 Issue: Energy 38% (41) 40% (43) 4% (5) 9% (10) 8% (8) 107#1 Issue: Other 35% (43) 31% (38) 8% (10) 7% (9) 18% (22) 1222020 Vote: Joe Biden 37% (349) 38% (361) 9% (83) 3% (26) 14% (128) 9462020 Vote: Donald Trump 23% (198) 36% (307) 12% (104) 11% (98) 18% (157) 8642020 Vote: Didn’t Vote 24% (37) 27% (42) 8% (13) 10% (15) 31% (47) 1532018 House Vote: Democrat 38% (291) 39% (299) 9% (68) 3% (19) 12% (91) 7692018 House Vote: Republican 22% (157) 38% (264) 13% (93) 12% (82) 15% (106) 7022016 Vote: Hillary Clinton 39% (265) 38% (258) 8% (55) 2% (15) 13% (92) 6852016 Vote: Donald Trump 24% (196) 36% (291) 14% (111) 12% (93) 14% (111) 8022016 Vote: Other 24% (20) 45% (38) 8% (7) 5% (5) 18% (15) 842016 Vote: Didn’t Vote 26% (111) 31% (132) 7% (28) 7% (28) 29% (124) 423Voted in 2014: Yes 32% (421) 37% (496) 11% (143) 8% (102) 13% (174) 1335Voted in 2014: No 26% (172) 34% (226) 9% (58) 6% (39) 25% (168) 663
Continued on next page
Page 218
218
Morning ConsultTable POL14_4
Table POL14_4: Do you approve or disapprove of the following proposals to reform the United States Supreme Court?Adopting transparency measures, such as live-streaming of oral arguments and decisions
DemographicStronglyapprove
Somewhatapprove
Somewhatdisapprove
Stronglydisapprove
Don’t know /No opinion Total N
Registered Voters 30% (593) 36% (722) 10% (200) 7% (141) 17% (342) 19984-Region: Northeast 32% (115) 37% (131) 13% (45) 4% (15) 13% (47) 3534-Region: Midwest 28% (126) 35% (156) 8% (37) 8% (36) 20% (90) 4444-Region: South 29% (218) 35% (261) 11% (80) 7% (52) 18% (134) 7464-Region: West 30% (135) 38% (173) 8% (38) 9% (39) 16% (71) 455Party: Democrat/Leans Democrat 38% (350) 37% (335) 8% (73) 3% (27) 14% (128) 914Party: Republican/Leans Republican 21% (166) 38% (303) 13% (105) 11% (87) 18% (146) 808Note: Row proportions may total to larger than one-hundred percent due to rounding. For more information visit MorningConsultIntelligence.com.
Page 219
National Tracking Poll #2110084, October, 2021
219
Table POL14_5
Table POL14_5: Do you approve or disapprove of the following proposals to reform the United States Supreme Court?Balancing the court with equal numbers of Democrats, Republicans, and Independents
DemographicStronglyapprove
Somewhatapprove
Somewhatdisapprove
Stronglydisapprove
Don’t know /No opinion Total N
Registered Voters 30% (596) 26% (514) 10% (192) 21% (418) 14% (279) 1998Gender: Male 27% (250) 25% (234) 9% (86) 28% (263) 12% (109) 942Gender: Female 33% (345) 26% (280) 10% (106) 15% (155) 16% (169) 1056Age: 18-34 34% (177) 28% (142) 10% (54) 11% (54) 17% (87) 514Age: 35-44 37% (113) 31% (97) 7% (21) 9% (27) 16% (49) 307Age: 45-64 27% (185) 25% (173) 10% (65) 23% (159) 14% (98) 679Age: 65+ 24% (121) 21% (102) 10% (52) 36% (178) 9% (44) 497GenZers: 1997-2012 36% (60) 24% (42) 13% (22) 10% (17) 17% (29) 170Millennials: 1981-1996 36% (198) 29% (162) 8% (44) 11% (58) 16% (89) 551GenXers: 1965-1980 29% (134) 29% (138) 9% (41) 17% (79) 16% (76) 469Baby Boomers: 1946-1964 26% (187) 22% (163) 11% (82) 30% (220) 11% (79) 732PID: Dem (no lean) 42% (326) 31% (244) 8% (64) 7% (56) 11% (87) 777PID: Ind (no lean) 27% (144) 22% (115) 8% (42) 24% (126) 19% (101) 528PID: Rep (no lean) 18% (126) 22% (155) 12% (85) 34% (236) 13% (91) 693PID/Gender: DemMen 42% (147) 31% (110) 7% (25) 10% (34) 10% (36) 352PID/Gender: DemWomen 42% (179) 32% (134) 9% (39) 5% (22) 12% (51) 425PID/Gender: Ind Men 21% (58) 23% (63) 9% (26) 31% (88) 16% (45) 280PID/Gender: Ind Women 34% (85) 21% (52) 7% (16) 15% (38) 23% (56) 248PID/Gender: Rep Men 14% (44) 20% (61) 11% (34) 45% (141) 9% (29) 310PID/Gender: Rep Women 21% (81) 24% (94) 13% (51) 25% (95) 16% (62) 384Ideo: Liberal (1-3) 45% (252) 29% (162) 9% (49) 7% (39) 11% (64) 566Ideo: Moderate (4) 31% (175) 34% (188) 10% (58) 14% (78) 11% (61) 560Ideo: Conservative (5-7) 18% (129) 19% (138) 11% (78) 40% (293) 13% (92) 730Educ: < College 30% (368) 25% (302) 9% (107) 18% (221) 17% (208) 1206Educ: Bachelors degree 29% (144) 27% (137) 10% (51) 25% (128) 8% (41) 501Educ: Post-grad 29% (84) 26% (75) 12% (33) 24% (69) 10% (29) 290Income: Under 50k 29% (257) 25% (222) 9% (81) 18% (155) 18% (158) 873Income: 50k-100k 32% (233) 23% (171) 9% (67) 24% (173) 12% (84) 728Income: 100k+ 27% (106) 30% (121) 11% (44) 22% (89) 9% (37) 398Ethnicity: White 27% (410) 25% (392) 10% (162) 24% (367) 14% (214) 1544Ethnicity: Hispanic 34% (75) 27% (59) 10% (23) 16% (36) 13% (30) 222
Continued on next page
Page 220
220
Morning ConsultTable POL14_5
Table POL14_5: Do you approve or disapprove of the following proposals to reform the United States Supreme Court?Balancing the court with equal numbers of Democrats, Republicans, and Independents
DemographicStronglyapprove
Somewhatapprove
Somewhatdisapprove
Stronglydisapprove
Don’t know /No opinion Total N
Registered Voters 30% (596) 26% (514) 10% (192) 21% (418) 14% (279) 1998Ethnicity: Black 45% (115) 28% (71) 4% (11) 7% (17) 16% (40) 253Ethnicity: Other 35% (71) 26% (52) 9% (19) 17% (34) 13% (25) 201All Christian 25% (261) 27% (278) 9% (97) 28% (287) 11% (119) 1041All Non-Christian 34% (37) 30% (31) 9% (10) 16% (17) 10% (11) 107Atheist 45% (35) 20% (15) 16% (12) 17% (14) 2% (2) 78Agnostic/Nothing in particular 32% (154) 24% (115) 9% (44) 15% (73) 20% (94) 480Something Else 37% (110) 25% (74) 10% (29) 9% (27) 18% (53) 293Religious Non-Protestant/Catholic 30% (38) 31% (40) 10% (13) 16% (21) 13% (17) 129Evangelical 29% (142) 24% (118) 10% (49) 24% (118) 14% (72) 499Non-Evangelical 28% (221) 27% (213) 9% (71) 24% (190) 12% (94) 790Community: Urban 37% (178) 29% (139) 8% (38) 14% (70) 13% (62) 487Community: Suburban 31% (319) 24% (253) 9% (97) 22% (232) 14% (141) 1041Community: Rural 21% (99) 26% (122) 12% (57) 25% (116) 16% (75) 469Employ: Private Sector 29% (197) 31% (215) 9% (62) 19% (130) 12% (80) 684Employ: Government 35% (39) 26% (29) 16% (19) 13% (15) 9% (10) 112Employ: Self-Employed 34% (62) 23% (43) 10% (19) 18% (34) 14% (26) 183Employ: Homemaker 25% (26) 28% (29) 10% (10) 15% (16) 22% (22) 104Employ: Student 34% (23) 20% (14) 17% (11) 4% (3) 25% (17) 67Employ: Retired 26% (139) 20% (107) 10% (56) 34% (180) 10% (53) 534Employ: Unemployed 33% (64) 22% (41) 5% (10) 14% (26) 26% (49) 191Employ: Other 38% (46) 29% (36) 4% (6) 12% (14) 17% (21) 124Military HH: Yes 30% (94) 22% (68) 5% (16) 30% (94) 14% (43) 315Military HH: No 30% (502) 26% (446) 10% (176) 19% (324) 14% (235) 1683RD/WT: Right Direction 41% (309) 31% (238) 10% (76) 7% (51) 11% (84) 757RD/WT: Wrong Track 23% (286) 22% (276) 9% (116) 30% (367) 16% (195) 1241Biden Job Approve 43% (383) 31% (282) 9% (83) 7% (63) 10% (88) 899Biden Job Disapprove 19% (196) 22% (225) 10% (107) 34% (352) 15% (159) 1039
Continued on next page
Page 221
National Tracking Poll #2110084, October, 2021
221
Table POL14_5
Table POL14_5: Do you approve or disapprove of the following proposals to reform the United States Supreme Court?Balancing the court with equal numbers of Democrats, Republicans, and Independents
DemographicStronglyapprove
Somewhatapprove
Somewhatdisapprove
Stronglydisapprove
Don’t know /No opinion Total N
Registered Voters 30% (596) 26% (514) 10% (192) 21% (418) 14% (279) 1998Biden Job Strongly Approve 49% (206) 29% (120) 8% (33) 5% (21) 9% (39) 418Biden Job Somewhat Approve 37% (178) 34% (162) 10% (50) 9% (43) 10% (49) 481Biden Job Somewhat Disapprove 28% (69) 33% (83) 12% (29) 12% (30) 16% (40) 250Biden Job Strongly Disapprove 16% (127) 18% (142) 10% (78) 41% (322) 15% (119) 788Favorable of Biden 43% (398) 31% (286) 9% (86) 7% (63) 10% (95) 927Unfavorable of Biden 19% (190) 21% (216) 10% (105) 35% (352) 15% (156) 1019Very Favorable of Biden 50% (236) 28% (134) 8% (40) 5% (23) 9% (43) 476Somewhat Favorable of Biden 36% (162) 34% (152) 10% (46) 9% (40) 11% (51) 451Somewhat Unfavorable of Biden 27% (57) 31% (64) 13% (26) 13% (26) 16% (34) 207Very Unfavorable of Biden 16% (133) 19% (152) 10% (78) 40% (326) 15% (122) 812#1 Issue: Economy 25% (194) 30% (228) 9% (68) 21% (160) 15% (118) 768#1 Issue: Security 28% (100) 13% (46) 10% (35) 40% (142) 10% (37) 360#1 Issue: Health Care 34% (79) 30% (69) 11% (26) 8% (18) 17% (39) 231#1 Issue: Medicare / Social Security 36% (81) 26% (59) 9% (21) 14% (31) 15% (35) 227#1 Issue: Women’s Issues 41% (51) 25% (31) 11% (14) 13% (16) 10% (13) 125#1 Issue: Education 33% (20) 23% (13) 17% (10) 15% (9) 13% (8) 59#1 Issue: Energy 36% (39) 36% (38) 6% (6) 15% (16) 7% (8) 107#1 Issue: Other 27% (32) 23% (29) 10% (12) 22% (27) 18% (22) 1222020 Vote: Joe Biden 42% (396) 31% (290) 9% (87) 8% (73) 11% (100) 9462020 Vote: Donald Trump 17% (148) 21% (179) 10% (91) 38% (328) 14% (118) 8642020 Vote: Didn’t Vote 25% (38) 26% (40) 7% (11) 7% (11) 34% (53) 1532018 House Vote: Democrat 42% (325) 30% (228) 8% (63) 10% (75) 10% (78) 7692018 House Vote: Republican 16% (114) 20% (141) 14% (95) 39% (275) 11% (76) 7022016 Vote: Hillary Clinton 43% (291) 30% (205) 8% (55) 8% (54) 12% (79) 6852016 Vote: Donald Trump 17% (140) 20% (161) 12% (94) 40% (318) 11% (89) 8022016 Vote: Other 27% (22) 19% (16) 10% (8) 29% (24) 16% (13) 842016 Vote: Didn’t Vote 33% (139) 31% (132) 8% (33) 5% (21) 23% (98) 423Voted in 2014: Yes 29% (391) 24% (324) 10% (138) 26% (350) 10% (132) 1335Voted in 2014: No 31% (204) 29% (190) 8% (54) 10% (68) 22% (147) 663
Continued on next page
Page 222
222
Morning ConsultTable POL14_5
Table POL14_5: Do you approve or disapprove of the following proposals to reform the United States Supreme Court?Balancing the court with equal numbers of Democrats, Republicans, and Independents
DemographicStronglyapprove
Somewhatapprove
Somewhatdisapprove
Stronglydisapprove
Don’t know /No opinion Total N
Registered Voters 30% (596) 26% (514) 10% (192) 21% (418) 14% (279) 19984-Region: Northeast 29% (102) 29% (103) 11% (37) 20% (69) 12% (42) 3534-Region: Midwest 33% (147) 25% (113) 9% (40) 20% (90) 12% (55) 4444-Region: South 27% (198) 24% (181) 10% (71) 21% (160) 18% (135) 7464-Region: West 33% (149) 26% (117) 10% (44) 22% (99) 10% (46) 455Party: Democrat/Leans Democrat 41% (379) 31% (282) 8% (76) 7% (65) 12% (111) 914Party: Republican/Leans Republican 18% (145) 22% (175) 12% (94) 36% (290) 13% (105) 808Note: Row proportions may total to larger than one-hundred percent due to rounding. For more information visit MorningConsultIntelligence.com.
Page 223
National Tracking Poll #2110084, October, 2021
223
Table POL14_6
Table POL14_6: Do you approve or disapprove of the following proposals to reform the United States Supreme Court?Placing an age cap on justices
DemographicStronglyapprove
Somewhatapprove
Somewhatdisapprove
Stronglydisapprove
Don’t know /No opinion Total N
Registered Voters 30% (591) 29% (580) 13% (269) 14% (283) 14% (275) 1998Gender: Male 27% (254) 31% (294) 15% (137) 18% (171) 9% (85) 942Gender: Female 32% (337) 27% (285) 12% (132) 11% (113) 18% (190) 1056Age: 18-34 33% (171) 27% (140) 10% (53) 8% (42) 21% (108) 514Age: 35-44 29% (89) 29% (90) 14% (43) 9% (29) 18% (57) 307Age: 45-64 26% (174) 30% (204) 15% (104) 16% (110) 13% (86) 679Age: 65+ 32% (157) 29% (146) 14% (69) 21% (102) 5% (24) 497GenZers: 1997-2012 34% (57) 21% (36) 11% (19) 8% (14) 26% (45) 170Millennials: 1981-1996 32% (178) 30% (168) 11% (60) 9% (51) 17% (95) 551GenXers: 1965-1980 23% (109) 32% (149) 16% (74) 11% (53) 18% (85) 469Baby Boomers: 1946-1964 31% (228) 29% (214) 14% (102) 19% (141) 6% (46) 732PID: Dem (no lean) 38% (294) 30% (236) 11% (87) 8% (63) 13% (98) 777PID: Ind (no lean) 28% (146) 26% (137) 15% (78) 14% (72) 18% (95) 528PID: Rep (no lean) 22% (151) 30% (207) 15% (104) 21% (149) 12% (82) 693PID/Gender: DemMen 36% (126) 34% (121) 11% (38) 10% (35) 9% (32) 352PID/Gender: DemWomen 40% (168) 27% (115) 11% (48) 6% (27) 15% (66) 425PID/Gender: Ind Men 25% (69) 31% (86) 15% (43) 17% (47) 13% (35) 280PID/Gender: Ind Women 31% (77) 21% (51) 14% (35) 10% (25) 24% (60) 248PID/Gender: Rep Men 19% (59) 28% (87) 18% (56) 29% (89) 6% (18) 310PID/Gender: Rep Women 24% (92) 31% (119) 13% (48) 16% (60) 17% (64) 384Ideo: Liberal (1-3) 39% (222) 31% (177) 10% (59) 9% (49) 10% (58) 566Ideo: Moderate (4) 30% (166) 31% (175) 15% (86) 12% (65) 12% (68) 560Ideo: Conservative (5-7) 22% (158) 29% (208) 16% (114) 23% (168) 11% (82) 730Educ: < College 31% (370) 27% (327) 14% (163) 11% (137) 17% (209) 1206Educ: Bachelors degree 30% (148) 32% (158) 13% (63) 19% (93) 8% (39) 501Educ: Post-grad 25% (73) 32% (94) 15% (43) 18% (54) 9% (26) 290Income: Under 50k 29% (257) 24% (206) 15% (129) 14% (118) 19% (163) 873Income: 50k-100k 32% (232) 30% (221) 12% (88) 15% (109) 11% (79) 728Income: 100k+ 26% (103) 38% (153) 13% (52) 14% (57) 8% (33) 398Ethnicity: White 28% (440) 30% (459) 14% (223) 15% (239) 12% (184) 1544Ethnicity: Hispanic 37% (81) 23% (50) 11% (25) 12% (27) 17% (39) 222
Continued on next page
Page 224
224
Morning ConsultTable POL14_6
Table POL14_6: Do you approve or disapprove of the following proposals to reform the United States Supreme Court?Placing an age cap on justices
DemographicStronglyapprove
Somewhatapprove
Somewhatdisapprove
Stronglydisapprove
Don’t know /No opinion Total N
Registered Voters 30% (591) 29% (580) 13% (269) 14% (283) 14% (275) 1998Ethnicity: Black 35% (89) 27% (69) 11% (28) 9% (22) 17% (44) 253Ethnicity: Other 31% (62) 26% (51) 9% (18) 11% (23) 23% (47) 201All Christian 28% (289) 31% (319) 14% (146) 17% (177) 11% (111) 1041All Non-Christian 36% (38) 28% (30) 14% (15) 15% (16) 7% (7) 107Atheist 36% (28) 33% (25) 14% (11) 11% (8) 6% (5) 78Agnostic/Nothing in particular 33% (158) 24% (117) 13% (61) 11% (52) 19% (92) 480Something Else 27% (78) 30% (88) 12% (36) 10% (30) 21% (60) 293Religious Non-Protestant/Catholic 31% (40) 30% (39) 14% (18) 16% (20) 9% (12) 129Evangelical 26% (131) 31% (157) 15% (73) 15% (75) 13% (63) 499Non-Evangelical 29% (229) 29% (227) 13% (105) 16% (126) 13% (103) 790Community: Urban 34% (166) 34% (163) 12% (58) 9% (46) 11% (54) 487Community: Suburban 28% (292) 28% (292) 14% (149) 15% (158) 14% (150) 1041Community: Rural 28% (133) 26% (124) 13% (62) 17% (79) 15% (71) 469Employ: Private Sector 28% (194) 33% (224) 13% (90) 14% (98) 11% (78) 684Employ: Government 26% (29) 40% (45) 11% (12) 11% (12) 12% (13) 112Employ: Self-Employed 26% (47) 33% (60) 16% (28) 12% (22) 14% (25) 183Employ: Homemaker 24% (24) 27% (28) 10% (10) 6% (7) 33% (34) 104Employ: Student 28% (19) 25% (17) 6% (4) 5% (3) 36% (24) 67Employ: Retired 33% (174) 26% (141) 16% (85) 20% (105) 5% (29) 534Employ: Unemployed 30% (57) 22% (43) 14% (28) 12% (23) 21% (40) 191Employ: Other 37% (45) 18% (22) 9% (12) 11% (14) 25% (31) 124Military HH: Yes 29% (91) 31% (97) 13% (42) 16% (50) 11% (34) 315Military HH: No 30% (500) 29% (482) 13% (227) 14% (233) 14% (241) 1683RD/WT: Right Direction 35% (268) 33% (253) 12% (91) 7% (50) 13% (96) 757RD/WT: Wrong Track 26% (324) 26% (327) 14% (178) 19% (234) 14% (178) 1241Biden Job Approve 37% (334) 32% (291) 12% (107) 7% (67) 11% (100) 899Biden Job Disapprove 23% (241) 27% (280) 15% (158) 21% (214) 14% (146) 1039
Continued on next page
Page 225
National Tracking Poll #2110084, October, 2021
225
Table POL14_6
Table POL14_6: Do you approve or disapprove of the following proposals to reform the United States Supreme Court?Placing an age cap on justices
DemographicStronglyapprove
Somewhatapprove
Somewhatdisapprove
Stronglydisapprove
Don’t know /No opinion Total N
Registered Voters 30% (591) 29% (580) 13% (269) 14% (283) 14% (275) 1998Biden Job Strongly Approve 42% (177) 30% (127) 12% (49) 6% (25) 10% (40) 418Biden Job Somewhat Approve 33% (157) 34% (164) 12% (58) 9% (41) 12% (60) 481Biden Job Somewhat Disapprove 25% (63) 30% (74) 18% (44) 12% (31) 15% (38) 250Biden Job Strongly Disapprove 23% (178) 26% (206) 14% (113) 23% (184) 14% (107) 788Favorable of Biden 38% (348) 32% (297) 11% (105) 7% (68) 12% (108) 927Unfavorable of Biden 23% (234) 26% (268) 16% (161) 21% (211) 14% (145) 1019Very Favorable of Biden 42% (199) 30% (144) 10% (50) 7% (32) 11% (51) 476Somewhat Favorable of Biden 33% (150) 34% (153) 12% (56) 8% (36) 13% (57) 451Somewhat Unfavorable of Biden 28% (58) 25% (51) 23% (47) 12% (24) 13% (28) 207Very Unfavorable of Biden 22% (176) 27% (217) 14% (114) 23% (187) 14% (118) 812#1 Issue: Economy 27% (204) 32% (246) 13% (99) 14% (106) 15% (113) 768#1 Issue: Security 26% (92) 24% (86) 16% (59) 23% (81) 12% (41) 360#1 Issue: Health Care 31% (71) 32% (74) 14% (31) 8% (18) 16% (36) 231#1 Issue: Medicare / Social Security 39% (89) 24% (54) 14% (32) 13% (29) 10% (23) 227#1 Issue: Women’s Issues 35% (43) 30% (38) 10% (13) 6% (8) 18% (23) 125#1 Issue: Education 32% (19) 37% (22) 7% (4) 11% (7) 13% (8) 59#1 Issue: Energy 43% (46) 25% (27) 7% (7) 12% (13) 13% (14) 107#1 Issue: Other 23% (28) 26% (32) 19% (23) 18% (22) 14% (17) 1222020 Vote: Joe Biden 36% (344) 32% (305) 12% (116) 7% (68) 12% (114) 9462020 Vote: Donald Trump 22% (189) 27% (238) 16% (136) 23% (194) 12% (108) 8642020 Vote: Didn’t Vote 31% (48) 21% (31) 9% (14) 11% (17) 28% (43) 1532018 House Vote: Democrat 38% (290) 31% (242) 13% (100) 8% (63) 10% (74) 7692018 House Vote: Republican 21% (144) 30% (208) 16% (113) 24% (167) 10% (69) 7022016 Vote: Hillary Clinton 38% (257) 32% (216) 14% (94) 7% (46) 11% (72) 6852016 Vote: Donald Trump 22% (180) 29% (234) 15% (122) 23% (187) 10% (79) 8022016 Vote: Other 25% (21) 32% (27) 12% (10) 18% (15) 13% (11) 842016 Vote: Didn’t Vote 31% (131) 24% (103) 10% (40) 8% (35) 27% (113) 423Voted in 2014: Yes 29% (388) 31% (416) 14% (186) 17% (233) 8% (112) 1335Voted in 2014: No 31% (203) 25% (164) 13% (83) 8% (50) 25% (163) 663
Continued on next page
Page 226
226
Morning ConsultTable POL14_6
Table POL14_6: Do you approve or disapprove of the following proposals to reform the United States Supreme Court?Placing an age cap on justices
DemographicStronglyapprove
Somewhatapprove
Somewhatdisapprove
Stronglydisapprove
Don’t know /No opinion Total N
Registered Voters 30% (591) 29% (580) 13% (269) 14% (283) 14% (275) 19984-Region: Northeast 30% (107) 30% (107) 17% (59) 11% (41) 11% (39) 3534-Region: Midwest 33% (145) 30% (135) 11% (48) 15% (65) 12% (52) 4444-Region: South 30% (224) 25% (184) 14% (106) 15% (113) 16% (119) 7464-Region: West 25% (115) 34% (153) 12% (56) 14% (65) 14% (65) 455Party: Democrat/Leans Democrat 37% (334) 31% (280) 12% (109) 8% (72) 13% (120) 914Party: Republican/Leans Republican 22% (179) 30% (244) 15% (122) 20% (166) 12% (98) 808Note: Row proportions may total to larger than one-hundred percent due to rounding. For more information visit MorningConsultIntelligence.com.
Page 227
National Tracking Poll #2110084, October, 2021
227
Table POL14_7
Table POL14_7: Do you approve or disapprove of the following proposals to reform the United States Supreme Court?Congress limiting the jurisdiction of the court, such as not allowing the court to hear cases about certain matters
DemographicStronglyapprove
Somewhatapprove
Somewhatdisapprove
Stronglydisapprove
Don’t know /No opinion Total N
Registered Voters 10% (196) 17% (339) 18% (358) 36% (726) 19% (379) 1998Gender: Male 11% (101) 20% (188) 16% (154) 41% (382) 12% (117) 942Gender: Female 9% (95) 14% (151) 19% (203) 33% (344) 25% (262) 1056Age: 18-34 14% (74) 21% (109) 19% (98) 21% (110) 24% (123) 514Age: 35-44 15% (46) 23% (69) 16% (50) 24% (74) 22% (68) 307Age: 45-64 7% (49) 16% (108) 20% (137) 39% (267) 17% (118) 679Age: 65+ 5% (27) 11% (52) 15% (73) 55% (275) 14% (71) 497GenZers: 1997-2012 5% (9) 17% (29) 22% (37) 24% (40) 32% (54) 170Millennials: 1981-1996 18% (100) 23% (126) 16% (91) 23% (124) 20% (110) 551GenXers: 1965-1980 6% (30) 22% (106) 18% (86) 31% (145) 22% (102) 469Baby Boomers: 1946-1964 7% (49) 10% (72) 19% (137) 50% (367) 15% (107) 732PID: Dem (no lean) 14% (105) 22% (173) 19% (147) 25% (196) 20% (156) 777PID: Ind (no lean) 9% (45) 16% (83) 17% (88) 36% (189) 23% (123) 528PID: Rep (no lean) 7% (45) 12% (83) 18% (123) 49% (341) 15% (101) 693PID/Gender: DemMen 15% (52) 26% (92) 20% (71) 23% (81) 16% (56) 352PID/Gender: DemWomen 13% (53) 19% (81) 18% (75) 27% (115) 23% (100) 425PID/Gender: Ind Men 10% (27) 22% (62) 14% (38) 40% (113) 14% (40) 280PID/Gender: Ind Women 7% (18) 9% (22) 20% (50) 31% (76) 33% (83) 248PID/Gender: Rep Men 7% (21) 11% (35) 15% (45) 61% (188) 7% (21) 310PID/Gender: Rep Women 6% (24) 13% (48) 20% (78) 40% (153) 21% (80) 384Ideo: Liberal (1-3) 14% (77) 21% (121) 19% (105) 28% (156) 19% (107) 566Ideo: Moderate (4) 10% (57) 21% (118) 22% (121) 30% (166) 17% (97) 560Ideo: Conservative (5-7) 7% (51) 11% (79) 16% (114) 53% (388) 13% (97) 730Educ: < College 8% (97) 16% (194) 19% (230) 34% (411) 23% (274) 1206Educ: Bachelors degree 14% (69) 17% (85) 14% (69) 42% (209) 14% (69) 501Educ: Post-grad 10% (30) 21% (60) 20% (60) 36% (105) 12% (36) 290Income: Under 50k 10% (86) 17% (145) 18% (155) 32% (276) 24% (211) 873Income: 50k-100k 10% (69) 14% (105) 18% (131) 41% (300) 17% (122) 728Income: 100k+ 10% (41) 22% (89) 18% (72) 38% (150) 12% (46) 398Ethnicity: White 8% (129) 16% (246) 19% (289) 40% (613) 17% (267) 1544Ethnicity: Hispanic 12% (27) 19% (42) 20% (44) 30% (66) 20% (44) 222
Continued on next page
Page 228
228
Morning ConsultTable POL14_7
Table POL14_7: Do you approve or disapprove of the following proposals to reform the United States Supreme Court?Congress limiting the jurisdiction of the court, such as not allowing the court to hear cases about certain matters
DemographicStronglyapprove
Somewhatapprove
Somewhatdisapprove
Stronglydisapprove
Don’t know /No opinion Total N
Registered Voters 10% (196) 17% (339) 18% (358) 36% (726) 19% (379) 1998Ethnicity: Black 15% (37) 21% (53) 14% (35) 25% (63) 26% (65) 253Ethnicity: Other 15% (30) 20% (41) 17% (33) 25% (50) 23% (46) 201All Christian 9% (91) 16% (172) 19% (193) 42% (439) 14% (146) 1041All Non-Christian 22% (24) 20% (21) 15% (16) 30% (32) 14% (14) 107Atheist 13% (10) 24% (19) 21% (16) 35% (27) 8% (6) 78Agnostic/Nothing in particular 10% (49) 14% (67) 18% (84) 31% (150) 27% (129) 480Something Else 8% (22) 21% (60) 17% (48) 27% (78) 29% (84) 293Religious Non-Protestant/Catholic 19% (25) 19% (25) 18% (23) 29% (38) 15% (19) 129Evangelical 12% (58) 17% (84) 14% (71) 37% (184) 21% (103) 499Non-Evangelical 6% (46) 18% (138) 20% (161) 41% (323) 15% (122) 790Community: Urban 19% (92) 24% (117) 16% (78) 26% (128) 15% (73) 487Community: Suburban 7% (70) 16% (164) 19% (200) 37% (387) 21% (221) 1041Community: Rural 7% (34) 13% (59) 17% (80) 45% (211) 18% (86) 469Employ: Private Sector 14% (94) 19% (133) 18% (122) 32% (219) 17% (116) 684Employ: Government 9% (11) 25% (28) 19% (22) 30% (34) 16% (18) 112Employ: Self-Employed 7% (12) 24% (43) 19% (34) 29% (52) 22% (40) 183Employ: Homemaker 10% (10) 8% (8) 21% (21) 29% (30) 33% (34) 104Employ: Student 7% (5) 23% (15) 23% (15) 23% (15) 25% (17) 67Employ: Retired 7% (37) 10% (53) 17% (92) 54% (286) 12% (66) 534Employ: Unemployed 10% (18) 20% (38) 16% (31) 25% (47) 30% (56) 191Employ: Other 7% (9) 17% (21) 16% (19) 35% (43) 25% (31) 124Military HH: Yes 9% (30) 17% (52) 13% (40) 48% (153) 13% (40) 315Military HH: No 10% (166) 17% (287) 19% (318) 34% (573) 20% (339) 1683RD/WT: Right Direction 14% (108) 27% (204) 18% (138) 23% (177) 17% (130) 757RD/WT: Wrong Track 7% (88) 11% (135) 18% (220) 44% (549) 20% (249) 1241Biden Job Approve 13% (121) 25% (222) 19% (172) 25% (223) 18% (160) 899Biden Job Disapprove 7% (71) 11% (112) 17% (180) 48% (496) 17% (180) 1039
Continued on next page
Page 229
National Tracking Poll #2110084, October, 2021
229
Table POL14_7
Table POL14_7: Do you approve or disapprove of the following proposals to reform the United States Supreme Court?Congress limiting the jurisdiction of the court, such as not allowing the court to hear cases about certain matters
DemographicStronglyapprove
Somewhatapprove
Somewhatdisapprove
Stronglydisapprove
Don’t know /No opinion Total N
Registered Voters 10% (196) 17% (339) 18% (358) 36% (726) 19% (379) 1998Biden Job Strongly Approve 20% (82) 23% (95) 18% (74) 25% (105) 15% (61) 418Biden Job Somewhat Approve 8% (39) 27% (128) 20% (98) 25% (118) 21% (99) 481Biden Job Somewhat Disapprove 6% (14) 18% (46) 28% (71) 28% (69) 20% (50) 250Biden Job Strongly Disapprove 7% (57) 8% (66) 14% (109) 54% (427) 16% (129) 788Favorable of Biden 14% (127) 24% (223) 19% (180) 24% (225) 19% (172) 927Unfavorable of Biden 6% (66) 11% (109) 17% (173) 48% (491) 18% (181) 1019Very Favorable of Biden 20% (95) 23% (108) 17% (83) 25% (120) 15% (70) 476Somewhat Favorable of Biden 7% (32) 26% (115) 21% (97) 23% (104) 23% (102) 451Somewhat Unfavorable of Biden 4% (8) 18% (38) 29% (60) 29% (60) 20% (42) 207Very Unfavorable of Biden 7% (58) 9% (71) 14% (113) 53% (431) 17% (139) 812#1 Issue: Economy 8% (61) 19% (142) 18% (137) 37% (285) 19% (143) 768#1 Issue: Security 11% (41) 8% (27) 19% (68) 47% (171) 15% (52) 360#1 Issue: Health Care 12% (28) 25% (57) 22% (50) 20% (47) 21% (49) 231#1 Issue: Medicare / Social Security 12% (28) 12% (28) 17% (38) 38% (86) 21% (48) 227#1 Issue: Women’s Issues 7% (9) 18% (22) 18% (23) 32% (39) 25% (31) 125#1 Issue: Education 11% (6) 25% (15) 20% (12) 28% (17) 17% (10) 59#1 Issue: Energy 13% (14) 25% (27) 17% (18) 24% (26) 21% (23) 107#1 Issue: Other 7% (9) 17% (20) 10% (12) 46% (56) 20% (24) 1222020 Vote: Joe Biden 12% (116) 23% (214) 20% (186) 26% (245) 19% (184) 9462020 Vote: Donald Trump 7% (57) 12% (102) 16% (138) 50% (431) 16% (137) 8642020 Vote: Didn’t Vote 15% (22) 13% (20) 19% (29) 22% (34) 31% (48) 1532018 House Vote: Democrat 13% (103) 22% (172) 18% (135) 28% (218) 18% (141) 7692018 House Vote: Republican 6% (44) 10% (70) 19% (136) 54% (376) 11% (75) 7022016 Vote: Hillary Clinton 14% (94) 21% (145) 19% (127) 27% (184) 20% (135) 6852016 Vote: Donald Trump 8% (65) 12% (95) 17% (133) 53% (421) 11% (88) 8022016 Vote: Other 8% (7) 13% (11) 16% (13) 40% (34) 22% (19) 842016 Vote: Didn’t Vote 7% (28) 21% (87) 20% (84) 20% (85) 33% (138) 423Voted in 2014: Yes 10% (136) 16% (213) 17% (227) 43% (568) 14% (191) 1335Voted in 2014: No 9% (60) 19% (126) 20% (131) 24% (157) 28% (188) 663
Continued on next page
Page 230
230
Morning ConsultTable POL14_7
Table POL14_7: Do you approve or disapprove of the following proposals to reform the United States Supreme Court?Congress limiting the jurisdiction of the court, such as not allowing the court to hear cases about certain matters
DemographicStronglyapprove
Somewhatapprove
Somewhatdisapprove
Stronglydisapprove
Don’t know /No opinion Total N
Registered Voters 10% (196) 17% (339) 18% (358) 36% (726) 19% (379) 19984-Region: Northeast 11% (38) 18% (64) 17% (61) 36% (127) 18% (63) 3534-Region: Midwest 9% (41) 16% (73) 19% (84) 36% (159) 20% (87) 4444-Region: South 9% (70) 16% (123) 17% (124) 38% (283) 20% (146) 7464-Region: West 10% (47) 17% (79) 20% (89) 35% (157) 18% (83) 455Party: Democrat/Leans Democrat 13% (114) 23% (209) 19% (177) 25% (231) 20% (184) 914Party: Republican/Leans Republican 6% (51) 12% (95) 18% (145) 49% (398) 15% (118) 808Note: Row proportions may total to larger than one-hundred percent due to rounding. For more information visit MorningConsultIntelligence.com.
Page 231
National Tracking Poll #2110084, October, 2021
231
Table POL15
Table POL15: As youmay know, a group of people attacked police and broke into the U.S. Capitol inWashington, D.C. on January 6th. Do you believethe people who broke into the U.S. Capitol in Washington, D.C., as Congress was certifying Electoral College votes for Joe Biden are:
DemographicSupporters of President
TrumpOpponents of President
TrumpDon’t know / No
opinion Total N
Registered Voters 62% (1242) 15% (310) 22% (446) 1998Gender: Male 64% (605) 15% (142) 21% (195) 942Gender: Female 60% (637) 16% (167) 24% (251) 1056Age: 18-34 60% (309) 16% (85) 24% (121) 514Age: 35-44 63% (194) 14% (44) 22% (69) 307Age: 45-64 64% (433) 15% (103) 21% (143) 679Age: 65+ 61% (306) 16% (79) 23% (113) 497GenZers: 1997-2012 62% (106) 13% (22) 25% (42) 170Millennials: 1981-1996 60% (329) 17% (94) 23% (128) 551GenXers: 1965-1980 65% (307) 14% (66) 21% (96) 469Baby Boomers: 1946-1964 63% (461) 15% (113) 22% (158) 732PID: Dem (no lean) 82% (638) 8% (63) 10% (77) 777PID: Ind (no lean) 61% (323) 11% (56) 28% (148) 528PID: Rep (no lean) 41% (281) 27% (191) 32% (221) 693PID/Gender: DemMen 82% (288) 10% (34) 9% (31) 352PID/Gender: DemWomen 82% (350) 7% (29) 11% (46) 425PID/Gender: Ind Men 63% (175) 13% (36) 24% (68) 280PID/Gender: Ind Women 60% (148) 8% (20) 32% (80) 248PID/Gender: Rep Men 46% (141) 23% (73) 31% (96) 310PID/Gender: Rep Women 36% (140) 31% (118) 33% (126) 384Ideo: Liberal (1-3) 85% (479) 8% (44) 8% (43) 566Ideo: Moderate (4) 72% (402) 10% (54) 19% (104) 560Ideo: Conservative (5-7) 42% (310) 27% (199) 30% (221) 730Educ: < College 58% (697) 15% (183) 27% (326) 1206Educ: Bachelors degree 68% (339) 17% (87) 15% (75) 501Educ: Post-grad 71% (205) 14% (40) 16% (45) 290Income: Under 50k 60% (525) 14% (121) 26% (227) 873Income: 50k-100k 62% (449) 18% (128) 21% (150) 728Income: 100k+ 67% (268) 15% (60) 18% (70) 398Ethnicity: White 61% (935) 16% (252) 23% (357) 1544Ethnicity: Hispanic 60% (134) 15% (33) 25% (55) 222
Continued on next page
Page 232
232
Morning ConsultTable POL15
Table POL15: As youmay know, a group of people attacked police and broke into the U.S. Capitol inWashington, D.C. on January 6th. Do you believethe people who broke into the U.S. Capitol in Washington, D.C., as Congress was certifying Electoral College votes for Joe Biden are:
DemographicSupporters of President
TrumpOpponents of President
TrumpDon’t know / No
opinion Total N
Registered Voters 62% (1242) 15% (310) 22% (446) 1998Ethnicity: Black 67% (170) 16% (40) 17% (43) 253Ethnicity: Other 68% (137) 9% (18) 23% (46) 201All Christian 60% (627) 18% (187) 22% (227) 1041All Non-Christian 74% (79) 16% (17) 10% (11) 107Atheist 82% (63) 6% (5) 12% (9) 78Agnostic/Nothing in particular 63% (305) 11% (52) 26% (123) 480Something Else 58% (168) 17% (48) 26% (76) 293Religious Non-Protestant/Catholic 72% (93) 14% (19) 14% (17) 129Evangelical 52% (259) 26% (129) 22% (110) 499Non-Evangelical 65% (511) 12% (96) 23% (183) 790Community: Urban 64% (312) 14% (68) 22% (107) 487Community: Suburban 66% (686) 14% (147) 20% (209) 1041Community: Rural 52% (244) 20% (95) 28% (131) 469Employ: Private Sector 62% (424) 17% (118) 21% (143) 684Employ: Government 69% (78) 15% (17) 15% (17) 112Employ: Self-Employed 62% (114) 14% (26) 23% (42) 183Employ: Homemaker 61% (63) 15% (15) 25% (25) 104Employ: Student 66% (44) 11% (7) 23% (16) 67Employ: Retired 60% (323) 18% (94) 22% (117) 534Employ: Unemployed 65% (124) 10% (20) 25% (47) 191Employ: Other 58% (72) 10% (13) 32% (39) 124Military HH: Yes 63% (197) 17% (54) 20% (64) 315Military HH: No 62% (1045) 15% (255) 23% (383) 1683RD/WT: Right Direction 79% (597) 10% (76) 11% (85) 757RD/WT: Wrong Track 52% (645) 19% (234) 29% (361) 1241Biden Job Approve 83% (749) 8% (71) 9% (79) 899Biden Job Disapprove 45% (465) 23% (239) 32% (335) 1039
Continued on next page
Page 233
National Tracking Poll #2110084, October, 2021
233
Table POL15
Table POL15: As youmay know, a group of people attacked police and broke into the U.S. Capitol inWashington, D.C. on January 6th. Do you believethe people who broke into the U.S. Capitol in Washington, D.C., as Congress was certifying Electoral College votes for Joe Biden are:
DemographicSupporters of President
TrumpOpponents of President
TrumpDon’t know / No
opinion Total N
Registered Voters 62% (1242) 15% (310) 22% (446) 1998Biden Job Strongly Approve 84% (350) 10% (43) 6% (25) 418Biden Job Somewhat Approve 83% (399) 6% (28) 11% (54) 481Biden Job Somewhat Disapprove 75% (187) 5% (14) 20% (50) 250Biden Job Strongly Disapprove 35% (278) 29% (225) 36% (285) 788Favorable of Biden 83% (769) 8% (71) 9% (87) 927Unfavorable of Biden 45% (456) 23% (234) 32% (328) 1019Very Favorable of Biden 82% (389) 9% (41) 10% (45) 476Somewhat Favorable of Biden 84% (380) 7% (30) 9% (41) 451Somewhat Unfavorable of Biden 75% (154) 5% (11) 20% (42) 207Very Unfavorable of Biden 37% (302) 27% (223) 35% (287) 812#1 Issue: Economy 59% (452) 14% (109) 27% (208) 768#1 Issue: Security 45% (161) 26% (95) 29% (104) 360#1 Issue: Health Care 77% (177) 9% (22) 14% (32) 231#1 Issue: Medicare / Social Security 74% (167) 11% (24) 16% (36) 227#1 Issue: Women’s Issues 76% (95) 10% (12) 14% (17) 125#1 Issue: Education 61% (36) 8% (5) 31% (18) 59#1 Issue: Energy 78% (84) 12% (13) 10% (11) 107#1 Issue: Other 57% (70) 25% (30) 18% (22) 1222020 Vote: Joe Biden 84% (792) 7% (66) 9% (88) 9462020 Vote: Donald Trump 40% (350) 25% (220) 34% (294) 8642020 Vote: Didn’t Vote 52% (79) 13% (19) 36% (55) 1532018 House Vote: Democrat 82% (632) 8% (59) 10% (78) 7692018 House Vote: Republican 41% (284) 28% (194) 32% (224) 7022016 Vote: Hillary Clinton 84% (576) 6% (44) 9% (64) 6852016 Vote: Donald Trump 42% (334) 26% (211) 32% (257) 8022016 Vote: Other 74% (62) 8% (6) 19% (16) 842016 Vote: Didn’t Vote 63% (268) 11% (48) 25% (107) 423Voted in 2014: Yes 62% (830) 17% (228) 21% (278) 1335Voted in 2014: No 62% (412) 12% (82) 25% (169) 663
Continued on next page
Page 234
234
Morning ConsultTable POL15
Table POL15: As youmay know, a group of people attacked police and broke into the U.S. Capitol inWashington, D.C. on January 6th. Do you believethe people who broke into the U.S. Capitol in Washington, D.C., as Congress was certifying Electoral College votes for Joe Biden are:
DemographicSupporters of President
TrumpOpponents of President
TrumpDon’t know / No
opinion Total N
Registered Voters 62% (1242) 15% (310) 22% (446) 19984-Region: Northeast 71% (251) 8% (28) 21% (74) 3534-Region: Midwest 62% (274) 16% (70) 23% (101) 4444-Region: South 55% (411) 21% (154) 24% (181) 7464-Region: West 67% (307) 13% (58) 20% (90) 455Party: Democrat/Leans Democrat 82% (751) 8% (73) 10% (91) 914Party: Republican/Leans Republican 42% (340) 26% (207) 32% (261) 808Note: Row proportions may total to larger than one-hundred percent due to rounding. For more information visit MorningConsultIntelligence.com.
Page 235
National Tracking Poll #2110084, October, 2021
235
Table POL16
Table POL16: And do you believe the people who broke into the U.S. Capitol in Washington, D.C., as Congress was certifying Electoral College votesfor Joe Biden should be viewed as domestic terrorists, or not?
DemographicYes, they are domestic
terroristsNo, they are not
domestic terroristsDon’t know / No
opinion Total N
Registered Voters 54% (1076) 31% (616) 15% (306) 1998Gender: Male 54% (508) 35% (331) 11% (103) 942Gender: Female 54% (568) 27% (285) 19% (203) 1056Age: 18-34 56% (289) 23% (118) 21% (108) 514Age: 35-44 56% (173) 25% (76) 19% (58) 307Age: 45-64 50% (339) 37% (254) 13% (87) 679Age: 65+ 55% (275) 34% (168) 11% (54) 497GenZers: 1997-2012 61% (104) 20% (34) 19% (32) 170Millennials: 1981-1996 55% (303) 26% (143) 19% (106) 551GenXers: 1965-1980 50% (236) 33% (154) 17% (79) 469Baby Boomers: 1946-1964 54% (395) 35% (255) 11% (82) 732PID: Dem (no lean) 79% (611) 12% (90) 10% (76) 777PID: Ind (no lean) 52% (276) 27% (144) 20% (108) 528PID: Rep (no lean) 27% (189) 55% (382) 18% (123) 693PID/Gender: DemMen 78% (276) 13% (47) 8% (29) 352PID/Gender: DemWomen 79% (335) 10% (43) 11% (47) 425PID/Gender: Ind Men 51% (144) 34% (94) 15% (42) 280PID/Gender: Ind Women 53% (132) 20% (50) 26% (66) 248PID/Gender: Rep Men 28% (88) 61% (190) 10% (32) 310PID/Gender: Rep Women 26% (101) 50% (192) 24% (90) 384Ideo: Liberal (1-3) 81% (459) 11% (61) 8% (46) 566Ideo: Moderate (4) 62% (346) 24% (132) 14% (81) 560Ideo: Conservative (5-7) 29% (210) 56% (412) 15% (108) 730Educ: < College 49% (592) 32% (380) 19% (234) 1206Educ: Bachelors degree 58% (290) 32% (162) 10% (50) 501Educ: Post-grad 67% (194) 25% (74) 8% (23) 290Income: Under 50k 54% (469) 27% (240) 19% (164) 873Income: 50k-100k 53% (387) 34% (246) 13% (94) 728Income: 100k+ 55% (219) 33% (130) 12% (48) 398Ethnicity: White 51% (783) 34% (531) 15% (230) 1544Ethnicity: Hispanic 55% (123) 24% (54) 20% (45) 222
Continued on next page
Page 236
236
Morning ConsultTable POL16
Table POL16: And do you believe the people who broke into the U.S. Capitol in Washington, D.C., as Congress was certifying Electoral College votesfor Joe Biden should be viewed as domestic terrorists, or not?
DemographicYes, they are domestic
terroristsNo, they are not
domestic terroristsDon’t know / No
opinion Total N
Registered Voters 54% (1076) 31% (616) 15% (306) 1998Ethnicity: Black 72% (181) 14% (36) 14% (36) 253Ethnicity: Other 55% (111) 24% (49) 20% (41) 201All Christian 49% (509) 36% (374) 15% (158) 1041All Non-Christian 70% (75) 22% (23) 8% (9) 107Atheist 70% (54) 27% (21) 4% (3) 78Agnostic/Nothing in particular 58% (278) 26% (123) 17% (79) 480Something Else 54% (160) 26% (76) 20% (58) 293Religious Non-Protestant/Catholic 66% (85) 25% (33) 9% (11) 129Evangelical 47% (234) 35% (174) 18% (90) 499Non-Evangelical 52% (413) 33% (258) 15% (119) 790Community: Urban 58% (284) 26% (127) 16% (76) 487Community: Suburban 56% (588) 31% (321) 13% (132) 1041Community: Rural 43% (203) 36% (168) 21% (98) 469Employ: Private Sector 52% (356) 33% (226) 15% (103) 684Employ: Government 58% (65) 28% (31) 14% (15) 112Employ: Self-Employed 55% (101) 37% (68) 7% (13) 183Employ: Homemaker 46% (47) 30% (31) 24% (25) 104Employ: Student 65% (44) 11% (7) 24% (16) 67Employ: Retired 55% (292) 35% (185) 11% (57) 534Employ: Unemployed 56% (108) 24% (46) 20% (37) 191Employ: Other 50% (62) 18% (22) 32% (40) 124Military HH: Yes 49% (155) 39% (123) 12% (37) 315Military HH: No 55% (921) 29% (493) 16% (270) 1683RD/WT: Right Direction 77% (585) 12% (94) 10% (78) 757RD/WT: Wrong Track 40% (491) 42% (522) 18% (228) 1241Biden Job Approve 81% (725) 10% (91) 9% (83) 899Biden Job Disapprove 31% (324) 50% (523) 18% (192) 1039
Continued on next page
Page 237
National Tracking Poll #2110084, October, 2021
237
Table POL16
Table POL16: And do you believe the people who broke into the U.S. Capitol in Washington, D.C., as Congress was certifying Electoral College votesfor Joe Biden should be viewed as domestic terrorists, or not?
DemographicYes, they are domestic
terroristsNo, they are not
domestic terroristsDon’t know / No
opinion Total N
Registered Voters 54% (1076) 31% (616) 15% (306) 1998Biden Job Strongly Approve 83% (349) 8% (34) 8% (35) 418Biden Job Somewhat Approve 78% (376) 12% (57) 10% (47) 481Biden Job Somewhat Disapprove 57% (143) 28% (70) 15% (38) 250Biden Job Strongly Disapprove 23% (181) 57% (453) 20% (154) 788Favorable of Biden 82% (756) 9% (86) 9% (86) 927Unfavorable of Biden 30% (308) 51% (522) 19% (189) 1019Very Favorable of Biden 81% (388) 9% (43) 10% (46) 476Somewhat Favorable of Biden 82% (368) 10% (43) 9% (40) 451Somewhat Unfavorable of Biden 55% (113) 31% (65) 14% (29) 207Very Unfavorable of Biden 24% (195) 56% (457) 20% (160) 812#1 Issue: Economy 48% (367) 35% (265) 18% (136) 768#1 Issue: Security 31% (112) 49% (177) 20% (70) 360#1 Issue: Health Care 69% (159) 15% (34) 16% (38) 231#1 Issue: Medicare / Social Security 66% (149) 24% (54) 10% (23) 227#1 Issue: Women’s Issues 77% (96) 14% (18) 9% (11) 125#1 Issue: Education 65% (38) 21% (12) 15% (9) 59#1 Issue: Energy 66% (71) 30% (32) 4% (5) 107#1 Issue: Other 69% (84) 19% (24) 12% (15) 1222020 Vote: Joe Biden 79% (752) 10% (93) 11% (101) 9462020 Vote: Donald Trump 26% (222) 56% (486) 18% (156) 8642020 Vote: Didn’t Vote 52% (80) 20% (31) 28% (42) 1532018 House Vote: Democrat 78% (601) 12% (95) 9% (73) 7692018 House Vote: Republican 29% (204) 56% (395) 15% (102) 7022016 Vote: Hillary Clinton 80% (551) 9% (62) 10% (72) 6852016 Vote: Donald Trump 30% (243) 55% (442) 15% (117) 8022016 Vote: Other 58% (49) 29% (24) 13% (11) 842016 Vote: Didn’t Vote 55% (232) 20% (84) 25% (107) 423Voted in 2014: Yes 54% (721) 34% (458) 12% (156) 1335Voted in 2014: No 54% (355) 24% (158) 23% (150) 663
Continued on next page
Page 238
238
Morning ConsultTable POL16
Table POL16: And do you believe the people who broke into the U.S. Capitol in Washington, D.C., as Congress was certifying Electoral College votesfor Joe Biden should be viewed as domestic terrorists, or not?
DemographicYes, they are domestic
terroristsNo, they are not
domestic terroristsDon’t know / No
opinion Total N
Registered Voters 54% (1076) 31% (616) 15% (306) 19984-Region: Northeast 58% (204) 28% (97) 15% (52) 3534-Region: Midwest 53% (236) 31% (136) 16% (73) 4444-Region: South 51% (381) 31% (233) 18% (132) 7464-Region: West 56% (254) 33% (150) 11% (50) 455Party: Democrat/Leans Democrat 79% (727) 11% (99) 10% (88) 914Party: Republican/Leans Republican 28% (226) 55% (446) 17% (136) 808Note: Row proportions may total to larger than one-hundred percent due to rounding. For more information visit MorningConsultIntelligence.com.
Page 239
National Tracking Poll #2110084, October, 2021
239
Table POL17_1
Table POL17_1: How responsible do you believe each of the following are for the events that led to a group of people attacking police and breakinginto the U.S. Capitol in Washington, D.C.?Democrats in Congress
DemographicVery
responsibleSomewhatresponsible
Not tooresponsible
Not responsibleat all
Don’t know /No opinion Total N
Registered Voters 19% (375) 15% (307) 13% (264) 36% (724) 16% (327) 1998Gender: Male 21% (198) 16% (151) 14% (128) 38% (354) 12% (110) 942Gender: Female 17% (177) 15% (156) 13% (136) 35% (370) 21% (217) 1056Age: 18-34 17% (89) 15% (79) 17% (85) 29% (149) 22% (112) 514Age: 35-44 18% (57) 17% (53) 14% (42) 36% (110) 15% (45) 307Age: 45-64 21% (143) 16% (107) 11% (76) 38% (259) 14% (95) 679Age: 65+ 17% (86) 14% (69) 12% (61) 41% (206) 15% (76) 497GenZers: 1997-2012 14% (23) 10% (17) 18% (31) 31% (53) 27% (46) 170Millennials: 1981-1996 20% (110) 18% (101) 14% (80) 31% (170) 16% (90) 551GenXers: 1965-1980 19% (90) 16% (77) 11% (54) 37% (174) 16% (74) 469Baby Boomers: 1946-1964 19% (140) 14% (101) 12% (91) 39% (289) 15% (111) 732PID: Dem (no lean) 8% (60) 10% (77) 13% (105) 57% (445) 12% (90) 777PID: Ind (no lean) 15% (81) 15% (79) 17% (90) 29% (152) 24% (126) 528PID: Rep (no lean) 34% (234) 22% (151) 10% (69) 18% (127) 16% (112) 693PID/Gender: DemMen 9% (33) 14% (49) 13% (45) 57% (200) 7% (26) 352PID/Gender: DemWomen 6% (27) 7% (28) 14% (60) 58% (246) 15% (64) 425PID/Gender: Ind Men 19% (54) 16% (45) 17% (46) 31% (87) 17% (47) 280PID/Gender: Ind Women 11% (27) 14% (34) 18% (44) 26% (65) 32% (79) 248PID/Gender: Rep Men 36% (111) 18% (57) 12% (36) 22% (68) 12% (38) 310PID/Gender: Rep Women 32% (123) 24% (94) 9% (33) 15% (59) 19% (74) 384Ideo: Liberal (1-3) 8% (46) 9% (49) 15% (84) 61% (347) 7% (41) 566Ideo: Moderate (4) 10% (55) 16% (91) 19% (106) 38% (214) 17% (94) 560Ideo: Conservative (5-7) 35% (253) 20% (147) 9% (65) 21% (153) 15% (111) 730Educ: < College 21% (253) 15% (185) 13% (155) 31% (371) 20% (241) 1206Educ: Bachelors degree 14% (73) 16% (78) 13% (66) 46% (229) 11% (55) 501Educ: Post-grad 17% (49) 15% (44) 15% (43) 43% (124) 11% (31) 290Income: Under 50k 19% (163) 15% (129) 12% (109) 33% (288) 21% (184) 873Income: 50k-100k 19% (136) 15% (109) 13% (97) 38% (280) 14% (105) 728Income: 100k+ 19% (76) 17% (69) 15% (58) 39% (156) 10% (39) 398Ethnicity: White 20% (309) 16% (247) 14% (209) 35% (534) 16% (244) 1544
Continued on next page
Page 240
240
Morning ConsultTable POL17_1
Table POL17_1: How responsible do you believe each of the following are for the events that led to a group of people attacking police and breakinginto the U.S. Capitol in Washington, D.C.?Democrats in Congress
DemographicVery
responsibleSomewhatresponsible
Not tooresponsible
Not responsibleat all
Don’t know /No opinion Total N
Registered Voters 19% (375) 15% (307) 13% (264) 36% (724) 16% (327) 1998Ethnicity: Hispanic 18% (41) 20% (45) 12% (27) 29% (64) 20% (45) 222Ethnicity: Black 11% (27) 11% (27) 8% (19) 52% (131) 19% (48) 253Ethnicity: Other 19% (38) 16% (33) 18% (35) 30% (60) 17% (35) 201All Christian 21% (221) 16% (171) 13% (140) 34% (354) 15% (156) 1041All Non-Christian 19% (20) 11% (12) 11% (12) 49% (52) 9% (10) 107Atheist 8% (6) 14% (11) 22% (17) 50% (38) 7% (5) 78Agnostic/Nothing in particular 16% (78) 12% (57) 13% (62) 37% (179) 22% (104) 480Something Else 17% (50) 19% (57) 11% (34) 34% (100) 18% (53) 293Religious Non-Protestant/Catholic 17% (22) 14% (18) 9% (12) 47% (61) 13% (16) 129Evangelical 26% (128) 20% (102) 12% (58) 30% (148) 13% (63) 499Non-Evangelical 17% (135) 14% (114) 14% (113) 37% (294) 17% (134) 790Community: Urban 18% (90) 19% (90) 13% (63) 36% (173) 14% (71) 487Community: Suburban 16% (162) 14% (146) 14% (147) 40% (419) 16% (169) 1041Community: Rural 26% (123) 15% (72) 12% (54) 28% (132) 19% (88) 469Employ: Private Sector 18% (125) 19% (127) 15% (101) 35% (240) 13% (92) 684Employ: Government 10% (12) 15% (17) 13% (15) 49% (55) 12% (14) 112Employ: Self-Employed 25% (45) 15% (27) 16% (30) 32% (58) 12% (22) 183Employ: Homemaker 19% (20) 17% (18) 4% (4) 36% (37) 24% (25) 104Employ: Student 8% (5) 10% (7) 20% (13) 36% (24) 26% (17) 67Employ: Retired 21% (113) 13% (70) 12% (63) 40% (212) 14% (75) 534Employ: Unemployed 18% (34) 14% (26) 10% (19) 34% (65) 24% (46) 191Employ: Other 16% (20) 13% (16) 15% (19) 27% (33) 29% (36) 124Military HH: Yes 22% (69) 18% (55) 9% (28) 37% (117) 15% (46) 315Military HH: No 18% (306) 15% (252) 14% (236) 36% (607) 17% (281) 1683RD/WT: Right Direction 9% (69) 11% (81) 15% (113) 55% (417) 10% (77) 757RD/WT: Wrong Track 25% (306) 18% (226) 12% (151) 25% (307) 20% (250) 1241Biden Job Approve 7% (65) 12% (105) 15% (139) 56% (504) 10% (88) 899Biden Job Disapprove 29% (305) 19% (197) 12% (122) 20% (212) 19% (202) 1039
Continued on next page
Page 241
National Tracking Poll #2110084, October, 2021
241
Table POL17_1
Table POL17_1: How responsible do you believe each of the following are for the events that led to a group of people attacking police and breakinginto the U.S. Capitol in Washington, D.C.?Democrats in Congress
DemographicVery
responsibleSomewhatresponsible
Not tooresponsible
Not responsibleat all
Don’t know /No opinion Total N
Registered Voters 19% (375) 15% (307) 13% (264) 36% (724) 16% (327) 1998Biden Job Strongly Approve 9% (38) 9% (36) 12% (50) 64% (267) 6% (26) 418Biden Job Somewhat Approve 5% (26) 14% (68) 18% (88) 49% (236) 13% (62) 481Biden Job Somewhat Disapprove 8% (20) 16% (40) 23% (57) 32% (79) 22% (54) 250Biden Job Strongly Disapprove 36% (285) 20% (158) 8% (64) 17% (133) 19% (148) 788Favorable of Biden 8% (75) 11% (105) 15% (137) 55% (513) 11% (98) 927Unfavorable of Biden 29% (295) 20% (200) 12% (124) 19% (199) 20% (201) 1019Very Favorable of Biden 13% (61) 8% (38) 10% (47) 62% (295) 7% (34) 476Somewhat Favorable of Biden 3% (14) 15% (67) 20% (89) 48% (218) 14% (63) 451Somewhat Unfavorable of Biden 6% (12) 20% (41) 25% (51) 29% (60) 21% (43) 207Very Unfavorable of Biden 35% (283) 20% (159) 9% (73) 17% (139) 20% (158) 812#1 Issue: Economy 17% (133) 20% (152) 14% (109) 30% (228) 19% (146) 768#1 Issue: Security 37% (132) 15% (53) 9% (31) 24% (87) 16% (58) 360#1 Issue: Health Care 10% (22) 15% (35) 18% (42) 43% (98) 14% (33) 231#1 Issue: Medicare / Social Security 14% (33) 8% (17) 12% (27) 52% (117) 14% (32) 227#1 Issue: Women’s Issues 8% (10) 8% (10) 13% (17) 55% (69) 16% (20) 125#1 Issue: Education 15% (9) 20% (12) 18% (11) 28% (16) 20% (12) 59#1 Issue: Energy 18% (19) 10% (10) 15% (17) 50% (54) 7% (7) 107#1 Issue: Other 15% (18) 15% (18) 9% (11) 46% (56) 16% (19) 1222020 Vote: Joe Biden 7% (64) 10% (97) 16% (154) 56% (532) 10% (99) 9462020 Vote: Donald Trump 33% (285) 21% (185) 9% (81) 18% (151) 19% (161) 8642020 Vote: Didn’t Vote 14% (22) 13% (21) 17% (25) 20% (30) 36% (56) 1532018 House Vote: Democrat 8% (59) 11% (83) 16% (125) 57% (440) 8% (62) 7692018 House Vote: Republican 32% (224) 22% (151) 10% (73) 20% (142) 16% (111) 7022016 Vote: Hillary Clinton 6% (43) 10% (67) 15% (103) 60% (414) 8% (58) 6852016 Vote: Donald Trump 33% (263) 21% (167) 11% (89) 20% (162) 15% (121) 8022016 Vote: Other 8% (7) 18% (15) 11% (9) 47% (40) 16% (13) 842016 Vote: Didn’t Vote 14% (60) 14% (58) 15% (63) 25% (106) 32% (135) 423Voted in 2014: Yes 20% (267) 16% (220) 13% (173) 39% (523) 11% (152) 1335Voted in 2014: No 16% (108) 13% (88) 14% (91) 30% (201) 26% (175) 663
Continued on next page
Page 242
242
Morning ConsultTable POL17_1
Table POL17_1: How responsible do you believe each of the following are for the events that led to a group of people attacking police and breakinginto the U.S. Capitol in Washington, D.C.?Democrats in Congress
DemographicVery
responsibleSomewhatresponsible
Not tooresponsible
Not responsibleat all
Don’t know /No opinion Total N
Registered Voters 19% (375) 15% (307) 13% (264) 36% (724) 16% (327) 19984-Region: Northeast 14% (50) 15% (54) 17% (60) 40% (140) 14% (50) 3534-Region: Midwest 23% (103) 12% (55) 15% (67) 34% (153) 15% (66) 4444-Region: South 19% (140) 19% (141) 11% (80) 33% (243) 19% (141) 7464-Region: West 18% (81) 13% (58) 13% (58) 41% (188) 15% (70) 455Party: Democrat/Leans Democrat 8% (69) 10% (89) 15% (137) 56% (512) 12% (107) 914Party: Republican/Leans Republican 32% (262) 21% (174) 10% (84) 19% (152) 17% (136) 808Note: Row proportions may total to larger than one-hundred percent due to rounding. For more information visit MorningConsultIntelligence.com.
Page 243
National Tracking Poll #2110084, October, 2021
243
Table POL17_2
Table POL17_2: How responsible do you believe each of the following are for the events that led to a group of people attacking police and breakinginto the U.S. Capitol in Washington, D.C.?Republicans in Congress
DemographicVery
responsibleSomewhatresponsible
Not tooresponsible
Not responsibleat all
Don’t know /No opinion Total N
Registered Voters 26% (525) 24% (471) 13% (269) 22% (449) 14% (285) 1998Gender: Male 27% (259) 25% (232) 16% (152) 22% (206) 10% (93) 942Gender: Female 25% (266) 23% (238) 11% (117) 23% (243) 18% (192) 1056Age: 18-34 30% (153) 25% (130) 10% (53) 12% (62) 23% (116) 514Age: 35-44 30% (91) 25% (76) 11% (35) 20% (61) 14% (44) 307Age: 45-64 22% (151) 22% (151) 18% (125) 25% (170) 12% (81) 679Age: 65+ 26% (130) 23% (113) 11% (55) 31% (156) 9% (44) 497GenZers: 1997-2012 29% (49) 21% (36) 10% (17) 10% (18) 29% (50) 170Millennials: 1981-1996 30% (168) 27% (147) 11% (62) 15% (84) 16% (91) 551GenXers: 1965-1980 23% (108) 21% (100) 18% (85) 23% (110) 14% (67) 469Baby Boomers: 1946-1964 25% (179) 24% (175) 13% (94) 29% (209) 10% (74) 732PID: Dem (no lean) 45% (346) 31% (244) 7% (55) 7% (51) 10% (81) 777PID: Ind (no lean) 22% (117) 25% (131) 13% (66) 19% (98) 22% (115) 528PID: Rep (no lean) 9% (62) 14% (96) 21% (147) 43% (300) 13% (88) 693PID/Gender: DemMen 45% (157) 33% (116) 8% (28) 7% (23) 8% (28) 352PID/Gender: DemWomen 44% (188) 30% (128) 6% (27) 7% (28) 13% (54) 425PID/Gender: Ind Men 22% (61) 28% (77) 16% (45) 19% (52) 16% (45) 280PID/Gender: Ind Women 23% (57) 22% (54) 9% (22) 18% (46) 28% (70) 248PID/Gender: Rep Men 13% (41) 13% (40) 25% (79) 42% (130) 7% (20) 310PID/Gender: Rep Women 6% (21) 15% (56) 18% (68) 44% (169) 18% (68) 384Ideo: Liberal (1-3) 49% (275) 31% (174) 8% (48) 5% (30) 7% (39) 566Ideo: Moderate (4) 29% (164) 30% (167) 11% (62) 15% (86) 14% (80) 560Ideo: Conservative (5-7) 9% (66) 15% (108) 20% (144) 44% (321) 13% (92) 730Educ: < College 25% (302) 20% (242) 13% (153) 24% (294) 18% (215) 1206Educ: Bachelors degree 28% (141) 27% (135) 16% (81) 20% (101) 8% (43) 501Educ: Post-grad 28% (82) 32% (94) 12% (35) 19% (54) 9% (27) 290Income: Under 50k 26% (224) 22% (188) 12% (107) 22% (190) 19% (164) 873Income: 50k-100k 26% (192) 25% (179) 13% (93) 25% (180) 11% (83) 728Income: 100k+ 27% (109) 26% (103) 17% (69) 20% (79) 9% (38) 398Ethnicity: White 23% (355) 23% (356) 15% (227) 25% (393) 14% (213) 1544
Continued on next page
Page 244
244
Morning ConsultTable POL17_2
Table POL17_2: How responsible do you believe each of the following are for the events that led to a group of people attacking police and breakinginto the U.S. Capitol in Washington, D.C.?Republicans in Congress
DemographicVery
responsibleSomewhatresponsible
Not tooresponsible
Not responsibleat all
Don’t know /No opinion Total N
Registered Voters 26% (525) 24% (471) 13% (269) 22% (449) 14% (285) 1998Ethnicity: Hispanic 31% (68) 33% (73) 8% (18) 11% (25) 17% (37) 222Ethnicity: Black 41% (104) 23% (58) 7% (17) 14% (36) 15% (38) 253Ethnicity: Other 33% (66) 28% (57) 12% (25) 10% (19) 17% (35) 201All Christian 22% (230) 22% (233) 15% (158) 27% (286) 13% (134) 1041All Non-Christian 31% (33) 42% (45) 8% (8) 12% (13) 8% (9) 107Atheist 40% (31) 32% (25) 10% (8) 13% (10) 5% (4) 78Agnostic/Nothing in particular 32% (152) 21% (99) 13% (62) 17% (82) 18% (85) 480Something Else 27% (80) 23% (69) 11% (32) 20% (58) 18% (54) 293Religious Non-Protestant/Catholic 26% (34) 40% (52) 8% (10) 16% (21) 10% (12) 129Evangelical 20% (98) 22% (110) 15% (76) 29% (146) 14% (68) 499Non-Evangelical 26% (202) 23% (179) 14% (110) 24% (186) 14% (114) 790Community: Urban 31% (152) 33% (159) 9% (45) 14% (70) 13% (62) 487Community: Suburban 26% (274) 22% (229) 14% (149) 23% (242) 14% (147) 1041Community: Rural 21% (100) 18% (82) 16% (75) 29% (136) 16% (76) 469Employ: Private Sector 25% (173) 26% (178) 16% (106) 22% (147) 11% (79) 684Employ: Government 35% (40) 28% (32) 11% (12) 16% (18) 10% (11) 112Employ: Self-Employed 27% (50) 22% (41) 19% (35) 21% (38) 10% (18) 183Employ: Homemaker 23% (24) 19% (20) 7% (8) 22% (23) 28% (29) 104Employ: Student 36% (24) 18% (12) 9% (6) 10% (7) 27% (18) 67Employ: Retired 25% (132) 21% (115) 12% (64) 32% (169) 10% (54) 534Employ: Unemployed 29% (55) 23% (45) 12% (22) 16% (30) 20% (38) 191Employ: Other 22% (27) 23% (28) 11% (14) 14% (17) 30% (38) 124Military HH: Yes 20% (62) 25% (78) 18% (55) 24% (75) 14% (44) 315Military HH: No 27% (463) 23% (393) 13% (213) 22% (374) 14% (241) 1683RD/WT: Right Direction 42% (319) 34% (255) 9% (68) 7% (49) 9% (66) 757RD/WT: Wrong Track 17% (206) 17% (216) 16% (201) 32% (400) 18% (219) 1241Biden Job Approve 44% (399) 33% (292) 9% (80) 6% (54) 8% (74) 899Biden Job Disapprove 11% (115) 16% (170) 18% (186) 38% (392) 17% (176) 1039
Continued on next page
Page 245
National Tracking Poll #2110084, October, 2021
245
Table POL17_2
Table POL17_2: How responsible do you believe each of the following are for the events that led to a group of people attacking police and breakinginto the U.S. Capitol in Washington, D.C.?Republicans in Congress
DemographicVery
responsibleSomewhatresponsible
Not tooresponsible
Not responsibleat all
Don’t know /No opinion Total N
Registered Voters 26% (525) 24% (471) 13% (269) 22% (449) 14% (285) 1998Biden Job Strongly Approve 55% (228) 29% (120) 7% (30) 5% (20) 5% (19) 418Biden Job Somewhat Approve 36% (171) 36% (172) 10% (49) 7% (34) 11% (54) 481Biden Job Somewhat Disapprove 21% (53) 34% (84) 15% (38) 13% (31) 17% (44) 250Biden Job Strongly Disapprove 8% (61) 11% (85) 19% (149) 46% (361) 17% (132) 788Favorable of Biden 44% (406) 34% (315) 8% (74) 6% (54) 8% (78) 927Unfavorable of Biden 11% (112) 15% (153) 19% (192) 38% (387) 17% (175) 1019Very Favorable of Biden 54% (258) 29% (138) 7% (34) 4% (20) 5% (26) 476Somewhat Favorable of Biden 33% (148) 39% (177) 9% (39) 8% (34) 12% (53) 451Somewhat Unfavorable of Biden 22% (45) 32% (67) 17% (36) 10% (20) 19% (40) 207Very Unfavorable of Biden 8% (67) 11% (86) 19% (156) 45% (367) 17% (135) 812#1 Issue: Economy 20% (157) 26% (196) 15% (117) 23% (175) 16% (123) 768#1 Issue: Security 15% (52) 13% (48) 18% (66) 41% (147) 13% (46) 360#1 Issue: Health Care 37% (84) 35% (80) 9% (21) 8% (19) 11% (26) 231#1 Issue: Medicare / Social Security 34% (78) 23% (53) 9% (21) 21% (47) 12% (27) 227#1 Issue: Women’s Issues 41% (51) 26% (32) 7% (8) 11% (14) 15% (18) 125#1 Issue: Education 41% (24) 22% (13) 4% (3) 9% (5) 24% (14) 59#1 Issue: Energy 39% (41) 23% (25) 13% (14) 14% (15) 11% (11) 107#1 Issue: Other 29% (36) 19% (23) 16% (19) 21% (25) 16% (19) 1222020 Vote: Joe Biden 45% (429) 32% (304) 8% (78) 6% (53) 9% (83) 9462020 Vote: Donald Trump 7% (61) 14% (122) 19% (168) 43% (370) 16% (142) 8642020 Vote: Didn’t Vote 18% (28) 22% (34) 13% (19) 15% (22) 32% (49) 1532018 House Vote: Democrat 45% (347) 33% (253) 8% (59) 7% (50) 8% (59) 7692018 House Vote: Republican 8% (54) 15% (108) 21% (147) 44% (310) 12% (83) 7022016 Vote: Hillary Clinton 47% (323) 32% (221) 6% (42) 6% (43) 8% (56) 6852016 Vote: Donald Trump 11% (90) 15% (124) 19% (155) 42% (334) 12% (99) 8022016 Vote: Other 19% (16) 33% (28) 16% (13) 18% (15) 14% (12) 842016 Vote: Didn’t Vote 23% (96) 23% (96) 14% (58) 13% (54) 28% (119) 423Voted in 2014: Yes 28% (377) 24% (315) 14% (186) 25% (335) 9% (121) 1335Voted in 2014: No 22% (148) 24% (156) 12% (83) 17% (114) 25% (163) 663
Continued on next page
Page 246
246
Morning ConsultTable POL17_2
Table POL17_2: How responsible do you believe each of the following are for the events that led to a group of people attacking police and breakinginto the U.S. Capitol in Washington, D.C.?Republicans in Congress
DemographicVery
responsibleSomewhatresponsible
Not tooresponsible
Not responsibleat all
Don’t know /No opinion Total N
Registered Voters 26% (525) 24% (471) 13% (269) 22% (449) 14% (285) 19984-Region: Northeast 25% (90) 27% (96) 10% (35) 22% (79) 15% (53) 3534-Region: Midwest 29% (129) 22% (97) 15% (69) 23% (103) 10% (46) 4444-Region: South 21% (159) 20% (152) 15% (108) 26% (195) 18% (132) 7464-Region: West 32% (147) 28% (126) 13% (57) 16% (72) 12% (53) 455Party: Democrat/Leans Democrat 44% (404) 32% (290) 8% (71) 6% (56) 10% (94) 914Party: Republican/Leans Republican 8% (68) 13% (109) 21% (167) 44% (354) 14% (111) 808Note: Row proportions may total to larger than one-hundred percent due to rounding. For more information visit MorningConsultIntelligence.com.
Page 247
National Tracking Poll #2110084, October, 2021
247
Table POL17_3
Table POL17_3: How responsible do you believe each of the following are for the events that led to a group of people attacking police and breakinginto the U.S. Capitol in Washington, D.C.?Sen. Ted Cruz
DemographicVery
responsibleSomewhatresponsible
Not tooresponsible
Not responsibleat all
Don’t know /No opinion Total N
Registered Voters 20% (402) 19% (380) 12% (241) 25% (508) 23% (468) 1998Gender: Male 21% (194) 21% (202) 16% (149) 27% (254) 15% (143) 942Gender: Female 20% (208) 17% (178) 9% (92) 24% (253) 31% (325) 1056Age: 18-34 22% (114) 19% (99) 13% (69) 14% (70) 32% (162) 514Age: 35-44 17% (53) 22% (69) 13% (39) 18% (55) 30% (91) 307Age: 45-64 18% (125) 17% (118) 13% (86) 32% (215) 20% (135) 679Age: 65+ 22% (110) 19% (95) 9% (47) 34% (167) 16% (80) 497GenZers: 1997-2012 25% (43) 16% (27) 11% (18) 13% (22) 35% (60) 170Millennials: 1981-1996 19% (106) 23% (125) 13% (72) 16% (87) 29% (161) 551GenXers: 1965-1980 18% (85) 18% (84) 14% (67) 27% (126) 23% (107) 469Baby Boomers: 1946-1964 21% (152) 18% (133) 10% (75) 33% (239) 18% (133) 732PID: Dem (no lean) 35% (274) 27% (211) 8% (65) 9% (71) 20% (156) 777PID: Ind (no lean) 16% (83) 19% (100) 16% (84) 20% (106) 29% (155) 528PID: Rep (no lean) 6% (45) 10% (68) 13% (91) 48% (331) 23% (157) 693PID/Gender: DemMen 36% (127) 30% (105) 12% (41) 8% (28) 15% (52) 352PID/Gender: DemWomen 35% (147) 25% (106) 6% (24) 10% (43) 25% (104) 425PID/Gender: Ind Men 16% (43) 21% (60) 18% (50) 24% (69) 21% (58) 280PID/Gender: Ind Women 16% (40) 16% (40) 14% (34) 15% (37) 39% (97) 248PID/Gender: Rep Men 8% (24) 12% (37) 19% (58) 51% (158) 11% (33) 310PID/Gender: Rep Women 6% (21) 8% (32) 9% (34) 45% (173) 32% (124) 384Ideo: Liberal (1-3) 40% (229) 25% (143) 8% (47) 9% (51) 17% (95) 566Ideo: Moderate (4) 19% (108) 26% (144) 15% (84) 15% (83) 25% (140) 560Ideo: Conservative (5-7) 7% (53) 11% (80) 14% (103) 49% (359) 19% (136) 730Educ: < College 18% (218) 15% (183) 11% (138) 28% (335) 28% (332) 1206Educ: Bachelors degree 22% (109) 26% (128) 13% (63) 22% (108) 19% (93) 501Educ: Post-grad 26% (75) 24% (69) 14% (40) 22% (64) 15% (43) 290Income: Under 50k 19% (164) 15% (133) 13% (112) 24% (209) 29% (256) 873Income: 50k-100k 22% (163) 19% (141) 11% (82) 28% (204) 19% (138) 728Income: 100k+ 19% (75) 27% (107) 12% (47) 24% (95) 18% (74) 398Ethnicity: White 18% (281) 19% (290) 12% (185) 28% (438) 23% (350) 1544
Continued on next page
Page 248
248
Morning ConsultTable POL17_3
Table POL17_3: How responsible do you believe each of the following are for the events that led to a group of people attacking police and breakinginto the U.S. Capitol in Washington, D.C.?Sen. Ted Cruz
DemographicVery
responsibleSomewhatresponsible
Not tooresponsible
Not responsibleat all
Don’t know /No opinion Total N
Registered Voters 20% (402) 19% (380) 12% (241) 25% (508) 23% (468) 1998Ethnicity: Hispanic 21% (46) 21% (46) 18% (40) 14% (31) 27% (60) 222Ethnicity: Black 30% (76) 21% (53) 8% (20) 16% (39) 26% (65) 253Ethnicity: Other 23% (45) 18% (36) 18% (36) 15% (30) 26% (52) 201All Christian 16% (170) 20% (207) 12% (128) 32% (328) 20% (208) 1041All Non-Christian 34% (36) 30% (32) 10% (11) 9% (9) 17% (18) 107Atheist 32% (25) 38% (29) 11% (8) 12% (9) 7% (6) 78Agnostic/Nothing in particular 24% (115) 14% (68) 12% (57) 21% (101) 29% (138) 480Something Else 19% (56) 15% (43) 12% (36) 21% (60) 33% (97) 293Religious Non-Protestant/Catholic 29% (37) 30% (39) 9% (12) 14% (18) 18% (23) 129Evangelical 13% (67) 20% (98) 12% (58) 33% (166) 22% (109) 499Non-Evangelical 19% (151) 17% (136) 13% (104) 26% (208) 24% (190) 790Community: Urban 22% (106) 26% (126) 12% (59) 17% (84) 23% (112) 487Community: Suburban 21% (219) 19% (195) 12% (130) 26% (275) 21% (223) 1041Community: Rural 16% (77) 13% (59) 11% (51) 32% (149) 28% (133) 469Employ: Private Sector 20% (135) 22% (154) 12% (84) 25% (169) 21% (142) 684Employ: Government 17% (19) 26% (29) 13% (14) 16% (18) 28% (32) 112Employ: Self-Employed 22% (40) 23% (42) 15% (28) 23% (43) 16% (30) 183Employ: Homemaker 15% (15) 10% (10) 9% (10) 27% (28) 39% (40) 104Employ: Student 37% (25) 9% (6) 7% (5) 10% (7) 37% (25) 67Employ: Retired 20% (109) 17% (91) 11% (60) 35% (187) 16% (86) 534Employ: Unemployed 18% (34) 17% (32) 14% (27) 18% (34) 34% (64) 191Employ: Other 20% (24) 13% (16) 10% (13) 18% (22) 39% (48) 124Military HH: Yes 18% (57) 17% (54) 11% (33) 33% (102) 22% (69) 315Military HH: No 21% (345) 19% (326) 12% (207) 24% (405) 24% (399) 1683RD/WT: Right Direction 34% (256) 32% (239) 10% (74) 8% (58) 17% (130) 757RD/WT: Wrong Track 12% (146) 11% (141) 13% (166) 36% (450) 27% (338) 1241Biden Job Approve 35% (316) 30% (268) 10% (87) 8% (69) 18% (159) 899Biden Job Disapprove 8% (80) 10% (104) 14% (149) 42% (436) 26% (269) 1039
Continued on next page
Page 249
National Tracking Poll #2110084, October, 2021
249
Table POL17_3
Table POL17_3: How responsible do you believe each of the following are for the events that led to a group of people attacking police and breakinginto the U.S. Capitol in Washington, D.C.?Sen. Ted Cruz
DemographicVery
responsibleSomewhatresponsible
Not tooresponsible
Not responsibleat all
Don’t know /No opinion Total N
Registered Voters 20% (402) 19% (380) 12% (241) 25% (508) 23% (468) 1998Biden Job Strongly Approve 44% (184) 32% (134) 8% (32) 6% (26) 10% (42) 418Biden Job Somewhat Approve 27% (131) 28% (134) 11% (55) 9% (43) 24% (118) 481Biden Job Somewhat Disapprove 16% (41) 20% (51) 19% (46) 13% (32) 32% (80) 250Biden Job Strongly Disapprove 5% (40) 7% (53) 13% (103) 51% (404) 24% (189) 788Favorable of Biden 34% (318) 31% (283) 10% (92) 7% (64) 18% (168) 927Unfavorable of Biden 8% (80) 9% (90) 14% (146) 43% (439) 26% (264) 1019Very Favorable of Biden 43% (206) 30% (145) 7% (36) 6% (29) 13% (60) 476Somewhat Favorable of Biden 25% (112) 31% (139) 13% (57) 8% (36) 24% (108) 451Somewhat Unfavorable of Biden 18% (38) 18% (37) 19% (39) 14% (30) 31% (64) 207Very Unfavorable of Biden 5% (42) 7% (53) 13% (107) 50% (409) 25% (200) 812#1 Issue: Economy 14% (108) 19% (148) 14% (106) 26% (198) 27% (209) 768#1 Issue: Security 6% (21) 10% (36) 13% (46) 50% (181) 21% (75) 360#1 Issue: Health Care 33% (76) 29% (66) 8% (19) 10% (23) 20% (47) 231#1 Issue: Medicare / Social Security 28% (63) 22% (51) 12% (28) 19% (43) 19% (42) 227#1 Issue: Women’s Issues 41% (51) 17% (21) 4% (6) 17% (21) 21% (26) 125#1 Issue: Education 32% (19) 22% (13) 12% (7) 6% (4) 27% (16) 59#1 Issue: Energy 29% (31) 25% (27) 10% (11) 10% (10) 26% (28) 107#1 Issue: Other 27% (33) 15% (18) 15% (18) 23% (28) 20% (25) 1222020 Vote: Joe Biden 36% (344) 29% (274) 10% (95) 7% (62) 18% (171) 9462020 Vote: Donald Trump 4% (37) 9% (82) 15% (128) 48% (414) 23% (203) 8642020 Vote: Didn’t Vote 12% (18) 9% (14) 9% (13) 17% (26) 53% (82) 1532018 House Vote: Democrat 37% (281) 29% (226) 9% (71) 9% (67) 16% (123) 7692018 House Vote: Republican 6% (40) 11% (77) 15% (106) 50% (350) 18% (129) 7022016 Vote: Hillary Clinton 37% (255) 30% (202) 9% (61) 7% (48) 17% (118) 6852016 Vote: Donald Trump 6% (49) 12% (95) 16% (127) 47% (374) 20% (157) 8022016 Vote: Other 21% (18) 20% (16) 17% (15) 23% (19) 18% (15) 842016 Vote: Didn’t Vote 19% (79) 16% (66) 9% (37) 15% (63) 42% (177) 423Voted in 2014: Yes 22% (296) 21% (274) 11% (151) 29% (387) 17% (228) 1335Voted in 2014: No 16% (106) 16% (106) 14% (90) 18% (121) 36% (240) 663
Continued on next page
Page 250
250
Morning ConsultTable POL17_3
Table POL17_3: How responsible do you believe each of the following are for the events that led to a group of people attacking police and breakinginto the U.S. Capitol in Washington, D.C.?Sen. Ted Cruz
DemographicVery
responsibleSomewhatresponsible
Not tooresponsible
Not responsibleat all
Don’t know /No opinion Total N
Registered Voters 20% (402) 19% (380) 12% (241) 25% (508) 23% (468) 19984-Region: Northeast 20% (69) 23% (80) 14% (49) 20% (71) 24% (83) 3534-Region: Midwest 21% (95) 18% (80) 10% (46) 28% (125) 22% (99) 4444-Region: South 19% (143) 15% (112) 11% (85) 30% (222) 25% (183) 7464-Region: West 21% (95) 24% (107) 13% (60) 20% (90) 23% (103) 455Party: Democrat/Leans Democrat 35% (319) 28% (256) 9% (82) 9% (78) 20% (179) 914Party: Republican/Leans Republican 6% (48) 10% (81) 14% (109) 48% (384) 23% (185) 808Note: Row proportions may total to larger than one-hundred percent due to rounding. For more information visit MorningConsultIntelligence.com.
Page 251
National Tracking Poll #2110084, October, 2021
251
Table POL17_4
Table POL17_4: How responsible do you believe each of the following are for the events that led to a group of people attacking police and breakinginto the U.S. Capitol in Washington, D.C.?Sen. Josh Hawley
DemographicVery
responsibleSomewhatresponsible
Not tooresponsible
Not responsibleat all
Don’t know /No opinion Total N
Registered Voters 18% (358) 12% (241) 9% (176) 15% (300) 46% (923) 1998Gender: Male 19% (183) 16% (150) 11% (101) 18% (171) 36% (337) 942Gender: Female 17% (175) 9% (91) 7% (75) 12% (129) 55% (586) 1056Age: 18-34 15% (78) 14% (70) 12% (63) 11% (59) 48% (245) 514Age: 35-44 21% (65) 13% (40) 10% (30) 13% (39) 43% (133) 307Age: 45-64 18% (122) 10% (71) 9% (59) 17% (116) 46% (312) 679Age: 65+ 19% (94) 12% (61) 5% (23) 17% (87) 47% (233) 497GenZers: 1997-2012 16% (27) 8% (14) 16% (27) 7% (12) 53% (91) 170Millennials: 1981-1996 17% (93) 16% (90) 10% (53) 14% (76) 43% (240) 551GenXers: 1965-1980 19% (91) 10% (48) 10% (47) 16% (75) 44% (209) 469Baby Boomers: 1946-1964 18% (130) 11% (82) 6% (44) 16% (118) 49% (358) 732PID: Dem (no lean) 31% (241) 16% (122) 9% (69) 7% (55) 37% (291) 777PID: Ind (no lean) 13% (68) 12% (64) 8% (45) 15% (80) 51% (272) 528PID: Rep (no lean) 7% (49) 8% (56) 9% (63) 24% (165) 52% (360) 693PID/Gender: DemMen 36% (126) 20% (71) 11% (40) 8% (28) 25% (87) 352PID/Gender: DemWomen 27% (115) 12% (50) 7% (28) 6% (27) 48% (204) 425PID/Gender: Ind Men 11% (31) 16% (45) 9% (26) 17% (47) 47% (130) 280PID/Gender: Ind Women 15% (37) 7% (18) 8% (19) 13% (33) 57% (141) 248PID/Gender: Rep Men 8% (26) 11% (33) 11% (35) 31% (96) 39% (120) 310PID/Gender: Rep Women 6% (23) 6% (23) 7% (28) 18% (70) 63% (240) 384Ideo: Liberal (1-3) 34% (195) 17% (99) 6% (33) 7% (41) 35% (198) 566Ideo: Moderate (4) 18% (102) 14% (76) 12% (66) 12% (68) 44% (248) 560Ideo: Conservative (5-7) 7% (53) 8% (61) 8% (61) 25% (185) 51% (371) 730Educ: < College 15% (175) 10% (115) 9% (103) 16% (187) 52% (626) 1206Educ: Bachelors degree 23% (115) 13% (65) 9% (47) 13% (64) 42% (210) 501Educ: Post-grad 24% (69) 21% (61) 9% (25) 17% (48) 30% (87) 290Income: Under 50k 16% (136) 10% (87) 8% (68) 16% (137) 51% (444) 873Income: 50k-100k 18% (131) 12% (89) 8% (61) 14% (105) 47% (342) 728Income: 100k+ 23% (90) 17% (66) 12% (47) 14% (58) 34% (137) 398Ethnicity: White 16% (254) 12% (186) 9% (142) 16% (253) 46% (709) 1544
Continued on next page
Page 252
252
Morning ConsultTable POL17_4
Table POL17_4: How responsible do you believe each of the following are for the events that led to a group of people attacking police and breakinginto the U.S. Capitol in Washington, D.C.?Sen. Josh Hawley
DemographicVery
responsibleSomewhatresponsible
Not tooresponsible
Not responsibleat all
Don’t know /No opinion Total N
Registered Voters 18% (358) 12% (241) 9% (176) 15% (300) 46% (923) 1998Ethnicity: Hispanic 17% (37) 11% (24) 18% (39) 12% (28) 42% (94) 222Ethnicity: Black 26% (65) 15% (37) 6% (14) 11% (27) 44% (111) 253Ethnicity: Other 20% (40) 9% (19) 10% (19) 10% (20) 51% (103) 201All Christian 16% (171) 12% (126) 9% (96) 18% (190) 44% (459) 1041All Non-Christian 27% (29) 16% (17) 11% (12) 10% (10) 37% (39) 107Atheist 31% (24) 23% (18) 7% (5) 9% (7) 30% (23) 78Agnostic/Nothing in particular 21% (102) 9% (42) 9% (42) 11% (51) 51% (243) 480Something Else 11% (32) 14% (40) 7% (22) 14% (42) 54% (157) 293Religious Non-Protestant/Catholic 23% (29) 18% (24) 10% (12) 12% (16) 37% (48) 129Evangelical 13% (62) 14% (69) 8% (40) 21% (105) 45% (222) 499Non-Evangelical 17% (133) 11% (84) 9% (74) 15% (119) 48% (380) 790Community: Urban 24% (117) 17% (85) 8% (41) 12% (60) 38% (185) 487Community: Suburban 16% (166) 11% (116) 10% (103) 16% (164) 47% (492) 1041Community: Rural 16% (76) 9% (41) 7% (32) 16% (76) 52% (246) 469Employ: Private Sector 19% (132) 15% (106) 11% (72) 17% (118) 37% (256) 684Employ: Government 20% (22) 20% (22) 8% (9) 16% (18) 37% (42) 112Employ: Self-Employed 24% (44) 15% (27) 12% (23) 12% (22) 36% (67) 183Employ: Homemaker 18% (19) 6% (6) 7% (7) 7% (7) 62% (64) 104Employ: Student 15% (10) 5% (4) 19% (13) 8% (6) 53% (36) 67Employ: Retired 17% (91) 10% (55) 6% (31) 18% (95) 49% (261) 534Employ: Unemployed 12% (23) 8% (16) 7% (13) 10% (19) 63% (120) 191Employ: Other 14% (17) 5% (6) 6% (8) 12% (15) 63% (77) 124Military HH: Yes 16% (50) 12% (38) 5% (16) 17% (53) 50% (158) 315Military HH: No 18% (308) 12% (204) 10% (160) 15% (246) 45% (765) 1683RD/WT: Right Direction 31% (236) 19% (147) 8% (63) 8% (59) 33% (252) 757RD/WT: Wrong Track 10% (123) 8% (94) 9% (112) 19% (240) 54% (671) 1241Biden Job Approve 30% (271) 19% (169) 9% (80) 6% (57) 36% (321) 899Biden Job Disapprove 8% (82) 7% (69) 9% (92) 23% (239) 54% (557) 1039
Continued on next page
Page 253
National Tracking Poll #2110084, October, 2021
253
Table POL17_4
Table POL17_4: How responsible do you believe each of the following are for the events that led to a group of people attacking police and breakinginto the U.S. Capitol in Washington, D.C.?Sen. Josh Hawley
DemographicVery
responsibleSomewhatresponsible
Not tooresponsible
Not responsibleat all
Don’t know /No opinion Total N
Registered Voters 18% (358) 12% (241) 9% (176) 15% (300) 46% (923) 1998Biden Job Strongly Approve 40% (166) 20% (85) 9% (38) 6% (27) 24% (102) 418Biden Job Somewhat Approve 22% (106) 17% (83) 9% (42) 6% (30) 46% (220) 481Biden Job Somewhat Disapprove 14% (34) 10% (25) 12% (30) 10% (24) 55% (138) 250Biden Job Strongly Disapprove 6% (49) 6% (44) 8% (62) 27% (215) 53% (418) 788Favorable of Biden 31% (283) 19% (173) 9% (82) 6% (52) 36% (337) 927Unfavorable of Biden 7% (71) 6% (64) 9% (93) 24% (240) 54% (550) 1019Very Favorable of Biden 39% (187) 21% (98) 9% (41) 5% (25) 26% (125) 476Somewhat Favorable of Biden 21% (97) 17% (75) 9% (41) 6% (27) 47% (212) 451Somewhat Unfavorable of Biden 13% (26) 9% (18) 13% (27) 10% (21) 56% (115) 207Very Unfavorable of Biden 6% (45) 6% (46) 8% (66) 27% (219) 54% (435) 812#1 Issue: Economy 14% (107) 12% (92) 8% (64) 17% (128) 49% (378) 768#1 Issue: Security 7% (24) 8% (27) 12% (42) 22% (78) 53% (189) 360#1 Issue: Health Care 28% (64) 24% (54) 6% (14) 6% (14) 36% (84) 231#1 Issue: Medicare / Social Security 26% (59) 10% (24) 4% (9) 13% (30) 47% (105) 227#1 Issue: Women’s Issues 25% (31) 11% (14) 12% (15) 7% (9) 45% (57) 125#1 Issue: Education 23% (14) 12% (7) 14% (9) 9% (5) 42% (25) 59#1 Issue: Energy 25% (27) 15% (16) 10% (10) 14% (15) 36% (39) 107#1 Issue: Other 27% (33) 7% (8) 11% (14) 17% (20) 38% (47) 1222020 Vote: Joe Biden 31% (297) 17% (165) 9% (80) 6% (53) 37% (351) 9462020 Vote: Donald Trump 5% (43) 7% (61) 10% (83) 26% (224) 52% (453) 8642020 Vote: Didn’t Vote 10% (15) 7% (11) 7% (11) 13% (19) 63% (97) 1532018 House Vote: Democrat 33% (256) 18% (137) 8% (63) 6% (43) 35% (270) 7692018 House Vote: Republican 6% (44) 9% (63) 9% (66) 26% (183) 49% (345) 7022016 Vote: Hillary Clinton 34% (234) 18% (124) 7% (48) 6% (38) 35% (240) 6852016 Vote: Donald Trump 7% (55) 9% (75) 10% (81) 26% (206) 48% (384) 8022016 Vote: Other 18% (15) 16% (13) 6% (5) 13% (11) 47% (39) 842016 Vote: Didn’t Vote 13% (54) 7% (30) 10% (41) 10% (42) 61% (256) 423Voted in 2014: Yes 20% (272) 14% (189) 8% (109) 16% (208) 42% (557) 1335Voted in 2014: No 13% (86) 8% (53) 10% (67) 14% (92) 55% (365) 663
Continued on next page
Page 254
254
Morning ConsultTable POL17_4
Table POL17_4: How responsible do you believe each of the following are for the events that led to a group of people attacking police and breakinginto the U.S. Capitol in Washington, D.C.?Sen. Josh Hawley
DemographicVery
responsibleSomewhatresponsible
Not tooresponsible
Not responsibleat all
Don’t know /No opinion Total N
Registered Voters 18% (358) 12% (241) 9% (176) 15% (300) 46% (923) 19984-Region: Northeast 17% (60) 13% (44) 8% (29) 16% (55) 47% (164) 3534-Region: Midwest 20% (90) 11% (47) 8% (35) 16% (70) 46% (202) 4444-Region: South 17% (130) 12% (90) 9% (69) 16% (116) 46% (341) 7464-Region: West 17% (79) 13% (60) 9% (42) 13% (59) 47% (215) 455Party: Democrat/Leans Democrat 30% (275) 16% (149) 8% (74) 6% (59) 39% (357) 914Party: Republican/Leans Republican 6% (51) 8% (61) 9% (73) 25% (203) 52% (419) 808Note: Row proportions may total to larger than one-hundred percent due to rounding. For more information visit MorningConsultIntelligence.com.
Page 255
National Tracking Poll #2110084, October, 2021
255
Table POL17_5
Table POL17_5: How responsible do you believe each of the following are for the events that led to a group of people attacking police and breakinginto the U.S. Capitol in Washington, D.C.?Local law enforcement
DemographicVery
responsibleSomewhatresponsible
Not tooresponsible
Not responsibleat all
Don’t know /No opinion Total N
Registered Voters 14% (286) 24% (481) 19% (388) 27% (538) 15% (305) 1998Gender: Male 16% (146) 29% (270) 22% (203) 24% (227) 10% (96) 942Gender: Female 13% (140) 20% (211) 18% (185) 29% (311) 20% (209) 1056Age: 18-34 19% (97) 27% (141) 17% (86) 19% (95) 18% (95) 514Age: 35-44 17% (53) 27% (82) 17% (51) 23% (70) 16% (51) 307Age: 45-64 12% (85) 20% (136) 21% (141) 34% (232) 13% (86) 679Age: 65+ 10% (52) 25% (122) 22% (109) 28% (140) 15% (74) 497GenZers: 1997-2012 23% (38) 26% (44) 15% (25) 18% (30) 19% (33) 170Millennials: 1981-1996 18% (98) 29% (158) 17% (97) 20% (110) 16% (89) 551GenXers: 1965-1980 15% (70) 21% (98) 19% (87) 30% (143) 15% (71) 469Baby Boomers: 1946-1964 10% (74) 22% (163) 22% (160) 31% (230) 14% (104) 732PID: Dem (no lean) 15% (113) 27% (207) 21% (162) 27% (208) 11% (88) 777PID: Ind (no lean) 12% (62) 27% (140) 20% (104) 22% (114) 21% (108) 528PID: Rep (no lean) 16% (111) 19% (134) 18% (122) 31% (217) 16% (109) 693PID/Gender: DemMen 16% (58) 30% (106) 23% (81) 25% (87) 6% (22) 352PID/Gender: DemWomen 13% (56) 24% (101) 19% (81) 28% (121) 16% (66) 425PID/Gender: Ind Men 12% (33) 33% (93) 20% (57) 20% (55) 15% (42) 280PID/Gender: Ind Women 12% (29) 19% (47) 19% (48) 24% (59) 27% (66) 248PID/Gender: Rep Men 18% (56) 23% (72) 21% (65) 27% (85) 10% (32) 310PID/Gender: Rep Women 14% (55) 16% (63) 15% (56) 34% (131) 20% (78) 384Ideo: Liberal (1-3) 15% (83) 30% (172) 23% (132) 22% (126) 9% (53) 566Ideo: Moderate (4) 12% (67) 24% (137) 21% (118) 28% (154) 15% (84) 560Ideo: Conservative (5-7) 16% (118) 20% (146) 16% (117) 33% (244) 14% (105) 730Educ: < College 14% (174) 21% (251) 18% (219) 28% (336) 19% (227) 1206Educ: Bachelors degree 14% (71) 27% (135) 21% (103) 27% (137) 11% (55) 501Educ: Post-grad 14% (41) 33% (95) 23% (66) 22% (65) 8% (24) 290Income: Under 50k 15% (132) 23% (196) 19% (167) 26% (230) 17% (148) 873Income: 50k-100k 13% (93) 24% (177) 19% (138) 28% (204) 16% (116) 728Income: 100k+ 16% (62) 27% (107) 21% (83) 26% (104) 10% (42) 398Ethnicity: White 13% (208) 23% (359) 19% (301) 29% (441) 15% (235) 1544
Continued on next page
Page 256
256
Morning ConsultTable POL17_5
Table POL17_5: How responsible do you believe each of the following are for the events that led to a group of people attacking police and breakinginto the U.S. Capitol in Washington, D.C.?Local law enforcement
DemographicVery
responsibleSomewhatresponsible
Not tooresponsible
Not responsibleat all
Don’t know /No opinion Total N
Registered Voters 14% (286) 24% (481) 19% (388) 27% (538) 15% (305) 1998Ethnicity: Hispanic 19% (41) 22% (50) 15% (33) 26% (57) 19% (41) 222Ethnicity: Black 18% (47) 30% (77) 15% (39) 21% (54) 14% (37) 253Ethnicity: Other 16% (32) 22% (45) 24% (48) 21% (43) 17% (34) 201All Christian 14% (148) 21% (222) 19% (201) 31% (318) 15% (152) 1041All Non-Christian 21% (22) 20% (21) 18% (20) 33% (35) 8% (8) 107Atheist 9% (7) 42% (33) 22% (17) 20% (16) 7% (5) 78Agnostic/Nothing in particular 14% (65) 27% (131) 19% (89) 21% (103) 19% (92) 480Something Else 15% (44) 25% (73) 21% (61) 23% (66) 16% (48) 293Religious Non-Protestant/Catholic 18% (24) 23% (29) 18% (23) 31% (40) 9% (12) 129Evangelical 17% (83) 21% (105) 18% (92) 30% (149) 14% (70) 499Non-Evangelical 13% (103) 22% (174) 21% (164) 28% (225) 16% (125) 790Community: Urban 16% (79) 30% (145) 22% (105) 19% (92) 14% (67) 487Community: Suburban 14% (143) 25% (259) 19% (201) 27% (284) 15% (155) 1041Community: Rural 14% (65) 17% (78) 17% (81) 35% (163) 18% (84) 469Employ: Private Sector 14% (96) 27% (185) 19% (129) 27% (187) 13% (88) 684Employ: Government 16% (18) 35% (39) 25% (28) 18% (20) 7% (8) 112Employ: Self-Employed 17% (31) 23% (42) 24% (45) 26% (48) 9% (16) 183Employ: Homemaker 14% (15) 9% (9) 10% (10) 40% (41) 27% (28) 104Employ: Student 23% (16) 22% (15) 14% (10) 16% (11) 24% (16) 67Employ: Retired 12% (64) 24% (126) 21% (115) 29% (153) 14% (76) 534Employ: Unemployed 15% (28) 23% (44) 15% (29) 27% (51) 20% (38) 191Employ: Other 15% (18) 16% (20) 19% (23) 22% (27) 28% (34) 124Military HH: Yes 15% (48) 26% (83) 21% (66) 22% (69) 15% (49) 315Military HH: No 14% (238) 24% (398) 19% (322) 28% (469) 15% (257) 1683RD/WT: Right Direction 14% (103) 27% (205) 25% (189) 23% (177) 11% (83) 757RD/WT: Wrong Track 15% (183) 22% (276) 16% (199) 29% (361) 18% (222) 1241Biden Job Approve 14% (122) 27% (240) 24% (219) 24% (220) 11% (97) 899Biden Job Disapprove 15% (157) 21% (222) 16% (163) 30% (310) 18% (185) 1039
Continued on next page
Page 257
National Tracking Poll #2110084, October, 2021
257
Table POL17_5
Table POL17_5: How responsible do you believe each of the following are for the events that led to a group of people attacking police and breakinginto the U.S. Capitol in Washington, D.C.?Local law enforcement
DemographicVery
responsibleSomewhatresponsible
Not tooresponsible
Not responsibleat all
Don’t know /No opinion Total N
Registered Voters 14% (286) 24% (481) 19% (388) 27% (538) 15% (305) 1998Biden Job Strongly Approve 13% (56) 27% (114) 26% (109) 26% (108) 7% (31) 418Biden Job Somewhat Approve 14% (66) 26% (126) 23% (110) 23% (112) 14% (67) 481Biden Job Somewhat Disapprove 9% (22) 26% (66) 24% (60) 24% (59) 17% (43) 250Biden Job Strongly Disapprove 17% (135) 20% (156) 13% (103) 32% (251) 18% (143) 788Favorable of Biden 14% (129) 27% (255) 24% (221) 24% (226) 10% (96) 927Unfavorable of Biden 15% (154) 21% (213) 16% (161) 30% (306) 18% (184) 1019Very Favorable of Biden 15% (73) 27% (127) 24% (114) 25% (120) 9% (42) 476Somewhat Favorable of Biden 12% (56) 28% (128) 24% (107) 23% (106) 12% (54) 451Somewhat Unfavorable of Biden 10% (21) 20% (42) 26% (53) 26% (55) 18% (37) 207Very Unfavorable of Biden 16% (134) 21% (171) 13% (108) 31% (251) 18% (147) 812#1 Issue: Economy 13% (98) 25% (194) 20% (151) 27% (206) 16% (120) 768#1 Issue: Security 18% (66) 18% (64) 16% (56) 32% (116) 16% (58) 360#1 Issue: Health Care 15% (34) 27% (63) 23% (52) 18% (42) 17% (39) 231#1 Issue: Medicare / Social Security 11% (25) 23% (52) 17% (39) 36% (81) 13% (30) 227#1 Issue: Women’s Issues 19% (23) 31% (39) 24% (30) 19% (24) 7% (8) 125#1 Issue: Education 6% (4) 33% (20) 21% (13) 14% (8) 25% (15) 59#1 Issue: Energy 15% (16) 26% (28) 24% (25) 25% (27) 10% (11) 107#1 Issue: Other 17% (20) 18% (22) 17% (21) 28% (34) 20% (25) 1222020 Vote: Joe Biden 14% (128) 27% (255) 24% (224) 25% (236) 11% (104) 9462020 Vote: Donald Trump 15% (130) 21% (181) 16% (135) 32% (272) 17% (145) 8642020 Vote: Didn’t Vote 16% (25) 24% (37) 14% (21) 16% (25) 30% (46) 1532018 House Vote: Democrat 11% (86) 28% (217) 25% (194) 26% (197) 10% (75) 7692018 House Vote: Republican 16% (115) 22% (154) 18% (123) 29% (206) 15% (103) 7022016 Vote: Hillary Clinton 12% (80) 27% (186) 23% (161) 27% (185) 11% (73) 6852016 Vote: Donald Trump 16% (130) 21% (168) 18% (146) 30% (240) 15% (119) 8022016 Vote: Other 7% (6) 34% (28) 26% (22) 20% (17) 12% (10) 842016 Vote: Didn’t Vote 17% (70) 23% (98) 14% (57) 22% (94) 24% (103) 423Voted in 2014: Yes 14% (184) 25% (328) 22% (289) 28% (373) 12% (161) 1335Voted in 2014: No 15% (102) 23% (153) 15% (99) 25% (165) 22% (144) 663
Continued on next page
Page 258
258
Morning ConsultTable POL17_5
Table POL17_5: How responsible do you believe each of the following are for the events that led to a group of people attacking police and breakinginto the U.S. Capitol in Washington, D.C.?Local law enforcement
DemographicVery
responsibleSomewhatresponsible
Not tooresponsible
Not responsibleat all
Don’t know /No opinion Total N
Registered Voters 14% (286) 24% (481) 19% (388) 27% (538) 15% (305) 19984-Region: Northeast 10% (37) 27% (96) 16% (58) 31% (109) 15% (53) 3534-Region: Midwest 18% (81) 22% (96) 21% (91) 26% (114) 14% (62) 4444-Region: South 13% (99) 24% (178) 17% (124) 28% (206) 19% (139) 7464-Region: West 15% (70) 24% (111) 25% (115) 24% (108) 11% (51) 455Party: Democrat/Leans Democrat 15% (135) 28% (253) 22% (197) 25% (229) 11% (100) 914Party: Republican/Leans Republican 16% (125) 21% (168) 17% (137) 31% (251) 16% (127) 808Note: Row proportions may total to larger than one-hundred percent due to rounding. For more information visit MorningConsultIntelligence.com.
Page 259
National Tracking Poll #2110084, October, 2021
259
Table POL17_6
Table POL17_6: How responsible do you believe each of the following are for the events that led to a group of people attacking police and breakinginto the U.S. Capitol in Washington, D.C.?Defense Department
DemographicVery
responsibleSomewhatresponsible
Not tooresponsible
Not responsibleat all
Don’t know /No opinion Total N
Registered Voters 11% (230) 19% (387) 19% (372) 28% (553) 23% (457) 1998Gender: Male 13% (122) 21% (201) 19% (181) 32% (298) 15% (141) 942Gender: Female 10% (108) 18% (186) 18% (192) 24% (255) 30% (315) 1056Age: 18-34 16% (82) 24% (123) 18% (95) 14% (71) 28% (143) 514Age: 35-44 17% (53) 21% (64) 17% (52) 21% (66) 24% (73) 307Age: 45-64 9% (61) 17% (116) 18% (125) 35% (238) 20% (139) 679Age: 65+ 7% (33) 17% (83) 20% (101) 36% (178) 21% (102) 497GenZers: 1997-2012 13% (23) 22% (38) 20% (35) 10% (17) 34% (58) 170Millennials: 1981-1996 18% (101) 24% (133) 17% (92) 18% (98) 23% (128) 551GenXers: 1965-1980 11% (53) 17% (79) 16% (76) 33% (155) 23% (107) 469Baby Boomers: 1946-1964 7% (48) 17% (125) 21% (153) 34% (250) 21% (156) 732PID: Dem (no lean) 12% (89) 21% (163) 21% (167) 29% (222) 17% (136) 777PID: Ind (no lean) 9% (48) 18% (97) 20% (107) 24% (125) 28% (150) 528PID: Rep (no lean) 13% (92) 18% (126) 14% (98) 30% (206) 25% (171) 693PID/Gender: DemMen 14% (50) 23% (80) 20% (70) 32% (111) 11% (40) 352PID/Gender: DemWomen 9% (39) 20% (83) 23% (97) 26% (110) 22% (95) 425PID/Gender: Ind Men 9% (26) 22% (60) 20% (57) 28% (77) 21% (59) 280PID/Gender: Ind Women 9% (22) 15% (37) 20% (50) 19% (48) 37% (91) 248PID/Gender: Rep Men 15% (45) 19% (60) 17% (53) 35% (109) 13% (42) 310PID/Gender: Rep Women 12% (47) 17% (66) 12% (45) 25% (97) 34% (129) 384Ideo: Liberal (1-3) 13% (72) 21% (120) 25% (143) 23% (132) 17% (98) 566Ideo: Moderate (4) 9% (50) 18% (100) 19% (105) 32% (178) 23% (127) 560Ideo: Conservative (5-7) 14% (99) 19% (139) 15% (108) 32% (233) 21% (151) 730Educ: < College 12% (142) 19% (234) 17% (207) 24% (295) 27% (328) 1206Educ: Bachelors degree 12% (59) 19% (93) 21% (103) 32% (160) 17% (86) 501Educ: Post-grad 10% (29) 20% (59) 21% (62) 34% (98) 14% (42) 290Income: Under 50k 11% (98) 18% (161) 18% (160) 25% (219) 27% (235) 873Income: 50k-100k 13% (92) 19% (136) 17% (127) 31% (224) 20% (148) 728Income: 100k+ 10% (40) 22% (89) 22% (86) 27% (109) 19% (74) 398Ethnicity: White 10% (155) 19% (290) 20% (305) 28% (438) 23% (355) 1544
Continued on next page
Page 260
260
Morning ConsultTable POL17_6
Table POL17_6: How responsible do you believe each of the following are for the events that led to a group of people attacking police and breakinginto the U.S. Capitol in Washington, D.C.?Defense Department
DemographicVery
responsibleSomewhatresponsible
Not tooresponsible
Not responsibleat all
Don’t know /No opinion Total N
Registered Voters 11% (230) 19% (387) 19% (372) 28% (553) 23% (457) 1998Ethnicity: Hispanic 15% (32) 25% (55) 15% (33) 18% (41) 28% (61) 222Ethnicity: Black 16% (41) 21% (54) 13% (33) 30% (76) 20% (49) 253Ethnicity: Other 16% (33) 21% (43) 17% (34) 20% (40) 26% (52) 201All Christian 11% (118) 18% (186) 18% (187) 31% (322) 22% (229) 1041All Non-Christian 18% (20) 23% (24) 19% (20) 23% (25) 17% (18) 107Atheist 5% (4) 27% (21) 35% (27) 18% (14) 15% (12) 78Agnostic/Nothing in particular 11% (54) 19% (92) 17% (84) 26% (124) 26% (126) 480Something Else 12% (34) 22% (64) 19% (55) 23% (69) 25% (72) 293Religious Non-Protestant/Catholic 15% (20) 23% (30) 16% (21) 26% (34) 19% (25) 129Evangelical 13% (64) 24% (118) 15% (73) 30% (148) 19% (95) 499Non-Evangelical 11% (83) 15% (119) 21% (163) 29% (229) 25% (195) 790Community: Urban 17% (85) 24% (117) 19% (93) 23% (113) 16% (80) 487Community: Suburban 9% (93) 20% (206) 19% (201) 27% (284) 25% (257) 1041Community: Rural 11% (52) 14% (64) 17% (78) 33% (155) 26% (120) 469Employ: Private Sector 13% (89) 22% (149) 17% (114) 28% (192) 21% (140) 684Employ: Government 13% (14) 22% (24) 25% (28) 25% (28) 15% (17) 112Employ: Self-Employed 15% (27) 22% (40) 24% (43) 28% (51) 12% (22) 183Employ: Homemaker 11% (12) 19% (20) 15% (16) 20% (21) 34% (35) 104Employ: Student 10% (7) 28% (19) 21% (14) 6% (4) 35% (23) 67Employ: Retired 8% (44) 18% (94) 19% (101) 36% (194) 19% (100) 534Employ: Unemployed 13% (25) 15% (29) 15% (28) 20% (39) 37% (70) 191Employ: Other 10% (12) 10% (12) 22% (28) 19% (24) 39% (48) 124Military HH: Yes 11% (35) 19% (59) 19% (60) 29% (91) 22% (70) 315Military HH: No 12% (195) 19% (328) 19% (312) 27% (462) 23% (386) 1683RD/WT: Right Direction 13% (96) 20% (151) 23% (176) 27% (206) 17% (129) 757RD/WT: Wrong Track 11% (134) 19% (236) 16% (196) 28% (347) 26% (328) 1241Biden Job Approve 12% (105) 20% (182) 24% (214) 28% (249) 17% (149) 899Biden Job Disapprove 12% (120) 18% (189) 15% (152) 29% (299) 27% (278) 1039
Continued on next page
Page 261
National Tracking Poll #2110084, October, 2021
261
Table POL17_6
Table POL17_6: How responsible do you believe each of the following are for the events that led to a group of people attacking police and breakinginto the U.S. Capitol in Washington, D.C.?Defense Department
DemographicVery
responsibleSomewhatresponsible
Not tooresponsible
Not responsibleat all
Don’t know /No opinion Total N
Registered Voters 11% (230) 19% (387) 19% (372) 28% (553) 23% (457) 1998Biden Job Strongly Approve 13% (55) 20% (84) 23% (97) 30% (123) 14% (58) 418Biden Job Somewhat Approve 10% (50) 20% (98) 24% (117) 26% (125) 19% (90) 481Biden Job Somewhat Disapprove 8% (20) 22% (56) 20% (49) 25% (63) 25% (62) 250Biden Job Strongly Disapprove 13% (100) 17% (133) 13% (103) 30% (236) 27% (216) 788Favorable of Biden 11% (104) 21% (197) 23% (217) 27% (253) 17% (156) 927Unfavorable of Biden 12% (122) 17% (177) 15% (151) 29% (292) 27% (276) 1019Very Favorable of Biden 14% (69) 21% (100) 24% (115) 28% (131) 13% (61) 476Somewhat Favorable of Biden 8% (35) 21% (97) 23% (102) 27% (122) 21% (95) 451Somewhat Unfavorable of Biden 10% (21) 17% (34) 21% (44) 26% (54) 26% (53) 207Very Unfavorable of Biden 13% (102) 18% (143) 13% (107) 29% (238) 27% (222) 812#1 Issue: Economy 11% (83) 20% (155) 16% (121) 28% (212) 26% (196) 768#1 Issue: Security 17% (61) 13% (46) 16% (57) 32% (113) 23% (82) 360#1 Issue: Health Care 12% (28) 22% (51) 22% (51) 20% (46) 24% (55) 231#1 Issue: Medicare / Social Security 9% (20) 16% (36) 20% (46) 35% (80) 19% (44) 227#1 Issue: Women’s Issues 9% (11) 23% (29) 20% (26) 25% (31) 22% (28) 125#1 Issue: Education 5% (3) 26% (15) 32% (19) 16% (9) 21% (13) 59#1 Issue: Energy 10% (10) 25% (27) 28% (30) 24% (25) 14% (14) 107#1 Issue: Other 9% (11) 22% (27) 18% (22) 30% (37) 20% (25) 1222020 Vote: Joe Biden 10% (96) 21% (201) 23% (219) 29% (272) 17% (158) 9462020 Vote: Donald Trump 13% (114) 17% (147) 15% (127) 29% (253) 26% (223) 8642020 Vote: Didn’t Vote 12% (18) 19% (30) 15% (23) 14% (21) 41% (62) 1532018 House Vote: Democrat 10% (76) 21% (164) 23% (176) 31% (239) 15% (114) 7692018 House Vote: Republican 12% (86) 16% (115) 17% (120) 32% (226) 22% (155) 7022016 Vote: Hillary Clinton 9% (64) 19% (132) 23% (160) 32% (221) 16% (107) 6852016 Vote: Donald Trump 14% (110) 18% (140) 17% (133) 30% (242) 22% (177) 8022016 Vote: Other 7% (6) 21% (18) 19% (16) 32% (27) 20% (17) 842016 Vote: Didn’t Vote 12% (50) 23% (96) 14% (60) 14% (61) 37% (155) 423Voted in 2014: Yes 11% (145) 19% (248) 20% (267) 32% (428) 18% (247) 1335Voted in 2014: No 13% (85) 21% (139) 16% (105) 19% (124) 32% (210) 663
Continued on next page
Page 262
262
Morning ConsultTable POL17_6
Table POL17_6: How responsible do you believe each of the following are for the events that led to a group of people attacking police and breakinginto the U.S. Capitol in Washington, D.C.?Defense Department
DemographicVery
responsibleSomewhatresponsible
Not tooresponsible
Not responsibleat all
Don’t know /No opinion Total N
Registered Voters 11% (230) 19% (387) 19% (372) 28% (553) 23% (457) 19984-Region: Northeast 8% (27) 18% (63) 23% (81) 28% (99) 23% (82) 3534-Region: Midwest 12% (52) 22% (99) 19% (85) 27% (119) 20% (90) 4444-Region: South 13% (99) 18% (136) 15% (113) 29% (218) 24% (180) 7464-Region: West 11% (52) 20% (89) 20% (92) 26% (117) 23% (105) 455Party: Democrat/Leans Democrat 12% (106) 21% (193) 22% (200) 28% (252) 18% (163) 914Party: Republican/Leans Republican 12% (101) 18% (146) 15% (120) 30% (241) 25% (201) 808Note: Row proportions may total to larger than one-hundred percent due to rounding. For more information visit MorningConsultIntelligence.com.
Page 263
National Tracking Poll #2110084, October, 2021
263
Table POL17_7
Table POL17_7: How responsible do you believe each of the following are for the events that led to a group of people attacking police and breakinginto the U.S. Capitol in Washington, D.C.?Donald Trump
DemographicVery
responsibleSomewhatresponsible
Not tooresponsible
Not responsibleat all
Don’t know /No opinion Total N
Registered Voters 46% (928) 12% (235) 11% (212) 22% (446) 9% (175) 1998Gender: Male 46% (434) 15% (138) 13% (120) 21% (196) 6% (53) 942Gender: Female 47% (494) 9% (97) 9% (92) 24% (251) 12% (122) 1056Age: 18-34 49% (252) 14% (71) 9% (44) 14% (70) 15% (79) 514Age: 35-44 48% (148) 16% (50) 9% (28) 18% (56) 8% (25) 307Age: 45-64 44% (300) 10% (66) 14% (94) 25% (171) 7% (49) 679Age: 65+ 46% (230) 10% (48) 9% (46) 30% (150) 5% (23) 497GenZers: 1997-2012 55% (93) 5% (9) 8% (13) 13% (21) 20% (34) 170Millennials: 1981-1996 46% (254) 19% (104) 9% (49) 16% (86) 11% (58) 551GenXers: 1965-1980 47% (220) 9% (42) 15% (68) 21% (100) 8% (39) 469Baby Boomers: 1946-1964 45% (332) 9% (69) 10% (75) 29% (213) 6% (43) 732PID: Dem (no lean) 78% (605) 9% (70) 3% (24) 4% (34) 6% (45) 777PID: Ind (no lean) 44% (231) 12% (62) 12% (63) 18% (95) 14% (76) 528PID: Rep (no lean) 13% (93) 15% (104) 18% (125) 46% (317) 8% (54) 693PID/Gender: DemMen 76% (268) 12% (41) 6% (21) 3% (9) 3% (12) 352PID/Gender: DemWomen 79% (337) 7% (28) 1% (3) 6% (25) 8% (32) 425PID/Gender: Ind Men 41% (113) 14% (39) 14% (40) 20% (57) 11% (30) 280PID/Gender: Ind Women 48% (118) 9% (23) 9% (23) 15% (38) 19% (46) 248PID/Gender: Rep Men 17% (53) 19% (58) 19% (59) 42% (129) 4% (11) 310PID/Gender: Rep Women 10% (40) 12% (46) 17% (66) 49% (188) 11% (43) 384Ideo: Liberal (1-3) 80% (455) 8% (44) 4% (25) 3% (14) 5% (27) 566Ideo: Moderate (4) 55% (310) 15% (82) 9% (52) 13% (74) 7% (42) 560Ideo: Conservative (5-7) 16% (116) 13% (97) 17% (127) 46% (338) 7% (52) 730Educ: < College 42% (503) 10% (120) 10% (125) 27% (320) 11% (138) 1206Educ: Bachelors degree 55% (275) 12% (62) 11% (56) 17% (84) 5% (24) 501Educ: Post-grad 52% (150) 18% (53) 11% (31) 15% (43) 5% (13) 290Income: Under 50k 45% (389) 11% (95) 9% (81) 23% (201) 12% (107) 873Income: 50k-100k 49% (354) 10% (74) 11% (81) 24% (173) 6% (46) 728Income: 100k+ 47% (185) 17% (67) 13% (50) 18% (72) 6% (23) 398Ethnicity: White 42% (654) 13% (194) 12% (181) 25% (387) 8% (128) 1544
Continued on next page
Page 264
264
Morning ConsultTable POL17_7
Table POL17_7: How responsible do you believe each of the following are for the events that led to a group of people attacking police and breakinginto the U.S. Capitol in Washington, D.C.?Donald Trump
DemographicVery
responsibleSomewhatresponsible
Not tooresponsible
Not responsibleat all
Don’t know /No opinion Total N
Registered Voters 46% (928) 12% (235) 11% (212) 22% (446) 9% (175) 1998Ethnicity: Hispanic 53% (118) 13% (30) 7% (16) 16% (35) 11% (24) 222Ethnicity: Black 64% (163) 7% (17) 4% (9) 13% (34) 12% (31) 253Ethnicity: Other 56% (112) 12% (24) 11% (22) 13% (25) 8% (17) 201All Christian 39% (410) 14% (149) 12% (125) 27% (281) 7% (76) 1041All Non-Christian 67% (71) 12% (13) 9% (10) 8% (9) 4% (4) 107Atheist 73% (57) 13% (10) 5% (4) 9% (7) 1% (0) 78Agnostic/Nothing in particular 52% (250) 9% (45) 9% (45) 18% (84) 12% (56) 480Something Else 48% (142) 6% (18) 10% (29) 22% (66) 13% (38) 293Religious Non-Protestant/Catholic 61% (78) 15% (19) 8% (10) 11% (15) 5% (7) 129Evangelical 36% (178) 12% (62) 12% (62) 32% (159) 8% (38) 499Non-Evangelical 45% (359) 12% (92) 11% (88) 23% (178) 9% (72) 790Community: Urban 53% (258) 14% (69) 9% (42) 14% (70) 10% (48) 487Community: Suburban 48% (505) 11% (117) 11% (114) 22% (229) 7% (76) 1041Community: Rural 35% (166) 11% (50) 12% (56) 31% (147) 11% (51) 469Employ: Private Sector 44% (304) 16% (107) 12% (85) 21% (142) 7% (46) 684Employ: Government 60% (67) 13% (14) 7% (8) 15% (17) 6% (6) 112Employ: Self-Employed 42% (77) 14% (25) 18% (33) 17% (30) 9% (17) 183Employ: Homemaker 36% (38) 12% (13) 8% (8) 29% (31) 15% (15) 104Employ: Student 60% (40) 5% (4) 8% (5) 7% (5) 20% (14) 67Employ: Retired 45% (238) 9% (46) 9% (50) 32% (171) 5% (29) 534Employ: Unemployed 57% (108) 7% (14) 10% (18) 15% (28) 12% (23) 191Employ: Other 46% (57) 11% (14) 4% (5) 19% (23) 20% (25) 124Military HH: Yes 41% (129) 14% (45) 9% (29) 30% (93) 6% (18) 315Military HH: No 47% (799) 11% (190) 11% (184) 21% (353) 9% (157) 1683RD/WT: Right Direction 75% (565) 11% (80) 4% (31) 5% (40) 5% (41) 757RD/WT: Wrong Track 29% (364) 13% (155) 15% (181) 33% (406) 11% (134) 1241Biden Job Approve 78% (705) 9% (82) 4% (36) 4% (32) 5% (43) 899Biden Job Disapprove 19% (197) 15% (152) 17% (174) 40% (411) 10% (105) 1039
Continued on next page
Page 265
National Tracking Poll #2110084, October, 2021
265
Table POL17_7
Table POL17_7: How responsible do you believe each of the following are for the events that led to a group of people attacking police and breakinginto the U.S. Capitol in Washington, D.C.?Donald Trump
DemographicVery
responsibleSomewhatresponsible
Not tooresponsible
Not responsibleat all
Don’t know /No opinion Total N
Registered Voters 46% (928) 12% (235) 11% (212) 22% (446) 9% (175) 1998Biden Job Strongly Approve 81% (339) 10% (40) 4% (16) 3% (13) 2% (9) 418Biden Job Somewhat Approve 76% (366) 9% (42) 4% (20) 4% (19) 7% (34) 481Biden Job Somewhat Disapprove 49% (122) 21% (53) 11% (28) 10% (25) 9% (22) 250Biden Job Strongly Disapprove 9% (75) 13% (99) 19% (146) 49% (386) 11% (83) 788Favorable of Biden 79% (734) 9% (88) 4% (32) 3% (29) 5% (44) 927Unfavorable of Biden 18% (185) 14% (146) 17% (176) 40% (408) 10% (104) 1019Very Favorable of Biden 80% (382) 10% (46) 2% (11) 3% (14) 5% (23) 476Somewhat Favorable of Biden 78% (352) 9% (41) 5% (22) 3% (15) 5% (21) 451Somewhat Unfavorable of Biden 47% (98) 20% (42) 13% (26) 9% (19) 11% (22) 207Very Unfavorable of Biden 11% (87) 13% (104) 18% (149) 48% (389) 10% (82) 812#1 Issue: Economy 40% (310) 15% (118) 12% (90) 22% (172) 10% (78) 768#1 Issue: Security 19% (69) 10% (37) 17% (62) 46% (164) 8% (27) 360#1 Issue: Health Care 64% (148) 16% (37) 7% (15) 8% (17) 6% (14) 231#1 Issue: Medicare / Social Security 64% (144) 8% (19) 6% (13) 17% (39) 5% (12) 227#1 Issue: Women’s Issues 75% (94) 7% (8) 4% (5) 8% (10) 6% (8) 125#1 Issue: Education 55% (32) 9% (5) 4% (2) 3% (2) 29% (17) 59#1 Issue: Energy 67% (72) 8% (8) 8% (8) 10% (10) 8% (8) 107#1 Issue: Other 49% (60) 2% (3) 13% (16) 26% (32) 9% (11) 1222020 Vote: Joe Biden 81% (763) 9% (82) 3% (25) 3% (29) 5% (48) 9462020 Vote: Donald Trump 10% (87) 15% (125) 20% (171) 45% (389) 11% (91) 8642020 Vote: Didn’t Vote 41% (63) 14% (22) 9% (13) 17% (26) 19% (29) 1532018 House Vote: Democrat 79% (606) 9% (66) 3% (21) 5% (37) 5% (39) 7692018 House Vote: Republican 15% (107) 14% (100) 19% (137) 44% (311) 7% (46) 7022016 Vote: Hillary Clinton 81% (553) 8% (53) 3% (18) 4% (28) 5% (32) 6852016 Vote: Donald Trump 16% (129) 16% (126) 18% (144) 43% (346) 7% (58) 8022016 Vote: Other 56% (47) 12% (10) 12% (10) 10% (9) 10% (8) 842016 Vote: Didn’t Vote 47% (197) 11% (46) 9% (40) 15% (62) 18% (77) 423Voted in 2014: Yes 48% (636) 12% (156) 11% (144) 24% (322) 6% (76) 1335Voted in 2014: No 44% (292) 12% (79) 10% (68) 19% (125) 15% (99) 663
Continued on next page
Page 266
266
Morning ConsultTable POL17_7
Table POL17_7: How responsible do you believe each of the following are for the events that led to a group of people attacking police and breakinginto the U.S. Capitol in Washington, D.C.?Donald Trump
DemographicVery
responsibleSomewhatresponsible
Not tooresponsible
Not responsibleat all
Don’t know /No opinion Total N
Registered Voters 46% (928) 12% (235) 11% (212) 22% (446) 9% (175) 19984-Region: Northeast 48% (169) 14% (48) 10% (36) 19% (66) 10% (34) 3534-Region: Midwest 51% (227) 9% (41) 7% (29) 27% (120) 6% (27) 4444-Region: South 38% (282) 13% (97) 12% (91) 26% (194) 11% (81) 7464-Region: West 55% (251) 11% (49) 12% (55) 15% (67) 7% (33) 455Party: Democrat/Leans Democrat 78% (712) 9% (81) 3% (29) 5% (44) 5% (49) 914Party: Republican/Leans Republican 14% (112) 15% (120) 18% (146) 45% (361) 9% (69) 808Note: Row proportions may total to larger than one-hundred percent due to rounding. For more information visit MorningConsultIntelligence.com.
Page 267
National Tracking Poll #2110084, October, 2021
267
Table POL17_8
Table POL17_8: How responsible do you believe each of the following are for the events that led to a group of people attacking police and breakinginto the U.S. Capitol in Washington, D.C.?Mike Pence
DemographicVery
responsibleSomewhatresponsible
Not tooresponsible
Not responsibleat all
Don’t know /No opinion Total N
Registered Voters 13% (252) 21% (413) 17% (343) 32% (639) 18% (351) 1998Gender: Male 13% (120) 21% (202) 21% (199) 33% (314) 11% (107) 942Gender: Female 12% (132) 20% (211) 14% (144) 31% (324) 23% (244) 1056Age: 18-34 20% (102) 22% (113) 17% (85) 15% (76) 27% (139) 514Age: 35-44 17% (53) 24% (74) 16% (49) 21% (64) 22% (67) 307Age: 45-64 7% (48) 21% (139) 18% (123) 40% (271) 14% (97) 679Age: 65+ 10% (49) 17% (86) 17% (86) 46% (228) 10% (48) 497GenZers: 1997-2012 25% (42) 14% (23) 14% (25) 12% (20) 35% (60) 170Millennials: 1981-1996 18% (97) 26% (142) 17% (92) 18% (100) 22% (121) 551GenXers: 1965-1980 9% (42) 20% (94) 20% (96) 33% (154) 18% (84) 469Baby Boomers: 1946-1964 8% (60) 20% (143) 17% (121) 44% (325) 11% (82) 732PID: Dem (no lean) 21% (161) 28% (214) 20% (155) 18% (136) 14% (110) 777PID: Ind (no lean) 10% (53) 19% (102) 18% (97) 28% (148) 24% (127) 528PID: Rep (no lean) 5% (38) 14% (96) 13% (90) 51% (354) 17% (115) 693PID/Gender: DemMen 23% (79) 27% (94) 26% (91) 15% (52) 10% (36) 352PID/Gender: DemWomen 19% (82) 28% (121) 15% (64) 20% (84) 17% (74) 425PID/Gender: Ind Men 8% (23) 22% (61) 22% (63) 32% (90) 15% (43) 280PID/Gender: Ind Women 12% (30) 17% (41) 14% (35) 24% (59) 34% (83) 248PID/Gender: Rep Men 6% (18) 15% (46) 14% (45) 56% (172) 9% (28) 310PID/Gender: Rep Women 5% (20) 13% (50) 12% (45) 47% (182) 23% (87) 384Ideo: Liberal (1-3) 25% (139) 29% (164) 19% (108) 14% (79) 13% (75) 566Ideo: Moderate (4) 11% (63) 24% (132) 22% (125) 28% (156) 15% (84) 560Ideo: Conservative (5-7) 5% (35) 14% (100) 14% (101) 54% (392) 14% (102) 730Educ: < College 12% (142) 20% (236) 14% (170) 33% (398) 22% (261) 1206Educ: Bachelors degree 13% (65) 22% (109) 20% (101) 32% (162) 13% (64) 501Educ: Post-grad 15% (45) 23% (68) 25% (72) 27% (79) 9% (26) 290Income: Under 50k 12% (102) 21% (181) 16% (142) 28% (244) 23% (204) 873Income: 50k-100k 14% (103) 18% (133) 17% (120) 38% (276) 13% (95) 728Income: 100k+ 12% (47) 25% (98) 20% (80) 30% (119) 13% (52) 398Ethnicity: White 11% (166) 19% (298) 17% (264) 36% (557) 17% (258) 1544
Continued on next page
Page 268
268
Morning ConsultTable POL17_8
Table POL17_8: How responsible do you believe each of the following are for the events that led to a group of people attacking police and breakinginto the U.S. Capitol in Washington, D.C.?Mike Pence
DemographicVery
responsibleSomewhatresponsible
Not tooresponsible
Not responsibleat all
Don’t know /No opinion Total N
Registered Voters 13% (252) 21% (413) 17% (343) 32% (639) 18% (351) 1998Ethnicity: Hispanic 17% (39) 30% (67) 11% (24) 19% (43) 22% (50) 222Ethnicity: Black 18% (46) 22% (56) 21% (53) 19% (47) 20% (51) 253Ethnicity: Other 20% (40) 29% (59) 13% (26) 17% (35) 21% (42) 201All Christian 9% (99) 19% (202) 17% (176) 40% (415) 14% (150) 1041All Non-Christian 25% (27) 26% (28) 14% (15) 21% (22) 14% (15) 107Atheist 20% (15) 25% (20) 24% (18) 25% (20) 6% (5) 78Agnostic/Nothing in particular 17% (83) 20% (94) 19% (92) 21% (101) 23% (110) 480Something Else 10% (29) 24% (69) 14% (41) 28% (82) 25% (72) 293Religious Non-Protestant/Catholic 21% (28) 25% (32) 14% (18) 24% (30) 16% (21) 129Evangelical 9% (46) 21% (103) 16% (81) 37% (185) 17% (84) 499Non-Evangelical 10% (78) 20% (155) 16% (128) 38% (299) 16% (130) 790Community: Urban 16% (80) 28% (135) 18% (86) 20% (99) 18% (88) 487Community: Suburban 11% (110) 19% (201) 19% (195) 34% (353) 17% (182) 1041Community: Rural 13% (62) 16% (77) 13% (62) 40% (187) 17% (82) 469Employ: Private Sector 12% (84) 23% (157) 19% (131) 31% (210) 15% (103) 684Employ: Government 10% (11) 26% (29) 20% (22) 27% (30) 18% (20) 112Employ: Self-Employed 13% (23) 25% (47) 23% (43) 21% (39) 17% (32) 183Employ: Homemaker 10% (11) 20% (21) 14% (15) 27% (28) 28% (29) 104Employ: Student 28% (19) 18% (12) 20% (13) 11% (8) 23% (16) 67Employ: Retired 9% (46) 18% (94) 15% (82) 47% (252) 11% (59) 534Employ: Unemployed 14% (27) 19% (36) 12% (22) 25% (48) 30% (57) 191Employ: Other 26% (32) 14% (17) 12% (15) 19% (24) 29% (36) 124Military HH: Yes 12% (37) 16% (52) 18% (56) 39% (123) 15% (47) 315Military HH: No 13% (215) 21% (361) 17% (287) 31% (516) 18% (305) 1683RD/WT: Right Direction 19% (145) 29% (219) 21% (158) 18% (137) 13% (99) 757RD/WT: Wrong Track 9% (107) 16% (194) 15% (185) 40% (502) 20% (253) 1241Biden Job Approve 20% (179) 30% (269) 21% (189) 17% (151) 12% (111) 899Biden Job Disapprove 6% (65) 14% (141) 14% (147) 47% (485) 19% (201) 1039
Continued on next page
Page 269
National Tracking Poll #2110084, October, 2021
269
Table POL17_8
Table POL17_8: How responsible do you believe each of the following are for the events that led to a group of people attacking police and breakinginto the U.S. Capitol in Washington, D.C.?Mike Pence
DemographicVery
responsibleSomewhatresponsible
Not tooresponsible
Not responsibleat all
Don’t know /No opinion Total N
Registered Voters 13% (252) 21% (413) 17% (343) 32% (639) 18% (351) 1998Biden Job Strongly Approve 25% (103) 32% (132) 22% (91) 15% (63) 7% (28) 418Biden Job Somewhat Approve 16% (76) 28% (136) 20% (98) 18% (88) 17% (83) 481Biden Job Somewhat Disapprove 11% (29) 19% (48) 20% (51) 26% (66) 23% (57) 250Biden Job Strongly Disapprove 5% (36) 12% (93) 12% (96) 53% (419) 18% (144) 788Favorable of Biden 20% (186) 30% (278) 20% (190) 17% (153) 13% (120) 927Unfavorable of Biden 6% (64) 13% (132) 15% (149) 47% (477) 19% (197) 1019Very Favorable of Biden 25% (118) 34% (161) 19% (92) 13% (64) 8% (40) 476Somewhat Favorable of Biden 15% (68) 26% (117) 22% (98) 20% (89) 18% (80) 451Somewhat Unfavorable of Biden 13% (28) 15% (31) 23% (48) 28% (58) 21% (43) 207Very Unfavorable of Biden 4% (36) 12% (100) 13% (102) 52% (419) 19% (155) 812#1 Issue: Economy 9% (68) 20% (155) 17% (128) 34% (259) 21% (158) 768#1 Issue: Security 7% (24) 11% (40) 17% (62) 48% (174) 16% (59) 360#1 Issue: Health Care 19% (43) 27% (62) 22% (50) 15% (35) 17% (40) 231#1 Issue: Medicare / Social Security 15% (33) 20% (46) 15% (35) 39% (88) 11% (25) 227#1 Issue: Women’s Issues 31% (39) 23% (29) 14% (18) 14% (17) 17% (22) 125#1 Issue: Education 22% (13) 31% (18) 6% (4) 15% (9) 26% (16) 59#1 Issue: Energy 20% (22) 31% (33) 18% (20) 18% (19) 12% (13) 107#1 Issue: Other 8% (10) 24% (29) 22% (27) 30% (37) 16% (19) 1222020 Vote: Joe Biden 21% (198) 28% (262) 22% (206) 17% (159) 13% (121) 9462020 Vote: Donald Trump 4% (32) 14% (122) 13% (116) 51% (445) 17% (148) 8642020 Vote: Didn’t Vote 12% (19) 16% (24) 9% (14) 17% (25) 46% (70) 1532018 House Vote: Democrat 20% (151) 30% (230) 22% (168) 17% (130) 12% (89) 7692018 House Vote: Republican 4% (29) 14% (97) 14% (102) 55% (382) 13% (91) 7022016 Vote: Hillary Clinton 20% (136) 31% (212) 22% (148) 15% (104) 12% (85) 6852016 Vote: Donald Trump 5% (40) 16% (127) 15% (120) 51% (409) 13% (106) 8022016 Vote: Other 11% (10) 11% (10) 26% (22) 37% (31) 14% (12) 842016 Vote: Didn’t Vote 16% (66) 15% (65) 12% (53) 22% (91) 35% (148) 423Voted in 2014: Yes 12% (160) 23% (300) 18% (239) 36% (478) 12% (158) 1335Voted in 2014: No 14% (92) 17% (113) 16% (104) 24% (161) 29% (194) 663
Continued on next page
Page 270
270
Morning ConsultTable POL17_8
Table POL17_8: How responsible do you believe each of the following are for the events that led to a group of people attacking police and breakinginto the U.S. Capitol in Washington, D.C.?Mike Pence
DemographicVery
responsibleSomewhatresponsible
Not tooresponsible
Not responsibleat all
Don’t know /No opinion Total N
Registered Voters 13% (252) 21% (413) 17% (343) 32% (639) 18% (351) 19984-Region: Northeast 9% (31) 23% (82) 22% (76) 32% (114) 14% (50) 3534-Region: Midwest 16% (70) 19% (85) 16% (69) 32% (142) 18% (79) 4444-Region: South 11% (79) 18% (137) 16% (118) 36% (265) 20% (147) 7464-Region: West 16% (72) 24% (110) 18% (80) 26% (118) 17% (75) 455Party: Democrat/Leans Democrat 21% (188) 28% (255) 21% (192) 17% (154) 14% (126) 914Party: Republican/Leans Republican 5% (38) 13% (107) 14% (110) 51% (414) 17% (140) 808Note: Row proportions may total to larger than one-hundred percent due to rounding. For more information visit MorningConsultIntelligence.com.
Page 271
National Tracking Poll #2110084, October, 2021
271
Table POL17_9
Table POL17_9: How responsible do you believe each of the following are for the events that led to a group of people attacking police and breakinginto the U.S. Capitol in Washington, D.C.?President Joe Biden
DemographicVery
responsibleSomewhatresponsible
Not tooresponsible
Not responsibleat all
Don’t know /No opinion Total N
Registered Voters 17% (335) 10% (209) 11% (229) 47% (946) 14% (280) 1998Gender: Male 17% (162) 12% (113) 12% (110) 48% (454) 11% (103) 942Gender: Female 16% (172) 9% (95) 11% (119) 47% (492) 17% (177) 1056Age: 18-34 18% (92) 13% (64) 15% (76) 39% (202) 16% (80) 514Age: 35-44 19% (60) 11% (33) 11% (33) 44% (134) 15% (47) 307Age: 45-64 17% (113) 9% (59) 10% (69) 51% (348) 13% (90) 679Age: 65+ 14% (70) 10% (52) 10% (51) 53% (262) 13% (62) 497GenZers: 1997-2012 15% (26) 9% (16) 20% (34) 35% (60) 20% (34) 170Millennials: 1981-1996 20% (110) 13% (74) 12% (65) 42% (230) 13% (71) 551GenXers: 1965-1980 17% (80) 9% (41) 10% (49) 49% (229) 15% (70) 469Baby Boomers: 1946-1964 15% (110) 9% (68) 10% (74) 52% (382) 13% (98) 732PID: Dem (no lean) 7% (56) 6% (47) 8% (65) 70% (547) 8% (62) 777PID: Ind (no lean) 13% (68) 9% (47) 14% (72) 43% (229) 21% (111) 528PID: Rep (no lean) 30% (210) 17% (115) 13% (92) 25% (170) 15% (107) 693PID/Gender: DemMen 8% (30) 8% (27) 9% (33) 68% (241) 6% (21) 352PID/Gender: DemWomen 6% (26) 5% (20) 7% (32) 72% (306) 10% (41) 425PID/Gender: Ind Men 16% (44) 13% (38) 12% (34) 42% (118) 16% (46) 280PID/Gender: Ind Women 10% (24) 4% (9) 15% (38) 45% (111) 27% (66) 248PID/Gender: Rep Men 28% (88) 16% (48) 14% (42) 31% (95) 12% (36) 310PID/Gender: Rep Women 32% (122) 17% (66) 13% (49) 20% (75) 18% (71) 384Ideo: Liberal (1-3) 8% (48) 5% (27) 9% (51) 72% (408) 6% (31) 566Ideo: Moderate (4) 10% (55) 11% (60) 15% (83) 52% (290) 13% (72) 560Ideo: Conservative (5-7) 29% (212) 15% (113) 10% (75) 30% (220) 15% (111) 730Educ: < College 19% (226) 10% (122) 11% (136) 43% (515) 17% (207) 1206Educ: Bachelors degree 13% (63) 10% (52) 11% (57) 56% (280) 10% (48) 501Educ: Post-grad 16% (46) 12% (34) 12% (36) 52% (150) 8% (25) 290Income: Under 50k 18% (158) 10% (92) 12% (101) 45% (392) 15% (130) 873Income: 50k-100k 16% (117) 9% (66) 10% (75) 49% (359) 15% (110) 728Income: 100k+ 15% (59) 13% (51) 13% (53) 49% (194) 10% (40) 398Ethnicity: White 18% (271) 11% (175) 12% (185) 45% (701) 14% (212) 1544
Continued on next page
Page 272
272
Morning ConsultTable POL17_9
Table POL17_9: How responsible do you believe each of the following are for the events that led to a group of people attacking police and breakinginto the U.S. Capitol in Washington, D.C.?President Joe Biden
DemographicVery
responsibleSomewhatresponsible
Not tooresponsible
Not responsibleat all
Don’t know /No opinion Total N
Registered Voters 17% (335) 10% (209) 11% (229) 47% (946) 14% (280) 1998Ethnicity: Hispanic 18% (40) 11% (25) 14% (30) 41% (91) 16% (36) 222Ethnicity: Black 11% (28) 6% (15) 8% (20) 59% (149) 16% (40) 253Ethnicity: Other 18% (35) 9% (19) 12% (24) 47% (95) 14% (27) 201All Christian 18% (188) 13% (135) 12% (122) 44% (461) 13% (135) 1041All Non-Christian 14% (14) 10% (10) 7% (8) 61% (65) 8% (9) 107Atheist 8% (7) 8% (6) 17% (13) 64% (49) 3% (2) 78Agnostic/Nothing in particular 16% (75) 7% (32) 10% (50) 50% (239) 17% (83) 480Something Else 17% (51) 8% (25) 12% (35) 45% (131) 17% (51) 293Religious Non-Protestant/Catholic 13% (16) 10% (13) 9% (11) 57% (73) 11% (15) 129Evangelical 23% (115) 15% (76) 9% (46) 39% (192) 14% (70) 499Non-Evangelical 15% (117) 9% (73) 13% (104) 49% (389) 14% (107) 790Community: Urban 18% (90) 13% (65) 13% (63) 45% (219) 10% (51) 487Community: Suburban 12% (129) 9% (94) 12% (126) 53% (547) 14% (146) 1041Community: Rural 25% (116) 11% (50) 9% (40) 38% (180) 18% (83) 469Employ: Private Sector 16% (112) 14% (94) 11% (75) 47% (319) 12% (84) 684Employ: Government 11% (13) 10% (11) 18% (20) 53% (60) 7% (8) 112Employ: Self-Employed 17% (32) 13% (23) 17% (31) 42% (76) 11% (20) 183Employ: Homemaker 28% (29) 4% (4) 6% (6) 34% (35) 29% (30) 104Employ: Student 7% (5) 10% (7) 22% (15) 38% (26) 23% (15) 67Employ: Retired 16% (86) 10% (51) 8% (43) 54% (287) 12% (66) 534Employ: Unemployed 18% (35) 4% (8) 13% (24) 49% (93) 16% (31) 191Employ: Other 19% (23) 7% (9) 12% (14) 41% (51) 21% (26) 124Military HH: Yes 20% (63) 11% (34) 10% (32) 45% (142) 14% (44) 315Military HH: No 16% (271) 10% (175) 12% (197) 48% (804) 14% (236) 1683RD/WT: Right Direction 10% (73) 6% (48) 10% (79) 67% (507) 7% (50) 757RD/WT: Wrong Track 21% (262) 13% (161) 12% (150) 35% (438) 19% (230) 1241Biden Job Approve 7% (59) 7% (61) 9% (84) 71% (639) 6% (56) 899Biden Job Disapprove 26% (273) 14% (146) 13% (138) 28% (294) 18% (190) 1039
Continued on next page
Page 273
National Tracking Poll #2110084, October, 2021
273
Table POL17_9
Table POL17_9: How responsible do you believe each of the following are for the events that led to a group of people attacking police and breakinginto the U.S. Capitol in Washington, D.C.?President Joe Biden
DemographicVery
responsibleSomewhatresponsible
Not tooresponsible
Not responsibleat all
Don’t know /No opinion Total N
Registered Voters 17% (335) 10% (209) 11% (229) 47% (946) 14% (280) 1998Biden Job Strongly Approve 9% (39) 5% (23) 6% (27) 76% (319) 3% (11) 418Biden Job Somewhat Approve 4% (21) 8% (38) 12% (57) 66% (320) 9% (45) 481Biden Job Somewhat Disapprove 6% (16) 9% (22) 23% (57) 45% (113) 17% (43) 250Biden Job Strongly Disapprove 33% (257) 16% (124) 10% (80) 23% (181) 19% (147) 788Favorable of Biden 7% (65) 7% (63) 10% (94) 70% (649) 6% (56) 927Unfavorable of Biden 26% (268) 14% (142) 13% (134) 28% (285) 19% (191) 1019Very Favorable of Biden 12% (56) 6% (27) 5% (26) 73% (349) 4% (18) 476Somewhat Favorable of Biden 2% (9) 8% (36) 15% (68) 67% (300) 9% (39) 451Somewhat Unfavorable of Biden 4% (8) 10% (20) 22% (46) 46% (94) 18% (38) 207Very Unfavorable of Biden 32% (259) 15% (122) 11% (88) 23% (190) 19% (152) 812#1 Issue: Economy 14% (108) 12% (95) 14% (107) 44% (335) 16% (122) 768#1 Issue: Security 32% (114) 14% (51) 10% (35) 30% (109) 14% (51) 360#1 Issue: Health Care 12% (27) 9% (21) 11% (25) 57% (131) 11% (26) 231#1 Issue: Medicare / Social Security 12% (27) 6% (13) 8% (18) 61% (139) 13% (30) 227#1 Issue: Women’s Issues 9% (11) 9% (11) 17% (21) 57% (71) 8% (10) 125#1 Issue: Education 12% (7) 11% (6) 10% (6) 44% (26) 23% (14) 59#1 Issue: Energy 15% (16) 6% (7) 10% (11) 63% (67) 6% (6) 107#1 Issue: Other 20% (24) 3% (4) 5% (6) 55% (67) 17% (20) 1222020 Vote: Joe Biden 6% (61) 5% (50) 10% (96) 71% (671) 7% (67) 9462020 Vote: Donald Trump 28% (245) 17% (145) 12% (105) 25% (212) 18% (156) 8642020 Vote: Didn’t Vote 16% (25) 6% (10) 17% (26) 31% (47) 30% (45) 1532018 House Vote: Democrat 7% (57) 6% (43) 9% (71) 71% (547) 6% (50) 7692018 House Vote: Republican 27% (190) 16% (114) 13% (94) 28% (199) 15% (105) 7022016 Vote: Hillary Clinton 6% (41) 5% (35) 9% (58) 74% (507) 6% (44) 6852016 Vote: Donald Trump 29% (229) 16% (126) 12% (93) 29% (232) 15% (122) 8022016 Vote: Other 9% (8) 12% (10) 15% (12) 53% (44) 12% (10) 842016 Vote: Didn’t Vote 13% (55) 9% (38) 15% (65) 38% (160) 25% (105) 423Voted in 2014: Yes 17% (230) 11% (149) 10% (140) 51% (679) 10% (138) 1335Voted in 2014: No 16% (105) 9% (59) 13% (89) 40% (267) 21% (142) 663
Continued on next page
Page 274
274
Morning ConsultTable POL17_9
Table POL17_9: How responsible do you believe each of the following are for the events that led to a group of people attacking police and breakinginto the U.S. Capitol in Washington, D.C.?President Joe Biden
DemographicVery
responsibleSomewhatresponsible
Not tooresponsible
Not responsibleat all
Don’t know /No opinion Total N
Registered Voters 17% (335) 10% (209) 11% (229) 47% (946) 14% (280) 19984-Region: Northeast 12% (42) 10% (37) 14% (49) 50% (176) 14% (50) 3534-Region: Midwest 19% (85) 9% (38) 11% (49) 51% (226) 10% (46) 4444-Region: South 19% (138) 12% (88) 9% (68) 42% (312) 19% (141) 7464-Region: West 15% (70) 10% (46) 14% (64) 51% (232) 10% (44) 455Party: Democrat/Leans Democrat 7% (66) 6% (56) 9% (83) 70% (642) 7% (68) 914Party: Republican/Leans Republican 28% (227) 16% (132) 14% (110) 26% (209) 16% (130) 808Note: Row proportions may total to larger than one-hundred percent due to rounding. For more information visit MorningConsultIntelligence.com.
Page 275
National Tracking Poll #2110084, October, 2021
275
Table POL17_10
Table POL17_10: How responsible do you believe each of the following are for the events that led to a group of people attacking police and breakinginto the U.S. Capitol in Washington, D.C.?The people who broke into the U.S. Capitol
DemographicVery
responsibleSomewhatresponsible
Not tooresponsible
Not responsibleat all
Don’t know /No opinion Total N
Registered Voters 70% (1389) 15% (300) 4% (77) 3% (66) 8% (165) 1998Gender: Male 68% (644) 17% (162) 5% (43) 4% (42) 5% (50) 942Gender: Female 71% (745) 13% (138) 3% (34) 2% (24) 11% (115) 1056Age: 18-34 61% (315) 15% (76) 6% (31) 5% (26) 13% (66) 514Age: 35-44 66% (203) 16% (50) 3% (10) 4% (11) 11% (33) 307Age: 45-64 73% (498) 14% (97) 3% (20) 3% (24) 6% (41) 679Age: 65+ 75% (373) 16% (78) 3% (16) 1% (6) 5% (25) 497GenZers: 1997-2012 68% (115) 5% (9) 7% (12) 7% (12) 13% (21) 170Millennials: 1981-1996 61% (339) 18% (100) 5% (27) 4% (24) 11% (61) 551GenXers: 1965-1980 70% (330) 15% (70) 3% (15) 2% (11) 9% (43) 469Baby Boomers: 1946-1964 74% (541) 16% (117) 3% (21) 2% (16) 5% (36) 732PID: Dem (no lean) 81% (631) 8% (64) 3% (24) 2% (19) 5% (38) 777PID: Ind (no lean) 69% (362) 14% (75) 3% (16) 1% (8) 13% (67) 528PID: Rep (no lean) 57% (396) 23% (161) 5% (36) 6% (40) 9% (60) 693PID/Gender: DemMen 79% (280) 12% (41) 4% (13) 2% (8) 3% (10) 352PID/Gender: DemWomen 83% (351) 5% (23) 3% (11) 3% (11) 7% (28) 425PID/Gender: Ind Men 68% (190) 18% (51) 3% (9) 1% (3) 9% (26) 280PID/Gender: Ind Women 69% (171) 10% (24) 3% (7) 2% (4) 17% (41) 248PID/Gender: Rep Men 56% (174) 23% (70) 7% (21) 10% (30) 5% (14) 310PID/Gender: Rep Women 58% (222) 24% (91) 4% (16) 2% (9) 12% (46) 384Ideo: Liberal (1-3) 83% (472) 7% (37) 4% (21) 2% (11) 4% (24) 566Ideo: Moderate (4) 72% (404) 16% (89) 3% (19) 3% (19) 5% (29) 560Ideo: Conservative (5-7) 60% (436) 23% (166) 5% (33) 5% (34) 8% (60) 730Educ: < College 67% (814) 15% (183) 3% (40) 3% (41) 11% (129) 1206Educ: Bachelors degree 74% (372) 13% (67) 4% (21) 4% (19) 5% (24) 501Educ: Post-grad 70% (204) 17% (50) 6% (17) 2% (7) 4% (12) 290Income: Under 50k 67% (584) 13% (115) 4% (39) 4% (35) 12% (101) 873Income: 50k-100k 74% (537) 15% (111) 3% (20) 3% (19) 6% (40) 728Income: 100k+ 67% (268) 19% (74) 5% (18) 3% (13) 6% (24) 398Ethnicity: White 69% (1071) 16% (252) 4% (59) 3% (44) 8% (117) 1544
Continued on next page
Page 276
276
Morning ConsultTable POL17_10
Table POL17_10: How responsible do you believe each of the following are for the events that led to a group of people attacking police and breakinginto the U.S. Capitol in Washington, D.C.?The people who broke into the U.S. Capitol
DemographicVery
responsibleSomewhatresponsible
Not tooresponsible
Not responsibleat all
Don’t know /No opinion Total N
Registered Voters 70% (1389) 15% (300) 4% (77) 3% (66) 8% (165) 1998Ethnicity: Hispanic 63% (140) 19% (42) 3% (7) 3% (6) 12% (28) 222Ethnicity: Black 72% (183) 8% (21) 4% (10) 6% (16) 9% (23) 253Ethnicity: Other 67% (135) 14% (27) 4% (8) 3% (6) 12% (25) 201All Christian 68% (707) 18% (187) 4% (42) 3% (29) 7% (76) 1041All Non-Christian 73% (78) 17% (18) 6% (6) 1% (1) 3% (3) 107Atheist 79% (61) 10% (8) 6% (5) 4% (3) 1% (1) 78Agnostic/Nothing in particular 72% (343) 11% (53) 4% (18) 3% (13) 11% (53) 480Something Else 68% (199) 12% (35) 2% (6) 7% (20) 11% (32) 293Religious Non-Protestant/Catholic 72% (93) 16% (20) 7% (9) 1% (1) 5% (6) 129Evangelical 64% (319) 17% (85) 4% (21) 6% (29) 9% (45) 499Non-Evangelical 71% (564) 16% (125) 3% (23) 2% (18) 8% (60) 790Community: Urban 64% (312) 18% (86) 5% (24) 4% (18) 10% (47) 487Community: Suburban 72% (754) 13% (134) 4% (46) 3% (31) 7% (77) 1041Community: Rural 69% (323) 17% (80) 2% (7) 4% (17) 9% (42) 469Employ: Private Sector 66% (452) 19% (131) 3% (19) 5% (35) 7% (48) 684Employ: Government 71% (79) 15% (17) 7% (8) 1% (1) 6% (6) 112Employ: Self-Employed 73% (134) 12% (23) 8% (15) 2% (4) 4% (7) 183Employ: Homemaker 60% (62) 14% (14) 4% (4) 2% (2) 20% (21) 104Employ: Student 68% (46) 9% (6) 6% (4) 4% (2) 13% (9) 67Employ: Retired 75% (402) 15% (79) 4% (21) 1% (6) 5% (25) 534Employ: Unemployed 75% (143) 10% (19) 3% (6) 3% (6) 9% (17) 191Employ: Other 57% (71) 9% (11) 1% (1) 7% (9) 25% (31) 124Military HH: Yes 70% (219) 18% (57) 3% (11) 2% (7) 7% (21) 315Military HH: No 69% (1170) 14% (243) 4% (66) 4% (59) 9% (145) 1683RD/WT: Right Direction 77% (585) 12% (88) 4% (30) 3% (20) 5% (35) 757RD/WT: Wrong Track 65% (804) 17% (212) 4% (48) 4% (46) 10% (130) 1241Biden Job Approve 81% (730) 9% (83) 3% (31) 3% (23) 4% (32) 899Biden Job Disapprove 61% (629) 21% (214) 4% (44) 4% (41) 11% (111) 1039
Continued on next page
Page 277
National Tracking Poll #2110084, October, 2021
277
Table POL17_10
Table POL17_10: How responsible do you believe each of the following are for the events that led to a group of people attacking police and breakinginto the U.S. Capitol in Washington, D.C.?The people who broke into the U.S. Capitol
DemographicVery
responsibleSomewhatresponsible
Not tooresponsible
Not responsibleat all
Don’t know /No opinion Total N
Registered Voters 70% (1389) 15% (300) 4% (77) 3% (66) 8% (165) 1998Biden Job Strongly Approve 82% (342) 9% (39) 3% (14) 3% (11) 3% (12) 418Biden Job Somewhat Approve 80% (387) 9% (43) 4% (18) 3% (13) 4% (20) 481Biden Job Somewhat Disapprove 72% (181) 14% (35) 3% (8) 1% (4) 9% (23) 250Biden Job Strongly Disapprove 57% (448) 23% (179) 5% (36) 5% (37) 11% (88) 788Favorable of Biden 81% (753) 9% (85) 4% (33) 2% (21) 4% (36) 927Unfavorable of Biden 60% (615) 21% (212) 4% (41) 4% (39) 11% (111) 1019Very Favorable of Biden 81% (386) 10% (45) 5% (22) 1% (7) 3% (16) 476Somewhat Favorable of Biden 81% (367) 9% (39) 2% (11) 3% (14) 4% (20) 451Somewhat Unfavorable of Biden 74% (153) 14% (29) 3% (6) 1% (2) 8% (17) 207Very Unfavorable of Biden 57% (462) 23% (183) 4% (36) 5% (37) 12% (94) 812#1 Issue: Economy 69% (530) 16% (120) 4% (27) 2% (18) 10% (74) 768#1 Issue: Security 56% (203) 26% (92) 4% (16) 4% (16) 9% (33) 360#1 Issue: Health Care 73% (169) 13% (29) 3% (8) 4% (8) 7% (17) 231#1 Issue: Medicare / Social Security 83% (187) 5% (12) 3% (7) 5% (11) 5% (10) 227#1 Issue: Women’s Issues 82% (102) 6% (8) 3% (4) 2% (3) 7% (8) 125#1 Issue: Education 63% (38) 10% (6) 13% (8) 1% (1) 12% (7) 59#1 Issue: Energy 73% (78) 13% (14) 3% (4) 8% (9) 3% (3) 107#1 Issue: Other 67% (82) 17% (21) 4% (5) 1% (1) 10% (13) 1222020 Vote: Joe Biden 82% (779) 8% (79) 3% (28) 2% (19) 4% (40) 9462020 Vote: Donald Trump 57% (490) 23% (201) 5% (44) 5% (41) 10% (87) 8642020 Vote: Didn’t Vote 63% (96) 11% (18) 3% (4) 4% (5) 20% (30) 1532018 House Vote: Democrat 83% (637) 9% (67) 3% (24) 2% (13) 4% (28) 7692018 House Vote: Republican 59% (412) 24% (166) 5% (36) 5% (34) 8% (54) 7022016 Vote: Hillary Clinton 82% (564) 8% (58) 3% (22) 2% (12) 4% (29) 6852016 Vote: Donald Trump 59% (471) 23% (188) 5% (39) 5% (39) 8% (66) 8022016 Vote: Other 78% (65) 9% (8) 3% (2) 3% (2) 7% (6) 842016 Vote: Didn’t Vote 68% (286) 11% (47) 3% (12) 3% (13) 15% (64) 423Voted in 2014: Yes 71% (951) 16% (213) 4% (59) 3% (40) 5% (73) 1335Voted in 2014: No 66% (438) 13% (87) 3% (19) 4% (26) 14% (92) 663
Continued on next page
Page 278
278
Morning ConsultTable POL17_10
Table POL17_10: How responsible do you believe each of the following are for the events that led to a group of people attacking police and breakinginto the U.S. Capitol in Washington, D.C.?The people who broke into the U.S. Capitol
DemographicVery
responsibleSomewhatresponsible
Not tooresponsible
Not responsibleat all
Don’t know /No opinion Total N
Registered Voters 70% (1389) 15% (300) 4% (77) 3% (66) 8% (165) 19984-Region: Northeast 69% (245) 15% (54) 5% (19) 3% (11) 7% (25) 3534-Region: Midwest 73% (323) 14% (62) 2% (11) 4% (17) 7% (31) 4444-Region: South 68% (510) 14% (104) 3% (23) 4% (28) 11% (80) 7464-Region: West 68% (311) 18% (80) 6% (25) 2% (10) 6% (29) 455Party: Democrat/Leans Democrat 82% (745) 8% (74) 3% (31) 2% (20) 5% (45) 914Party: Republican/Leans Republican 59% (477) 23% (184) 5% (38) 5% (41) 9% (70) 808Note: Row proportions may total to larger than one-hundred percent due to rounding. For more information visit MorningConsultIntelligence.com.
Page 279
National Tracking Poll #2110084, October, 2021
279
Table POL17_11
Table POL17_11: How responsible do you believe each of the following are for the events that led to a group of people attacking police and breakinginto the U.S. Capitol in Washington, D.C.?State elections officials
DemographicVery
responsibleSomewhatresponsible
Not tooresponsible
Not responsibleat all
Don’t know /No opinion Total N
Registered Voters 14% (275) 20% (406) 17% (349) 25% (500) 23% (468) 1998Gender: Male 15% (142) 21% (198) 21% (195) 28% (262) 15% (144) 942Gender: Female 13% (132) 20% (208) 15% (154) 23% (238) 31% (324) 1056Age: 18-34 21% (107) 19% (100) 16% (82) 16% (83) 28% (142) 514Age: 35-44 16% (48) 26% (81) 14% (44) 19% (59) 25% (75) 307Age: 45-64 10% (67) 21% (141) 17% (119) 31% (211) 21% (141) 679Age: 65+ 11% (53) 17% (84) 21% (103) 30% (147) 22% (109) 497GenZers: 1997-2012 21% (35) 14% (24) 14% (24) 18% (30) 34% (58) 170Millennials: 1981-1996 19% (106) 24% (135) 15% (85) 17% (92) 24% (134) 551GenXers: 1965-1980 12% (56) 20% (96) 18% (86) 27% (127) 22% (105) 469Baby Boomers: 1946-1964 9% (67) 18% (135) 19% (139) 31% (224) 23% (166) 732PID: Dem (no lean) 13% (105) 20% (159) 19% (150) 27% (209) 20% (155) 777PID: Ind (no lean) 10% (54) 21% (113) 18% (94) 22% (114) 29% (153) 528PID: Rep (no lean) 17% (116) 19% (134) 15% (106) 26% (177) 23% (160) 693PID/Gender: DemMen 14% (51) 23% (80) 21% (75) 29% (103) 12% (43) 352PID/Gender: DemWomen 13% (54) 18% (78) 18% (74) 25% (106) 26% (112) 425PID/Gender: Ind Men 12% (34) 21% (59) 22% (62) 25% (70) 20% (55) 280PID/Gender: Ind Women 8% (20) 22% (54) 13% (32) 18% (44) 39% (98) 248PID/Gender: Rep Men 18% (57) 19% (59) 19% (59) 29% (89) 15% (46) 310PID/Gender: Rep Women 15% (59) 20% (75) 12% (47) 23% (88) 30% (115) 384Ideo: Liberal (1-3) 14% (79) 21% (118) 22% (126) 28% (158) 15% (86) 566Ideo: Moderate (4) 10% (57) 22% (122) 18% (100) 25% (140) 25% (140) 560Ideo: Conservative (5-7) 17% (124) 19% (138) 16% (118) 27% (194) 21% (156) 730Educ: < College 14% (166) 21% (259) 13% (161) 22% (269) 29% (351) 1206Educ: Bachelors degree 13% (66) 19% (94) 24% (120) 29% (148) 14% (73) 501Educ: Post-grad 15% (43) 18% (53) 23% (68) 29% (83) 15% (44) 290Income: Under 50k 14% (125) 20% (177) 15% (134) 22% (189) 28% (248) 873Income: 50k-100k 14% (103) 20% (148) 18% (131) 26% (188) 22% (157) 728Income: 100k+ 12% (47) 20% (81) 21% (84) 31% (123) 16% (62) 398Ethnicity: White 12% (193) 20% (308) 19% (291) 26% (399) 23% (354) 1544
Continued on next page
Page 280
280
Morning ConsultTable POL17_11
Table POL17_11: How responsible do you believe each of the following are for the events that led to a group of people attacking police and breakinginto the U.S. Capitol in Washington, D.C.?State elections officials
DemographicVery
responsibleSomewhatresponsible
Not tooresponsible
Not responsibleat all
Don’t know /No opinion Total N
Registered Voters 14% (275) 20% (406) 17% (349) 25% (500) 23% (468) 1998Ethnicity: Hispanic 22% (50) 20% (43) 13% (28) 15% (33) 31% (68) 222Ethnicity: Black 17% (44) 22% (56) 11% (27) 23% (59) 26% (67) 253Ethnicity: Other 19% (38) 21% (42) 16% (31) 21% (42) 24% (48) 201All Christian 12% (129) 20% (213) 19% (198) 26% (274) 22% (228) 1041All Non-Christian 24% (25) 20% (22) 19% (20) 26% (28) 11% (12) 107Atheist 10% (8) 23% (18) 17% (13) 38% (29) 12% (10) 78Agnostic/Nothing in particular 15% (73) 21% (99) 16% (74) 22% (105) 27% (128) 480Something Else 14% (40) 19% (55) 15% (44) 22% (63) 31% (90) 293Religious Non-Protestant/Catholic 21% (27) 20% (26) 17% (22) 27% (35) 14% (18) 129Evangelical 15% (75) 23% (117) 14% (70) 24% (119) 24% (118) 499Non-Evangelical 11% (87) 17% (138) 21% (167) 26% (206) 24% (192) 790Community: Urban 17% (83) 26% (125) 16% (79) 22% (107) 19% (93) 487Community: Suburban 11% (115) 19% (198) 19% (203) 26% (267) 25% (259) 1041Community: Rural 16% (77) 18% (82) 14% (67) 27% (126) 25% (117) 469Employ: Private Sector 12% (85) 26% (176) 18% (125) 25% (173) 18% (125) 684Employ: Government 12% (13) 21% (23) 25% (28) 26% (29) 17% (19) 112Employ: Self-Employed 24% (44) 21% (39) 16% (29) 22% (40) 16% (29) 183Employ: Homemaker 11% (12) 20% (21) 15% (16) 21% (22) 32% (33) 104Employ: Student 25% (17) 12% (8) 10% (7) 18% (12) 35% (23) 67Employ: Retired 11% (61) 17% (89) 19% (103) 29% (153) 24% (126) 534Employ: Unemployed 12% (23) 20% (37) 9% (16) 25% (47) 35% (67) 191Employ: Other 16% (19) 10% (12) 20% (24) 19% (24) 36% (44) 124Military HH: Yes 15% (46) 19% (60) 19% (59) 28% (87) 20% (63) 315Military HH: No 14% (229) 21% (346) 17% (290) 25% (413) 24% (405) 1683RD/WT: Right Direction 13% (100) 23% (178) 20% (152) 26% (197) 17% (130) 757RD/WT: Wrong Track 14% (175) 18% (228) 16% (197) 24% (303) 27% (338) 1241Biden Job Approve 13% (121) 24% (212) 20% (181) 26% (230) 17% (155) 899Biden Job Disapprove 14% (149) 18% (183) 16% (165) 25% (263) 27% (278) 1039
Continued on next page
Page 281
National Tracking Poll #2110084, October, 2021
281
Table POL17_11
Table POL17_11: How responsible do you believe each of the following are for the events that led to a group of people attacking police and breakinginto the U.S. Capitol in Washington, D.C.?State elections officials
DemographicVery
responsibleSomewhatresponsible
Not tooresponsible
Not responsibleat all
Don’t know /No opinion Total N
Registered Voters 14% (275) 20% (406) 17% (349) 25% (500) 23% (468) 1998Biden Job Strongly Approve 16% (67) 25% (103) 18% (76) 29% (121) 12% (51) 418Biden Job Somewhat Approve 11% (54) 23% (109) 22% (105) 23% (109) 22% (104) 481Biden Job Somewhat Disapprove 7% (17) 18% (45) 22% (56) 26% (65) 27% (67) 250Biden Job Strongly Disapprove 17% (132) 18% (138) 14% (109) 25% (198) 27% (211) 788Favorable of Biden 14% (126) 24% (219) 19% (180) 26% (239) 18% (163) 927Unfavorable of Biden 14% (144) 18% (181) 16% (165) 25% (251) 27% (277) 1019Very Favorable of Biden 18% (85) 23% (111) 19% (89) 27% (129) 13% (61) 476Somewhat Favorable of Biden 9% (41) 24% (108) 20% (91) 24% (110) 22% (101) 451Somewhat Unfavorable of Biden 6% (13) 17% (35) 24% (50) 24% (50) 29% (59) 207Very Unfavorable of Biden 16% (131) 18% (146) 14% (115) 25% (202) 27% (218) 812#1 Issue: Economy 11% (86) 20% (157) 18% (137) 25% (188) 26% (200) 768#1 Issue: Security 18% (65) 16% (58) 14% (52) 25% (90) 26% (95) 360#1 Issue: Health Care 14% (32) 23% (54) 20% (47) 23% (52) 20% (46) 231#1 Issue: Medicare / Social Security 12% (27) 15% (35) 19% (44) 34% (77) 20% (44) 227#1 Issue: Women’s Issues 20% (24) 23% (29) 17% (22) 23% (29) 17% (21) 125#1 Issue: Education 26% (15) 20% (12) 19% (11) 12% (7) 24% (14) 59#1 Issue: Energy 14% (15) 33% (35) 15% (16) 23% (25) 15% (16) 107#1 Issue: Other 8% (10) 22% (27) 17% (20) 26% (32) 26% (32) 1222020 Vote: Joe Biden 13% (121) 23% (217) 21% (194) 26% (247) 18% (166) 9462020 Vote: Donald Trump 15% (131) 18% (156) 15% (131) 26% (221) 26% (225) 8642020 Vote: Didn’t Vote 12% (18) 18% (28) 10% (16) 17% (26) 42% (64) 1532018 House Vote: Democrat 12% (91) 24% (182) 21% (163) 28% (212) 16% (122) 7692018 House Vote: Republican 15% (108) 20% (141) 16% (113) 27% (186) 22% (153) 7022016 Vote: Hillary Clinton 12% (80) 24% (163) 19% (129) 28% (194) 17% (119) 6852016 Vote: Donald Trump 16% (132) 18% (148) 17% (139) 27% (215) 21% (168) 8022016 Vote: Other 4% (3) 20% (17) 24% (20) 30% (25) 22% (18) 842016 Vote: Didn’t Vote 14% (60) 18% (76) 14% (58) 15% (65) 39% (163) 423Voted in 2014: Yes 14% (184) 22% (289) 19% (249) 27% (366) 18% (246) 1335Voted in 2014: No 14% (90) 18% (117) 15% (100) 20% (134) 34% (223) 663
Continued on next page
Page 282
282
Morning ConsultTable POL17_11
Table POL17_11: How responsible do you believe each of the following are for the events that led to a group of people attacking police and breakinginto the U.S. Capitol in Washington, D.C.?State elections officials
DemographicVery
responsibleSomewhatresponsible
Not tooresponsible
Not responsibleat all
Don’t know /No opinion Total N
Registered Voters 14% (275) 20% (406) 17% (349) 25% (500) 23% (468) 19984-Region: Northeast 12% (42) 19% (67) 21% (75) 28% (99) 20% (70) 3534-Region: Midwest 16% (73) 21% (95) 17% (77) 21% (95) 23% (104) 4444-Region: South 14% (103) 20% (147) 15% (114) 26% (197) 25% (185) 7464-Region: West 13% (58) 21% (96) 18% (83) 24% (108) 24% (110) 455Party: Democrat/Leans Democrat 13% (120) 21% (194) 20% (180) 26% (238) 20% (182) 914Party: Republican/Leans Republican 15% (120) 20% (158) 15% (125) 26% (209) 24% (196) 808Note: Row proportions may total to larger than one-hundred percent due to rounding. For more information visit MorningConsultIntelligence.com.
Page 283
National Tracking Poll #2110084, October, 2021
283
Table POL17_12
Table POL17_12: How responsible do you believe each of the following are for the events that led to a group of people attacking police and breakinginto the U.S. Capitol in Washington, D.C.?State legislators
DemographicVery
responsibleSomewhatresponsible
Not tooresponsible
Not responsibleat all
Don’t know /No opinion Total N
Registered Voters 11% (212) 24% (473) 19% (377) 23% (461) 24% (475) 1998Gender: Male 12% (113) 25% (236) 21% (197) 26% (245) 16% (151) 942Gender: Female 9% (100) 22% (237) 17% (180) 20% (216) 31% (324) 1056Age: 18-34 12% (60) 24% (125) 18% (92) 17% (89) 29% (149) 514Age: 35-44 13% (40) 28% (86) 15% (46) 19% (59) 25% (77) 307Age: 45-64 10% (69) 21% (144) 20% (134) 28% (188) 21% (143) 679Age: 65+ 9% (42) 24% (118) 21% (106) 25% (125) 21% (106) 497GenZers: 1997-2012 10% (17) 22% (37) 18% (31) 17% (29) 32% (55) 170Millennials: 1981-1996 13% (72) 27% (151) 16% (87) 18% (99) 26% (143) 551GenXers: 1965-1980 11% (54) 22% (101) 20% (93) 26% (120) 22% (101) 469Baby Boomers: 1946-1964 9% (64) 22% (164) 21% (153) 25% (184) 23% (167) 732PID: Dem (no lean) 11% (89) 27% (206) 21% (163) 22% (167) 20% (152) 777PID: Ind (no lean) 8% (43) 25% (131) 19% (101) 20% (104) 28% (149) 528PID: Rep (no lean) 12% (81) 20% (136) 16% (112) 27% (189) 25% (174) 693PID/Gender: DemMen 14% (50) 27% (96) 20% (71) 26% (90) 13% (46) 352PID/Gender: DemWomen 9% (39) 26% (110) 22% (92) 18% (77) 25% (106) 425PID/Gender: Ind Men 9% (25) 26% (74) 24% (67) 21% (60) 19% (54) 280PID/Gender: Ind Women 7% (18) 23% (57) 14% (34) 18% (45) 38% (95) 248PID/Gender: Rep Men 12% (38) 21% (66) 19% (59) 31% (95) 17% (51) 310PID/Gender: Rep Women 11% (43) 18% (70) 14% (54) 25% (94) 32% (123) 384Ideo: Liberal (1-3) 13% (75) 28% (160) 23% (132) 18% (103) 17% (96) 566Ideo: Moderate (4) 9% (50) 25% (139) 23% (127) 21% (119) 22% (124) 560Ideo: Conservative (5-7) 10% (75) 22% (164) 14% (102) 30% (223) 23% (167) 730Educ: < College 11% (131) 21% (259) 17% (203) 23% (275) 28% (339) 1206Educ: Bachelors degree 10% (52) 26% (129) 21% (103) 23% (118) 20% (99) 501Educ: Post-grad 10% (30) 29% (84) 24% (71) 24% (68) 13% (37) 290Income: Under 50k 11% (97) 21% (186) 19% (165) 21% (182) 28% (243) 873Income: 50k-100k 10% (73) 24% (176) 18% (132) 25% (183) 23% (164) 728Income: 100k+ 11% (42) 28% (111) 20% (80) 24% (96) 17% (68) 398Ethnicity: White 10% (156) 23% (360) 21% (319) 23% (360) 23% (349) 1544
Continued on next page
Page 284
284
Morning ConsultTable POL17_12
Table POL17_12: How responsible do you believe each of the following are for the events that led to a group of people attacking police and breakinginto the U.S. Capitol in Washington, D.C.?State legislators
DemographicVery
responsibleSomewhatresponsible
Not tooresponsible
Not responsibleat all
Don’t know /No opinion Total N
Registered Voters 11% (212) 24% (473) 19% (377) 23% (461) 24% (475) 1998Ethnicity: Hispanic 13% (29) 22% (48) 23% (51) 19% (43) 23% (51) 222Ethnicity: Black 12% (30) 25% (64) 16% (40) 21% (53) 26% (66) 253Ethnicity: Other 13% (26) 24% (49) 9% (18) 24% (47) 30% (61) 201All Christian 9% (96) 24% (246) 20% (212) 25% (258) 22% (230) 1041All Non-Christian 19% (20) 25% (27) 18% (19) 23% (24) 15% (16) 107Atheist 12% (9) 41% (32) 14% (11) 22% (17) 12% (9) 78Agnostic/Nothing in particular 10% (48) 22% (108) 16% (78) 22% (107) 29% (139) 480Something Else 13% (39) 21% (61) 19% (57) 19% (54) 28% (82) 293Religious Non-Protestant/Catholic 16% (21) 24% (31) 17% (22) 28% (36) 15% (19) 129Evangelical 12% (61) 24% (120) 17% (87) 24% (122) 22% (109) 499Non-Evangelical 9% (69) 22% (176) 22% (175) 22% (176) 25% (195) 790Community: Urban 14% (67) 27% (132) 18% (90) 21% (102) 20% (96) 487Community: Suburban 8% (87) 25% (264) 18% (192) 24% (247) 24% (251) 1041Community: Rural 13% (59) 16% (76) 20% (95) 24% (111) 27% (128) 469Employ: Private Sector 12% (79) 25% (170) 19% (128) 25% (171) 20% (135) 684Employ: Government 6% (6) 28% (31) 20% (22) 29% (32) 18% (20) 112Employ: Self-Employed 10% (19) 30% (54) 22% (41) 20% (37) 17% (32) 183Employ: Homemaker 10% (11) 25% (25) 15% (16) 15% (15) 35% (36) 104Employ: Student 10% (7) 22% (15) 18% (12) 15% (10) 35% (24) 67Employ: Retired 10% (52) 23% (124) 18% (98) 27% (146) 21% (114) 534Employ: Unemployed 11% (20) 19% (37) 19% (36) 17% (33) 34% (65) 191Employ: Other 14% (18) 13% (16) 19% (24) 13% (17) 40% (50) 124Military HH: Yes 14% (43) 21% (66) 18% (56) 27% (84) 21% (66) 315Military HH: No 10% (169) 24% (407) 19% (320) 22% (377) 24% (409) 1683RD/WT: Right Direction 12% (87) 30% (224) 22% (168) 19% (143) 18% (135) 757RD/WT: Wrong Track 10% (125) 20% (249) 17% (209) 26% (317) 27% (340) 1241Biden Job Approve 10% (92) 29% (261) 23% (211) 20% (176) 18% (159) 899Biden Job Disapprove 11% (116) 20% (205) 15% (160) 27% (281) 27% (276) 1039
Continued on next page
Page 285
National Tracking Poll #2110084, October, 2021
285
Table POL17_12
Table POL17_12: How responsible do you believe each of the following are for the events that led to a group of people attacking police and breakinginto the U.S. Capitol in Washington, D.C.?State legislators
DemographicVery
responsibleSomewhatresponsible
Not tooresponsible
Not responsibleat all
Don’t know /No opinion Total N
Registered Voters 11% (212) 24% (473) 19% (377) 23% (461) 24% (475) 1998Biden Job Strongly Approve 16% (66) 29% (121) 23% (95) 19% (78) 14% (58) 418Biden Job Somewhat Approve 5% (26) 29% (140) 24% (116) 20% (98) 21% (101) 481Biden Job Somewhat Disapprove 11% (27) 22% (55) 23% (58) 22% (54) 23% (57) 250Biden Job Strongly Disapprove 11% (89) 19% (150) 13% (103) 29% (227) 28% (219) 788Favorable of Biden 10% (96) 29% (269) 22% (208) 20% (185) 18% (169) 927Unfavorable of Biden 11% (113) 19% (195) 16% (167) 27% (270) 27% (274) 1019Very Favorable of Biden 16% (74) 31% (146) 22% (105) 18% (86) 14% (65) 476Somewhat Favorable of Biden 5% (22) 27% (123) 23% (103) 22% (99) 23% (104) 451Somewhat Unfavorable of Biden 11% (23) 22% (45) 24% (51) 19% (40) 23% (48) 207Very Unfavorable of Biden 11% (90) 18% (150) 14% (116) 28% (230) 28% (226) 812#1 Issue: Economy 9% (66) 21% (165) 19% (149) 27% (204) 24% (185) 768#1 Issue: Security 13% (47) 18% (65) 17% (63) 24% (88) 27% (98) 360#1 Issue: Health Care 13% (29) 32% (75) 21% (48) 15% (35) 19% (44) 231#1 Issue: Medicare / Social Security 10% (22) 22% (51) 22% (49) 25% (56) 22% (49) 227#1 Issue: Women’s Issues 10% (12) 26% (33) 17% (21) 17% (22) 29% (37) 125#1 Issue: Education 14% (8) 33% (19) 18% (11) 11% (7) 24% (14) 59#1 Issue: Energy 17% (18) 28% (30) 13% (14) 24% (25) 18% (19) 107#1 Issue: Other 9% (11) 29% (36) 18% (22) 20% (25) 24% (29) 1222020 Vote: Joe Biden 11% (105) 30% (280) 21% (201) 20% (185) 18% (174) 9462020 Vote: Donald Trump 10% (87) 19% (162) 18% (152) 28% (243) 26% (221) 8642020 Vote: Didn’t Vote 11% (17) 16% (24) 12% (18) 17% (25) 45% (68) 1532018 House Vote: Democrat 12% (91) 30% (229) 21% (160) 21% (163) 16% (126) 7692018 House Vote: Republican 10% (70) 21% (146) 17% (120) 28% (199) 24% (167) 7022016 Vote: Hillary Clinton 12% (80) 30% (206) 19% (130) 22% (149) 17% (120) 6852016 Vote: Donald Trump 11% (91) 20% (159) 19% (155) 28% (224) 22% (174) 8022016 Vote: Other 7% (6) 18% (15) 24% (20) 26% (22) 24% (20) 842016 Vote: Didn’t Vote 9% (36) 21% (91) 17% (72) 15% (62) 38% (162) 423Voted in 2014: Yes 11% (152) 25% (335) 20% (261) 25% (332) 19% (255) 1335Voted in 2014: No 9% (60) 21% (138) 17% (115) 20% (129) 33% (220) 663
Continued on next page
Page 286
286
Morning ConsultTable POL17_12
Table POL17_12: How responsible do you believe each of the following are for the events that led to a group of people attacking police and breakinginto the U.S. Capitol in Washington, D.C.?State legislators
DemographicVery
responsibleSomewhatresponsible
Not tooresponsible
Not responsibleat all
Don’t know /No opinion Total N
Registered Voters 11% (212) 24% (473) 19% (377) 23% (461) 24% (475) 19984-Region: Northeast 9% (30) 21% (74) 21% (73) 26% (91) 24% (84) 3534-Region: Midwest 14% (61) 24% (107) 19% (85) 18% (81) 25% (110) 4444-Region: South 10% (77) 23% (174) 18% (133) 25% (186) 24% (176) 7464-Region: West 10% (45) 26% (117) 19% (85) 22% (102) 23% (105) 455Party: Democrat/Leans Democrat 11% (105) 27% (248) 22% (199) 20% (187) 19% (176) 914Party: Republican/Leans Republican 11% (87) 19% (157) 16% (129) 28% (227) 26% (207) 808Note: Row proportions may total to larger than one-hundred percent due to rounding. For more information visit MorningConsultIntelligence.com.
Page 287
National Tracking Poll #2110084, October, 2021
287
Table POL17_13
Table POL17_13: How responsible do you believe each of the following are for the events that led to a group of people attacking police and breakinginto the U.S. Capitol in Washington, D.C.?News media
DemographicVery
responsibleSomewhatresponsible
Not tooresponsible
Not responsibleat all
Don’t know /No opinion Total N
Registered Voters 29% (580) 31% (625) 14% (288) 13% (257) 12% (248) 1998Gender: Male 30% (287) 32% (304) 15% (142) 15% (142) 7% (66) 942Gender: Female 28% (293) 30% (321) 14% (145) 11% (115) 17% (182) 1056Age: 18-34 31% (157) 29% (149) 12% (62) 12% (60) 17% (86) 514Age: 35-44 29% (88) 34% (103) 13% (39) 12% (37) 13% (39) 307Age: 45-64 29% (196) 30% (201) 17% (113) 14% (98) 11% (72) 679Age: 65+ 28% (139) 35% (172) 15% (74) 12% (62) 10% (51) 497GenZers: 1997-2012 31% (53) 24% (40) 14% (23) 11% (19) 20% (35) 170Millennials: 1981-1996 31% (169) 32% (179) 11% (61) 12% (67) 14% (76) 551GenXers: 1965-1980 29% (135) 31% (143) 16% (75) 13% (62) 12% (55) 469Baby Boomers: 1946-1964 29% (209) 31% (230) 16% (116) 14% (99) 11% (78) 732PID: Dem (no lean) 18% (142) 30% (230) 23% (182) 19% (149) 9% (73) 777PID: Ind (no lean) 29% (151) 35% (184) 11% (55) 9% (49) 17% (88) 528PID: Rep (no lean) 41% (287) 30% (211) 7% (50) 8% (58) 12% (86) 693PID/Gender: DemMen 17% (62) 29% (102) 25% (89) 23% (80) 6% (20) 352PID/Gender: DemWomen 19% (80) 30% (128) 22% (93) 16% (69) 13% (54) 425PID/Gender: Ind Men 33% (94) 36% (102) 10% (28) 11% (30) 10% (27) 280PID/Gender: Ind Women 23% (58) 33% (82) 11% (28) 8% (19) 25% (62) 248PID/Gender: Rep Men 43% (132) 32% (100) 8% (26) 10% (32) 6% (19) 310PID/Gender: Rep Women 40% (155) 29% (111) 6% (24) 7% (26) 17% (67) 384Ideo: Liberal (1-3) 20% (113) 31% (174) 22% (123) 19% (110) 8% (46) 566Ideo: Moderate (4) 22% (124) 34% (191) 19% (104) 14% (76) 12% (66) 560Ideo: Conservative (5-7) 42% (309) 32% (236) 7% (49) 8% (60) 10% (76) 730Educ: < College 30% (368) 29% (352) 13% (154) 12% (142) 16% (190) 1206Educ: Bachelors degree 29% (144) 34% (169) 14% (72) 15% (75) 8% (41) 501Educ: Post-grad 24% (69) 36% (104) 21% (62) 13% (39) 6% (17) 290Income: Under 50k 29% (250) 29% (250) 15% (128) 12% (103) 16% (142) 873Income: 50k-100k 31% (224) 33% (240) 13% (92) 13% (96) 10% (75) 728Income: 100k+ 26% (105) 34% (135) 17% (68) 14% (57) 8% (31) 398Ethnicity: White 30% (459) 33% (510) 14% (213) 12% (181) 12% (180) 1544
Continued on next page
Page 288
288
Morning ConsultTable POL17_13
Table POL17_13: How responsible do you believe each of the following are for the events that led to a group of people attacking police and breakinginto the U.S. Capitol in Washington, D.C.?News media
DemographicVery
responsibleSomewhatresponsible
Not tooresponsible
Not responsibleat all
Don’t know /No opinion Total N
Registered Voters 29% (580) 31% (625) 14% (288) 13% (257) 12% (248) 1998Ethnicity: Hispanic 27% (60) 28% (62) 21% (47) 10% (22) 13% (30) 222Ethnicity: Black 26% (66) 23% (58) 17% (44) 20% (50) 14% (36) 253Ethnicity: Other 27% (55) 29% (58) 15% (31) 13% (25) 16% (32) 201All Christian 31% (327) 32% (335) 14% (146) 11% (110) 12% (124) 1041All Non-Christian 25% (26) 29% (31) 15% (16) 23% (25) 9% (9) 107Atheist 20% (15) 41% (32) 19% (15) 16% (13) 4% (3) 78Agnostic/Nothing in particular 28% (132) 27% (130) 15% (72) 15% (72) 15% (73) 480Something Else 27% (79) 34% (99) 13% (39) 13% (38) 13% (38) 293Religious Non-Protestant/Catholic 22% (29) 32% (41) 16% (20) 20% (26) 10% (13) 129Evangelical 33% (166) 33% (164) 11% (54) 11% (56) 12% (60) 499Non-Evangelical 29% (229) 32% (251) 15% (122) 11% (90) 12% (98) 790Community: Urban 29% (140) 31% (152) 17% (83) 12% (58) 11% (55) 487Community: Suburban 26% (268) 31% (323) 16% (164) 15% (153) 13% (132) 1041Community: Rural 37% (172) 32% (150) 9% (41) 10% (46) 13% (61) 469Employ: Private Sector 29% (201) 33% (224) 13% (89) 15% (100) 10% (70) 684Employ: Government 22% (25) 39% (43) 14% (15) 19% (22) 6% (7) 112Employ: Self-Employed 37% (68) 25% (46) 17% (31) 11% (19) 10% (19) 183Employ: Homemaker 32% (34) 31% (32) 13% (14) 6% (6) 18% (19) 104Employ: Student 33% (22) 29% (20) 11% (8) 3% (2) 22% (15) 67Employ: Retired 29% (155) 32% (170) 16% (88) 12% (63) 11% (59) 534Employ: Unemployed 23% (44) 25% (48) 17% (31) 17% (33) 18% (34) 191Employ: Other 25% (31) 35% (43) 10% (12) 9% (12) 21% (26) 124Military HH: Yes 35% (109) 34% (106) 13% (40) 9% (29) 10% (31) 315Military HH: No 28% (471) 31% (519) 15% (247) 14% (228) 13% (217) 1683RD/WT: Right Direction 18% (140) 30% (225) 23% (174) 21% (159) 8% (60) 757RD/WT: Wrong Track 35% (440) 32% (401) 9% (114) 8% (98) 15% (188) 1241Biden Job Approve 17% (155) 32% (286) 23% (209) 20% (178) 8% (72) 899Biden Job Disapprove 40% (415) 32% (331) 7% (71) 7% (75) 14% (146) 1039
Continued on next page
Page 289
National Tracking Poll #2110084, October, 2021
289
Table POL17_13
Table POL17_13: How responsible do you believe each of the following are for the events that led to a group of people attacking police and breakinginto the U.S. Capitol in Washington, D.C.?News media
DemographicVery
responsibleSomewhatresponsible
Not tooresponsible
Not responsibleat all
Don’t know /No opinion Total N
Registered Voters 29% (580) 31% (625) 14% (288) 13% (257) 12% (248) 1998Biden Job Strongly Approve 18% (75) 29% (121) 26% (109) 23% (94) 4% (19) 418Biden Job Somewhat Approve 17% (80) 34% (164) 21% (100) 17% (83) 11% (53) 481Biden Job Somewhat Disapprove 24% (61) 39% (99) 14% (35) 7% (18) 15% (37) 250Biden Job Strongly Disapprove 45% (354) 29% (232) 5% (36) 7% (58) 14% (108) 788Favorable of Biden 17% (162) 32% (300) 23% (211) 19% (179) 8% (76) 927Unfavorable of Biden 41% (413) 31% (316) 7% (71) 7% (73) 14% (145) 1019Very Favorable of Biden 20% (97) 30% (141) 24% (115) 20% (96) 6% (27) 476Somewhat Favorable of Biden 14% (65) 35% (159) 21% (96) 18% (83) 11% (49) 451Somewhat Unfavorable of Biden 30% (63) 36% (74) 13% (26) 7% (15) 14% (29) 207Very Unfavorable of Biden 43% (350) 30% (242) 6% (45) 7% (58) 14% (116) 812#1 Issue: Economy 29% (224) 33% (256) 13% (100) 12% (93) 13% (96) 768#1 Issue: Security 42% (150) 27% (97) 8% (28) 10% (36) 13% (48) 360#1 Issue: Health Care 21% (49) 34% (79) 20% (46) 11% (25) 14% (32) 231#1 Issue: Medicare / Social Security 23% (52) 31% (71) 16% (36) 18% (41) 12% (26) 227#1 Issue: Women’s Issues 27% (34) 33% (41) 17% (22) 13% (16) 10% (13) 125#1 Issue: Education 34% (20) 30% (18) 11% (6) 13% (8) 12% (7) 59#1 Issue: Energy 26% (27) 26% (27) 27% (29) 13% (14) 8% (9) 107#1 Issue: Other 19% (23) 31% (37) 17% (21) 20% (24) 13% (16) 1222020 Vote: Joe Biden 19% (176) 32% (305) 22% (207) 18% (171) 9% (87) 9462020 Vote: Donald Trump 41% (355) 32% (275) 7% (61) 7% (64) 13% (109) 8642020 Vote: Didn’t Vote 24% (36) 24% (36) 11% (16) 13% (19) 29% (45) 1532018 House Vote: Democrat 18% (136) 33% (252) 22% (166) 20% (152) 8% (62) 7692018 House Vote: Republican 42% (293) 33% (229) 8% (55) 8% (57) 10% (68) 7022016 Vote: Hillary Clinton 17% (113) 31% (212) 24% (164) 20% (134) 9% (60) 6852016 Vote: Donald Trump 41% (326) 33% (263) 8% (62) 9% (70) 10% (81) 8022016 Vote: Other 25% (21) 35% (30) 12% (10) 16% (13) 12% (10) 842016 Vote: Didn’t Vote 28% (117) 29% (121) 12% (49) 9% (39) 23% (96) 423Voted in 2014: Yes 31% (411) 32% (425) 15% (200) 14% (185) 8% (113) 1335Voted in 2014: No 25% (169) 30% (200) 13% (88) 11% (72) 20% (135) 663
Continued on next page
Page 290
290
Morning ConsultTable POL17_13
Table POL17_13: How responsible do you believe each of the following are for the events that led to a group of people attacking police and breakinginto the U.S. Capitol in Washington, D.C.?News media
DemographicVery
responsibleSomewhatresponsible
Not tooresponsible
Not responsibleat all
Don’t know /No opinion Total N
Registered Voters 29% (580) 31% (625) 14% (288) 13% (257) 12% (248) 19984-Region: Northeast 24% (86) 34% (122) 15% (53) 15% (55) 11% (38) 3534-Region: Midwest 34% (150) 26% (116) 17% (74) 10% (42) 14% (62) 4444-Region: South 29% (217) 31% (232) 11% (83) 13% (100) 15% (113) 7464-Region: West 28% (127) 34% (155) 17% (78) 13% (60) 8% (35) 455Party: Democrat/Leans Democrat 20% (180) 31% (280) 22% (202) 18% (165) 10% (87) 914Party: Republican/Leans Republican 40% (327) 31% (251) 8% (62) 9% (69) 12% (98) 808Note: Row proportions may total to larger than one-hundred percent due to rounding. For more information visit MorningConsultIntelligence.com.
Page 291
National Tracking Poll #2110084, October, 2021
291
Table POL17_14
Table POL17_14: How responsible do you believe each of the following are for the events that led to a group of people attacking police and breakinginto the U.S. Capitol in Washington, D.C.?Social media companies
DemographicVery
responsibleSomewhatresponsible
Not tooresponsible
Not responsibleat all
Don’t know /No opinion Total N
Registered Voters 31% (613) 33% (661) 12% (232) 11% (215) 14% (277) 1998Gender: Male 34% (322) 32% (303) 15% (137) 10% (98) 9% (82) 942Gender: Female 28% (291) 34% (358) 9% (95) 11% (117) 18% (194) 1056Age: 18-34 30% (152) 25% (130) 13% (69) 13% (66) 19% (97) 514Age: 35-44 26% (80) 38% (116) 12% (38) 12% (36) 12% (37) 307Age: 45-64 31% (210) 32% (214) 13% (89) 10% (70) 14% (97) 679Age: 65+ 34% (170) 40% (200) 7% (37) 9% (43) 9% (47) 497GenZers: 1997-2012 29% (50) 24% (41) 16% (26) 11% (19) 19% (33) 170Millennials: 1981-1996 29% (160) 31% (170) 12% (65) 13% (72) 15% (85) 551GenXers: 1965-1980 31% (147) 30% (139) 14% (67) 10% (49) 14% (66) 469Baby Boomers: 1946-1964 32% (232) 39% (283) 9% (63) 9% (66) 12% (87) 732PID: Dem (no lean) 23% (180) 38% (299) 14% (110) 14% (109) 10% (80) 777PID: Ind (no lean) 30% (160) 33% (172) 11% (59) 7% (36) 19% (101) 528PID: Rep (no lean) 39% (273) 27% (190) 9% (64) 10% (70) 14% (96) 693PID/Gender: DemMen 30% (105) 33% (115) 20% (70) 10% (37) 7% (26) 352PID/Gender: DemWomen 18% (75) 43% (184) 9% (40) 17% (72) 13% (54) 425PID/Gender: Ind Men 31% (86) 35% (97) 14% (38) 8% (21) 14% (38) 280PID/Gender: Ind Women 30% (74) 30% (75) 8% (21) 6% (15) 25% (63) 248PID/Gender: Rep Men 42% (131) 29% (91) 10% (29) 13% (40) 6% (18) 310PID/Gender: Rep Women 37% (142) 26% (99) 9% (34) 8% (30) 20% (78) 384Ideo: Liberal (1-3) 28% (160) 39% (222) 11% (64) 13% (74) 8% (46) 566Ideo: Moderate (4) 24% (133) 39% (216) 14% (79) 11% (60) 13% (72) 560Ideo: Conservative (5-7) 41% (298) 27% (200) 9% (65) 10% (75) 13% (93) 730Educ: < College 31% (375) 29% (350) 11% (138) 11% (134) 17% (209) 1206Educ: Bachelors degree 31% (156) 37% (184) 11% (57) 11% (54) 10% (51) 501Educ: Post-grad 28% (82) 44% (127) 13% (37) 9% (27) 6% (17) 290Income: Under 50k 30% (265) 28% (242) 12% (105) 12% (103) 18% (157) 873Income: 50k-100k 33% (238) 35% (252) 11% (82) 10% (74) 11% (82) 728Income: 100k+ 28% (110) 42% (167) 12% (46) 10% (38) 9% (37) 398Ethnicity: White 32% (498) 35% (534) 11% (162) 10% (151) 13% (199) 1544
Continued on next page
Page 292
292
Morning ConsultTable POL17_14
Table POL17_14: How responsible do you believe each of the following are for the events that led to a group of people attacking police and breakinginto the U.S. Capitol in Washington, D.C.?Social media companies
DemographicVery
responsibleSomewhatresponsible
Not tooresponsible
Not responsibleat all
Don’t know /No opinion Total N
Registered Voters 31% (613) 33% (661) 12% (232) 11% (215) 14% (277) 1998Ethnicity: Hispanic 31% (69) 25% (55) 17% (38) 11% (25) 16% (35) 222Ethnicity: Black 19% (48) 33% (82) 15% (37) 19% (48) 15% (38) 253Ethnicity: Other 33% (67) 22% (45) 17% (33) 8% (16) 20% (40) 201All Christian 32% (332) 35% (360) 10% (108) 10% (107) 13% (134) 1041All Non-Christian 31% (33) 40% (43) 11% (12) 9% (10) 9% (9) 107Atheist 39% (30) 36% (28) 17% (13) 8% (6) 1% (0) 78Agnostic/Nothing in particular 29% (137) 28% (134) 14% (68) 12% (57) 18% (84) 480Something Else 28% (81) 33% (96) 11% (32) 12% (34) 17% (49) 293Religious Non-Protestant/Catholic 29% (37) 42% (54) 10% (14) 9% (11) 10% (13) 129Evangelical 33% (164) 34% (171) 9% (44) 11% (53) 13% (67) 499Non-Evangelical 30% (240) 33% (262) 12% (92) 11% (85) 14% (111) 790Community: Urban 30% (147) 35% (172) 12% (58) 10% (46) 13% (63) 487Community: Suburban 28% (290) 34% (354) 12% (130) 12% (125) 14% (142) 1041Community: Rural 37% (175) 29% (135) 10% (45) 9% (44) 15% (71) 469Employ: Private Sector 31% (211) 33% (225) 12% (79) 12% (82) 13% (87) 684Employ: Government 27% (30) 34% (39) 11% (12) 18% (20) 10% (11) 112Employ: Self-Employed 31% (57) 38% (70) 13% (23) 9% (16) 9% (16) 183Employ: Homemaker 33% (34) 29% (30) 6% (7) 8% (8) 24% (25) 104Employ: Student 27% (18) 30% (20) 13% (9) 5% (4) 24% (16) 67Employ: Retired 34% (180) 39% (207) 9% (47) 8% (45) 10% (56) 534Employ: Unemployed 25% (48) 22% (42) 21% (40) 15% (28) 17% (33) 191Employ: Other 27% (34) 22% (28) 13% (16) 10% (13) 27% (33) 124Military HH: Yes 36% (114) 40% (127) 7% (21) 8% (24) 9% (30) 315Military HH: No 30% (499) 32% (534) 13% (211) 11% (191) 15% (247) 1683RD/WT: Right Direction 26% (198) 37% (279) 14% (103) 14% (108) 9% (69) 757RD/WT: Wrong Track 33% (415) 31% (382) 10% (129) 9% (107) 17% (208) 1241Biden Job Approve 26% (230) 39% (351) 14% (129) 13% (116) 8% (73) 899Biden Job Disapprove 36% (374) 29% (303) 9% (94) 9% (96) 17% (173) 1039
Continued on next page
Page 293
National Tracking Poll #2110084, October, 2021
293
Table POL17_14
Table POL17_14: How responsible do you believe each of the following are for the events that led to a group of people attacking police and breakinginto the U.S. Capitol in Washington, D.C.?Social media companies
DemographicVery
responsibleSomewhatresponsible
Not tooresponsible
Not responsibleat all
Don’t know /No opinion Total N
Registered Voters 31% (613) 33% (661) 12% (232) 11% (215) 14% (277) 1998Biden Job Strongly Approve 28% (119) 38% (161) 15% (61) 13% (53) 6% (25) 418Biden Job Somewhat Approve 23% (111) 40% (191) 14% (69) 13% (63) 10% (48) 481Biden Job Somewhat Disapprove 23% (57) 39% (98) 13% (33) 8% (21) 17% (42) 250Biden Job Strongly Disapprove 40% (318) 26% (204) 8% (61) 9% (75) 17% (130) 788Favorable of Biden 25% (233) 39% (363) 15% (138) 12% (115) 8% (78) 927Unfavorable of Biden 37% (373) 28% (287) 9% (92) 9% (94) 17% (172) 1019Very Favorable of Biden 29% (136) 39% (187) 14% (69) 12% (56) 6% (28) 476Somewhat Favorable of Biden 21% (97) 39% (175) 15% (70) 13% (59) 11% (51) 451Somewhat Unfavorable of Biden 28% (57) 32% (66) 14% (29) 11% (22) 15% (32) 207Very Unfavorable of Biden 39% (316) 27% (221) 8% (63) 9% (71) 17% (140) 812#1 Issue: Economy 30% (229) 31% (240) 12% (94) 12% (95) 14% (109) 768#1 Issue: Security 42% (150) 25% (91) 10% (34) 10% (35) 13% (48) 360#1 Issue: Health Care 25% (58) 38% (88) 15% (33) 7% (17) 15% (34) 231#1 Issue: Medicare / Social Security 27% (61) 38% (86) 11% (26) 12% (27) 12% (27) 227#1 Issue: Women’s Issues 27% (34) 37% (46) 7% (9) 15% (19) 13% (16) 125#1 Issue: Education 20% (12) 49% (29) 3% (2) 4% (3) 24% (14) 59#1 Issue: Energy 29% (31) 40% (43) 14% (15) 10% (10) 6% (7) 107#1 Issue: Other 31% (37) 31% (38) 15% (18) 7% (8) 17% (21) 1222020 Vote: Joe Biden 27% (252) 38% (364) 14% (137) 12% (110) 9% (84) 9462020 Vote: Donald Trump 38% (331) 27% (236) 9% (78) 10% (83) 16% (136) 8642020 Vote: Didn’t Vote 14% (21) 33% (50) 10% (15) 11% (18) 32% (49) 1532018 House Vote: Democrat 26% (197) 41% (315) 14% (109) 11% (83) 8% (65) 7692018 House Vote: Republican 40% (280) 29% (206) 9% (61) 9% (63) 13% (91) 7022016 Vote: Hillary Clinton 25% (168) 40% (277) 14% (97) 12% (82) 9% (60) 6852016 Vote: Donald Trump 39% (312) 30% (239) 9% (73) 9% (74) 13% (103) 8022016 Vote: Other 23% (19) 38% (32) 12% (10) 8% (7) 19% (16) 842016 Vote: Didn’t Vote 26% (111) 27% (113) 12% (52) 12% (50) 23% (98) 423Voted in 2014: Yes 33% (443) 36% (478) 11% (150) 10% (129) 10% (135) 1335Voted in 2014: No 26% (170) 28% (183) 12% (83) 13% (86) 21% (141) 663
Continued on next page
Page 294
294
Morning ConsultTable POL17_14
Table POL17_14: How responsible do you believe each of the following are for the events that led to a group of people attacking police and breakinginto the U.S. Capitol in Washington, D.C.?Social media companies
DemographicVery
responsibleSomewhatresponsible
Not tooresponsible
Not responsibleat all
Don’t know /No opinion Total N
Registered Voters 31% (613) 33% (661) 12% (232) 11% (215) 14% (277) 19984-Region: Northeast 23% (82) 39% (138) 14% (49) 10% (34) 14% (50) 3534-Region: Midwest 35% (154) 28% (123) 13% (57) 12% (51) 13% (59) 4444-Region: South 31% (232) 31% (234) 10% (76) 12% (89) 15% (115) 7464-Region: West 32% (146) 36% (166) 11% (51) 9% (41) 12% (52) 455Party: Democrat/Leans Democrat 25% (230) 38% (345) 14% (128) 13% (118) 10% (94) 914Party: Republican/Leans Republican 37% (301) 29% (234) 10% (78) 10% (77) 15% (118) 808Note: Row proportions may total to larger than one-hundred percent due to rounding. For more information visit MorningConsultIntelligence.com.
Page 295
National Tracking Poll #2110084, October, 2021
295
Table POL18
Table POL18: And specifically, how important is it for the federal government to continue to investigate the events that occurred in the U.S. Capitol inWashington, D.C. on January 6th?
Demographic Very importantSomewhatimportant
Not tooimportant
Not importantat all
Don’t know /No opinion Total N
Registered Voters 50% (989) 15% (299) 13% (265) 15% (310) 7% (135) 1998Gender: Male 50% (470) 15% (139) 14% (135) 17% (157) 4% (42) 942Gender: Female 49% (519) 15% (160) 12% (131) 14% (153) 9% (93) 1056Age: 18-34 48% (246) 20% (102) 11% (56) 9% (48) 12% (62) 514Age: 35-44 56% (172) 18% (55) 10% (29) 9% (27) 8% (24) 307Age: 45-64 45% (309) 13% (86) 18% (120) 19% (132) 5% (33) 679Age: 65+ 53% (263) 11% (57) 12% (60) 21% (102) 3% (16) 497GenZers: 1997-2012 44% (75) 20% (35) 10% (18) 9% (15) 16% (28) 170Millennials: 1981-1996 52% (288) 19% (105) 10% (57) 10% (53) 9% (49) 551GenXers: 1965-1980 48% (227) 15% (70) 13% (62) 18% (84) 6% (26) 469Baby Boomers: 1946-1964 50% (363) 11% (81) 17% (122) 19% (138) 4% (28) 732PID: Dem (no lean) 77% (601) 13% (101) 4% (34) 2% (14) 4% (27) 777PID: Ind (no lean) 44% (235) 15% (78) 13% (68) 15% (79) 13% (68) 528PID: Rep (no lean) 22% (153) 17% (120) 24% (163) 31% (217) 6% (39) 693PID/Gender: DemMen 80% (284) 12% (41) 4% (15) 1% (2) 3% (10) 352PID/Gender: DemWomen 75% (318) 14% (59) 5% (19) 3% (11) 4% (17) 425PID/Gender: Ind Men 42% (116) 16% (45) 16% (44) 18% (50) 9% (25) 280PID/Gender: Ind Women 48% (118) 14% (34) 10% (24) 11% (28) 17% (43) 248PID/Gender: Rep Men 23% (70) 17% (53) 25% (76) 34% (104) 2% (6) 310PID/Gender: Rep Women 22% (83) 18% (67) 23% (87) 29% (113) 9% (33) 384Ideo: Liberal (1-3) 78% (443) 11% (61) 7% (37) 1% (8) 3% (17) 566Ideo: Moderate (4) 58% (326) 17% (94) 11% (64) 8% (43) 6% (33) 560Ideo: Conservative (5-7) 24% (173) 17% (125) 21% (155) 33% (243) 5% (34) 730Educ: < College 46% (550) 13% (158) 15% (179) 17% (207) 9% (112) 1206Educ: Bachelors degree 53% (266) 19% (94) 11% (56) 14% (70) 3% (15) 501Educ: Post-grad 59% (172) 16% (47) 10% (30) 11% (33) 3% (8) 290Income: Under 50k 50% (436) 14% (120) 14% (122) 12% (109) 10% (86) 873Income: 50k-100k 48% (353) 14% (104) 13% (94) 19% (139) 5% (38) 728Income: 100k+ 50% (201) 19% (75) 12% (49) 16% (62) 3% (11) 398Ethnicity: White 45% (694) 16% (250) 15% (227) 18% (279) 6% (95) 1544Ethnicity: Hispanic 53% (117) 12% (27) 16% (36) 10% (22) 9% (20) 222
Continued on next page
Page 296
296
Morning ConsultTable POL18
Table POL18: And specifically, how important is it for the federal government to continue to investigate the events that occurred in the U.S. Capitol inWashington, D.C. on January 6th?
Demographic Very importantSomewhatimportant
Not tooimportant
Not importantat all
Don’t know /No opinion Total N
Registered Voters 50% (989) 15% (299) 13% (265) 15% (310) 7% (135) 1998Ethnicity: Black 71% (179) 11% (27) 4% (10) 6% (15) 8% (21) 253Ethnicity: Other 58% (116) 11% (22) 14% (28) 8% (16) 9% (19) 201All Christian 45% (472) 16% (163) 16% (164) 18% (186) 5% (57) 1041All Non-Christian 67% (71) 16% (17) 6% (6) 11% (12) — (0) 107Atheist 67% (52) 12% (10) 13% (10) 7% (5) — (0) 78Agnostic/Nothing in particular 52% (249) 15% (74) 8% (41) 14% (65) 11% (52) 480Something Else 50% (145) 12% (37) 15% (44) 14% (42) 9% (25) 293Religious Non-Protestant/Catholic 63% (81) 13% (17) 8% (11) 13% (17) 2% (3) 129Evangelical 41% (206) 15% (75) 19% (93) 19% (95) 6% (30) 499Non-Evangelical 49% (389) 15% (118) 14% (108) 16% (125) 6% (49) 790Community: Urban 59% (289) 17% (82) 10% (48) 7% (35) 7% (33) 487Community: Suburban 50% (517) 15% (157) 13% (135) 17% (177) 5% (55) 1041Community: Rural 39% (183) 13% (60) 18% (83) 21% (97) 10% (47) 469Employ: Private Sector 47% (321) 17% (113) 15% (105) 15% (104) 6% (40) 684Employ: Government 57% (64) 21% (23) 10% (11) 6% (7) 6% (7) 112Employ: Self-Employed 46% (83) 24% (44) 17% (31) 10% (18) 3% (6) 183Employ: Homemaker 43% (45) 18% (19) 11% (11) 18% (19) 9% (10) 104Employ: Student 48% (32) 21% (14) 10% (6) 9% (6) 11% (8) 67Employ: Retired 53% (280) 9% (48) 13% (69) 21% (114) 4% (22) 534Employ: Unemployed 55% (105) 10% (18) 10% (18) 14% (27) 11% (22) 191Employ: Other 48% (59) 15% (19) 10% (12) 11% (14) 16% (20) 124Military HH: Yes 49% (155) 11% (34) 13% (40) 18% (57) 9% (29) 315Military HH: No 50% (834) 16% (265) 13% (225) 15% (252) 6% (106) 1683RD/WT: Right Direction 77% (584) 12% (94) 4% (33) 2% (19) 4% (27) 757RD/WT: Wrong Track 33% (405) 17% (205) 19% (232) 23% (291) 9% (108) 1241Biden Job Approve 79% (714) 13% (119) 4% (36) 1% (9) 2% (21) 899Biden Job Disapprove 25% (257) 17% (173) 22% (227) 29% (299) 8% (83) 1039
Continued on next page
Page 297
National Tracking Poll #2110084, October, 2021
297
Table POL18
Table POL18: And specifically, how important is it for the federal government to continue to investigate the events that occurred in the U.S. Capitol inWashington, D.C. on January 6th?
Demographic Very importantSomewhatimportant
Not tooimportant
Not importantat all
Don’t know /No opinion Total N
Registered Voters 50% (989) 15% (299) 13% (265) 15% (310) 7% (135) 1998Biden Job Strongly Approve 86% (359) 9% (36) 4% (15) — (1) 2% (7) 418Biden Job Somewhat Approve 74% (355) 17% (83) 4% (21) 2% (8) 3% (14) 481Biden Job Somewhat Disapprove 48% (120) 20% (51) 19% (48) 5% (13) 8% (20) 250Biden Job Strongly Disapprove 17% (137) 16% (122) 23% (180) 36% (286) 8% (63) 788Favorable of Biden 79% (732) 13% (121) 4% (32) 1% (11) 3% (30) 927Unfavorable of Biden 24% (241) 16% (167) 22% (229) 29% (298) 8% (85) 1019Very Favorable of Biden 86% (408) 10% (46) 2% (11) 1% (3) 2% (7) 476Somewhat Favorable of Biden 72% (324) 17% (75) 5% (21) 2% (8) 5% (22) 451Somewhat Unfavorable of Biden 44% (92) 20% (42) 22% (46) 6% (13) 7% (15) 207Very Unfavorable of Biden 18% (149) 15% (125) 23% (183) 35% (285) 9% (70) 812#1 Issue: Economy 42% (322) 18% (141) 17% (133) 15% (113) 8% (59) 768#1 Issue: Security 30% (107) 14% (50) 15% (54) 34% (124) 7% (24) 360#1 Issue: Health Care 65% (149) 16% (36) 6% (13) 5% (11) 9% (21) 231#1 Issue: Medicare / Social Security 66% (150) 9% (19) 11% (25) 11% (24) 3% (7) 227#1 Issue: Women’s Issues 62% (77) 16% (19) 10% (13) 5% (6) 8% (10) 125#1 Issue: Education 56% (33) 21% (12) 3% (2) 11% (6) 9% (5) 59#1 Issue: Energy 68% (73) 12% (12) 9% (9) 7% (8) 4% (5) 107#1 Issue: Other 63% (77) 6% (8) 14% (17) 14% (17) 2% (3) 1222020 Vote: Joe Biden 78% (741) 12% (118) 4% (41) 1% (11) 4% (35) 9462020 Vote: Donald Trump 19% (168) 17% (147) 24% (206) 32% (281) 7% (63) 8642020 Vote: Didn’t Vote 42% (65) 18% (28) 10% (15) 9% (14) 21% (31) 1532018 House Vote: Democrat 76% (587) 11% (87) 6% (43) 3% (23) 4% (28) 7692018 House Vote: Republican 25% (175) 16% (112) 23% (161) 31% (219) 5% (35) 7022016 Vote: Hillary Clinton 80% (549) 11% (78) 3% (23) 2% (10) 3% (24) 6852016 Vote: Donald Trump 24% (191) 17% (137) 23% (185) 31% (250) 5% (39) 8022016 Vote: Other 56% (47) 12% (10) 16% (13) 11% (9) 5% (4) 842016 Vote: Didn’t Vote 47% (199) 18% (74) 10% (44) 9% (38) 16% (68) 423Voted in 2014: Yes 52% (688) 13% (179) 14% (188) 17% (229) 4% (51) 1335Voted in 2014: No 45% (301) 18% (120) 12% (78) 12% (80) 13% (84) 663
Continued on next page
Page 298
298
Morning ConsultTable POL18
Table POL18: And specifically, how important is it for the federal government to continue to investigate the events that occurred in the U.S. Capitol inWashington, D.C. on January 6th?
Demographic Very importantSomewhatimportant
Not tooimportant
Not importantat all
Don’t know /No opinion Total N
Registered Voters 50% (989) 15% (299) 13% (265) 15% (310) 7% (135) 19984-Region: Northeast 50% (177) 14% (51) 17% (59) 13% (48) 5% (18) 3534-Region: Midwest 50% (223) 14% (64) 13% (58) 16% (72) 6% (28) 4444-Region: South 45% (334) 17% (128) 13% (94) 17% (128) 8% (61) 7464-Region: West 56% (255) 12% (56) 12% (54) 14% (62) 6% (29) 455Party: Democrat/Leans Democrat 77% (706) 13% (116) 5% (42) 2% (16) 4% (34) 914Party: Republican/Leans Republican 22% (179) 16% (133) 23% (187) 32% (260) 6% (49) 808Note: Row proportions may total to larger than one-hundred percent due to rounding. For more information visit MorningConsultIntelligence.com.
Page 299
National Tracking Poll #2110084, October, 2021
299
Table POL19_1
Table POL19_1: Do you agree or disagree with the following statements?The people who broke into the U.S. Capitol are representative of the Republican Party
Demographic Strongly agreeSomewhatagree
Somewhatdisagree
Stronglydisagree
Don’t know /No opinion Total N
Registered Voters 22% (442) 23% (450) 14% (280) 26% (526) 15% (300) 1998Gender: Male 22% (209) 24% (222) 14% (130) 27% (254) 14% (127) 942Gender: Female 22% (233) 22% (228) 14% (149) 26% (273) 16% (172) 1056Age: 18-34 25% (129) 24% (124) 15% (79) 17% (87) 19% (96) 514Age: 35-44 23% (71) 25% (78) 15% (46) 17% (52) 20% (60) 307Age: 45-64 20% (134) 23% (157) 13% (88) 31% (211) 13% (89) 679Age: 65+ 22% (108) 18% (91) 13% (67) 36% (177) 11% (55) 497GenZers: 1997-2012 33% (56) 19% (33) 10% (17) 18% (31) 20% (35) 170Millennials: 1981-1996 23% (128) 26% (141) 17% (92) 17% (92) 18% (99) 551GenXers: 1965-1980 18% (87) 27% (127) 14% (67) 25% (120) 15% (69) 469Baby Boomers: 1946-1964 22% (158) 19% (140) 12% (88) 35% (256) 12% (89) 732PID: Dem (no lean) 42% (323) 32% (248) 10% (80) 6% (44) 10% (82) 777PID: Ind (no lean) 17% (88) 21% (112) 16% (86) 23% (121) 23% (120) 528PID: Rep (no lean) 5% (31) 13% (90) 16% (113) 52% (361) 14% (98) 693PID/Gender: DemMen 43% (151) 31% (108) 10% (35) 6% (20) 11% (37) 352PID/Gender: DemWomen 41% (172) 33% (139) 11% (45) 6% (24) 10% (44) 425PID/Gender: Ind Men 13% (38) 24% (67) 19% (52) 24% (68) 20% (55) 280PID/Gender: Ind Women 20% (50) 18% (45) 14% (34) 21% (53) 26% (66) 248PID/Gender: Rep Men 6% (20) 15% (47) 14% (43) 53% (165) 11% (35) 310PID/Gender: Rep Women 3% (12) 11% (44) 18% (70) 51% (196) 16% (63) 384Ideo: Liberal (1-3) 45% (257) 30% (169) 9% (53) 7% (40) 8% (47) 566Ideo: Moderate (4) 22% (123) 28% (158) 17% (98) 16% (91) 16% (90) 560Ideo: Conservative (5-7) 6% (43) 14% (100) 17% (120) 52% (377) 12% (88) 730Educ: < College 21% (252) 21% (252) 13% (157) 27% (324) 18% (222) 1206Educ: Bachelors degree 24% (118) 22% (112) 16% (81) 28% (142) 10% (48) 501Educ: Post-grad 25% (72) 30% (86) 14% (42) 21% (60) 10% (30) 290Income: Under 50k 22% (191) 22% (191) 13% (117) 25% (214) 18% (159) 873Income: 50k-100k 22% (158) 21% (156) 16% (113) 27% (197) 14% (102) 728Income: 100k+ 23% (93) 26% (103) 12% (49) 29% (115) 10% (38) 398Ethnicity: White 19% (286) 23% (348) 15% (224) 30% (469) 14% (217) 1544Ethnicity: Hispanic 28% (62) 26% (57) 11% (25) 15% (34) 21% (46) 222
Continued on next page
Page 300
300
Morning ConsultTable POL19_1
Table POL19_1: Do you agree or disagree with the following statements?The people who broke into the U.S. Capitol are representative of the Republican Party
Demographic Strongly agreeSomewhatagree
Somewhatdisagree
Stronglydisagree
Don’t know /No opinion Total N
Registered Voters 22% (442) 23% (450) 14% (280) 26% (526) 15% (300) 1998Ethnicity: Black 40% (102) 24% (60) 8% (21) 10% (26) 17% (44) 253Ethnicity: Other 27% (55) 21% (42) 17% (34) 16% (32) 19% (39) 201All Christian 19% (201) 19% (198) 15% (156) 33% (343) 14% (144) 1041All Non-Christian 31% (33) 33% (35) 10% (11) 19% (20) 7% (8) 107Atheist 37% (29) 33% (25) 9% (7) 16% (12) 6% (5) 78Agnostic/Nothing in particular 25% (118) 25% (120) 14% (65) 20% (95) 17% (82) 480Something Else 21% (62) 25% (72) 14% (40) 19% (57) 21% (61) 293Religious Non-Protestant/Catholic 27% (35) 29% (37) 10% (13) 24% (31) 10% (13) 129Evangelical 16% (79) 22% (111) 16% (78) 33% (165) 13% (66) 499Non-Evangelical 22% (172) 19% (152) 14% (113) 28% (221) 17% (131) 790Community: Urban 31% (149) 25% (122) 14% (68) 16% (79) 14% (70) 487Community: Suburban 20% (213) 25% (260) 14% (141) 28% (287) 13% (140) 1041Community: Rural 17% (80) 14% (68) 15% (70) 34% (161) 19% (90) 469Employ: Private Sector 20% (137) 25% (168) 16% (107) 27% (183) 13% (88) 684Employ: Government 29% (33) 27% (30) 10% (12) 18% (20) 16% (18) 112Employ: Self-Employed 25% (45) 23% (41) 18% (32) 21% (39) 14% (25) 183Employ: Homemaker 21% (22) 20% (20) 14% (15) 27% (28) 18% (19) 104Employ: Student 33% (22) 23% (16) 15% (10) 13% (9) 16% (11) 67Employ: Retired 22% (117) 19% (101) 12% (67) 36% (190) 11% (59) 534Employ: Unemployed 23% (45) 30% (57) 8% (16) 19% (35) 20% (38) 191Employ: Other 17% (21) 13% (17) 17% (21) 18% (23) 34% (42) 124Military HH: Yes 20% (63) 17% (54) 15% (46) 29% (92) 19% (60) 315Military HH: No 23% (379) 24% (396) 14% (234) 26% (434) 14% (240) 1683RD/WT: Right Direction 38% (286) 36% (269) 11% (83) 6% (45) 10% (74) 757RD/WT: Wrong Track 13% (156) 15% (181) 16% (197) 39% (481) 18% (225) 1241Biden Job Approve 39% (352) 34% (309) 11% (102) 5% (49) 10% (87) 899Biden Job Disapprove 8% (80) 13% (130) 17% (172) 46% (476) 17% (181) 1039
Continued on next page
Page 301
National Tracking Poll #2110084, October, 2021
301
Table POL19_1
Table POL19_1: Do you agree or disagree with the following statements?The people who broke into the U.S. Capitol are representative of the Republican Party
Demographic Strongly agreeSomewhatagree
Somewhatdisagree
Stronglydisagree
Don’t know /No opinion Total N
Registered Voters 22% (442) 23% (450) 14% (280) 26% (526) 15% (300) 1998Biden Job Strongly Approve 47% (196) 32% (132) 11% (46) 5% (22) 5% (22) 418Biden Job Somewhat Approve 32% (156) 37% (177) 12% (56) 6% (27) 13% (65) 481Biden Job Somewhat Disapprove 18% (46) 24% (59) 19% (47) 18% (44) 22% (54) 250Biden Job Strongly Disapprove 4% (34) 9% (71) 16% (125) 55% (432) 16% (126) 788Favorable of Biden 40% (370) 34% (314) 11% (103) 6% (53) 9% (87) 927Unfavorable of Biden 6% (66) 13% (130) 17% (173) 46% (470) 18% (180) 1019Very Favorable of Biden 48% (227) 31% (148) 10% (46) 5% (24) 7% (31) 476Somewhat Favorable of Biden 32% (143) 37% (166) 13% (57) 7% (29) 12% (56) 451Somewhat Unfavorable of Biden 15% (30) 25% (51) 20% (42) 18% (38) 22% (46) 207Very Unfavorable of Biden 4% (36) 10% (79) 16% (130) 53% (433) 17% (134) 812#1 Issue: Economy 17% (134) 20% (157) 15% (115) 29% (226) 18% (136) 768#1 Issue: Security 12% (45) 14% (49) 15% (55) 46% (164) 13% (47) 360#1 Issue: Health Care 29% (68) 34% (79) 12% (27) 10% (24) 14% (33) 231#1 Issue: Medicare / Social Security 26% (59) 28% (64) 12% (26) 22% (50) 12% (28) 227#1 Issue: Women’s Issues 38% (48) 27% (33) 16% (19) 7% (9) 12% (15) 125#1 Issue: Education 32% (19) 23% (14) 14% (8) 6% (4) 25% (15) 59#1 Issue: Energy 32% (34) 24% (26) 14% (15) 17% (18) 13% (13) 107#1 Issue: Other 30% (37) 23% (28) 10% (13) 26% (32) 11% (13) 1222020 Vote: Joe Biden 40% (380) 32% (299) 12% (118) 6% (56) 10% (93) 9462020 Vote: Donald Trump 3% (28) 13% (108) 17% (145) 51% (438) 17% (145) 8642020 Vote: Didn’t Vote 17% (26) 24% (37) 9% (13) 17% (25) 33% (50) 1532018 House Vote: Democrat 40% (308) 31% (238) 11% (88) 7% (57) 10% (77) 7692018 House Vote: Republican 4% (30) 12% (86) 19% (133) 52% (366) 12% (87) 7022016 Vote: Hillary Clinton 42% (287) 32% (218) 11% (75) 6% (38) 10% (67) 6852016 Vote: Donald Trump 5% (40) 14% (112) 17% (133) 50% (404) 14% (114) 8022016 Vote: Other 19% (16) 20% (17) 24% (20) 17% (15) 19% (16) 842016 Vote: Didn’t Vote 24% (99) 24% (103) 12% (49) 16% (68) 24% (102) 423Voted in 2014: Yes 23% (308) 22% (292) 14% (191) 30% (400) 11% (144) 1335Voted in 2014: No 20% (135) 24% (158) 13% (89) 19% (126) 23% (155) 663
Continued on next page
Page 302
302
Morning ConsultTable POL19_1
Table POL19_1: Do you agree or disagree with the following statements?The people who broke into the U.S. Capitol are representative of the Republican Party
Demographic Strongly agreeSomewhatagree
Somewhatdisagree
Stronglydisagree
Don’t know /No opinion Total N
Registered Voters 22% (442) 23% (450) 14% (280) 26% (526) 15% (300) 19984-Region: Northeast 22% (76) 23% (83) 14% (51) 23% (80) 18% (63) 3534-Region: Midwest 24% (107) 20% (87) 15% (65) 29% (128) 13% (58) 4444-Region: South 20% (150) 20% (149) 12% (90) 31% (235) 16% (122) 7464-Region: West 24% (109) 29% (131) 16% (74) 18% (84) 13% (57) 455Party: Democrat/Leans Democrat 40% (369) 33% (300) 11% (99) 6% (52) 10% (94) 914Party: Republican/Leans Republican 5% (38) 12% (99) 17% (138) 51% (414) 15% (120) 808Note: Row proportions may total to larger than one-hundred percent due to rounding. For more information visit MorningConsultIntelligence.com.
Page 303
National Tracking Poll #2110084, October, 2021
303
Table POL19_2
Table POL19_2: Do you agree or disagree with the following statements?The people who broke into the U.S. Capitol are representative of Donald Trump, but not the Republican Party
Demographic Strongly agreeSomewhatagree
Somewhatdisagree
Stronglydisagree
Don’t know /No opinion Total N
Registered Voters 19% (375) 22% (441) 17% (348) 27% (532) 15% (302) 1998Gender: Male 18% (168) 24% (223) 18% (167) 28% (261) 13% (123) 942Gender: Female 20% (207) 21% (218) 17% (181) 26% (271) 17% (179) 1056Age: 18-34 20% (101) 26% (134) 18% (91) 17% (89) 19% (100) 514Age: 35-44 22% (67) 28% (85) 14% (44) 17% (54) 19% (57) 307Age: 45-64 16% (105) 20% (133) 20% (135) 32% (218) 13% (88) 679Age: 65+ 20% (101) 18% (90) 16% (78) 35% (172) 11% (56) 497GenZers: 1997-2012 19% (32) 25% (43) 17% (30) 15% (25) 24% (41) 170Millennials: 1981-1996 21% (114) 27% (149) 17% (93) 18% (101) 17% (94) 551GenXers: 1965-1980 17% (80) 25% (119) 18% (82) 26% (122) 14% (66) 469Baby Boomers: 1946-1964 19% (137) 15% (113) 18% (129) 36% (264) 12% (89) 732PID: Dem (no lean) 28% (221) 29% (226) 20% (154) 14% (110) 8% (65) 777PID: Ind (no lean) 17% (92) 22% (118) 17% (90) 22% (114) 22% (114) 528PID: Rep (no lean) 9% (62) 14% (96) 15% (105) 44% (308) 18% (122) 693PID/Gender: DemMen 26% (90) 31% (108) 18% (65) 17% (60) 8% (29) 352PID/Gender: DemWomen 31% (131) 28% (118) 21% (89) 12% (50) 9% (37) 425PID/Gender: Ind Men 16% (46) 23% (63) 20% (57) 23% (63) 18% (52) 280PID/Gender: Ind Women 19% (46) 22% (55) 13% (33) 21% (51) 25% (63) 248PID/Gender: Rep Men 10% (32) 17% (52) 14% (45) 45% (138) 14% (43) 310PID/Gender: Rep Women 8% (30) 12% (45) 16% (60) 44% (170) 21% (80) 384Ideo: Liberal (1-3) 27% (150) 27% (153) 22% (123) 17% (99) 7% (40) 566Ideo: Moderate (4) 23% (130) 30% (167) 16% (91) 17% (94) 14% (79) 560Ideo: Conservative (5-7) 11% (78) 14% (100) 16% (115) 44% (322) 16% (115) 730Educ: < College 17% (209) 19% (232) 16% (195) 28% (337) 19% (233) 1206Educ: Bachelors degree 22% (110) 23% (115) 18% (93) 27% (137) 9% (46) 501Educ: Post-grad 19% (56) 32% (94) 21% (61) 20% (57) 8% (23) 290Income: Under 50k 20% (176) 18% (157) 16% (139) 27% (234) 19% (166) 873Income: 50k-100k 18% (132) 22% (161) 19% (136) 27% (198) 14% (101) 728Income: 100k+ 17% (67) 31% (122) 18% (73) 25% (100) 9% (35) 398Ethnicity: White 18% (275) 22% (341) 17% (264) 28% (440) 15% (225) 1544Ethnicity: Hispanic 22% (48) 24% (54) 16% (35) 19% (42) 20% (43) 222
Continued on next page
Page 304
304
Morning ConsultTable POL19_2
Table POL19_2: Do you agree or disagree with the following statements?The people who broke into the U.S. Capitol are representative of Donald Trump, but not the Republican Party
Demographic Strongly agreeSomewhatagree
Somewhatdisagree
Stronglydisagree
Don’t know /No opinion Total N
Registered Voters 19% (375) 22% (441) 17% (348) 27% (532) 15% (302) 1998Ethnicity: Black 25% (64) 25% (63) 16% (40) 19% (49) 15% (37) 253Ethnicity: Other 18% (37) 18% (37) 22% (44) 21% (43) 20% (40) 201All Christian 17% (177) 21% (218) 18% (192) 29% (298) 15% (157) 1041All Non-Christian 36% (38) 22% (23) 15% (16) 21% (23) 7% (7) 107Atheist 24% (19) 29% (22) 25% (19) 12% (9) 11% (8) 78Agnostic/Nothing in particular 18% (87) 23% (112) 18% (84) 26% (125) 15% (72) 480Something Else 19% (54) 22% (65) 13% (37) 27% (78) 20% (58) 293Religious Non-Protestant/Catholic 32% (42) 21% (28) 15% (19) 21% (27) 11% (14) 129Evangelical 16% (80) 20% (99) 16% (81) 33% (165) 15% (73) 499Non-Evangelical 18% (142) 22% (172) 18% (141) 26% (201) 17% (133) 790Community: Urban 24% (118) 26% (125) 16% (79) 19% (94) 15% (71) 487Community: Suburban 19% (196) 24% (247) 20% (208) 25% (258) 13% (132) 1041Community: Rural 13% (61) 14% (68) 13% (61) 38% (180) 21% (100) 469Employ: Private Sector 18% (122) 25% (174) 18% (121) 27% (188) 12% (80) 684Employ: Government 23% (26) 23% (25) 14% (16) 24% (27) 16% (18) 112Employ: Self-Employed 17% (32) 23% (43) 28% (51) 19% (34) 13% (23) 183Employ: Homemaker 12% (13) 17% (18) 21% (22) 23% (24) 26% (27) 104Employ: Student 13% (9) 33% (22) 16% (11) 12% (8) 26% (17) 67Employ: Retired 19% (102) 17% (90) 17% (90) 35% (186) 12% (66) 534Employ: Unemployed 20% (38) 24% (46) 14% (27) 20% (39) 22% (41) 191Employ: Other 28% (34) 19% (23) 9% (11) 22% (27) 24% (29) 124Military HH: Yes 15% (46) 19% (61) 16% (49) 32% (101) 18% (57) 315Military HH: No 20% (329) 23% (380) 18% (299) 26% (431) 15% (245) 1683RD/WT: Right Direction 28% (209) 31% (232) 20% (152) 14% (106) 8% (59) 757RD/WT: Wrong Track 13% (166) 17% (209) 16% (197) 34% (426) 20% (243) 1241Biden Job Approve 28% (249) 31% (277) 21% (185) 14% (125) 7% (63) 899Biden Job Disapprove 11% (112) 15% (155) 15% (158) 39% (407) 20% (207) 1039
Continued on next page
Page 305
National Tracking Poll #2110084, October, 2021
305
Table POL19_2
Table POL19_2: Do you agree or disagree with the following statements?The people who broke into the U.S. Capitol are representative of Donald Trump, but not the Republican Party
Demographic Strongly agreeSomewhatagree
Somewhatdisagree
Stronglydisagree
Don’t know /No opinion Total N
Registered Voters 19% (375) 22% (441) 17% (348) 27% (532) 15% (302) 1998Biden Job Strongly Approve 32% (135) 28% (117) 18% (73) 17% (73) 5% (19) 418Biden Job Somewhat Approve 24% (115) 33% (159) 23% (112) 11% (51) 9% (44) 481Biden Job Somewhat Disapprove 24% (60) 22% (56) 21% (53) 13% (31) 20% (51) 250Biden Job Strongly Disapprove 7% (52) 13% (99) 13% (106) 48% (375) 20% (156) 788Favorable of Biden 29% (271) 30% (276) 20% (183) 14% (131) 7% (64) 927Unfavorable of Biden 10% (99) 15% (158) 16% (158) 39% (399) 20% (205) 1019Very Favorable of Biden 33% (157) 28% (132) 17% (82) 17% (79) 5% (25) 476Somewhat Favorable of Biden 25% (114) 32% (144) 22% (101) 12% (52) 9% (39) 451Somewhat Unfavorable of Biden 23% (47) 24% (50) 21% (44) 11% (23) 21% (43) 207Very Unfavorable of Biden 6% (52) 13% (108) 14% (115) 46% (375) 20% (161) 812#1 Issue: Economy 16% (122) 22% (170) 17% (132) 27% (207) 18% (137) 768#1 Issue: Security 11% (39) 14% (50) 16% (58) 45% (160) 14% (52) 360#1 Issue: Health Care 22% (51) 30% (68) 19% (45) 12% (27) 17% (39) 231#1 Issue: Medicare / Social Security 27% (61) 24% (55) 16% (37) 22% (51) 10% (22) 227#1 Issue: Women’s Issues 23% (29) 30% (37) 21% (26) 15% (18) 11% (14) 125#1 Issue: Education 27% (16) 21% (13) 21% (12) 11% (7) 20% (12) 59#1 Issue: Energy 26% (28) 28% (30) 12% (13) 20% (22) 14% (15) 107#1 Issue: Other 23% (28) 14% (17) 20% (24) 33% (40) 10% (12) 1222020 Vote: Joe Biden 29% (278) 29% (272) 21% (197) 13% (126) 8% (73) 9462020 Vote: Donald Trump 7% (60) 15% (127) 15% (126) 44% (382) 20% (169) 8642020 Vote: Didn’t Vote 19% (29) 24% (36) 13% (20) 13% (19) 32% (49) 1532018 House Vote: Democrat 28% (214) 27% (210) 21% (161) 16% (124) 8% (58) 7692018 House Vote: Republican 10% (68) 15% (103) 15% (104) 45% (318) 16% (110) 7022016 Vote: Hillary Clinton 29% (201) 28% (189) 22% (152) 14% (95) 7% (49) 6852016 Vote: Donald Trump 10% (77) 14% (113) 15% (118) 45% (362) 16% (132) 8022016 Vote: Other 23% (19) 25% (21) 24% (20) 13% (11) 15% (12) 842016 Vote: Didn’t Vote 18% (78) 27% (116) 14% (59) 15% (62) 26% (108) 423Voted in 2014: Yes 20% (266) 20% (270) 18% (243) 30% (404) 11% (152) 1335Voted in 2014: No 16% (109) 26% (171) 16% (105) 19% (129) 23% (150) 663
Continued on next page
Page 306
306
Morning ConsultTable POL19_2
Table POL19_2: Do you agree or disagree with the following statements?The people who broke into the U.S. Capitol are representative of Donald Trump, but not the Republican Party
Demographic Strongly agreeSomewhatagree
Somewhatdisagree
Stronglydisagree
Don’t know /No opinion Total N
Registered Voters 19% (375) 22% (441) 17% (348) 27% (532) 15% (302) 19984-Region: Northeast 21% (72) 28% (100) 17% (58) 18% (64) 16% (58) 3534-Region: Midwest 19% (84) 16% (71) 19% (85) 35% (154) 11% (50) 4444-Region: South 17% (124) 21% (156) 15% (112) 31% (232) 16% (122) 7464-Region: West 21% (95) 25% (113) 20% (93) 18% (82) 16% (72) 455Party: Democrat/Leans Democrat 27% (248) 30% (270) 20% (182) 15% (134) 9% (81) 914Party: Republican/Leans Republican 9% (72) 15% (118) 15% (120) 43% (350) 18% (148) 808Note: Row proportions may total to larger than one-hundred percent due to rounding. For more information visit MorningConsultIntelligence.com.
Page 307
National Tracking Poll #2110084, October, 2021
307
Table POL19_3
Table POL19_3: Do you agree or disagree with the following statements?There has been too much focus on the January 6th events at the U.S. Capitol
Demographic Strongly agreeSomewhatagree
Somewhatdisagree
Stronglydisagree
Don’t know /No opinion Total N
Registered Voters 26% (514) 16% (322) 16% (319) 33% (658) 9% (184) 1998Gender: Male 30% (282) 16% (154) 15% (144) 31% (292) 7% (70) 942Gender: Female 22% (232) 16% (168) 17% (176) 35% (366) 11% (115) 1056Age: 18-34 20% (102) 19% (99) 22% (113) 25% (129) 14% (72) 514Age: 35-44 18% (55) 21% (64) 18% (55) 29% (89) 14% (44) 307Age: 45-64 31% (210) 15% (101) 13% (87) 35% (241) 6% (40) 679Age: 65+ 30% (148) 12% (58) 13% (64) 40% (199) 6% (28) 497GenZers: 1997-2012 11% (18) 15% (25) 26% (44) 34% (58) 15% (25) 170Millennials: 1981-1996 22% (124) 21% (116) 19% (105) 24% (134) 13% (73) 551GenXers: 1965-1980 28% (132) 16% (76) 16% (75) 32% (150) 8% (37) 469Baby Boomers: 1946-1964 29% (214) 13% (97) 12% (88) 39% (287) 6% (46) 732PID: Dem (no lean) 10% (76) 13% (103) 16% (124) 56% (431) 5% (43) 777PID: Ind (no lean) 21% (112) 17% (88) 19% (103) 28% (149) 14% (76) 528PID: Rep (no lean) 47% (326) 19% (130) 13% (93) 11% (78) 10% (66) 693PID/Gender: DemMen 12% (42) 16% (55) 16% (56) 52% (182) 5% (17) 352PID/Gender: DemWomen 8% (34) 11% (48) 16% (67) 59% (249) 6% (25) 425PID/Gender: Ind Men 25% (70) 17% (48) 19% (54) 26% (72) 13% (36) 280PID/Gender: Ind Women 17% (42) 16% (40) 20% (49) 31% (77) 16% (40) 248PID/Gender: Rep Men 55% (170) 16% (51) 11% (33) 12% (39) 5% (17) 310PID/Gender: Rep Women 41% (156) 21% (80) 15% (59) 10% (39) 13% (49) 384Ideo: Liberal (1-3) 8% (47) 11% (64) 14% (78) 62% (350) 5% (26) 566Ideo: Moderate (4) 17% (96) 18% (99) 22% (123) 35% (193) 9% (49) 560Ideo: Conservative (5-7) 49% (355) 19% (136) 13% (94) 12% (88) 8% (56) 730Educ: < College 26% (318) 14% (166) 16% (192) 32% (387) 12% (144) 1206Educ: Bachelors degree 25% (127) 20% (102) 16% (81) 32% (161) 6% (30) 501Educ: Post-grad 24% (70) 19% (54) 16% (46) 38% (110) 3% (10) 290Income: Under 50k 22% (189) 14% (118) 17% (152) 34% (296) 14% (118) 873Income: 50k-100k 30% (216) 15% (110) 14% (99) 35% (254) 7% (49) 728Income: 100k+ 27% (109) 24% (94) 17% (68) 27% (109) 4% (18) 398Ethnicity: White 29% (448) 17% (265) 15% (232) 31% (473) 8% (127) 1544Ethnicity: Hispanic 19% (43) 13% (28) 21% (47) 35% (77) 12% (27) 222
Continued on next page
Page 308
308
Morning ConsultTable POL19_3
Table POL19_3: Do you agree or disagree with the following statements?There has been too much focus on the January 6th events at the U.S. Capitol
Demographic Strongly agreeSomewhatagree
Somewhatdisagree
Stronglydisagree
Don’t know /No opinion Total N
Registered Voters 26% (514) 16% (322) 16% (319) 33% (658) 9% (184) 1998Ethnicity: Black 12% (31) 11% (29) 19% (48) 47% (119) 11% (27) 253Ethnicity: Other 18% (36) 14% (29) 20% (40) 33% (66) 15% (31) 201All Christian 30% (307) 19% (198) 16% (171) 27% (280) 8% (85) 1041All Non-Christian 21% (23) 13% (14) 14% (15) 45% (48) 7% (7) 107Atheist 13% (10) 11% (8) 12% (9) 59% (46) 5% (4) 78Agnostic/Nothing in particular 23% (110) 10% (50) 15% (74) 39% (189) 12% (56) 480Something Else 22% (64) 18% (52) 17% (50) 32% (95) 11% (33) 293Religious Non-Protestant/Catholic 26% (34) 11% (14) 15% (19) 40% (51) 8% (11) 129Evangelical 30% (152) 22% (111) 15% (75) 22% (112) 10% (48) 499Non-Evangelical 25% (200) 17% (131) 18% (139) 32% (256) 8% (64) 790Community: Urban 24% (117) 20% (99) 14% (66) 33% (159) 10% (47) 487Community: Suburban 24% (254) 15% (151) 18% (186) 36% (372) 7% (78) 1041Community: Rural 31% (143) 15% (72) 14% (67) 27% (128) 13% (60) 469Employ: Private Sector 28% (195) 20% (136) 15% (106) 29% (196) 8% (51) 684Employ: Government 19% (21) 20% (23) 18% (21) 34% (38) 8% (9) 112Employ: Self-Employed 25% (46) 18% (32) 25% (46) 26% (48) 6% (11) 183Employ: Homemaker 27% (28) 18% (19) 12% (12) 29% (30) 14% (14) 104Employ: Student 8% (5) 15% (10) 27% (18) 34% (23) 17% (11) 67Employ: Retired 31% (163) 11% (60) 13% (67) 40% (213) 6% (31) 534Employ: Unemployed 17% (32) 13% (25) 13% (24) 41% (78) 17% (32) 191Employ: Other 20% (24) 14% (17) 21% (26) 26% (32) 20% (24) 124Military HH: Yes 30% (94) 15% (46) 11% (35) 36% (113) 9% (28) 315Military HH: No 25% (421) 16% (276) 17% (284) 32% (545) 9% (157) 1683RD/WT: Right Direction 10% (77) 14% (106) 18% (134) 52% (394) 6% (47) 757RD/WT: Wrong Track 35% (437) 17% (216) 15% (185) 21% (264) 11% (138) 1241Biden Job Approve 9% (78) 14% (122) 19% (167) 54% (488) 5% (44) 899Biden Job Disapprove 42% (431) 19% (196) 13% (139) 15% (161) 11% (112) 1039
Continued on next page
Page 309
National Tracking Poll #2110084, October, 2021
309
Table POL19_3
Table POL19_3: Do you agree or disagree with the following statements?There has been too much focus on the January 6th events at the U.S. Capitol
Demographic Strongly agreeSomewhatagree
Somewhatdisagree
Stronglydisagree
Don’t know /No opinion Total N
Registered Voters 26% (514) 16% (322) 16% (319) 33% (658) 9% (184) 1998Biden Job Strongly Approve 11% (46) 14% (57) 13% (55) 59% (247) 3% (12) 418Biden Job Somewhat Approve 7% (32) 13% (64) 23% (112) 50% (241) 7% (32) 481Biden Job Somewhat Disapprove 15% (38) 19% (49) 22% (56) 32% (80) 11% (28) 250Biden Job Strongly Disapprove 50% (393) 19% (147) 11% (83) 10% (80) 11% (84) 788Favorable of Biden 9% (80) 13% (117) 19% (173) 55% (509) 5% (47) 927Unfavorable of Biden 42% (429) 19% (189) 14% (141) 14% (144) 11% (115) 1019Very Favorable of Biden 12% (55) 12% (56) 14% (66) 59% (280) 4% (18) 476Somewhat Favorable of Biden 6% (25) 14% (61) 24% (107) 51% (229) 6% (28) 451Somewhat Unfavorable of Biden 16% (33) 20% (41) 24% (49) 28% (58) 13% (26) 207Very Unfavorable of Biden 49% (396) 18% (149) 11% (92) 11% (87) 11% (88) 812#1 Issue: Economy 27% (207) 20% (154) 17% (128) 26% (198) 11% (81) 768#1 Issue: Security 50% (179) 13% (45) 12% (43) 18% (64) 8% (29) 360#1 Issue: Health Care 9% (21) 17% (38) 17% (38) 45% (105) 12% (28) 231#1 Issue: Medicare / Social Security 19% (43) 14% (32) 14% (31) 48% (108) 5% (11) 227#1 Issue: Women’s Issues 9% (11) 10% (13) 23% (29) 50% (62) 7% (9) 125#1 Issue: Education 17% (10) 10% (6) 19% (11) 42% (25) 12% (7) 59#1 Issue: Energy 16% (17) 19% (20) 19% (21) 36% (39) 10% (10) 107#1 Issue: Other 21% (26) 11% (13) 14% (17) 46% (57) 8% (9) 1222020 Vote: Joe Biden 8% (73) 13% (124) 19% (177) 55% (516) 6% (57) 9462020 Vote: Donald Trump 48% (415) 19% (166) 13% (110) 10% (88) 10% (84) 8642020 Vote: Didn’t Vote 13% (19) 18% (27) 17% (26) 28% (43) 24% (37) 1532018 House Vote: Democrat 10% (79) 12% (94) 16% (124) 56% (430) 5% (42) 7692018 House Vote: Republican 49% (341) 19% (134) 13% (90) 12% (86) 7% (50) 7022016 Vote: Hillary Clinton 9% (58) 11% (77) 16% (113) 58% (398) 6% (38) 6852016 Vote: Donald Trump 48% (384) 18% (144) 13% (101) 13% (107) 8% (66) 8022016 Vote: Other 15% (13) 17% (15) 24% (20) 35% (29) 8% (7) 842016 Vote: Didn’t Vote 14% (57) 20% (86) 20% (85) 29% (121) 17% (73) 423Voted in 2014: Yes 30% (395) 15% (206) 14% (185) 35% (467) 6% (82) 1335Voted in 2014: No 18% (120) 17% (116) 20% (134) 29% (191) 15% (102) 663
Continued on next page
Page 310
310
Morning ConsultTable POL19_3
Table POL19_3: Do you agree or disagree with the following statements?There has been too much focus on the January 6th events at the U.S. Capitol
Demographic Strongly agreeSomewhatagree
Somewhatdisagree
Stronglydisagree
Don’t know /No opinion Total N
Registered Voters 26% (514) 16% (322) 16% (319) 33% (658) 9% (184) 19984-Region: Northeast 23% (81) 18% (63) 17% (59) 32% (112) 11% (38) 3534-Region: Midwest 27% (122) 14% (63) 16% (73) 35% (157) 7% (30) 4444-Region: South 27% (205) 16% (119) 16% (116) 30% (223) 11% (83) 7464-Region: West 24% (107) 17% (78) 16% (71) 36% (166) 7% (33) 455Party: Democrat/Leans Democrat 9% (79) 12% (113) 18% (166) 55% (503) 6% (53) 914Party: Republican/Leans Republican 46% (376) 19% (151) 14% (109) 11% (92) 10% (80) 808Note: Row proportions may total to larger than one-hundred percent due to rounding. For more information visit MorningConsultIntelligence.com.
Page 311
National Tracking Poll #2110084, October, 2021
311
Table POL19_4
Table POL19_4: Do you agree or disagree with the following statements?There has not been enough focus on the January 6th events at the U.S. Capitol
Demographic Strongly agreeSomewhatagree
Somewhatdisagree
Stronglydisagree
Don’t know /No opinion Total N
Registered Voters 26% (525) 19% (375) 16% (321) 28% (569) 10% (208) 1998Gender: Male 25% (234) 21% (197) 15% (146) 31% (288) 8% (77) 942Gender: Female 28% (291) 17% (179) 17% (175) 27% (281) 12% (131) 1056Age: 18-34 25% (128) 26% (132) 17% (88) 18% (90) 15% (77) 514Age: 35-44 27% (82) 23% (70) 16% (51) 18% (55) 16% (48) 307Age: 45-64 25% (167) 15% (102) 14% (96) 38% (257) 8% (56) 679Age: 65+ 30% (148) 14% (71) 17% (86) 33% (166) 5% (26) 497GenZers: 1997-2012 26% (45) 26% (44) 17% (28) 13% (23) 18% (30) 170Millennials: 1981-1996 26% (141) 24% (133) 18% (98) 19% (105) 14% (75) 551GenXers: 1965-1980 23% (110) 19% (90) 15% (70) 32% (152) 10% (47) 469Baby Boomers: 1946-1964 28% (206) 13% (98) 15% (107) 37% (268) 7% (52) 732PID: Dem (no lean) 44% (339) 25% (195) 14% (106) 11% (84) 7% (53) 777PID: Ind (no lean) 22% (115) 19% (102) 16% (85) 27% (142) 16% (83) 528PID: Rep (no lean) 10% (71) 11% (79) 19% (129) 49% (343) 10% (71) 693PID/Gender: DemMen 43% (153) 27% (96) 13% (46) 10% (37) 6% (20) 352PID/Gender: DemWomen 44% (186) 23% (99) 14% (60) 11% (47) 8% (33) 425PID/Gender: Ind Men 19% (53) 23% (65) 15% (41) 31% (87) 12% (34) 280PID/Gender: Ind Women 25% (62) 15% (37) 18% (45) 22% (55) 20% (49) 248PID/Gender: Rep Men 9% (28) 11% (36) 19% (59) 53% (164) 7% (23) 310PID/Gender: Rep Women 11% (43) 11% (43) 18% (70) 46% (178) 13% (48) 384Ideo: Liberal (1-3) 46% (261) 25% (140) 14% (81) 9% (50) 6% (35) 566Ideo: Moderate (4) 27% (153) 24% (132) 18% (100) 22% (121) 10% (53) 560Ideo: Conservative (5-7) 13% (93) 11% (82) 16% (120) 52% (379) 8% (57) 730Educ: < College 25% (302) 17% (202) 14% (170) 30% (367) 14% (165) 1206Educ: Bachelors degree 27% (135) 23% (113) 18% (90) 26% (133) 6% (31) 501Educ: Post-grad 30% (88) 21% (61) 21% (60) 24% (69) 4% (12) 290Income: Under 50k 27% (235) 19% (169) 15% (128) 24% (209) 15% (132) 873Income: 50k-100k 27% (194) 16% (116) 16% (116) 34% (248) 7% (54) 728Income: 100k+ 24% (96) 23% (90) 19% (77) 28% (112) 5% (22) 398Ethnicity: White 24% (373) 17% (262) 17% (268) 32% (489) 10% (152) 1544Ethnicity: Hispanic 29% (65) 22% (50) 12% (27) 23% (50) 14% (31) 222
Continued on next page
Page 312
312
Morning ConsultTable POL19_4
Table POL19_4: Do you agree or disagree with the following statements?There has not been enough focus on the January 6th events at the U.S. Capitol
Demographic Strongly agreeSomewhatagree
Somewhatdisagree
Stronglydisagree
Don’t know /No opinion Total N
Registered Voters 26% (525) 19% (375) 16% (321) 28% (569) 10% (208) 1998Ethnicity: Black 40% (101) 26% (65) 11% (27) 14% (34) 10% (26) 253Ethnicity: Other 25% (51) 24% (48) 13% (26) 23% (46) 15% (30) 201All Christian 23% (237) 18% (189) 19% (198) 31% (325) 9% (93) 1041All Non-Christian 40% (43) 19% (20) 14% (15) 18% (20) 8% (9) 107Atheist 36% (28) 21% (16) 13% (10) 26% (20) 4% (3) 78Agnostic/Nothing in particular 28% (134) 22% (104) 12% (56) 25% (120) 14% (66) 480Something Else 28% (83) 16% (47) 14% (42) 29% (85) 12% (36) 293Religious Non-Protestant/Catholic 36% (46) 18% (23) 17% (22) 20% (26) 9% (12) 129Evangelical 22% (109) 20% (98) 17% (83) 32% (159) 10% (50) 499Non-Evangelical 25% (200) 16% (129) 18% (145) 31% (242) 9% (74) 790Community: Urban 33% (163) 25% (122) 12% (57) 19% (93) 11% (52) 487Community: Suburban 25% (264) 19% (202) 18% (191) 28% (294) 9% (90) 1041Community: Rural 21% (99) 11% (51) 15% (72) 39% (182) 14% (65) 469Employ: Private Sector 26% (180) 19% (128) 17% (118) 29% (200) 9% (59) 684Employ: Government 26% (29) 17% (19) 21% (24) 23% (25) 13% (14) 112Employ: Self-Employed 24% (44) 31% (57) 12% (22) 24% (45) 8% (15) 183Employ: Homemaker 23% (24) 17% (18) 14% (14) 30% (31) 16% (17) 104Employ: Student 32% (22) 10% (7) 25% (17) 18% (12) 14% (9) 67Employ: Retired 28% (148) 16% (83) 15% (80) 35% (187) 7% (35) 534Employ: Unemployed 23% (44) 24% (45) 12% (22) 24% (45) 18% (35) 191Employ: Other 28% (35) 15% (19) 19% (24) 19% (23) 18% (23) 124Military HH: Yes 25% (80) 12% (39) 17% (54) 34% (107) 11% (34) 315Military HH: No 26% (446) 20% (336) 16% (266) 27% (462) 10% (173) 1683RD/WT: Right Direction 41% (311) 28% (209) 15% (115) 9% (71) 7% (52) 757RD/WT: Wrong Track 17% (214) 13% (166) 17% (206) 40% (498) 13% (156) 1241Biden Job Approve 42% (375) 27% (245) 16% (142) 9% (81) 6% (56) 899Biden Job Disapprove 14% (142) 11% (119) 17% (174) 46% (482) 12% (121) 1039
Continued on next page
Page 313
National Tracking Poll #2110084, October, 2021
313
Table POL19_4
Table POL19_4: Do you agree or disagree with the following statements?There has not been enough focus on the January 6th events at the U.S. Capitol
Demographic Strongly agreeSomewhatagree
Somewhatdisagree
Stronglydisagree
Don’t know /No opinion Total N
Registered Voters 26% (525) 19% (375) 16% (321) 28% (569) 10% (208) 1998Biden Job Strongly Approve 52% (217) 23% (98) 12% (52) 9% (36) 4% (15) 418Biden Job Somewhat Approve 33% (158) 31% (147) 19% (90) 9% (45) 9% (41) 481Biden Job Somewhat Disapprove 22% (55) 24% (59) 20% (50) 22% (55) 13% (31) 250Biden Job Strongly Disapprove 11% (88) 8% (60) 16% (124) 54% (427) 11% (89) 788Favorable of Biden 42% (392) 27% (252) 15% (136) 9% (82) 7% (64) 927Unfavorable of Biden 13% (128) 11% (115) 17% (177) 47% (477) 12% (121) 1019Very Favorable of Biden 52% (249) 23% (109) 11% (53) 9% (44) 4% (21) 476Somewhat Favorable of Biden 32% (143) 32% (143) 18% (83) 9% (38) 10% (43) 451Somewhat Unfavorable of Biden 18% (38) 22% (45) 23% (48) 24% (49) 13% (27) 207Very Unfavorable of Biden 11% (90) 9% (70) 16% (130) 53% (428) 12% (94) 812#1 Issue: Economy 22% (166) 18% (139) 17% (128) 31% (237) 13% (99) 768#1 Issue: Security 14% (49) 13% (47) 12% (43) 53% (190) 8% (30) 360#1 Issue: Health Care 39% (89) 19% (44) 17% (38) 14% (33) 12% (27) 231#1 Issue: Medicare / Social Security 37% (84) 20% (45) 19% (43) 20% (46) 4% (9) 227#1 Issue: Women’s Issues 36% (45) 20% (25) 25% (31) 9% (11) 10% (12) 125#1 Issue: Education 29% (17) 27% (16) 14% (8) 18% (11) 12% (7) 59#1 Issue: Energy 27% (29) 35% (37) 11% (12) 13% (14) 14% (15) 107#1 Issue: Other 38% (46) 17% (21) 15% (18) 23% (28) 7% (9) 1222020 Vote: Joe Biden 43% (408) 26% (244) 15% (141) 9% (87) 7% (65) 9462020 Vote: Donald Trump 9% (78) 11% (91) 17% (151) 52% (447) 11% (97) 8642020 Vote: Didn’t Vote 21% (32) 21% (32) 16% (25) 17% (27) 25% (38) 1532018 House Vote: Democrat 43% (327) 26% (200) 14% (106) 12% (95) 5% (41) 7692018 House Vote: Republican 13% (88) 10% (68) 17% (122) 52% (362) 9% (62) 7022016 Vote: Hillary Clinton 45% (307) 26% (175) 14% (96) 10% (65) 6% (41) 6852016 Vote: Donald Trump 12% (98) 10% (83) 16% (129) 52% (419) 9% (72) 8022016 Vote: Other 22% (19) 27% (23) 25% (21) 18% (15) 7% (6) 842016 Vote: Didn’t Vote 23% (99) 22% (94) 18% (75) 16% (70) 20% (86) 423Voted in 2014: Yes 29% (383) 17% (228) 16% (208) 32% (422) 7% (95) 1335Voted in 2014: No 21% (142) 22% (148) 17% (113) 22% (148) 17% (113) 663
Continued on next page
Page 314
314
Morning ConsultTable POL19_4
Table POL19_4: Do you agree or disagree with the following statements?There has not been enough focus on the January 6th events at the U.S. Capitol
Demographic Strongly agreeSomewhatagree
Somewhatdisagree
Stronglydisagree
Don’t know /No opinion Total N
Registered Voters 26% (525) 19% (375) 16% (321) 28% (569) 10% (208) 19984-Region: Northeast 28% (98) 19% (66) 15% (54) 27% (97) 11% (38) 3534-Region: Midwest 27% (118) 19% (85) 14% (64) 32% (142) 8% (36) 4444-Region: South 25% (188) 16% (117) 16% (122) 31% (229) 12% (89) 7464-Region: West 27% (122) 23% (107) 18% (81) 22% (101) 10% (45) 455Party: Democrat/Leans Democrat 43% (391) 26% (236) 14% (132) 10% (93) 7% (63) 914Party: Republican/Leans Republican 10% (83) 12% (93) 18% (145) 49% (400) 11% (87) 808Note: Row proportions may total to larger than one-hundred percent due to rounding. For more information visit MorningConsultIntelligence.com.
Page 315
National Tracking Poll #2110084, October, 2021
315
Table POL20
Table POL20: As you may know, House Speaker Nancy Pelosi (D-Calif.) appointed seven Democrats and two Republicans to serve on a special con-gressional committee to investigate the events that occurred at the U.S. Capitol on January 6th.Based on what you know, do you approve or disapproveof the special congressional committee investigating the events that occurred at the U.S. Capitol on January 6th?
DemographicStronglyapprove
Somewhatapprove
Somewhatdisapprove
Stronglydisapprove
Don’t know /No opinion Total N
Registered Voters 30% (609) 18% (367) 11% (217) 26% (516) 14% (289) 1998Gender: Male 32% (303) 19% (182) 12% (111) 27% (250) 10% (95) 942Gender: Female 29% (306) 18% (185) 10% (106) 25% (266) 18% (194) 1056Age: 18-34 24% (122) 26% (134) 11% (55) 14% (74) 25% (129) 514Age: 35-44 31% (97) 25% (77) 9% (28) 17% (53) 17% (52) 307Age: 45-64 30% (204) 15% (99) 13% (89) 31% (207) 12% (79) 679Age: 65+ 37% (186) 12% (58) 9% (44) 36% (181) 6% (28) 497GenZers: 1997-2012 15% (26) 24% (41) 7% (12) 16% (28) 37% (63) 170Millennials: 1981-1996 31% (170) 26% (141) 11% (61) 15% (83) 17% (96) 551GenXers: 1965-1980 27% (127) 19% (90) 12% (56) 27% (127) 15% (70) 469Baby Boomers: 1946-1964 35% (257) 12% (90) 10% (75) 35% (253) 8% (56) 732PID: Dem (no lean) 58% (447) 23% (179) 4% (33) 5% (40) 10% (78) 777PID: Ind (no lean) 22% (117) 22% (114) 11% (58) 22% (115) 23% (124) 528PID: Rep (no lean) 7% (45) 11% (75) 18% (125) 52% (360) 13% (87) 693PID/Gender: DemMen 63% (221) 24% (83) 4% (13) 3% (12) 7% (23) 352PID/Gender: DemWomen 53% (226) 22% (95) 5% (21) 7% (28) 13% (55) 425PID/Gender: Ind Men 21% (59) 22% (62) 15% (41) 24% (67) 18% (50) 280PID/Gender: Ind Women 23% (58) 21% (52) 7% (17) 20% (49) 30% (73) 248PID/Gender: Rep Men 7% (23) 12% (37) 18% (57) 55% (171) 7% (22) 310PID/Gender: Rep Women 6% (23) 10% (38) 18% (68) 49% (189) 17% (66) 384Ideo: Liberal (1-3) 58% (327) 21% (117) 5% (30) 6% (34) 10% (58) 566Ideo: Moderate (4) 37% (206) 28% (157) 10% (54) 13% (74) 12% (69) 560Ideo: Conservative (5-7) 9% (69) 10% (72) 17% (125) 53% (388) 10% (76) 730Educ: < College 25% (301) 18% (212) 11% (136) 28% (341) 18% (216) 1206Educ: Bachelors degree 36% (180) 19% (93) 11% (55) 24% (118) 11% (55) 501Educ: Post-grad 44% (129) 21% (62) 9% (26) 20% (57) 6% (18) 290Income: Under 50k 28% (247) 18% (161) 10% (83) 24% (211) 20% (171) 873Income: 50k-100k 30% (219) 17% (120) 12% (88) 30% (215) 12% (86) 728Income: 100k+ 36% (144) 22% (86) 11% (46) 23% (90) 8% (32) 398Ethnicity: White 28% (425) 17% (269) 12% (180) 30% (457) 14% (212) 1544
Continued on next page
Page 316
316
Morning ConsultTable POL20
Table POL20: As you may know, House Speaker Nancy Pelosi (D-Calif.) appointed seven Democrats and two Republicans to serve on a special con-gressional committee to investigate the events that occurred at the U.S. Capitol on January 6th.Based on what you know, do you approve or disapproveof the special congressional committee investigating the events that occurred at the U.S. Capitol on January 6th?
DemographicStronglyapprove
Somewhatapprove
Somewhatdisapprove
Stronglydisapprove
Don’t know /No opinion Total N
Registered Voters 30% (609) 18% (367) 11% (217) 26% (516) 14% (289) 1998Ethnicity: Hispanic 30% (67) 18% (39) 9% (20) 19% (43) 24% (53) 222Ethnicity: Black 46% (117) 21% (54) 5% (12) 9% (23) 19% (47) 253Ethnicity: Other 33% (67) 22% (45) 12% (24) 18% (36) 15% (30) 201All Christian 28% (296) 17% (174) 12% (122) 31% (324) 12% (125) 1041All Non-Christian 53% (57) 12% (13) 6% (7) 19% (20) 10% (10) 107Atheist 52% (40) 24% (19) 6% (5) 15% (12) 3% (3) 78Agnostic/Nothing in particular 28% (135) 22% (106) 11% (51) 20% (95) 19% (93) 480Something Else 28% (81) 19% (55) 11% (32) 23% (66) 20% (58) 293Religious Non-Protestant/Catholic 48% (61) 13% (16) 10% (12) 20% (26) 10% (13) 129Evangelical 22% (112) 18% (89) 12% (59) 33% (167) 15% (72) 499Non-Evangelical 31% (249) 17% (133) 11% (88) 27% (214) 13% (106) 790Community: Urban 40% (195) 23% (114) 9% (43) 15% (71) 13% (64) 487Community: Suburban 30% (312) 18% (191) 11% (110) 27% (284) 14% (145) 1041Community: Rural 22% (101) 13% (63) 13% (63) 34% (161) 17% (81) 469Employ: Private Sector 29% (201) 22% (151) 12% (83) 23% (158) 13% (91) 684Employ: Government 36% (41) 18% (21) 12% (14) 20% (23) 13% (14) 112Employ: Self-Employed 30% (55) 17% (32) 13% (24) 24% (43) 16% (29) 183Employ: Homemaker 17% (18) 24% (25) 9% (9) 26% (27) 24% (25) 104Employ: Student 24% (16) 30% (20) 5% (3) 14% (10) 27% (18) 67Employ: Retired 37% (199) 10% (53) 9% (49) 37% (196) 7% (36) 534Employ: Unemployed 30% (58) 19% (36) 12% (22) 15% (30) 24% (45) 191Employ: Other 17% (21) 24% (29) 10% (12) 24% (30) 26% (32) 124Military HH: Yes 31% (98) 13% (40) 11% (34) 32% (101) 13% (41) 315Military HH: No 30% (511) 19% (327) 11% (182) 25% (415) 15% (248) 1683RD/WT: Right Direction 57% (432) 25% (186) 5% (37) 4% (33) 9% (69) 757RD/WT: Wrong Track 14% (177) 15% (181) 14% (180) 39% (483) 18% (220) 1241Biden Job Approve 58% (520) 26% (231) 4% (40) 4% (32) 9% (77) 899Biden Job Disapprove 8% (84) 12% (129) 17% (173) 47% (484) 16% (169) 1039
Continued on next page
Page 317
National Tracking Poll #2110084, October, 2021
317
Table POL20
Table POL20: As you may know, House Speaker Nancy Pelosi (D-Calif.) appointed seven Democrats and two Republicans to serve on a special con-gressional committee to investigate the events that occurred at the U.S. Capitol on January 6th.Based on what you know, do you approve or disapproveof the special congressional committee investigating the events that occurred at the U.S. Capitol on January 6th?
DemographicStronglyapprove
Somewhatapprove
Somewhatdisapprove
Stronglydisapprove
Don’t know /No opinion Total N
Registered Voters 30% (609) 18% (367) 11% (217) 26% (516) 14% (289) 1998Biden Job Strongly Approve 74% (311) 16% (66) 3% (12) 2% (9) 5% (20) 418Biden Job Somewhat Approve 43% (209) 34% (165) 6% (28) 5% (22) 12% (56) 481Biden Job Somewhat Disapprove 19% (48) 29% (74) 20% (50) 11% (29) 20% (51) 250Biden Job Strongly Disapprove 5% (36) 7% (55) 16% (123) 58% (455) 15% (118) 788Favorable of Biden 57% (527) 25% (234) 4% (38) 4% (34) 10% (93) 927Unfavorable of Biden 7% (75) 12% (125) 17% (174) 47% (476) 17% (168) 1019Very Favorable of Biden 71% (338) 17% (83) 2% (11) 4% (17) 6% (26) 476Somewhat Favorable of Biden 42% (189) 34% (151) 6% (27) 4% (17) 15% (67) 451Somewhat Unfavorable of Biden 19% (40) 29% (60) 21% (44) 9% (18) 22% (45) 207Very Unfavorable of Biden 4% (36) 8% (65) 16% (130) 56% (458) 15% (124) 812#1 Issue: Economy 23% (180) 20% (151) 13% (101) 26% (197) 18% (139) 768#1 Issue: Security 16% (59) 11% (41) 11% (40) 52% (186) 9% (33) 360#1 Issue: Health Care 42% (98) 23% (53) 10% (22) 8% (19) 17% (39) 231#1 Issue: Medicare / Social Security 47% (107) 15% (34) 10% (22) 21% (48) 7% (16) 227#1 Issue: Women’s Issues 39% (49) 21% (26) 9% (11) 9% (12) 22% (27) 125#1 Issue: Education 32% (19) 22% (13) 9% (5) 17% (10) 20% (12) 59#1 Issue: Energy 44% (47) 31% (33) 5% (6) 8% (8) 12% (13) 107#1 Issue: Other 41% (50) 13% (16) 9% (10) 29% (36) 8% (10) 1222020 Vote: Joe Biden 56% (534) 24% (229) 4% (42) 4% (37) 11% (104) 9462020 Vote: Donald Trump 6% (48) 11% (96) 18% (154) 52% (448) 14% (118) 8642020 Vote: Didn’t Vote 14% (22) 25% (38) 10% (16) 13% (20) 38% (58) 1532018 House Vote: Democrat 57% (439) 22% (172) 4% (29) 6% (49) 10% (79) 7692018 House Vote: Republican 9% (65) 11% (75) 17% (120) 54% (378) 9% (63) 7022016 Vote: Hillary Clinton 61% (420) 22% (151) 3% (22) 4% (29) 9% (63) 6852016 Vote: Donald Trump 9% (70) 12% (94) 17% (135) 51% (410) 12% (93) 8022016 Vote: Other 31% (26) 17% (14) 16% (13) 22% (18) 15% (12) 842016 Vote: Didn’t Vote 22% (93) 25% (105) 11% (47) 13% (57) 29% (121) 423Voted in 2014: Yes 35% (462) 16% (215) 10% (129) 31% (410) 9% (119) 1335Voted in 2014: No 22% (147) 23% (152) 13% (87) 16% (106) 26% (170) 663
Continued on next page
Page 318
318
Morning ConsultTable POL20
Table POL20: As you may know, House Speaker Nancy Pelosi (D-Calif.) appointed seven Democrats and two Republicans to serve on a special con-gressional committee to investigate the events that occurred at the U.S. Capitol on January 6th.Based on what you know, do you approve or disapproveof the special congressional committee investigating the events that occurred at the U.S. Capitol on January 6th?
DemographicStronglyapprove
Somewhatapprove
Somewhatdisapprove
Stronglydisapprove
Don’t know /No opinion Total N
Registered Voters 30% (609) 18% (367) 11% (217) 26% (516) 14% (289) 19984-Region: Northeast 34% (121) 24% (85) 9% (30) 19% (66) 14% (50) 3534-Region: Midwest 29% (127) 18% (79) 10% (46) 30% (133) 13% (59) 4444-Region: South 26% (191) 15% (114) 11% (85) 30% (223) 18% (133) 7464-Region: West 37% (170) 19% (89) 12% (55) 21% (94) 10% (47) 455Party: Democrat/Leans Democrat 56% (512) 24% (219) 5% (43) 5% (46) 10% (94) 914Party: Republican/Leans Republican 6% (50) 11% (93) 17% (141) 51% (411) 14% (113) 808Note: Row proportions may total to larger than one-hundred percent due to rounding. For more information visit MorningConsultIntelligence.com.
Page 319
National Tracking Poll #2110084, October, 2021
319
Table POLx_1
Table POLx_1: Next we will look at a list of names that are active in politics. It is a long list, please take the time to go through the list carefullyand give an individual answer for each name below. For each person, please indicate if you have a Very Favorable, Somewhat Favorable, SomewhatUnfavorable, or Very Unfavorable opinion of each If you have heard of the person, but do not have an opinion, please mark ’Heard Of, No Opinion.’ Ifyou have not heard of the person, please mark ’Never Heard Of.’Mitch McConnell
Demographic Total Favorable Total UnfavorableHeard Of, NoOpinion Never Heard Of Total N
Registered Voters 22% (448) 56% (1111) 15% (307) 7% (131) 1998Gender: Male 28% (264) 58% (547) 11% (103) 3% (28) 942Gender: Female 17% (185) 53% (564) 19% (204) 10% (103) 1056Age: 18-34 20% (101) 42% (218) 20% (101) 18% (94) 514Age: 35-44 27% (82) 46% (140) 20% (61) 8% (24) 307Age: 45-64 21% (141) 64% (436) 13% (90) 2% (13) 679Age: 65+ 25% (125) 64% (317) 11% (55) — (0) 497GenZers: 1997-2012 9% (16) 45% (77) 18% (30) 28% (48) 170Millennials: 1981-1996 25% (138) 43% (235) 21% (116) 11% (63) 551GenXers: 1965-1980 21% (98) 59% (276) 16% (75) 4% (20) 469Baby Boomers: 1946-1964 24% (175) 65% (474) 11% (82) — (1) 732PID: Dem (no lean) 12% (97) 68% (528) 13% (104) 6% (48) 777PID: Ind (no lean) 14% (73) 59% (312) 17% (91) 10% (51) 528PID: Rep (no lean) 40% (279) 39% (271) 16% (112) 5% (32) 693PID/Gender: DemMen 16% (58) 69% (244) 12% (41) 3% (9) 352PID/Gender: DemWomen 9% (39) 67% (284) 15% (63) 9% (39) 425PID/Gender: Ind Men 18% (50) 65% (183) 12% (33) 5% (13) 280PID/Gender: Ind Women 9% (23) 52% (129) 23% (58) 15% (38) 248PID/Gender: Rep Men 50% (155) 39% (120) 9% (29) 2% (6) 310PID/Gender: Rep Women 32% (123) 39% (151) 22% (83) 7% (26) 384Ideo: Liberal (1-3) 11% (61) 75% (423) 7% (42) 7% (40) 566Ideo: Moderate (4) 19% (107) 56% (314) 20% (109) 5% (30) 560Ideo: Conservative (5-7) 36% (264) 46% (336) 14% (105) 3% (25) 730Educ: < College 19% (224) 56% (670) 18% (215) 8% (97) 1206Educ: Bachelors degree 28% (142) 55% (274) 13% (63) 4% (22) 501Educ: Post-grad 28% (83) 57% (167) 10% (29) 4% (12) 290Income: Under 50k 16% (139) 56% (487) 20% (170) 9% (77) 873Income: 50k-100k 24% (175) 58% (421) 13% (95) 5% (37) 728Income: 100k+ 34% (135) 51% (203) 11% (42) 4% (17) 398
Continued on next page
Page 320
320
Morning ConsultTable POLx_1
Table POLx_1: Next we will look at a list of names that are active in politics. It is a long list, please take the time to go through the list carefullyand give an individual answer for each name below. For each person, please indicate if you have a Very Favorable, Somewhat Favorable, SomewhatUnfavorable, or Very Unfavorable opinion of each If you have heard of the person, but do not have an opinion, please mark ’Heard Of, No Opinion.’ Ifyou have not heard of the person, please mark ’Never Heard Of.’Mitch McConnell
Demographic Total Favorable Total UnfavorableHeard Of, NoOpinion Never Heard Of Total N
Registered Voters 22% (448) 56% (1111) 15% (307) 7% (131) 1998Ethnicity: White 26% (397) 55% (853) 13% (204) 6% (90) 1544Ethnicity: Hispanic 10% (22) 53% (119) 19% (43) 17% (38) 222Ethnicity: Black 12% (30) 60% (152) 18% (45) 10% (26) 253Ethnicity: Other 11% (22) 53% (106) 29% (58) 8% (15) 201All Christian 29% (303) 53% (550) 14% (148) 4% (40) 1041All Non-Christian 23% (24) 60% (64) 6% (7) 11% (12) 107Atheist 11% (8) 77% (60) 8% (7) 4% (3) 78Agnostic/Nothing in particular 15% (74) 58% (281) 17% (82) 9% (44) 480Something Else 13% (39) 54% (157) 22% (65) 11% (32) 293Religious Non-Protestant/Catholic 26% (34) 53% (69) 10% (13) 10% (13) 129Evangelical 31% (152) 46% (227) 17% (83) 7% (35) 499Non-Evangelical 22% (170) 59% (466) 15% (119) 4% (35) 790Community: Urban 28% (138) 49% (239) 16% (76) 7% (35) 487Community: Suburban 19% (199) 59% (615) 15% (160) 6% (67) 1041Community: Rural 24% (112) 55% (257) 15% (72) 6% (29) 469Employ: Private Sector 27% (183) 52% (353) 16% (108) 6% (40) 684Employ: Government 26% (29) 53% (60) 9% (10) 12% (14) 112Employ: Self-Employed 21% (38) 53% (97) 18% (33) 8% (14) 183Employ: Homemaker 11% (12) 50% (52) 27% (28) 11% (12) 104Employ: Student 11% (8) 46% (31) 18% (12) 24% (16) 67Employ: Retired 24% (130) 68% (364) 7% (39) — (1) 534Employ: Unemployed 12% (23) 57% (108) 21% (41) 10% (19) 191Employ: Other 21% (26) 38% (46) 29% (36) 12% (15) 124Military HH: Yes 22% (70) 61% (192) 12% (39) 4% (14) 315Military HH: No 22% (378) 55% (919) 16% (268) 7% (117) 1683RD/WT: Right Direction 18% (139) 64% (488) 12% (87) 6% (43) 757RD/WT: Wrong Track 25% (310) 50% (623) 18% (220) 7% (88) 1241
Continued on next page
Page 321
National Tracking Poll #2110084, October, 2021
321
Table POLx_1
Table POLx_1: Next we will look at a list of names that are active in politics. It is a long list, please take the time to go through the list carefullyand give an individual answer for each name below. For each person, please indicate if you have a Very Favorable, Somewhat Favorable, SomewhatUnfavorable, or Very Unfavorable opinion of each If you have heard of the person, but do not have an opinion, please mark ’Heard Of, No Opinion.’ Ifyou have not heard of the person, please mark ’Never Heard Of.’Mitch McConnell
Demographic Total Favorable Total UnfavorableHeard Of, NoOpinion Never Heard Of Total N
Registered Voters 22% (448) 56% (1111) 15% (307) 7% (131) 1998Biden Job Approve 17% (149) 66% (598) 12% (107) 5% (45) 899Biden Job Disapprove 29% (297) 48% (497) 17% (181) 6% (64) 1039Biden Job Strongly Approve 17% (73) 71% (298) 9% (36) 3% (11) 418Biden Job Somewhat Approve 16% (77) 62% (299) 15% (71) 7% (34) 481Biden Job Somewhat Disapprove 16% (41) 54% (134) 23% (57) 7% (18) 250Biden Job Strongly Disapprove 33% (256) 46% (363) 16% (123) 6% (46) 788Favorable of Biden 16% (152) 66% (614) 12% (108) 6% (52) 927Unfavorable of Biden 29% (293) 48% (490) 17% (172) 6% (64) 1019Very Favorable of Biden 18% (84) 70% (332) 9% (42) 4% (18) 476Somewhat Favorable of Biden 15% (69) 63% (283) 15% (66) 8% (34) 451Somewhat Unfavorable of Biden 18% (38) 52% (108) 23% (47) 7% (14) 207Very Unfavorable of Biden 31% (255) 47% (382) 15% (125) 6% (50) 812#1 Issue: Economy 23% (176) 52% (397) 18% (136) 8% (59) 768#1 Issue: Security 35% (126) 47% (170) 13% (46) 5% (18) 360#1 Issue: Health Care 18% (41) 62% (142) 15% (35) 5% (13) 231#1 Issue: Medicare / Social Security 20% (45) 70% (158) 10% (22) 1% (2) 227#1 Issue: Women’s Issues 7% (9) 62% (78) 18% (22) 13% (16) 125#1 Issue: Education 19% (11) 59% (35) 8% (5) 14% (8) 59#1 Issue: Energy 21% (23) 50% (53) 22% (24) 7% (7) 107#1 Issue: Other 14% (18) 65% (79) 15% (18) 6% (8) 1222020 Vote: Joe Biden 13% (123) 70% (664) 12% (112) 5% (46) 9462020 Vote: Donald Trump 35% (300) 43% (371) 16% (142) 6% (52) 8642020 Vote: Didn’t Vote 14% (22) 39% (59) 27% (41) 20% (31) 1532018 House Vote: Democrat 13% (99) 73% (560) 10% (80) 4% (30) 7692018 House Vote: Republican 41% (286) 44% (309) 11% (78) 4% (29) 702
Continued on next page
Page 322
322
Morning ConsultTable POLx_1
Table POLx_1: Next we will look at a list of names that are active in politics. It is a long list, please take the time to go through the list carefullyand give an individual answer for each name below. For each person, please indicate if you have a Very Favorable, Somewhat Favorable, SomewhatUnfavorable, or Very Unfavorable opinion of each If you have heard of the person, but do not have an opinion, please mark ’Heard Of, No Opinion.’ Ifyou have not heard of the person, please mark ’Never Heard Of.’Mitch McConnell
Demographic Total Favorable Total UnfavorableHeard Of, NoOpinion Never Heard Of Total N
Registered Voters 22% (448) 56% (1111) 15% (307) 7% (131) 19982016 Vote: Hillary Clinton 13% (88) 74% (505) 10% (72) 3% (20) 6852016 Vote: Donald Trump 35% (282) 47% (375) 13% (102) 5% (42) 8022016 Vote: Other 16% (13) 65% (54) 17% (14) 3% (2) 842016 Vote: Didn’t Vote 14% (61) 42% (176) 28% (119) 16% (66) 423Voted in 2014: Yes 26% (353) 59% (794) 11% (149) 3% (39) 1335Voted in 2014: No 14% (95) 48% (317) 24% (159) 14% (92) 6634-Region: Northeast 23% (82) 54% (192) 16% (57) 6% (21) 3534-Region: Midwest 18% (82) 61% (273) 14% (63) 6% (26) 4444-Region: South 24% (181) 53% (394) 14% (108) 8% (62) 7464-Region: West 23% (103) 55% (252) 17% (79) 5% (21) 455Party: Democrat/Leans Democrat 12% (105) 69% (629) 13% (123) 6% (56) 914Party: Republican/Leans Republican 38% (307) 40% (325) 16% (133) 5% (43) 808Note: Row proportions may total to larger than one-hundred percent due to rounding. For more information visit MorningConsultIntelligence.com.
Page 323
National Tracking Poll #2110084, October, 2021
323
Table POLx_2
Table POLx_2: Favorability forNancy Pelosi
Demographic Total Favorable Total UnfavorableHeard Of, NoOpinion Never Heard Of Total N
Registered Voters 36% (711) 54% (1077) 8% (162) 2% (48) 1998Gender: Male 39% (366) 54% (512) 5% (49) 2% (15) 942Gender: Female 33% (345) 54% (565) 11% (113) 3% (33) 1056Age: 18-34 34% (174) 42% (215) 17% (86) 8% (39) 514Age: 35-44 41% (126) 45% (137) 12% (36) 2% (7) 307Age: 45-64 33% (225) 63% (425) 4% (28) — (1) 679Age: 65+ 37% (186) 60% (300) 2% (11) — (0) 497GenZers: 1997-2012 24% (41) 37% (62) 23% (39) 17% (28) 170Millennials: 1981-1996 40% (222) 43% (238) 13% (73) 3% (18) 551GenXers: 1965-1980 33% (157) 60% (281) 6% (30) — (1) 469Baby Boomers: 1946-1964 36% (263) 61% (450) 3% (19) — (0) 732PID: Dem (no lean) 68% (531) 19% (144) 10% (79) 3% (23) 777PID: Ind (no lean) 26% (136) 60% (317) 11% (56) 4% (19) 528PID: Rep (no lean) 6% (44) 89% (616) 4% (26) 1% (7) 693PID/Gender: DemMen 75% (264) 17% (60) 7% (24) 1% (5) 352PID/Gender: DemWomen 63% (267) 20% (85) 13% (54) 4% (18) 425PID/Gender: Ind Men 27% (75) 66% (183) 5% (14) 3% (7) 280PID/Gender: Ind Women 24% (61) 54% (133) 17% (43) 5% (11) 248PID/Gender: Rep Men 9% (27) 87% (269) 3% (11) 1% (3) 310PID/Gender: Rep Women 4% (17) 91% (347) 4% (16) 1% (4) 384Ideo: Liberal (1-3) 68% (383) 22% (123) 7% (39) 4% (21) 566Ideo: Moderate (4) 42% (237) 45% (250) 12% (66) 1% (7) 560Ideo: Conservative (5-7) 9% (68) 88% (642) 2% (18) — (2) 730Educ: < College 30% (367) 57% (687) 9% (114) 3% (39) 1206Educ: Bachelors degree 39% (195) 54% (269) 7% (33) 1% (4) 501Educ: Post-grad 52% (150) 42% (122) 5% (14) 2% (5) 290Income: Under 50k 33% (289) 52% (457) 11% (94) 4% (33) 873Income: 50k-100k 35% (257) 57% (416) 6% (46) 1% (9) 728Income: 100k+ 42% (165) 51% (204) 5% (21) 2% (7) 398Ethnicity: White 32% (492) 61% (934) 6% (92) 2% (25) 1544Ethnicity: Hispanic 37% (82) 44% (97) 12% (27) 7% (16) 222
Continued on next page
Page 324
324
Morning ConsultTable POLx_2
Table POLx_2: Favorability forNancy Pelosi
Demographic Total Favorable Total UnfavorableHeard Of, NoOpinion Never Heard Of Total N
Registered Voters 36% (711) 54% (1077) 8% (162) 2% (48) 1998Ethnicity: Black 53% (135) 22% (56) 18% (46) 7% (17) 253Ethnicity: Other 42% (85) 43% (87) 12% (23) 3% (6) 201All Christian 33% (345) 60% (630) 6% (58) 1% (9) 1041All Non-Christian 55% (59) 31% (33) 10% (11) 4% (4) 107Atheist 59% (46) 36% (28) 5% (4) — (0) 78Agnostic/Nothing in particular 35% (166) 49% (233) 11% (53) 6% (26) 480Something Else 33% (95) 53% (154) 12% (35) 3% (8) 293Religious Non-Protestant/Catholic 47% (61) 39% (51) 10% (13) 3% (4) 129Evangelical 29% (143) 63% (317) 6% (32) 1% (7) 499Non-Evangelical 36% (283) 56% (440) 7% (57) 1% (10) 790Community: Urban 48% (235) 36% (175) 12% (57) 4% (22) 487Community: Suburban 36% (372) 55% (571) 7% (75) 2% (23) 1041Community: Rural 22% (104) 71% (332) 6% (30) 1% (3) 469Employ: Private Sector 37% (252) 54% (370) 8% (57) 1% (5) 684Employ: Government 42% (47) 43% (48) 9% (11) 6% (7) 112Employ: Self-Employed 32% (58) 52% (95) 10% (19) 6% (12) 183Employ: Homemaker 27% (28) 63% (65) 10% (10) 1% (1) 104Employ: Student 32% (22) 33% (22) 28% (19) 7% (4) 67Employ: Retired 36% (195) 62% (332) 1% (7) — (0) 534Employ: Unemployed 42% (79) 38% (73) 15% (29) 5% (10) 191Employ: Other 26% (32) 59% (72) 8% (10) 7% (9) 124Military HH: Yes 33% (103) 61% (192) 5% (14) 2% (5) 315Military HH: No 36% (608) 53% (885) 9% (147) 3% (43) 1683RD/WT: Right Direction 70% (532) 18% (134) 8% (61) 4% (30) 757RD/WT: Wrong Track 14% (179) 76% (943) 8% (100) 1% (18) 1241Biden Job Approve 71% (639) 17% (155) 9% (79) 3% (26) 899Biden Job Disapprove 6% (62) 88% (910) 5% (54) 1% (13) 1039
Continued on next page
Page 325
National Tracking Poll #2110084, October, 2021
325
Table POLx_2
Table POLx_2: Favorability forNancy Pelosi
Demographic Total Favorable Total UnfavorableHeard Of, NoOpinion Never Heard Of Total N
Registered Voters 36% (711) 54% (1077) 8% (162) 2% (48) 1998Biden Job Strongly Approve 84% (353) 8% (35) 5% (22) 2% (8) 418Biden Job Somewhat Approve 59% (286) 25% (120) 12% (57) 4% (18) 481Biden Job Somewhat Disapprove 14% (34) 73% (183) 11% (27) 3% (6) 250Biden Job Strongly Disapprove 4% (28) 92% (727) 3% (27) 1% (6) 788Favorable of Biden 71% (662) 18% (163) 8% (73) 3% (29) 927Unfavorable of Biden 5% (47) 89% (905) 5% (53) 1% (14) 1019Very Favorable of Biden 85% (403) 7% (34) 5% (25) 3% (13) 476Somewhat Favorable of Biden 57% (259) 29% (129) 11% (48) 3% (16) 451Somewhat Unfavorable of Biden 12% (25) 75% (155) 11% (22) 2% (5) 207Very Unfavorable of Biden 3% (22) 92% (750) 4% (31) 1% (9) 812#1 Issue: Economy 27% (208) 62% (473) 9% (68) 3% (19) 768#1 Issue: Security 16% (57) 80% (286) 4% (15) — (1) 360#1 Issue: Health Care 58% (134) 30% (70) 9% (22) 2% (5) 231#1 Issue: Medicare / Social Security 50% (113) 44% (100) 5% (12) — (1) 227#1 Issue: Women’s Issues 49% (61) 30% (37) 16% (20) 5% (6) 125#1 Issue: Education 42% (25) 33% (20) 7% (4) 18% (11) 59#1 Issue: Energy 53% (57) 30% (32) 14% (15) 3% (3) 107#1 Issue: Other 45% (55) 49% (60) 4% (5) 1% (1) 1222020 Vote: Joe Biden 66% (621) 22% (205) 10% (96) 3% (24) 9462020 Vote: Donald Trump 7% (58) 89% (771) 3% (25) 1% (10) 8642020 Vote: Didn’t Vote 20% (31) 49% (76) 22% (34) 9% (13) 1532018 House Vote: Democrat 68% (524) 22% (171) 7% (55) 2% (18) 7692018 House Vote: Republican 8% (58) 90% (628) 2% (14) — (2) 7022016 Vote: Hillary Clinton 74% (505) 19% (128) 6% (42) 2% (11) 6852016 Vote: Donald Trump 8% (67) 87% (698) 3% (25) 1% (11) 8022016 Vote: Other 25% (21) 63% (53) 11% (9) — (0) 842016 Vote: Didn’t Vote 27% (116) 46% (196) 20% (85) 6% (26) 423Voted in 2014: Yes 39% (527) 55% (737) 4% (55) 1% (17) 1335Voted in 2014: No 28% (185) 51% (340) 16% (107) 5% (31) 663
Continued on next page
Page 326
326
Morning ConsultTable POLx_2
Table POLx_2: Favorability forNancy Pelosi
Demographic Total Favorable Total UnfavorableHeard Of, NoOpinion Never Heard Of Total N
Registered Voters 36% (711) 54% (1077) 8% (162) 2% (48) 19984-Region: Northeast 42% (150) 46% (162) 8% (30) 3% (12) 3534-Region: Midwest 35% (156) 57% (252) 7% (31) 1% (5) 4444-Region: South 29% (220) 59% (443) 9% (63) 3% (20) 7464-Region: West 41% (186) 48% (220) 8% (37) 3% (12) 455Party: Democrat/Leans Democrat 67% (613) 20% (184) 10% (89) 3% (28) 914Party: Republican/Leans Republican 6% (48) 89% (718) 4% (28) 2% (13) 808Note: Row proportions may total to larger than one-hundred percent due to rounding. For more information visit MorningConsultIntelligence.com.
Page 327
National Tracking Poll #2110084, October, 2021
327
Table POLx_3
Table POLx_3: Favorability forCharles Schumer
Demographic Total Favorable Total UnfavorableHeard Of, NoOpinion Never Heard Of Total N
Registered Voters 30% (607) 42% (831) 16% (328) 12% (231) 1998Gender: Male 36% (336) 48% (450) 10% (91) 7% (64) 942Gender: Female 26% (271) 36% (381) 22% (237) 16% (168) 1056Age: 18-34 24% (121) 23% (119) 23% (119) 30% (155) 514Age: 35-44 32% (98) 30% (93) 23% (69) 15% (47) 307Age: 45-64 32% (216) 51% (349) 13% (92) 3% (23) 679Age: 65+ 35% (172) 55% (271) 10% (48) 1% (6) 497GenZers: 1997-2012 12% (20) 16% (27) 26% (44) 46% (79) 170Millennials: 1981-1996 30% (168) 27% (151) 22% (123) 20% (110) 551GenXers: 1965-1980 30% (139) 48% (224) 15% (72) 7% (34) 469Baby Boomers: 1946-1964 35% (253) 52% (383) 12% (87) 1% (9) 732PID: Dem (no lean) 54% (422) 17% (132) 17% (131) 12% (92) 777PID: Ind (no lean) 21% (109) 45% (236) 17% (92) 17% (91) 528PID: Rep (no lean) 11% (76) 67% (463) 15% (106) 7% (48) 693PID/Gender: DemMen 65% (228) 19% (65) 11% (38) 6% (21) 352PID/Gender: DemWomen 46% (194) 16% (67) 22% (93) 17% (71) 425PID/Gender: Ind Men 24% (68) 54% (152) 11% (31) 10% (28) 280PID/Gender: Ind Women 16% (41) 34% (84) 24% (60) 25% (63) 248PID/Gender: Rep Men 13% (40) 75% (233) 7% (22) 5% (14) 310PID/Gender: Rep Women 9% (36) 60% (230) 22% (83) 9% (34) 384Ideo: Liberal (1-3) 56% (317) 16% (93) 12% (67) 16% (89) 566Ideo: Moderate (4) 36% (203) 34% (191) 21% (120) 8% (46) 560Ideo: Conservative (5-7) 10% (73) 72% (522) 13% (94) 6% (41) 730Educ: < College 24% (291) 41% (500) 19% (231) 15% (185) 1206Educ: Bachelors degree 35% (177) 44% (222) 13% (65) 7% (36) 501Educ: Post-grad 48% (139) 38% (109) 11% (32) 4% (10) 290Income: Under 50k 25% (217) 38% (335) 21% (181) 16% (140) 873Income: 50k-100k 32% (232) 45% (328) 14% (99) 9% (69) 728Income: 100k+ 40% (158) 42% (169) 12% (48) 6% (23) 398Ethnicity: White 29% (451) 47% (723) 15% (229) 9% (140) 1544Ethnicity: Hispanic 34% (75) 28% (62) 19% (41) 20% (43) 222
Continued on next page
Page 328
328
Morning ConsultTable POLx_3
Table POLx_3: Favorability forCharles Schumer
Demographic Total Favorable Total UnfavorableHeard Of, NoOpinion Never Heard Of Total N
Registered Voters 30% (607) 42% (831) 16% (328) 12% (231) 1998Ethnicity: Black 36% (92) 20% (51) 20% (52) 23% (59) 253Ethnicity: Other 32% (64) 28% (57) 23% (47) 16% (33) 201All Christian 31% (323) 48% (502) 15% (156) 6% (61) 1041All Non-Christian 49% (53) 30% (32) 10% (10) 11% (11) 107Atheist 58% (45) 24% (19) 7% (5) 11% (9) 78Agnostic/Nothing in particular 25% (120) 39% (185) 18% (87) 18% (88) 480Something Else 23% (67) 32% (94) 24% (69) 21% (63) 293Religious Non-Protestant/Catholic 43% (56) 33% (43) 13% (17) 10% (13) 129Evangelical 26% (129) 46% (228) 17% (86) 11% (55) 499Non-Evangelical 31% (246) 44% (348) 16% (128) 8% (67) 790Community: Urban 42% (205) 29% (140) 17% (83) 12% (60) 487Community: Suburban 30% (307) 43% (449) 17% (174) 11% (112) 1041Community: Rural 20% (95) 52% (243) 15% (71) 13% (60) 469Employ: Private Sector 31% (214) 44% (298) 15% (105) 10% (67) 684Employ: Government 40% (45) 30% (34) 16% (18) 14% (16) 112Employ: Self-Employed 25% (45) 39% (71) 21% (38) 16% (28) 183Employ: Homemaker 21% (22) 35% (36) 22% (23) 22% (23) 104Employ: Student 21% (14) 14% (9) 33% (22) 31% (21) 67Employ: Retired 35% (184) 56% (299) 9% (47) 1% (3) 534Employ: Unemployed 31% (59) 27% (51) 19% (36) 23% (45) 191Employ: Other 19% (23) 26% (33) 32% (39) 23% (28) 124Military HH: Yes 29% (91) 50% (159) 13% (39) 8% (25) 315Military HH: No 31% (516) 40% (672) 17% (289) 12% (206) 1683RD/WT: Right Direction 59% (449) 16% (120) 14% (110) 10% (79) 757RD/WT: Wrong Track 13% (158) 57% (712) 18% (218) 12% (152) 1241Biden Job Approve 57% (516) 17% (153) 15% (135) 11% (96) 899Biden Job Disapprove 8% (86) 65% (672) 17% (175) 10% (106) 1039
Continued on next page
Page 329
National Tracking Poll #2110084, October, 2021
329
Table POLx_3
Table POLx_3: Favorability forCharles Schumer
Demographic Total Favorable Total UnfavorableHeard Of, NoOpinion Never Heard Of Total N
Registered Voters 30% (607) 42% (831) 16% (328) 12% (231) 1998Biden Job Strongly Approve 72% (301) 13% (55) 10% (42) 5% (20) 418Biden Job Somewhat Approve 45% (214) 20% (98) 19% (93) 16% (76) 481Biden Job Somewhat Disapprove 14% (35) 44% (109) 26% (65) 17% (42) 250Biden Job Strongly Disapprove 7% (52) 71% (563) 14% (110) 8% (64) 788Favorable of Biden 57% (531) 16% (150) 15% (139) 12% (107) 927Unfavorable of Biden 7% (73) 66% (676) 16% (164) 10% (106) 1019Very Favorable of Biden 71% (336) 11% (55) 12% (57) 6% (28) 476Somewhat Favorable of Biden 43% (195) 21% (96) 18% (82) 17% (79) 451Somewhat Unfavorable of Biden 13% (26) 45% (94) 27% (55) 15% (32) 207Very Unfavorable of Biden 6% (47) 72% (582) 13% (109) 9% (74) 812#1 Issue: Economy 23% (176) 44% (342) 19% (143) 14% (108) 768#1 Issue: Security 18% (63) 65% (233) 14% (50) 4% (13) 360#1 Issue: Health Care 50% (116) 22% (52) 12% (29) 15% (34) 231#1 Issue: Medicare / Social Security 47% (105) 39% (89) 12% (26) 3% (6) 227#1 Issue: Women’s Issues 30% (37) 19% (24) 25% (31) 26% (33) 125#1 Issue: Education 26% (15) 31% (18) 19% (11) 25% (15) 59#1 Issue: Energy 42% (45) 21% (22) 24% (25) 13% (14) 107#1 Issue: Other 40% (48) 43% (52) 11% (13) 7% (9) 1222020 Vote: Joe Biden 52% (493) 21% (201) 16% (147) 11% (104) 9462020 Vote: Donald Trump 10% (88) 67% (578) 16% (136) 7% (63) 8642020 Vote: Didn’t Vote 15% (23) 23% (35) 24% (37) 38% (58) 1532018 House Vote: Democrat 57% (437) 20% (156) 14% (105) 9% (70) 7692018 House Vote: Republican 11% (79) 73% (514) 11% (79) 4% (30) 7022016 Vote: Hillary Clinton 59% (407) 19% (133) 13% (90) 8% (54) 6852016 Vote: Donald Trump 11% (88) 71% (567) 13% (102) 6% (45) 8022016 Vote: Other 31% (26) 47% (39) 15% (13) 7% (6) 842016 Vote: Didn’t Vote 20% (84) 21% (88) 29% (123) 30% (127) 423Voted in 2014: Yes 35% (468) 48% (643) 12% (161) 5% (63) 1335Voted in 2014: No 21% (139) 28% (189) 25% (167) 25% (168) 663
Continued on next page
Page 330
330
Morning ConsultTable POLx_3
Table POLx_3: Favorability forCharles Schumer
Demographic Total Favorable Total UnfavorableHeard Of, NoOpinion Never Heard Of Total N
Registered Voters 30% (607) 42% (831) 16% (328) 12% (231) 19984-Region: Northeast 42% (147) 38% (135) 14% (48) 7% (23) 3534-Region: Midwest 26% (113) 41% (184) 19% (86) 14% (62) 4444-Region: South 25% (183) 46% (340) 16% (122) 13% (100) 7464-Region: West 36% (163) 38% (172) 16% (73) 10% (47) 455Party: Democrat/Leans Democrat 53% (485) 19% (169) 17% (151) 12% (109) 914Party: Republican/Leans Republican 10% (82) 66% (535) 15% (124) 8% (67) 808Note: Row proportions may total to larger than one-hundred percent due to rounding. For more information visit MorningConsultIntelligence.com.
Page 331
National Tracking Poll #2110084, October, 2021
331
Table POLx_4
Table POLx_4: Favorability forMike Pence
Demographic Total Favorable Total UnfavorableHeard Of, NoOpinion Never Heard Of Total N
Registered Voters 40% (793) 49% (971) 9% (181) 3% (53) 1998Gender: Male 43% (401) 50% (467) 6% (58) 2% (16) 942Gender: Female 37% (392) 48% (504) 12% (123) 4% (37) 1056Age: 18-34 28% (147) 46% (237) 20% (104) 5% (27) 514Age: 35-44 37% (115) 44% (136) 12% (38) 6% (18) 307Age: 45-64 45% (302) 50% (342) 4% (30) 1% (5) 679Age: 65+ 46% (229) 51% (255) 2% (9) 1% (3) 497GenZers: 1997-2012 13% (22) 55% (94) 27% (45) 5% (8) 170Millennials: 1981-1996 37% (204) 43% (235) 15% (82) 6% (31) 551GenXers: 1965-1980 41% (192) 50% (235) 7% (33) 2% (10) 469Baby Boomers: 1946-1964 46% (338) 51% (371) 3% (20) — (3) 732PID: Dem (no lean) 19% (146) 69% (538) 9% (73) 3% (20) 777PID: Ind (no lean) 31% (161) 53% (279) 12% (63) 5% (24) 528PID: Rep (no lean) 70% (486) 22% (154) 6% (45) 1% (8) 693PID/Gender: DemMen 24% (83) 67% (237) 8% (27) 2% (5) 352PID/Gender: DemWomen 15% (63) 71% (301) 11% (46) 4% (15) 425PID/Gender: Ind Men 36% (101) 55% (153) 7% (20) 2% (6) 280PID/Gender: Ind Women 24% (60) 51% (126) 17% (43) 7% (18) 248PID/Gender: Rep Men 70% (217) 25% (77) 4% (11) 1% (4) 310PID/Gender: Rep Women 70% (269) 20% (78) 9% (33) 1% (4) 384Ideo: Liberal (1-3) 15% (84) 76% (430) 6% (33) 3% (19) 566Ideo: Moderate (4) 38% (211) 48% (270) 12% (68) 2% (10) 560Ideo: Conservative (5-7) 65% (474) 30% (219) 5% (34) — (3) 730Educ: < College 39% (472) 46% (553) 12% (140) 3% (41) 1206Educ: Bachelors degree 40% (203) 53% (264) 5% (27) 1% (7) 501Educ: Post-grad 41% (118) 53% (154) 5% (13) 2% (5) 290Income: Under 50k 36% (312) 47% (408) 13% (116) 4% (37) 873Income: 50k-100k 43% (311) 50% (366) 6% (42) 1% (9) 728Income: 100k+ 43% (170) 49% (197) 6% (23) 2% (8) 398Ethnicity: White 46% (705) 45% (693) 7% (115) 2% (31) 1544Ethnicity: Hispanic 27% (60) 53% (118) 17% (38) 3% (6) 222
Continued on next page
Page 332
332
Morning ConsultTable POLx_4
Table POLx_4: Favorability forMike Pence
Demographic Total Favorable Total UnfavorableHeard Of, NoOpinion Never Heard Of Total N
Registered Voters 40% (793) 49% (971) 9% (181) 3% (53) 1998Ethnicity: Black 13% (33) 63% (159) 16% (41) 8% (20) 253Ethnicity: Other 27% (54) 59% (119) 12% (25) 1% (2) 201All Christian 50% (518) 43% (445) 6% (63) 1% (15) 1041All Non-Christian 33% (35) 55% (59) 7% (7) 5% (5) 107Atheist 17% (13) 78% (60) 5% (4) — (0) 78Agnostic/Nothing in particular 27% (129) 58% (279) 12% (59) 3% (13) 480Something Else 34% (98) 44% (128) 16% (47) 7% (20) 293Religious Non-Protestant/Catholic 37% (48) 50% (64) 9% (12) 4% (5) 129Evangelical 52% (261) 36% (178) 9% (45) 3% (15) 499Non-Evangelical 42% (333) 48% (378) 8% (60) 2% (18) 790Community: Urban 33% (163) 50% (245) 12% (57) 5% (22) 487Community: Suburban 38% (398) 52% (539) 8% (86) 2% (19) 1041Community: Rural 49% (231) 40% (188) 8% (39) 3% (12) 469Employ: Private Sector 43% (293) 47% (319) 9% (59) 2% (14) 684Employ: Government 36% (41) 49% (56) 6% (7) 8% (9) 112Employ: Self-Employed 35% (64) 50% (91) 10% (19) 5% (8) 183Employ: Homemaker 40% (41) 39% (40) 18% (19) 4% (4) 104Employ: Student 17% (12) 61% (41) 17% (11) 5% (4) 67Employ: Retired 46% (246) 52% (277) 2% (10) — (0) 534Employ: Unemployed 26% (50) 52% (99) 18% (34) 4% (7) 191Employ: Other 37% (46) 39% (48) 19% (23) 5% (7) 124Military HH: Yes 46% (144) 48% (150) 6% (18) 1% (4) 315Military HH: No 39% (649) 49% (821) 10% (164) 3% (49) 1683RD/WT: Right Direction 25% (191) 64% (487) 7% (56) 3% (24) 757RD/WT: Wrong Track 49% (602) 39% (484) 10% (125) 2% (29) 1241Biden Job Approve 23% (207) 67% (599) 8% (68) 3% (25) 899Biden Job Disapprove 56% (584) 34% (353) 8% (87) 1% (14) 1039
Continued on next page
Page 333
National Tracking Poll #2110084, October, 2021
333
Table POLx_4
Table POLx_4: Favorability forMike Pence
Demographic Total Favorable Total UnfavorableHeard Of, NoOpinion Never Heard Of Total N
Registered Voters 40% (793) 49% (971) 9% (181) 3% (53) 1998Biden Job Strongly Approve 23% (98) 70% (292) 5% (22) 2% (6) 418Biden Job Somewhat Approve 23% (109) 64% (307) 10% (46) 4% (19) 481Biden Job Somewhat Disapprove 33% (84) 53% (133) 11% (28) 2% (6) 250Biden Job Strongly Disapprove 63% (501) 28% (220) 7% (59) 1% (9) 788Favorable of Biden 23% (216) 67% (617) 7% (68) 3% (26) 927Unfavorable of Biden 56% (572) 34% (349) 8% (84) 1% (13) 1019Very Favorable of Biden 23% (111) 68% (324) 6% (29) 2% (11) 476Somewhat Favorable of Biden 23% (105) 65% (293) 8% (38) 3% (15) 451Somewhat Unfavorable of Biden 34% (70) 55% (115) 9% (19) 2% (3) 207Very Unfavorable of Biden 62% (502) 29% (234) 8% (65) 1% (10) 812#1 Issue: Economy 42% (325) 44% (336) 10% (77) 4% (30) 768#1 Issue: Security 62% (222) 29% (104) 8% (29) 1% (4) 360#1 Issue: Health Care 29% (67) 62% (144) 7% (16) 2% (4) 231#1 Issue: Medicare / Social Security 38% (87) 56% (127) 5% (12) 1% (2) 227#1 Issue: Women’s Issues 13% (16) 67% (83) 18% (22) 2% (3) 125#1 Issue: Education 21% (12) 69% (41) 7% (4) 3% (2) 59#1 Issue: Energy 25% (27) 56% (60) 14% (15) 5% (5) 107#1 Issue: Other 30% (36) 63% (77) 4% (5) 3% (4) 1222020 Vote: Joe Biden 19% (181) 71% (670) 7% (69) 3% (25) 9462020 Vote: Donald Trump 66% (573) 25% (217) 7% (62) 1% (13) 8642020 Vote: Didn’t Vote 21% (32) 41% (63) 28% (43) 10% (15) 1532018 House Vote: Democrat 20% (157) 72% (556) 6% (44) 2% (12) 7692018 House Vote: Republican 69% (487) 26% (180) 4% (29) 1% (6) 7022016 Vote: Hillary Clinton 17% (119) 75% (515) 5% (37) 2% (14) 6852016 Vote: Donald Trump 66% (526) 28% (221) 6% (44) 1% (11) 8022016 Vote: Other 35% (30) 57% (48) 7% (6) — (0) 842016 Vote: Didn’t Vote 27% (115) 44% (187) 22% (93) 7% (28) 423Voted in 2014: Yes 44% (587) 50% (670) 5% (62) 1% (15) 1335Voted in 2014: No 31% (205) 45% (301) 18% (119) 6% (38) 663
Continued on next page
Page 334
334
Morning ConsultTable POLx_4
Table POLx_4: Favorability forMike Pence
Demographic Total Favorable Total UnfavorableHeard Of, NoOpinion Never Heard Of Total N
Registered Voters 40% (793) 49% (971) 9% (181) 3% (53) 19984-Region: Northeast 40% (140) 50% (177) 6% (21) 4% (14) 3534-Region: Midwest 39% (171) 52% (229) 8% (35) 2% (9) 4444-Region: South 43% (320) 43% (321) 11% (81) 3% (24) 7464-Region: West 35% (161) 54% (244) 10% (43) 1% (6) 455Party: Democrat/Leans Democrat 18% (162) 71% (645) 9% (83) 3% (23) 914Party: Republican/Leans Republican 68% (549) 24% (193) 7% (58) 1% (9) 808Note: Row proportions may total to larger than one-hundred percent due to rounding. For more information visit MorningConsultIntelligence.com.
Page 335
National Tracking Poll #2110084, October, 2021
335
Table POLx_5
Table POLx_5: Favorability forDonald Trump
Demographic Total Favorable Total UnfavorableHeard Of, NoOpinion Never Heard Of Total N
Registered Voters 44% (874) 53% (1060) 3% (52) 1% (12) 1998Gender: Male 44% (415) 53% (502) 2% (20) — (4) 942Gender: Female 43% (459) 53% (558) 3% (32) 1% (8) 1056Age: 18-34 39% (198) 56% (286) 4% (23) 1% (7) 514Age: 35-44 40% (123) 56% (171) 4% (11) 1% (2) 307Age: 45-64 47% (322) 50% (343) 2% (14) — (1) 679Age: 65+ 46% (231) 52% (260) 1% (4) 1% (3) 497GenZers: 1997-2012 31% (53) 61% (104) 5% (8) 2% (4) 170Millennials: 1981-1996 41% (226) 54% (297) 4% (24) 1% (5) 551GenXers: 1965-1980 43% (203) 54% (254) 2% (12) — (1) 469Baby Boomers: 1946-1964 49% (356) 50% (366) 1% (8) — (3) 732PID: Dem (no lean) 10% (80) 86% (665) 3% (24) 1% (8) 777PID: Ind (no lean) 37% (195) 59% (309) 4% (23) — (1) 528PID: Rep (no lean) 86% (599) 12% (86) 1% (6) — (3) 693PID/Gender: DemMen 13% (46) 83% (293) 3% (10) 1% (3) 352PID/Gender: DemWomen 8% (34) 88% (372) 3% (13) 1% (5) 425PID/Gender: Ind Men 40% (112) 57% (159) 3% (7) — (1) 280PID/Gender: Ind Women 33% (83) 60% (150) 6% (15) — (0) 248PID/Gender: Rep Men 83% (258) 16% (50) 1% (2) — (0) 310PID/Gender: Rep Women 89% (342) 9% (36) 1% (3) 1% (3) 384Ideo: Liberal (1-3) 11% (60) 87% (495) 1% (8) 1% (3) 566Ideo: Moderate (4) 29% (162) 67% (373) 3% (20) 1% (5) 560Ideo: Conservative (5-7) 81% (591) 17% (127) 1% (9) — (3) 730Educ: < College 47% (570) 49% (594) 3% (36) — (6) 1206Educ: Bachelors degree 39% (197) 57% (288) 2% (11) 1% (6) 501Educ: Post-grad 37% (107) 61% (178) 2% (5) — (1) 290Income: Under 50k 43% (377) 52% (457) 4% (33) 1% (6) 873Income: 50k-100k 46% (333) 52% (381) 1% (10) — (4) 728Income: 100k+ 41% (164) 56% (222) 2% (9) 1% (3) 398Ethnicity: White 50% (768) 48% (735) 2% (33) — (7) 1544Ethnicity: Hispanic 41% (91) 53% (118) 4% (9) 2% (4) 222
Continued on next page
Page 336
336
Morning ConsultTable POLx_5
Table POLx_5: Favorability forDonald Trump
Demographic Total Favorable Total UnfavorableHeard Of, NoOpinion Never Heard Of Total N
Registered Voters 44% (874) 53% (1060) 3% (52) 1% (12) 1998Ethnicity: Black 14% (34) 79% (200) 6% (14) 2% (5) 253Ethnicity: Other 35% (71) 62% (125) 2% (4) — (1) 201All Christian 52% (546) 45% (470) 2% (18) 1% (8) 1041All Non-Christian 25% (27) 72% (77) 1% (1) 2% (2) 107Atheist 22% (17) 78% (60) — (0) — (0) 78Agnostic/Nothing in particular 32% (155) 64% (305) 4% (19) — (1) 480Something Else 44% (129) 51% (149) 5% (14) — (1) 293Religious Non-Protestant/Catholic 31% (40) 65% (84) 2% (3) 2% (2) 129Evangelical 58% (287) 38% (191) 3% (16) 1% (4) 499Non-Evangelical 46% (363) 52% (408) 2% (14) 1% (5) 790Community: Urban 36% (176) 59% (290) 4% (18) 1% (4) 487Community: Suburban 41% (426) 56% (588) 2% (20) 1% (8) 1041Community: Rural 58% (272) 39% (182) 3% (15) — (1) 469Employ: Private Sector 43% (292) 55% (373) 2% (16) — (2) 684Employ: Government 43% (48) 55% (62) 2% (2) — (0) 112Employ: Self-Employed 47% (85) 47% (87) 4% (8) 1% (2) 183Employ: Homemaker 47% (48) 48% (50) 2% (2) 3% (3) 104Employ: Student 20% (13) 71% (48) 3% (2) 6% (4) 67Employ: Retired 49% (261) 50% (266) 1% (7) — (0) 534Employ: Unemployed 37% (71) 59% (112) 4% (7) — (1) 191Employ: Other 44% (54) 50% (62) 6% (7) — (0) 124Military HH: Yes 48% (151) 51% (159) 2% (5) — (0) 315Military HH: No 43% (723) 54% (901) 3% (46) 1% (12) 1683RD/WT: Right Direction 16% (125) 79% (602) 3% (23) 1% (8) 757RD/WT: Wrong Track 60% (749) 37% (458) 2% (29) — (4) 1241Biden Job Approve 12% (110) 85% (763) 2% (17) 1% (9) 899Biden Job Disapprove 73% (757) 25% (264) 1% (15) — (3) 1039
Continued on next page
Page 337
National Tracking Poll #2110084, October, 2021
337
Table POLx_5
Table POLx_5: Favorability forDonald Trump
Demographic Total Favorable Total UnfavorableHeard Of, NoOpinion Never Heard Of Total N
Registered Voters 44% (874) 53% (1060) 3% (52) 1% (12) 1998Biden Job Strongly Approve 13% (53) 85% (354) 2% (8) 1% (3) 418Biden Job Somewhat Approve 12% (57) 85% (409) 2% (9) 1% (6) 481Biden Job Somewhat Disapprove 31% (77) 66% (166) 3% (7) — (0) 250Biden Job Strongly Disapprove 86% (679) 12% (97) 1% (8) — (3) 788Favorable of Biden 12% (109) 86% (798) 1% (11) 1% (8) 927Unfavorable of Biden 74% (756) 24% (247) 1% (12) — (3) 1019Very Favorable of Biden 11% (53) 86% (407) 2% (9) 1% (7) 476Somewhat Favorable of Biden 13% (56) 87% (391) 1% (3) — (1) 451Somewhat Unfavorable of Biden 36% (75) 62% (129) 1% (2) — (1) 207Very Unfavorable of Biden 84% (681) 15% (118) 1% (10) — (3) 812#1 Issue: Economy 49% (374) 49% (377) 2% (14) — (3) 768#1 Issue: Security 74% (267) 23% (82) 2% (7) 1% (3) 360#1 Issue: Health Care 25% (57) 72% (166) 4% (8) — (0) 231#1 Issue: Medicare / Social Security 31% (71) 66% (149) 3% (6) — (0) 227#1 Issue: Women’s Issues 17% (22) 74% (92) 5% (7) 3% (4) 125#1 Issue: Education 24% (14) 74% (44) 2% (1) — (0) 59#1 Issue: Energy 21% (23) 70% (75) 7% (7) 2% (2) 107#1 Issue: Other 38% (46) 61% (75) 1% (1) — (0) 1222020 Vote: Joe Biden 7% (62) 91% (857) 2% (18) 1% (9) 9462020 Vote: Donald Trump 87% (755) 11% (93) 1% (13) — (3) 8642020 Vote: Didn’t Vote 33% (50) 57% (87) 10% (15) — (0) 1532018 House Vote: Democrat 11% (81) 88% (673) 2% (13) — (2) 7692018 House Vote: Republican 84% (588) 15% (107) 1% (4) — (3) 7022016 Vote: Hillary Clinton 7% (49) 90% (619) 2% (14) — (2) 6852016 Vote: Donald Trump 82% (655) 17% (135) 1% (9) — (3) 8022016 Vote: Other 20% (16) 76% (63) 5% (4) — (0) 842016 Vote: Didn’t Vote 36% (151) 57% (239) 6% (25) 2% (7) 423Voted in 2014: Yes 45% (603) 53% (709) 1% (19) — (4) 1335Voted in 2014: No 41% (271) 53% (351) 5% (32) 1% (9) 663
Continued on next page
Page 338
338
Morning ConsultTable POLx_5
Table POLx_5: Favorability forDonald Trump
Demographic Total Favorable Total UnfavorableHeard Of, NoOpinion Never Heard Of Total N
Registered Voters 44% (874) 53% (1060) 3% (52) 1% (12) 19984-Region: Northeast 38% (133) 60% (210) 2% (7) 1% (3) 3534-Region: Midwest 46% (204) 51% (227) 3% (13) — (1) 4444-Region: South 49% (369) 47% (352) 3% (22) — (2) 7464-Region: West 37% (169) 59% (271) 2% (9) 2% (7) 455Party: Democrat/Leans Democrat 10% (93) 86% (786) 3% (25) 1% (10) 914Party: Republican/Leans Republican 85% (686) 14% (112) 1% (7) — (3) 808Note: Row proportions may total to larger than one-hundred percent due to rounding. For more information visit MorningConsultIntelligence.com.
Page 339
National Tracking Poll #2110084, October, 2021
339
Table POLx_6
Table POLx_6: Favorability forRepublicans in Congress
Demographic Total Favorable Total UnfavorableHeard Of, NoOpinion Never Heard Of Total N
Registered Voters 37% (733) 55% (1109) 6% (128) 1% (29) 1998Gender: Male 38% (355) 57% (539) 4% (36) 1% (11) 942Gender: Female 36% (377) 54% (569) 9% (91) 2% (18) 1056Age: 18-34 33% (168) 49% (252) 15% (76) 4% (19) 514Age: 35-44 37% (114) 55% (170) 6% (19) 1% (4) 307Age: 45-64 37% (253) 59% (399) 3% (22) 1% (6) 679Age: 65+ 40% (198) 58% (289) 2% (11) — (0) 497GenZers: 1997-2012 23% (40) 47% (81) 24% (40) 5% (9) 170Millennials: 1981-1996 37% (205) 51% (282) 9% (51) 3% (14) 551GenXers: 1965-1980 35% (163) 60% (281) 4% (19) 1% (5) 469Baby Boomers: 1946-1964 40% (294) 58% (422) 2% (15) — (0) 732PID: Dem (no lean) 11% (83) 82% (636) 6% (50) 1% (8) 777PID: Ind (no lean) 21% (110) 63% (331) 14% (72) 3% (16) 528PID: Rep (no lean) 78% (540) 21% (142) 1% (6) 1% (5) 693PID/Gender: DemMen 14% (50) 80% (282) 5% (16) 1% (5) 352PID/Gender: DemWomen 8% (33) 83% (354) 8% (34) 1% (3) 425PID/Gender: Ind Men 22% (62) 69% (194) 7% (20) 1% (4) 280PID/Gender: Ind Women 19% (48) 55% (136) 21% (52) 5% (12) 248PID/Gender: Rep Men 79% (244) 21% (64) — (0) 1% (2) 310PID/Gender: Rep Women 77% (296) 20% (79) 1% (6) 1% (3) 384Ideo: Liberal (1-3) 12% (67) 83% (467) 4% (22) 2% (10) 566Ideo: Moderate (4) 26% (147) 66% (367) 8% (44) — (2) 560Ideo: Conservative (5-7) 66% (479) 31% (230) 2% (18) 1% (4) 730Educ: < College 38% (464) 51% (617) 9% (104) 2% (20) 1206Educ: Bachelors degree 34% (168) 63% (316) 3% (13) 1% (4) 501Educ: Post-grad 34% (100) 61% (176) 4% (10) 1% (4) 290Income: Under 50k 36% (316) 53% (464) 8% (74) 2% (19) 873Income: 50k-100k 37% (272) 57% (412) 6% (41) — (3) 728Income: 100k+ 36% (145) 59% (234) 3% (13) 2% (6) 398Ethnicity: White 42% (643) 52% (802) 5% (78) 1% (21) 1544Ethnicity: Hispanic 28% (62) 58% (128) 11% (24) 4% (8) 222
Continued on next page
Page 340
340
Morning ConsultTable POLx_6
Table POLx_6: Favorability forRepublicans in Congress
Demographic Total Favorable Total UnfavorableHeard Of, NoOpinion Never Heard Of Total N
Registered Voters 37% (733) 55% (1109) 6% (128) 1% (29) 1998Ethnicity: Black 14% (35) 72% (182) 13% (33) 2% (4) 253Ethnicity: Other 28% (55) 62% (124) 8% (17) 2% (4) 201All Christian 44% (459) 51% (527) 5% (51) — (4) 1041All Non-Christian 30% (32) 65% (69) 1% (1) 4% (4) 107Atheist 17% (13) 80% (62) 1% (1) 1% (1) 78Agnostic/Nothing in particular 27% (131) 60% (289) 10% (47) 3% (14) 480Something Else 33% (97) 56% (163) 9% (27) 2% (6) 293Religious Non-Protestant/Catholic 35% (45) 58% (75) 3% (4) 3% (4) 129Evangelical 49% (245) 43% (215) 7% (35) 1% (4) 499Non-Evangelical 37% (291) 58% (454) 5% (40) 1% (5) 790Community: Urban 32% (154) 57% (276) 9% (43) 3% (15) 487Community: Suburban 34% (358) 59% (619) 6% (58) 1% (7) 1041Community: Rural 47% (221) 46% (214) 6% (27) 2% (7) 469Employ: Private Sector 36% (247) 58% (400) 4% (30) 1% (7) 684Employ: Government 34% (38) 59% (66) 5% (6) 1% (2) 112Employ: Self-Employed 39% (71) 52% (94) 8% (14) 2% (3) 183Employ: Homemaker 39% (41) 45% (47) 14% (14) 2% (2) 104Employ: Student 19% (13) 58% (39) 19% (13) 4% (3) 67Employ: Retired 42% (224) 57% (305) 1% (5) — (0) 534Employ: Unemployed 26% (50) 56% (107) 15% (29) 2% (4) 191Employ: Other 40% (49) 41% (50) 13% (16) 7% (8) 124Military HH: Yes 37% (117) 58% (183) 3% (10) 1% (4) 315Military HH: No 37% (615) 55% (925) 7% (117) 1% (25) 1683RD/WT: Right Direction 19% (147) 73% (553) 6% (47) 1% (10) 757RD/WT: Wrong Track 47% (585) 45% (556) 6% (80) 2% (19) 1241Biden Job Approve 15% (138) 78% (704) 5% (47) 1% (11) 899Biden Job Disapprove 57% (589) 37% (387) 5% (54) 1% (8) 1039
Continued on next page
Page 341
National Tracking Poll #2110084, October, 2021
341
Table POLx_6
Table POLx_6: Favorability forRepublicans in Congress
Demographic Total Favorable Total UnfavorableHeard Of, NoOpinion Never Heard Of Total N
Registered Voters 37% (733) 55% (1109) 6% (128) 1% (29) 1998Biden Job Strongly Approve 15% (64) 81% (340) 2% (10) 1% (5) 418Biden Job Somewhat Approve 15% (74) 76% (364) 8% (37) 1% (6) 481Biden Job Somewhat Disapprove 25% (63) 64% (160) 9% (23) 2% (4) 250Biden Job Strongly Disapprove 67% (526) 29% (228) 4% (31) — (4) 788Favorable of Biden 15% (138) 78% (724) 5% (49) 2% (15) 927Unfavorable of Biden 58% (591) 37% (373) 5% (47) 1% (9) 1019Very Favorable of Biden 15% (72) 79% (378) 4% (19) 1% (6) 476Somewhat Favorable of Biden 15% (66) 77% (346) 7% (30) 2% (9) 451Somewhat Unfavorable of Biden 30% (63) 62% (128) 6% (11) 2% (5) 207Very Unfavorable of Biden 65% (528) 30% (244) 4% (35) 1% (4) 812#1 Issue: Economy 39% (300) 53% (404) 7% (51) 2% (14) 768#1 Issue: Security 58% (208) 37% (133) 4% (16) 1% (3) 360#1 Issue: Health Care 26% (61) 67% (155) 6% (13) — (1) 231#1 Issue: Medicare / Social Security 33% (75) 63% (144) 4% (8) — (0) 227#1 Issue: Women’s Issues 14% (17) 74% (92) 9% (11) 4% (5) 125#1 Issue: Education 17% (10) 58% (35) 23% (14) 2% (1) 59#1 Issue: Energy 26% (27) 64% (68) 7% (8) 3% (4) 107#1 Issue: Other 29% (35) 64% (78) 6% (7) 2% (2) 1222020 Vote: Joe Biden 11% (103) 82% (779) 5% (50) 1% (13) 9462020 Vote: Donald Trump 68% (588) 27% (231) 4% (39) 1% (6) 8642020 Vote: Didn’t Vote 22% (34) 53% (81) 19% (29) 6% (9) 1532018 House Vote: Democrat 10% (80) 84% (649) 4% (33) 1% (8) 7692018 House Vote: Republican 71% (497) 28% (196) 1% (5) — (3) 7022016 Vote: Hillary Clinton 8% (58) 86% (591) 5% (33) — (2) 6852016 Vote: Donald Trump 65% (520) 32% (254) 3% (21) 1% (7) 8022016 Vote: Other 26% (21) 65% (54) 8% (6) 2% (1) 842016 Vote: Didn’t Vote 31% (131) 49% (206) 16% (67) 4% (18) 423Voted in 2014: Yes 38% (514) 58% (779) 3% (36) — (6) 1335Voted in 2014: No 33% (219) 50% (330) 14% (91) 3% (22) 663
Continued on next page
Page 342
342
Morning ConsultTable POLx_6
Table POLx_6: Favorability forRepublicans in Congress
Demographic Total Favorable Total UnfavorableHeard Of, NoOpinion Never Heard Of Total N
Registered Voters 37% (733) 55% (1109) 6% (128) 1% (29) 19984-Region: Northeast 32% (114) 58% (204) 8% (29) 2% (6) 3534-Region: Midwest 39% (175) 56% (249) 3% (15) 1% (6) 4444-Region: South 42% (310) 50% (371) 7% (54) 1% (11) 7464-Region: West 30% (134) 62% (284) 7% (31) 1% (6) 455Party: Democrat/Leans Democrat 11% (100) 82% (749) 6% (56) 1% (9) 914Party: Republican/Leans Republican 73% (587) 24% (196) 2% (17) 1% (8) 808Note: Row proportions may total to larger than one-hundred percent due to rounding. For more information visit MorningConsultIntelligence.com.
Page 343
National Tracking Poll #2110084, October, 2021
343
Table POLx_7
Table POLx_7: Favorability forDemocrats in Congress
Demographic Total Favorable Total UnfavorableHeard Of, NoOpinion Never Heard Of Total N
Registered Voters 42% (841) 51% (1023) 5% (109) 1% (25) 1998Gender: Male 44% (411) 52% (490) 3% (29) 1% (11) 942Gender: Female 41% (430) 50% (533) 8% (79) 1% (14) 1056Age: 18-34 48% (247) 37% (192) 11% (55) 4% (21) 514Age: 35-44 47% (144) 44% (134) 9% (27) 1% (2) 307Age: 45-64 37% (254) 60% (407) 3% (17) — (2) 679Age: 65+ 40% (196) 59% (291) 2% (10) — (0) 497GenZers: 1997-2012 46% (78) 32% (54) 15% (25) 8% (13) 170Millennials: 1981-1996 49% (271) 40% (219) 9% (52) 2% (10) 551GenXers: 1965-1980 38% (178) 58% (274) 3% (16) — (2) 469Baby Boomers: 1946-1964 39% (287) 59% (429) 2% (15) — (0) 732PID: Dem (no lean) 83% (647) 12% (96) 4% (29) 1% (4) 777PID: Ind (no lean) 27% (142) 57% (303) 13% (67) 3% (16) 528PID: Rep (no lean) 8% (52) 90% (624) 2% (13) 1% (4) 693PID/Gender: DemMen 85% (301) 11% (40) 2% (8) 1% (3) 352PID/Gender: DemWomen 81% (346) 13% (57) 5% (21) — (1) 425PID/Gender: Ind Men 27% (76) 65% (182) 6% (16) 2% (5) 280PID/Gender: Ind Women 26% (65) 49% (121) 21% (51) 4% (11) 248PID/Gender: Rep Men 11% (34) 87% (268) 2% (5) 1% (3) 310PID/Gender: Rep Women 5% (19) 93% (356) 2% (8) — (1) 384Ideo: Liberal (1-3) 79% (449) 17% (98) 2% (13) 1% (7) 566Ideo: Moderate (4) 51% (283) 42% (234) 8% (43) — (0) 560Ideo: Conservative (5-7) 10% (75) 88% (641) 2% (12) — (3) 730Educ: < College 38% (457) 54% (650) 7% (81) 1% (18) 1206Educ: Bachelors degree 44% (221) 51% (258) 4% (21) — (2) 501Educ: Post-grad 56% (163) 40% (116) 2% (7) 2% (5) 290Income: Under 50k 42% (369) 48% (420) 8% (70) 2% (14) 873Income: 50k-100k 38% (280) 56% (410) 4% (29) 1% (8) 728Income: 100k+ 48% (192) 49% (194) 2% (10) 1% (3) 398Ethnicity: White 38% (588) 56% (867) 5% (70) 1% (19) 1544Ethnicity: Hispanic 44% (99) 43% (97) 6% (14) 6% (13) 222
Continued on next page
Page 344
344
Morning ConsultTable POLx_7
Table POLx_7: Favorability forDemocrats in Congress
Demographic Total Favorable Total UnfavorableHeard Of, NoOpinion Never Heard Of Total N
Registered Voters 42% (841) 51% (1023) 5% (109) 1% (25) 1998Ethnicity: Black 65% (164) 25% (64) 9% (22) 1% (3) 253Ethnicity: Other 44% (89) 46% (93) 8% (17) 1% (2) 201All Christian 39% (402) 57% (598) 4% (37) — (5) 1041All Non-Christian 64% (68) 32% (34) 2% (2) 3% (3) 107Atheist 64% (49) 34% (26) 3% (2) — (0) 78Agnostic/Nothing in particular 43% (208) 45% (215) 9% (43) 3% (14) 480Something Else 39% (113) 52% (151) 9% (25) 1% (3) 293Religious Non-Protestant/Catholic 55% (71) 39% (50) 4% (5) 2% (3) 129Evangelical 35% (173) 59% (296) 5% (26) 1% (4) 499Non-Evangelical 41% (326) 54% (428) 4% (32) — (3) 790Community: Urban 58% (281) 34% (164) 7% (34) 2% (8) 487Community: Suburban 41% (429) 53% (548) 5% (53) 1% (12) 1041Community: Rural 28% (131) 66% (312) 5% (22) 1% (5) 469Employ: Private Sector 43% (295) 51% (351) 5% (37) — (2) 684Employ: Government 55% (62) 41% (46) 3% (4) — (0) 112Employ: Self-Employed 42% (77) 51% (93) 5% (9) 3% (5) 183Employ: Homemaker 33% (34) 56% (58) 10% (10) 2% (2) 104Employ: Student 49% (33) 35% (23) 13% (9) 3% (2) 67Employ: Retired 39% (211) 60% (319) 1% (4) — (0) 534Employ: Unemployed 48% (92) 36% (68) 12% (22) 4% (8) 191Employ: Other 31% (38) 53% (65) 12% (15) 5% (6) 124Military HH: Yes 36% (112) 59% (186) 4% (13) 1% (3) 315Military HH: No 43% (729) 50% (837) 6% (95) 1% (22) 1683RD/WT: Right Direction 79% (602) 15% (115) 4% (33) 1% (7) 757RD/WT: Wrong Track 19% (239) 73% (908) 6% (76) 1% (17) 1241Biden Job Approve 81% (729) 14% (127) 4% (36) 1% (7) 899Biden Job Disapprove 10% (100) 85% (883) 5% (48) 1% (8) 1039
Continued on next page
Page 345
National Tracking Poll #2110084, October, 2021
345
Table POLx_7
Table POLx_7: Favorability forDemocrats in Congress
Demographic Total Favorable Total UnfavorableHeard Of, NoOpinion Never Heard Of Total N
Registered Voters 42% (841) 51% (1023) 5% (109) 1% (25) 1998Biden Job Strongly Approve 90% (377) 6% (25) 3% (11) 1% (5) 418Biden Job Somewhat Approve 73% (352) 21% (102) 5% (26) — (1) 481Biden Job Somewhat Disapprove 27% (68) 63% (157) 9% (24) 1% (2) 250Biden Job Strongly Disapprove 4% (33) 92% (726) 3% (24) 1% (6) 788Favorable of Biden 82% (761) 13% (121) 3% (31) 1% (13) 927Unfavorable of Biden 7% (75) 87% (891) 4% (44) 1% (8) 1019Very Favorable of Biden 93% (443) 4% (20) 2% (7) 1% (5) 476Somewhat Favorable of Biden 71% (318) 22% (101) 5% (24) 2% (8) 451Somewhat Unfavorable of Biden 21% (44) 70% (146) 7% (15) 1% (3) 207Very Unfavorable of Biden 4% (31) 92% (746) 4% (30) 1% (5) 812#1 Issue: Economy 34% (258) 58% (447) 7% (54) 1% (9) 768#1 Issue: Security 20% (71) 76% (273) 4% (14) — (1) 360#1 Issue: Health Care 64% (147) 31% (71) 4% (10) 1% (3) 231#1 Issue: Medicare / Social Security 56% (127) 41% (92) 2% (5) 1% (1) 227#1 Issue: Women’s Issues 62% (77) 27% (33) 8% (10) 3% (4) 125#1 Issue: Education 58% (35) 25% (15) 9% (5) 8% (5) 59#1 Issue: Energy 65% (69) 29% (31) 6% (7) — (0) 107#1 Issue: Other 46% (57) 49% (60) 3% (4) 2% (2) 1222020 Vote: Joe Biden 76% (716) 19% (180) 4% (40) 1% (9) 9462020 Vote: Donald Trump 9% (79) 86% (739) 4% (38) 1% (8) 8642020 Vote: Didn’t Vote 28% (43) 52% (79) 15% (23) 5% (7) 1532018 House Vote: Democrat 78% (597) 18% (142) 3% (21) 1% (9) 7692018 House Vote: Republican 10% (67) 88% (620) 2% (13) — (1) 7022016 Vote: Hillary Clinton 80% (551) 16% (110) 3% (24) — (0) 6852016 Vote: Donald Trump 12% (95) 84% (676) 3% (23) 1% (7) 8022016 Vote: Other 31% (26) 63% (53) 5% (4) 1% (1) 842016 Vote: Didn’t Vote 39% (167) 43% (182) 14% (58) 4% (17) 423Voted in 2014: Yes 44% (587) 53% (713) 2% (29) — (6) 1335Voted in 2014: No 38% (254) 47% (310) 12% (80) 3% (19) 663
Continued on next page
Page 346
346
Morning ConsultTable POLx_7
Table POLx_7: Favorability forDemocrats in Congress
Demographic Total Favorable Total UnfavorableHeard Of, NoOpinion Never Heard Of Total N
Registered Voters 42% (841) 51% (1023) 5% (109) 1% (25) 19984-Region: Northeast 49% (171) 43% (153) 6% (20) 2% (9) 3534-Region: Midwest 41% (184) 52% (233) 5% (22) 1% (6) 4444-Region: South 36% (269) 57% (429) 6% (43) 1% (5) 7464-Region: West 48% (217) 46% (208) 5% (24) 1% (6) 455Party: Democrat/Leans Democrat 80% (735) 15% (141) 4% (33) 1% (5) 914Party: Republican/Leans Republican 8% (63) 89% (717) 2% (20) 1% (9) 808Note: Row proportions may total to larger than one-hundred percent due to rounding. For more information visit MorningConsultIntelligence.com.
Page 347
National Tracking Poll #2110084, October, 2021
347
Table POLx_9
Table POLx_9: Favorability forKevin McCarthy
Demographic Total Favorable Total UnfavorableHeard Of, NoOpinion Never Heard Of Total N
Registered Voters 23% (462) 36% (715) 25% (508) 16% (314) 1998Gender: Male 31% (295) 42% (399) 18% (165) 9% (83) 942Gender: Female 16% (167) 30% (316) 32% (343) 22% (230) 1056Age: 18-34 19% (95) 23% (117) 28% (143) 31% (159) 514Age: 35-44 22% (66) 32% (98) 25% (78) 21% (65) 307Age: 45-64 22% (149) 43% (290) 25% (169) 10% (71) 679Age: 65+ 31% (152) 42% (210) 24% (118) 4% (18) 497GenZers: 1997-2012 11% (19) 21% (35) 30% (51) 38% (65) 170Millennials: 1981-1996 23% (126) 26% (146) 25% (139) 26% (141) 551GenXers: 1965-1980 19% (89) 38% (180) 28% (132) 15% (68) 469Baby Boomers: 1946-1964 27% (200) 44% (319) 24% (173) 5% (40) 732PID: Dem (no lean) 14% (106) 47% (368) 25% (193) 14% (110) 777PID: Ind (no lean) 14% (73) 39% (204) 24% (127) 23% (124) 528PID: Rep (no lean) 41% (283) 21% (142) 27% (188) 12% (80) 693PID/Gender: DemMen 20% (69) 56% (196) 19% (66) 6% (22) 352PID/Gender: DemWomen 9% (37) 41% (173) 30% (127) 21% (88) 425PID/Gender: Ind Men 19% (54) 46% (130) 18% (52) 16% (44) 280PID/Gender: Ind Women 8% (20) 30% (74) 30% (75) 32% (79) 248PID/Gender: Rep Men 56% (172) 24% (73) 15% (47) 5% (17) 310PID/Gender: Rep Women 29% (111) 18% (69) 37% (141) 16% (63) 384Ideo: Liberal (1-3) 11% (63) 54% (303) 18% (103) 17% (97) 566Ideo: Moderate (4) 17% (97) 39% (216) 30% (167) 14% (79) 560Ideo: Conservative (5-7) 40% (294) 24% (173) 24% (178) 12% (85) 730Educ: < College 20% (237) 32% (381) 30% (358) 19% (229) 1206Educ: Bachelors degree 26% (130) 42% (208) 21% (106) 11% (58) 501Educ: Post-grad 33% (95) 43% (125) 15% (44) 9% (27) 290Income: Under 50k 17% (151) 33% (285) 30% (258) 20% (178) 873Income: 50k-100k 25% (185) 37% (269) 23% (171) 14% (103) 728Income: 100k+ 32% (126) 40% (161) 20% (79) 8% (32) 398Ethnicity: White 26% (404) 36% (556) 25% (383) 13% (201) 1544Ethnicity: Hispanic 14% (31) 31% (70) 29% (65) 25% (56) 222
Continued on next page
Page 348
348
Morning ConsultTable POLx_9
Table POLx_9: Favorability forKevin McCarthy
Demographic Total Favorable Total UnfavorableHeard Of, NoOpinion Never Heard Of Total N
Registered Voters 23% (462) 36% (715) 25% (508) 16% (314) 1998Ethnicity: Black 14% (34) 36% (92) 25% (63) 25% (64) 253Ethnicity: Other 12% (24) 33% (66) 31% (62) 24% (49) 201All Christian 31% (321) 35% (365) 24% (250) 10% (105) 1041All Non-Christian 23% (24) 50% (54) 13% (14) 14% (14) 107Atheist 14% (11) 50% (39) 17% (13) 19% (15) 78Agnostic/Nothing in particular 14% (68) 35% (170) 28% (136) 22% (105) 480Something Else 13% (38) 30% (87) 32% (94) 25% (74) 293Religious Non-Protestant/Catholic 26% (34) 45% (58) 15% (19) 14% (18) 129Evangelical 33% (167) 26% (127) 25% (126) 16% (78) 499Non-Evangelical 22% (171) 40% (314) 26% (207) 12% (98) 790Community: Urban 28% (135) 35% (172) 20% (98) 17% (81) 487Community: Suburban 21% (217) 38% (391) 27% (282) 15% (151) 1041Community: Rural 23% (109) 32% (152) 27% (127) 17% (81) 469Employ: Private Sector 25% (169) 38% (262) 24% (163) 13% (89) 684Employ: Government 25% (28) 29% (32) 20% (22) 27% (30) 112Employ: Self-Employed 22% (40) 31% (56) 24% (43) 24% (43) 183Employ: Homemaker 12% (13) 34% (35) 34% (36) 19% (20) 104Employ: Student 5% (3) 39% (26) 35% (23) 22% (15) 67Employ: Retired 32% (170) 43% (230) 21% (112) 4% (21) 534Employ: Unemployed 11% (20) 26% (49) 39% (74) 24% (47) 191Employ: Other 14% (18) 19% (23) 27% (34) 40% (49) 124Military HH: Yes 30% (94) 36% (115) 20% (64) 13% (42) 315Military HH: No 22% (368) 36% (600) 26% (443) 16% (272) 1683RD/WT: Right Direction 20% (149) 46% (350) 23% (173) 11% (86) 757RD/WT: Wrong Track 25% (313) 29% (365) 27% (335) 18% (228) 1241Biden Job Approve 17% (150) 48% (433) 22% (198) 13% (118) 899Biden Job Disapprove 30% (312) 26% (270) 28% (290) 16% (168) 1039
Continued on next page
Page 349
National Tracking Poll #2110084, October, 2021
349
Table POLx_9
Table POLx_9: Favorability forKevin McCarthy
Demographic Total Favorable Total UnfavorableHeard Of, NoOpinion Never Heard Of Total N
Registered Voters 23% (462) 36% (715) 25% (508) 16% (314) 1998Biden Job Strongly Approve 21% (88) 53% (221) 18% (76) 8% (34) 418Biden Job Somewhat Approve 13% (62) 44% (211) 25% (123) 18% (84) 481Biden Job Somewhat Disapprove 15% (37) 33% (83) 30% (75) 22% (55) 250Biden Job Strongly Disapprove 35% (274) 24% (187) 27% (214) 14% (113) 788Favorable of Biden 17% (156) 48% (442) 22% (203) 14% (125) 927Unfavorable of Biden 30% (303) 26% (268) 28% (282) 16% (165) 1019Very Favorable of Biden 21% (102) 51% (244) 19% (88) 9% (41) 476Somewhat Favorable of Biden 12% (54) 44% (198) 26% (115) 19% (84) 451Somewhat Unfavorable of Biden 16% (32) 31% (65) 31% (64) 22% (46) 207Very Unfavorable of Biden 33% (271) 25% (203) 27% (218) 15% (119) 812#1 Issue: Economy 23% (174) 32% (249) 28% (218) 16% (126) 768#1 Issue: Security 36% (131) 23% (82) 30% (107) 11% (40) 360#1 Issue: Health Care 20% (47) 46% (106) 17% (39) 17% (39) 231#1 Issue: Medicare / Social Security 24% (53) 50% (112) 19% (44) 7% (17) 227#1 Issue: Women’s Issues 6% (7) 31% (38) 29% (36) 34% (43) 125#1 Issue: Education 21% (12) 33% (20) 23% (13) 23% (14) 59#1 Issue: Energy 16% (17) 41% (44) 25% (26) 18% (19) 107#1 Issue: Other 16% (20) 52% (63) 19% (23) 13% (16) 1222020 Vote: Joe Biden 13% (122) 51% (484) 22% (210) 14% (128) 9462020 Vote: Donald Trump 37% (323) 21% (181) 29% (246) 13% (113) 8642020 Vote: Didn’t Vote 9% (14) 25% (37) 27% (41) 40% (61) 1532018 House Vote: Democrat 14% (109) 53% (407) 21% (159) 12% (93) 7692018 House Vote: Republican 42% (296) 24% (171) 24% (168) 9% (66) 7022016 Vote: Hillary Clinton 13% (91) 54% (371) 22% (147) 11% (75) 6852016 Vote: Donald Trump 39% (314) 25% (204) 24% (192) 11% (91) 8022016 Vote: Other 11% (9) 51% (43) 24% (20) 14% (12) 842016 Vote: Didn’t Vote 11% (45) 22% (95) 35% (147) 32% (135) 423Voted in 2014: Yes 28% (375) 40% (538) 21% (287) 10% (135) 1335Voted in 2014: No 13% (88) 27% (176) 33% (221) 27% (178) 663
Continued on next page
Page 350
350
Morning ConsultTable POLx_9
Table POLx_9: Favorability forKevin McCarthy
Demographic Total Favorable Total UnfavorableHeard Of, NoOpinion Never Heard Of Total N
Registered Voters 23% (462) 36% (715) 25% (508) 16% (314) 19984-Region: Northeast 24% (84) 37% (130) 26% (91) 14% (48) 3534-Region: Midwest 19% (84) 38% (170) 28% (125) 15% (65) 4444-Region: South 24% (182) 34% (252) 24% (179) 18% (132) 7464-Region: West 25% (112) 36% (162) 25% (112) 15% (69) 455Party: Democrat/Leans Democrat 13% (118) 48% (441) 24% (220) 15% (135) 914Party: Republican/Leans Republican 39% (316) 21% (171) 27% (214) 13% (108) 808Note: Row proportions may total to larger than one-hundred percent due to rounding. For more information visit MorningConsultIntelligence.com.
Page 351
National Tracking Poll #2110084, October, 2021
351
Table POLx_10
Table POLx_10: Favorability forJoe Biden
Demographic Total Favorable Total UnfavorableHeard Of, NoOpinion Never Heard Of Total N
Registered Voters 46% (927) 51% (1019) 3% (50) — (2) 1998Gender: Male 49% (459) 49% (465) 2% (16) — (2) 942Gender: Female 44% (468) 52% (554) 3% (34) — (0) 1056Age: 18-34 53% (271) 43% (220) 4% (22) — (2) 514Age: 35-44 52% (159) 44% (135) 4% (13) — (0) 307Age: 45-64 41% (276) 58% (392) 2% (12) — (0) 679Age: 65+ 44% (221) 55% (273) 1% (3) — (0) 497GenZers: 1997-2012 53% (89) 40% (69) 7% (12) — (0) 170Millennials: 1981-1996 53% (294) 42% (232) 4% (22) — (2) 551GenXers: 1965-1980 40% (189) 58% (270) 2% (10) — (0) 469Baby Boomers: 1946-1964 45% (326) 55% (400) 1% (6) — (0) 732PID: Dem (no lean) 85% (660) 12% (94) 3% (22) — (1) 777PID: Ind (no lean) 38% (202) 57% (301) 5% (25) — (0) 528PID: Rep (no lean) 9% (65) 90% (624) — (3) — (1) 693PID/Gender: DemMen 87% (308) 10% (34) 3% (10) — (1) 352PID/Gender: DemWomen 83% (352) 14% (60) 3% (12) — (0) 425PID/Gender: Ind Men 39% (108) 60% (168) 1% (4) — (0) 280PID/Gender: Ind Women 38% (93) 54% (133) 9% (22) — (0) 248PID/Gender: Rep Men 14% (43) 85% (264) 1% (2) — (1) 310PID/Gender: Rep Women 6% (23) 94% (360) — (1) — (0) 384Ideo: Liberal (1-3) 83% (468) 16% (88) 2% (9) — (1) 566Ideo: Moderate (4) 57% (319) 40% (223) 3% (18) — (0) 560Ideo: Conservative (5-7) 12% (87) 87% (636) 1% (6) — (1) 730Educ: < College 41% (498) 56% (672) 3% (35) — (1) 1206Educ: Bachelors degree 50% (249) 48% (239) 3% (13) — (1) 501Educ: Post-grad 62% (180) 37% (109) 1% (2) — (0) 290Income: Under 50k 46% (405) 50% (438) 3% (28) — (1) 873Income: 50k-100k 43% (310) 55% (403) 2% (14) — (1) 728Income: 100k+ 53% (212) 45% (177) 2% (8) — (0) 398Ethnicity: White 42% (649) 56% (863) 2% (29) — (2) 1544Ethnicity: Hispanic 53% (118) 42% (94) 5% (11) — (0) 222
Continued on next page
Page 352
352
Morning ConsultTable POLx_10
Table POLx_10: Favorability forJoe Biden
Demographic Total Favorable Total UnfavorableHeard Of, NoOpinion Never Heard Of Total N
Registered Voters 46% (927) 51% (1019) 3% (50) — (2) 1998Ethnicity: Black 67% (170) 27% (69) 6% (15) — (0) 253Ethnicity: Other 54% (108) 43% (87) 3% (6) — (0) 201All Christian 43% (449) 55% (573) 2% (19) — (0) 1041All Non-Christian 70% (74) 28% (30) — (0) 2% (2) 107Atheist 66% (51) 32% (25) 2% (1) — (0) 78Agnostic/Nothing in particular 49% (237) 47% (226) 3% (16) — (0) 480Something Else 39% (115) 56% (165) 4% (13) — (0) 293Religious Non-Protestant/Catholic 61% (78) 38% (49) — (0) 1% (2) 129Evangelical 38% (188) 59% (294) 3% (16) — (0) 499Non-Evangelical 45% (356) 53% (418) 2% (16) — (0) 790Community: Urban 63% (308) 34% (167) 2% (11) — (1) 487Community: Suburban 46% (482) 51% (533) 2% (26) — (1) 1041Community: Rural 29% (137) 68% (319) 3% (14) — (0) 469Employ: Private Sector 48% (331) 50% (340) 2% (13) — (1) 684Employ: Government 54% (60) 41% (46) 6% (6) — (0) 112Employ: Self-Employed 42% (77) 53% (97) 4% (8) — (1) 183Employ: Homemaker 35% (37) 62% (64) 3% (3) — (0) 104Employ: Student 65% (44) 28% (19) 6% (4) — (0) 67Employ: Retired 44% (234) 56% (298) — (2) — (0) 534Employ: Unemployed 54% (103) 42% (79) 4% (9) — (0) 191Employ: Other 33% (41) 62% (77) 5% (6) — (0) 124Military HH: Yes 40% (127) 59% (185) 1% (3) — (0) 315Military HH: No 48% (800) 50% (834) 3% (47) — (2) 1683RD/WT: Right Direction 89% (677) 8% (63) 2% (17) — (1) 757RD/WT: Wrong Track 20% (250) 77% (956) 3% (33) — (1) 1241Biden Job Approve 94% (847) 4% (33) 2% (18) — (1) 899Biden Job Disapprove 5% (53) 94% (977) 1% (8) — (1) 1039
Continued on next page
Page 353
National Tracking Poll #2110084, October, 2021
353
Table POLx_10
Table POLx_10: Favorability forJoe Biden
Demographic Total Favorable Total UnfavorableHeard Of, NoOpinion Never Heard Of Total N
Registered Voters 46% (927) 51% (1019) 3% (50) — (2) 1998Biden Job Strongly Approve 97% (406) 2% (8) 1% (3) — (1) 418Biden Job Somewhat Approve 92% (442) 5% (25) 3% (14) — (0) 481Biden Job Somewhat Disapprove 16% (41) 82% (205) 2% (5) — (0) 250Biden Job Strongly Disapprove 2% (13) 98% (771) — (3) — (1) 788Favorable of Biden 100% (927) — (0) — (0) — (0) 927Unfavorable of Biden — (0) 100% (1019) — (0) — (0) 1019Very Favorable of Biden 100% (476) — (0) — (0) — (0) 476Somewhat Favorable of Biden 100% (451) — (0) — (0) — (0) 451Somewhat Unfavorable of Biden — (0) 100% (207) — (0) — (0) 207Very Unfavorable of Biden — (0) 100% (812) — (0) — (0) 812#1 Issue: Economy 39% (299) 59% (451) 2% (17) — (1) 768#1 Issue: Security 20% (72) 79% (285) 1% (3) — (0) 360#1 Issue: Health Care 69% (160) 26% (60) 5% (12) — (0) 231#1 Issue: Medicare / Social Security 60% (136) 38% (87) 2% (4) — (0) 227#1 Issue: Women’s Issues 70% (88) 25% (31) 5% (6) — (0) 125#1 Issue: Education 69% (41) 29% (17) 2% (1) — (0) 59#1 Issue: Energy 62% (66) 31% (33) 7% (8) — (0) 107#1 Issue: Other 54% (65) 45% (55) 1% (1) 1% (1) 1222020 Vote: Joe Biden 83% (787) 14% (136) 2% (22) — (1) 9462020 Vote: Donald Trump 9% (80) 90% (775) 1% (9) — (0) 8642020 Vote: Didn’t Vote 35% (53) 56% (85) 10% (15) — (0) 1532018 House Vote: Democrat 83% (638) 16% (122) 1% (9) — (0) 7692018 House Vote: Republican 11% (80) 88% (618) 1% (4) — (0) 7022016 Vote: Hillary Clinton 86% (589) 12% (82) 2% (14) — (0) 6852016 Vote: Donald Trump 13% (103) 86% (693) 1% (5) — (1) 8022016 Vote: Other 44% (36) 54% (45) 2% (2) — (0) 842016 Vote: Didn’t Vote 46% (196) 47% (197) 7% (29) — (1) 423Voted in 2014: Yes 48% (640) 51% (679) 1% (16) — (0) 1335Voted in 2014: No 43% (287) 51% (340) 5% (34) — (2) 663
Continued on next page
Page 354
354
Morning ConsultTable POLx_10
Table POLx_10: Favorability forJoe Biden
Demographic Total Favorable Total UnfavorableHeard Of, NoOpinion Never Heard Of Total N
Registered Voters 46% (927) 51% (1019) 3% (50) — (2) 19984-Region: Northeast 51% (181) 45% (160) 3% (11) — (1) 3534-Region: Midwest 43% (193) 54% (241) 2% (10) — (1) 4444-Region: South 40% (298) 57% (424) 3% (23) — (0) 7464-Region: West 56% (255) 43% (194) 1% (6) — (0) 455Party: Democrat/Leans Democrat 83% (761) 14% (130) 2% (22) — (1) 914Party: Republican/Leans Republican 9% (74) 90% (730) — (3) — (1) 808Note: Row proportions may total to larger than one-hundred percent due to rounding. For more information visit MorningConsultIntelligence.com.
Page 355
National Tracking Poll #2110084, October, 2021
355
Table POLx_11
Table POLx_11: Favorability forKamala Harris
Demographic Total Favorable Total UnfavorableHeard Of, NoOpinion Never Heard Of Total N
Registered Voters 42% (838) 50% (994) 7% (131) 2% (34) 1998Gender: Male 42% (394) 51% (484) 5% (47) 2% (17) 942Gender: Female 42% (444) 48% (511) 8% (84) 2% (17) 1056Age: 18-34 46% (236) 38% (196) 11% (55) 5% (27) 514Age: 35-44 48% (148) 40% (123) 9% (29) 2% (7) 307Age: 45-64 37% (254) 58% (396) 4% (28) — (1) 679Age: 65+ 40% (200) 56% (279) 4% (19) — (0) 497GenZers: 1997-2012 49% (83) 33% (56) 12% (21) 6% (10) 170Millennials: 1981-1996 47% (259) 39% (216) 11% (58) 3% (19) 551GenXers: 1965-1980 37% (175) 57% (266) 5% (23) 1% (5) 469Baby Boomers: 1946-1964 40% (293) 56% (412) 4% (27) — (0) 732PID: Dem (no lean) 80% (621) 11% (89) 7% (55) 2% (13) 777PID: Ind (no lean) 31% (166) 55% (293) 10% (53) 3% (17) 528PID: Rep (no lean) 7% (52) 88% (613) 3% (24) 1% (5) 693PID/Gender: DemMen 80% (282) 10% (36) 8% (28) 2% (7) 352PID/Gender: DemWomen 80% (339) 12% (53) 6% (27) 1% (6) 425PID/Gender: Ind Men 30% (83) 62% (173) 5% (14) 3% (9) 280PID/Gender: Ind Women 33% (82) 48% (119) 16% (39) 3% (8) 248PID/Gender: Rep Men 9% (28) 89% (274) 2% (5) 1% (2) 310PID/Gender: Rep Women 6% (23) 88% (338) 5% (19) 1% (3) 384Ideo: Liberal (1-3) 78% (444) 16% (91) 4% (22) 2% (9) 566Ideo: Moderate (4) 52% (291) 39% (217) 9% (49) 1% (3) 560Ideo: Conservative (5-7) 9% (68) 87% (638) 3% (21) — (3) 730Educ: < College 37% (449) 52% (632) 8% (102) 2% (23) 1206Educ: Bachelors degree 45% (227) 50% (249) 4% (20) 1% (5) 501Educ: Post-grad 56% (162) 39% (113) 3% (9) 2% (6) 290Income: Under 50k 41% (357) 48% (417) 9% (74) 3% (24) 873Income: 50k-100k 41% (295) 53% (389) 5% (36) 1% (7) 728Income: 100k+ 47% (185) 47% (188) 5% (20) 1% (3) 398Ethnicity: White 37% (576) 55% (854) 6% (87) 2% (26) 1544Ethnicity: Hispanic 43% (96) 41% (90) 12% (26) 4% (10) 222
Continued on next page
Page 356
356
Morning ConsultTable POLx_11
Table POLx_11: Favorability forKamala Harris
Demographic Total Favorable Total UnfavorableHeard Of, NoOpinion Never Heard Of Total N
Registered Voters 42% (838) 50% (994) 7% (131) 2% (34) 1998Ethnicity: Black 66% (167) 23% (58) 8% (21) 3% (7) 253Ethnicity: Other 47% (95) 41% (82) 11% (22) 1% (2) 201All Christian 39% (404) 56% (588) 4% (42) 1% (8) 1041All Non-Christian 65% (69) 30% (32) — (0) 4% (5) 107Atheist 61% (48) 34% (26) 3% (2) 1% (1) 78Agnostic/Nothing in particular 42% (203) 44% (209) 12% (57) 2% (11) 480Something Else 39% (114) 48% (139) 10% (29) 3% (10) 293Religious Non-Protestant/Catholic 56% (72) 39% (50) 2% (2) 4% (5) 129Evangelical 35% (173) 58% (291) 6% (30) 1% (4) 499Non-Evangelical 42% (332) 52% (408) 5% (37) 2% (13) 790Community: Urban 57% (276) 33% (163) 7% (32) 3% (17) 487Community: Suburban 42% (436) 50% (524) 7% (72) 1% (9) 1041Community: Rural 27% (126) 65% (307) 6% (27) 2% (9) 469Employ: Private Sector 41% (283) 50% (345) 6% (42) 2% (14) 684Employ: Government 54% (61) 42% (47) 3% (3) 1% (1) 112Employ: Self-Employed 39% (72) 48% (89) 10% (19) 2% (3) 183Employ: Homemaker 35% (37) 54% (55) 9% (9) 2% (2) 104Employ: Student 58% (39) 30% (20) 6% (4) 6% (4) 67Employ: Retired 40% (214) 57% (306) 3% (14) — (0) 534Employ: Unemployed 49% (93) 37% (70) 12% (24) 2% (4) 191Employ: Other 31% (39) 51% (63) 13% (16) 4% (5) 124Military HH: Yes 39% (122) 57% (181) 2% (7) 2% (5) 315Military HH: No 43% (716) 48% (813) 7% (124) 2% (30) 1683RD/WT: Right Direction 81% (612) 12% (92) 5% (38) 2% (15) 757RD/WT: Wrong Track 18% (226) 73% (902) 7% (93) 2% (20) 1241Biden Job Approve 83% (748) 10% (91) 5% (49) 1% (11) 899Biden Job Disapprove 7% (75) 86% (894) 5% (56) 1% (14) 1039
Continued on next page
Page 357
National Tracking Poll #2110084, October, 2021
357
Table POLx_11
Table POLx_11: Favorability forKamala Harris
Demographic Total Favorable Total UnfavorableHeard Of, NoOpinion Never Heard Of Total N
Registered Voters 42% (838) 50% (994) 7% (131) 2% (34) 1998Biden Job Strongly Approve 91% (379) 5% (21) 3% (13) 1% (5) 418Biden Job Somewhat Approve 77% (370) 14% (70) 7% (36) 1% (6) 481Biden Job Somewhat Disapprove 23% (58) 64% (161) 10% (24) 3% (7) 250Biden Job Strongly Disapprove 2% (18) 93% (733) 4% (31) 1% (7) 788Favorable of Biden 83% (774) 10% (94) 5% (46) 1% (13) 927Unfavorable of Biden 6% (62) 88% (895) 5% (47) 1% (15) 1019Very Favorable of Biden 92% (439) 4% (17) 3% (14) 1% (6) 476Somewhat Favorable of Biden 74% (335) 17% (77) 7% (32) 1% (7) 451Somewhat Unfavorable of Biden 21% (43) 69% (143) 8% (16) 2% (4) 207Very Unfavorable of Biden 2% (19) 93% (751) 4% (31) 1% (11) 812#1 Issue: Economy 34% (265) 57% (440) 6% (48) 2% (16) 768#1 Issue: Security 19% (68) 76% (272) 4% (16) 1% (3) 360#1 Issue: Health Care 63% (145) 28% (64) 8% (18) 1% (3) 231#1 Issue: Medicare / Social Security 54% (122) 40% (90) 6% (14) — (1) 227#1 Issue: Women’s Issues 65% (81) 24% (30) 8% (10) 3% (4) 125#1 Issue: Education 62% (37) 20% (12) 15% (9) 3% (2) 59#1 Issue: Energy 58% (62) 27% (29) 14% (15) 2% (2) 107#1 Issue: Other 48% (58) 48% (59) 1% (1) 3% (4) 1222020 Vote: Joe Biden 76% (721) 16% (150) 7% (62) 1% (13) 9462020 Vote: Donald Trump 8% (70) 86% (746) 4% (38) 1% (10) 8642020 Vote: Didn’t Vote 27% (41) 50% (77) 16% (25) 7% (10) 1532018 House Vote: Democrat 78% (600) 16% (124) 5% (38) 1% (7) 7692018 House Vote: Republican 8% (60) 87% (611) 3% (24) 1% (7) 7022016 Vote: Hillary Clinton 81% (557) 13% (87) 5% (37) 1% (4) 6852016 Vote: Donald Trump 11% (87) 84% (674) 4% (30) 1% (11) 8022016 Vote: Other 31% (26) 61% (51) 8% (6) 1% (1) 842016 Vote: Didn’t Vote 39% (166) 43% (180) 14% (58) 4% (19) 423Voted in 2014: Yes 44% (582) 51% (685) 4% (59) 1% (8) 1335Voted in 2014: No 39% (256) 47% (309) 11% (72) 4% (26) 663
Continued on next page
Page 358
358
Morning ConsultTable POLx_11
Table POLx_11: Favorability forKamala Harris
Demographic Total Favorable Total UnfavorableHeard Of, NoOpinion Never Heard Of Total N
Registered Voters 42% (838) 50% (994) 7% (131) 2% (34) 19984-Region: Northeast 47% (165) 45% (160) 6% (22) 2% (6) 3534-Region: Midwest 40% (178) 50% (222) 7% (33) 3% (12) 4444-Region: South 36% (267) 56% (417) 6% (48) 2% (14) 7464-Region: West 50% (228) 43% (197) 6% (28) — (2) 455Party: Democrat/Leans Democrat 78% (713) 14% (126) 7% (60) 2% (15) 914Party: Republican/Leans Republican 8% (63) 87% (702) 4% (35) 1% (9) 808Note: Row proportions may total to larger than one-hundred percent due to rounding. For more information visit MorningConsultIntelligence.com.
Page 359
National Tracking Poll #2110084, October, 2021
359
Table POLx_12
Table POLx_12: Favorability forPope Francis
Demographic Total Favorable Total UnfavorableHeard Of, NoOpinion Never Heard Of Total N
Registered Voters 47% (932) 20% (408) 27% (544) 6% (114) 1998Gender: Male 46% (438) 25% (233) 25% (235) 4% (36) 942Gender: Female 47% (494) 17% (175) 29% (309) 7% (78) 1056Age: 18-34 39% (200) 21% (109) 29% (152) 10% (54) 514Age: 35-44 40% (122) 20% (62) 32% (98) 8% (25) 307Age: 45-64 48% (327) 22% (150) 27% (186) 2% (17) 679Age: 65+ 57% (283) 18% (87) 22% (109) 4% (19) 497GenZers: 1997-2012 29% (49) 16% (27) 39% (66) 16% (28) 170Millennials: 1981-1996 43% (236) 23% (125) 27% (146) 8% (44) 551GenXers: 1965-1980 41% (191) 23% (109) 33% (153) 4% (16) 469Baby Boomers: 1946-1964 55% (405) 18% (131) 23% (171) 3% (25) 732PID: Dem (no lean) 59% (455) 13% (100) 24% (186) 5% (35) 777PID: Ind (no lean) 39% (205) 24% (126) 29% (153) 8% (44) 528PID: Rep (no lean) 39% (272) 26% (181) 30% (206) 5% (35) 693PID/Gender: DemMen 60% (210) 16% (57) 21% (74) 3% (11) 352PID/Gender: DemWomen 58% (245) 10% (43) 26% (112) 6% (25) 425PID/Gender: Ind Men 39% (108) 28% (78) 28% (78) 6% (16) 280PID/Gender: Ind Women 39% (97) 20% (49) 30% (75) 11% (28) 248PID/Gender: Rep Men 39% (119) 32% (98) 27% (84) 3% (9) 310PID/Gender: Rep Women 40% (152) 22% (83) 32% (122) 7% (26) 384Ideo: Liberal (1-3) 58% (330) 15% (87) 21% (119) 5% (31) 566Ideo: Moderate (4) 52% (288) 14% (79) 30% (170) 4% (23) 560Ideo: Conservative (5-7) 38% (279) 30% (219) 27% (199) 4% (32) 730Educ: < College 41% (493) 20% (239) 32% (384) 8% (91) 1206Educ: Bachelors degree 52% (259) 22% (111) 24% (118) 3% (13) 501Educ: Post-grad 62% (180) 20% (58) 15% (43) 3% (10) 290Income: Under 50k 42% (364) 21% (184) 30% (258) 8% (68) 873Income: 50k-100k 47% (343) 20% (149) 29% (208) 4% (27) 728Income: 100k+ 56% (224) 19% (75) 20% (79) 5% (19) 398Ethnicity: White 48% (741) 20% (311) 27% (418) 5% (74) 1544Ethnicity: Hispanic 43% (96) 22% (49) 28% (63) 6% (14) 222
Continued on next page
Page 360
360
Morning ConsultTable POLx_12
Table POLx_12: Favorability forPope Francis
Demographic Total Favorable Total UnfavorableHeard Of, NoOpinion Never Heard Of Total N
Registered Voters 47% (932) 20% (408) 27% (544) 6% (114) 1998Ethnicity: Black 43% (108) 17% (42) 29% (75) 11% (29) 253Ethnicity: Other 41% (83) 27% (55) 26% (52) 6% (11) 201All Christian 56% (581) 19% (196) 22% (229) 3% (35) 1041All Non-Christian 51% (54) 16% (17) 27% (29) 6% (6) 107Atheist 29% (22) 40% (31) 27% (21) 5% (4) 78Agnostic/Nothing in particular 31% (149) 22% (106) 37% (179) 10% (46) 480Something Else 43% (125) 20% (59) 30% (87) 8% (23) 293Religious Non-Protestant/Catholic 50% (64) 16% (20) 30% (39) 5% (6) 129Evangelical 40% (202) 27% (137) 27% (135) 5% (25) 499Non-Evangelical 61% (480) 14% (110) 21% (167) 4% (33) 790Community: Urban 50% (244) 19% (92) 23% (111) 8% (40) 487Community: Suburban 48% (500) 20% (208) 27% (283) 5% (50) 1041Community: Rural 40% (187) 23% (107) 32% (151) 5% (24) 469Employ: Private Sector 46% (314) 21% (142) 29% (200) 4% (28) 684Employ: Government 44% (49) 21% (23) 28% (31) 8% (9) 112Employ: Self-Employed 42% (77) 20% (36) 31% (56) 7% (13) 183Employ: Homemaker 30% (31) 20% (21) 44% (46) 6% (6) 104Employ: Student 45% (30) 14% (10) 33% (22) 7% (5) 67Employ: Retired 57% (306) 20% (104) 19% (104) 4% (19) 534Employ: Unemployed 41% (78) 22% (42) 28% (53) 9% (18) 191Employ: Other 37% (46) 24% (30) 26% (32) 13% (16) 124Military HH: Yes 47% (149) 21% (67) 26% (82) 5% (17) 315Military HH: No 47% (783) 20% (340) 27% (462) 6% (97) 1683RD/WT: Right Direction 61% (463) 12% (90) 22% (167) 5% (37) 757RD/WT: Wrong Track 38% (468) 26% (318) 30% (377) 6% (77) 1241Biden Job Approve 62% (556) 12% (110) 21% (193) 4% (40) 899Biden Job Disapprove 35% (365) 28% (293) 31% (323) 6% (58) 1039
Continued on next page
Page 361
National Tracking Poll #2110084, October, 2021
361
Table POLx_12
Table POLx_12: Favorability forPope Francis
Demographic Total Favorable Total UnfavorableHeard Of, NoOpinion Never Heard Of Total N
Registered Voters 47% (932) 20% (408) 27% (544) 6% (114) 1998Biden Job Strongly Approve 70% (293) 12% (49) 16% (67) 2% (9) 418Biden Job Somewhat Approve 55% (264) 13% (60) 26% (126) 6% (31) 481Biden Job Somewhat Disapprove 44% (111) 18% (44) 31% (77) 7% (18) 250Biden Job Strongly Disapprove 32% (253) 32% (249) 31% (245) 5% (41) 788Favorable of Biden 62% (576) 11% (105) 21% (197) 5% (48) 927Unfavorable of Biden 34% (345) 29% (300) 31% (320) 5% (54) 1019Very Favorable of Biden 69% (326) 10% (50) 17% (80) 4% (19) 476Somewhat Favorable of Biden 55% (250) 12% (55) 26% (117) 6% (29) 451Somewhat Unfavorable of Biden 44% (91) 18% (37) 31% (65) 7% (14) 207Very Unfavorable of Biden 31% (254) 32% (263) 31% (255) 5% (40) 812#1 Issue: Economy 42% (321) 22% (165) 31% (240) 5% (42) 768#1 Issue: Security 45% (163) 28% (99) 22% (79) 5% (18) 360#1 Issue: Health Care 51% (117) 17% (39) 25% (59) 7% (15) 231#1 Issue: Medicare / Social Security 63% (142) 12% (26) 23% (52) 3% (6) 227#1 Issue: Women’s Issues 39% (49) 22% (27) 31% (38) 8% (10) 125#1 Issue: Education 53% (32) 12% (7) 22% (13) 12% (7) 59#1 Issue: Energy 51% (54) 16% (17) 27% (29) 7% (7) 107#1 Issue: Other 44% (54) 21% (26) 29% (35) 6% (8) 1222020 Vote: Joe Biden 58% (552) 13% (127) 23% (222) 5% (45) 9462020 Vote: Donald Trump 38% (332) 28% (239) 29% (252) 5% (42) 8642020 Vote: Didn’t Vote 26% (40) 22% (34) 37% (56) 15% (23) 1532018 House Vote: Democrat 59% (452) 15% (114) 22% (172) 4% (30) 7692018 House Vote: Republican 41% (289) 28% (195) 28% (195) 3% (23) 7022016 Vote: Hillary Clinton 61% (419) 12% (85) 23% (156) 4% (25) 6852016 Vote: Donald Trump 39% (315) 28% (227) 28% (227) 4% (33) 8022016 Vote: Other 44% (36) 27% (22) 26% (22) 4% (3) 842016 Vote: Didn’t Vote 37% (157) 17% (73) 33% (139) 13% (53) 423Voted in 2014: Yes 51% (687) 21% (285) 24% (315) 4% (48) 1335Voted in 2014: No 37% (245) 18% (122) 35% (229) 10% (67) 663
Continued on next page
Page 362
362
Morning ConsultTable POLx_12
Table POLx_12: Favorability forPope Francis
Demographic Total Favorable Total UnfavorableHeard Of, NoOpinion Never Heard Of Total N
Registered Voters 47% (932) 20% (408) 27% (544) 6% (114) 19984-Region: Northeast 56% (199) 13% (47) 26% (91) 4% (15) 3534-Region: Midwest 42% (186) 24% (107) 30% (133) 4% (18) 4444-Region: South 43% (320) 21% (156) 29% (214) 7% (55) 7464-Region: West 50% (226) 21% (98) 23% (106) 6% (25) 455Party: Democrat/Leans Democrat 57% (525) 14% (129) 24% (220) 4% (40) 914Party: Republican/Leans Republican 38% (309) 27% (216) 30% (242) 5% (41) 808Note: Row proportions may total to larger than one-hundred percent due to rounding. For more information visit MorningConsultIntelligence.com.
Page 363
National Tracking Poll #2110084, October, 2021Respondent Demographics Summary
Respondent Demographics Summary
Summary Statistics of Survey Respondent DemographicsDemographic Group Frequency Percentage
xdemAll Registered Voters 1998 100%
xdemGender Gender: Male 942 47%Gender: Female 1056 53%
N 1998
age Age: 18-34 514 26%Age: 35-44 307 15%Age: 45-64 679 34%Age: 65+ 497 25%
N 1998
demAgeGeneration GenZers: 1997-2012 170 9%Millennials: 1981-1996 551 28%GenXers: 1965-1980 469 23%
Baby Boomers: 1946-1964 732 37%N 1923
xpid3 PID: Dem (no lean) 777 39%PID: Ind (no lean) 528 26%PID: Rep (no lean) 693 35%
N 1998
xpidGender PID/Gender: DemMen 352 18%PID/Gender: DemWomen 425 21%
PID/Gender: Ind Men 280 14%PID/Gender: Ind Women 248 12%
PID/Gender: Rep Men 310 16%PID/Gender: Rep Women 384 19%
N 1998
xdemIdeo3 Ideo: Liberal (1-3) 566 28%Ideo: Moderate (4) 560 28%
Ideo: Conservative (5-7) 730 37%N 1856
xeduc3 Educ: < College 1206 60%Educ: Bachelors degree 501 25%
Educ: Post-grad 290 15%N 1998
Continued on next page
363
Page 364
Morning ConsultRespondent Demographics Summary
Summary Statistics of Survey Respondent DemographicsDemographic Group Frequency Percentage
xdemInc3 Income: Under 50k 873 44%Income: 50k-100k 728 36%
Income: 100k+ 398 20%N 1998
xdemWhite Ethnicity: White 1544 77%
xdemHispBin Ethnicity: Hispanic 222 11%
demBlackBin Ethnicity: Black 253 13%
demRaceOther Ethnicity: Other 201 10%
xdemReligion All Christian 1041 52%All Non-Christian 107 5%
Atheist 78 4%Agnostic/Nothing in particular 480 24%
Something Else 293 15%N 1998
xdemReligOther Religious Non-Protestant/Catholic 129 6%
xdemEvang Evangelical 499 25%Non-Evangelical 790 40%
N 1288
xdemUsr Community: Urban 487 24%Community: Suburban 1041 52%
Community: Rural 469 23%N 1998
xdemEmploy Employ: Private Sector 684 34%Employ: Government 112 6%
Employ: Self-Employed 183 9%Employ: Homemaker 104 5%
Employ: Student 67 3%Employ: Retired 534 27%
Employ: Unemployed 191 10%Employ: Other 124 6%
N 1998
xdemMilHH1 Military HH: Yes 315 16%Military HH: No 1683 84%
N 1998
Continued on next page
364
Page 365
National Tracking Poll #2110084, October, 2021Respondent Demographics Summary
Summary Statistics of Survey Respondent DemographicsDemographic Group Frequency Percentage
xnr1 RD/WT: Right Direction 757 38%RD/WT: Wrong Track 1241 62%
N 1998
xdemBidenApprove Biden Job Approve 899 45%Biden Job Disapprove 1039 52%
N 1938
xdemBidenApprove2 Biden Job Strongly Approve 418 21%Biden Job Somewhat Approve 481 24%
Biden Job Somewhat Disapprove 250 13%Biden Job Strongly Disapprove 788 39%
N 1938
xdemBidenFav Favorable of Biden 927 46%Unfavorable of Biden 1019 51%
N 1946
xdemBidenFavFull Very Favorable of Biden 476 24%Somewhat Favorable of Biden 451 23%
Somewhat Unfavorable of Biden 207 10%Very Unfavorable of Biden 812 41%
N 1946
xnr3 #1 Issue: Economy 768 38%#1 Issue: Security 360 18%
#1 Issue: Health Care 231 12%#1 Issue: Medicare / Social Security 227 11%
#1 Issue: Women’s Issues 125 6%#1 Issue: Education 59 3%
#1 Issue: Energy 107 5%#1 Issue: Other 122 6%
N 1998
xsubVote20O 2020 Vote: Joe Biden 946 47%2020 Vote: Donald Trump 864 43%
2020 Vote: Other 35 2%2020 Vote: Didn’t Vote 153 8%
N 1998
xsubVote18O 2018 House Vote: Democrat 769 38%2018 House Vote: Republican 702 35%
2018 House Vote: Someone else 49 2%N 1519
Continued on next page
365
Page 366
Morning ConsultRespondent Demographics Summary
Summary Statistics of Survey Respondent DemographicsDemographic Group Frequency Percentage
xsubVote16O 2016 Vote: Hillary Clinton 685 34%2016 Vote: Donald Trump 802 40%
2016 Vote: Other 84 4%2016 Vote: Didn’t Vote 423 21%
N 1993
xsubVote14O Voted in 2014: Yes 1335 67%Voted in 2014: No 663 33%
N 1998
xreg4 4-Region: Northeast 353 18%4-Region: Midwest 444 22%
4-Region: South 746 37%4-Region: West 455 23%
N 1998
xdemPidLean Party: Democrat/Leans Democrat 914 46%Party: Republican/Leans Republican 808 40%
N 1722
Note: Group proportions may total to larger than one-hundred percent due to rounding. All statistics are calcu-lated with demographic post-stratification weights applied.
366
Page 367
National Tracking Poll #2110084, October, 2021 367