Page 1
Native Meadow Trials at the Hudson Valley Farm Hub Page 1
Handouts for the Twilight Meeting on Sept. 22, 2020
Presenters:
Claudia Knab-Vispo, Hawthorne Valley Farmscape Ecology Program, [email protected]
Conrad Vispo, Hawthorne Valley Farmscape Ecology Program, [email protected]
Anne Bloomfield, Hudson Valley Farm Hub, [email protected]
For detailed descriptions of the trials during their first three years, please see the various reports posted on
https://www.hvfarmscape.org/agroecology. There you also find a link to the “Farmscape Ecology” movie by Jon
Bowermaster and videos of presentations featuring these native meadow trials.
Autumn Bentgrass Agrostis perennans NY, etc. 15.0%down,
occasional
Big Bluestem Andropogon geradii NY, etc. 6.4% up, dominant
Blackeyed Susan Rudbeckia hirtaJuly (into
Sept)
Eastern and
Central NA,
prob. not NY
6.3%
down, but still
dominant in
one plot
Canada Wildrye Elymus canadensis NY, etc. 10.7%same,
common
Indiangrass Sorghastrum nutans NY, etc. 6.7% same, common
Lance Leaved Coreopsis Coreopsis lanceolataJune-July
(into Sept)
Eastern and
Central NA,
prob. not NY
3.2%down,
occasional
Little Bluestem Schizachyrium scoparium NY, etc. 16.0%down,
occasional
Partridge Pea Chamaecrista fasciculata Aug-Sept NY, etc. 1.1% occasional
Purple Coneflower Echinacea purpureaJuly (into
Sep.)
Eastern NA,
prob. not NY5.3%
down,
occasional
Purple Lovegrass Eragrostis spectablis NY, etc. 1.3% ?
Purple Prairie Clover Dalea purpurea June Central NA 2.1%down, not
seen in 2020
Purpletop Tridens flavus NY, etc. 16.4%down,
occasional
Slender Lespedeza Lespedeza virginiana July?
Eastern and
Central NA,
prob. not NY
1.1%down, not
seen in 2020
Switchgrass Panicum virgatum NY, etc. 8.5% same, common
Trend in
Abundance
from 2018-2020
Native Meadow Mix B seeded in the Native Meadow Trials at the Hudson Valley Farm Hub in
May 2017
Flowering
PeriodCommon Name Scientific Name
Percent of
mix by
volume
(seed/ft2)
Native Range
Page 2
Page 2
Common Name Scientific Name Flowering Period Native Range
Percent
of mix by
volume
(seed/ft2
)
Trend in
Abundance
2018-2020
Blackeyed Susan Rudbeckia hirta July (into Sept)Eastern and Central
NA, prob. not NY6.5%
down, but still
common
Browneyed Susan Rudbeckia triloba Aug-Sept Eastern NA, prob. not NY 2.2%
same,
occasional and
patchy
Butterfly Milkweed Asclepias tuberosa June (into Sept) NYS, etc. 1.1% same, sparse
Common Milkweed Asclepias syriaca July NYS, etc. 1.1% same, sparse
Dense Blazingstar Liatris spicata August Eastern NA, prob. not NY 1.1%same, sparse
and patchy
Early Goldenrod Solidago juncea August NYS, etc. 3.2% up, common
Joe Pye Weed Eupatorium purpureum Aug-Sept NYS, etc. 1.0% none
Lance Leaved Coreopsis Coreopsis lanceolataJune-July (2nd fl
period: Aug-Sept)
Eastern and Central NA,
prob. not NY8.6%
down, common,
but patchy
Lavender Hyssop Agastache foeniculum August Midwest 8.6% up, occasional
Little Bluestem Schizachyrium scoparium NYS, etc. 19.4%up, common,
but patchy
Mistflower Eupatorium coelestinum Sept-Oct Eastern NA, prob. not NY 6.5%
down,
occasional and
patchy
Narrowleaf Mountainmint Pycnanthemum tenuifolium July NYS, etc. 3.8% same, sparse
New England Aster Aster novae-angliae Sept-Oct NYS, etc. 2.1% up, common
Ohio Spiderwort Tradescantia ohiensis May-JulyEastern and Central NA,
prob. not NY2.2% up, occasional
Partridge Pea Chamaecrista fasciculata Aug-Sept NYS, etc. 2.2% same, common
Purple Coneflower Echinacea purpurea July (into Sep.) Eastern NA, prob. not NY 4.3% same, common
Purple Prairie Clover Dalea purpurea June Central NA 2.2% same, sparse
Roundhead Lespedeza Lespedeza capitata July-Aug NYS, etc. 1.1% same, sparse
Showy Goldenrod Solidago speciosa Sept-Oct NYS, etc. 2.3% up, common
Slender Lespedeza Lespedeza virginiana July?Eastern and Central NA,
prob. not NY2.1% same, sparse
Smooth Blue Aster Aster laevis Sept-Oct NYS, etc. 2.1%same,
occasional
Tall White Beardtongue Penstemon digitalis June NYS, etc. 9.7%up, occasional,
but patchy
Wild Bergamot Monarda fistulosa July NYS, etc. 6.7% up, dominant
Native Meadow Mix A seeded in Native Meadow Trials at the Hudson Valley Farm Hub in May 2017
Page 3
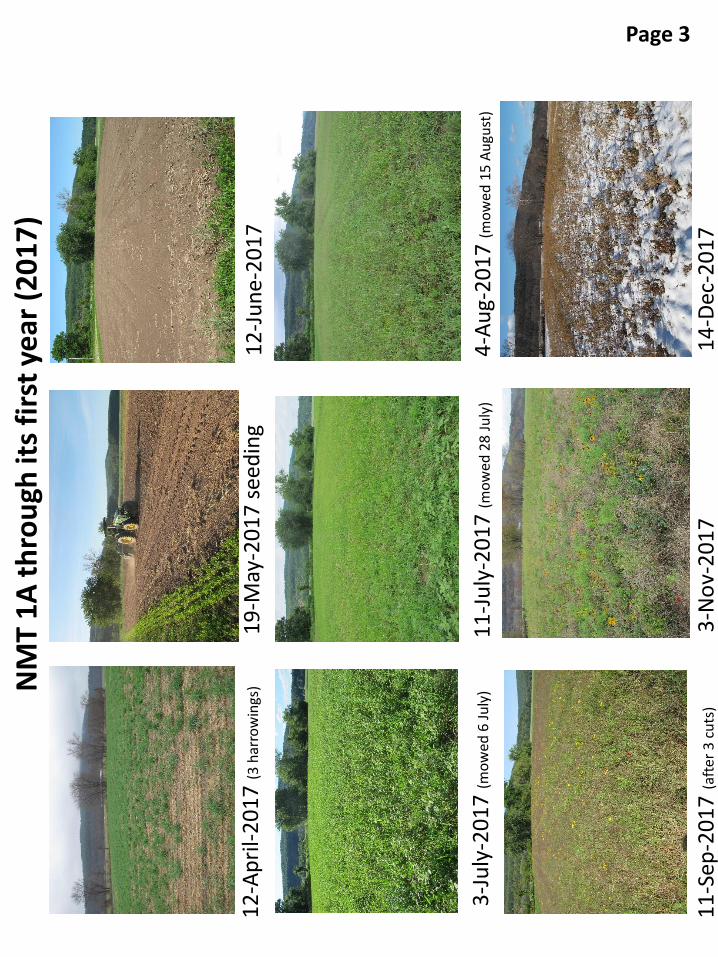
12
-Ap
ril-
20
17
(3 h
arro
win
gs)N
MT
1A
th
rou
gh it
s fi
rst
year
(2
01
7)
19
-May
-20
17
see
din
g1
2-J
un
e-2
01
7
3-J
uly
-20
17
(mo
wed
6 J
uly
)1
1-J
uly
-20
17
(mo
wed
28
July
)4
-Au
g-2
01
7 (m
ow
ed 1
5 A
ugu
st)
11
-Sep
-20
17
(aft
er 3
cu
ts)
3-N
ov-
20
17
14
-Dec
-20
17
Page 3
Page 4
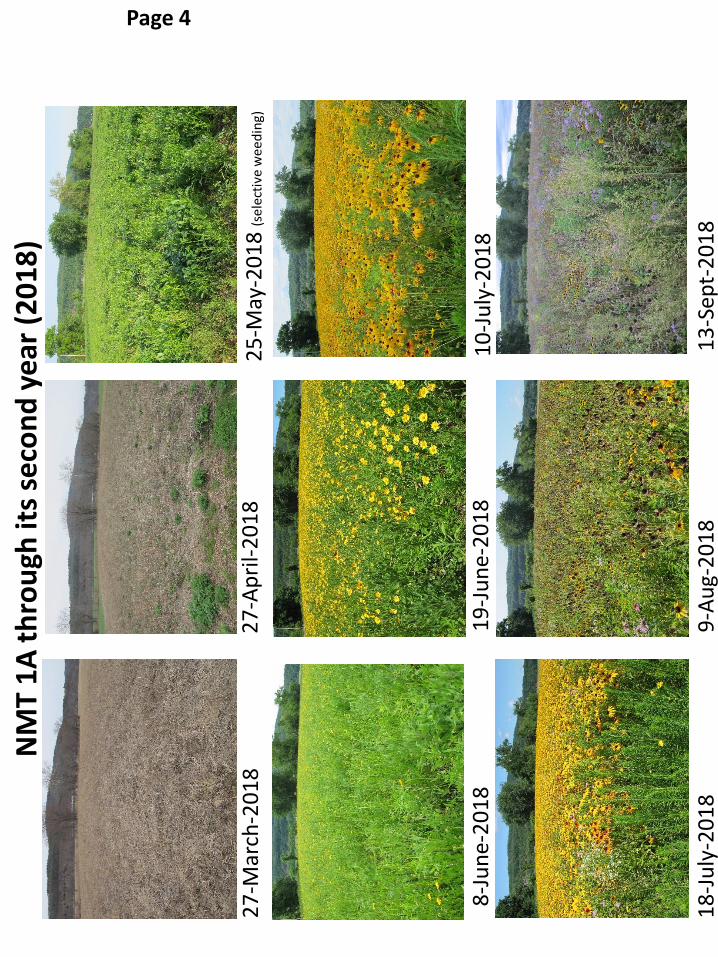
27
-Mar
ch-2
01
8
NM
T 1
A t
hro
ugh
its
seco
nd
yea
r (2
01
8)
27
-Ap
ril-
20
18
25
-May
-20
18
(se
lect
ive
we
ed
ing)
8-J
un
e-2
01
81
9-J
un
e-2
01
81
0-J
uly
-20
18
18
-Ju
ly-2
01
89
-Au
g-2
01
81
3-S
ept-
20
18
Page 4
Page 5
0%
20%
40%
60%
80%
100%
Percent Cover of Flowers
NM
T 1
A in
its
thir
d y
ear
(20
19
)
17
-Ap
ril-
20
19
22
-May
-20
19
27
-Ju
ne-
20
19
15
-Ju
ly-2
01
9
14
-Au
g-2
01
9
Page 5
0%
20%
40%
60%
80%
100%
Percent Cover of Flowers
20
18
0%
20%
40%
60%
80%
100%
Percent Cover of Flowers
LLC
ore
op
sis
Blk
-eye
S.
Mo
nar
da
NEA
ster
Brn
-eye
S.
Par
t. P
ea
20
19
20
-Sep
t-2
01
9
20
20
Page 6
0%
20%
40%
60%
80%
100%
2017 2018 2019 2020
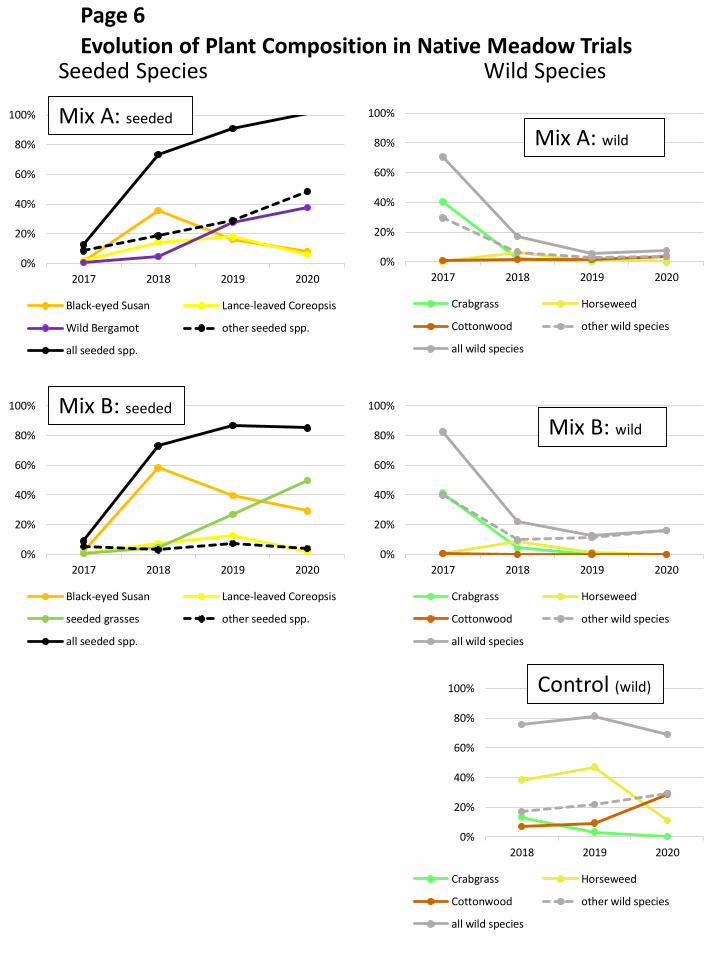
Black-eyed Susan Lance-leaved Coreopsis
Wild Bergamot other seeded spp.
all seeded spp.
0%
20%
40%
60%
80%
100%
2017 2018 2019 2020
Black-eyed Susan Lance-leaved Coreopsis
seeded grasses other seeded spp.
all seeded spp.
0%
20%
40%
60%
80%
100%
2017 2018 2019 2020
Crabgrass Horseweed
Cottonwood other wild species
all wild species
0%
20%
40%
60%
80%
100%
2017 2018 2019 2020
Crabgrass Horseweed
Cottonwood other wild species
all wild species
0%
20%
40%
60%
80%
100%
2018 2019 2020
Crabgrass Horseweed
Cottonwood other wild species
all wild species
Evolution of Plant Composition in Native Meadow TrialsSeeded Species Wild Species
Mix A: seeded
Mix A: wild
Mix B: wild
Mix B: seeded
Control (wild)
Page 6
Page 7
0%
20%
40%
60%
80%
100%
120%
5/25 6/9 6/24 7/9 7/24 8/8 8/23 9/7 9/22 10/7
Perc
ent
Co
ver
of
all I
nse
ct-
po
llin
ated
Flo
wer
s
Average Cumulative Flower Abundance in the three Treatments in 2018
Mix A
Mix B
Control
0%
20%
40%
60%
80%
100%
120%
6/4 6/19 7/4 7/19 8/3 8/18 9/2 9/17
Pe
rce
nt
Co
ver
of
all I
nse
ct-
po
llin
ated
Flo
wer
s
Average Cummulative Flower Abundance in the three Treatments in 2019
Mix AMix BControl
0%
20%
40%
60%
80%
100%
120%
6/13 6/28 7/13 7/28 8/12 8/27
Perc
ent
Co
ver
of
all I
nse
ct-
po
llin
ated
Flo
wer
s
Average Cummulative Flower Abundance in the three Treatments in 2020
Mix AMix BControl
Page 7
Page 8
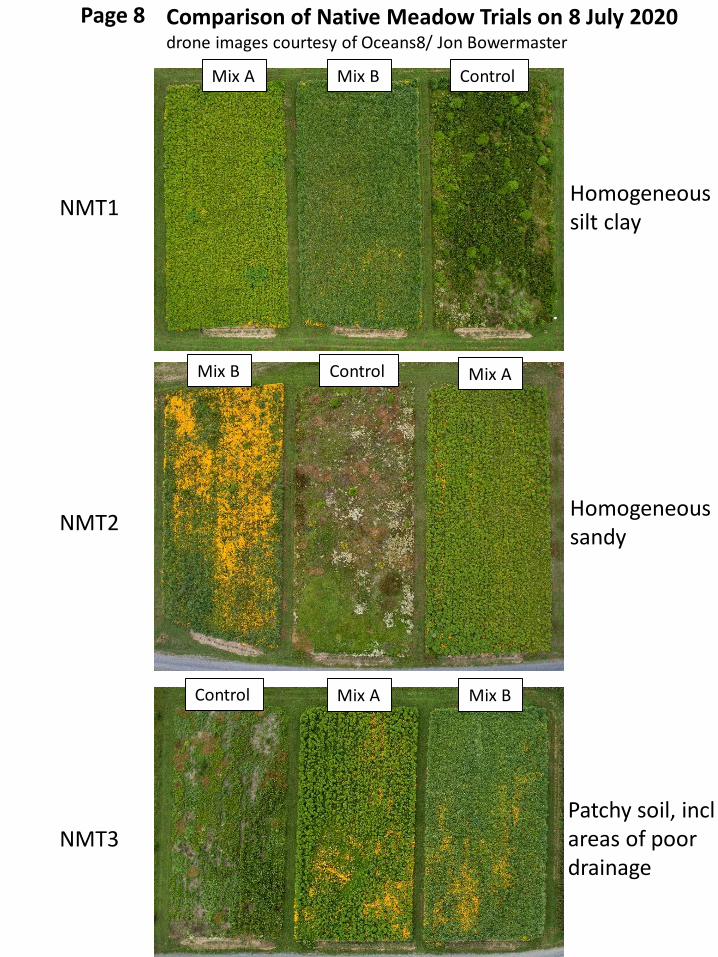
Comparison of Native Meadow Trials on 8 July 2020 drone images courtesy of Oceans8/ Jon Bowermaster
NMT1
NMT2
NMT3
Mix A Mix B Control
Mix A
Mix A
Mix B
Mix B
Control
Control
Homogeneous silt clay
Homogeneous sandy
Patchy soil, inclareas of poor drainage
Page 8
Page 9
21 Sept 2020. C Vispo, [email protected]
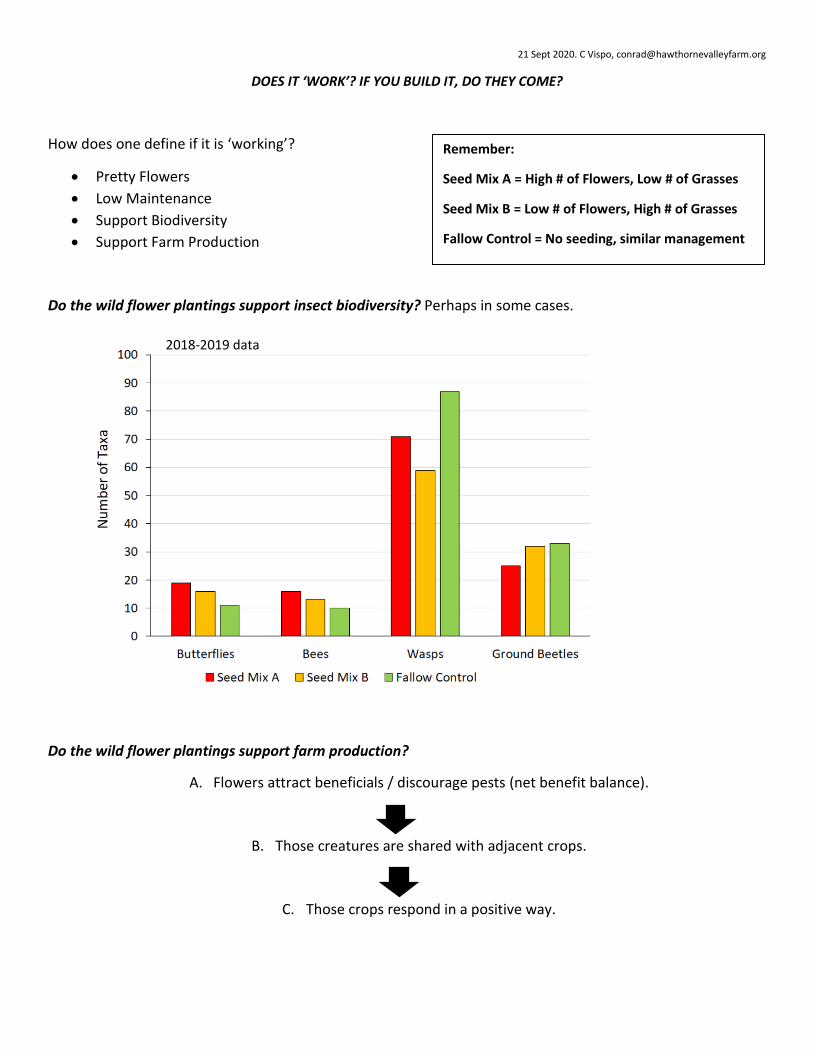
DOES IT ‘WORK’? IF YOU BUILD IT, DO THEY COME?
How does one define if it is ‘working’?
Pretty Flowers
Low Maintenance
Support Biodiversity
Support Farm Production
Do the wild flower plantings support insect biodiversity? Perhaps in some cases.
Do the wild flower plantings support farm production?
A. Flowers attract beneficials / discourage pests (net benefit balance).
B. Those creatures are shared with adjacent crops.
C. Those crops respond in a positive way.
Remember:
Seed Mix A = High # of Flowers, Low # of Grasses
Seed Mix B = Low # of Flowers, High # of Grasses
Fallow Control = No seeding, similar management
2018-2019 data
Page 10
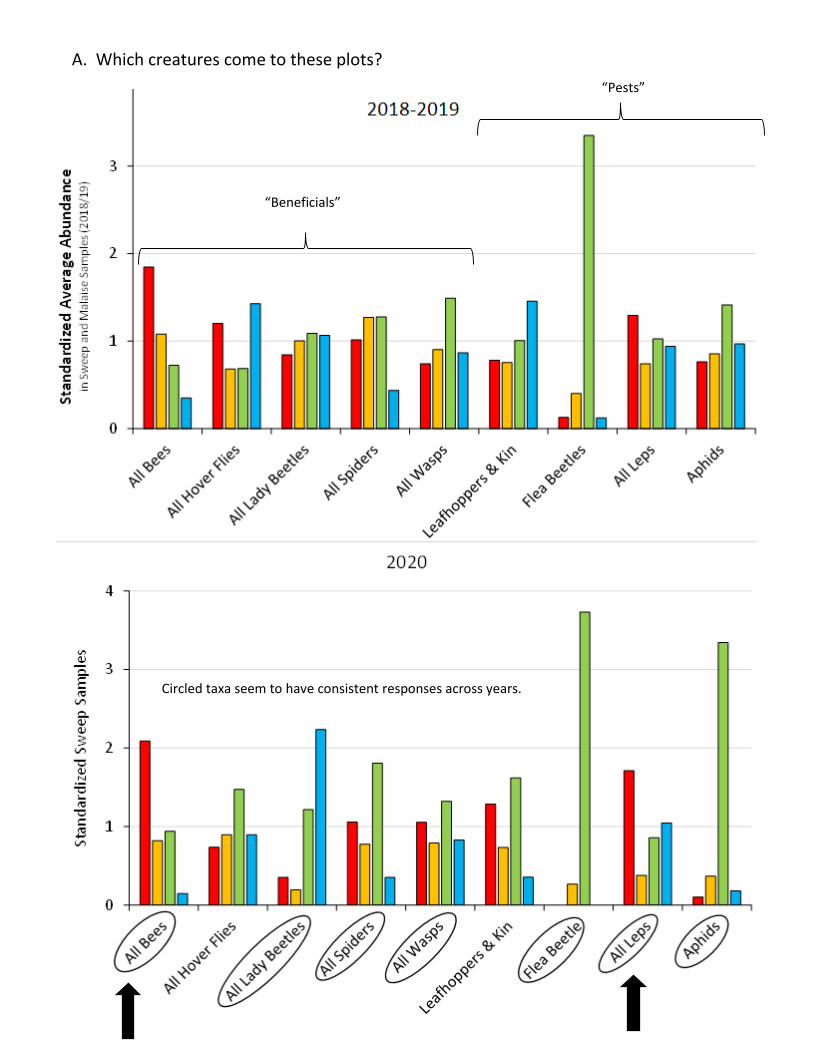
A. Which creatures come to these plots?
“Beneficials”
“Pests”
Circled taxa seem to have consistent responses across years.
Page 11
B. What seeps over into adjacent veggie plots?
C. What do the adjacent veggies think of all this?
BUTTERNUT SQUASH
In terms of total harvest, in both 2019 and 2020, total Butternut Squash harvest in Mix A was a bit over 70% of the
harvest from next to the Fallow Control; Seed Mix B harvest was around 80% of that from adjacent to the Fallow
Control. There is no indication that Seed Mix A helps adjacent organic squash production in this farm’s landscape.
0
1
2
Seed Mix A Seed Mix B Fallow Control
Stan
dar
diz
ed in
-Cro
p S
amp
les
"Beneficials" "Pests"
2019 2020 2019 2020 2019 2020
Seed Mix A 81.7 41.7 4 3.5 933.8 437.3
Seed Mix B 91.3 48.3 4.1 3.5 995.4 507.8
Fallow Control 97.7 58.3 4.5 3.6 1284.2 624.7
Average No. of Ripe
Squash per Bed
Mean Squash
Weight (lbs)
Total Harvest from
Treatment (lbs)
2020 data
Page 12
Higher squash damage next to Seed Mix A?
SWEET CORN (2020 only)
ECB = European Corn Borer a major corn pest
Cob or ear weight from adjacent to Seed Mix A averaged about 15% heavier and leaves (& cobs?) had lower damage,
although stink bug damage to kernels (=“punctures”?) may have been higher…. A hint of a positive effect – needs
repeating.
Conclusions
Yes, one can establish native wild flower meadows organically on a farm such as this, although not without
effort.
Those meadows attract some beneficials but perhaps not others (no doubt dependent on specifics of flower mix
and planting locations)
Net effect on adjacent crops is unclear, may be negative in some cases, perhaps positive in others, perhaps
neutral in yet others.
There are other reasons to plant native wild flowers (aesthetics, conservation), but effects on the production of
nearby crops is likely nuanced and very dependent on the crops, the specific farm system, and the landscape in
which the farm is embedded.
Holes (#
of leaves,
out of
five)
Specks (#
of leaves
out of
five)
# ECBs in
top 5
internode
#
Punctures% fert % tip fill
avg. ECBs
in 2° cobsMass (g)
Length
(inches)
Seed Mix A 1.47 1.2 0.18 2.39 84.44 40 0.05 198.6 7.5
Seed Mix B 1.89 2.11 0.16 0.71 77.06 30 0.52 178.3 7.3
Fallow Control 2.17 1.94 0.03 0.72 68.89 38.89 0.22 170.92 7.5
Leaves & Stalks Cob Characteristics
2019 data (2020 is still being analyzed!)