71
CREDIT CONFERENCE NATIXIS SEPTEMBER 24, 2020

CREDIT CONFERENCE
NATIXIS
SEPTEMBER 24, 2020

Credit
Conference
September 24, 2020
2020 H1 results and
August YTD market

Credit Conference – September 24, 2020
August 2020 YTD: demand recovery in most of the markets, particularly
strong in China.
Source: Michelin
* Including Central America for OE
-6 -12 -24 -46 -40 -16 -11 -9
-2 -5 -22 -51 -45 -15 -10 -10
-5 -4 -18 -61 -50 -15 -4 -5
PC/LT: -20% TRUCK: -14%
-10 -19 -21 -20 -19 -11 -9 -6
-1 +6 -11 -34 -27 -13 -10 -8
-3 -6 -8 -27 -36 -11 -5 -8
SPECIALTIES
-18 -60 -36+4 +9 +9 +14 +14
-17 -68 -38 0+10 +7 +14 +8
Jan Feb Mar Apr May Jun Jul Aug
Jan Feb Mar Apr May Jun Jul Aug
Jan Feb Mar Apr May Jun Jul Aug
Jan Feb Mar Apr May Jun Jul Aug
Jan Feb Mar Apr May Jun Jul Aug
Jan Feb Mar Apr May Jun Jul Aug
Jan Feb Mar Apr May Jun Jul Aug
Jan Feb Mar Apr May Jun Jul Aug
3

● Quick deployment of all the measures needed to safeguard employees, ensure business continuity and conserve
cash
● Despite collapsing markets and a 20.6% contraction in sales, SOI* ended the first half at €310m:
─ 22.4% decline in volumes, leading to a deep fixed cost shortfall
─ 0.3% gain from assertive pricing policy at a time of declining raw material prices
─ 1.6% gain from the still buoyant mix, reflecting market share gains in the 18”+ segment and resilience in the Specialty businesses
─ €192m reduction in SG&A costs, excluding €77m in exceptional outlays directly related to Covid-19
● A robust financial position recognized by the rating agencies, to weather the crisis
● Strategic choices validated during the first half:
─ A global presence and diversified business base (resilience in the Specialty businesses, with a 15% operating margin)
─ CO2 reduction pathways and objectives approved by the Science Based Targets initiative**
● Expanded CSR governance within the Supervisory Board
Credit Conference – September 24, 2020
Supported by its diversified offering, engaged employees and robust financial position,
Michelin demonstrates its resilience through a crisis of unprecedented intensity
* Segment Operating Income
** Initiative launched in 2015, a few months before COP21, SBTi is a collaboration of 4 organizations that offer a voluntary approach to fight against global warming in the private sector
4

Credit Conference – September 24, 2020
In response to the health crisis, Michelin is taking action to protect
its employees and support its host communities worldwide
12,000 polycarbonate face shields
being fast-track produced for
hospitals
Ventilator components and
reusable masks being 3D
printed
Positioning cushions being
produced to help patients breathe
Mask production lines built with
our Imeca subsidiary
Masks (~2.4m), hand sanitizer
(~12,000 liters) and other
PPE donated
Tires (~4,600) donated and
free-of-charge assistance provided
for ambulances and other vehicles
needed for the crisis
Masks (400k/week) and hand
sanitizer being produced in
certain Group plants
Financial and in-kind
donations made
+ +
+
+
+
+
+
Production shutdowns, home office
solutions introduced
Necessary health precautions
deployed to support the
reopening of production lines
Production gradually being
restarted
Business safely
resumed
Sustained, diligent
tracking to respond
promptly to any resurgence
of the epidemic
5
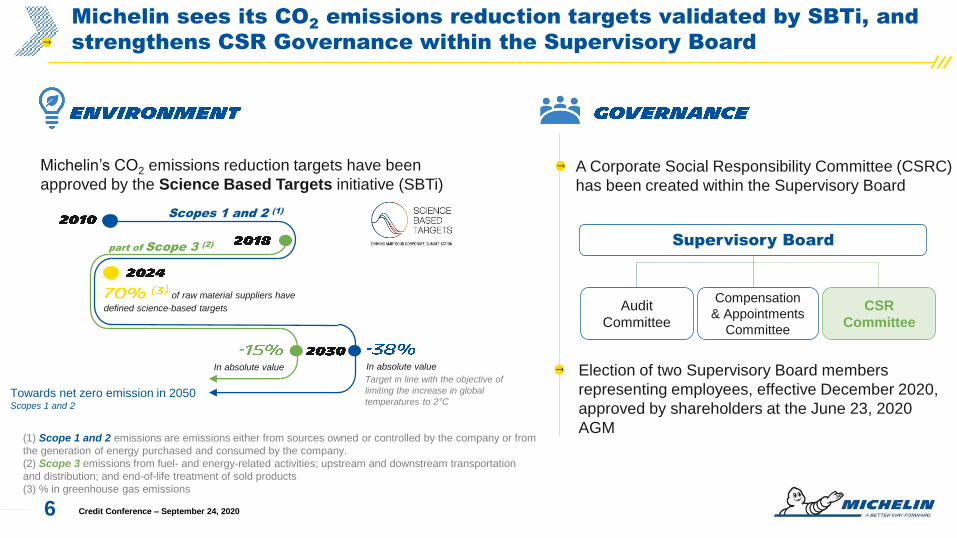
Michelin sees its CO2 emissions reduction targets validated by SBTi, and
strengthens CSR Governance within the Supervisory Board
Credit Conference – September 24, 2020
A Corporate Social Responsibility Committee (CSRC)
has been created within the Supervisory Board
Michelin’s CO2 emissions reduction targets have been
approved by the Science Based Targets initiative (SBTi)
Election of two Supervisory Board members
representing employees, effective December 2020,
approved by shareholders at the June 23, 2020
AGM
Supervisory Board
Audit
Committee
Compensation
& Appointments
Committee
CSR
Committee
Scopes 1 and 2 (1)
part of Scope 3 (2)
Towards net zero emission in 2050 Scopes 1 and 2
In absolute valueIn absolute value
of raw material suppliers have
defined science-based targets
Target in line with the objective of
limiting the increase in global
temperatures to 2°C
(1) Scope 1 and 2 emissions are emissions either from sources owned or controlled by the company or from
the generation of energy purchased and consumed by the company.
(2) Scope 3 emissions from fuel- and energy-related activities; upstream and downstream transportation
and distribution; and end-of-life treatment of sold products
(3) % in greenhouse gas emissions
6

2019 sales by region 2019 sales by growth driver
A resilient multidimensional Group in an unprecedented
systemic crisis
North America (incl. Mexico)
Europe (including CIS)
Asia and Rest of the World
* Auto (PC/LT OE): Passenger car and Light truck tires
sold to vehicle manufacturers as Original Equipment
7 Credit Conference – September 24, 2020

1,438
312 310
+3 -1,522
+217
+192 -77 +17 -2
+44
H1 2019 H1 2020at
constantexchange
rates
H1 2020
Credit Conference – September 24, 2020
* Of which a €752m fixed cost shortfall and decline in industrial output, partly offset by €124m in furlough grants
** supply and manufacture of masks and gels
H1 2020 SOI: deep fixed cost shortfall due to the drop in volumes, partially
offset by a robust price-mix and lower SG&A expenses
YoY change in SOI (in € millions)
Currency
effectOther
SG&A
Price-mix
o/w mix
+187
Raw
materials
+261
Scope of
consolidation
Covid-19
Costs **
Volumes*
8

Credit Conference – September 24, 2020
At a time of plunging global demand, margin was slightly negative in
RS1 and RS2, but highly resilient in RS3
H1 2020 H1 2019 Change
* For the segment
(in € millions)
Despite the collapse in volumes, the Group continued to enhance the mix across every reporting segment
and maintained an assertive pricing policy that more than compensated for the negative impact of indexation
clauses, which were applied in particular in the Automotive OE business.
5,658
585
10.3%
3,144
2798.9%
2,979
574
19.3%
-22.3%
-106.0%
-11.1 pts
-23.3%
-110.8%
-10.2 pts
-14.3%
-34.7%
-4.6 pts
4,394
-35
-0.8%
2,411
-30
-1.3%
2,552
375
14.7%
RS1 sales
Operating income*
Operating margin*
RS2 sales
Operating income*
Operating margin*
RS3 sales
Operating income*
Operating margin*
9

A solid cash position at June 30, 2020Change in free cash flow(in € millions, including acquisitions and JV financing)
Optimized cash management strengthening the Group’s robust
financial position and enabling it to deal with the crisis calmly
H1 2019 free cash flow -592
Change in EBITDA -1,104
Change in trade working capital +285
Change in tax and interest paid +281
Change in capital expenditure +120
Change in M&A and financing for
subsidiaries and affiliates
+400
Change in other +259
H1 2020 free cash flow -351
● €2.8bn in cash and cash equivalents
● €1.4bn in commercial paper issued out of a maximum
€3.1bn
● €1.5bn in confirmed, undrawn lines of credit
● No significant bonds falling due before 2022
The Group’s available sources of financing enabled
it to easily pass the stress tests conducted for a
period 18 months out
Credit Conference – September 24, 202010

Net debt
(in € millions)
Credit ratings reaffirmed in first-half 2020
Despite the crisis, net debt remains under control, thanks to
management discipline recognized by the rating agencies
* Free cash flow excluding M&A and financing for subsidiaries and affiliates
** Mainly translation adjustments, share buyback and the impact of new leases
5,184
5,510
25541
55 -25
Net debtDec. 31, 2019
FCFH1 2020*
M&A Financing forsubsidiaries and
affiliates
Other** Net debtJune 30, 2020
+ €326m
Short termS&P
Fitch
A-2
F-2
Long termS&P
Fitch
Moody’s**
A-
A-
A3
OutlookS&P
Fitch
Moody’s**
Negative
Stable
Stable
** Moody’s, whose rating is no longer solicited as of July 1, 2020, affirmed the long-term credit
ratings of CGEM and CFM on May 14, 2020
+ €351m
11 Credit Conference – September 24, 2020
Credit Conference – September 24, 2020
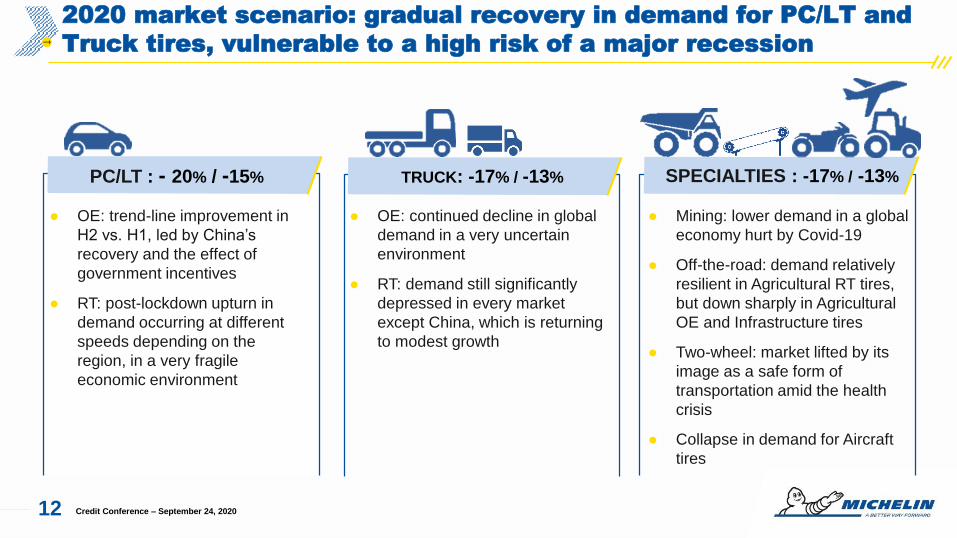
2020 market scenario: gradual recovery in demand for PC/LT and
Truck tires, vulnerable to a high risk of a major recession
● OE: continued decline in global
demand in a very uncertain
environment
● RT: demand still significantly
depressed in every market
except China, which is returning
to modest growth
● Mining: lower demand in a global
economy hurt by Covid-19
● Off-the-road: demand relatively
resilient in Agricultural RT tires,
but down sharply in Agricultural
OE and Infrastructure tires
● Two-wheel: market lifted by its
image as a safe form of
transportation amid the health
crisis
● Collapse in demand for Aircraft
tires
TRUCK: -17% / -13%PC/LT : - 20% / -15% SPECIALTIES : -17% / -13%
● OE: trend-line improvement in
H2 vs. H1, led by China’s
recovery and the effect of
government incentives
● RT: post-lockdown upturn in
demand occurring at different
speeds depending on the
region, in a very fragile
economic environment
12

2020 scenario*
Credit Conference – September 24, 2020
2020
VolumesGrowth in line with markets
excluding the geomix effect
Cost impact of raw materials prices and customs
dutiesPositive
Currency effectSlightly negative
based on June 2020 rates**
Net price-mix/raw materials effectPositive
Price / Raw materials: positive
* Based on the following average prices and exchange rates for 2020: natural rubber: $1.267/kg; butadiene (US, Europe and Asia): $611/t;
Brent: $39.8/bbl; EUR/USD: 1.092
** See slide 54
13

2020 guidance excluding any new systemic effect from Covid-19
Credit Conference – September 24, 2020
2020
Segment Operating Income
at constant exchange rates > €1,200m
Structural FCF > €500m
14

Credit
Conference
September 24, 2020
Drivers for growth

Credit Conference – September 24, 2020
Michelin’s strengths Four areas of growth
Leverage on Group’s strengths, in four domains of growth, to
enhance customers mobility and create value
*By Advertising week
Employee engagementIn 2019, 81% of employees say they are proud
and happy to work at Michelin
Michelin brand leadership Michelin Man named* "Icon of the Millennium"
High-tech materials leadership 125 years of competencies and innovations in flexible
composite materials and transformation processes
16

* 1st replacement
Automotive: market share gains in 18 inch and above, recognition
of Michelin’s technological leadership
MICHELIN OE/RT loyalty rate in Europe*:
Percentage of ≥18” tires in total MICHELIN-brand sales (in tonnes)
25%29%
35%39%
43%46%
2015 2016 2017 2018 2019 H1 2020
>50%
18’’
>65%
19’’
>89%
20’’ and +
Credit Conference – September 24, 202017

Electric vehicles: by leveraging its technological advance, Michelin is
strengthening its leadership in a highly demanding, fast-growing market
Credit Conference – September 24, 2020
Share of EV
sales in the
total market
aligned with
EV needs
High-
performance
solutions
Increasing rangethe major challenge for
EVs
Supporting
heavy batteries
Reducing cockpit
noise
Coping with torque
GeneralistSport passion
Premium luxury New entries
18

Launch of the
* Long Lasting Performance
Michelin is deploying its circular economy strategy, notably in
urban and highway transportation
Credit Conference – September 24, 2020
On average than the
previous generation
Demonstrating the
For light commercial vehicles
environment economy safety
● Growth driver for the Group’s Road transportation tire business
● Supports Michelin’s “All Sustainable” strategy
● Unmatched solutions, thanks to Michelin’s robust tire
casings
● A profitable business that is more recession-proof than
new tires
As many
kilometers(1)
savings vs.
Buying a new
tire(2)
Raw materials used in
production(3)
Waste to be recycled:
(1) With the same casing. In-house Michelin tests in 2013. The lifespan of a MICHELIN Remix® tire = 97% of the lifespan of a new, same-size MICHELIN tire.
(2) European average, in-house price surveys in 2014 and Internet price surveys conducted by an outside organization in 2014.
(3) MICHELIN Remix® retreading requires only an average 20 kg of raw materials, i.e. 70% less than to make a new tire
19

Credit Conference – September 24, 2020
Michelin strengthens its position in markets with high potential
for value creation
Technological leadership
Comprehensive solutions for every
customer need
Services & Solutions
Mining tires
Long-term CAGR Long-term CAGR
OHT
MICHELIN Zen@terra
Convoyer belts
XDR250 - 57’’ XDR3 - 63’’
MICHELIN
MEM’S Evolution 4
MICHELIN AgroPressure
CAMSO tracks and tracks system
UrbanizationTrade flows Population growth
20
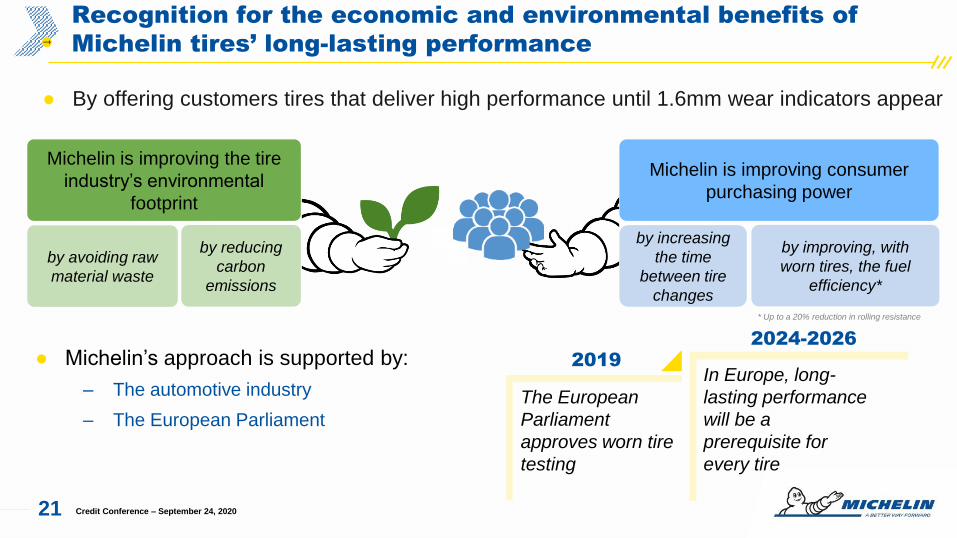
● By offering customers tires that deliver high performance until 1.6mm wear indicators appear
Credit Conference – September 24, 2020
Recognition for the economic and environmental benefits of
Michelin tires’ long-lasting performance
Michelin is improving the tire
industry’s environmental
footprint
by avoiding raw
material waste
by reducing
carbon
emissions
Michelin is improving consumer
purchasing power
by increasing
the time
between tire
changes
by improving, with
worn tires, the fuel
efficiency*
The European
Parliament
approves worn tire
testing
In Europe, long-
lasting performance
will be a
prerequisite for
every tire
● Michelin’s approach is supported by:
‒ The automotive industry
‒ The European Parliament
20192024-2026
* Up to a 20% reduction in rolling resistance
21

Innovation leader with Uptis: the airless concept, an essential
step towards more sustainable mobility
- From ambition to action -
Benefits for car
owner
Benefits for fleet
owners and
profesionnals
Benefits for all
Productivity optimisation
Material savings and
waste reduction
Co-developed
with General Motors
(Connected, Autonomous,
Shared, Electric)
More serenity during
the journeys
Credit Conference – September 24, 2020

Credit Conference – September 24, 2020
Services & Solutions: an expansive offering suited to B2B
customer needs
A global footprint
Connected
services
vehicles under contract
For the transportation industry and beyond
Infrastructure Insurance
* Including Truck and Mining tire maintenance
Monetization of
data analyses
Predictive
maintenance
Usage-based
billing*
23

Credit Conference – September 24, 2020
Our aim: deeply understand our customers to provide
solutions that create greater value for all
DATA LAKE
100% tires with RFID
- JV with Sigfox & Argon Consulting -
with Safran
Trucks & Light Trucks Military
Aircraft
Passenger Car
Container Tracking
Agriculture Mining
● Data collection: a pre-requisite to building predictive capabilities
● Michelin begins this journey with a data lake that merges unique historical data sets
● Michelin will go much further, ultimately connecting every single asset
24

Credit Conference – September 24, 2020
High-Tech Materials strategy: addressing 3 main value chains
for a sustainable growth
Rubber goods
Bio-based and clean materials
End of Life Tire recycling
25

Credit Conference – September 24, 2020
Photo Renault
Michelin aims to become a world leader in hydrogen systems
by participating in the Zero Emission Valley
project (Hympulsion) in France, involving
public-private partners
by being the major player in hydrogen
competition, a solution accelerator, with
Mission H24 partnership
by being a key stakeholder and a trusted third
party in hydrogen mobility (Hydrogen Europe,
Hydrogen Council, MOVIN’ON…)
by partnering with Faurecia to create
a leading hydrogen fuel cell system
WITH its expertise in the hydrogen fuel cell technology, notably in the
coated membranes technology, Michelin is accelerating the
deployment of zero-emission mobility:
26

Credit Conference – September 24, 2020
Symbio strong ambitions on a growing and high value
creative market
employees in 2020 will be committed by
Michelin and Faurecia
Production facilities
eventually: Europe,
Asia and USA
÷the price of a fuel cell stack +
components in the future,
(due to growing demand)
2030 outlook
market share
in sales
0,52,6
10,5
2020 2025 2030
Total stacks market size (€bn)
2020 2025 20300
60
120
FCEV*
ICE*
BEV*
Total cost of ownership for a
light truck** (€k)
* FCEV: Fuel Cell
Electric Vehicle,
BEV: Battery
Electric Vehicle,
ICE: Internal
Combustion
Engine
** Assumptions:
Light trucks, EU
region, Max range
500 km, 80,000
km/year, 3 years
ownership
27

Credit Conference – September 24, 2020
Maintaining our brand leadership and strengthening
our B2C connection
* Reputation Institute
that enable our customers to enjoy a unique mobility
experience and make Michelin a trusted partner
8th most reputable
company worldwide Ranked no.1 in the
automotive sector In 2019, a strategic international partnership agreement
was signed with the aim of combining:‒ The gastronomic selection expertise of the Michelin Guide
‒ The power of TripAdvisor’s global customer audience
‒ TheFork’s leading online restaurant booking platform
28

Credit
Conference
September 24, 2020
Drivers for
competitiveness
Credit Conference – September 24, 2020

Credit Conference – September 24, 2020
Beyond 2020: set up our manufacturing efficiency, boosting
competitiveness gains
Produce locally and increase flexibility
Multistrada conversion from Tier 3 toTier 2 production
Increase the number and utilization of large plants (>100k tonnes)
Process standardization
Empowerment deployment
Simplexity
Digital manufacturing
30

Credit Conference – September 24, 2020
Continuing to rightsize Michelin’s manufacturing footprint
South and
Central
America
North
America
Western Europe
Eastern Europe
2023 production capacity by region (in kt)
Including Camso and Multistrada
Asia
31

Credit Conference – September 24, 2020
Digital manufacturing: 50 demonstrators launched
Assets Quality
Assisted root cause quality
control
Quality data collection (SPC,
Vision)
Supply
End to End integration
On time inventory /
intelligent lots
People Automation
AGV, ROBOTS, VISION
1. AUTOMATISATION
FACTORY FLOW
2. WORKSTATION
AUTOMATISATION
3. AUTOMATISATION
CONTROL – VISION
32
Credit Conference – September 24, 2020
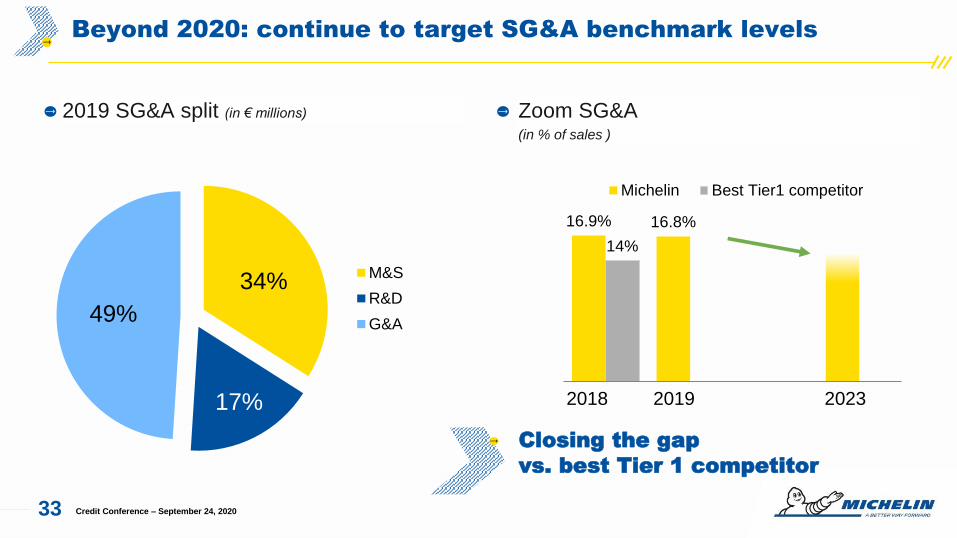
2019 SG&A split (in € millions) Zoom SG&A (in % of sales )
Beyond 2020: continue to target SG&A benchmark levels
16.9% 16.8%
14%
Michelin Best Tier1 competitor
34%
17%
49%
M&S
R&D
G&A
Closing the gap
vs. best Tier 1 competitor
2018 2019 2023
33

Credit Conference – September 24, 2020
Levers to improve our SG&A structure
34

Credit
Conference
September 24, 2020
Financial profile

2212
27 11 9 6
33
54
3945
Gearing Net debt / equity (in %)
A robust balance sheet after recent acquisitions, confirmed by
the rating agencies
Net Debt / EBITDA
0,630,31
0,040,22 0,26 0,23 0,18
0,98 0,96
0,13**
* 2018 restated for Camso PPA impact on the balance sheet **IFRS 16 impact
Credit ratings reaffirmed in
first-half 2020
36 Credit Conference – September 24, 2020
Short termS&P
Fitch
A-2
F-2
Long termS&P
Fitch
Moody’s
A-
A-
A3
OutlookS&P
Fitch
Moody’s
Negative
Stable
Stable
● Last rating actions:
‒ May 18, 2020 : Moody’s, whose ratingsis no longer solicited as of July 1, 2020
‒ May 19, 2020 : S&P
‒ May 29, 2020: Fitch

Net debt
(in € millions)
Despite the crisis, net debt remains under control, thanks to
management discipline recognized by the rating agencies
* Free cash flow excluding M&A and financing for subsidiaries and affiliates
** Mainly translation adjustments, share buyback and the impact of new leases
5,184
5,510
25541
55 -25
Net debtDec. 31, 2019
FCFH1 2020*
M&A Financing for subsidiariesand affiliates
Other** Net debtJune 30, 2020
+ €326m
+ €351m
37 Credit Conference – September 24, 2020

Debt maturities at June 30, 2020 (carrying amount, in € millions)
Credit Conference – September 24, 2020
A confortable cash position
0
500
1 000
1 500
2 000
2 500
3 000
3 500
4 000
Treasuryand
Back-up lines
H2 2020 2021 2022 2023 2024 2025 2026 andbeyond
Loans from financial institutions
Securitization
Bond
CP
Derivatives and leases
Cash and cash equivalents
Cash management Financial Assets
Confirmed Back-up Facilities
38

Credit Conference – September 24, 2020
Outstanding bond issues (as of June 30, 2020)
IssuerCompagnie Générale des Etablissements
MICHELIN
Compagnie Générale des Etablissements
MICHELIN
Compagnie Générale des Etablissements
MICHELIN
Compagnie Générale des Etablissements
MICHELIN
Compagnie Générale des Etablissements
MICHELIN
MICHELIN Luxembourg
MICHELIN Luxembourg
MICHELIN Luxembourg
Issue Senior Note Senior Note Senior Note Senior Note Senior Note Senior Note Senior Note Senior Note
Type Bond Bond Bond Convertible Convertible Bond Bond Bond
Principal Amount € 750 mn € 1'000 mn € 750 mn $ 600 mn $ 500 mn + TAP $100 mn € 209 mn + TAP € 93 mn € 300 mn € 300 mn
Offering price 99,099% 99,262% 99,363% 95,50% 100% & 103,85% 98.926% & 118.66 % 99,967% 99,081%
Rating corporationat Issuance date
A- (S&P)A3 (Moody's)
A- (S&P)A3 (Moody's)
A- (S&P)A3 (Moody's)
A- (S&P)A3 (Moody's)
A- (S&P)A3 (Moody's)
at issuance : BBB+ (S&P)A3 (Moody's)
BBB+ (S&P)A3 (Moody's)
BBB+ (S&P)A3 (Moody's)
Current corporation rating A- (S& P) ; A3 (Moody's) ; A- (Fitch) --- as of 01/July/2020, S& P and Fitch are sollicitated agencies
Coupon 0,875% p.a 1,75% p.a 2,50% p.aZERO
Conv premium 130%ZERO
Conv premium 128%3,25% p.a 1,125% p.a 1,75% p.a
Issue Date 3-Sept.-18 3-Sept.-18 3-Sept.-18 05/Jan/2018 05/Jan/2017 & 25/Apr/2017 21/Sep/2015 & 27/Sep/2016 19-May-15 19-May-15
Maturity 3-Sept.-25 3-Sept.-30 3-Sept.-38 10-Nov.-23 10-Jan.-22 30-Sept.-45 28-May-22 28-May-27
Interest paymentAnnualSept 03
AnnualSept 03
AnnualSept 03
N/A N/AAnnualSept 30
AnnualMay 28
AnnualMay 28
ISIN FR0013357845 FR0013357852 FR0013357860 FR0013309184 FR0013230745 XS1298728707 XS1233732194 XS1233734562
Denomination€ 100'000 with min.
tradable amount€ 100'000
€ 100'000 with min. tradable amount
€ 100'000
€ 100'000 with min. tradable amount
€ 100'000
$ 200'000 with min. tradable amount
$ 200'000
$ 200'000 with min. tradable amount
$ 200'000
€ 1'000 with min. tradable amount
€ 1'000
€ 1'000 with min. tradable amount
€ 1'000
€ 1'000 with min. tradable amount
€ 1'000
39

● Total cash @ 2’990 Millions € : 2’810 M€ of cash& cash equivalent + 180 M€ of financial
assets – treasury management at June 30, 2020
● 1’500 M€ of an undrawn committed syndicated credit facility refinanced in December/2014
with 17 banks until December/2021 (in course of being refinanced for 3+1+1 years with,
most probably, a significantly higher amount up to 2’000 – 2’500 Millions €) :
- Back-up facility
- EUR and/or USD
- No financial covenants
● Main short-term debt programs :
- French Commercial Papers (NEUCP) : maximum @ 2.500 M€ (since May/2019)
- US Commercial Papers (USCP) : maximum @ 700 M$
- Pan- European receivables securitization program : total capacity @ 300 M€
- US receivables securitization program : total capacity @ 150 M$, up to 250 M$
- Reverse factoring program
Cash and Liquidity Reserve
Credit Conference – September 24, 202040

● Liquidity risk:─ Secured financing : RCF, undrawn committed syndicated credit facility of 1’500 M€ (in course of being refinanced and
increased up to 2’000-2’500 M€)
─ Diversified financing sources
─ Conservative approach with available short- term instruments much above our needs
─ Non-risky cash investment
─ Risk managed at diverse horizons: very short term (5 d), monthly on a rolling 18 months, 5 years financial plan
● Interest rate risk: ─ Managed by currency at central level only
─ Defined fixed/variable thresholds
● FX rate risk:─ Accounting FX exposure systematically hedged on a daily basis
● Counterparty risk: ─ Duly authorized counterparts (Group banks, CDS, ratings, market cap, …) with defined thresholds in €
─ Managed on a weekly basis
Systematic and Efficient Management of the Main Financial Risks
under the Governance of the Financial Risk Committee
Credit Conference – September 24, 202041

Credit Conference – September 24, 2020
Defined benefit plans as at December 31, 2019
Defined benefit
obligations
Assets & liabilities
in Balance Sheet
11.1 11.1Present value
of unfunded
obligations
Present value
of fully or partly
funded obligations
Net liability
(in balance
sheet)
Fair value
of plan
assets
Assets celling
8.07.3
0.1
3.03.8
(in € billions)
Estimates
of contributions
to be paid and benefits
to be paid directly
2020e: €244m
2021e: €207m
2022e: €170m
2023e: €174m
2024e: €205m
2025-2029e: €1,077m
42
Credit Conference – September 24, 2020
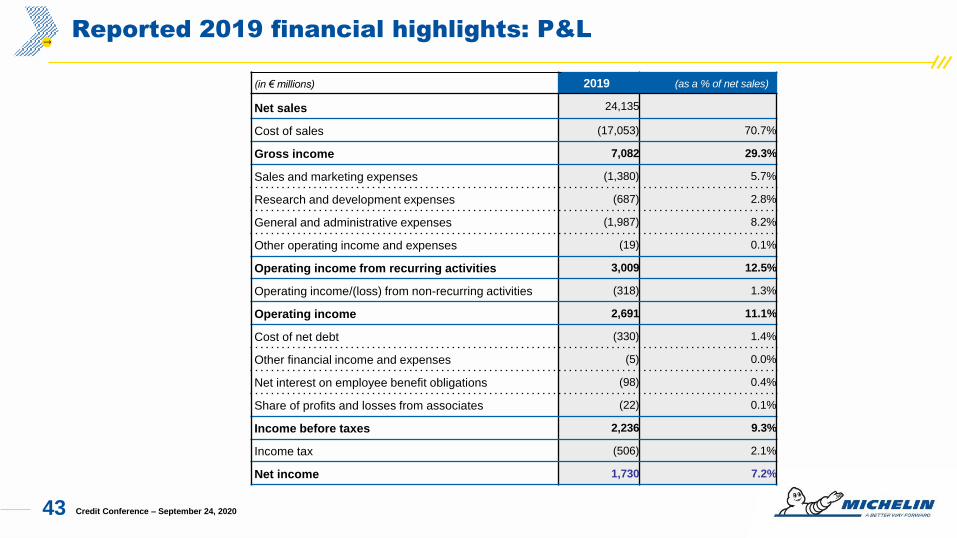
Reported 2019 financial highlights: P&L
(in € millions) 2019 (as a % of net sales)
Net sales 24,135
Cost of sales (17,053) 70.7%
Gross income 7,082 29.3%
Sales and marketing expenses (1,380) 5.7%
Research and development expenses (687) 2.8%
General and administrative expenses (1,987) 8.2%
Other operating income and expenses (19) 0.1%
Operating income from recurring activities 3,009 12.5%
Operating income/(loss) from non-recurring activities (318) 1.3%
Operating income 2,691 11.1%
Cost of net debt (330) 1.4%
Other financial income and expenses (5) 0.0%
Net interest on employee benefit obligations (98) 0.4%
Share of profits and losses from associates (22) 0.1%
Income before taxes 2,236 9.3%
Income tax (506) 2.1%
Net income 1,730 7.2%
43

Credit Conference – September 24, 2020
Reported 2019 financial highlights: Balance Sheet
ASSETS (in € millions) December 31, 2019
Goodwill 2,388
Intangible assets 2,280
Property, plant and equipment 13,169
Non-current financial assets and other
assets796
Investments in associates 1,087
Deferred tax assets 814
Non-current assets 20,534
Inventories 4,694
Trade receivables 3,532
Current financial assets 396
Other current assets 1,055
Cash and cash equivalents 1,466
Current assets 11,143
TOTAL ASSETS 31,677
EQUITY AND LIABILITIES (in € millions) December 31, 2019
Share capital 357
Share premiums 2,789
Reserves 10,080
Non-controlling interests 3
Equity 13,229
Non-current financial liabilities 5,923
Employee benefit obligations 3,873
Provisions and other non-current liabilities 1,104
Deferred tax liabilities 455
Non-current liabilities 11,355
Current financial liabilities 1,158
Trade payables 2,627
Reverse factoring contracts 470
Other current liabilities 2,838
Current liabilities 7,093
TOTAL EQUITY AND LIABILITIES 31,677
44

Credit
Conference
September 24, 2020
Conclusion

2,170 -30237
145304
2014 2015 2016 2017 2018 2019 Fx 15-19 2019
Change in segment operating income 2014 – 2019
(in € millions)
Credit Conference – September 24, 2020
Beyond 2019: Michelin’s strengths and drivers
for more value creation
Resilient margins, underlying strengths and robust drivers
support confidence in sustainable FCF growth
A powerful brand operating in structurally
growing markets
Innovation for better performing, more
environmentally friendly products
Tires becoming more technology rich
Business expansion leveraging our customer
base and our unique expertise
Competitiveness plan deployment
Working capital optimization
717833
961
1,509
1,274
1,615
2014 2015 2016 2017 2018 2019
Structural free cash flow 2014 – 2019
(in € millions)
+€835m excl. forex
179 3,0094
46

CDP
2019
ECOVADIS
2019
ISS-OEKOM
2019
MSCI
2019
VIGEO EIRIS
2018
SUSTAINALYTICS
2018
Status
Rating A- 78/100 B- 7.4/10 68/100 77/100
Ranking /
Distribution of
ratings
Major sustainability rating (As of June 30, 2020)
Credit Conference – September 24, 2020
Michelin’s non-financial ratings: a leading, and recognized player
in sustainable mobility
Top 1%(natural rubber)Climate change
MICHELIN score
MICHELIN score
Water security 8%
21%24%
16%
24%
5%3%
CCC B BB BBB A AA AAA
1er of 31 in the sector 7ème of 54 in the
sector
-Light
manufacturingEurope Global
Average
Light
manufacturingEurope Global
Average
47

Credit
Conference
September 24, 2020
Appendices

● Coming events:
─ October 22, 2020 (after close of trading) : Third-quarter and 9 months 2020 sales
─ February 15, 2021 (after close of trading) : 2020 Annual Results
─ April 8, 2021: Investor Day
Credit Conference – September 24, 2020
Investor Calendar
49

YoY change(in € millions and %)
11,781
9,414 9,357
+51 -2,635
+217 -57
H1-2019sales
H1-2020sales at constantexchange rates
H1-2020sales
Credit Conference – September 24, 2020
H1 2020 sales: as global tire demand collapsed, sales declined
by 20.6%
Organic growth
Volumes
(-22.4%)
Price-mix
(+1.9%
o/w mix +1.6%)
Currency
effect
(-0.5%)
External growth
Changes in scope
of consolidation*
(+0.4%)
* Notably the inclusion of Multistrada and Masternaut and the deconsolidation of BookaTable
50

Credit Conference – September 24, 2020
Q2 2020: despite the fall in volumes caused by the health crisis,
the Group held prices firm and enhanced the mix
YoY change, by quarter (in %)
2.01.4
2.92.4 2.0 1.7 2.0 1.7 2.1
1.40.3
-1.2
-0.5-1.4
-0.6
-2.2
-11.7
-32.5
Volumes Price-mix Currency effect
2019 2020
Q1 Q2 Q3 Q4 Q1 Q2
2019 2020
Q1 Q2 Q3 Q4 Q1 Q2
2019 2020
Q1 Q2 Q3 Q4 Q1 Q2
51

433 -359
1,507
426 517 599 749 717 833 961
1,5091,274
1,615
1,340 1,271
672 1,100
1,711
1,996 1,9801,883
1,804 1,811
1,771 1,6691,801
9.7%
5.6%
5.4%
10.5%
10.9%
12.8% 11.9%11.1%
12.2% 12.1%
13.6% 14.0% 13.7%
0%
2%
4%
6%
8%
10%
12%
14%
16%
-500
0
500
1 000
1 500
2 000
2 500
2007 2008 2009 2010 2011 2012 2013 2014 2015 2016 2017* 2018* 2019*
FCF** CAPEX ROCE after tax (in %)
2007 - 2019 Free Cash Flow, CAPEX & ROCE*
Credit Conference – September 24, 2020
2007 – 2019 : Group capacity to protect and improve its Free
Cash Flow generation
* With standard taxe rate at 28% for 2017 and 26% for 2018 & 2019 and excluding goodwill, acquired intangibles, associates and joint ventures for 2017, 2018 & 2019
** Reported FCF from 2007 to 2010, Structural FCF from 2011 onwards.
52

Credit Conference – September 24, 2020
Michelin’s OE position is unique
GENERALISTSLUXURY PREMIUMSPORT PASSIONNEW ENTRANTS
(OEM & Mobility)
OEM
BRANDS
(examples)
Who are they WW players
mass-market oriented
Premium brand focus
on consumer experience
Extreme emotions &
passionate drivers
New OEMs &
new offers of mobility
Michelin
positionAmongst the Top 3
Overall & WW presenceAmongst the Top 3 Leader
Leadership Position amongst non Chinese
Market weight(Volumes of tires)
65%
=
13%
> in € and image
2%
> in € and image
20%
< in €
Main
competitors
Bridgestone, Goodyear,
Continental,
Dunlop, Hankook
Continental
PirelliPirelli All
… with the overall objective of achieving
● a benchmark position in each segment & each geography
● sales growth at least in line with the market
● profitability on a par with the best auto suppliers53

Credit Conference – September 24, 2020
The new challenges facing road transportation: opportunities to
showcase the value added of Michelin solutions
Reducing CO2 emissions
Vecto UE 2020 standard for new vehiclesCut CO2 emissions by 15% by 2025
Cut CO2 emissions by 30% by 2030
Circular economy
Preference for retreaded or
retreadable tires in government
contracts (French legislation)
Shortage of drivers and
rising wages
Optimizing asset
use
Tires offering the lowest TCO over time
Innovative solutions to improve the productivity and
environmental footprint of trucking companies
Products with low environmental impact to support truckers in
transitioning to zero-emission operation
Focus on fuel
efficiency
Greenhouse Gas Protocol applied to
company upstream/downstream
operations
54
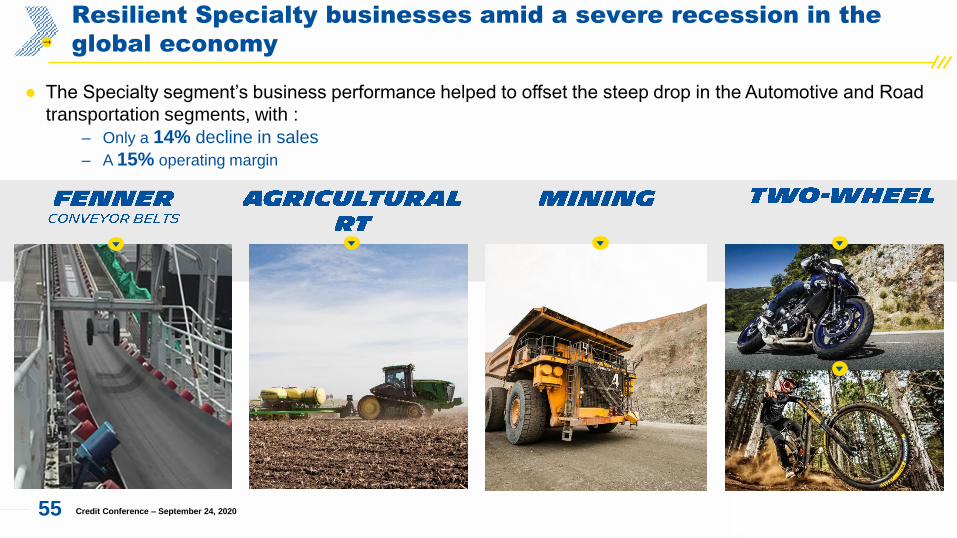
Resilient Specialty businesses amid a severe recession in the
global economy
Credit Conference – September 24, 2020
● The Specialty segment’s business performance helped to offset the steep drop in the Automotive and Road
transportation segments, with :
‒ Only a 14% decline in sales
‒ A 15% operating margin
55

Credit Conference – September 24, 2020
Partner dealership chains* that showcase the Group’s products
85
221303
1,658
118
2,8182,277
● Partner wholesalers: NTW, Ihle, Meyer Lissendorf
● A vast network of strategic retailers* as of late 2019: ~ 7,500 including Penta in Indonesia following the acquisition of
Multistrada
● Michelin boasts industry-leading global coverage
Penta
South
America
North
America
Africa, India,
Middle East
ASEAN
Russia
& CIS
Europe
*Proprietary or franchised dealers, plus minority stakes in partners
56

Credit Conference – September 24, 2020
Hydrogen mobility is the unique solution to meet the three challenges
simultaneously : pollution, greenhouse gases and energy transition
● storing intermittent energies (wind, solar…)
electricity production surplus, through
electrolysis
● helping decarbonize transportation. Hydrogen
vehicles only reject water
Water electrolysis
Electricity & H2O H2
(zero CO2 emission)
Renewable energy
57

Credit Conference – September 24, 2020
3 questions about fuel cells
+ +
Electric transmission
Stack
Air system
Cooling system
+ transformer and controller
58

The hydrogen mobility, which growth perspectives are significant,
is a solution particularly adapted to the professionnal needs
* Michelin estimate
500 km
257 km
Hydrogen fill-up Range Before approaching passenger car market,
Michelin has decided to target first
professionnal markets as hydrogen is the
most appropriate enegy for heavy and long
distance transportation
● A fuel cell car will be able to cover longer
distances and offer constant availabilty
for a lighter, smaller system
● 2030 market *
2million
vehicles
‒ 80% light vehicles (passenger cars and light trucks)
‒ 20% trucks and buses
Credit Conference – September 24, 2020
500 km
90 km
X2-X33min
59

Credit Conference – September 24, 2020
What are Tire and Road Wear Particles (TRWPs) ?
● TRWPs are tiny debris produced by the friction between tires and the road; this
friction is what ensures grip and safety on the road
● The particles are a mixture of rubber and road surface minerals
● They have specific characteristics and behaviors ‒ High density: 1.8
‒ Big diameter: average size 100 mm
‒ High degradability rate
● Scientific studies conducted to date at the request of TIP and ETRMA have shown
that 2% to 5% of TRWPs reach estuaries and that around 1% of PM10 and PM2.5
present in the air would be from TRWPs
60

Credit Conference – September 24, 2020
The Group is strongly engaged on the topic of TRWP
The Michelin Group has a dual commitment to reducing abrasion:
● Individually, by reducing the abrasion of its own products
‒ by leveraging its materials expertise and a design culture/strategy focused on
optimizing the use of raw materials and reducing their quantities (less wear, less
raw materials) ;
‒ by already working to define an ambitious target for reducing TRWP emissions from
its tires in the coming years.
● Collectively, by collaborating with industry and public authority stakeholders to help
introduce maximum abrasion limits and support deeper scientific understanding of
TRWPs.
61

Credit Conference – September 24, 2020
RAW MATERIALS
Michelin is responsibly developing its natural rubber
supply and other sustainable materials.
USE OF PRODUCTS
AND SERVICES
REPRESENTS 63 % to 96% OF THE
LIFE CYCLE IMPACT*
Michelin’s innovations mean longer distances and higher
performance with fewer materials and a smaller carbon
footprint. Our services and solutions optimize tire use.*depending on type of vehicle and environmental impact category
LOGISTICS
Michelin leverages a variety of solutions
to reduce its carbon footprint for
transporting semi-finished and finished
products
ENERGY
RECOVERY
MATERIALS
RECYCLINGLehigh Technologies, a Michelin company,
produces high-performance materials from end-of-
life tires and other post-industrial rubber.
MANUFACTURINGMichelin strives to continuously reduce the
environmental impact of manufacturing
through its environmental management
system and performance targets.
END OF LIFEMichelin actively supports resource
recovery and recycling systems for end-
of-life tires with its stakeholders and
industry partners around the world.
Life cycle impact: taking action throughout the life cycle of our
products
62
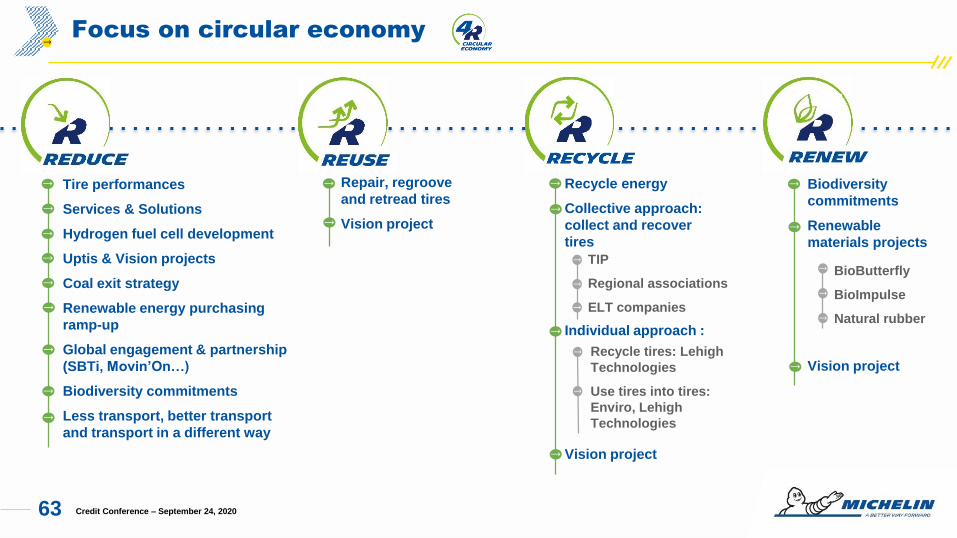
Biodiversity
commitments
Renewable
materials projects
Vision project
Credit Conference – September 24, 2020
Focus on circular economy
Tire performances
Services & Solutions
Hydrogen fuel cell development
Uptis & Vision projects
Coal exit strategy
Renewable energy purchasing
ramp-up
Global engagement & partnership
(SBTi, Movin’On…)
Biodiversity commitments
Less transport, better transport
and transport in a different way
BioButterfly
BioImpulse
Natural rubber
Recycle energy
Collective approach:
collect and recover
tires
Individual approach :
Vision project
TIP
Regional associations
ELT companies
Recycle tires: Lehigh
Technologies
Use tires into tires:
Enviro, Lehigh
Technologies
Repair, regroove
and retread tires
Vision project
63

Net impact of changes in the price-mix and raw material prices(in € millions)
Credit Conference – September 24, 2020
Proven ability to improve unit margin in a highly competitive
market environment
+264
+1,133
+103 +118
-93
+159
-70
+286+324
2011 2012 2013 2014 2015 2016 2017 2018 2019
64

Credit Conference – September 24, 2020
Sales by currency and SOI impact
*actual dropthrough linked to the export/manufacturing/sales base
% of sales(June 30th LTM)
2020 H1
€ change vs.
currency
Dropthrough
sales / ROS*
USD 37% -2% 40% / 50%
EUR 31% - -
CNY 6% 1% 25% / 30%
AUD 3% 5% 80% / 85%
GBP 3% 0% 25% / 30%
BRL 3% 23% -30% / -20%
CAD 3% 0% 25% / 30%
RUB 2% 3% 25% / 30%
JPY 1% -4% 80% / 85%
% of sales (June 30th LTM)
2020 H1
€ change vs.
currency
Dropthrough
sales / ROS*
CLP 1% 17% 80% / 85%
MXN 1% 9% 25% / 30%
THB 1% -3% -130% / -100%
TRY 1% 12% 80% / 85%
SEK 1% 1% 80% / 85%
TWD 0.6% -6% 80% / 85%
ZAR 0.4% 13% 80% / 85%
ARS 0.4% 52% 80% / 85%
COP 0.2% 12% 80% / 85%
Others 4.4% - -
65

0
50
100
150
200
250
300
100
150
200
250
300
0
20
40
60
80
100
2015 2016 20182017 2019 2020 2015 2016 20182017 2019 2020
Raw material purchases in H1 2020 (€1.8bn)
2015 2016 20182017 2019 2020
Credit Conference – September 24, 2020
Raw materials
25 %
Natural
rubber
24 %
Synthetic
rubber
19 %
Filer
14 %
Chemicals
11 %
Steel cord
7 %
Textiles
€/$ exchange rate:
Average H1 2019 : 1.130
Average H1 2020 : 1.102
-2.5 %
in USD/kg
indexed
Synthetic rubber
Manufacturing BLS
RSS3
TSR20
Brent, in USD
66

Credit Conference – September 24, 2020
Source : SICOM.
Natural Rubber price trend
At end of June 2020 (per kg, base 100 in Q3’17)
TSR20 in $ RSS3 in $ Quarterly average TSR20 in $ & quarterly evolution in %
1.5
-
1.4
-7 %
40
60
80
100
120
140
Q3'17 Q4'17 Q1'18 Q2'18 Q3'18 Q4'18 Q1'19 Q2'19 Q3'19 Q4'19 Q1'20 Q2'20
1.3
-5 %
1.3
-5 %
1.4
+10 %
1.5
+8 %
1.4
-4 %
1.5
+2 %
1.3
-11 %
1.4
+2 %
1.3
-2 %
1.1
-17 %
67

Credit Conference – September 24, 2020
Brent price trend
At end of June 2020 (per barrel, base 100 au Q3’17)
Brent in $ Quarterly average Brent in $ & quarterly change in %
30
50
70
90
110
130
150
170
Q3'17 Q4'17 Q1'18 Q2'18 Q3'18 Q4'18 Q1'19 Q2'19 Q3'19 Q4'19 Q1'20 Q2'20
64
-6 %
52
-
61
+18 %
67
+9 %
75
+11 %
76
+1 %
68
-10 %
68
+7 %
62
-9 %
63
+1 %
51
-18 %
33
-35 %
68

Credit Conference – September 24, 2020
Butadiene price trend
At end of June 2020 (per ton, base 100 in Q3’17)
Butadiene Europe Quarterly average Butadiene in € & quarterly change in %
0
20
40
60
80
100
120
140
160
Q3'17 Q4'17 Q1'18 Q2'18 Q3'18 Q4'18 Q1'19 Q2'19 Q3'19 Q4'19 Q1'20 Q2'20
808
+1 %
1,037
+28 %
392
-46 %
783
-
800
+2 %
1,142
+10 %
1,058
-7 %
865
-18 %
900
+4 %
790
-12 %
740
-6 %
727
-2 %
69

Credit Conference – September 24, 2020
Disclaimer
"This presentation is not an offer to purchase or a solicitation to recommend the purchase
of Michelin shares. To obtain more detailed information on Michelin, please consult the
documents filed in France with Autorité des marchés financiers, which are also available
from the http://www.michelin.com/eng/ website.
This presentation may contain a number of forward-looking statements. Although the
Company believes that these statements are based on reasonable assumptions as at the
time of publishing this document, they are by nature subject to risks and contingencies
liable to translate into a difference between actual data and the forecasts made or inferred
by these statements."
70

Credit Conference – September 24, 2020
Contacts
Edouard de PEUFEILHOUX
Humbert de FEYDEAU
Pierre HASSAÏRI
+33 (0)4 63 21 56 90
27, cours de l’île Seguin
92100 Boulogne-Billancourt – France
23, place des Carmes Dechaux
63040 Clermont-Ferrand Cedex 9
71


