NATL INST. OF STAND 8, TECH NIST AlllDt flfl7bfifl PUBLICATIONS NIST Special Publication 500-261 Information Technolosv: The Thirteenth Text REtrieval Conference, TREC 2004 Ellen M. Voorhees and Lori P. Buckland Editors Nisr I ^ ^ National Institute of Standards and Technology \jlJ^^ Technology Administration, U.S. Department of Commerce
Transcript
NATL INST. OF STAND 8, TECH
NIST
AlllDt flfl7bfifl PUBLICATIONS
NIST Special Publication 500-261
Information Technolosv:
The Thirteenth Text REtrieval Conference,
TREC 2004
Ellen M. Voorhees
and
Lori P. Buckland
Editors
NisrI ^ ^ National Institute of Standards and Technology
\jlJ^^ Technology Administration, U.S. Department of Commerce
Jhe National Institute of Standards and Technology was established in 1988 by Congress to "assist industry
in the development of technology ... needed to improve product quality, to modernize manufacturing
processes, to ensure product reliability ... and to facilitate rapid commercialization ... of products based on newscientific discoveries."
NIST, originally founded as the National Bureau of Standards in 1901, works to strengthen U.S. industry's
competitiveness; advance science and engineering; and improve public health, safety, and the environment. Oneof the agency's basic functions is to develop, maintain, and retain custody of the national standards of
measurement, and provide the means and methods for comparing standards used in science, engineering,
manufacturing, commerce, industry, and education with the standards adopted or recognized by the Federal
Government.
As an agency of the U.S. Commerce Department's Technology Administration, NIST conducts basic and
applied research in the physical sciences and engineering, and develops measurement techniques, test methods,
standards, and related services. The Institute does generic and precompetitive work on new and advanced
technologies. NIST's research facilities are located at Gaithersburg, MD 20899, and at Boulder, CO 80303. Major
technical operating units and their principal activities are listed below. For more information visit the NISTWebsite at http://www.nist.gov, or contact the Publications and Program Inquiries Desk, 301-975-3058.
Office of the Director• National Quality Program• Intemational and Academic Affairs
Technology Services• Standards Services
• Technology Partnerships
• Measurement Services
• Information Services
• Weights and Measures
Advanced Technology Program• Economic Assessment
• Information Technology and Applications
• Chemistry and Life Sciences
• Electronics and Photonics Technology
Manufacturing Extension PartnershipProgram• Regional Programs• National Programs• Program Development
Electronics and Electrical EngineeringLaboratory• Microelectronics
• Law Enforcement Standards
• Electricity
• Semiconductor Electronics
• Radio-Frequency Teclmology'
• Electromagnetic Teclmology'
• Optoelectronics'
• Magnetic Teclmology'
Materials Science and EngineeringLaboratory• Intelligent Processing of Materials• Ceramics
• Materials Reliability!
• Polymers• Metallurgy
• NIST Center for Neutron Research
Chemical Science and TechnologyLaboratory• Biotechnology
• Process Measurements• Surface and Microanalysis Science
This report constitutes the proceedings of the 2004 edition of the Text REtrieval Conference,
TREC 2004, held in Gaithersburg, Maryland, November 16-19, 2004. The conference was co-
sponsored by the National Institute of Standards and Technology (NIST), the Advanced Research
and Development Activity (ARDA), and the Defense Advanced Research Projects Agency (DARPA)
Approximately 200 people attended the conference, including representatives from 21 different
countries. The conference was the thirteenth in an on-going series of workshops to evaluate new
technologies for text retrieval and related information-seeking tasks.
The workshop included plenary sessions, discussion groups, a poster session, and demonstrations.
Because the participants in the workshop drew on their personal experiences, they sometimes cite
specific vendors and commercial products. The inclusion or omission of a particular company
or product implies neither endorsement nor criticism by NIST. Any opinions, findings, and con-
clusions or recommendations expressed in the individual papers are the authors' own and do not
necessarily reflect those of the sponsors.
The sponsorship of the U.S. Department of Defense is gratefully acknowledged, as is the tremen-
dous work of the program committee and the track coordinators.
Ellen Voorhees
August 2, 2005
TREC 2004 Program Committee
Ellen Voorhees, NIST, chair
James Allan, University of Massachusetts at Amherst
Chris Buckley, Sabir Research, Inc.
Gordon Cormack, University of Waterloo
Susan Dumais, Microsoft
Donna Harman, NIST
David Hawking, CSIROBill Hersh, Oregon Health & Science University
David Lewis, Omarose Inc.
John Prager, IBMJohn Prange, U.S. Department of Defense
Steve Robertson, Microsoft
Mark Sanderson, University of Sheffield
Karen Sparck Jones, University of Cambridge, UKRoss Wilkinson, CSIRO
111
I
I
I
TREC 2004 Proceedings
Foreword iii
Listing of contents of Appendix xiv
Listing of papers, alphabetical by organization xv
Listing of papers, organized by track xxiv
Abstract xxxvi
Overview Papers
Overview ofTREC 2004 1
E.M. Voorhees, National Institute of Standards and Technology (NIST)
TREC 2004 Genomics Track Overview 13
W.R. Hersh, R.T. Bhuptiraju, L. Ross, A.M. Cohen, D.F. Kraemer,
Oregon Health & Science University
P. Johnson, Biogen Idee Corporation
HARD Track Overview in TREC 2004 25
High Accuracy Retrieval from Documents
J. Allan, University of Massachusetts Amherst
Overview of the TREC 2004 Novelty Track 36
I.Soboroff, NIST
Overview of the TREC 2004 Question Answering Track 52
E.M. Voorhees, NIST
Overview of the TREC 2004 Robust Track 70
E.M. Voorhees, NIST
Overview of the TREC 2004 Terabyte Track 80
C. Clarke, University of Waterloo
N. Craswell, Microsoft Research
I. Soboroff, National Institute of Standards and Technology
Overview of the TREC 2004 Web Track 89
N. Craswell, MSR Cambridge
D. Hawking, CSIRO
V
Other Papers(contents ofthese papers arefound on the TREC 2004 Proceedings CD)
Phrasal Queries with LingPipe and Lucene: Ad Hoc Genomics Text Retrieval
B. Carpenter, Alias-i, Inc.
Experiments with Web QA System and TREC 2004 Questions
D. Roussinov, Y. Ding, J.A. Robles-Flores, Arizona State University
Categorization of Genomics Text Based on Decision Rules
R. Guillen, California State University San Marcos
Liitial Results with Structured Queries and Language Models on Half a Terabyte of Text
K. Collins-Thompson, P. Ogilvie, J. Callan, Carnegie Mellon University
Experiments in TREC 2004 Novelty Track at CAS-ICTH.-P. Zhang, H.-B. Xu, S. Bai, B. Wang, X.-Q. Cheng, Chinese Academy of Sciences
TREC 2004 Web Track Experiments at CAS-ICTZ. Zhou, Y. Guo, B. Wang, X. Cheng, H. Xu, G. Zhang, Chinese Academy of Sciences
NLPR at TREC 2004: Robust Experiments
J. Xu, J. Zhao, B. Xu, Chinese Academy of Science
ISCAS at TREC 2004: HARD Track
L. Sun, J. Zhang, Y. Sun, Chinese Academy of Sciences
TREC 2004 HARD Track Experiments in Clustering
D.A. Evans, J. Bennett, J. Montgomery, V. Sheftel, D.A. Hull, J.G. Shanahan,
Clairvoyance Corporation
Evolving XML and Dictionary Strategies for Question Answering and Novelty Tasks
K.C. Litkowski, CL Research
Columbia University in the Novelty Track at TREC 2004
B. Schiffman, K.R. McKeown, Columbia University
Concept Extraction and Synonymy Management for Biomedical Information Retrieval
C. Crangle, A. Zbyslaw, ConverSpeech LLCM. Cherry, E. Hong, Stanford University
DalTREC 2004: Question Answering Using Regular Expression Rewriting
V. Keselj, A. Cox, Dalhousie University, Halifax
VI
Experiments in Terabyte Searching, Genomic Retrieval and Novelty Detection for TREC 2004
S. Blott, F. Camous, P. Ferguson, G. Gaughan, C. Gurrin, J.G.F. Jones, N. Murphy,
N. O'Connor, A.F. Smeaton, P. Wilkins, Dublin City University
O. Boydell, B. Smyth, University College Dublin
Amberfish at the TREC 2004 Terabyte Track
N. Nassar, Etymon Systems
Fondazione Ugo Bordoni at TREC 2004
G. Amati, C. Carpineto, G. Romano, Fondazione Ugo Bordoni
FDUQA on TREC 2004 QA Track
L. Wu, X. Huang, L. You, Z. Zhang, X. Li, Y. Zhou, Fudan University
The GUC Goes to TREC 2004: Using Whole or Partial Documents for Retrieval and
Classification in the Genomics Track
K. Darwish, A. Madkour, The German University in Cairo
The Hong Kong Polytechnic University at the TREC 2004 Robust Track
D.Y. Wang, R.W.P. Luk, The Hong Kong Polytechnic University
K.F. Wong, The Chinese University ofHong Kong
Robust, Web and Terabyte Retrieval with Hummingbird SearchServer at TREC 2004
S. Tomlinson, Hummingbird
Juru at TREC 2004: Experiments with Prediction of Query Difficulty
E. Yom-Tov, S. Fine, D. Carmel, A. Darlow, E. Amitay, IBM Haifa Research Labs
IBM's PIQUANT II in TREC 2004
J. Chu-CarroU, K. Czuba, J. Prager, A. Ittycheriah, IBM T.J. Watson Research Center
S. Blair-Goldensohn, Columbia University
A Hidden Markov Model for the TREC Novelty Task
J.M. Conroy, IDA/CCS
IIT at TREC 2004 Standard Retrieval Models Over Partitioned Indices for the Terabyte Track
J. Heard, O. Frieder, D. Grossman, Illinois Institute of Technology
WIDIT in TREC 2004 Genomics, Hard, Robust and Web Tracks
K. Yang, N. Yu, A. Wead, G. La Rowe, Y.-H. Li, C. Friend, Y. Lee, Indiana University
TREC 2004 Genomics Track Experiments at KJBK. Seki, J.C. Costello, V.R. Singan, J. Mostafa, Indiana University Bloomington
Vll
TREC Novelty Track at IRIT-SIG
T. Dkaki, Institut de Recherche en hiformatique de Toulouse (IRIT) and
Universite Toulouse le Mirail
J. Mothe, Listitut de Recherche en Informatique de Toulouse (IRIT) and
Institut Universitaire de Formation des Maitres Midi-Pyrenees
Combining Linguistic Processing and Web Mining for Question Answering: ITC-irst at
TREC 2004
H. Tanev, M. Kouylekov, B. Magnini, ITC-irst
JHU/APL at TREC 2004: Robust and Terabyte Tracks
C. Piatko, J. Mayfield, P. McNamee, S. Cost, The Johns Hopkins University Applied Physics
Laboratory
Korea University Question Answering System at TREC 2004
K.-S. Han, H. Chung, S.-B. Kim, Y.-I. Song, J.-Y. Lee, H.-C. Rim, Korea University
Novel Approaches in Text Information Retrieval
Experiments in the Web Track of TREC 2004
M. Farah, D. Vanderpooten, Lamsade, University of Paris Dauphine
LexiClone hic. and NIST TRECI. Geller, LexiClone
AnswerFinder at TREC 2004
D. Molla, M. Gardiner, Macquarie University
Meiji University Web, Novelty and Genomic Track Experiments
T. Tomiyama, K. Karoji, T. Kondo, Y. Kakuta, T. Takagi, Meiji University
Microsoft Research Asia at Web Track and Terabyte Track ofTREC 2004
R. Song, J.-R. Wen, S. Shi, G. Xin, T.-Y. Liu, T. Qin, X. Zheng, J. Zhang, G. Xue, W.-Y. Ma,
Microsoft Research Asia
Microsoft Cambridge at TREC 13: Web and Hard Tracks
H. Zaragoza, N. Craswell, M. Taylor, S. Saria, S. Robertson, Microsoft Research Ltd.
Answering Muhiple Questions on a Topic From Heterogeneous Resources
B. Katz, M. Bilotti, S. Felshin, A. Femandes, W. Hildebrandt, R. Katzir, J. Lin, D. Loreto,
G. Marton, F. Mora, O. Uzuner, MIT Computer Science and Artificial Intelligence Laboratory
Experience of Using SVM for the Triage Task in TREC 2004 Genomics Track
D. Zhang, W.S. Lee, National University of Singapore
viii
Knowledge-Intensive and Statistical Approaches to the Retrieval and Annotation of GenomicsMEDLINE Citations
A.R. Aronson, D. Demmer, S.H. Humphrey, N.C. Ide, W. Kim, R.R. Loane, J.G. Mork,
L.H. Smith, L.K. Tanabe, W.J. Wilbur, N. Xie, National Library of Medicine
D. Demner, University of Maryland, College Park
H. Liu, University of Maryland, Baltimore County
Identifying Relevant Full-Text Articles for GO Annotation Without MeSH Terms
C. Lee, W.-J. Hou, H.-H. Chen, National Taiwan University
Similarity Computation in Novelty Detection and Biomedical Text Categorization
M.-F. Tsai, M.-H. Hus, H.-H. Chen, National Taiwan University
National University of Singapore at the TREC 1 3 Question Answering Main Task
H. Cui, K. Li, R. Sun, T.-S. Chua, M.-Y. Kan, National University of Singapore
Feature Generation, Feature Selection, Classifiers, and Conceptual Drift for Biomedical
Document Triage
A.M. Cohen, R.T. Bhupatiraju, W.R. Hersh, Oregon Health & Science University
Revisiting Again Document Length Hypotheses TREC 2004 Genomics Track
Experiments at Patolis
S. Fujita, Patolis Corporation
Part-of-Speech Sense Matrix Model Experiments in the TREC 2004 Robust Track at ICL, PKUB. Swen, X-Q. Lu, H.-Y. Zan, Q. Su, Z.-G. Lai, K. Xiang, J.-H. Hu, Peking University, Beijing
TREC 2004 Robust Track Experiments Using PIRCSK.L. Kwok, L. Grunfeld, H.L. Sun, P. Deng, Queens College, CUNY
RMIT University at TREC 2004
B. Billerbeck, A. Cannane, A. Chattaraj, N. Lester, W. Webber, H.E. Williams, J. Yiannis,
J. Zobel, RMIT University
The Robert Gordon University's HARD Track Experiments at TREC 2004
D.J. Harper, G. Muresan, B. Liu, I. Koychev, D. Wettschereck, N. Wiratunga,
The Robert Gordon University
Rutgers' HARD Track Experiences at TREC 2004
N.J. Belkin, I. Chaleva, M. Cole, Y.-L. Li, L. Liu, Y.-H. Liu, G. Muresan, C.L. Smith, Y. Sun,
X.-J. Yuan, X.-M. Zhang, Rutgers University
DIMACS at the TREC 2004 Genomics Track
A. Dayanik, D. Fradkin, A. Genkin, P. Kantor, D. Madigan, Rutgers University DIMACSD. D. Lewis, David D. Lewis Consulting
V. Menkov, Aqsaqal Enterprises
ix
Question Answering by Searching Large Corpora With Linguistic Methods
M. Kaisser, T. Becker, Saarland University/DFKI GmbH
SJTU at TREC 2004: Web Track Experiments
Y. Lu, J. Hu, F. Ma, Shanghai Jiaotong University
UB at TREC 1 3 : Genomics Track
M.E. Ruiz, State University ofNew York at Buffalo
M. Srikanth, Language Computer Corporation
R. Srihari, Cedar/Buffalo
Information Needs and Automatic Queries
R.M. Tong, Tarragon Consulting Corporation
MeSH Based Feedback, Concept Recognition and Stacked Classification for Curation Tasks
W. Kraaij, S. Raaijmakers, TNO-TPDM. Weeber, R. Jelier, Erasmus Medical Center
THUIR at TREC 2004: Genomics Track
J.Li, X. Zhang, M. Zhang, X. Zhu, Tsinghua University
Improved Feature Selection and Redundance Computing—
THUIR at TREC 2004 Novelty Track
L. Ru, L. Zhao, M. Zhang, S. Ma, Tsinghua University
THUIR at TREC 2004: QAW. Tan, Q. Chen, S. Ma, Tsinghua University
Using Normal PC to hidex and Retrieval Terabyte Document--THUIR at TREC 2004
Terabyte Track
Y. Jn, W. Qi, M. Zhang, S. Ma, Tsinghua University
Finding "Abstract Fields" ofWeb Pages and Query Specific Retrieval—
THUIR at TREC 2004 Web Track
Y. Liu, C. Wang, M. Zhang, S. Ma, Tsinghua University
Question Answering with QACTIS at TREC 2004
P. Schone, T. Bassi, A. Kulman, U.S. Department of Defense
G. Ciany, Dragon Development Corporation
P. McNamee, J. Mayfield, Johns Hopkins Applied Physics Lab
Towards Grid-Based Information Retrieval
G.B. Newby, University of Alaska Fairbanks
X
Using Wikipedia at the TREC QA Track
D. Ahn, V. Jijkoun, G. Mishne, K. Muller, M. de Rijke, S. Schloback,
University of Amsterdam
Language Models for Searching in Web Corpora
J. Kamps, G. Mishne, M. de Rijke, University of Amsterdam
BioText Team Experiments for the TREC 2004 Genomics Track
P J. Nakov, A.S. Schwartz, E. Stoica, M.A. Hearst, University of CaUfomia Berkeley
University of Chicago at TREC 2004: HARD Track
G.-A. Levow, University of Chicago
TREC Genomics 2004
G. Sinclair, B. Webber, University of Edinburgh
Question Answering with QED and Wee at TREC 2004
K. Ahn, J. Bos, S. Clark, T. Dalmas, J.L. Leidner, M.B. Smilhe, B. Webber,
University of Edinburgh
J.R. Curran, University of Sydney
University of Glasgow at TREC 2004:
Experiments in Web, Robust, and Terabyte Tracks with Terrier
V. Plachouras, B. He, I. Ounis, University of Glasgow
Report on the TREC 2004 Experiment: Genomics Track
P. Ruch, C. Chichester, G. Cohen, F. Ehrler, P. Fabry, J. Marty, H. Muller, A. Geissbuhler,
University Hospital of Geneva
UIC at TREC 2004: Robust Track
S. Liu, C. Sun, C. Yu, University of Illinois at Chicago
UIUC in HARD 2004--Passage Retrieval Using HMMsJ. Jiang, ex. Zhai, University of Illinois at Urbana-Champaign
Novelty, Question Answering and Genomics: The University of Iowa Response
D. Eichmann, Y. Zhang, S. Bradshaw, X. Ying Qiu, L. Zhou, P. Srinivasan, A. Kumar Sehgal,
H. Wong, The University of Iowa
University of Lethbridge's Participation in TREC 2004 QA Track
Y. Chali, S. Dubien, University of Lethbridge
Question Answering Using the DLT System at TREC 2004
R.F.E. Sutchffe, I. Gabbay, K. White, A. O'Gorman, M. Mulcahy, University of Limerick
xi
UMass at TREC 2004: Novelty and HARDN. Abdul-Jaleel, J. Allan, W.B. Croft, F. Diaz, L. Larkey, X. Li, M.D. Smucker, C. Wade,
University of Massachusetts
Indri at TREC 2004: Terabyte Track
D. Metzler, T. Strohman, H. Turtle, W.B. Croft, University of Massachusetts
Improving Passage Retrieval Using hiteractive Elicition and Statistical Modeling
D. He, D. Demner-Fushman, D.W. Oard, University of Maryland College Park
D. Karakow, S. Khudanpur, Johns Hopkins University
Melbourne University 2004: Terabyte and Web Tracks
V.N. Anh, A. Moffat, The University of Melbourne
The University of Michigan in Novelty 2004
G. Erkan, University of Michigan
University ofNorth Carolina's HARD Track Experiments at TREC 2004
D. Kelly, V. Deepak Dollu, X. Fu, University of North Carolina at Chapel Hill
UNT at TREC 2004: Question Answering Combining Multiple Evidences
J. Chen, G. He, Y. Wu, S. Jiang, University of North Texas
Expanding Queries Using Stems and Symbols
M. Bacchin, M. Melucci, University of Padova
From the Texts to the Contexts They Contain: A Chain of Linguistic Treatments
A. Amrani, ESIEA Recherche
J. Aze, T. Heitz, Y. Kodratoff, M. Roche, LRI-Universite Paris-Sud
TALP-QA System at TREC 2004: Structural and Hierarchical Relaxation
Over Semantic Constraints
D. Ferres, S. Kanaan, E. Gonzalez, A. Ageno, H. Rodriguez, M. Surdeanu, J. Turmo,
Universitat Politecnica de Catalunya, TALP Research Center
Using Clustering and Blade Clusters in the Terabyte Task
G. Attardi, A. Esuli, C. Patel, Universita di Pisa, Italy
ISI Novelty Track System for TREC 2004
S.-M. Kim, D. Ravichandran, E. Hovy, University of Southern California, ISI
Sheffield University and the TREC 2004 Genomics Track:
Query Expansion Using Synonymous TermsY. Guo, H. Harkema, R. Gaizauskas, University of Sheffield
xii
The University of Sheffield's TREC 2004 QA Experiments
R. Gaizauskas, M.A. Greenwood, M. Hepple, I. Roberts, H. Saggion, University of Sheffield
TREC 2004 Genomics Track Experiments at UTA:The Effects of Primary Keys, Digram Phrases and Query Expansion on
Retrieval Performance
A. Pirkola, University of Tampere (UTA)
Conceptual Language Models for Context-Aware Text Retrieval
H. Rode, D. Hiemstra, University of Twente
Bangor at TREC 2004: Question Answering Track
T. Clifton, W. Teahan, University of Wales Bangor
Approaches to High Accuracy Retrieval:
Phrase-Based Search Experiments in the HARD Track
O. Vechtomova, University of Waterloo
M. Karamuftuoglu, Bilkent University
Domain-Specific Synonym Expansion and Validation for Biomedical hiformation Retrieval
(MultiText Experiments for TREC 2004)
S. Buttcher, C.L.A. Clarke, G.V. Cormack, University of Waterloo
Exploiting Zone Information, Syntactic Rules, and hiformative Terms in Gene Ontology
Annotation of Biomedical Documents
B. Settles, M. Craven, University of Wisconsin, Madison
Can We Get A Better Retrieval Function From Machine?
W. Fan, W. Xi, E.A. Fox, Virginia Tech
L. Wang, University of Michigan
York University at TREC 2004: HARD and Genomics Tracks
X. Huang, Y.R. Huang, M. Zhong, M. Wen, York University
xiii
Appendix(contents ofthe Appendix arefound on the TREC 2004 Proceedings CD)
Common Evaluation Measures
Genomics adhoc Runs
Genomics adhoc Results
Genomics annhiev Runs
Genomics annhiev Results
Genomics annhi Runs
Genomics annhi Results
Genomics triage Runs
Genomics triage Results
HARD Runs
Hard Results
Novelty Task 1 Runs
Novelty Task 1 Results
Novelty Task 2 Runs
Novelty Task 2 Results
Novelty Task 3 Runs
Novelty Task 3 Results
Novelty Task 4 Runs
Novelty Task 4 Results
Question Answering Runs
Question Answering Results
Robust Runs
Robust Results
Terabyte Runs
Terabyte Results
Web Classification RunsWeb Classification Results
Web Mixed Runs
Web Named-Page Results
xiv
Papers: Alphabetical by Organization(contents ofthesepapers arefound on the TREC 2004 Proceedings CD)
Alias-i, Inc.
Phrasal Queries with LingPipe and Lucene: Ad Hoc Genomics Text Retrieval
Aqsaqal Enterprises
DMACS at the TREC 2004 Genomics Track
Arizona State University
Experiments with Web QA System and TREC 2004 Questions
Bilkent University
Approaches to High Accuracy Retrieval:
Phrase-Based Search Experiments in the HARD Track
Biogen Idee Corporation
TREC 2004 Genomics Track Overview
California State University San MarcosCategorization of Genomics Text Based on Decision Rules
Carnegie Mellon University
Liitial Results with Structured Queries and Language Models on Half a Terabyte of Text
Cedar/Buffalo
UB at TREC 1 3 : Genomics Track
Chinese Academy of Sciences
Experiments in TREC 2004 Novehy Track at CAS-ICT
TREC 2004 Web Track Experiments at CAS-ICT
NLPR at TREC 2004: Robust Experiments
ISCAS at TREC 2004: H.ARD Track
The Chinese University of Hong KongThe Hong Kong Polytechnic University at the TREC 2Q04 Robust Track
Clairvoyance Corporation
TREC 2004 HARD Track Experiments in Clustering
CL Research
Evolving XML and Dictionary Strategies for Question Answering and Novelty Tasks
XV
Columbia University
Columbia University in the Novelty Track at TREC 2004
IBM's PIQUANT II in TREC 2004
ConverSpeech LLCConcept Extraction and Synonymy Management for Biomedical Information Retrieval
CSIROOverview of the TREC 2004 Web Track
Dalhousie University, Halifax
DalTREC 2004: Question Answering Using Regular Expression Rewriting
David D. Lewis Consulting
DIMACS at the TREC 2004 Genomics Track
Dragon Development Corporation
Question Answering with QACTIS at TREC 2004
Dublin City University
Experiments in Terabyte Searching, Genomic Retrieval and Novelty Detection for TREC 2004
Erasmus Medical Center
MeSH Based Feedback, Concept Recognition and Stacked Classification for Curation Tasks
ESIEA Recherche
From the Texts to the Contexts They Contain: A Chain of Linguistic Treatments
Etymon Systems
Amberfish at the TREC 2004 Terabyte Track
Fondazione Ugo Bordoni
Fondazione Ugo Bordoni at TREC 2004
Fudan University
FDUQA on TREC 2004 QA Track
The German University in Cairo
The GUC Goes to TREC 2004: Using Whole or Partial Documents for Retrieval and
Classification in the Genomics Track
The Hong Kong Polytechnic University
The Hong Kong Polytechnic University at the TREC 2004 Robust Track
xvi
HummingbirdRobust, Web and Terabyte Retrieval with Hummingbird SearchServer at TREC 2004
IBM Haifa Research Labs
Juru at TREC 2004: Experiments with Prediction of Query Difficulty
IBM T.J. Watson Research Center
IBM's PIQUANT II in TREC 2004
IDA/CCSA Hidden Markov Model for the TREC Novelty Task
Illinois Institute of Technology
IIT at TREC 2004 Standard Retrieval Models Over Partitioned Indices for the Terabyte Track
Indiana University
WIDIT in TREC 2004 Genomics, Hard, Robust and Web Tracks
TREC 2004 Genomics Track Experiments at lUB
Institut Universitaire de Formation des Maitres Midi-Pyrenees
TREC Novelty Track at IRIT-SIG
Institut de Recherche en Informatique de Toulouse (IRIX)
TREC Novelty Track at IRIT-SIG
ITC-irst
Combining Linguistic Processing and Web Mining for Question Answering: ITC-irst at TREC2004
Johns Hopkins University
JHU/APL at TREC 2004:
Robust and Terabyte Tracks
Question Answering with QACTIS at TREC 2004
Improving Passage Retrieval Using Interactive Elicition and Statistical Modeling
Korea University
Korea University Question Answering System at TREC 2004
Lamsade, University of Paris Dauphine
Novel Approaches in Text Information Retrieval
Experiments in the Web Track ofTREC 2004
xvii
LexiClone
LexiClone Inc. and NIST TREC
Language Computer Corporation
UB at TREC 13: Genomics Track
Macquarie University
AnswerFinder at TREC 2004
Meiji University
Meiji University Web, Novelty and Genomic Track Experiments
Microsoft Research
Overview of the TREC 2004 Terabyte Track
Microsoft Research Asia
Microsoft Research Asia at Web Track and Terabyte Track ofTREC 2004
Microsoft Research Ltd
Microsoft Cambridge at TREC 13: Web and Hard Tracks
MIT Computer Science and ArtiHcial Intelligence Laboratory
Answering Multiple Questions on a Topic From Heterogeneous Resources
MSR CambridgeTREC 2004 Web Track Experiments at CAS-ICT
National Library of Medicine
Knowledge-Intensive and Statistical Approaches to the Retrieval and Annotation of Genomics
MEDLINE Citations
National University of Singapore
Experience ofUsing SVM for the Triage Task in TREC 2004 Genomics Track
National University of Singapore at the TREC 1 3 Question Answering Main Task
National Taiwan University
Identifying Relevant Full-Text Articles for GO Annotation Without MeSH Terms
Similarity Computation in Novelty Detection and Biomedical Text Categorization
National Institute of Standards and TechnologyOverview of the TREC 2004 Question Answering Track
Overview of the TREC 2004 Robust Track
xviii
Overview of the TREC 2004 Terabyte Track
Oregon Health & Science University
TREC 2004 Genomics Track Overview
Feature Generation, Feature Selection, Classifiers, and Conceptual Drift for Biomedical
Document Triage
Patolis Corporation
Revisiting Again Document Length Hypotheses TREC 2004 Genomics Track Experiments at
Patolis
Peking University, Beijing
Part-of-Speech Sense Matrix Model Experiments in the TREC 2004 Robust Track at ICL, PKU
Queens College, CUNYTREC 2004 Robust Track Experiments Using PIRCS
RMIT University
RMIT University at TREC 2004
The Robert Gordon University
The Robert Gordon University's HARD Track Experiments at TREC 2004
Rutgers University
Rutgers' HARD Track Experiences at TREC 2004
DIMACS at the TREC 2004 Genomics Track,
Saarland University/DFKI GmbHQuestion Answering by Searching Large Corpora With Linguistic Methods
Shanghai Jiaotong University
SJTU at TREC 2004: Web Track Experiments
Stanford University
Concept Extraction and Synonymy Management for Biomedical Information Retrieval
State University of New York at Buffalo
UB at TREC 13: Genomics Track
Tarragon Consulting Corporation
Information Needs and Automatic Queries
TNO-TPDMeSH Based Feedback, Concept Recognition and Stacked Classification for Curation Tasks
xix
Tsinghua University
THUIR at TREC 2004: Genomics Track
Improved Feature Selection and Redundance Computing—
THUIR at TREC 2004 Novelty Track
THUIR at TREC 2004: QA
Using Normal PC to Index and Retrieval Terabyte Document-THUIR at TREC 2004 Terabyte
Track
Finding "Abstract Fields" ofWeb Pages and Query Specific Retrieval—
THUIR at TREC 2004 Web Track
University of Alaska Fairbanks
Towards Grid-Based Information Retrieval
University of AmsterdamUsing Wikipedia at the TREC QA Track
Language Models for Searching in Web Corpora
University of California Berkeley
BioText Team Experiments for the TREC 2004 Genomics Track
University of Chicago
University of Chicago at TREC 2004: HARD Track
University College Dublin
Experiments in Terabyte Searching, Genomic Retrieval and Novelty Detection for TREC 2004
University of Edinburgh
TREC Genomics 2004
Question Answering with QED and Wee at TREC 2004
University of Glasgow
University of Glasgow at TREC 2004:
Experiments in Web, Robust, and Terabyte Tracks with Terrier
University Hospital of GenevaReport on the TREC 2004 Experiment: Genomics Track
XX
University of Illinois at Chicago
UIC at TREC 2004: Robust Track
University of Illinois at Urbana-ChampaignUIUC in HARD 2004-Passage Retrieval Using HMMs
The University of Iowa
Novelty, Question Answering and Genomics: The University of Iowa Response
University of Lethbridge
University of Lethbridge's Participation in TREC 2004 QA Track
University of Limerick
Question Answering Using the DLT System at TREC 2004
University of Maryland, Baltimore CountyKnowledge-Intensive and Statistical Approaches to the Retrieval and Annotation of Genomics
MEDLINE Citations
University of Maryland College Park
Knowledge-Intensive and Statistical Approaches to the Retrieval and Annotation of Genomics
MEDLINE Citations
Improving Passage Retrieval Using Interactive Elicition and Statistical Modeling
University of Massachusetts
UMass at TREC 2004: Novelty and HARD
Lidri at TREC 2004: Terabyte Track
University of Massachusetts, AmherstHARD Track Overview in TREC 2004
High Accuracy Retrieval from Documents
The University of Melbourne
Melbourne University 2004: Terabyte and Web Tracks
University of Michigan
The University of Michigan in Novelty 2004
Can We Get A Better Retrieval Function From Machine?
University of North Carolina at Chapel Hill
University ofNorth Carolina's HARD Track Experiments at TREC 2004
xxi
University of North Texas
UNT at TREC 2004: Question Answering Combining Multiple Evidences
University of PadovaExpanding Queries Using Stems and Symbols
University of Paris Dauphine
Novel Approaches in Text Information Retrieval
Experiments in the Web Track of TREC 2004
LRI-Universite Paris-Sud
From the Texts to the Contexts They Contain: A Chain of Linguistic Treatments
Universitat Politecnica de Catalunya, TALP Research Center
TALP-QA System at TREC 2004: Structural and Hierarchical Relaxation Over Semantic
Constraints
Universita di Pisa, Italy
Using Clustering and Blade Clusters in the Terabyte Task
University of Southern California, ISI
ISI Novelty Track System for TREC 2004
University of Sheffleld
Sheffield University and the TREC 2004 Genomics Track:
Query Expansion Using Synonymous Terms
The University of Sheffield's TREC 2004 QA Experiments
University of SydneyQuestion Answering with QED and Wee at TREC 2004
University of Tampere (UTA)TREC 2004 Genomics Track Experiments at UTA:The Effects of Primary Keys, Bigram Phrases and Query Expansion on
Retrieval Performance
Universite Toulouse le Mirail
TREC Novelty Track at IRIT-SIG
University of TwenteConceptual Language Models for Context-Aware Text Retrieval
University of Wales BangorBangor at TREC 2004: Question Answering Track
xxii
University of Waterloo
Overview of the TREC 2004 Terabyte Track
Approaches to High Accuracy Retrieval:
Phrase-Based Search Experiments in the HARD Track
Domain-Specific Synonym Expansion and Vahdation for Biomedical Information Retrieval
(MultiText Experiments for TREC 2004)
University of Wisconsin, Madison
Exploiting Zone Information, Syntactic Rules, and Liformative Terms in Gene Ontology
Annotation of Biomedical Documents
U.S. Department of Defense
Question Answering with QACTIS at TREC 2004
Virginia Tech
Can We Get A Better Retrieval Function From Machine?
York University
York University at TREC 2004: HARD and Genomics Tracks
xxni
Papers: Organized by Track(contents ofthese papers arefound on the TREC 2004 Proceedings CD)
Genomics
Alias-i, Inc.
Phrasal Queries with LingPipe and Lucene: Ad Hoc Genomics Text Retrieval
Aqsaqal Enterprises
DIMACS at the TREC 2004 Genomics Track
Biogen Idee Corporation
TREC 2004 Genomics Track Overview
California State University San MarcosCategorization of Genomics Text Based on Decision Rules
Cedar/Buffalo
UB at TREC 13: Genomics Track
ConverSpeech LLCConcept Extraction and Synonymy Management for Biomedical Information Retrieval
David D. Lewis Consulting
DIMACS at the TREC 2004 Genomics Track
Dublin City University
Experiments in Terabyte Searching, Genomic Retrieval and Novelty Detection for TREC 2004
Erasmus Medical Center
MeSH Based Feedback, Concept Recognition and Stacked Classification for Curation Tasks
The German University in Cairo
The GUC Goes to TREC 2004: Using Whole or Partial Documents for Retrieval and
Classification in the Genomics Track
Indiana University
WIDIT in TREC 2004 Genomics, Hard, Robust and Web Tracks
Indiana University Bloomington
TREC 2004 Genomics Track Experiments at lUB
Language Computer Corporation
UB at TREC 13: Genomics Track
xxiv
Meiji University
Meiji University Web, Novelty and Genomic Track Experiments
National Library of Medicine
Knowledge-Intensive and Statistical Approaches to the Retrieval and Annotation of Genomics
MEDLINE Citations
National Taiwan University
Identifying Relevant Full-Text Articles for GO Annotation Without MeSH Terms
National University of Singapore
Experience ofUsing SVM for the Triage Task in TREC 2004 Genomics Track
Oregon Health & Science University
TREC 2004 Genomics Track Overview
Oregon Health & Science University
Feature Generation, Feature Selection, Classifiers, and Conceptual Drift for Biomedical
Document Triage
Patolis Corporation
Revisiting Again Document Length Hypotheses TREC 2004 Genomics Track Experiments at
Patolis
RMIT University
RMIT University at TREC 2004
Rutgers University DIMACSDIMACS at the TREC 2004 Genomics Track
Stanford University
Concept Extraction and Synonymy Management for Biomedical Information Retrieval
State University of New York at Buffalo
UB at TREC 13: Genomics Track
Tarragon Consulting Corporation
Information Needs and Automatic Queries
TNO-TPDMeSH Based Feedback, Concept Recognition and Stacked Classification for Curation Tasks
Tsinghua University
THUIR at TREC 2004: Genomics Track
XXV
University of California Berkeley
BioText Team Experiments for the TREC 2004 Genomics Track
University College Dublin
Experiments in Terabyte Searching, Genomic Retrieval and Novelty Detection for TREC 2004
University of Edinburgh
TREC Genomics 2004
University Hospital of Geneva
Report on the TREC 2004 Experiment: Genomics Track
The University of IowaNovelty, Question Answering and Genomics: The University of Iowa Response
University of Maryland, Baltimore CountyKnowledge-Intensive and Statistical Approaches to the Retrieval and Annotation of Genomics
MEDLINE Citations
University of Maryland, College ParkKnowledge-Intensive and Statistical Approaches to the Retrieval and Aimotation of Genomics
MEDLINE Citations
University of Padova
Expanding Queries Using Stems and Symbols
University of Sheffield
Sheffield University and the TREC 2004 Genomics Track:
Query Expansion Using Synonymous Terms
University of Tampere (UTA)TREC 2004 Genomics Track Experiments at UTA:The Effects of Primary Keys, Digram Phrases and Query Expansion on
Retrieval Performance
University of Waterloo
Domain-Specific Synonym Expansion and Validation for Biomedical Information Retrieval
(MultiText Experiments for TREC 2004)
University of Wisconsin, MadisonExploiting Zone Information, Syntactic Rules, and Informative Terms in Gene Ontology
Annotation of Biomedical Documents
York University
York University at TREC 2004: HARD and Genomics Tracks
xxvi
HARD
Bilkent University
Approaches to High Accuracy Retrieval:
Phrase-Based Search Experiments in the HARD Track
Chinese Academy of Sciences
ISCAS at TREC 2004: HARD Track
Clairvoyance Corporation
TREC 2004 HARD Track Experiments in Clustering
Indiana University
WIDIT in TREC 2004 Genomics, Hard, Robust and Web Tracks
Johns Hopkins University
hnproving Passage Retrieval Using Interactive Elicition and Statistical Modeling
Microsoft Research Ltd
Microsoft Cambridge at TREC 13: Web and Hard Tracks
The Robert Gordon University
The Robert Gordon University's HARD Track Experiments at TREC 2004
Rutgers University
Rutgers' HARD Track Experiences at TREC 2004
University of Chicago
University of Chicago at TREC 2004: HARD Track
University of Illinois at Urbana-ChampaignUIUC in HARD 2004--Passage Retrieval Using HMMs
University of Massachusetts
UMass at TREC 2004: Novelty and HARD
University of Massachusetts, AmherstHARD Track Overview in TREC 2004
High Accuracy Retrieval from Documents
University of Maryland College Park
Improving Passage Retrieval Using Interactive Elicition and Statistical Modeling
University of North Carolina at Chapel Hill
University of North Carolina's HARD Track Experiments at TREC 2004
xxvii
University of TwenteConceptual Language Models for Context-Aware Text Retrieval
University of Waterloo
Approaches to High Accuracy Retrieval:
Phrase-Based Search Experiments in the HARD Track
York University
York University at TREC 2004: HARD and Genomics Tracks
.
^ ;Novelty
Chinese Academy of Sciences
Experiments in TREC 2004 Novelty Track at CAS-ICT
CL Research
Evolving XML and Dictionary Strategies for Question Answering and Novelty Tasks
Columbia University
Columbia University in the Novelty Track at TREC 2004
Dublin City University
Experiments in Terabyte Searching, Genomic Retrieval and Novelty Detection for TREC 2004
ESIEA Recherche
From the Texts to the Contexts They Contain: A Chain of Linguistic Treatments
IDA/CCSA Hidden Markov Model for the TREC Novelty Task
Institut de Recherche en Informatique de Toulouse (IRIT)
TREC Novelty Track at IRIT-SIG
Institut Universitaire de Formation des Maitres Midi-Pyrenees
TREC Novelty Track at IRIT-SIG
Meiji University
Meiji University Web, Novelty and Genomic Track Experiments
National Institute of Standards and TechnologyOverview of the TREC 2004 Novelty Track
National Taiwan University
Similarity Computation in Novelty Detection and Biomedical Text Categorization
xxviii
Tsinghua University
Improved Feature Selection and Redundance Computing—
THUIR at TREC 2004 Novelty Track
University College Dublin
Experiments in Terabyte Searching, Genomic Retrieval and Novelty Detection for TREC 2004
The University of IowaNovelty, Question Answering and Genomics: The University of Iowa Response
University of Massachusetts
UMass at TREC 2004: Novelty and HARD
University of Michigan
The University of Michigan in Novelty 2004
LRI-Universite Paris-Sud
From the Texts to the Contexts They Contain: A Chain of Linguistic Treatments
University of Southern California, ISI
ISI Novelty Track System for TREC 2004
Universite Toulouse le Mirail
TI(EC Novelty Track at IRIT-SIG
Question Answering
Arizona State University
Experiments with Web QA System and TREC 2004 Questions
CL Research
Evolving XML and Dictionary Strategies for Question Answering and Novelty Tasks
Columbia University
IBM's PIQUANT II in TREC 2004
Dalhousie University, Halifax
DalTREC 2004: Question Answering Using Regular Expression Rewriting
Dragon Development Corporation
Question Answering with QACTIS at TREC 2004
Fudan University
FDUQA on TREC 2004 QA Track
xxix
IBM T.J. Watson Research Center
ffiM's PIQUANT II in TREC 2004
ITC-irst
Combining Linguistic Processing and Web Mining for Question 7\nswering: ITC-irst at TREC2004
Johns Hopkins Applied Physics LabQuestion Answering with QACTIS at TREC 2004
Korea University
Korea University Question Answering System at TREC 2004
LexiClone
LexiClone Inc. and NIST TREC
Macquarie University
AnswerFinder at TREC 2004
MIT Computer Science and Artificial Intelligence Laboratory
Answering Multiple Questions on a Topic From Heterogeneous Resources
National University of Singapore
National University of Singapore at the TREC 13 Question Answering Main Task
National Institute of Standards and Technology
Overview of the TREC 2004 Question Answering Track
Saarland University/DFKI GmbHQuestion Answering by Searching Large Corpora With Linguistic Methods
Tsinghua University
THUIR at TREC 2004: QA
University of AmsterdamUsing Wikipedia at the TREC QA Track
University of EdinburghQuestion Answering with QED and Wee at TREC 2004
The University of IowaNovelty, Question Answering and Genomics: The University of Iowa Response
University of Lethbridge
University of Lethbridge's Participation in TREC 2004 QA Track
XXX
University of Limerick
Question Answering Using the DLT System at TREC 2004
University of North Texas
UNT at TREC 2004: Question Answering Combining Multiple Evidences
Universitat Politecnica de Catalunya, TALP Research Center
TALP-QA System at TREC 2004: Structural and Hierarchical Relaxation Over Semantic
Constraints
University of Sheffield
The University of Sheffield's TREC 2004 QA Experiments
University of Sydney
Question Answering with QED and Wee at TREC 2004
University of Wales BangorBangor at TREC 2004: Question Answering Track
U.S. Department of Defense
Question Answering with QACTIS at TREC 2004
Robust
Chinese Academy of Science
NLPR at TREC 2004: Robust Experiments
The Chinese University of Hong KongThe Hong Kong Polytechnic University at the TREC 2004 Robust Track
Fondazione Ugo Bordoni
Fondazione Ugco Bordoni at TREC 2004
The Hong Kong Polytechnic University
The Hong Kong Polytechnic University at the TREC 2004 Robust Track
HummingbirdRobust, Web and Terabyte Retrieval with Hummingbird SearchServer at TREC 2004
IBM Haifa Research Labs
Juru at TREC 2004: Experiments with Prediction of Query Difficulty
Indiana University
WIDIT in TREC 2004 Genomics, Hard, Robust and Web Tracks
xxxi
The Johns Hopkins University Applied Physics Laboratory
JHU/APL at TREC 2004:
Robust and Terabyte Tracks
National Institute of Standards and Technology
Overview of the TREC 2004 Robust Track
Peking University, Beijing
Part-of-Speech Sense Matrix Model Experiments in the TREC 2004 Robust Track at ICL, PKU
Queens College, CUNYTREC 2004 Robust Track Experiments Using PIRCS
University of Glasgow
University of Glasgow at TREC 2004:
Experiments in Web, Robust, and Terabyte Tracks with Terrier
University of Illinois at Chicago
UIC at TREC 2004: Robust Track
University of Michigan
Can We Get A Better Retrieval Function From Machine?
Virginia Tech
Can We Get A Better Retrieval Function From Machine?
Terabyte
Carnegie Mellon University
hiitial Results with Structured Queries and Language Models on Half a Terabyte of Text
Dublin City University
Experiments in Terabyte Searching, Genomic Retrieval and Novelty Detection for TREC 2004
Etymon Systems
Amberfish at the TREC 2004 Terabyte Track
Hummingbird
Robust, Web and Terabyte Retrieval with Hummingbird SearchServer at TREC 2004
HummingbirdRobust, Web and Terabyte Retrieval with Hummingbird SearchServer at TREC 2004
Illinois Institute of Technology
IIT at TREC 2004 Standard Retrieval Models Over Partitioned Indices for the Terabyte Track
xxxii
The Johns Hopkins University Applied Physics Laboratory
JHU/APL at TREC 2004:
Robust and Terabyte Tracks
Microsoft Research
Overview of the TREC 2004 Terabyte Track
Microsoft Research Asia
Microsoft Research Asia at Web Track and Terabyte Track ofTREC 2004
National Institute of Standards and Technology (NIST)
Overview of the TREC 2004 Terabyte Track
RMIT University
RMIT University at TREC 2004
Tsinghua University
Using Normal PC to hidex and Retrieval Terabyte Document--THUIR at TREC 2004 Terabyte
Track
University of Alaska Fairbanks
Towards Grid-Based Information Retrieval
University College Dublin
Experiments in Terabyte Searching, Genomic Retrieval and Novelty Detection for TREC 2004
University of GlasgowUniversity of Glasgow at TREC 2004:
Experiments in Web, Robust, and Terabyte Tracks with Terrier
University of Massachusetts
Indri at TREC 2004: Terabyte Track
The University of Melbourne
Melbourne University 2004: Terabyte and Web Tracks
Universita di Pisa, Italy
Using Clustering and Blade Clusters in the Terabyte Task
University of Waterloo
Overview of the TREC 2004 Terabyte Track
xxxiii
Web
CSIROOverview of the TREC 2004 Web Track
Chinese Academy of Sciences
TREC 2004 Web Track Experiments at CAS-ICT
HummingbirdRobust, Web and Terabyte Retrieval with Hummingbird SearchServer at TREC 2004
Indiana University
WIDIT in TREC 2004 Genomics, Hard, Robust and Web Tracks
ITC-irst
Combining Linguistic Processing and Web Mining for Question Answering: ITC-irst at TREC2004
LamsadeNovel Approaches in Text Information Retrieval
Experiments in the Web Track of TREC 2004
Meiji University
Meiji University Web, Novelty and Genomic Track Experiments
Microsoft Research Asia
Microsoft Research Asia at Web Track and Terabyte Track ofTREC 2004
Microsoft Research Ltd
Microsoft Cambridge at TREC 13: Web and Hard Tracks
MSR CambridgeTREC 2004 Web Track Experiments at CAS-ICT
Shanghai Jiaotong University
SJTU at TREC 2004: Web Track Experiments
Tsinghua University
Finding "Abstract Fields" ofWeb Pages and Query Specific Retrieval—
THUIR at TREC 2004 Web Track
University of Alaska Fairbanks
Towards Grid-Based Information Retrieval
University of AmsterdamLanguage Models for Searching in Web Corpora
xxxiv
University of Glasgow
University of Glasgow at TREC 2004:
Experiments in Web, Robust, and Terabyte Tracks with Terrier
The University of MelbourneMelbourne University 2004: Terabyte and Web Tracks
University of Paris DauphineNovel Approaches in Text hifomiation Retrieval
Experiments in the Web Track of TREC 2004
XXXV
Abstract
This report constitutes the proceedings of the 2004 edition of the Text REtrieval Conference,
TREC 2004, held in Gaithersburg, Maryland, November 16-19, 2004. The conference was co-
sponsored by the National Institute of Standards and Technology (NIST), the Advanced Research
and Development Activity (ARDA), and the Defense Advanced Research Projects Agency (DARPA)
TREC 2004 had 103 participating groups including participants from 21 different countries.
TREC 2004 is the latest in a series of workshops designed to foster research in text retrieval and re-
lated technologies. This year's conference consisted of seven different tasks: web-based retrieval,
novelty detection, question answering, retrieval in the genomics domain, improving the consis-
tency of retrieval systems across queries, improving retrieval effectiveness by focusing on user
context, and retrieval from terabyte-scale collections.
The conference included paper sessions and discussion groups. The overview papers for the differ-
ent "tracks" and for the conference as a whole are gathered in this bound version of the proceed-
ings. The papers from the individual participants and the evaluation output for the runs submitted
to TREC 2004 are contained on the disk included in the volume. The TREC 2004 proceedings
web site (http: / /tree .nist .gov/pubs .html) also contains the complete proceedings,
including system descriptions that detail the timing and storage requirements of the different runs.
XXXvi
Overview of TREC 2004
Ellen M. Voorhees
National Institute of Standards and Technology
Gaithersburg, MD 20899
1 Introduction
The thirteenth Text REtrieval Conference, TREC 2004, was held at the National Institute of Standards and Technology
(MIST) November 16-19, 2004. The conference was co-sponsored by NIST, the US Department of Defense Advanced
Research and Development Activity (ARDA), and the Defense Advanced Research Projects Agency (DARPA).TREC 2004 is the latest in a series of workshops designed to foster research on technologies for information
retrieval. The workshop series has four goals:
• to encourage retrieval research based on large test collections;
• to increase communication among industry, academia, and government by creating an open forum for the ex-
change of research ideas;
• to speed the transfer of technology from research labs into commercial products by demonstrating substantial
improvements in retrieval methodologies on real-world problems; and
• to increase the availability of appropriate evaluation techniques for use by industry and academia, including
development of new evaluation techniques more applicable to current systems.
TREC 2004 contained seven areas of focus called "tracks". Six of the tracks had run in at least one previous TREC,while the seventh track, the terabyte track, was new in TREC 2004. The retrieval tasks performed in each of the tracks
are summarized in Section 3 below.
Table 2 at the end of this paper lists the 103 groups that participated in TREC 2004. The participating groups come
from 21 different countries and include academic, commercial, and government institutions.
This paper serves as an introduction to the research described in detail in the remainder of the volume. The
next section provides a summary of the retrieval background knowledge that is assumed in the other papers. Section 3
presents a short description of each track—a more complete description of a track can be found in that track's overview
paper in the proceedings. The final section looks toward future TREC conferences.
2 Information Retrieval
Information retrieval is concerned with locating information that will satisfy a user's information need. Traditionally,
the emphasis has been on text retrieval: providing access to natural language texts where the set of documents to
be searched is large and topically diverse. There is increasing interest, however, in finding appropriate information
regardless of the medium that happens to contain that information. Thus "document" can be interpreted as any unit of
information such as a web page or a MEDLINE record.
The prototypical retrieval task is a researcher doing a literature search in a library. In this environment the retrieval
system knows the set of documents to be searched (the library's holdings), but cannot anticipate the particular topic
that will be investigated. We call this an ad hoc retrieval task, reflecting the arbitrary subject of the search and its short
duration. Other examples of ad hoc searches are web surfers using Internet search engines, lawyers performing patent
searches or looking for precedences in case law, and analysts searching archived news reports for particular events. A
1
retrieval system's response to an ad hoc search is generally a list of documents ranked by decreasing similarity to the
query. Most of the retrieval tasks in TREC 2004 are ad hoc tasks.
A known-item search is similar to an ad hoc search but the target of the search is a particular document (or a small
set of documents) that the searcher knovk's to exist in the collection and wants to find again. Once again, the retrieval
system's response is usually a ranked list of documents, and the system is evaluated by the rank at which the target
document is retrieved. The named page finding part of the web track task is a known-item search.
In a categorization task, the system is responsible for assigning a document to one or more categories from among
a given set of categories. The genomics track had several categorization tasks in TREC 2004, and the novelty track
tasks required assigning sentences from within documents to "relevant" and "novel" categories. The web track also
had a variant of a categorization task, though in this case the topics, not the documents, were to be categorized.
Information retrieval has traditionally focused on returning entire documents that contain answers to questions
rather than returning the answers themselves. This emphasis is both a reflection of retrieval systems' heritage as
library reference systems and an acknowledgement of the difficulty of question answering. However, for certain types
of questions, users would much prefer the system to answer the question than be forced to wade through a list of
documents looking for the sp)ecific answer. To encourage research on systems that return answers instead of document
lists, TREC has had a question answering track since 1999.
2.1 Test collections
Text retrieval has a long history of using retrieval experiments on test collections to advance the state of the art [3, 6, 9],
and TREC continues this tradition. A test collection is an abstraction of an operational retrieval environment that
provides a means for researchers to explore the relative benefits of different retrieval strategies in a laboratory setting.
Test collections consist of three parts: a set of documents, a set of information needs (called topics in TREC), and
relevancejudgments, an indication of which documents should be retrieved in response to which topics.
2.1.1 Documents
The document set of a test collection should be a sample of the kinds of texts that will be encountered in the operational
setting of interest. It is important that the document set reflect the diversity of subject matter, word choice, literary
styles, document formats, etc. of the operational setting for the retrieval results to be representative of the performance
in the real task. Frequently, this means the document set must be large. The primary TREC test collections contain
about 2 gigabytes of text (between 500,000 and 1,000,000 documents). The document sets used in various tracks
have been smaller and larger depending on the needs of the track and the availability of data. The terabyte track was
introduced this year to investigate both retrieval and evaluation issues associated with collections significantly larger
than 2 gigabytes of text.
The primary TREC document sets consist mostly of newspaper or newswire articles, though there are also some
govemment documents (the Federal Register, patent applications) and computer science abstracts (Computer Selects
by Ziff-Davis publishing) included. High-level structures within each document are tagged using SGML, and each
document is assigned an unique identifier called the DOCNO. In keeping of the spirit of realism, the text was kept
as close to the original as possible. No attempt was made to correct spelling errors, sentence fragments, strange
formatting around tables, or similar faults.
2.1.2 Topics
TREC distinguishes between a statement of information need (the topic) and the data structure that is actually given to
a retrieval system (the query). The TREC test collections provide topics to allow a wide range of query construction
methods to be tested and also to include a clear statement of what criteria make a document relevant. The format of a
topic statement has evolved since the earliest TRECs, but it has been stable since TREC-5 (1996). A topic statement
generally consists of four sections: an identifier, a title, a description, and a narrative. An example topic taken from
this year's robust track is shown in figure 1.
The different parts of the TREC topics allow researchers to investigate the effect of different query lengths on
retrieval performance. For topics 301 and later, the "title" field was specially designed to allow experiments with very
2
<nuin> Number: 656
<title> lead poisoning children<desc>How are young children being protected against lead poisoning from paint andwater pipes?<narr>Documents describing the extent of the problem, including suits againstmanufacturers and product recalls, are relevant. Descriptions of future plansfor lead poisoning abatement projects are also relevant. Worker problems withlead are not relevant. Other poison hazards for children are not relevant.
Figure 1: A sample TREC 2004 topic from the robust track test set.
short queries; these title fields consist of up to three words that best describe the topic. The description ("desc") field
is a one sentence description of the topic area. The narrative ("narr") gives a concise description of what makes a
document relevant.
Participants are free to use any method they wish to create queries from the topic statements. TREC distinguishes
among two major categories of query construction techniques, automatic methods and manual methods. An automatic
method is a means of deriving a query from the topic statement with no manual intervention whatsoever; a manual
method is anything else. The definition of manual query construction methods is very broad, ranging from simple
tweaks to an automatically derived query, through manual construction of an initial query, to multiple query refor-
mulations based on the document sets retrieved. Since these methods require radically different amounts of (human)
effort, care must be taken when comparing manual results to ensure that the runs are truly comparable.
TREC topic statements are created by the same person who performs the relevance assessments for that topic
(the assessor). Usually, each assessor comes to NIST with ideas for topics based on his or her own interests, and
searches the document collection using NIST's PRISE system to estimate the likely number of relevant documents per
candidate topic. The NIST TREC team selects the final set of topics from among these candidate topics based on the
estimated number of relevant documents and balancing the load across assessors.
2.U Relevance judgments
The relevance judgments are what turns a set of documents and topics into a test collection. Given a set of relevance
judgments, the retrieval task is then to retrieve all of the relevant documents and none of the irrelevant documents.
TREC usually uses binary relevance judgments—either a document is relevant to the topic or it is not. To define
relevance for the assessors, the assessors are told to assume that they are writing a report on the subject of the topic
statement. If they would use any information contained in the document in the report, then the (entire) document
should be marked relevant, otherwise it should be marked irrelevant. The assessors are instructed to judge a document
as relevant regardless of the number of other documents that contain the same information.
Relevance is inherently subjective. Relevance judgments are known to differ across judges and for the same judge
at different times [7] . Furthermore, a set of static, binary relevance judgments makes no provision for the fact that a real
user's perception of relevance changes as he or she interacts with the retrieved documents. Despite the idiosyncratic
nature of relevance, test collections are useful abstractions because the comparative effectiveness of different retrieval
methods is stable in the face of changes to the relevance judgments [10].
The relevance judgments in early retrieval test collections were complete. That is, a relevance decision was made
for every document in the collection for every topic. The size of the TREC document sets makes complete judgments
utterly infeasible—with 800,000 documents, it would take over 6500 hours to judge the entire document set for one
topic, assuming each document could be judged in just 30 seconds. Instead, TREC uses a technique called pooling [8]
to create a subset of the documents (the "pool") to judge for a topic. Each docmnent in the pool for a topic is judged
for relevance by the topic author. Documents that are not in the pool are assumed to be irrelevant to that topic.
The judgment pools are created as follows. When participants submit their retrieval runs to NIST, they rank their
runs in the order they prefer them to be judged. NIST chooses a number of runs to be merged into the pools, and selects
3
that many runs from each participant respecting the preferred ordering. For each selected run, the top X documents
(usually, X = 100) per topic are added to the topics' pools. Since the retrieval results are ranked by decreasing
similarity to the query, the top documents are the documents most likely to be relevant to the topic. Many documents
are retrieved in the top X for more than one run, so the pools are generally much smaller than the theoretical maximum
ofX X the-number-of-selected-runs documents (usually about 1/3 the maximum size).
The use of pooling to produce a test collection has been questioned because unjudged documents are assumed to
be not relevant. Critics argue that evaluation scores for methods that did not contribute to the pools will be deflated
relative to methods that did contribute because the non-contributors will have highly ranked unjudged documents.
Zobel demonstrated that the quality of the pools (the number and diversity of runs contributing to the pools and
the depth to which those runs are judged) does affect the quality of the final collection [14]. He also found that the
TREC collections were not biased against unjudged runs. In this test, he evaluated each run that contributed to the
pools using both the official set of relevant documents published for that collection and the set of relevant documents
produced by removing the relevant documents uniquely retrieved by the run being evaluated. For the TREC-5 ad hoc
collection, he found that using the unique relevant documents increased a run's 11 point average precision score by
an average of 0.5 %. The maximum increase for any run was 3.5 %. The average increase for the TREC-3 ad hoc
collection was somewhat higher at 2.2 %.
A similar investigation of the TREC-8 ad hoc collection showed that every automatic run that had a mean average
precision score of at least 0.1 had a percentage difference of less than 1 % between the scores with and without that
group's uniquely retrieved relevant documents [13]. That investigation also showed that the quality of the pools is
significantly enhanced by the presence of recall-oriented manual runs, an effect noted by the organizers of the NTCIR(NACSIS Test Collection for evaluation of Information Retrieval systems) workshop who performed their own manual
runs to supplement their pools [5].
While the lack of any appreciable difference in the scores of submitted runs is not a guarantee that all relevant
documents have been found, it is very strong evidence that the test collection is reliable for comparative evaluations of
retrieval runs. The differences in scores resulting from incomplete pools observed here are smaller than the differences
that result from using different relevance assessors [10].
2.2 Evaluation
Retrieval runs on a test collection can be evaluated in a number of ways. In TREC, ad hoc tasks are evaluated using
the trec.eval package written by Chris Buckley of Sabir Research [1]. This package reports about 85 different
numbers for a run, including recall and precision at various cut-off levels plus single-valued summary measures that
are derived from recall and precision. Precision is the proportion of retrieved documents that are relevant, while recall
is the proportion of relevant documents that are retrieved. A cut-off level is a rank that defines the retrieved set; for
example, a cut-off level of ten defines the retrieved set as the top ten documents in the ranked list. The trecevalprogram reports the scores as averages over the set of topics where each topic is equally weighted. (The altemative is to
weight each relevant document equally and thus give more weight to topics with more relevant documents. Evaluation
of retrieval effectiveness historically weights topics equally since all users are assumed to be equally important.)
Precision reaches its maximal value of 1.0 when only relevant documents are retrieved, and recall reaches its
maximal value (also 1.0) when all the relevant documents are retrieved. Note, however, that these theoretical maximumvalues are not obtainable as an average over a set of topics at a single cut-off level because different topics have different
numbers of relevant documents. For example, a topic that has fewer than ten relevant documents will have a precision
score less than one at ten documents retrieved regardless of how the documents are ranked. Similarly, a topic with
more than ten relevant documents must have a recall score less than one at ten documents retrieved. At a single cut-off
level, recall and precision reflect the same information, namely the number of relevant documents retrieved. At varying
cut-off levels, recall and precision tend to be inversely related since retrieving more documents will usually increase
recall while degrading precision and vice versa.
Of all the numbers reported by trec.eval, the recall-precision curve and mean (non-interpolated) average preci-
sion are the most commonly used measures to describe TREC retrieval results. A recall-precision curve plots precision
as a function of recall. Since the actual recall values obtained for a topic depend on the number of relevant documents,
the average recall-precision curve for a set of topics must be interpolated to a set of standard recall values. The par-
4
ticular interpolation method used is given in Appendix A, which also defines many of the other evaluation measures
reported by trec.eval. Recall-precision graphs show the behavior of a retrieval run over the entire recall spectrum.
Mean average precision is the single-valued summary measure used when an entire graph is too cumbersome. Theaverage precision for a single topic is the mean of the precision obtained after each relevant document is retrieved
(using zero as the precision for relevant documents that are not retrieved). The mean average precision for a run
consisting of multiple topics is the mean of the average precision scores of each of the individual topics in the run.
The average precision measure has a recall component in that it reflects the performance of a retrieval run across
all relevant documents, and a precision component in that it weights documents retrieved earlier more heavily than
documents retrieved later. Geometrically, average precision is the area underneath a non-interpolated recall-precision
curve.
As TREC has expanded into tasks other than the traditional ad hoc retrieval task, new evaluation measures have had
to be devised. Indeed, developing an appropriate evaluation methodology for a new task is one of the primary goals
of the TREC tracks. The details of the evaluation methodology used in a track are described in the track's overview
paper.
3 TREC 2004 Tracks
TREC's track structure was begun in TREC-3 (1994). The tracks serve several purposes. First, tracks act as incubators
for new research areas: the first running of a track often defines what the problem really is, and a track creates the
necessary infrastructure (test collections, evaluation methodology, etc.) to support research on its task. The tracks also
demonstrate the robustness of core retrieval technology in that the same techniques are frequentiy appropriate for a
variety of tasks. Finally, the tracks make TREC attractive to a broader community by providing tasks that match the
research interests of more groups.
Table 1 lists the different tracks that were in each TREC, the nimiber of groups that submitted runs to that track,
and the total number of groups that participated in each TREC. The tasks within the tracks offered for a given TREChave diverged as TREC has progressed. This has helped fuel the growth in the number of participants, but has also
created a smaller common base of experience among participants since each participant tends to submit runs to fewer
tracks.
This section describes the tasks performed in the TREC 2004 tracks. See the track reports later in these proceedings
for a more complete description of each track.
3.1 The genomics track
The genomics track was introduced as a "pre-track" in 2002. It is the first TREC track devoted to retrieval within a
specific domain; one of the goals of the track is to see how exploiting domain-specific information improves retrieval
effectiveness.
The 2004 genomics track contained an ad hoc retrieval task and three variants of a categorization task. The ad hoc
task used a 10-year subset (1994-2003) ofMEDLINE, a bibliographic database of the biomedical literature maintained
by the US National Library of Medicine who donated the subset to the track. The subset used in the track contains
about 4.5 million MEDLINE records (which include title and abstract as well as other bibliographic information)
and is about 9GB of data. The 50 topics for the ad hoc task were derived from information needs obtained through
interviews of biomedical reseaichers. Pools were created using one run from each of the 27 participating groups using
a depth of 75. Relevance judgments were made by assessors with backgrounds in biology using a three-point scale of
definitely relevant, probably relevant, and not relevant. Both definitely relevant and probably relevant were considered
relevant when computing evaluation scores.
Domain knowledge was most frequently exploited by using resources such as the MeSH hierarchy (a controlled
vocabulary used to index medical literature) to expand queries. Careful use of such resources appears to increase
retrieval effectiveness, though some attempts to exploit such information decreased effectiveness relative to a generic
baseline.
The genomics domain has a number of model organism database projects in which the literature regarding a specific
organism (such as a mouse) is tracked and annotated with the function of genes and proteins. The classification tasks
5
Table 1: Number of participants per track and total number of distinct participants in each TRECTREC
used in the 2004 track mimic some aspects of this curation process with the goal of eventually automating this nowlargely manual task. For the classification tasks, the track used the full text articles from a two-year span of three
journals. This text was made available to the track through Highwire Press. The truth data for the tasks came from
the actual annotation process carried out by the human annotators in the mouse genome informatics (MGI) system.
Evaluation scores were computed using normalized utility measures.
As in the ad hoc task, many groups used MeSH terms as features to classify the documents. While these approaches
were relatively effective, a subsequent analysis demonstrated the benefit was largely attributable to a single MeSHterm: a baseline run that classified documents solely by the presence of the MeSH term Mice in the MEDLINE record
of the document would have been the second best run submitted to the track for the triage classification task.
3.2 The HARD track
HARD stands for "High Accuracy Retrieval from Documents". The HARD track was started in TREC 2003 with the
goal of improving retrieval performance, especially at the top of the ranked list, by targeting retrieval results to the
specific searcher. To facilitate such targeting, the HARD track provides metadata in the topic statement. In addition,
"clarification forms" provide a limited means of interaction between the system and the searcher.
The underlying task in the HARD track was an ad hoc retrieval task. The document set was a set of
newswire/newspaper articles from 2003, including (English portions) of non-US papers. The collection is approx-
imately 1500MB of text and contains approximately 650,000 articles. Topics were created at the Linguistic Data
Consortium (LDC), and were originally released in standard TREC format (i.e., just title, description, and narrative
fields). Once participants submitted baseline runs using the standard topics, they received the expanded version of the
topics. There were 50 topics in the test set, though only 45 topics were used in the evaluation since five topics had no
relevant documents.
The expanded version of the topics contained both a statement of the retrieval unit and the metadata. The retrieval
6
unit was always specified, and was either "passage" or "document". The "passage" specification meant retrieval
systems should return pieces of documents, rather than full documents, as a response. The types of metadata in the
TREC 2004 topics included familiarity, genre, geography, subject, and related text. The first three types affected
the relevance of a text: a text that was on-topic but did not satisfy one of these metadata constraints was considered
not relevant when using stringent relevance criteria. The subject metadata item contained the subject domain of the
topic (for example, "sports", or "politics"); a document that did not meet this criterion was off-topic. The related text
metadata provided some examples of relevant or on-topic text drawn from outside the test corpus. Different topics
contained different kinds and amounts of metadata.
In addition to the information included in the expanded version of the topics, participants could collect information
from the searcher (the assessor who created and judged the topic) using clarification forms. A clarification form was
a single, self-contained HTML form created by the participating group and specific to a single topic. There were no
restrictions on what type of data could be collected using a clarification form, but the searcher spent no more than
three minutes filling out any one form.
Participants then made new runs using any combination of information from the expanded topics and clarification
forms. The goal was to see if the additional information helped systems to create a more effective retrieved set than
the initial baseline result. Retrieval results were evaluated both at the document level (for all 45 topics including those
with retrieval unit "passage") using trec.eval and using passage level evaluation measures over just the 25 topics
with retrieval unit "passage".
Sixteen groups submitted 135 runs to the HARD track. Most groups were able to exploit the additional information
to improve effectiveness as compared to their baseline run, generally by performing some type of relevance feedback.
33 The novelty track
The goal of the novelty track is to investigate systems' abilities to locate relevant and new (nonredundant) information
within an ordered set of documents. This task models an application where the user is skimming a set of documents
and the system highlights the new, on-topic information. The track was first introduced in TREC 2002, though the
tasks changed significantly between 2002 and 2003. This year's track used the same tasks as the 2003 track.
The basic task in the novelty track is as follows: given a topic and an ordered set of documents segmented into sen-
tences, return sentences that are both relevant to the topic and novel given what has aheady been seen. To accomplish
this task, participants must first identify relevant sentences and then identify which sentences contain new information.
Fifty new topics were created for the 2004 track. As in TREC 2003, half of the topics focused on events and
the other half focused on opinions about controversial subjects. For each topic, the assessor created a statement of
information need and queried the document collection using the NIST PRISE search engine. The assessor selected
25 relevant documents and labeled the relevant and new sentences in each. The document collection used was the
AQUAINT Corpus ofEnglish News Text which contains approximately 1,033,000 documents and 3 gigabytes of text.
The document set for a topic in the test set contained the 25 relevant documents selected by the assessor as well as 0
or more irrelevant documents. The documents in a set were ordered chronologically.
There were four tasks in the track, which allowed participants to test their approaches to novelty detection using
no, partial, or complete relevance information.
Task 1. Given the complete document set for a topic, identify all relevant and novel sentences.
Task 2. Given the relevant sentences in the complete document set, identify all novel sentences.
Task 3. Given the relevant and novel sentences in the first 5 documents for the topic, find the relevant and novel
sentences in the remaining documents.
Task 4. Given the relevant sentences in the complete document set, and the novel sentences in the first 5 documents,
find the novel sentences in the remaining documents.
Given the set of relevant and new sentences selected by the assessor who created the topic, the score for a novelty
topic was computed as the F measure where sentence set recall and sentence set precision are equally weighted.
Fourteen groups submitted 183 runs to the novelty track, with tasks 1 and 2 having the greater participation. The
inclusion of nonrelevant documents in the retrieved set appears to make task 1 much more challenging. In TREC 2003,
7
3 Hale Bopp comet
3.1 FACTOID3.2 FACTOID3.3 LIST
When was the comet discovered?
How often does it approach the earth?
In what countries was the comet visible on its last return?
3.4 OTHER
Figure 2: A sample QA track question series.
the best-performing systems for task 1 were roughly comparable to human performance as measured by scoring a
second assessor's sentence selection against the primary assessor's choices. This year, the best systems' effectiveness
was well below human performance. The particular topics used this year may also have been more difficult given that
the absolute scores of TREC 2004 systems were lower than TREC 2003 scores for task 2 and task 2 is unaffected by
nonrelevant documents.
3.4 The question answering (QA) track
The question answering track addresses the problem of information overload by encouraging research into systems
that return actual answers, as opposed to ranked lists of documents, in response to a question. The TREC 2003 version
of the track used a combined task where the test set of questions consisted of factoid, list, and definition questions.
Each type of question was judged and scored separately, but the final score for a run was a weighted average of the
component scores. The task in the 2004 track was similar in that the test set consisted of a mix of question types, and
the final score was a weighted average of the components. The task was reorganized, however, such that the systems
were to answer a series of factoid and list questions that each related to a common target, and then to respond with
a list of "other" information about the target that was not covered by the previous questions in the series. This last
question in the series is a more difficult variant of the definition questions in TREC 2003. This reorientation of the
task requires systems to track context when answering questions, an important element of question answering that the
track has not yet successfully incorporated [11].
The document set used in the track was the AQUAINT Corpus of English News Text. The test set consisted of
65 series of questions that together included 230 factoid questions, 56 list questions (one had to be removed from
the evaluation due to no correct answers in the collection), and 65 Other questions (one had to be removed from the
evaluation since it mistakenly went unjudged). Each of the questions was explicitly tagged as to what type of question
it was and what series it belonged to. The target of the series was given as metadata for the whole series. An example
series is given in figure 2.
The score for the factoid question component was accuracy, the percentage of factoid questions whose response
was judged correct. The list and Other question components were each scored using average F, though the computation
of the F score differed between the two components [12]. The final score for a run was computed as a weighted average
of the three component scores: FinalScore = .SAccuracy + .25AveListF + .25AveOtherF.
Sixty-three runs from 28 different groups were submitted to the track. In general, the use of pronouns and anaphora
in questions later in a series did not seem to pose a very serious challenge for the systems, in part because the target
was the correct referent a large majority of the time. For most systems, the average score for the first question in
a series was somewhat greater than the average score for a question that was not the first question in a series, but
the difference was not great and is confounded by other effects (there are many fewer first questions to compute the
average over, first questions in a series might be intrinsically easier questions, etc.).
The reorganization of the task into a set of question series had an unexpected benefit. The series proved to be
an appropriate level of granularity for aggregating scores for an effective evaluation. The series is small enough to
be meaningful at the task level since it represents a single user interaction, yet it is large enough to avoid the highly
skewed score distributions exhibited by single questions. Computing a combined score for each series, and averaging
the series scores, produces a QA task evaluation that more closely mimics classic document retrieval evaluation.
8
3.5 The robust track
The robust track looks to improve the consistency of retrieval technology by focusing on poorly performing topics.
TREC 2004 was the second time the track was run. The initial track provided strong evidence that optimizing average
effectiveness using the standard methodology and current evaluation measures furtlier improves the effectiveness of
the already-effective topics, sometimes at the expense of the poor performers. That track also showed that measuring
poor performance is intrinsically difficuh because there is so little signal in the sea of noise for a poorly performing
topic. New measures devised for the TREC 2003 robust track do emphasize poorly performing topics, but because
there is so little information, the measures are unstable.
The task in both years of the robust track was a classic ad hoc retrieval task. The TREC 2004 edition of the track
used more topics than the 2003 edition in hopes of getting a more stable evaluation. In particular, the test set for 2004
consisted of 250 topics (one topic was dropped from the evaluation since it was judged to have no relevant documents).
Two hundred of the topics were used in previous TREC tasks and 50 new topics were created for the track. To avoid
needing new relevance judgments for the 200 old topics, an old document set was used: the set of documents on TRECdisks 4 and 5 minus the Congressional Record documents.
The use of old topics had an additional motivation other than not needing new relevancejudgments for those topics.
Since the retrieval results from the previous TREC in which the topics were used are available, it is possible to select
topics that are known to be challenging to a majority of retrieval systems. Fifty topics from among the 200 old topics
were designated as being difficult. These topics were selected for the TREC 2003 track by choosing topics that had a
low median average precision score and at least one high outlying score.
The retrieval results were evaluated using trec.eval, two measures introduced in the TREC 2003 track that em-
phasize poorly performing topics, and a new measure, geometric MAP, introduced in this year's track. The geometric
MAP is a variant of the traditional MAP measure that uses a geometric mean rather than an arithmetic mean to aver-
age individual topic results. An analysis of the behavior of the geometric MAP measure suggests it gives appropriate
emphasis to poorly performing topics while being more stable at equal topic set sizes.
The robust track received a total of 110 runs from 14 participants. All of the runs submitted to the track were
automatic runs. The results indicate that the most promising approach to improving poorly performing topics is
exploiting text collections other than the target collection, though the process must be carefully controlled to avoid
making the results worse. The web was the collection most frequently used as an auxiliary collection.
An additional requirement in this year's track was for systems to submit a ranked list of the topics ordered by
perceived difficulty. That is, the system assigned each topic a number from 1 to 250 where the topic assigned 1 was
the topic the system believed it did best on, the topic assigned 2 was the topic the system believed it did next best
on, etc. The purpose of the requirement was to see if systems can recognize whether a topic is difficult at run time, a
first step toward doing special processing for difficult topics. While some systems were clearly better than others at
predicting when a topic is difficult for that system, none of the systems were particularly good at the task. How muchaccuracy is required to make effective use of the predictions is still unknown.
3.6 The terabyte track
The terabyte track is a new track in 2004. The goal of the track is is to develop an evaluation methodology for
terabyte-scale document collections. The track also provides an opportunity for participants to see how well their
retrieval algorithms scale to much larger test sets than other TREC collections.
The document collection used in the track is the GOV2 collection, a collection of Web data crawled from Websites in the .gov domain during early 2004. This collection contains a large proportion of the crawlable pages in .gov,
including html and text, plus extracted text of pdf, word and postscript files. The collection is 426GB in size and
contains approximately 25 million documents. The collection is smaller than a full terabyte due to the difficulty of ob-
taining and processing enough documents while allowing sufficient time for distributing the collection to participants.
The collection will be expanded using data from other sources in future years. The current collection is at least an
order of magnimde greater than the next-largest TREC collection.
The task in the track was a classic ad hoc retrieval task. The test set consisted of 50 topics created specifically for
the track. While the document set consists of web pages, the topics were standard mformation-seeking requests, and
9
not navigational requests or topic distillation requests, for example. Systems returned the top 10,000 documents per
topic so various evaluation strategies can be investigated. Participants also answered a series of questions about timing
and resources required to produce the retrieval results.
Seventy runs from 17 different groups were submitted to the track. The top 85 documents per topic for two runs
per group were added to the judgment pools. Initial analysis of the track results has revealed little difference in the
relative effectiveness of different approaches when evaluated by MAP or by bpref, a measure created for evaluation
environments where pools are known to be very incomplete [2]. There are a variety of reasons why this might be so:
it may mean that current pooling practices are adequate for collections of this size, or that the runs submitted to the
terabyte track happened to retrieve a sufficient set of relevant documents, or that the terabyte topics happened to be
particularly narrow, and so forth. The terabyte track will continue in TREC 2005 to examine these questions.
3.7 The web track
The goal in the web track is to investigate retrieval behavior when the collection to be searched is a large hyperlinked
structure such as the World Wide Web. Previous TREC web tracks had separately investigated topic distillation, named
page finding, and home page finding tasks [4]. Since web search engines must process these types of searches (among
others) without explicit knowledge of which type of search is wanted, this year's web task combined them into a single
task.
For a topic distillation search a system is to return a list of entry points for good websites principally devoted to the
topic. Since there are only a few good websites for any particular topic, there are only a few key ("relevant") pages for
a topic distillation search. The emphasis is on returning entry pages rather than pages containing relevant information
themselves since a result list of homepages provides a better overview of the coverage of a topic in the collection.
Named page and home page finding searches are similar to each other in that both are known-item tasks where the
system is to return a particular page. For home page finding, the target page is the home page of the entity in the topic.
For named page finding, a particular page is sought, but that page is not an entry point to a site (e.g., "1040 tax form")-
For the TREC 2004 task, participants received a set of 225 title-only topics such as "West Indian manatee informa-
tion" and "York county". The assessor specified which type of search was intended when the topic was created, but the
test set did not include this information. Systems returned a ranked list of up to 1000 pages per topic. During judging,
the assessors made binary judgments as to whether a page was appropriate with respect to the intended task. That is,
the pages returned for topics whose search type was topic distillation were judged relevant if the page was a key entry
page and not relevant otherwise. For the named page finding and home page finding topics, a page was judged relevant
if and only if the page was the target page (or a mirror/alias of the target page). The runs were evaluated using MAP,which is equivalent to the mean reciprocal rank (MRR) measure for known-item searches.
The track used the .GOV collection created for the TREC 2(X)2 web track and distributed by CSIRO. This collection
is based on a January, 2002 crawl of .gov web sites. The documents in the collection contain both page content and
the information returned by the http daemon; text extracted from the non-html pages is also included in the collection.
In addition to the search task, the track also contained a classification task in which the goal was simply to label
each of the 225 test topics as to what type of search was intended.
Eighteen groups submitted a total of 83 runs to the track. Nine of the runs were classification task runs. The
retrieval results showed that systems are able to obtain effective overall retrieval without having to classify the queries
by type. That is, groups were able to devise a single technique that performed well for home page, named page, and
distillation topics. These techniques were not based solely on the text of a page, but also needed to exploit some sort
of web information such as link structure or anchor text. Systems that did attempt to classify topics were generally
able to do so, with most classification errors confusing named page and home page topics.
4 The Future
A significant fraction of the time of one TREC workshop is spent in planning the next TREC. A majority of the
TREC 2004 tracks will continue in TREC 2005, including the genomics, HARD, QA, robust, and terabyte tracks.
As described in the web track overview paper, the web track as such will end, with a new enterprise track taking its
place. The goal of the enterprise track is to study enterprise search—satisfying a user who is searching the data of
10
an organization to accomplish some task. The novelty track will also end. Finally, a new track, the spam track, will
be introduced in TREC 2005. The goal of the spam track is to provide a standard evaluation of current and proposed
spam filtering approaches, thereby laying the foundation for the evaluation of more general email filtering and retrieval
tasks.
Acknowledgements
Special thanks to the track coordinators who make the variety of different tasks addressed in TREC possible.
References
[1] Chris Buckley. trec_eval IR evaluation package. Available from http: / /tree . nist . gov/trec_eval/.
[2] Chris Buckley and Ellen M. Voorhees. Retrieval evaluation with incomplete information. In Proceedings of
the Twenty-Seventh Annual InternationalACM SIGIR Conference on Research and Development in Information
Retrieval, pages 25-32. 2004.
[3] C. W. Cleverdon, J. Mills, and E. M. Keen. Factors determining the performance of indexing systems. Twovolumes, Cranfield, England, 1968.
[4] Nick Craswell, David Hawking, Ross Wilkinson, and Mingfang Wu. Overview of the TREC 2003 web track. In
Figure 8 - Grouping of documents for categorization subtasks.
MGI - articles
not selected for
any actions
Triage task
negative
examples
The evaluation measure for the triage task was the
utility measure often applied in text categorization
research and used by the former TREC Filtering
Track. This measure contains coefficients for the
utility of retrieving a relevant and retrieving a
nonrelevant document. We used a version that was
normalized by the best possible score:
Unonii ~ Uraw / Umax
where Unom was the normalized score, Uraw the raw
score, and Umax the best possible score.
The coefficients for the utility measure were derived
as follows. For a test collection of documents to
categorize, Uraw is calculated as:
Uraw = (Ur * relcvant-docs-retrieved) + (Un,*
nonrelevant-docs-retrieved)
where:
• Ur = relative utility of relevant document
• Uni = relative utility of nonrelevant document
We used values for u^ and Unr that were driven by
boundary cases for different results. In particular, wewanted (thought it was important) the measure to
have the following characteristics:
• Completely perfect prediction - Unorm = 1
• All documents designated positive (triage
everything) - 1 > Unom > 0
• All documents designated negative (triage
nothing) - Unom = 0
• Completely imperfect prediction - Unorm < 0
In order to achieve the above boundary cases, we had
to set Ur > 1 . The ideal approach would have been to
interview MGI curators and use decision-theoretic
approaches to determine their utility. However, time
constraints did not allow this. Deciding that the
triage-everything approach should have a higher
score than the tnagc-nothing approach, we estimated
that a Unorm in the range of 0.25-0.3 for the triage-
everything condition would be appropriate. Solving
for the above boundary cases with Unorm ~ 0.25-0.3
for that case, we obtained a value for Ur ~ 20. To
keep calculations simple, we choose a value of Ur =
20. Table 5 shows the value of Unorm for the
boundary cases.
The measure Umax was calculated by assuming all
relevant documents were retrieved and no
nonrelevant documents were retrieved, i.e., Umax = Ur
* all-relevant-docs-retrieved.
Thus, for the training data,
Uraw = (20 * relevant-docs-retrieved) -
nonrelevant-docs-retrieved
Umax = 20 * 375 = 7500
Unorm = [(20 * relevant-docs-rctrieved) -,
nonrelevant-docs-retrieved] / 7500
Likewise, for the test data,
Uraw = (20 * relevant-docs-retrieved) -
nonrelevant-docs-retrieved
Umax = 20 * 420 = 8400
Unorm = [(20 * relevant-docs-rctrieved) -
nonrelevant-docs-retrieved] / 8400
The results of the triage subtask are shown in Table
6. A variety of groups used classifiers based on
machine learning techniques. The higher scoring
runs tended to make use ofMeSH terms in some
fashion. The best performing run came from Rutgers
University, using the MEDLINE record, weighting,
and filtering by the MeSH term Mice [16]. They
achieved a Unorm of 0.6512. However, this group also
noted that the MeSH term Mice alone scored better
than all but the single top run, with a Unorm of 0.6404.
This meant that no other approach was better able to
classify documents for triage than simply using the
MeSH term Mice from the MEDLINE record. Ofcourse, this run only achieved a recall of about 1 5%(with a recall of 89%), so this feature is far from a
perfect predictor. In an another analysis of the data,
Cohen noted that there was conceptual drift across
the collection, with the features identified as strong
predictors in the training data not necessarily
continuing to be strong predictors in the test data
[12]. All of the triage subtask results are showngraphically in Figure 9, along with the utility for the
MeSH term Mice and the decision to select all
articles.
4.3 Annotation Subtask
that the goal of this task was not to select the actual
GO term, but rather to select the one or more GOhierarchies (molecular function, biological process,
or cellular component) from which terms had been
selected to annotate the gene for the article. Papers
that were annotated had terms from one to three
hierarchies.
For negative examples, we used 555 papers that had a
gene name assigned but were used for other purposes
by MGI. As such, these papers had no GOannotations. These papers did, however, have one or
more gene assigned by MGI for the other annotation
purposes.
A secondary subtask was to identify the correct GOevidence code that went with the hierarchy code.
Only two groups took part in this subtask.
Table 7 shows the contents and counts of the data
files for this subtask. For the training data, there
were a total of 504 documents that were either
positive (one or more GO terms assigned) or negative
(no GO terms assigned) examples. From these
documents, a total of 1291 genes had been assigned
by MGI. (The Genes file contained the MGIidentifier, the gene symbol, and the gene name. It did
not contain any other synonyms.) There were 1418
unique possible document-gene pairs in the training
data. The data from the first three rows of Table 7
differ from the rest in that they contained data
merged from positive and negative examples. These
were what would be used as input for systems to
nominate GO domains or the GO domains plus their
evidence codes per the annotation task. When the
test data were released, these three files were the only
ones that were provided.
For the positive examples in the training data, there
were 1 78 documents and 346 document-gene pairs.
There were 589 document-gene name-GO domain
tuples (out of a possible 346 * 3 = 1038). There were
640 document-gene name-GO domain-evidence code
tuples. A total of 872 GO plus evidence codes had
been assigned to these documents. For the negative
examples, there were 326 documents and 1072
document-gene pairs. This meant that systems could
possibly assign 1072*3 = 3216 document-gene name-
GO domain tuples.
The primary goal of this task was, given an article
and gene name, to correctly identify which of the GOhierarchies (also called domains) had terms within
them that were annotated by the MGI curators. Note
24
HARD Track Overview in TREC 2004
High Accuracy Retrieval from Documents
James Allan
Center for Intelligent Information Retrieval
Department of Computer Science
University of Massachusetts Amherst
Abstract
The HARD track of TREC 2004 aims to improve the accuracy of information retrieval through the
use of three techniques: (1) query metadata that better describes the information need, (2) focused
and time-hmited interaction with the searcher through "clarification forms", and (3) incorporation of
passage-level relevance judgments and retrieval. Participation in all three aspects of the track wasexcellent this year with about 10 groups trying something in each area. No group was able to achieve
huge gains in effectiveness using these techniques, but some improvements were found and enthusiasm
for the clarification forms (in particular) remains high. The track will run again in TREC 2005.
1 Introduction
The High Accuracy Retrieval from Documents (HARD) track explores methods for improving the accuracy
of document retrieval systems. It does so by considering three questions:
1. Can additional metadata about the query, the searcher, or the context of the search provide more
focused and therefore accurate results? These metadata items generally do not directly affect whether
or not a document is on topic, but they do affect whether it is relevant. For example, a person looking
for introductory material will not find an on-topic but highly technical document relevant.
2. Can highly focused, short-duration, interaction with the searcher be used to improve the accuracy of
a system? Participants created "clarification forms" generated in response to a query—and leveraging
any information available in the corpus—that were filled out by the searcher. Typical clarification
questions might ask whether some titles seem relevant, whether some words or names are on topic, or
whether a short passage of text is related.
3. Can passage retrieval be used to effectively focus attention on relevant material, increasing accuracy
by eliminating unwanted text in an otherwise useful document? For this aspect of the problem, there
are challenges in finding relevant passages, but also in determining how best to evaluate the results.
The HARD track ran for the second time in TREC 2004. It used a new corpus and a new set of 50 topics
for evaluation. All topics included metadata information and clarification forms were considered for each of
them. Because of the expense of sub-document relevance judging, only half of the topics were used in the
passage-level evaluation.
A total of 16 sites participated in HARD, up from 14 the year before. Interest remains strong, so the
HARD track will run again in TREC 2005, but because of funding uncertainties will only address a subset of
the issues. Exactly what is included and how it takes place will be determined by interested participants. In-
formation about the track will be available at the track's Web page, http : //ciir . cs . umass . edu/research/hard
(the contents of the site are not predictable after 2005).
Topic creation, clarification form entry, and relevance judging were all carried out by the Linguistic Data
Consortium (LDC) at the University of Pennsylvania (http://wvirw.ldc.upenn.edu). The annotation work
was supported in part by the DARPA TIDES project.
25
Evaluation of runs using the judgments from the LDC was carried out by NIST.
The remainder of this document discusses the HARD 2004 track and provides an overview of some of its
results. Additional details on results are available in the TREC papers from the participating sites.
2 HARD Corpus
The HARD 2004 evaluation corpus itself consisted entirely of English text from 2003, most of which is
newswire. The specific sources and approximate amounts of material are:
Source Abbrev Num docs Size (Mbs)
Agence France Press AFP 226,777 497
Associated Press APW 236,735 644
Central News Agency CNA 4,011 6
LA Times/Wash Post LAT 34,145 107
New York Times NYT 27,835 105
Salon.com SLN 3,134 28
Ummah Press UMM 2,557 5
Xinhua (English) XIN 117,516 183
Totals 652,710 1,575
This information was made available to participating sites with a research license. The data was provided
free of charge, though sites interested in retaining the data after the HARD track ended were required to
make arrangements with the LDC to do so.
3 Topics
Topics were an extension of typical TREC topics: they included (1) a statement of the topic and (2) a
description of metadata that a document must satisfy to be relevant, even if it is on topic. The topics were
represented in XML and included the following components:
• number is the topic's number-e.g., HARD-003.
• title is a short, few word description of the topic.
• description is a sentence-length description of the topic.
• topic-narrative is a paragraph-length description of the topic. This component did not contain any
mention of metadata restrictions. It is intended purely to define what is "on topic."
• metadata-narrative is a topic author's description of how metadata is intended to be used. This
description helps make it clear how the topic and metadata were intended to interact.
• retrieval- element indicates whether the judgments (hence retrieval) should be at the document or
passage level. For HARD 2004, half of the topics were annotated at the passage level.
• The following metadata fields were provided:
— familiarity had a value of little or much. It affected whether a document was relevant, but not
whether it was on topic.
— genre had values of news-report, opinion- editorial, other, or any. It affected whether a documentwas relevant, but not whether it was on topic.
- geography had values of US, non-US, or any. It affected whether a document was relevant, but
not whether it was on topic.
- subject describes the subject domain of the topic. It is a free-text field, though the LDC attemptedto be consistent in the descriptions it used. It affected whether or not a document was on-topic.
26
— related-text, on-topic provided an example of text that the topic's author considered to be on-topic
but not relevant.
— related-tedd. relevant provided an example of text that the topic's author considered to be relevant
(and therefore also on-topic).
During topic creation, the LDC made an effort to have topics vary across each of the indicated metadata
items.
The following is a sample topic from the evaluation corpus (topic HARD-428). Some particularly long
sections of the topic have been elided.
<topic>
<number>
HARD-428
</number>
<title>
International organ traffickers
</title>
<description>
Who creates the demands in the international ring of organ trafficking?
</description>
<topic-naxrative>
Many countries are institutionalizing legal measures to prevent the
selling and buying of human organs. Who, in the ring of international
organ traiff icking, axe the "buyers" of humam organs? Any information
that identifies 'where' they sire or 'who' they may be will be
considered on topic; the specificity of info does not matter. Also,
the story must be about international trafficking. Stories that only
contain information about the "sellers" of organs or those that focus
on national treifficking will be off topic.
</topic-narrative>
<metadata-naxrat ive>
Subject (CURRENT EVENTS) is chosen as it is expected that such
eirticles will have more information about the identities of the
peirties involved. Genre (NEWS) is expected to exclude stories that
tends to focus on ethical matters.
</metadata-narrative>
<retrieval-element>
passage
</retrieval-element>
<metadata>
<familiarity>
little
</familiarity>
<genre>
news-report
</genre>
27
<geography>
any
</geography>
<related-text>
<on-topic>
Every day, 17 Americans die of organ failure. In Israel, the average
wait for a kidney transplant is four years. In response, a global gray
market has bloomed. In India, for example, poor sellers are quickly...
</on-topic>
<relevant>
At least 30 Brazilians have sold their kidneys to an international
human organ trsifficking ring for transplants performed in South
Africa, with Israel providing most of the funding, says a legislative...
</relevan.t>
</related-text>
<subject>
CURRENT EVENTS
</subject>
</metadata>
</topic>
4 Relevance judgments
For each topic, documents that are annotated get one of the following judgments:
• OFF-TOPIC means that the document does not match the topic. (As is common in TREC, a document
without any judgment is assumed to be off topic for evaluation purposes.)
• ON-TOPIC means that the document does match the topic but that it does not satisfy the provided
metadata restrictions. Given the metadata items listed above, that means it either does not satisfy
the FAMILIARITY, GENRE, or GEOGRAPHY items (note that SUBJECT affects whether a story
is on topic).
• RELEVANT means that the document is on topic and it satisfies the appropriate metadata.
In addition, if the retrieval element field is passage then each judgment comes with information that specifies
which portions of the documents are relevant.
To specify passages, HARD used the same approach used by the question answering track [Voorhees, 2005].
A passage is specified by its byte ofltset and length. The offset will be from the "<" in the "<DOC>" tag
of the original document (an offset of zero would mean include the "<" character). The length will indicate
the number of bytes that are included. If a document contains multiple relevant passages, the document will
be listed multiple times.
The HARD track used the standard TREC pooling approach to find possible relevant documents. Thetop 85 documents from one baseline and one final run from each submitted system were pooled (i.e., 85 times
16 times 2 documents). The LDC considered each of those documents as possibly relevant to the topic.
Across all topics, the LDC annotated 36,938 documents, finding 3,026 that were on topic and relevant
and another 744 that were on topic but not relevant. Topics ranged from one on topic and relevant documentto 519; from 1 on topic but not relevant document to 70.
28
5 Training data
The LDC provided 20 training topics and 100 judged documents per topic. The topics incorporated a
selection of metadata values and came with relevance judgments.
In addition, the LDC provided a mechanism to allow sites to validate their clarification forms. Sites
could send a form to the LDC and get back confirmation that the form wa^ viewable and some "random"
completion of the form. The resulting information was sent back to the site in the same format that was
used in the evaluation. (No one took advantage of such a capability.)
6 Clarification forms
A unique aspect of the HARD track is that it provides access to the person who formulated the query and
will be doing the annotation. It allows sites to get a small amount of additional information from that person
by providing a small Web page as a form with clarification questions, check boxes, etc. for the searcher to
fill in.
The assessor spent no more than three (3) minutes filling out the form for a particular topic. If some
portions of a form were not filled out when the time expired, those portions were left blank. Sites were aware
of the time limit and were encouraged to keep their forms small—however, several (perhaps most) sites built
longer forms intending to get whatever they could within three minutes rather than building forms designed
to be filled in quickly.
In order to avoid implementation issues, systems were required to restrict the forms to simple HTMLwithout Javascript, images, and so on. They were also told what would be the hardware configuration used
by annotators, so they could tailor the presentation appropriately if desired.
The LDC reported that the annotators enjoyed filling out clarification forms immensely—if only because
it was an entirely new type of annotation task for them.
7 Results format
Results were returned for evaluation in standard TREC format extended, though, to support passage-level
submissions since it possible that the searcher's preferred response is the best passage (or sentence or phrase)
of relevant documents. Results included the top 1000 documents (or top 1000 passages) for each topic, one
line per document/passage per topic. Each line had the format:
topic-id QO docno rank score tag psg-offset psg-length
where:
• topic-id represents the topic number from the topic (e.g., HARD-001)
• "QO" is a constant provided for historical reasons
• docno represents the document that is being retrieved (or from which the passage is taken)
• rank is the rank number of the document/passage in the Ust. Rank should start with 1 for the
document/passage that the system believes is most likely to be relevant and continue to 1000.
• score is a system-internal score that was assigned to the document/passages. High values of score are
cLSSumed to be better, so score should generally drop in value as rank increases.
• tag is a unique identifier for this run by the site.
• psg-offset indicates the byte-offset in document docno where the passage starts. A value of zero
represents the "<" in "<DOC>" at the start of the document. A value of negative one (-1) means
that no passage has been selected and the entire document is being retrieved.
• psg-length represents how many bytes of the document are included in the passage. A value of negative
one (-1) must be supplied when psg-offset is negative one.
29
8 Evaluation approach
Results were evaluated at the document level, both in light of (HARD) and ignoring (SOFT) the query meta-
data. Ranked lists were also evaluated incorporating passage-level judgments. We discuss each evaluation
in this section.
Five of the 50 HARD topics (401, 403, 433, 435, and 450) had no relevant {and on topic) documents.
That is, although there were documents that matched the topics, no document in the pool matched the
topic and the query metadata. Accordingly, those five topics were dropped from both the HARD and SOFTevaluations. (They could have been kept for the SOFT evaluation, but then the scores of the two evaluations
would not have been comparable.)
8.1 Document-level evaluation
In the absence of passage information, evaluation was done using standard mean average precision. There
were two variants, one for HARD judgments and one for SOFT.Some of the runs evaluated in this portion were actually passage-level runs and could therefore include
a document at multiple points in the ranked list—i.e., because more than one passage was considered likely
to be relevant. For the document-level evaluation, only the first occurrence of a document in the ranked
list was considered. Subsequent occurrences were "deleted" from the ranked list. (That meant that it was
possible for a site to submit 1000 items in a ranked list, but have fewer than 1000 documents ranked.)
8.2 Passage-level evaluation
Two passage measures were explored for HARD 2004. The first was the same one used in HARD 2003,
passage R-precision. Some research at UMass Amherst demonstrated an extremely strong bias in favor of
short passages, so a second measure was also explored.
8.2.1 Passage R-Precision
In a nutshell, this evaluation measure considers the "true" relevant R passages as found by annotators.
It considers the top R passage returned by a system and counts the proportion of characters that overlap
relevant passages. It incorporates a penalty for repeating text in multiple passages. More details are provided
below.
The passage level evaluation for a topic consists of values for passage recall, passage precision, and the
F score at cutoff 5, 10, 15, 20, 30, 50, and 100, plus a R-precision score. As with standard document level
evaluation, a cutoff is the rank within the result set such that passages at or above the cutoff are "retrieved"
and all other passages are not retrieved. So, for example, if the cut-off is 5 the passage recall and precision
are computed over the top 5 passages. R-precision is defined similarly to the document level counterpart: it
is the passage precision after R passages have been retrieved where R is the number of relevant passages for
that topic. We are using passage R-precision as an evaluation measure reported for the track because it is a
cutoff-based measure that tracks mean average precision extremely closely in document evaluations.
The following is an operational definition of passage recall and precision as used in the evaluation. For
each relevant passage allocate a string representing all of the character positions contained within the rel-
evant passage (i.e., a relevant passage of length 100 has a string of length 100 allocated). Each passage in
the retrieved set marks those character positions in the relevant passages that it overlaps with. A character
position can be marked at most once, regardless of how many different retrieved passages contain it. (Re-
trieved passages may overlap, but relevant passages do not overlap.) The passage recall is then defined as
the average over all relevant passages of the fraction of the passage that is marked. The passage precision
is defined as the total number of marked character positions divided hy the total number of characters in
the retrieved set. The F score is defined in the same way as for documents, assigning equal weight to recall
and precision: F = (2*prec*recall)/(prec-Frecall) where F is defined to be 0 if prec-frecall is 0. We included
the F score because set-based recall and precision average extremely poorly but F averages well. R-precision
also averages well.
30
In all of the above, a document is treated as a (potentially long) passage. That is, the relevant "peissage"
starts at the beginning of the document and is as long as the document. (These are represented in the
judgment file as passages with -1 offset and -1 length, but are treated as described above.) For any topic, a
retrieved document (i.e., where offset and length are -1) is again just a passage with offset 0 and length the
length of the document.
Using the above definition of passage recall, passage recall and standard document level recall are identical
when both retrieved and relevant passages are whole documents. That is not true for this definition of passage
precision. Passage precision will be greater when a shorter irrelevant document is retrieved as compared to
when a longer irrelevant document is retrieved. This makes sense, but is different from standard document
level precision.
8.2.2 Passage-level bpref
Some explorations at UMass Amherst showed that passage R-precision could be improved dramatically by
splitting existing passages into smaller pieces. For example, by splitting the top-ranked passages into 32
pieces and then using the top R of those (rather than the top R original passages), the value of passage
R-precision increased by 128%.
Although numerous measures were considered, a variation of bpref [Buckley and Voorhees, 2004] was
finally selected. In this measure, the top 12,000 characters of the system's ranked list of passages was
considered (intended to correspond roughly to 10 normal sized passages).
As a document evaluation measure, bpref considers two sets of documents: a relevant set and a non-
relevant set. The assumption is that if a document A is taken from the first set and B is taken from the
second, then the user has a binary preference that A be ranked higher than B. The measure counts the
proportion of times that the user's implied set of preferences is satisfied. A perfect system would rank all
known relevant documents above all known non-relevant documents, would thereby satisfy all of the user's
preferences, and receive a score of 1.0. The worst possible score is zero, and systems will normally score
somewhere in the middle.
To extend this measure to passages, we consider character-level preferences. We assert that all relevant
characters should be presented before any non-relevant characters and count the proportion of preferences
that are satisfied. Note that the choice of character as the base unit is arbitrary and made for reasons of
simplicity. It could have been word, phrase, or even sentence, but each of those would require algorithmic
decisions about boundaries between units that are not necessary for character-level decisions. We believe
(though have not investigated) that different units will merely change the scale of results.
9 Protocol
The HARD 2004 track ran from May through August of 2004. On June 25th, sites received the 50 evaluation
topics, but without any of the metadata fields provided. That is, they received just the title, description,
and narrative information, a format consistent with past "ad hoc" TREC tracks.
Using that base information, sites were asked to do their best to rank documents for relevance and return
the ranked list of documents (not passages). These were the "baseline runs" and were due to NIST on July
9th.
In addition, sites could optionally generate up to two clarification forms that the LDC annotators would
fill out. These forms were due to the LDC on July 16th
On July 29th, the filled-out forms were returned to sites and the metadata fields of the topics were released
to all sites, regardless of whether they used clarification forms. Sites could use any of that information to
produce improved ranked lists. The final runs, incorporating everything they could, were due to NIST on
August 5th.
As described above, one baseline run and one final run were used from each site. The top 85 documents
from each of those runs were pooled together and used by the LDC for judging. For topics that required
passage-level judgment, the annotator marked passages as relevant as soon as a relevant document was found.
31
10 Participation
The following 16 sites participated in the HARD track of TREC 2004. The first three columns indicate
whether the site used metadata values, clarification forms, or passage retrieval in any of their submitted
runs.
Meta CF Psgs Site
Y Y Y Chinese Academy of Science, Institute of Software [Sun et al., 2005]
N Y N Clairvoyance Corporation [Evans et al., 2005]
N Y Y Indiana University [Yang et al., 2005]
N Y N Microsoft Research Cambridge [Zaragoza et al., 2005]
Y N N The Robert Gordon University [Harper et al., 2005]
Y N N Rutgers University [Belkin et al., 2005]
7 ? 7 Tsinghua University
Y N Y University of Chicago [Levow, 2005]
? ? 7 University of Cincinnati
N Y Y University of Illinois at Urbana-Champaign [Jiang and Zhai, 2005]
N Y Y University of Maryland &; Johns Hopkins University [He et al., 2005]
Y Y Y University of Massachusetts Amherst [Abdul-Jaleel et al., 2005]
N Y N University of North Carolina at Chapel Hill [Kelly et al., 2005]
Y N N University of Twente[Rode and Hiemstra, 2005]
N Y Y University of Waterloo & Bilkent University [Vechtomova and Karamuftuoglu, 2005]
Y Y Y York University [Huang et al., 2005]
7 10 8 COUNTS
(No information was reported for Tsinghua University or the University of Cincinnati, and they did not
provide a paper on this track to TREC for publication.)
It is interesting to note the wide range of ways that the different purposes of the track were exploited.
Only three sites used all three possible components of the track. The clarification forms were the most
popular, but not by a wide margin.
11 Results
This section provides a sketch of some of the results found by participating sites. Further and more detailed
information is available in the sites individual papers.
11.1 Use of metadata
For the most part, sites built models for the geography, genre, and subject metadata categories. Theytypically used text classification techniques to decide whether a document matched the category. Somesites used the Web to collect more data relevant to the category. And some built manual term lists for
classification (mostly for geography information).
In general, sites were unable to demonstrate substantial gains in effectiveness using metadata. Since
metadata differentiated between relevant and merely on-topic documents, a run using metadata should
score much better on "hard" measures (where only relevant documents are counted as relevant) and "soft"
measures (where on-topic documents are also counted as relevant). Several runs were able to improve in
that direction, though not by huge margins.
Some of these results are because topics tended not to require the metadata to improve performance. For
example, AIDS in Africa is obviously a non-US topic, and being told that it is not US is of little value.
The University of North Carolina asked (in clarification forms) the user how many times they had searched
before for each topic. They then showed that users who had claimed low familiarity in metadata also hadnot previously searched often for this topic. They did not use the metadata to aid retrieval, but cleverly
used the clarification form to show how familiarity metadata could be collected [Kelly et al., 2005].
32
The University of Waterloo also did not use metadata for retrieval, but did a very nice analysis using
the familiarity metadata. Users with low familiarity selected fewer phrases in Waterloo's clarification forms.
User's with low familiarity were helped by the clarification forms but users with much familiarity were hurt
[Vechtomova and Karamuftuoglu, 2005].
11.2 Use of clarification forms
Clarification forms allowed sites to ask the user anything about the topic that could be expressed in simple
HTML. Most requested information asked for judgments on keywords, documents, or passages. One site
asked whether presented passages were of about the right length, presumably to get a handle on the right
amount of information that should be returned. Several sites included free-form entry of phrases, other
keywords, or related text at the end of their clarification forms.
When sites asked for keywords, they had usually found words or phrases that their system suspected
were related to the topic. These might be words or phrases appearing in top-ranked documents, synonyms
of query words found using Wordnet (for example), extracted noun phrases or named entities, or ranges of
time that where relevant material would appear.
Document-style requests generally asked for a judgment of relevant for the passage. That was often the
title and a few keywords from a document, the passage most likely to be relevant ("best passage"), or a cluster
of documents represented by titles and/or key words. The set of documents, passages, or clusters chosen for
presentation were either the top-ranked set or a set modified to incorporate some notion of novelty—i.e., do
not present two highly similar documents for judgment.
Clarification forms were very popular, very fun, provided an open ended framework for experimentation,
and were by those counts very successful. On the other hand, most sites limited themselves to keyword and
text relevance feedback rather than trying more novel techniques, so the "open ended" nature has not (yet)
encouraged new ideas.
The value of clarification forms remains elusive to determine. Many sites saw some gains from their
clarification forms, but there were several sites that achieved their best performance—or nearly their best
—
on the baseline runs. Unquestionably work should consider on clarification forms because they are popular,
though until more impressive gains are seen, their value will debatable.
11.3 Use of passages
As described in Section 8, two measures for passage retrieval were considered, but others were compared.
Two get a sense of how similar they were, we investigated the correlation between bpref at 12,000 characters.
(That measure was declared "primary" in the track guidehnes, but sufficiently late in the process that some
sites fit to the passage R-precision measure.)
• Precision at 12,000 characters measured the proportion of characters that were relevant in the top
12,000 characters. It showed a 99% correlation.
• Character R-precision (similar to passage R-precision, but a character-oriented evaluation where R is
the total number of relevant characters not passages). It showed an 88% correlation.
• Passage Fl at 30 passages retrieved showed a 90% correlation.
• Passage precision at 10 passages showed an 80% correlation.
If nothing else, these results should suggest that sites training their systems to optimize passage R-precision
should not be expected to do well on the character bpref measure.
Passage retrieval systems often use fixed-length passages of some number of words or characters, treating
those passages as if they were documents. Some sites tried to generate appropriately sized passages using
HMMs, retrieving and then merging highly ranked adjacent sentences, or looking for runs of text where the
query terms are highly dense. Most sites scored passages and then combined the passage score with the
document score in one way or another.
33
There was substantially more activity in passage retrieval for HARD 2004 than in 2003. However, the
issue of how best to resolve variable-length passage retrieval with variable-length passage "truth" judgments
remains open and begs for substantially more exploration. There are clear problems with the passage R-
precision measure, but the character bpref is also not without issues. Unfortunately, the HARD 2005 track
will be dropping passage retrieval because of funding issues.
11.4 Overall results
When measured by topicality (i.e., when on-topic and/or relevant documents are the target), the top runs
were all automatic and used both the title and description. Some top runs used clarification forms, passage
retrieval, and the (hard) related text information. A few top runs used the geography and genre metadata
fields and a couple used the topic narrative and (soft) related text.
When measured by relevance (i.e., only relevant documents were the target), the top runs used similar
information, though all top runs used the (hard) related text.
For passage retrieval evaluation, the best runs were usually automatic (though the second ranked run
was manual), used the title and scription, incorporated a clarification form, and did passage retrieval.
Interestingly, the fifth ranked run was a document run with no passages marked. Some sites were able to
find advantage to the geography and genre metadata, and some used related text and narrative. Note that
related text (of both kinds) was more often used in top performing document retrieval systems than in top
performing passage retrieval systems.
No top run by any of the measures used the familiarity field.
12 Conclusion
The second year of the HARD track appears to have been much more productive for most sites. With better
training data and a clearer task definition earlier, groups were able to carry out more careful and interesting
research.
The HARD track will continue in TREC 2005. Funding considerations have forced the removal of passage
retrieval from the evaluation. Topics deemed by the Robust track to be difficult will be used rather than
developing new topics, though they will be judged against a new corpus. Familiarity metadata will be
collected, but not used in any particular way by the annotators.
Acknowledgments
The coordination of the HARD track at the CHR would not have been possible without the help of Fernando
Diaz, Mark Smucker, and Courtney Wade. The way the track was organized was by consensus of participating
researchers and they all deserve credit for the shape the track eventually took.
The work at the CHR was supported in part by the Center for Intelligent Information Retrieval, in part
by SPAWARSYSCEN-SD grant number N66001-02-1-8903, and in part by NSF grant number IIS-9907018.
Any opinions, findings and conclusions or recommendations expressed in this material are the author's and
do not necessarily reflect those of the sponsor.
References
[Abdul-Jaleel et al, 2005] Abdul-Jaleel, N., Allan, J., Croft, W. B., Diaz, F., Larkey, L., Li, X., Smucker,
M. D., and Wade, C. (2005). UMass at TREC 2004: Novelty and HARD. In Proceedings of TREC 2001Appears in this volume.
[Belkin et al., 2005] Belkin, N., Chaleva, I., Cole, M., Li, Y.-L., Liu, L., Liu, Y.-H., Muresan, C, Smith,
C, Sun, Y., Yuan, X.-J., and Zhang, X.-M. (2005). Rutgers' HARD track experiences at TREC 2004. In
Proceedings of TREC 2004- Appears in this volume.
34
[Buckley and Voorhees, 2004] Buckley, C. and Voorhees, E. M. (2004). Retrieval evaluation with incomplete
information. In Proceedings of SIGIR, pages 25-32.
[Evans et al., 2005] Evans, D. A., Bennett, J., Montgomery, J., Sheftel, V., Hull, D. A., and Shanahan, J. G.
(2005). TREC-2004 HARD-track experiments in clustering. In Proceedings of TREC 2004. Appears in
this volume.
[Harper et al., 2005] Harper, D. J., Muresan, G., Liu, B., Koychev, I., Wettschereck, D., and Wiratanga,
N. (2005). The Robert Gordon University's HARD track experiments at TREC 2004. In Proceedings of
TREC 2004. Appears in this volume.
[He et al, 2005] He, D., Demner-Pushman, D., Oard, D. W., Karakos, D., and Dhudanpur, S. (2005). Im-
proving passage retrieval using interactive elicitation and statistical modeling. In Proceedings of TREC2004- Appears in this volume.
[Huang et al., 2005] Huang, X., Huang, Y. R., Wen, M., and Zhong, M. (2005). York University at TREC2004: HARD and genomics tracks. In Proceedings of TREC 2004- Appears in this volume.
[Jiang and Zhai, 2005] Jiang, J. and Zhai, C. (2005). UIUC in HARD 2004 - passage retrieval using HMMs.In Proceedings of TREC 2004- Appears in this volume.
[Kelly et al., 2005] Kelly, D., Dollu, V. D., and Fu, X. (2005). University of North Carolina's HARD track
experiments at TREC 2004. In Proceedings of TREC 2004- Appears in this volume.
[Levow, 2005] Levow, G.-A. (2005). University of Chicago at TREC 2004: HARD track. In Proceedings of
TREC 2004. Appears in this volume.
[Rode and Hiemstra, 2005] Rode, H. and Hiemstra, D. (2005). Conceptual language models for context-
aware text retrieval. In Proceedings of TREC 2004- Appears in this volume.
[Sun et al., 2005] Sun, L., Zhang, J., and Sun, Y. (2005). ISCAS at TREC-2004: HARD track. In Proceedings
of TREC 2004. Appears in this volume.
[Vechtomova and Karamuftuoglu, 2005] Vechtomova, O. and Karamuftuoglu, M. (2005). Approaches to high
accuracy retrieval: Phrase-based search experiments in the HARD track. In Proceedings of TREC 2004-
Appears in this volume.
[Voorhees, 2005] Voorhees, E. M. (2005). Overview of the TREC 2004 question answering track. In Pro-
ceedings of TREC 2004- Appears in this volume.
[Yanget al., 2005] Yang, K., Yu, N., Wead, A., La Rowe, G., Li, Y.-H., Friend, C, and Lee, Y. (2005).
WIDIT in TREC-2004 genomics, HARD, robust and web tracks. In Proceedings of TREC 2004. Appears
in this volume.
[Zaragoza et al., 2005] Zaragoza, H., Craswell, N., Taylor, M., Saria, S., and Robertson, S. (2005). Microsoft
Cambridge at TREC-13: Web and HARD tracks. In Proceedings of TREC 2004. Appears in this volume.
35
Overview of the TREC 2004 Novelty Track
Ian Soboroff
National Institute of Standards and Technology
Gaithersburg, MD 20899
Abstract
TREC 2004 marks the third and final year for the
novelty track. The task is as follows: Given a TRECtopic and an ordered list of documents, systems must
find the relevant and novel sentences that should be
returned to the user from this set. This task inte-
grates aspects of passage retrieval and information
filtering. As in 2003, there were two categories of top-
ics - events and opinions - and four subtasks which
provided systems with varying amounts of relevance
or novelty information as training data. This year,
the task was made harder by the inclusion of some
number of irrelevant documents in document sets.
Fourteen groups participated in the track this year.
1 Introduction
The novelty track was introduced in TREC 2002 [1].
The basic task is as follows: given a topic and an
ordered set of documents segmented into sentences,
return sentences that are both relevant to the topic
and novel given what has already been seen. This
task models an application where a user is skimming
a set of documents, and the system highlights new,
on-topic information.
There are two problems that participants must
solve in the novelty track. The first is identifying
relevant sentences, which is essentially a passage re-
trieval task. Sentence retrieval differs from documentretrieval because there is much less text to work with,
and identifying a relevant sentence may involve exam-ining the sentence in the context of those surrounding
it. We have specified the unit of retrieval as the sen-
tence in order to standardize the task across a variety
of passage retrieval approaches, as well as to simplify
the evaluation.
The second problem is that of identifying those rel-
evant sentences that contain new information. Theoperational definition of "new" is information that
has not appeared previously in this topic's set of
documents. In other words, we allow the system to
assume that the user is most concerned about find-
ing new information in this particular set of docu-
ments and is tolerant of reading information he al-
ready knows because of his background knowledge.
Since each sentence adds to the user's knowledge, and
later sentences are to be retrieved only if they con-
tain new information, novelty retrieval resembles a
filtering task.
To allow participants to focus on the filtering and
passage retrieval aspects separately, the novelty track
has four different tasks. The base task was to identify
all relevant and novel sentences in the documents.
The other tasks provided varying amounts of relevant
and novel sentences as training data.
The track has changed slightly from year to year.
The first run in 2002 used old topics and rele-
vance judgments, with sentences judged by new as-
sessors [1]. TREC 2003 included separate tasks,
made the document ordering chronological rather
than relevance-based, and introduced new topics and
the different topic types [2]. This year, the major
change is the inclusion (or perhaps re-introduction)
of irrelevant documents into the document sets.
2 Input Data
The documents for the novelty track are taken from
the AQUAINT collection. This collection is unique in
that it contains three news sources from overlapping
time periods: New York Times News Service (Jun
1998 - Sep 2000), AP (also Jun 1998 - Sep 2000),
and Xinhua News Service (Jan 1996 - Sep 2000). As
a result, this collection exhibits greater redundancy
than other TREC collections, and thus less novel in-
formation, increasing the reahsm of the task.
The NIST assessors created fifty new topics for
the 2004 track. As was done last year, the top-
ics were of two types. Twenty-five topics concerned
events, such as India and Pakistan's nuclear tests
in 1998, and twenty-five topics focused on opinions
36
about controversial subjects such as the safety of irra-
diated food and the so-called "abortion pill" RU-486.
The topic type was indicated in the topic descrip-
tion by a <toptype> tag. The assessors, in creating
their topics, searched the AQUAINT collection us-
ing WebPRISE, NIST's IR system, and collected 25
documents they deemed to be relevant to the topic.
They also labeled some documents as irrelevant, andall documents judged irrelevant and ranked above the
25 relevant documents were included in the documentsets. Note that this means that the irrelevant docu-
ments are close matches to the relevant ones, and not
random irrelevant documents.
Once selected, the documents were ordered chrono-
logically. (Chronological ordering is achieved triv-
ially in the AQUAINT collection by sorting documentIDs.) The documents were then split into sentences,
each sentence receiving an identifier, and all sentences
were concatenated together to produce the documentset for a topic.
3 Task Definition
There are four tasks in the novelty track:
Teisk 1. Given the set of documents for the topic,
identify all relevant and novel sentences.
Task 2. Given the relevant sentences in all docu-
ments, identify all novel sentences.
Task 3. Given the relevant and novel sentences in
the first 5 documents only, find the relevant
and novel sentences in the remaining documents.
Note that since some documents are irrelevant,
there may not be any relevant or novel sentences
in the first 5 documents for some topics.
Tcisk 4. Given the relevant sentences from all doc-
uments, and the novel sentences from the first
5 documents, find the novel sentences in the re-
maining documents.
These four tasks allowed the participants to test
their approaches to novelty detection given different
levels of training: none, partial, or complete relevance
information, and none or partial novelty information.
Participants were provided with the topics, the set
of sentence-segmented documents, and the chronolog-
ical order for those documents. For tasks 2-4, train-
ing data in the form of relevant and novel "sentence
qrels" were also given. The data, were released and
results were submitted in stages to limit "leakage"
of training data between tasks. Depending on the
task, the system was to output the identifiers of sen-
tences which the system determined to contain rele-
vant and/or novel relevant information.
4 Evaluation
4.1 Creation of truth data
Judgments were created by having NIST eissessors
manually perform the first task. Prom the concate-
nated document set, the eissessor selected the relevant
sentences, then selected those relevant sentences that
were novel. Each topic was independently judged by
two different Eissessors, the topic author and a "sec-
ondary" assessor, so that the effects of different hu-
man opinions could be assessed.
The assessors only judged sentences in the relevant
documents. Since, by the definition of relevance in
TREC, a document containing any relevant informa-
tion would itself be relevant, the assessors would not
miss any relevant information by not judging the sen-
tences in the irrelevant documents. This does give the
second assessor some advantage against systems at-
tempting task 1, since the assessor was not confronted
with irrelevant documents in the sentence judging
phase.
Since the novelty task requires systems to auto-
matically select the same sentences that were selected
manually by the assessors, it is important to analyze
the characteristics of the manually-created truth data
in order to better understand the system results. Thefirst novelty track topics (in 2002) were created us-
ing topics from old TRECs and relevant documents
from manual TREC runs, and the sentences judg-
ments were made by new assessors. Those topics had
very few relevant sentences and consequently neeirly
every relevant sentence was novel. Last year's topics,
which were each newly developed and judged by a
single assessor, resulted in topics with much more rea-
sonable levels of relevant and new information. This
year the inclusion of irrelevant documents means that
fewer sentences are relevant. Somewhat surprisingly,
perhaps, the fraction of relevant sentences which are
novel is lower than last year as well.
Table 1 shows the number of relevant and novel
sentences selected for each topic by each of the two
assessors who worked on that topic. The column
marked "assr-l" precedes the results for the primary
assessor, whereas "assr-2"" precedes those of the sec-
ondary assessor. The column marked "rel" is the
number of sentences selected as relevant: the next
37
Table 1: Analysis of relevant and novel sentences by topic
51 CCF- 1 rpl % tntfll new CloDl ^ rel % tntfll new % rel
IN OJ. X-J fifiQuuy 1 07XU f X tj.yy 9fi 94 '^0 R 1 1
9
X X ^ 1 fi 74xu. 1 *x ^8OO "^^ Q^oo.yo
ii Do OO 1pill 1 nfixuu 1 ^ 8Qxo.oy ^1O X 9Q 9^^y . ^o p xou 90 "^Q^u.oy SfiOU fi"? 94UO.Z4
1 90Qizzy pXL/ 1 Q8lyo 1 fi 1
1
lO.X X 71/ X OO. OU Rij ^84004 "^1 94ox .^4 994ZZ4 oo.oo
L\ OO Hi ooo c OO 1 0 4^1XU.40 91^ X ^7 ^0O / .OU FXJJ Qfiyo 1 7 QlX 1 .yx 4fi40 47 Q94 ( .yz
x\ oo Hi iyu4 PXLi xyo 1 0 9Qxu.zy in^xuo ^9 A xoo fi QQu.yy 474 / 00.04
O O O O O pr,> > > > > "2c c c c c ££ £ E 5 £ p3 Z3 3 Z) 3 -IX I I X X "
H-l— I— I— cocol-co^ccocQctrc cere
§ u o oO
3 3
o o o XZ Z Zo o o(0 (0 CO
S 5 5o o o3 3 3
lO CO CO CO CO (NCO
tt oo o .-s: O O ,tO (0 (0
oo ootcocyiooEE E E 1 1 S S E3 3 3 3 3
X =;;=• X
CO CO CO CO55 t c r
E £ CO 5£ CO CO
sT :± ^ in oa> in t)
Precision + Recall
Figure 5: Scores for Task 3, ordered by average F score for relevant sentence retrieval.
49
1.0 J I I I I I I L
Task 4
J I I I L J I I I I I I I I I I L
0.8 -
0.6 -
0)
ooCO
u.
0.4 -
0.2 -
0.0
OOOOOOOOOOO0_Q_Q_Q.
+ + + + +
^0 o
5O O 0 o o 6
+ + + + + + + + + +
o o o
+ +
T—
r
1 1 T"
•>- CM CMTt
•«t > -"l-O O O> z >
-|—
r
"T—
r
T—
r
T—
r
CO
EC CC DC
If)
o>cDCO O O ^I
> tO O? c0 DC
1-
o
CO
o>cDC
Z2I
<1-
o(0
5o
ii X
>o
CC CO
o_J x:
I
CM 1-
tO Oo oE E3 3
3 D 3
o
o
CO Q.
5 O
2 O
O
o
F OPrecision + Return all relevant, F = 0.541 (P = 0.39, R = 1 .0)
Figure 6: Scores for Task 4, against a baseline of returning all relevant sentences as novel.
50
o
8
8
' Relevant ' ' Novel '' Novel '
Task 1 Task 3 Task 1 Task 3 Task 2 Task 4
Figiire 7: Comparison of F scores between Tasks 1 and 3, and between TelsIcs 2 and 4.
51
Overview of the TREC 2004 Question Answering Track
Ellen M. Voorhees
National Institute of Standards and Technology
Gaithersburg, MD 20899
Abstract
The TREC 2004 Question Answering track contained a single task in which question series were used to define a
set of targets. Each series contained factoid and Hst questions and related to a single target. The final question in the
series was an "Other" question that asked for additional information about the target that was not covered by previous
questions in the series. Each question type was evaluated separately with the final score a weighted average of the
different component scores. Applying the combined measure on a per-series basis produces a QA task evaluation that
more closely mimics classic document retrieval evaluation.
The goal of the TREC question answering (QA) track is to foster research on systems that return answers them-
selves, rather than documents containing answers, in response to a question. The track started in TREC-8 (1999), with
the fi rst several editions of the track focused on factoid questions. A factoid question is a fact-based, short answer
question such as How many calories are there in a Big Mac?. The task in the TREC 2003 QA track was a combined
task that contained list and defi nition questions in addition to factoid questions [3]. A list question asks for different
instances of a particular kind of information to be returned, such as List the names of chewing gums. Answering
such questions requires a system to assemble an answer from information located in multiple documents. A defi nition
question asks for interesting information about a particular person or thing such as Who is Vlad the Impaler? or What
is a golden parachute?. Defi nition questions also require systems to locate information in multiple documents, but in
this case the information of interest is much less crisply delineated.
The TREC 2003 track was the fi rst large-scale evaluation of list and defi nition questions, and the results of the
track demonstrated that not only are list and defi nition questions challenging tasks for systems, but they present
evaluation challenges as well. Defi nition task scores contained a relatively large error term in comparison to the
size of the difference between scores of different systems. For example, the analysis of the TREC 2003 defi nition
evaluation performed as part of TREC 2003 showed that an absolute difference in scores of 0. 1 was needed to have
95% confi dence that the comparison represented a true difference in scores when the test set contained 50 questions.
Yet relatively few of the runs submitted to TREC 2003 differed by this amount. Reducing the error term requires
more defi nition questions in the test set. The task for the TREC 2004 QA track was designed to accommodate more
defi nition questions while keeping a mix of different question types.
The TREC 2004 test set contained factoid and list questions grouped into different series, where each series had
the target of a defi nition associated with it. Each question in a series asked for some information about the target. In
addition, the fi nal question in each series was an explicit "other" question, which was to be interpreted as "Tell meother interesting things about this target I don't know enough to ask directly". This last question is roughly equivalent
to the defi nition questions in the TREC 2003 task.
The reorganization of the combined task into question series has an important additional benefi t. Each series is a
(limited) abstraction of an information dialog in which the user is trying to defi ne the target. The target and earlier
questions in a series provide the context for the current question. Context processing is an important element for
question answering systems to possess, but its use has not yet been successfully incorporated into the TREC QAtrack [2].
The remainder of this paper describes the TREC 2004 QA track in more detail. The next section describes the
question series that formed the basis of the evaluation. The following section describes the way the individual ques-
tion types were evaluated and gives the scores for the runs for that component. Section 3 summarizes the technical
52
3 Hale Bopp comet
3.1 FACTOID When was the comet discovered?
3.2 FACTOID How often does it approach the earth?
3.3 LIST In what countries was the comet visible on its last return?
3.4 OTHER21 Club Med
21.1 FACTOID How many Club Med vacation spots are there worldwide?
21.2 LIST List the spots in the United States.
21.3 FACTOID Where is an adults-only Club Med?21.4 OTHER
22 Franz Kafka
22.1 FACTOID Where was Franz Kafka bom?22.2 FACTOID When was he bom?22.3 FACTOID What is his ethnic background?
22.4 LIST What books did he author?
22.5 OTHER
Figure 1: Sample question series from the test set. Series 3 has a THING as a target, series 21 has an ORGANIZATIONas a target, and series 22 has a PERSON as a target.
approaches used by the systems to answer the questions. Section 4 looks at the advantages of evaluating mns using a
per-series combined score rather than an overall combined score. The fi nal section looks at the future of the track.
1 Question Series
The TREC 2004 QA track consisted of a single task, providing answers for each question in a set of question series.
A question series consisted of several factoid questions, zero to two list questions, and exactly one Other question.
Associated with each series was a defi nition target. The series a question belonged to, the order of the question in the
series, and the type of each question (factoid, list, or Other) were all explicitly encoded in the XML format used to
describe the test set. Example series (minus the XML tags) are shown in fi gure 1
.
The question series were developed as follows. NIST staff searched search engines logs' for defi nition targets. Atarget was a person, an organization, or thing that was a plausible match for the scenario assumed for the task. The task
scenario was the same as in the 2003 track: the questioner was an adult, a native speaker of English, and an "average"
reader of US newspapers who was looking for more information about a term encountered while reading the paper.
The set of candidate targets were then given to the assessors, the humans who act as surrogate users and judge the
system responses. An assessor selected a target and wrote down questions regarding things he or shee would want to
know about the target. The assessor then searched the document collection looking for answers to those questions,
plus recording other information about the target that had not asked about but they found interesting. For the most
part, the assessors created the questions before doing any searching. However, if the assessor did not know anything
about the target (and therefore could create no questions), they fi rst did a Google search to leara about the target, then
created questions, and fi nally searched the document collection. The document collection was the same document set
used by the participants as the source of answers, the AQUAINT Corpus of English News Text (LDC catalog number
LDC2002T31).
NIST staff reviewed the information found by the assessors and constructed the fi nal question series. Because
most questions in the fi nal test set had to contain answers in the document collection, and there needed to be suffi cient
"other" information for the fi nal question in the series, the fi nal series were heavily edited versions of the assessors'
original series. This process proved to be more time-consuming than expected, so a few of the question series were
constructed directly from searches of the document collection (i.e., the target was not selected from the logs and the
questions were developed only after the search).
'The search engine logs were donated by Abdur Chowdhury of AOL and Susan Dumais of Microsoft Research for the TREC 2003 track.
53
Table 1 : Targets of the 65 question series.
SI Crips S2 Fred Durst S3 Hale Bopp comet
S4 James Dean S5 AARP S6 Rhodes scholars
S7 agouti S8 Black Panthers S9 Insane Clown Posse
SIO prions Sll the band Nirvana S12 Rohm and Haas
SB Jar Jar Binks S14 Horus S15 Rat Pack
S16 cataract S17 International Criminal Court S18 boxer Floyd Patterson
S19 Kibbutz S20 Concorde S21 Club MedS22 Franz Kafka S23 Gordon Gekko S24 architect Frank Gehry
S25 Harlem Globe Trotters S26 Ice-T S27 Jennifer Capriati
S28 Abercrombie and Fitch S29 'Tale of Genji' S30 minstrel Al Jolson
S31 Jean Harlow S32 Wicca S33 Florence Nightingale
S34 Amtrak S35 Jack Welch S36 Khmer Rouge
S37 Wiggles S38 quarks S39 The Clash
S40 Chester Nimitz S41 Teapot Dome scandal S42 USS Constitution
S43 Nobel prize S44 Sacajawea S45 International Finance Corporation
S46 Heaven's Gate S47 Bashar Assad S48 Abu Nidal
S49 Carlos the Jackal S50 Cassini space probe S51 Kurds
S52 Burger King S53 Conde Nast S54 Eileen Marie Collins
S55 Walter Mosley S56 Good Friday Agreement S57 Liberty Bell 7
S58 philanthropist Alberto Vilar S59 Public Citizen S60 senator Jim Inhofe
S61 Muslim Brotherhood S62 Berkman Center for Internet and Society S63 boll weevil
S64 Johnny Appleseed S65 space shuttles
The fi nal test set contained 65 series; the targets of these series are given in table 1. Of the 65 targets, 23 are
PERSONS, 25 are ORGANIZATIONS, and 17 are THINGs. The series contain a total of 230 factoid questions, 56
list questions, and 65 (one per target) Other questions. Each series contains at least 4 questions (counting the Other
question), with most series containing 5 or 6 questions. The maximum number of questions in a series is 10.
The question series used in the TREC 2004 track are similar to the QACIAD challenge (Question Answering
Challenge for Information Access Dialogue) of NTCIR4 [1]. However, there are some important differences. The
heavy editing of the assessors' original questions required to make a usable evaluation test set means the TREC series
are not true samples of the assessors' original interests in the target. There were many questions that were eliminated
because they did not have answers in the document collection or because they did not meet some other evaluation
criterion (for example, the answers for many of the original list questions were not named entities). The TREC series
are also not true samples of naturally occurring user-system dialog. In a true dialog, the user would most likely mention
answers of previous questions in later questions, but the TREC test set specifi cally did not do this. This appears as a
stilted conversational style when viewed from the perspective of true dialog.
Participants were required to submit retrieval results within one week of receiving the test set. All processing of
the questions was required to be strictly automatic. Systems were required to process series independently from one
another, and required to process an individual series in question order. That is, systems were allowed to use questions
and answers from earlier questions in a series to answer later questions in that same series, but could not "look ahead"
and use later questions to help answer earlier questions. As a convenience for the track, NIST made available document
rankings of the top 1000 documents per target as produced using the PRISE document retrieval system and the target
as the query. Sixty-three runs from 28 participants were submitted to the track.
2 Component Evaluations
The questions in the series were tagged as to which type of question they were because each question type had its
own response format and evaluation method. The fi nal score for a run was computed as a weighted average of the
component scores. The individual component evaluations for 2004 were identical to those used in the TREC 2003 QA
54
track, and are briefly summarized in this section.
2.1 Factoid questions
The system response for a factoid question was either exactly one [doc-id, answer-string] pair or the literal string 'NIL'
.
Since there was no guarantee that a factoid question had an answer in the document collection, NIL was returned by the
system when it believed there was no answer. Otherwise, answer-string was a string containing precisely an answer
to the question, and doc-id was the id of a document in the collection that supported answer-string as an answer.
Each response was independently judged by two human assessors. When the two assessors disagreed in their
judgments, a third adjudicator (a NIST staff member) made the fi nal determination. Each response was assigned
exactly one of the following four judgments:
incorrect: the answer string does not contain a right answer or the answer is not responsive;
not supported: the answer string contains a right answer but the document returned does not support that answer;
not exact: the answer string contains a right answer and the document supports that answer, but the string contains
more than just the answer or is missing bits of the answer;
correct: the answer string consists of exactly the right answer and that answer is supported by the document returned.
To be responsive, an answer string was required to contain appropriate units and to refer to the correct "famous" entity
(e.g., the Taj Mahal casino is not responsive when the question asks about "the Taj Mahal"). NIL responses are correct
only if there is no known answer to the question in the collection and are incorrect otherwise. NIL is correct for 22 of
the 230 factoid questions in the test set.
The main evaluation score for the factoid component is accuracy, the fraction of questions judged correct. Also
reported are the recall and precision of recognizing when no answer exists in the document collection. NIL precision
is the ratio of the number of times NIL was returned and correct to the number of times it was returned, whereas NIL
recall is the ratio of the number of times NIL was returned and correct to the number of times it was correct (22). If
NIL was never returned, NIL precision is undefi ned and NIL recall is 0.0.
Table 2 gives evaluation results for the factoid component. The table shows the most accurate run for the factoid
component for each of the top 10 groups. The table gives the accuracy score over the entire set of factoid questions as
well as NIL precision and recall scores. In addition, the table reports accuracy for two subsets of the factoid questions:
those factoid questions that were the fi rst question in their series (Initial), and those factoid questions that were not
the first questions in their series (Non-Initial). As suggested by QACIAD [1], these last two accuracy scores mayindicate whether systems had diffi culty with context processing in that the fi rst question in a series is usually more
fully specifi ed than later questions in a series. (But note there are only 62 initial factoid questions and 168 non-initial
factoid questions.)
2.2 List questions
A list question can be thought of as a shorthand for asking the same factoid question multiple times. The set of all
correct, distinct answers in the document collection that satisfy the factoid question is the correct answer for the list
question.
A system's response for a list question was an unordered set of [doc-id, answer-string] pairs such that each answer-
string was considered an instance of the requested type. Judgments of incorrect, unsupported, not exact, and correct
were made for individual response pairs as in the factoid judging. The assessor was given one run's entire list at a time,
and while judging for correctness also marked a set of responses as distinct. The assessor arbitrarily chose any one of
equivalent responses to be distinct, and the remainder were not distinct. Only correct responses could be marked as
distinct.
The fi nal set of correct answers for a list question was compiled from the union of the correct responses across all
runs plus the instances the assessor found during question development. For the 55 list questions used in the evaluation
(one list question was dropped because the assessor decided there were no correct answers during judging), the average
55
Table 2: Evaluation scores for runs with the best factoid component.
Run Tap Submitter All
Accuracy
Initial Non-Initial NIL Prec NTT Recall
led 0 770 0.839 0.744 \j.O.J 1
uwbqitekat04 Univ. of Wales, Bangor 0.643 0.694 0.625 0.247 0.864
NUSCHUAl National Univ. of Singapore 0.626 0.710 0.595 0.333 0.273
mk2004qarl Saarland University 0.343 0.419 0.315 0.177 0.500
FDUQA13a Fudan University (Wu) 0.257 0.355 0.220 0.167 0.091
KUQAl Korea University 0.222 0.226 0.220 0.042 0.045
shef04afv University of Sheffi eld 0.213 0.177 0.226 0.071 0.136
Table 3: Average F scores for the list question component. Scores are given for the best run from the top 10 groups.
Run Tag Submitter F
Iccl Language Computer Corp. 0.622
NUSCHUA2 National Univ. of Singapore 0.486
uwbqitekat04 Univ. of Wales, Bangor 0.258
IBMl IBM Research 0.200
KUQAl Korea University 0.159
FDUQA13a Fudan University (Wu) 0.143
MITRE2004B Mitre Corp. 0.143
UNTQA04M1 University of North Texas 0.128
mk2004qar3 Saarland University 0.125
shef04afv University of Sheffi eld 0.125
number of answers per question is 8.8, with 2 as the smallest number of answers, and 41 as the maximum number
of answers. A system's response to a list question was scored using instance precision (IP) and instance recall (IR)
based on the list of known instances. Let S be the the number of known instances, D be the number of correct, distinct
responses returned by the system, and N be the total number of responses returned by the system. Then IP — D/Nand IR — D/S. Precision and recall were then combined using the F measure with equal weight given to recall and
precision:
2x IP X IR~ IP + IR
The score for the list component of a run was the average F score over the 55 questions. Table 3 gives the average Fscores for the run with the best list component score for each of the top 10 groups.
As happened last year, some submitted runs contained identical list question components as another run submitted
by the same group. Since assessors see the lists for each run separately, it can happen that identical components
receive different scores. NIST tries to minimize judging differences by making sure the same assessor judges all runs
and completes judging one question before moving on to another, but differences remain. These differences are one
measure of the error inherent in the evaluation. NIST does not adjust the judgments to make identical runs match
because then we wouldn't know what the naturally occurring error rate was, and doing so would bias the scores of
systems that submitted identical component runs.
There were 15 pairs of runs with identical list components. Seven pairs had identical average F scores, though
some of those seven did have individual questions judged differently. The largest difference in average F scores for
identical list components was 0.006, and the largest number of individual questions judged differently for a single run
pair was 7.
56
2.3 Other questions
The Other questions were evaluated using the same methodology as the TREC 2003 defi nition questions. A system's
response for an Other question was an unordered set of [doc-id, answer-string] pairs as in the list component. Each
string was presumed to be a facet in the defi nition of the series' target that had not yet been covered by earlier
questions in the series. The requirement to not repeat information already covered by earlier questions in the series
made answering Other questions somewhat more diffi cult than answering TREC 2003 defi nition questions.
Judging the quality of the systems' responses was done in two steps. In the fi rst step, all of the answer strings from
all of the systems' responses were presented to the assessor in a single list. Using these responses and the searches
done during question development, the assessor created a list of information nuggets about the target. An information
nugget is an atomic piece of information about the target that is interesting (in the assessor's opinion) and was not part
of an earlier question in the series or an answer to an earlier question in the series. An information nugget is atomic
if the assessor can make a binary decision as to whether the nugget appears in a response. Once the nugget list was
created for a target, the assessor marked some nuggets as vital, meaning that this information must be returned for a
response to be good. Non-vital nuggets act as don't care conditions in that the assessor believes the information in the
nugget to be interesting enough that returning the information is acceptable in, but not necessary for, a good response.
In the second step ofjudging the responses, the assessor went through each system's response in turn and marked
which nuggets appeared in the response. A response contained a nugget if there was a conceptual match between the
response and the nugget; that is, the match was independent of the particular wording used in either the nugget or the
response. A nugget match was marked at most once per response—if the response contained more than one match for
a nugget, an arbitrary match was marked and the remainder were left unmarked. A single [doc-id, answer-string] pair
in a system response could match 0, 1, or multiple nuggets.
Given the nugget list and the set of nuggets matched in a system's response, the nugget recall of the response is the
ratio of the number of matched nuggets to the total number of vital nuggets in the list. Nugget precision is much more
diffi cult to compute since there is no effective way of enumerating all the concepts in a response. Instead, a measure
based on length (in non-white space characters) is used as an approximation to nugget precision. The length-based
measure starts with an initial allowance of 100 characters for each (vital or non-vital) nugget matched. If the total
system response is less than this number of characters, the value of the measure is 1.0. Otherwise, the measure's value
decreases as the length increases using the function 1 — The fi nal score for an Other question was
computed as the F measure with nugget recall three times as important as nugget precision:
10 X precision x recall
9 X precision -I- recall
The score for the Other question component was the average F(/3 = 3) score over 64 Other questions. The Other
question for series S7 was mistakenly left unjudged, so it was removed from the evaluation. Table 4 gives the average
F(/? = 3) score for the best scoring Other question component for each of the top 10 groups.
As with list questions, a system's response for an Other question must be judged as a unit, so identical responses
may receive different scores. There were 13 pairs of runs with identical Other question components. The differences
between the run pairs' average F(/3 = 3) scores were {0.012, 0.0, 0.0, 0.0, 0.0, 0.007, 0.0, 0.007, .003, 0.007, 0.0,
0.012, 0.003}, and the number of Other questions that received a different score between the run pairs was {12, 0, 0,
0, 0, 5, 5, 4, 3, 3, 10, 4, 1} respectively.
2.4 Combined weighted average
The fi nal score for a QA run was computed as a weighted average of the three component scores:
FinalScore = .5 x FactoidAccuracy + .25 x ListAveF + .25 x OtherAveF.
Since each of the component scores ranges between 0 and 1, the fi nal score is also in that range. Table 5 shows the
combined scores for the best run for each of the top 10 groups. Also given in the table are the weighted component
scores that make up the fi nal sum.
57
Table 4: Average ¥{0 = 3) scores for the Other questions component. Scores are given for the best run from the top
10 groups.
Run Tag Submitter F(^ = 3)
NUSCHUA2 National Univ. of Singapore 0.460
FDUQAlSa Fudan University (Wu) 0.404
NSAQACTISl National Security Agency 0.376
ShefMadCow20 University of Sheffi eld 0.321
UNTQA04M3 University of North Texas 0.307
roMi IBM Research 0.285
KUQA3 Korea University 0.247
Iccl Language Computer Corp. 0.240
clr04rl CL Research 0.239
mk2004qar3 Saarland University 0.211
Table 5: Weighted component scores and fi nal combined scores for QA task runs. Scores are given for the best run
from the top 10 groups.
Weighted Component Score Final
Run Tag Submitter Factoid List Odier Score
Iccl Language Computer Corp. 0.385 0.155 0.060 0.601
NUSCHUAl National Univ. of Singapore 0.313 0.120 0.112 0.545
uwbqitekat04 Univ. of Wales, Bangor 0.322 0.065 0.000 0.386
IBMl IBM Research 0.157 0.050 0.071 0.278
FDUQA13a Fudan University (Wu) 0.129 0.036 0.101 0.265
mk2004qar3 Saarland University 0.172 0.031 0.053 0.256
mitl MIT 0.157 0.030 0.046 0.232
irst04higher rrc-irst 0.145 0.026 0.052 0.223
shef04afv University of Sheffi eld 0.106 0.031 0.078 0.216
KUQAl Korea University 0.111 0.040 0.061 0.212
58
3 System Approaches
The overall approach taken for answering factoid questions has remained unchanged for the past several years. Systems
generally determine the expected answer type of the question, retrieve documents or passages likely to contain answers
to the question using important question words and related terms as the query, and then perform a match between the
question words and retrieved passages to extract the answer. While the overall approach has remained the same,
individual groups continue to refi ne their techniques for these three steps, increasing the coverage and accuracy of
their systems.
Most groups use their factoid-answering system for list questions, changing only the number of responses returned
as the answer. The main issue is determining the number ofresponses to return. Systems whose matching phase creates
a question-independent score for each passage return all answers whose score is above an empirically determined
threshold. Other systems return all answers whose scores were wi..iin an empirically determined fraction of the top
result's score.
The fact that target and list questions did not necessarily explicitly include the target of the question was a new
diffi culty in this year's track. For the document/passage retrieval phase, most systems simply appended the target to
the query. This was an effective strategy since in all cases the target was the correct domain for the question, and most
of the retrieval methods used treat the query as a simple set of keywords. There were a variety of approaches taken
by different systems to address this diffi culty in phases that require more detailed processing of the question. While a
few systems made no attempt to include the target in the question, a much more common approach was to append the
target to the question. Another common approach was to replace all pronouns in the questions with the target. While
many (but not all) pronouns in the questions did in fact refer to the target, this approach suffered when the question
used a defi nite noun phrase rather than a pronoun to refer to the target (e.g., using "the band" when the target was
Nirvana). Finally, other systems tried varying degrees of true anaphora resolution to appropriately resolve references
in the questions. It is diffi cult to judge how much benefi t these systems received from this more extensive processing
since the majority of pronoun references were to the target.
Systems generally used the same techniques as were used for TREC 2003 's defi nition questions to answer the Other
questions. Most systems fi rst retrieve passages about the target using a recall-oriented retrieval search. Subsequent
processing reduces the amount of material returned. Some systems used pattern-matching to locate defi nition-content
in text. These patterns, such as looking for copular constructions and appositives, were either hand-constructed or
learned from a training corpus. Systems also looked to eliminate redundant information, using either word overlap
measures or document summarization techniques. Unlike last year, answers to previous questions in the series had to
be incorporated as part of the redundant information for this year's task. The output from the redundancy-reducing
step was then returned as the answer for the Other question.
4 Per-series Combined Weighted Scores
The series play no role in computing the combined average score as above. That is, questions are treated independently
without regard to the series they appear in for scoring purposes. This is unfortunate since each individual series is an
abstraction of a single user's interaction with the system. Evaluating over the individual series should provide a more
accurate representation of the effectiveness of the system from an individual user's perspective. This section examines
the effectiveness of a per-series evaluation.
Since each series is a mixture of different question types, we can compute the weighted average score on a per-
series basis, and take the average of the per-series scores as the fi nal score for the run. Note that the average per-
series weighted score (call this the per-series score) will not in general be equal to the fi nal score computed as the
weighted average of the three component scores (the global score) since the two averages emphasize different things.
The global score gives equal weight to individual questions within a component. The per-series score gives equal
weight to each series. (This is the same difference between micro- and macro-averaging of document retrieval scores.)
To compute the combined score for an individual series that contained all three question types, the same weighted
average of the different question types was used, but only the scores for questions belonging to the series were part
of the computation. For those series that did not contain any list questions, the weighted score was compuied as
.67 X FactoidAccuracy + .33 x OtherF. All of series S7 was eliminated from the evaluation since that was the series
59
Table 6: Per-series scores for QA task runs. Scores are given for the best run from the top 10 groups. Also given is the
global score (as given in Table 5) for comparison.
Run Tag Submitter Per-series Global
Iccl Language Computer Corp. 0.609 0.601
NUSCHUAl National Univ. of Singapore 0.557 0.545
uwbqitekat04 Univ. of Wales, Bangor 0.401 0.386
ffiMl IBM Research 0.289 0.278
FDUQA13a Fudan University (Wu) 0.289 0.265
mk2004qar3 Saarland University 0.271 0.256
mitl MIT 0.253 0.232
irst04higher rrc-irst 0.239 0.223
shef04afv University of Sheffi eld 0.230 0.216
NSAQACTISl National Security Agency 0.226 0.211
whose Other question was not evaluated.
Table 6 shows the per-series score for the best run for each of the top 10 groups. The global score is repeated in
the table for comparison. For the particular set of runs shown in the table, all of the runs rank in the same order by the
two scoring methods, except that the tenth run is different for the two schemes (the NSAQACTISl run edges out the
KUQAl run when using the per-series score). The absolute value of the per-series score is somewhat greater than the
global score for these runs, though it is possible for the global score to be the greater of the two.
Each individual series has only a few questions, so the combined weighted score for an individual series will be
much less stable than the global score. But the average of 64 per-series scores should be at least as stable as the overall
combined weighted average and has some additional advantages. The per-series score is computed at a small enough
granularity to be meaningful at the task-level (i.e., each series representing a single user interaction), and at a large
enough granularity for individual scores to be meaningful. Figure 2 shows a box-and-whiskers plot of the per-series
scores across all runs for each series. A box in the plot shows the extent of the middle half of the scores for that series,
with the median score indicated by the line through the box. The dotted lines (the "whiskers") extend to a point that is
1.5 times the interquartile distance, or the most extreme score, whichever is less. Extreme scores that are greater than
the 1.5 times the interquartile distance are plotted as circles. The plot shows that only a few series (S21, S25, S37,
S39) have median scores of 0.0. This is in sharp contrast to the median scores of individual questions. For factoid
questions, 212 of the 230 questions (92.2%) have a zero median; for list questions 39 of 55 questions (70.9%) have a
zero median; and for Other questions 41 of 64 questions (64.1%) have a zero median.
One of the hypotheses during question development was that system effectiveness would depend on the type of
target. For example, PERSON targets may be easier for systems to defi ne since the set of information desired for a
person may be more standard then the set of information desired for a THING. This hypothesis has little support in
the overall results of the track (there may be individual systems that show stronger dependencies). The average of the
average per-series score across all runs and all series is 0.187. The averages for series restricted to particular target
types are 0.184 for PERSON targets, 0.179 for ORGANIZATION targets, and 0.206 for THING targets.
5 Future of the QA Track
Several concerns regarding the TREC 2005 QA track were raised during the TREC 2004 QA breakout session. Since
the TREC 2004 task was rather different from previous years' tasks, there was the desire to repeat the task largely
unchanged. There was also the desire to build infrastructure that would allow a closer examination of the role document
retrieval techniques play in supporting QA technology. As a result of this discussion, the main task for the 2005 QAtrack was decided to be essentially the same as the 2004 task in that the test set will consist of a set of question series
where each series asks for information regarding a particular target. As in TREC 2004, the targets will include people,
organizations, and other entities; unlike TREC 2004 the target can also be an event. Events were added since the
document set from which the answers are to be drawn are newswire articles. Each question series will consist of some
60
o oo
I
I
C
o
o oo
o
- - €H
I I
1 I
I
H rI
^ r J H
€-C
I
oo o I- L
HP H
I I H
(S>
(TOO
I
I > - H
I -i
JODOOl
I
H r
I IH
(Q) OO o
H[
O t-
K
-- Cr
r
O o
oI- - -C 1 I-
I
I
K ^o o
-I I
oO O I-
oo
H -£o
O I
H I
- -I I
o o o <
O I
H f
oo
t-
-c
I1
O I-
ooo
I-
o
ooI
—
LJ}
o o O O I
y.
o o£ 3
O K
o-C
•1
D- - 1
I- C
I
OlD O I
t-1
- -L
I
O I-
o o-c
I
I
o o o O H - -
o o I
-r
J- H
80 90 zo 00
Figure 2: Box and whiskers plot of per-series combined weighted scores across all runs. The x-axis shows the series
number (recall that series S7 was omitted), and the y-axis the combined weighted score for that series.
61
factoid and some list questions and will end with exactly one "Other" question. The answer to the "Other" question is
to be interesting information about the target that is not covered by the preceding questions in the series. The runs will
be evaluated using the same methodology as in TREC 2004, though the primary measure will be the per-series score.
To address the concern regarding document retrieval and QA, TREC 2005 submissions will be required to include
an ordered list of documents for each question. This list will represent the the set of documents used by the system
to create its answer, where the order of the documents in the list is the order in which the system considered the
document. The purpose of the lists is to create document pools both to get a better understanding of the number of
instances of correct answers in the collection and to support research on whether some document retrieval techniques
are better than others in support of QA. For some subset of approximately 50 questions, NIST will pool the document
lists, and assessors will judge each document in the pool as relevant ("contains an answer") or not relevant ("does not
contain an answer"). Document lists will then be evaluated using using trecjeval measures.
References
[1] Tsuneaki Kato, Jun'ichi Fukumoto, Fumito Masui, and Noriko Kando. Handling information access dialogue
through QA technologies—A novel challenge for open-domain question answering. In Proceedings of the HLT-
NAACL 2004 Workshop on Pragmatics of Question Answering, pages 70-77, May 2004.
[2] Ellen M. Voorhees. Overview of the TREC 2001 question answering track. In Proceedings of the Tenth Text
effectiveness for the topics in that category, and suggested that topics in categories 1-5 should be amenable to today's
technology if systems could detect what category the topic was in. More than half of the 45 topics studied during RIA
were placed in the first 5 categories.
Twenty-six topics are in the intersection of the robust track's hard set and the RIA failure analysis set. Table 4
shows how the topics in the intersection were categorized by Buckley. Seventeen of the 26 topics in the intersection
are in the earlier categories, suggesting that the hard topic set should not be a hopelessly difficult topic set.
3 Predicting difficulty
A necessary first step in determining the problem with a topic is the ability to recognize whether or not it will be
effective. Obviously, to be useful the system needs to be able to make this determination at run time and without
any explicit relevance information. Cronen-Townsend, Zhou, and Croft suggested the clarity measure, the relative
entropy between a query language model and the corresponding collection language model, as one way of predicting
the effectiveness of a query [3]. The robust track required systems to rank the topics in the test set by predicted
difficulty to explore how capable systems are at recognizing difficult topics. A similar investigation in the TREC2002 question answering track demonstrated that accurately predicting whether a correct answer was retrieved is a
challenging problem [10].
In addition to including the retrieval results for each topic, a robust track run ranked the topics in strict order firom
1 to 250 such that the topic at rank 1 was the topic the system predicted it had done best on, the topic at rank 2
was the topic the system predicted it had done next best on, etc. This ranking was the predicted ranking. Once the
evaluation was complete, the topics were ranked from best to worst by average precision score; this ranking was the
73
Table 4: Failure categories of hard topics.
Category
number Category gloss Topics
2 general technical failures such as stemming 353,378
3 systems all emphasize one aspect, miss another re-
quired term
322,419,445
4 systems all emphasize one aspect, miss another aspect 350, 355, 372, 408, 409, 435, 443
5 some systems emphasize one aspect, some another,
need both
307,310,330, 363,436
6 systems all emphasize some irrelevant aspect, missing
point of topic
347
7 need outside expansion of "general" term (e.g., expand
Europe to individual countries)
401,443,448
8 need query analysis to determine relationship between
query terms
414
9 systems missed difficult aspect 362,367,389, 393,401,404
actual ranking.
One measure for how well two rankings agree is Kendall's r [9]. Kendall's r measures the similarity between
two rankings as a function of the number of pairwise swaps needed to turn one ranking into the other. The r ranges
between -1.0 and 1.0 where the expected correlation between two randomly generated rankings is 0.0, and a r of 1.0
indicates perfect agreement. The run with the largest r between the predicted and actual ranking was the uic0401run with a r of 0.623. Fourteen of the 1 10 runs submitted to the track had a negative correlation between the predicted
and actual rankings. (The topic that was dropped from the evaluation was also removed from the rankings before the
r was computed.)
The Kendall's r score between the predicted and actual ranking for a run is given as part of the run's description in
the Appendix of these proceedings. Unfortunately, Kendall's r between the entire predicted and actual rankings is not
a very good measure of whether a system can recognize poorly performing topics. The main problem is that Kendall's
T is sensitive to any difference in the rankings (by design). But for the purposes of predicting when a topic will be a
poor performer, small differences in average precision don't matter, nor does the actual ranking of the very effective
topics.
A more accurate representation ofhow well systems predict poorly performing topics is to look at how MAP scores
change when successively greater numbers of topics are eliminated from the evaluation. The idea is essentially the
inverse of the area measure: instead of computing MAP over the X worst topics, compute it over the best Y topics
where Y = 249 . . . 199 and the best topics are defined as the first Y topics in either the predicted or actual ranking.
The difference between the two curves produced using the actual ranking on the one hand and the predicted ranking on
the other is the measure of how accurate the predictions are. Figure 1 shows these curves plotted for the uic0401 run,
the run with the highest Kendall correlation, on the left and the humR04d5 run, the run with the (second') smallest
difference between curves, on the right. In the figure, the MAP scores computed when eliminating topics from the
actual ranking are plotted with circles and scores using the predicted ranking are plotted with triangles.
Figure 2 shows a scatter plot of the area between the MAP curves versus the Kendall r between the rankings for
each of the 1 10 runs submitted to the track. If the r and area-between-MAP-curves agreed as to which runs made
good predictions, the points would lie on a line from the upper left to the lower right. While the general tendency is
roughly in that direction, there are enough outliers to argue against using Kendall's r over the entire topic ranking for
this purpose.
Figure 2 also shows that there is quite a range in systems' abilities to predict which topics will be poor performers
for them. Twenty-two of the 110 runs representing 5 of the 14 groups had area-between-MAP-curves scores of 0.5
or less. Thirty runs representing six groups (all distinct from the first group) had area-between-MAP-curves scores
'The nin with the smallest difference was an ineffective run where almost all topics had very small average precision scores.
74
miiiiittttTT
Number wont topics dropped Number worst topics dropped
(a)runuic0404 (b) run huinR04d5
Figure 1: Effect of differences in actual and predicted rankings on MAP scores.
0.5-
• • • _ •
• • • •
-0.5-"
Area between MAP curves
Figure 2: Scatter plot of area-between-MAP-curves vs. Kendall's r for robust track runs.
of greater than 1 .0 How much accuracy is required—including whether accurate predictions can be exploited at all
—
remains to be seen.
4 Evaluating Ineffectiveness
Most TREC topic sets contain 50 topics. In the TREC 2003 robust track we showed that the %no and area measures
that emphasize poorly performing topics are unstable when used with topic sets as small as 50 topics. The problem is
that the measuires are defined over a subset of the topics in the set causing them to be much less stable than traditional
measures for a given topic set size. In turn, the instability causes the margin of error associated with the measures to
75
Table 5: Error rate and proportion of ties for different measures and topic set sizes.
Rate (%) of Ties Rate (%) of Ties Rate (%) of Ties Rate (%) of Ties
MAP 2.4 0.144 1.3 0.146 0.7 0.146 0.3 0.145
PIO 4.0 0.215 2.1 0.223 1.1 0.226 0.6 0.228
%no 14.1 0.107 11.8 0.146 9.6 0.064 7.6 0.065
area 10.6 0.040 7.9 0.041 5.9 0.042 4.7 0.042
be large relative to the difference in scores observed in practice.
4.1 Stability of % no and area measure
The motivation for using 250 topics in the this year's track was to test the stability of the measures on larger topic set
sizes. The empirical procedures to compute the error rates and error margins are the same as were used in the 2003
track [11] except the topic set size is varied. Since the combined topic set contained 249 topics, topic set sizes up to
124 (half 249) can be tested.
Table 5 shows the error rate and proportion of ties computed for the four different measures used in table 3 and
four different topic set sizes: 50, 75, 100, and 124. The error rate shows how likely it is that a single comparison of two
systems using the given topic set size and evaluation measure will rank the systems in the wrong order. For example,
an error rate of 3% says that in 3 out of 100 cases the comparison will be wrong. Larger error rates imply a less stable
measure. The proportion of ties indicates how much discrimination power a measure has; a measure with a low error
rate but a high proportion of ties has little power.
The error rates computed for topic set size 50 are somewhat higher than those computed for the TREC 2003 track,
probably reflecting the greater variety of topics the error rate was computed from. The general trends in the error
rates are strong and consistent: error rate decreases as topic set size increases, and the %no and area measures have a
significantly higher error rate than MAP or P(10) at equal topic set sizes.
Using the standard of no larger than a 5% error rate, the area measure can be used with test sets of at least 124
topics, while the %no measure requires still larger topics sets. Note that since the area measure is defined using the
worst quarter topics, a 124 topic set size implies the measure is using 31 topics in its computation. While this is good
for stability, it is no longer as focused on the very poor topics.
The error rates shown in table 5 assumed two runs whose difference in score was less than 5% of the larger score
were equally as effective. By using a larger value for the difference before deciding two runs are different, we can
decrease the error rate for a given topic set size (because the discrimination power is reduced) [12]. Table 6 gives
the critical value required to obtain no more than a 5% error rate for a given topic set size. For the area measure, the
critical value is the minimum difference in area scores needed. For the %no measure, the critical value is the number of
additional questions that must have no relevant in the top ten, also expressed as a percentage of the total topic set size.
Also given in the table is the percentage of the comparisons that exceeded the critical value when comparing all pairs
of runs submitted to the track over all 1000 topic sets used to estimate the error rates. This percentage demonstrates
how sensitive the measure is to score differences encountered in practice.
The sensitivity of the %no measure does increase with topic set size, but the sensitivity is still very poor even at
124 topics. While intuitively appealing, this measure is just too coarse to be useful unless there are massive numbers
of topics. Note that the same argument applies to the "Success® 10" measure (i.e., the number of topics that retrieve
a relevant document in the top 10 retrieved) that is being used to evaluate tasks such as home page finding and the
document retrieval phase of question answering.
The sensitivity of the area measure is more reasonable. The area measure appears to be an acceptable measure for
topic set sizes of at least 100 topics, though as mentioned above, its emphasis on the worst performing topics lessens
as topic size grows.
76
Table 6: Sensitivity of measures: given is the critical value required to have an error rate no greater than 5% plus the
percentage of comparisons over track run pairs that exceeded the critical value.
50 Topics 75 Topics 100 Topics 124 Topics
Critical %Value Significant
Critical %Value Significant
Critical %Value Significant
Critical %Value Significant
%noarea
11(22%) 3.8
0.025 16.5
16(21%) 3.9
0.020 38.6
11(10%) 15.7
0.015 62.4
13(10%) 16.3
0.015 68.8
Table 7: Evaluation scores for the runs of Figure 3.
MAPgeometric
MAP PIO area %nopircRB04td2 0.359 0.263 0.541 0.047 4
NLPR04cluslO 0.306 0.230 0.449 0.048 8
uogRobLWRl
0
0.320 0.176 0.448 0.015 11
4.2 Geometric MAP
The problem with using MAP as a measure for poorly performing topics is that changes in the scores of better-
performing topics mask changes in the scores of poorly performing topics. For example, the MAP of a run in which
the effectiveness of topic A doubles from 0.02 to 0.04 while the effectiveness of topic B decreases 5% from 0.4 to
0.38 is identical to the baseline run's MAP. This suggests using a nonlinear rescaling of the individual topics' average
precision scores before averaging over the topic set as a way of emphasizing the poorly performing topics.
The geometric mean of the individual topics' average precision scores has the desired effect of emphasizing scores
close to 0.0 (the poor performers) while minimizing differences between larger scores. The geometric mean is equiva-
leht to taking the log of the the individual topics' average precision scores, computing the arithmetic mean of the logs,
and exponentiating back for the final geometric MAP score. Since the average precision score for a single topic can
be 0.0—and trec_eval reports scores to 4 significant digits—we take the expedient of adding 0.00001 to all scores
before taking the log (and then subtracting 0.00001 from the result after exponentiating).
To understand the effect of the various measures, Figure 3 shows a plot of the individual topic average precision
scores for three runs from the TREC 2004 robust track. For each run, the average precision scores are sorted by
increasing score and plotted in that order. Thus the x-axis in the figure represents a topic rank and the y-axis is the
average precision score obtained by the topic at that rank. The three runs were selected to illustrate the differences
in the measures. The pircRB04td2 run was the most effective run as measured by both standard MAP over all
249 topics and geometric MAP over all 249 topics. The NLPR04cluslO run has relatively few abysmal topics and
also relatively few excellent topics, while die uogRobLWRl 0 run has relatively many of both abysmal and excellent
topics. The evaluation scores for these three runs are given in Table 7. The uogRobLWRl 0 run has a better standard
MAP score than the NLPR04cluslO run, and a worse area and geometric MAP score. The P(10) score for the two
runs are essentially identical.
Table 8 shows that the geometric mean measure is also a stable measure. The table gives the error rate and
proportion of ties for geometric MAP for various topic set sizes. As in Table 5, the geometric MAP's error rates are
computed assuming a difference in scores less than 5% of the larger score is a tie. Compared to the error rates for the
measures given in Table 5, geometric MAP's error rate is larger than both standard MAP and P(10) for equal topic
set sizes, but much reduced compared to the area and %no measures. The geometric MAP measure has the additional
benefit over the area measure of being less complex. Given just the geometric MAP scores for a run over two sets of
topics, the geometric MAP score for that run on the combined set of topics can be computed, which is not the case for
the area measure.
77
l.O
pircRB04td2NI_PR04cluslOuogRobLWRlO
Figure 3: Individual topic average precision scores for three TREC 2004 runs.
Table 8: Error rate and proportion of ties computed over different topic set sizes for the geometric MAP measure.
Topic Set Size Error Rate (%) Proportion of Ties
25 9.1 0.081
50 5.2 0.086
63 4.1 0.088
75 3.4 0.090
100 2.3 0.092
124 1.5 0.094
5 Conclusion
The first two years of the TREC robust retrieval track have focused on trying to ensure that all topics obtain minimumeffectiveness levels. The most promising approach to accomplishing this feat is exploiting text collections other than
the target collection, usually the web. Believing that you cannot improve that which you cannot measure, the track
has also examined evaluation measures that emphasize poorly performing topics. The geometric MAP measure is the
most stable measure with a suitable emphasis.
The robust retrieval track is scheduled to run again in TREC 2005, though the focus of the track is expected to
change. The current thinking is that the track will test the robusmess of ad hoc retrieval technology by examining howstable it is in face of changes to the retrieval environment. To accomplish this, participants in the robust track will
be asked to use their system for the ad hoc task in at least two of the other TREC tracks (for example, genomics and
terabyte or terabyte and HARD). Within the robust track, same-system runs will be contrasted to see how differences in
the tasks affect performance. Runs will also be evaluated using existing robust track measures, particularly geometric
MAP.
Acknowledgements
Steve Robertson and Chris Buckley were instrumental in the development of the geometric MAP measure.
78
References
[1] Giambattista Amati, Claudio Carpineto, and Giovanni Romano. Fondazione Ugo Bordoni at TREC 2004. In
Proceedings ofthe Thirteenth Text REtrieval Conference (TREC 2004), 2005.
[2] Chris Buckley. Why current IR engines fail. In Proceedings of the Twenty-Seventh Annual International ACMSIGIR Conference on Reserach and Development in Information Retrieval, pages 584—585, 2004.
[3] Steve Cronen-Townsend, Yun Zhou, and W. Bruce Croft. Predicting query performance. In Proceedings ofthe 25th Annual International ACM SIGIR Conference on Research and Development in Information Retrieval,
pages 299-306, 2002.
[4] Donna Harman and Chris Buckley. The NRRC Reliable Information Access (RIA) Workshop. In Proceedings of
the Twenty-Seventh Annual InternationalACM SIGIR Conference on Reserach and Development in Information
Retrieval, pages 528-529, 2004.
[5] K.L. Kwok, L. Grunfeld, H.L. Sun, and R Deng. TREC2004 robust track experiments using PIRCS. In Proceed-
ings ofthe Thirteenth Text REtrieval Conference (TREC 2004), 2005.
[6] Shuang Liu, Chaojing Sun, and Clement Yu. UIC at TREC-2004: Robust track. In Proceedings ofthe Thirteenth
Text REtrieval Conference (TREC 2004), 2005.
[7] Christine Piatko, James Mayfield, Paul McNamee, and Scott Cost. JHU/APL at TREC 2004: Robust and terabyte
tracks. In Proceedings ofthe Thirteenth Text REtrieval Conference (TREC 2004), 2005.
[8] Vassilis Plachouras, Ben He, and ladh Ounis. University of Glasgow at TREC2004: Experiments in web, robust
and terabyte tracks with Terrier. In Proceedings ofthe Thirteenth Text REtrieval Conference (TREC 2004), 2005.
[9] Alan Stuart. Kendall's tau. In Samuel Kotz and Norman L. Johnson, editors, Encyclopedia ofStatistical Sciences,
volume 4, pages 367-369. John Wiley & Sons, 1983.
[10] Ellen M. Voorhees. Overview of the TREC 2002 question answering track. In Proceedings ofthe Eleventh Text
[12] Ellen M. Voorhees and Chris Buckley. The effect of topic set size on retrieval experiment error. In Proceedings of
the 25th Annual International ACM SIGIR Conference on Research and Development in Information Retrieval,
pages 316-323, 2002.
[13] Jin Xu, Jun Zhao, and Bo Xu. NLPR at TREC 2004: Robust experiments. In Proceedings ofthe Thirteenth Text
REtrieval Conference (TREC 2004), 2005.
[14] Kiduk Yang, Ning Yu, Adam Wead, Gavin La Rowe, Yu-Hsiu Li, Christopher Friend, and Yoon Lee. WIDIT
in TREC-2004 genomics, HARD, robust, and web tracks. In Proceedings of the Thirteenth Text REtrieval
Conference (TREC 2004), 2005.
[15] Elad Yom-Tov, Shai Fine, David Carmel, Adam Darlow, and Einat Amitay. Juru at TREC 2004: Experiments
with prediction of query difficulty. In Proceedings of the Thirteenth Text REtrieval Conference (TREC 2004),
2005.
79
Overview of the TREC 2004 Terabyte Track
Charles Clarke
University of Waterloo
claclarkOplg . uwaterloo . ca
Nick Craswell
Microsoft Research
nickcrOmicrosoft . com
Ian Soboroff
NISTian . soboroff@nist
.gov
Abstract
The Terabyte Track explores how adhoc retrieval and evaluation techniques can scale to
terabyte-sized collections. For TREC 2004, our first year, 50 new adhoc topics were created
and evaluated over a a 426GB collection of 25 million documents taken from the .gov Webdomain. A total of 70 runs were submitted by 17 groups. Along with the top documents, each
group reported average query times, indexing times, index sizes, and hardware and software
characteristics for their systems.
1 Introduction
Early retrieval test collections were small, allowing relevance judgments to be based on an exhaustive
.examination of the documents but limiting the general applicability of the findings. Karen Sparck
Jones and Keith van Rijsbergen proposed a way of building significantly larger test collections
by using pooling, a procedure adopted and subsequently validated by TREC. Now, TREC-sized
collections (several gigabytes of text and a few million documents) are small for some realistic tasks,
but current pooling practices do not scale to substantially larger document sets. Thus, there is a
need for an evaluation methodology that is appropriate for terabyte-scale document collections. Amajor research goal of the Terabyte track is to better define where our measures break down, and
to explore new measures and methods for dealing with incomplete relevance judgments.
Current tasks that are evaluated using large web collections, such as known-item and high-
precision searching, focus on the needs of the common web searcher but also arise from our inability
to measure recall on very large collections. Good estimates of the total set of relevant documents
are critical to the reliability and reusability of test collections as we now use them, but it would
take hundreds of different systems, hundreds of relevance assessors, and years of effort to produce a
terabyte-sized collection with completeness of judgments comparable to a typical TREC collection.
Hence, new evaluation methodologies and ways of building test collections are needed to scale
retrieval experiments to the next level.
The proposal for a TREC Terabyte Track was initiated at a SIGIR workshop in 2003 and
accepted by the TREC program committee for TREC 2004. This report describes the details of
the task undertaken, the runs submitted, and the range of approaches taken by the participants.
80
2 The Retrieval Task
The task is classic adhoc retrieval, a task which investigates the performance of systems searching
a static set of documents using previously-unseen topics. This task is similar to the current Robust
Retrieval task, and to the adhoc and VLC tasks from earlier TREC conferences.
2.1 Collection
This year's track used a collection of Web data crawled from Web sites in the .gov domain during
early 2004. We believe that this collection ("G0V2") contains a large proportion of the crawlable
pages in .gov, including HTML and text, plus the extracted text of PDF, Word and postscript
files. By focusing the track on a single, large, interconnected domain we hoped to create a realistic
setting, where content, structure and links could all be fruitfully exploited in the retrieval process.
The G0V2 collection is 426GB in size and contains 25 million documents. While this collection
contains less than a full terabyte of data, it is considerably larger than the collections used in
previous TREC tracks. For TREC 2004, the collection was distributed by CSIRO in Australia on
a single hard drive for a cost of A$1200 (about US$800).
2.2 Topics
NIST created 50 new topics for the track. Figure 1 provides an example. As in the past, the title
field may be treated as a keyword query, similar to the queries stereotypically entered by users
of Web search systems. The description field provides a slightly longer statement of the topic
requirements, usually expressed as a single complete sentence or question. Finally, the narrative
supplies additional information necessary to fully specify the requirements, expressed in the form
of a short paragraph. While keywords from the title are usually repeated in the description, they
do not always appear in the narrative.
2.3 Queries
For each topic, participants created a query and submitted a ranking of the top 10,000 documents
for that topic. Queries could be created automatically or manually from the topic statements. As
for all TREC tasks, automatic methods are those in which there is no human intervention at any
stage, and manual methods are everything else. For most runs, groups could use any or all of the
topic fields when creating queries from the topic statements. However, each group submitting an
automatic run was required to submit an automatic run that used just the title field.
2.4 Submissions
Each group was permitted to submit up to five experimental runs. Each run consists of the top
10,000 documents for each topic, along with associated performance and system information. Werequired 10,000 documents, since we believe this that information may useful during later analysis
to help us better understand the evaluation process.
In addition to the top 10,000 documents, we required each group to report details of their
hardware configuration and various performance numbers, including the number of processors,
total RAM (GB), on-disk index size (GB), indexing time (elapsed time in minutes), average search
time (seconds), and hardware cost. For the number of processors, we requested the total number
of CPUs in the system, regardless of their location. For example, if a system is a cluster of eight
81
<top>
<nuiii> Number : 705
<title>
Iraq foreign debt reduction
<desc> Description:
Identify amy efforts, proposed or undertaiken, by world governments to seek
reduction of Iraq's foreign debt.
<narr> Narrative: Documents noting this subject as a topic for
discussion (e.g. at U.N. and G7) are relevant. Money pledged for
reconstruction is irrelevant
.
</top> . ^!
Figure 1: Terabyte Track Topic 705
dual-processor machines, the number of processors is 16. For the hardware cost, we requested an
estimate in US dollars of the cost at the time of purchase.
Some groups may subset a collection before indexing, removing selected pages or portions of
pages to reduce its size. Since subsetting may have an impact on indexing time and average query
time, we asked each group to report the fraction of pages indexed.
For search time, we asked the groups to report the time to return the top 20 documents, not
the time to return the top 10,000, since this number better reflects the performance that would be
seen by a user. It was acceptable to execute a system twice for each query, once to generate the
top 10,000 documents and once to measure the execution time for the top 20, provided that the
top 20 results were the same in both cases.
2.5 Judgments
The top 85 documents of two runs from each group were pooled and judged by NIST assessors.
The judgments used a three-way scale of "not relevant", "relevant", and "highly relevant".
3 Submitted Runs
Figures 2 and 3 provide an overview submitted runs. The first two columns give the group and
run ids. The third column lists the topic fields — Title ("T"), Description ("D") and Narrative
("N") — that were used to create the query. In all cases queries were generated automatically
from these fields. No manual runs were submitted. The next three columns indicate if link analysis
techniques, anchor text, or other document structure was used in the ranking process. The third-
last column gives the average query time required to generate the top 20 results, and the second-last
column gives the time to build the index in hours. The last column gives the mean average precision
achieved by each run.
82
Group
Id
Run
Id
Topic
Fields
Links?
Anchors?Structure?
Query
Time
(s)
Index
Time
(h)
MAP
cmu.dir.callan cmuapfs2500 TDN N N N 600 20 0 0.284
cmutufs2500 T N N N 240 20 0 0.248
cmutuns2500 T N N N 75 20 0 0.207
dubblincitv.u DcuTB04Base T N N N 2 408 7 0.118
DcuTB04Ucdl TDN N Y N 84 883 7 0.076
DcuTB04Wbm25 T N N Y 2 760 8 0.079
DcuTB04Combo T N Y Y 2 906 0 0.033
DcuTB04Ucd2 TDN N Y N 15 457 5 0.070
etymon nn04tint T N N N 25 44 8 0.112
nn04eint T N N N 78 44 8 0.074
nn04test T N N N 46 44 8 0.028
hummingbird humT041 T N N Y 115 100 0 0.224
humT04dvl T N N Y 142 100 0 0.212
humT04vl T N N Y 119 100 0 0.221
humT0413 T N N Y 49 100 0 0.155
humT04 T N N Y 50 100 0 0.196
iit iitOOt T N N N 23 8 0 0.210
robertson T N N N 42 8 0 0.200
jhu .apl .mcnamee apl04w4tdn TDN N N N 10000 0 0 0.034
apl04w4t T N N N 10000 0 0 0.027
max-planck.theobald mpi04tb07 T Y N Y 6 42 0 0.125
mpi04tb09 TD Y N Y 9 42 0 0.123
mpi04tbl01 TD Y N N 9 42. 0 0.081
mpi04tb81 TD Y N N 9 42. 0 0.092
mpi04tb91 TD Y N N 9 42 0 0.092
microsoft,asia MSRAt3 T N Y Y 1 11 6 0.171
MSRAt4 T N Y Y 1 11 6 0.188
MSRAtS T N Y Y 1 11 6 0.190
MSRAt2 T N N Y 1 11 6 0.092
MSRAtl T N N Y 1 11 6 0.191
rmit.scholer zetbodoffff T N N N 25 13. 5 0.219
zetanch T N Y N 2 13. 6 0.217
zetplain T N N N 2 13 5 0.223
zetfuzzy T N Y N 2 13. 6 0.131
zetfunkyz T N Y N 3 13 6 0.207
Figure 2: Summary of Submitted Runs (Part 1)
83
Group
Id
Run
Id
Topic
Fields
Links?
Anchors?Structure?
Query
Time
(s)
Index
Time
(h)
MAP
sabir .buckley sabir04td3 D N N N 18 14. 0 0.117
sabir04ta2 TDN N N N 9 14. 0 0.172
sabir04tt T N N N 1 14. 0 0.116
sabir04td2 D N N N 3 14. 0 0.121
sabir04tt2 T N N N 1 14. 0 0.118
tsinghua.ma THUIRtb5 T N N N 15 32. 0 0.244
THUIRtb4 TDN N Y N 55 17. 0 0.245
THUIRtbS T N Y N 9 17. 0 0.220
THUIRtb2 TDN N Y Y 18 2. 8 0.056
THUIRtbe T N N N 16 32. 0 0.204
u.alaska irttbtl T N N Y 5 30. 0 0.009
u.amsterdam.lit UAmsT04TBml T N Y Y 90 4. 3 0.044
UAmsT04TBanc T N Y N 1 0. 3 0.013
UAmsT04TBmlp T N Y Y 90 4. 3 0.043
UAmsT04TBtit T N N Y 20 4. 0 0.039
UAmsT04TBm3 T N Y Y 90 4. 3 0.043
uoeTBOEL TDN N N N 46 200. 6 0.307
uoeTBPoolOEL TDN N N N 46 200. 6 0.231
uoeTBBaseS T N N N 4 200. 6 0.271
uogTBAnchS T N Y N 3 501
.
7 0.269
uogTBBaseL TDN N N N 28 200. 6 0.305
u.mass indri04AWRM T N N N 39 5
.
9 0.284
indri04AW T N N N 7 5. 9 0.269
indri04QLRM T N N N 26 5. 9 0.253
indri04QL T N N N 1 5. 9 0.251
indri04FAW T N Y Y 52 21. 6 0.279
u.melbourne MU04tb3 T Y Y N 0.08 2. 5 0.043
MU04tb2 T N Y N 0.08 2. 5 0.063
MU04tb4 T Y Y N 0.36 13. 0 0.268
MU04tbl T N N N 0.08 1. 7 0.266
MU04tb5 T Y Y N 0.08 2. 5 0.064
upisa. attardi pisa4 T Y Y Y 3 16. 0 0.103
pisaS T Y Y Y 3 16. 0 0.107
pisa2 T Y Y Y 3 16. 0 0.096
pisal T Y Y Y 1 16. 0 0.050
Figure 3: Summary of Submitted Runs (Part 2)
84
4 Overview of Systems
Most groups contributed papers to this notebook, and we refer the reader to the these papers for
complete details about individual systems. In. the remainder of this section, we summarize the
range of approaches taken by the groups and highlight some unusual features of their systems.
4.1 Hardware and Software
The cost and scale of the hardware varied widely, with many groups dividing the documents across
multiple machines and searching the collection in parallel. At one extreme, the group from the
University of Alaska's Arctic Region Supercomputing Center used 40 nodes of the NCSA "mercury"
TeraGrid cluster, which cost over US$10 million. At the other extreme, the group from Tsinghua
University used a single PC with an estimated cost of US$750.
To index and search the collection, most groups used custom retrieval software develop by
their own group or by an associated group. One exception is the University of Alaska, which
used MySQL (finding a bug in the process). Hummingbird used their commercial SearchServer*^
system. Etymon Systems used their Amberfish package, which they have released as open source
(etymon, com/tr. html). Both CMU and University of Massachusetts used Indri, a new indexing
and retrieval component developed by the University of Massachusetts for the Lemur Toolkit.
4.2 Indexing
Overall, indexing methods were fairly standard. Most groups applied stopping and stemming
methods. However, at least three groups, the University of Massachusetts, CMU, and EtymonSystems did not remove stopwords, despite the size of the collection. Several groups compressed
the index to improve performance and reduce storage requirements, including the University of
Glasgow, the University of Melbourne, and the University of Pisa. Sabir implemented compressed
indices, but did not use them in their final runs.
Since a large portion the collection consists of HTML, many groups applied special processing
to the anchor text or to specific fields within the documents. For example, Dublin City University
generated surrogate anchor text documents, comprised of the anchor text of inlinks to a document.
The Indri system supports the indexing of arbitrary document fields, and this facility was used to
index various fields of HTML documents (title, hi, h2, etc.). The University of Pisa performed
extensive preprocessing, extracting page descriptions and categories from Dmoz, collecting links
and anchor texts, and identifying specific fields within HTML documents.
The most unusual approach was taken by the University of Amsterdam group, who indexed only
document titles and anchor text. The resulting indexes are small: 1.4GB for the titles covering 83%of the documents, and 0.1 GB for the anchors covering 6% of the documents. This very selective
indexing produced a 20 minute indexing time and a 1 second average query time without the need
for special performance optimizations.
Figure 4 plots the fastest indexing times, ignoring all but the fastest time from each group. In-
dexing a 426GB collection in under 14 hours implies an indexing rate of over 30GB/hour. However,
most of these groups parallelized the indexing process or indexed only a subset of the collection.
The fastest reported "indexing" time, zero, does not appear on the figure. The group reporting
this indexing time, JHU/APL, did not index the collection at all. Instead, they searched it with a
Table 5: Normalised overall results with indication of methods used. Anc: Anchor text used? Lnk: Other link structure
used? Strc: Document structure used? ULen: URL length used? UOth: Other URL features used? QCls: Special
processing for different query types?
whole page of results without finding a good answer Fig-
ure 3 presents success rate figures for the best run from
each group, according to S@10 across all queries. The
best S@ 10=0.88 measure gives the user no useful docu-
ments for 12% of queries, although perhaps this is accept-
able if we assume that in those cases the user reformulates
their query.
2.4 What worked
Table 5 indicates which technologies were used by the
best run from each group. It is clear that most groups
use document structure and many use anchor text. It also
seems useful to use link structure and URL length. Other
URL features and query classification were not necessary
for good performance, but if groups had their best run us-
ing such methods they may well be helpful.
We also present information on methods used by the
best run from several groups. (Full information is in Ap-
pendix A.)
performance, of nearly 0.80. Similarly to last year, S@ 10
performance seems to max out at around 90%.
2.3 Overall results
Table 4 presents the best run from each group, judged on
the average of TD MAP, NP MRR and HP MRR. Al-
though the magnitude for TD is much less than NP and
HP, MAP and MRR are related measures so it makes
sense to look at the average.
Another way to get an overall score out of TD MAP,NP MRR and HP MRR is to normalise each query type
according to the maximum score. This gives each run
three scores between 0 and 1, and the average of these
three scores is an overall score. Such scores are presented
in Figure 2 and Table 5.
A third way to look at the overall result is by success
rate. Success at 10 is an interesting number, because it is
different from MAP and MRR which give a lot of weight
to rank one, and it indicates how often a user reads a
95
I. MSRC04C12 Interleaving of stem and nostem runs,
each using structure, URL length and PageRank.
3. MSRAx2 We interpolated relevance scores on the
fields of title, body, anchor, url and merged the
former four together. The score functions include
BM25, proximity and a new proposed URL score
function. And the final score combines relevance
score and a HostRank that is a PageRank-Iike value.
10. uogWebSelAn Content and anchor-text retrieval.
Porter Stemming, Divergence From Randomness
PL2 weighting scheme, URL-length reranking. Se-
lecting between content and anchor-text retrieval, or
content with anchor-text and URL-length reranking
II, UAmsT04MWScb CombMNZ (non-normalized,
non-weighted) of stemmed and non-stemmed runs,
each using a mixture language model on stemmed
full-text, titles, and anchor texts, using both an
indegree and URL prior.
16. THUIRmix045 Word pair weighting based on an-
other run, which used content retrieval in full text
and in-link anchor, with a larger weight in fields of
Title, head. Bold and first line of page content.
20. ICT04CIIS1AT Anchor text forward propagation,
page title text back propagation, combination of an-
chor text ,key words ,hl text etc. ,different pivoted
weigth function for different part
27. humW04rdpI Plain content search including lin-
guistic expansion from English inflectional stem-
ming, extra weight on properties such as Title and
Metadata, lower url depth and root urls
3 Query classification runs
Three groups submitted a total of 9 query classification
runs. Results are presented in Figure 4. Random clas-
sification of 225 queries into three types would tend to
lead to about 150 errors, so classification runs were able
to do significantly better than random. The best run Mei-
jiHILwqc was a manual run. The most common type of
error was confusing HP and NP (either by classifying HPas NP or classifying NP as HP).
4 W3C Investigation
Workshop participants proposed a variety of new experi-
ments, for example relevance ranking in email, or search-
ing for people who are experts in a particular topic area.
We plan to pursue such ideas using the W3C dataset in the
TREC-2005 Enterprise Track.
5 Conclusion
The main experiment showed that, on a mixed query set,
effective retrieval is possible without query classification.
Topic distillation is still by far the most difficult query
type. Query classification runs showed that it is indeed
possible to tell the difference. The most common classifi-
cation mistake was to confuse NP and HP queries.
The other effect of the mixed query task is to consoli-
date the findings of previous Web Track years. There are
web search information needs which are based on a page's
position (a 'homepage') and importance, rather than just
the page's text. To answer these information needs, it is
not sufficient to search on content alone: use of 'Web ev-
idence' based on structure, links and URLs is necessary.
This evidence may be effectively used in an enterprise-
scale crawl, of a million pages. The Web Track collec-
tions are now reusable resources for new experiments with
TD, NP, HP and mixed query streams.
Of course there is also more work to be done in devel-
oping evaluation methodologies. Future web experiments
could model other user needs, for example transactional
search, and refine solutions to tricky issues such as distil-
lation judging and scoring of near-duplicate results. An-
other direction would be to venture into the wider Web,
where adversarial information retrieval is an issue, and
many pages are there to manipulate the ranking rather
than provide useful information. These can be eliminated
or down-weighted via analysis at crawl time or query
time. Finally, having so far considered enterprise-scale
webs in the Web Track, it is interesting consider ranking
with other forms of enterprise information such as mailing
list archives and document shares/archives, and a search
across a mixture of web and non-web enterprise data.
96
A All run descriptions
The a description of each run as submitted, sorted as in
Figure 2. Each group's best run is marked with a *.
1. MSRC04C12* Interleaving submissions MSRC04B1S and MSRC04B2S2. MSRC04B2S Weighted Field BM25 (fields title, body & anchor) optimised
on the Named Page 2003 task, with linear adition of non-linear PageRank
and URL features. Stenmiing.3. MSRAx2* relevance propagation + HostRank (more details in Section 2.4
above)4. MSRAmixedl fields weighting + proximity + a new importance named Hos-
tRank5. MSRAx4 URL match and level -^ BM25 + HostRank6. MSRC04B1S Weighted Field BM25 (fields title, body & anchor) optimised
on the Named Page 2003 task, with linear adition of non-linear PageRank
and URL features. No stemming.7. MSRAinixed3 BM2500 + Proximity8. MSRAxS relevance propagation + HostRank9. MSRC04B1S2 Weighted Field BM25 (fields title, body & anchor) optimised
on the Topic Distillation 2003 task, with linear adition of non-linear Click-
Distance and URL features. No stemming.10. uogWebSelAn* content and anchor-text retrieval. Porter Stemming, Diver-
gence From Randomness PL2 weighting scheme, URL-length reranking.
Selecting between content and anchor-text retrieval, or content with anchor-
text and URL-length reranking11. UAiiisT04MWScb* CombMNZ (non-normalized, non-weighted) of runs
UAmsT04MWinu and UAmsT04MSinu.12. uogWebSeLAnL content and anchor-text retrieval. Porter Stemming, Diver-
gence From Randomness PL2 weighting scheme, URL-length reranking.
Selecting between content and anchor-text retrieval, or content with anchor-
text and URL-length reranking13. UAinsT04MSuiu Mixture language model on stemmed full-text, titles, and
anchor texts, using both an indegree and URL prior.
14. UAmsT04MSind Mixture language model on stemmed full-text, titles, and
anchor texts, using an indegree prior.
15. UAmsT04MWinu Mixture language model on non-stemmed full-text, titles,
and anchor texts, using both an indegree and URL prior.
16. THUIRiiux045* Word pair weighting based on THUIRmix041.17. MSRC04B3S Weighted Field BM25 (fields title, body & anchor) optimised
on the Topic Distillation 2003 task, with linear adition of non-linear Click-
Distance No stemming.18. THUIRniix044 (Juery classification with query length and named entity in-
formation. TD topics are assigned to THUIRinix042, while the others are
retrieved on THUIRmix041
.
19. THUIRiiiix042 Content retrieval in full text and in-link anchor of Key re-
source pages. Key resource pages are selected with non-content features
using clustering technologies.20. ICT04CIIS1AT* anchor text forward propagation , page title text back prop-
agation, combination of anchor text ,key words ,hl text etc. ,different piv-
oted weigth function for different part
21. ICT04MNZ3 CombMNZ for combination of anchor text retrieval result
.structure info retrieval result and content retrieval result, anchor text for-
ward propagation, page tide text back propagation.
22. uogWebCA content and anchor text retrieval. Porter Stenuning, Divergence
From Randomness PL2 weighting scheme23. THXJIR!nix041 Content retrieval in full text and in-link anchor, with a larger
weight in fields of Title, head. Bold and first line of page content.
24. ICT04RULE rerank the result by some heuristic sti-ategies make use of the
url depth.url works,anchkor text, site compression like trick.
25. uogWebSelL content and anchor-text retrieval, Porter Stemming, Divergence
From Randomness PL2 weighting scheme, URL-length reranking. Select-
ing between content and anchor-text retrieval, or content with anchor-text
and URL-length reranking26. THTJIRinix043 THUIRmix041 -t- primary space model weighting in in-link
anchor text and contents of Title, head. Bold and first line of page content.
27. humW04rdpl* same as humW04dpl except extra weight for root urls
28. ICT04CIILC comparable run with lCT04basic, using a different weighted
function for Content text, otiiers just the same as lCT04basic29. uogWebCAU150 content and anchor text retrieval. Porter Stenuning, Diver-
gence From Randomness PL2 weighting scheme. URL-length reranking30. UAmsT04LnuNG Lnu.ltc run with worcTn-gram boosting, using document
structure and anchor texts.
31. ICT04basic vector space content model, baseline for all the runs, using com-bination of anchor text and some simplest page structure info, not siems.nol
feedback and classification of queries32. SJTUINCMIX3' BM2533. SJTU1NCMIX2 Task classification,BM2534. McijiHILwl* Vector space model. Using anchor text, url-depth and title text.
Outdegree reranking.
35. MeijiHltw3 Vector space model. Using anchor text, url-depth and ti-
de text. Outdegree reranking. (Juery Classified based on last year's
queries. Document vector modification by Relevance-based Superimpo-
sition Model(RSModel).36. SJTUINCMIXl task classification,BM25,minimal span weighting reRank37. MeijiHILw2 Vector space model. Using anchor text, url-depth and title text.
Outdegree reranking. (Juery Classified based on last year's queries.38. SJTUINCMIXS Task classihcation,BM25,Site Unit39. SJTUINCM1X4 Task classification,BM25,PageRank reRank40. csiroatnist* This is a baseline run obtained by submitting the query titles
to the Panoptic (CSIRO software) search service at ir.nist.gov. Note that
an error with topic 179 resulted in no documents retrieved. To pass die
submission checking script, the 30th result for topic 178 was arbitrarily
inserted as the first for 179.
41. huinW04dpl same as humW04pl except extra weight for lower url depth42. MU04webI* Vector Space Model + Document-centric impact + pagerank +
URL depth43. humW04dp same as humW04dpl except linguistic expansion from stem-
ming disabled44. wdf3oks0arrl* result merging, okapi, simple stemmer, homepage rank
boosting45. wdf3oks0brrl result merging, okapi, combo stemmer, homepage rank boost-
ing46. wdf3oks0a result merging, okapi, simple stemmer47. MeijiHILw4 Vector space model. Using anchor text, url-depth and tide text.
Outdegree reranking. Query Classified based on last year's queries.Query
expansion using Conceptual Fuzzy Sets(CFS).48. wdf3oksOb result merging, okapi, combo stemmer49. humW04pl same as humW041 except extra weight on properties such as Tide
and Metadata50. VTOK5» BASELINE51. MeijiHILw5 Vector space model. Using anchor text, url-depth and tide text.
Outdegree reranking. Query Classified based on last year's queries.Query
expansion using Conceptual Fuzzy Sets(CFS). Document vector modifica-
tion by Relevance-based Superimposition Model(RSModel).52. MU04web3 Vector Space Model + Document-centric impacts + Pagerank53. rapi04web08* Automatic phrase detection, Anchor text reranking, PageR-
scores63. humW04l plain content search including linguistic expansion from English
inflectional stemming64. irtbow* bag of words but with added weighting for query term order and
proximity; Lnu.Ltc weighting.
65. irttil title only; Lnu.Ltc weighting66. fdwieslO improved okpai method67. irtpbr2 phrase search (not useful for single-term queries); Lnu.Ltc weight-
ing.
68. fdwieUql anchro-text ranking69. fdwiellgO okpai model70. XLDBTumbaOl*71. VT2 Ranking tuning using linear fusion
72. VTTDl TD mning73. VTl best trial
74. VT3 Ranking tuning using linear fusion
97
lyM.l3 M. Technical Publications
Periodical
Journal of Research of the National Institute of Standards and Technology—^Reports NIST research and
development in metrology and related fields of physical science, engineering, applied mathematics, statistics,
biotechnology, and information technology. Papers cover a broad range of subjects, with major emphasis onmeasurement methodology and the basic technology underlying standardization. Also included from time to
time are survey articles on topics closely related to the histitute's technical and scientific programs. Issued six
times a year.
Nonperiodicals
Monographs—^Major contributions to the technical literature on various subjects related to the histitute's
scientific and technical activities.
Handbooks—Recommended codes of engineering and industrial practice (including safety codes) developed
in cooperation with interested industries, professional organizations, and regulatory bodies.
Special Publications—^Include proceedings of conferences sponsored by NIST, NIST annual reports, and other
special publications appropriate to this grouping such as wall charts, pocket cards, and bibliographies.
National Standard Reference Data Series—^Provides quantitative data on the physical and chemical
properties of materials, compiled from the world's literature and critically evaluated. Developed under a
worldwide program coordinated by NIST under the authority ofthe National Standard Data Act (Public Law90-396). NOTE:The Journal of Physical and Chemical Reference Data (JPCRD) is published bimonthly for
NIST by the American Institute of Physics (AIP). Subscription orders and renewals are available from AIP, P.O.
Box 503284, St. Louis, M063 1 50-3284.
BuUding Science Series—^Disseminates technical information developed at the Institute on building materials,
components, systems, and whole structures. The series presents research results, test methods, and performance
criteria related to the structural and environmental functions and the durability and safety characteristics of
building elements and systems.
Technical Notes—Studies or reports which are complete in themselves but restrictive in their treatment of a
subject. Analogous to monographs but not so comprehensive in scope or definitive in treatment of the subject
area. Often serve as a vehicle for final reports ofwork performed at NIST under the sponsorship of other
government agencies.
Voluntary Product Standards—^Developed under procedures published by the Department of Commerce in
Part 10, Title 15, of the Code of Federal Regulations. The standards establish nationally recognized
requirements for products, and provide all concemed interests with a basis for common understanding of the
characteristics of the products. NIST administers this program in support of the efforts of private-sector
standardizing organizations. ,
Order thefollowing NISTpublications—FIPS and NISTIRs—from the National Technical Information Service,
Springfield VA 22I6I. /
Federal Information Processing Standards Publications (FIPS PUB)—^Publications in this series
collectively constitute the Federal Information Processing Standards Register. Xne Register serves as the official
source of information in the Federal Government regarding standards issued by NIST pursuant to the Federal
Property and Administrative Services Act of 1949 as amended. Public Law 89-306 (79 Stat. 1127), and as
implemented by Executive Order 11717 (38 FR 12315, dated May 1 1, 1973) and Part 6 of Title 15 CFR (Code
of Federal Regulations).
NIST Interagency or Internal Reports (NISTIR)—The series includes interim or final reports on
work performed by NIST for outside sponsors (both government and nongovernment). In general, initial
distribution is handled by the sponsor; public distribution is handled by sales through the National
Technical Information Service, Springfield, VA 22161, in hard copy, elecfronic media, or microfiche
form. NISTIR's may also report results of NIST projects of transitory or limited interest, including those
that will be published subsequently in more comprehensive form.


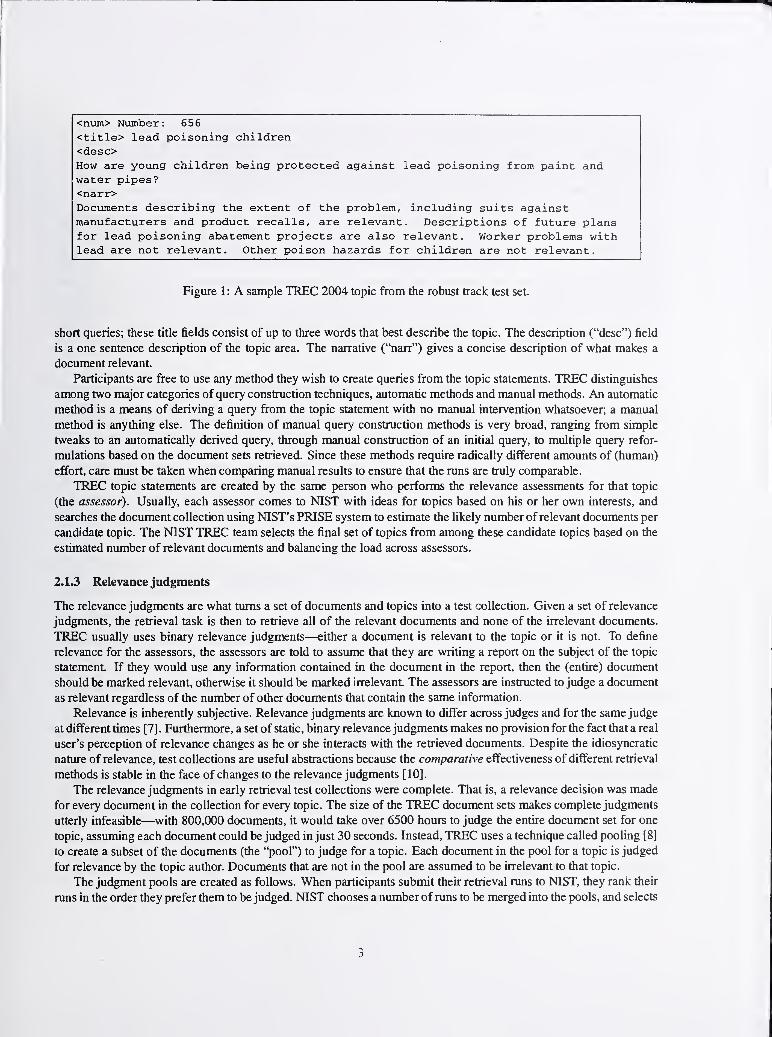
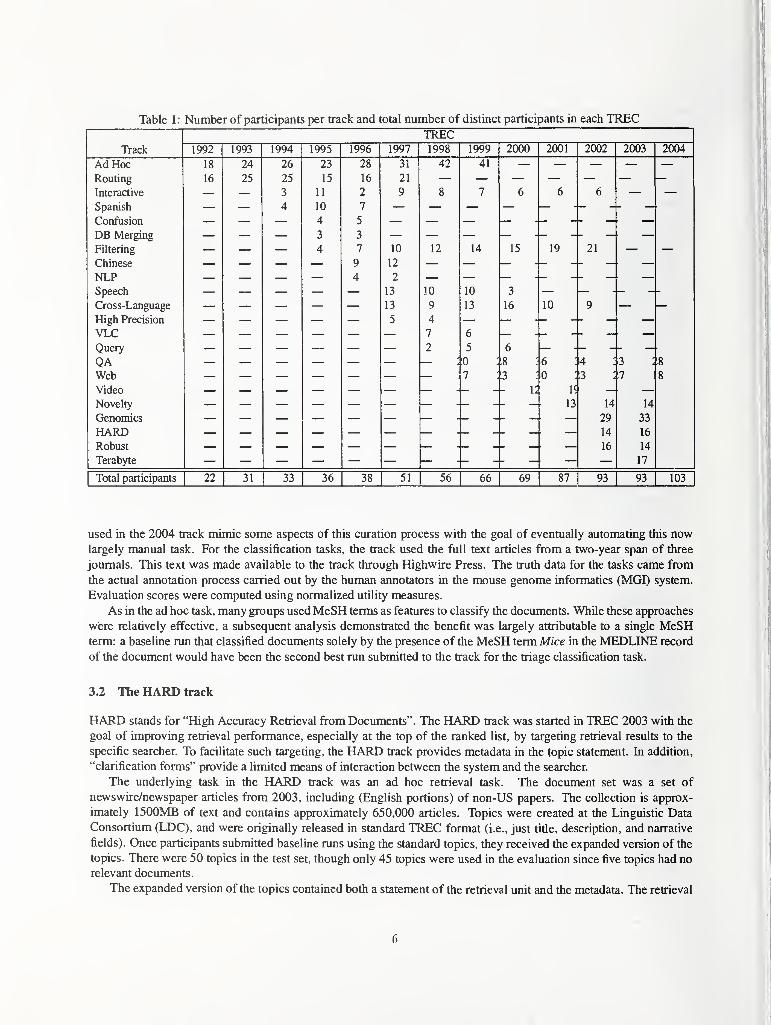
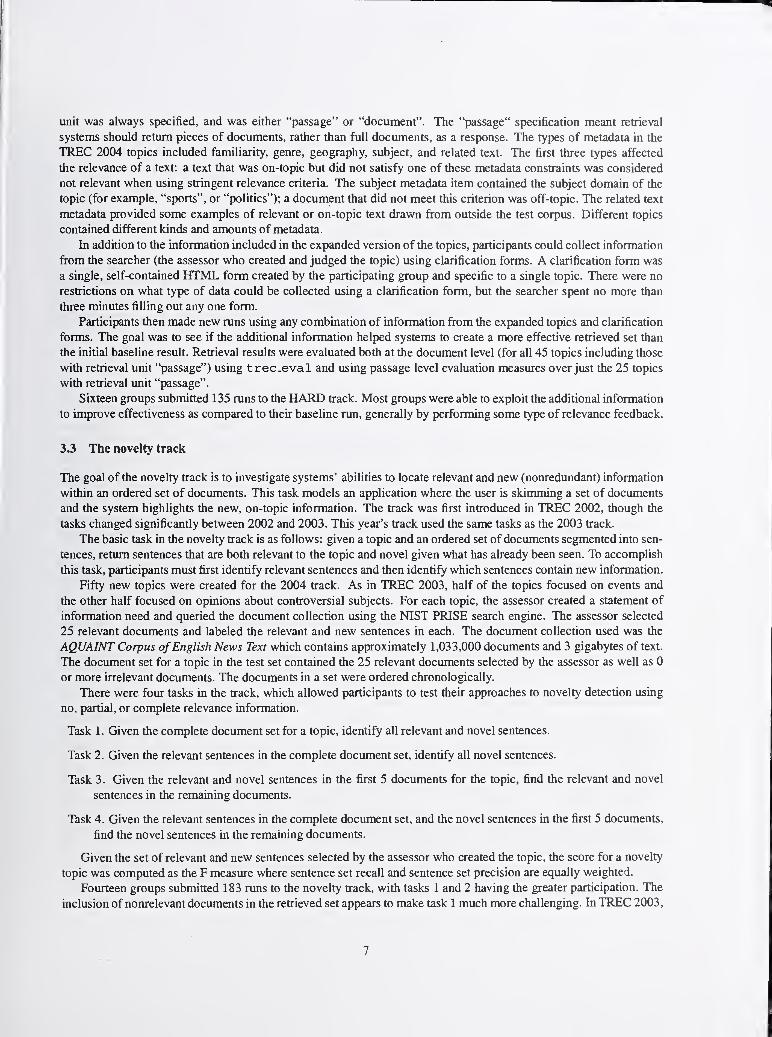
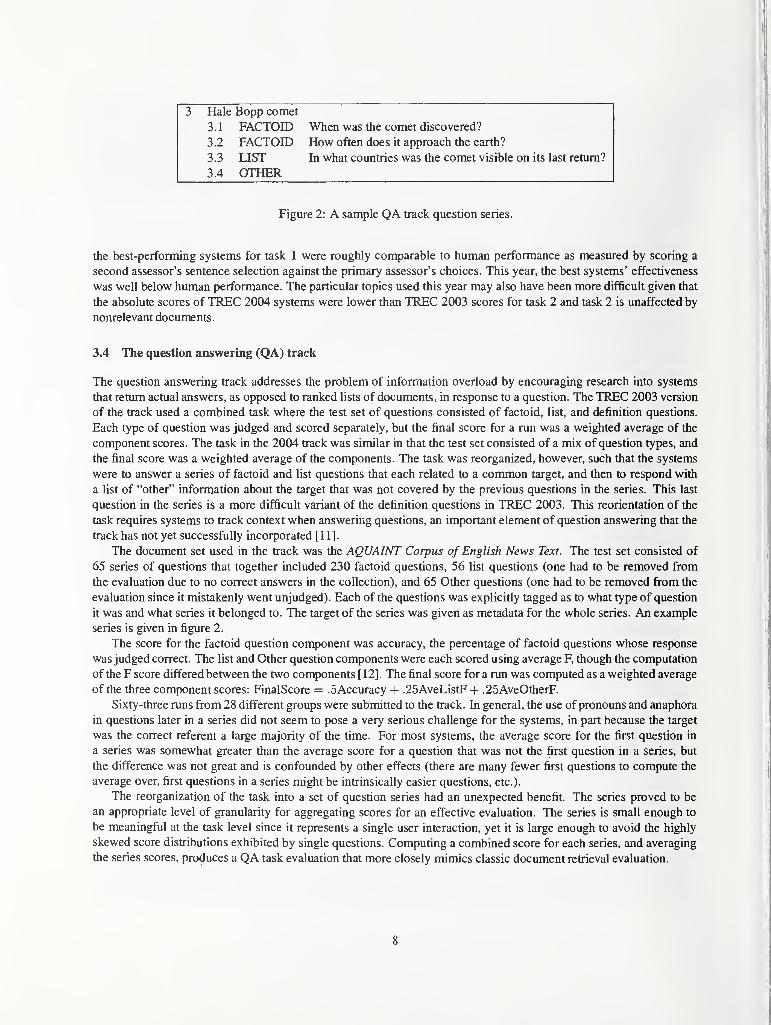
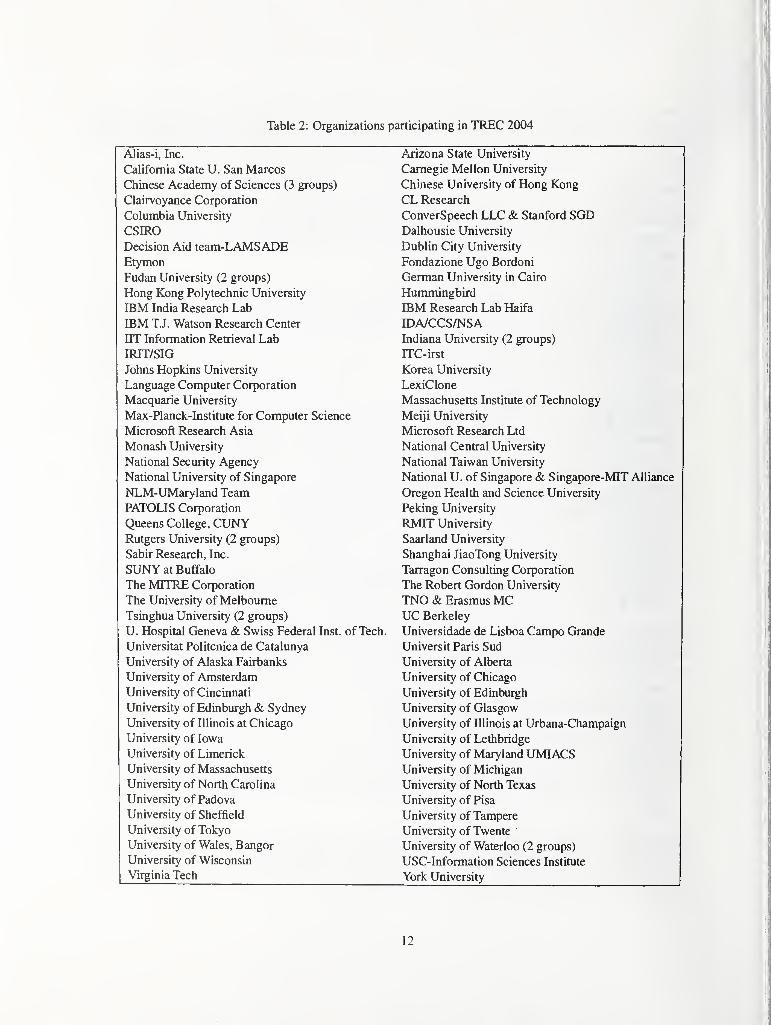
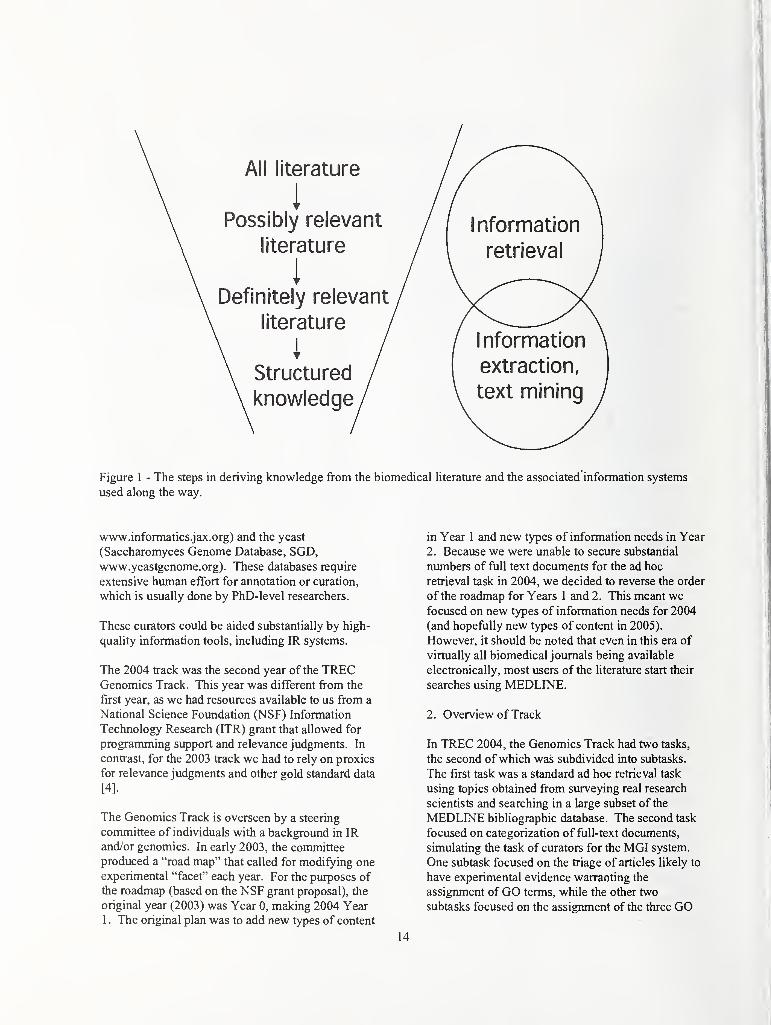
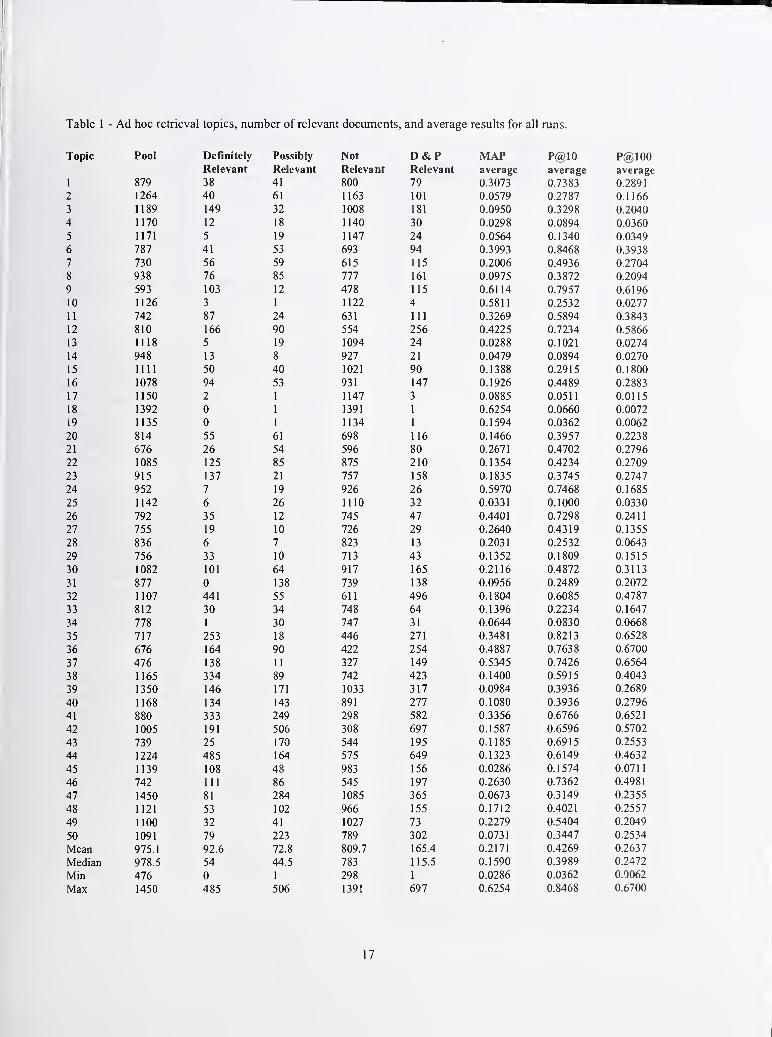
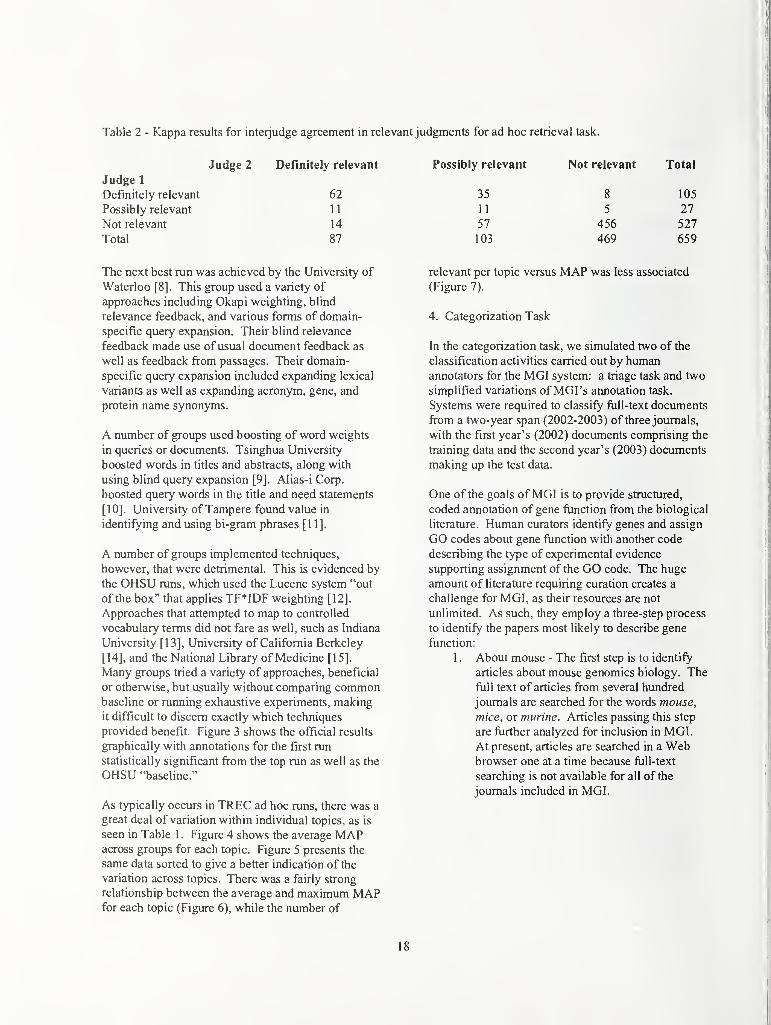
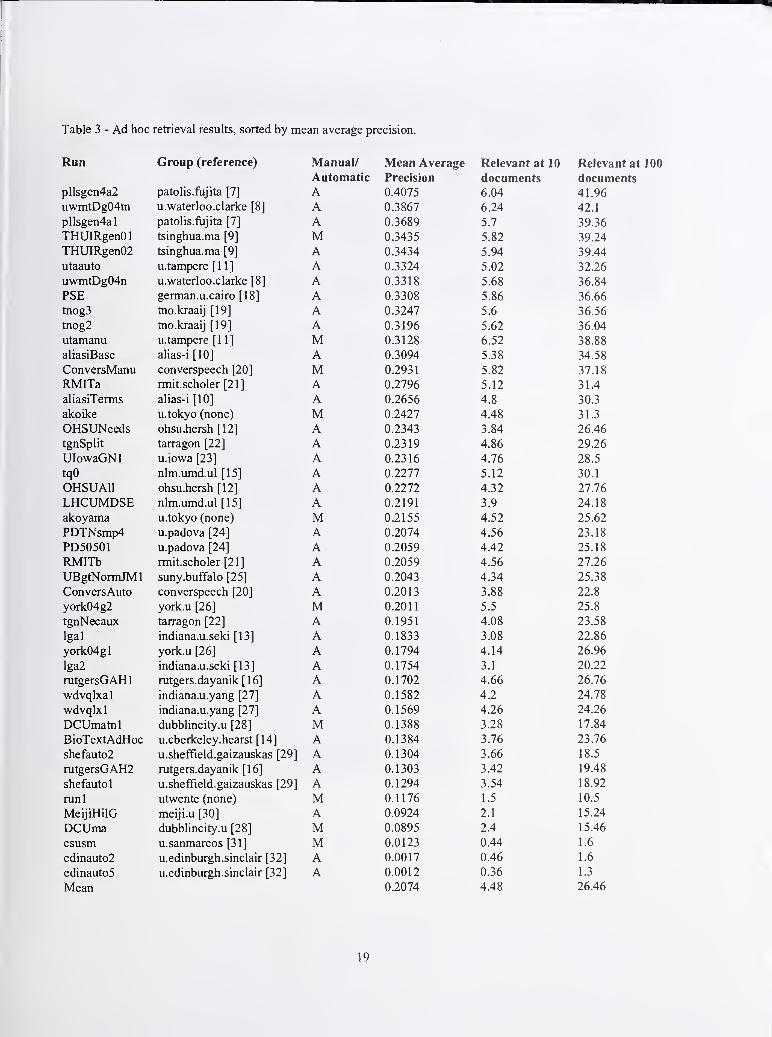
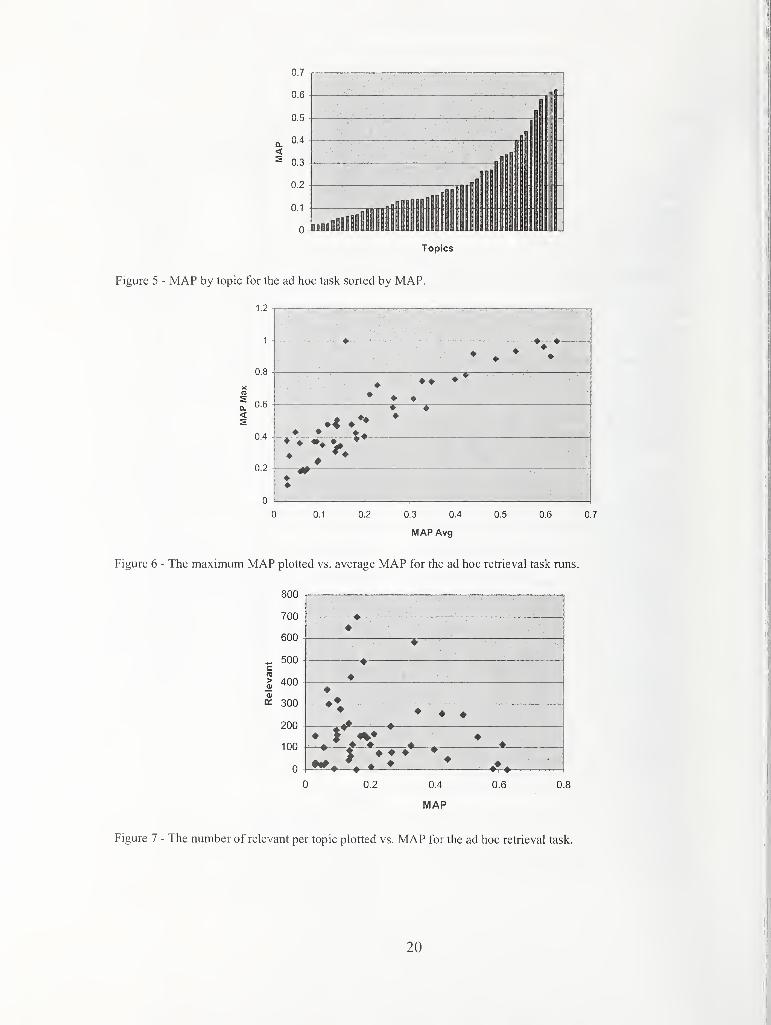
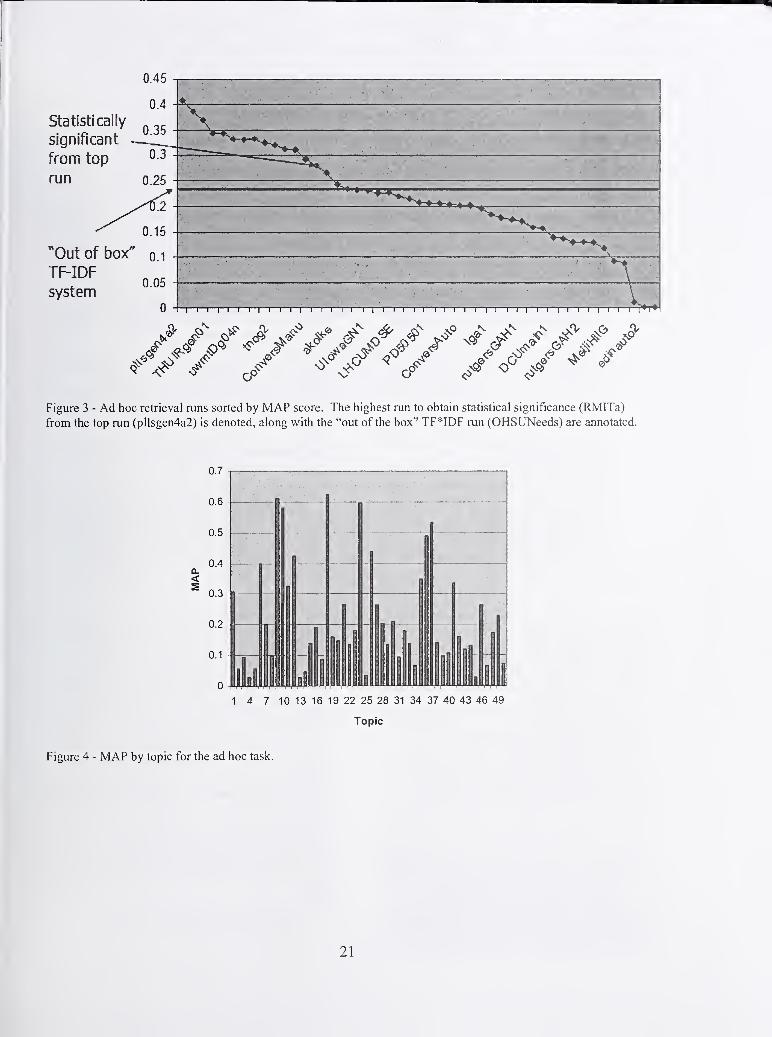

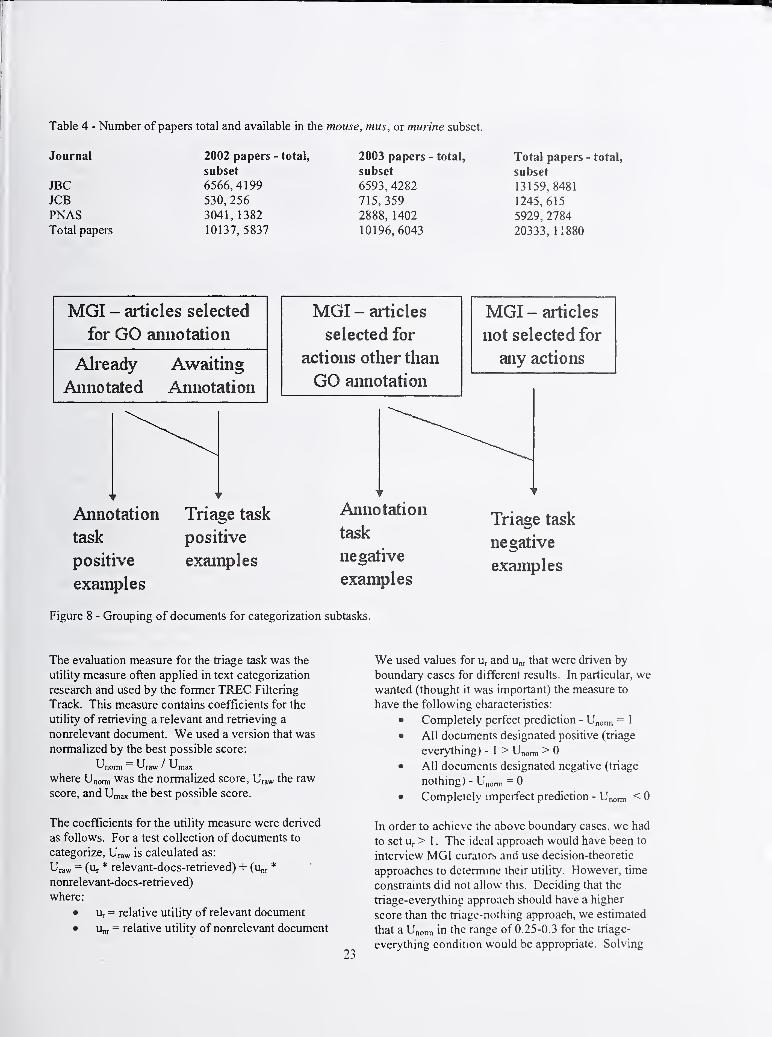
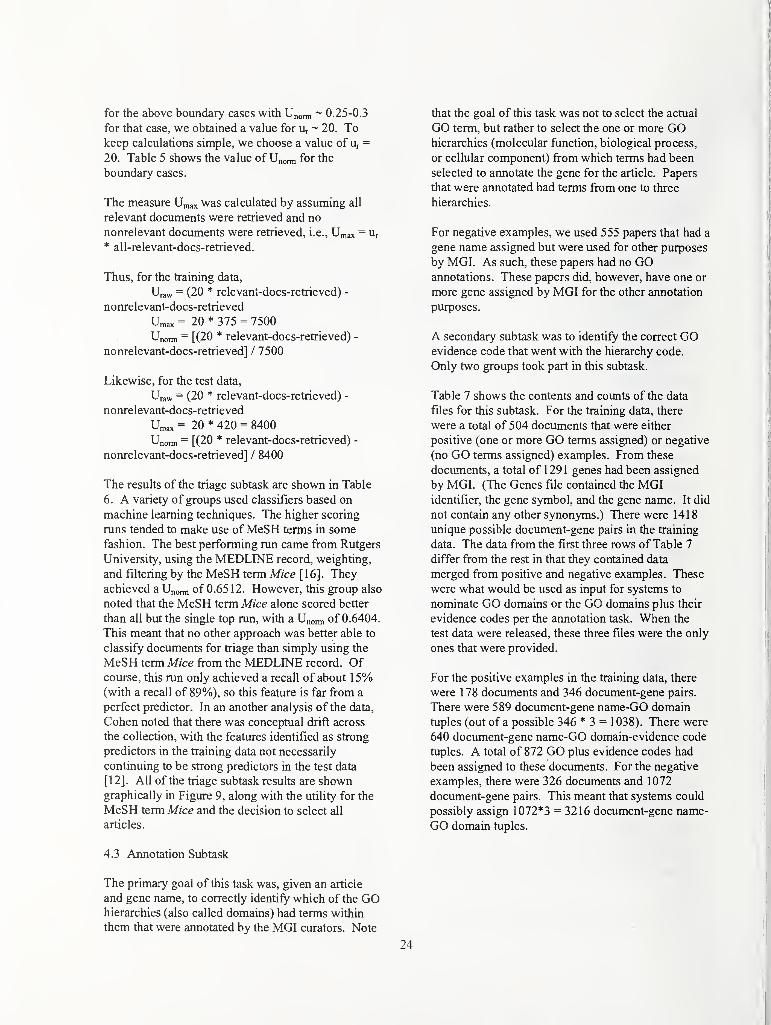
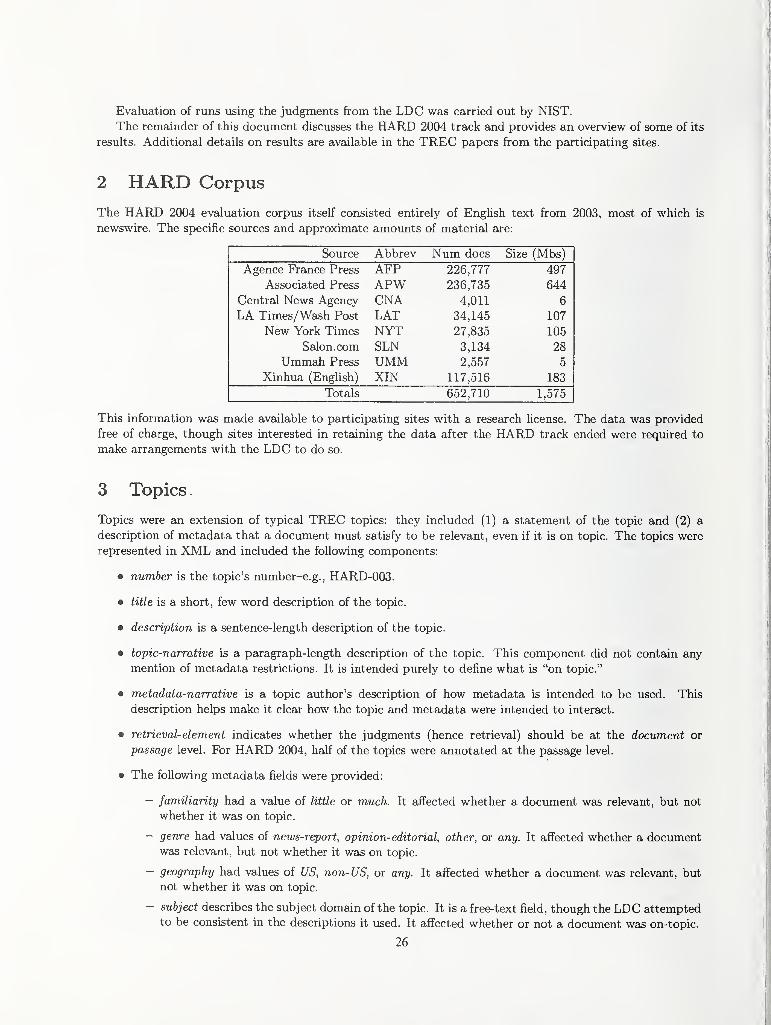
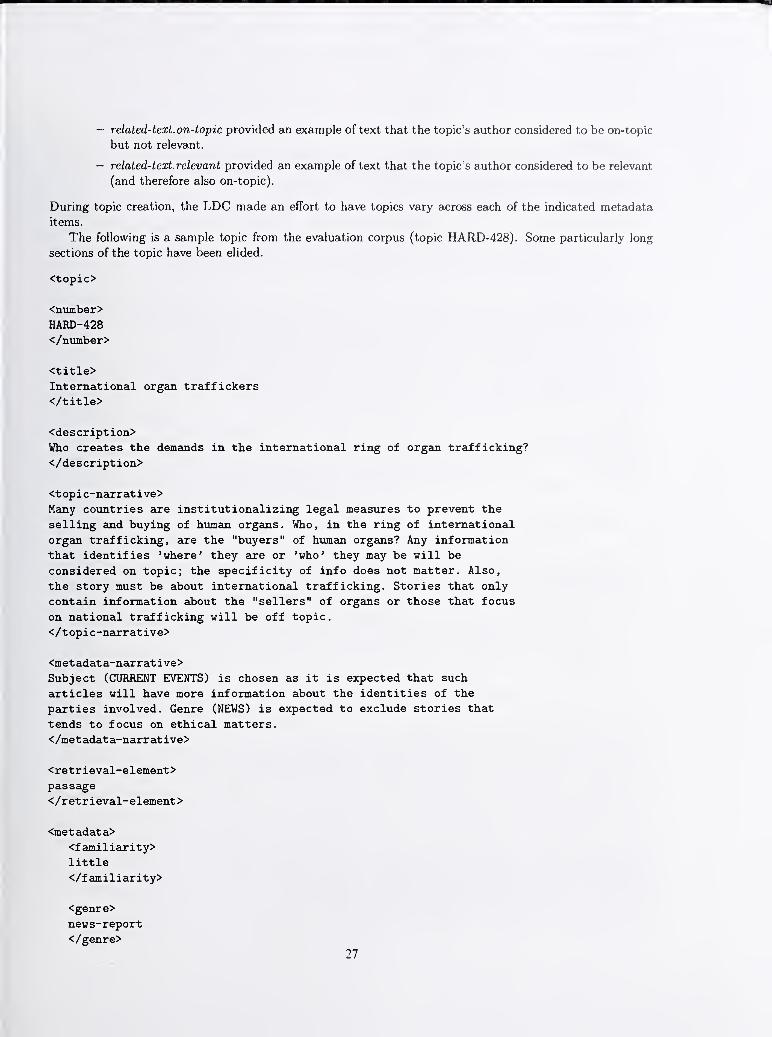
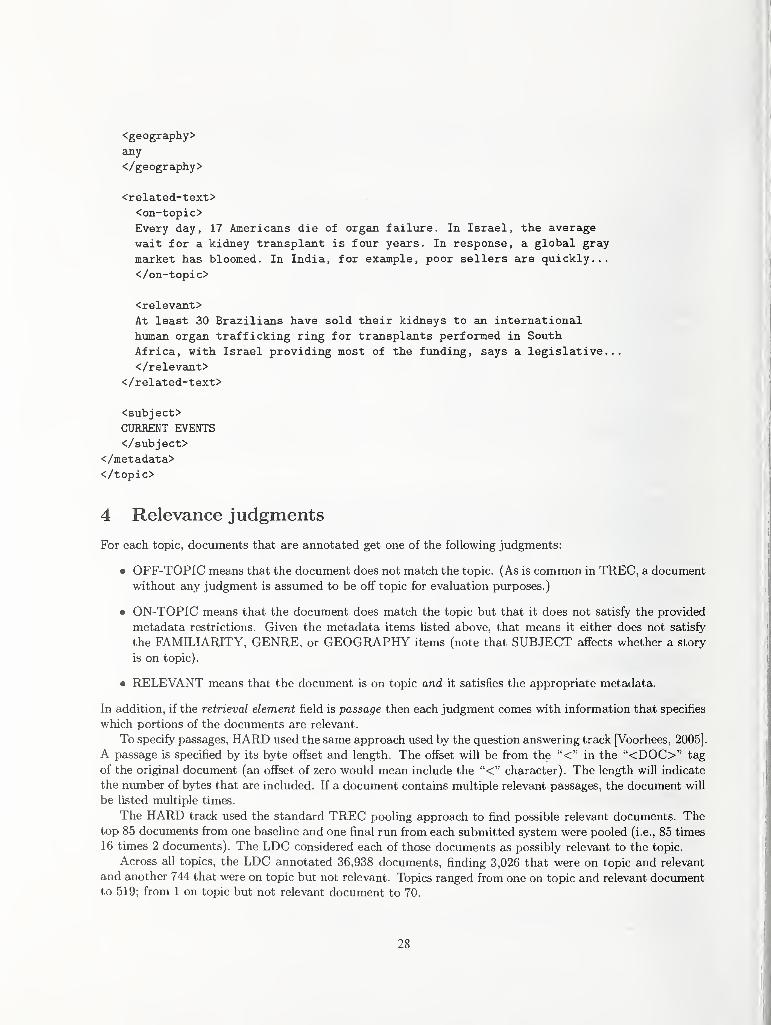


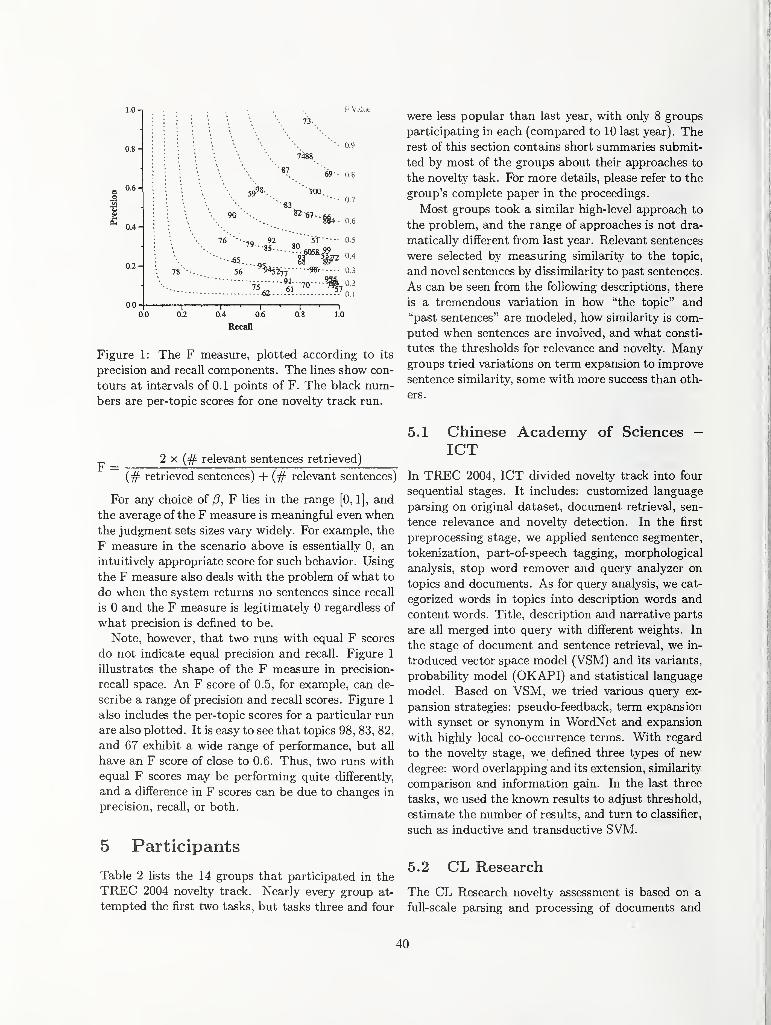
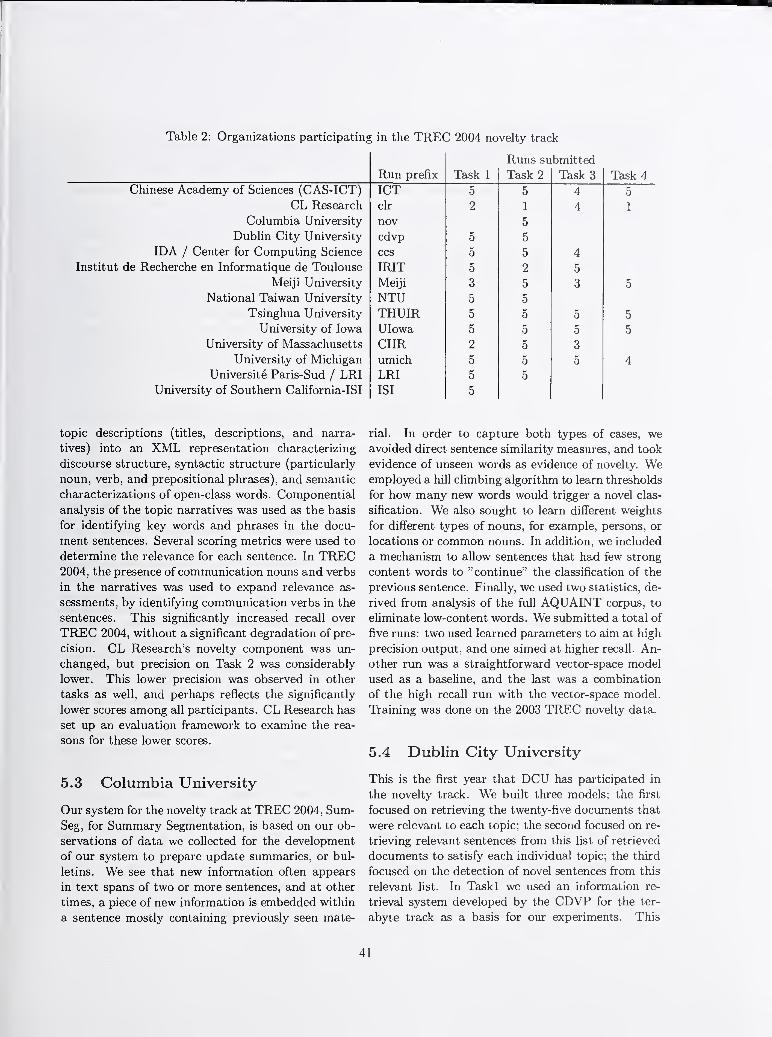

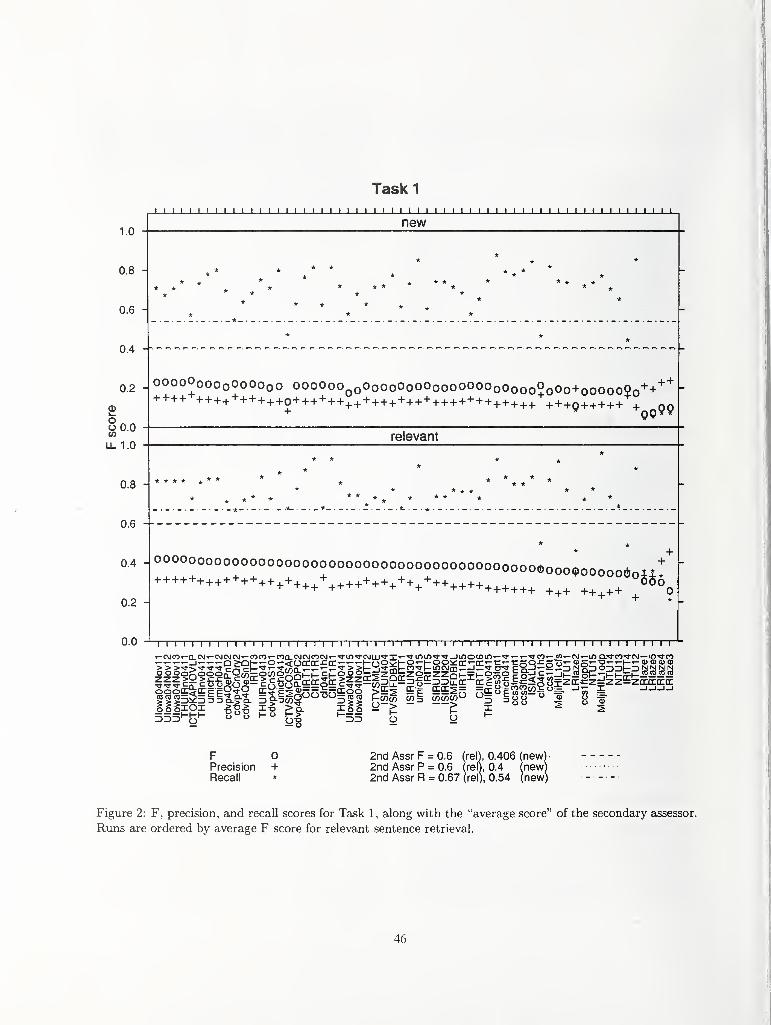
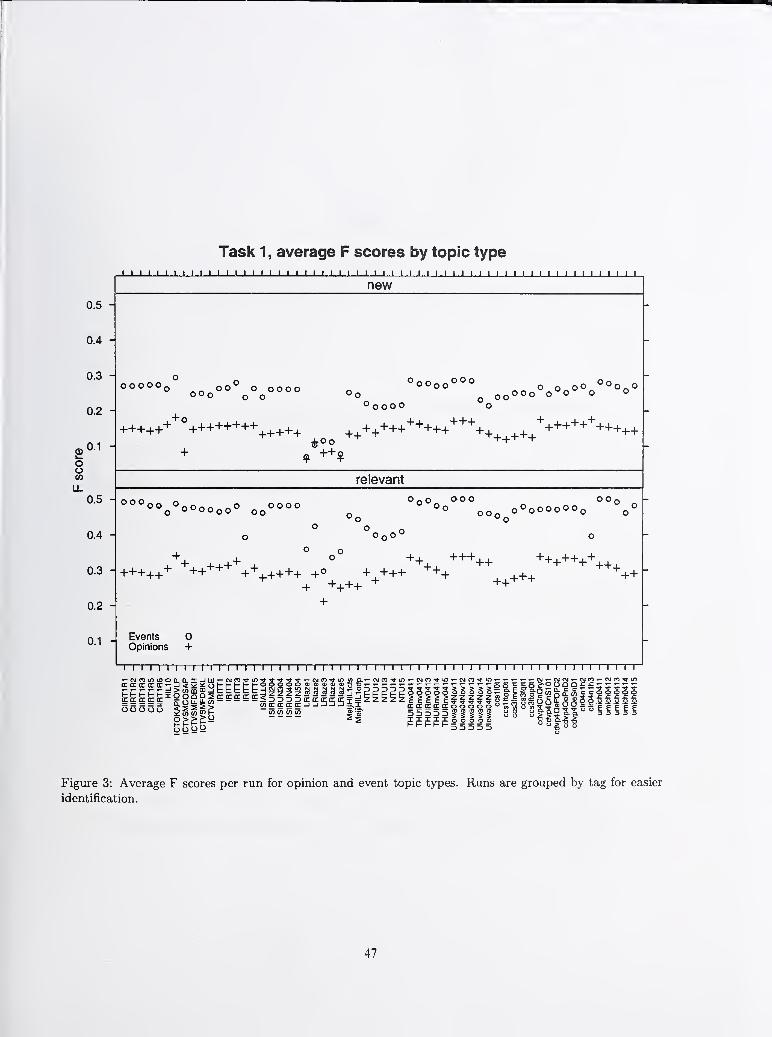
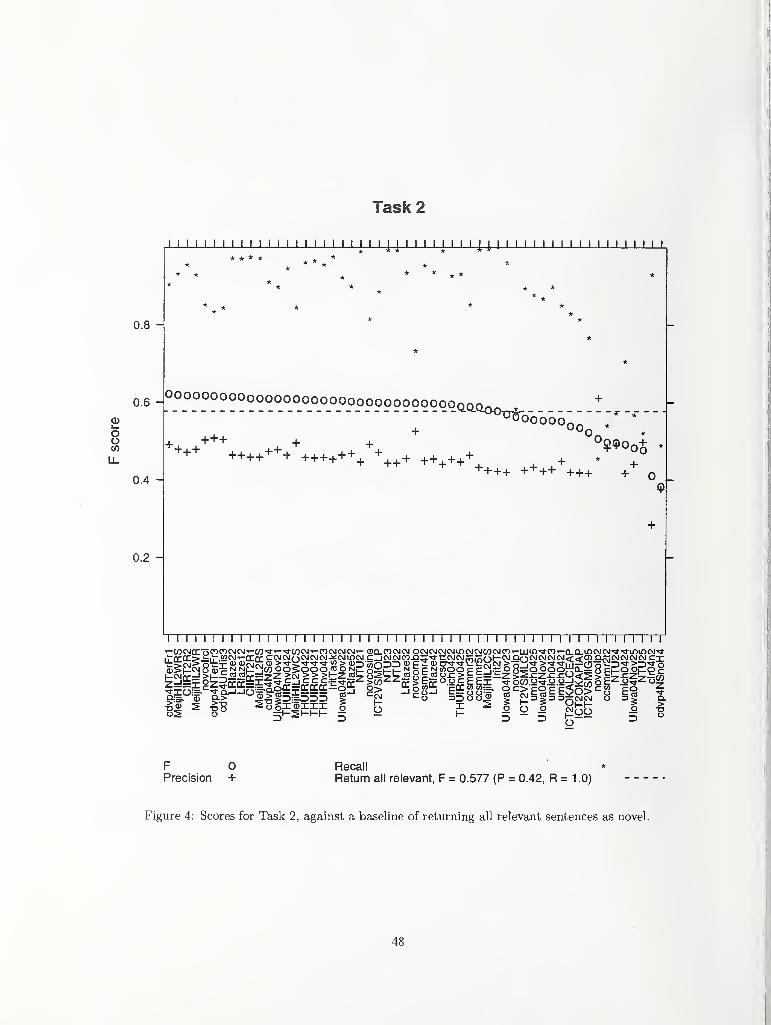

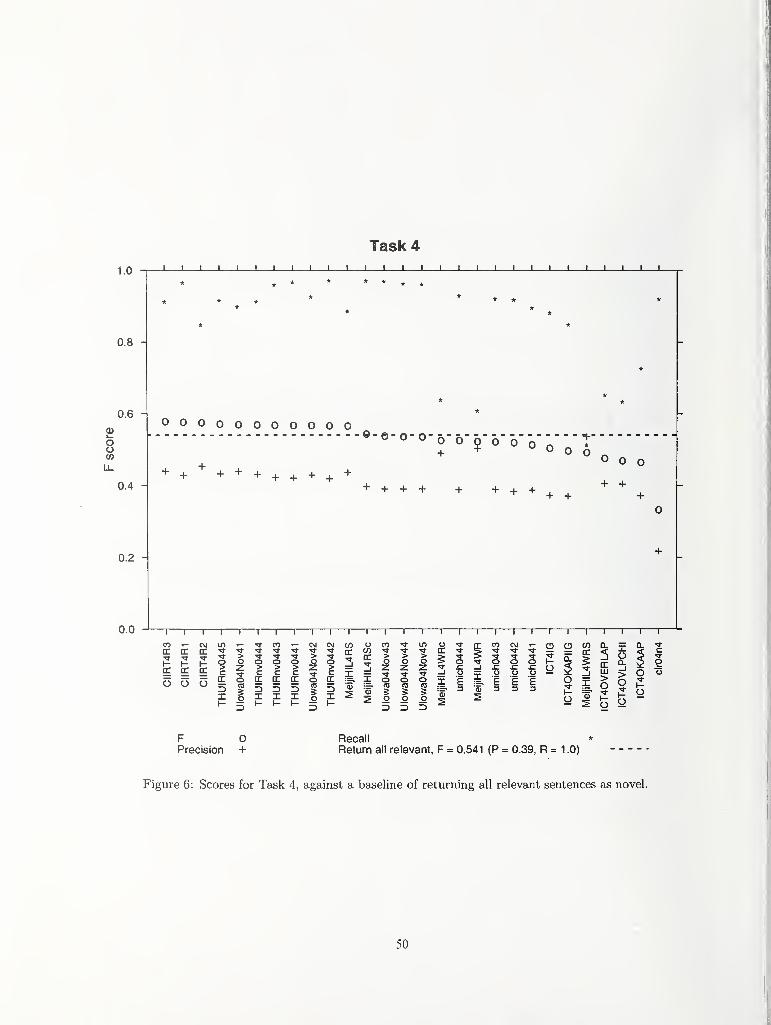

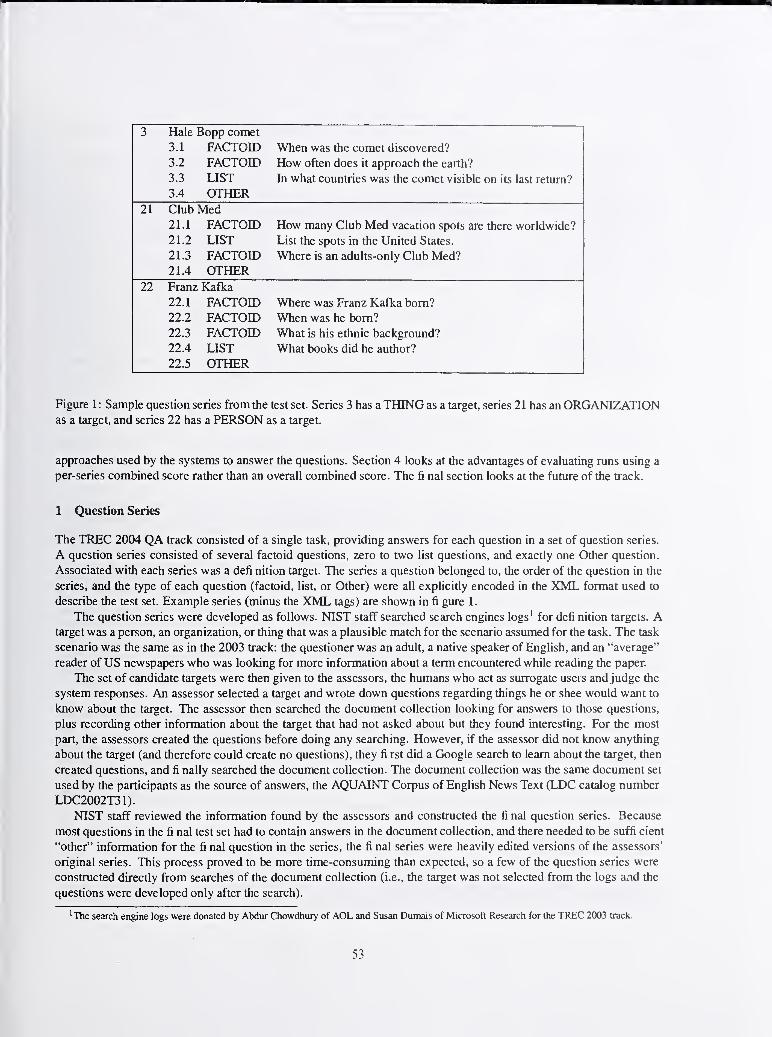
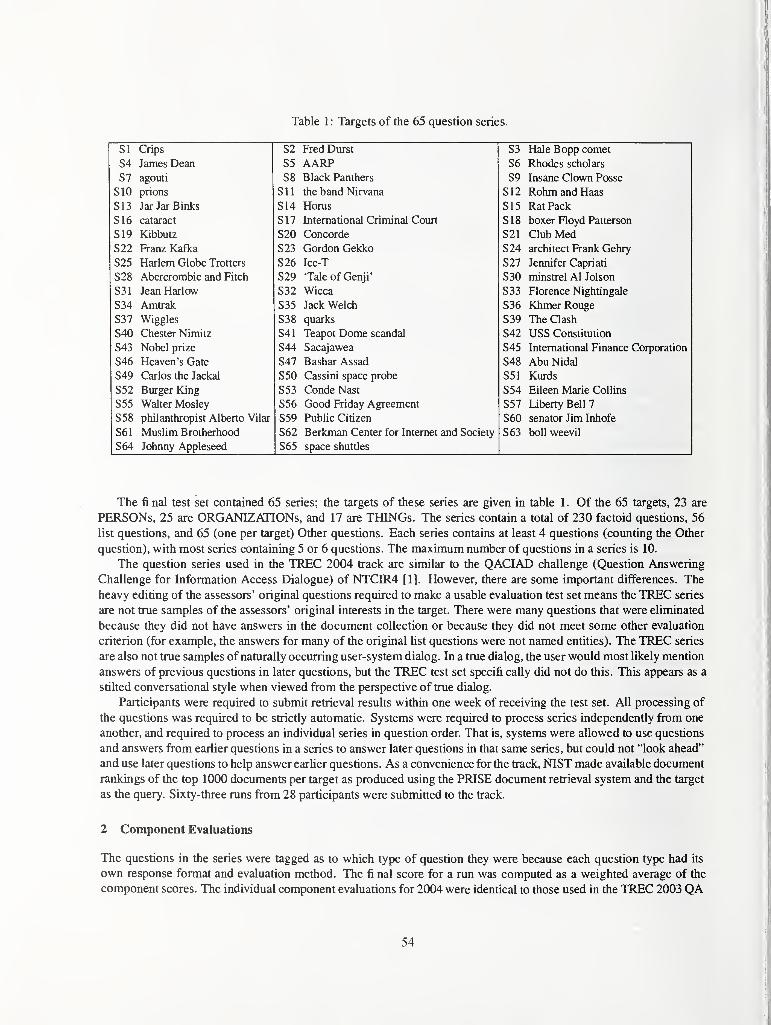
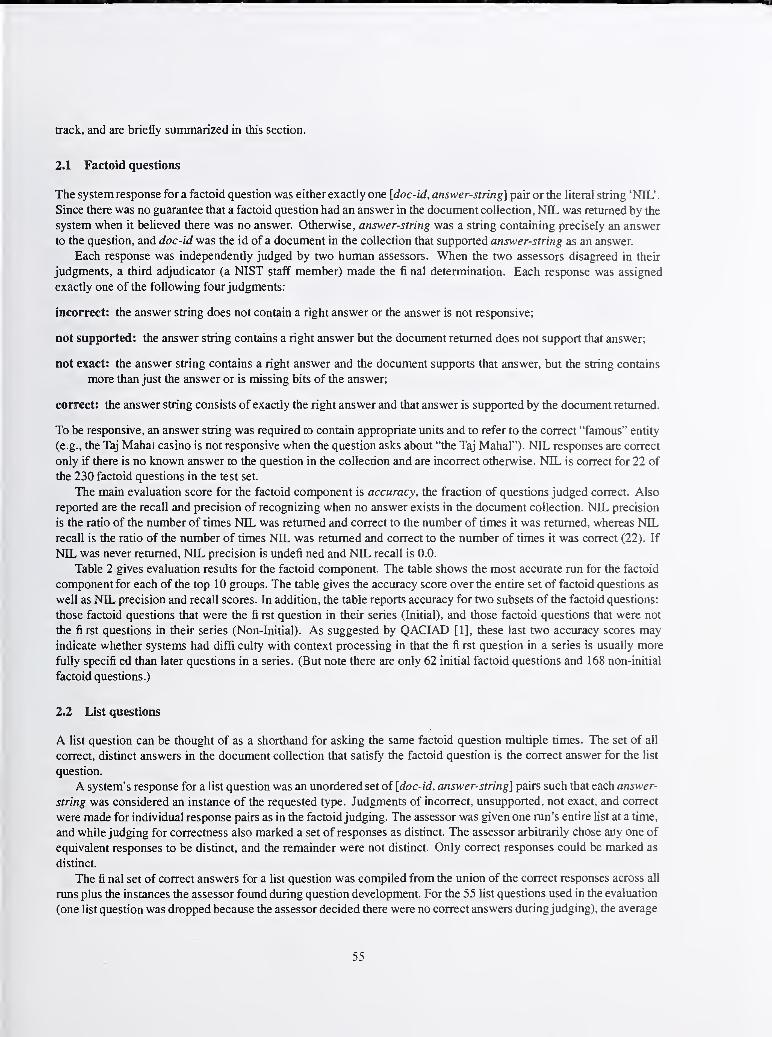
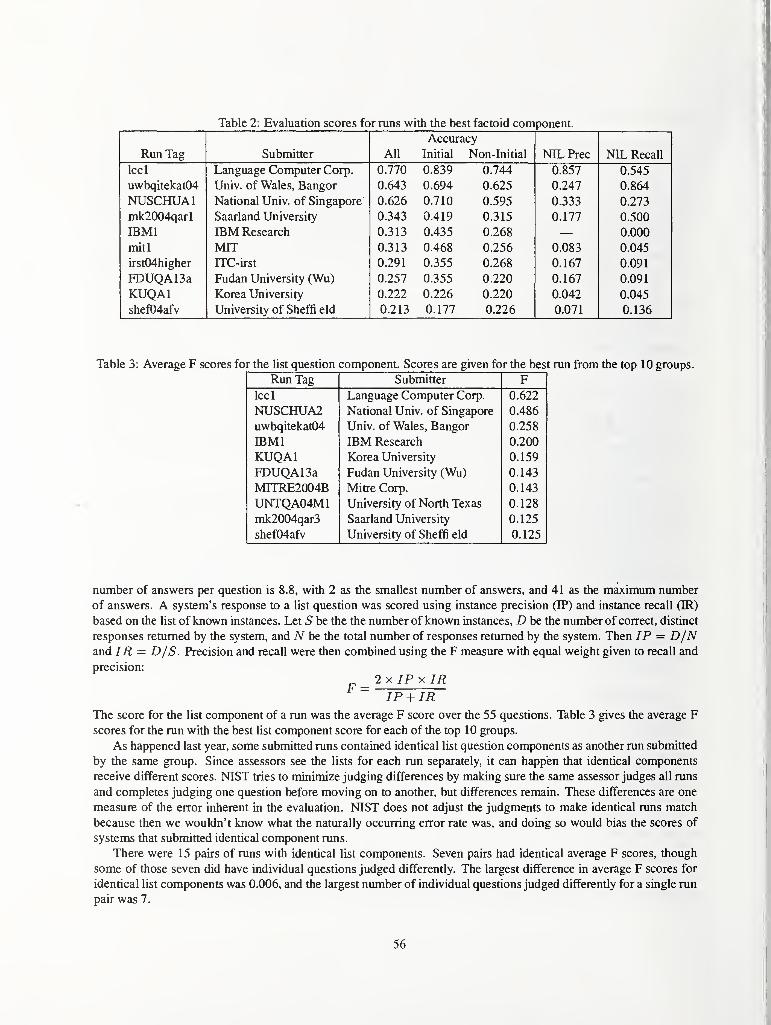
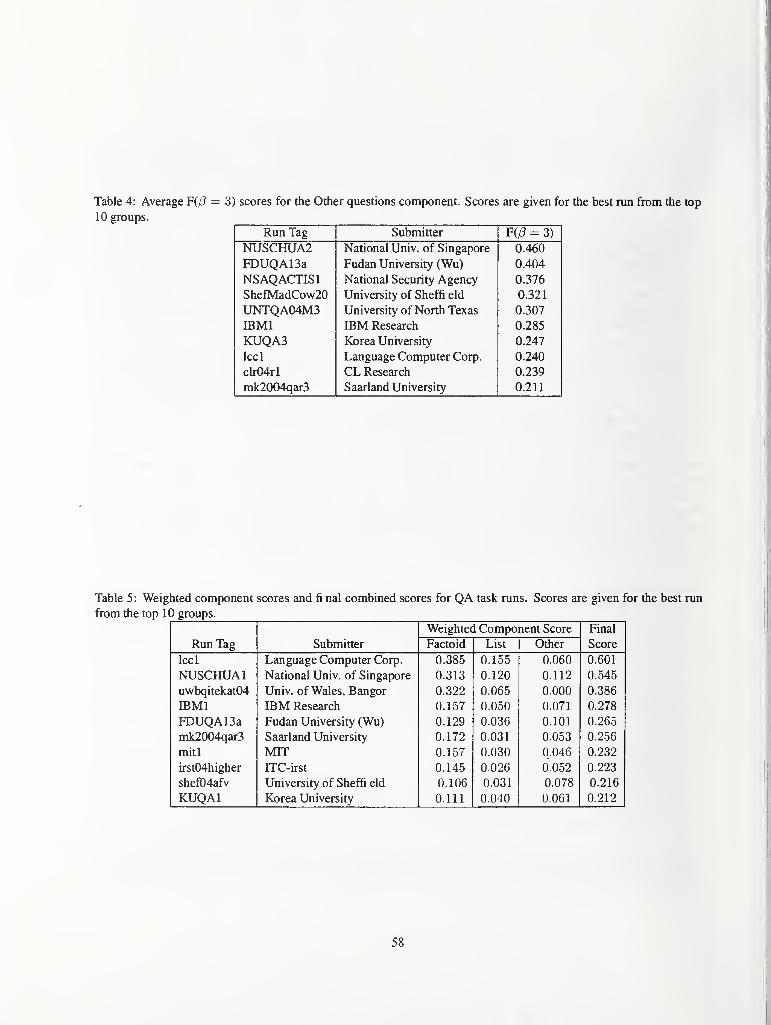
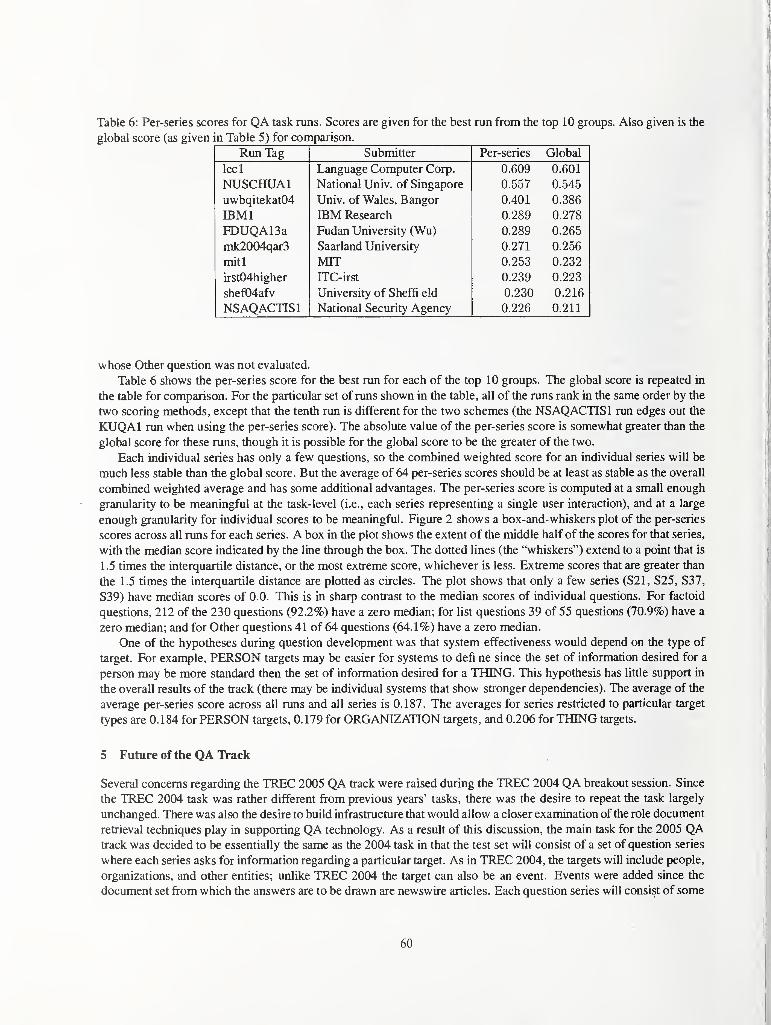
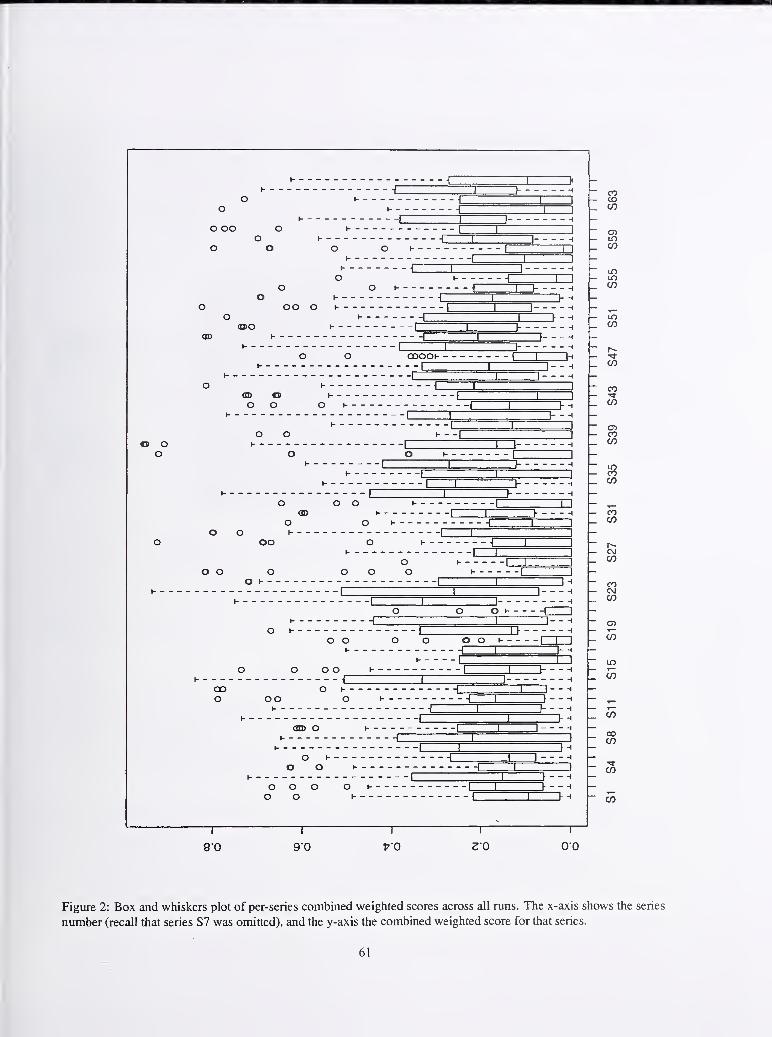

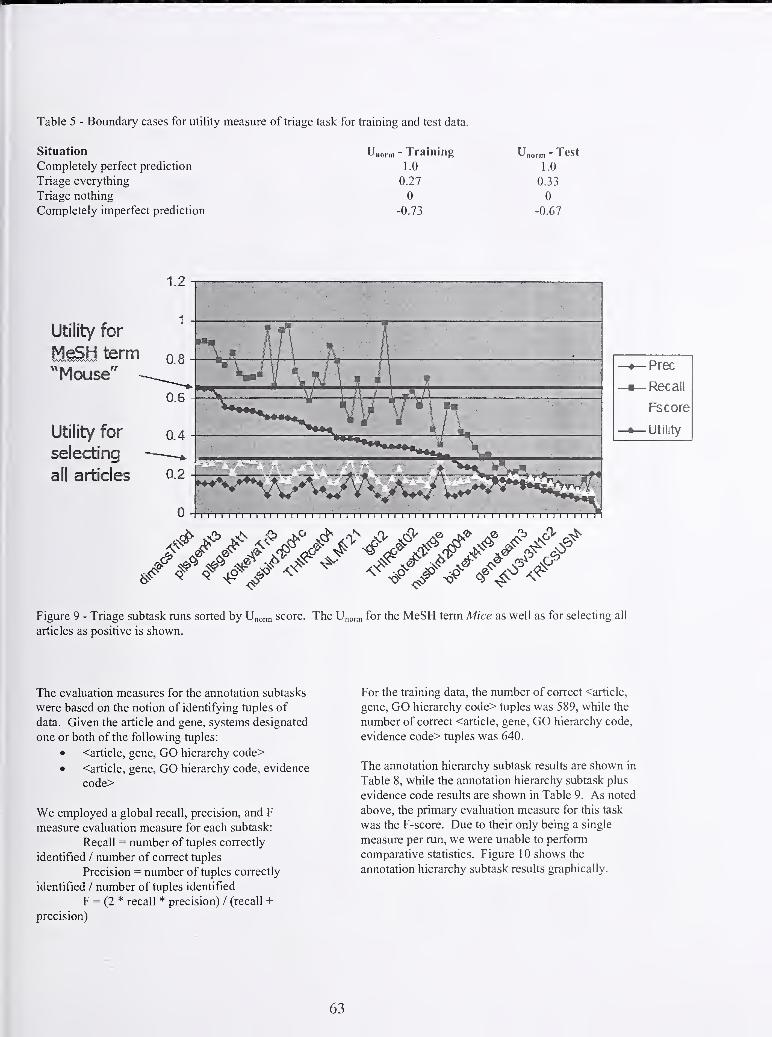
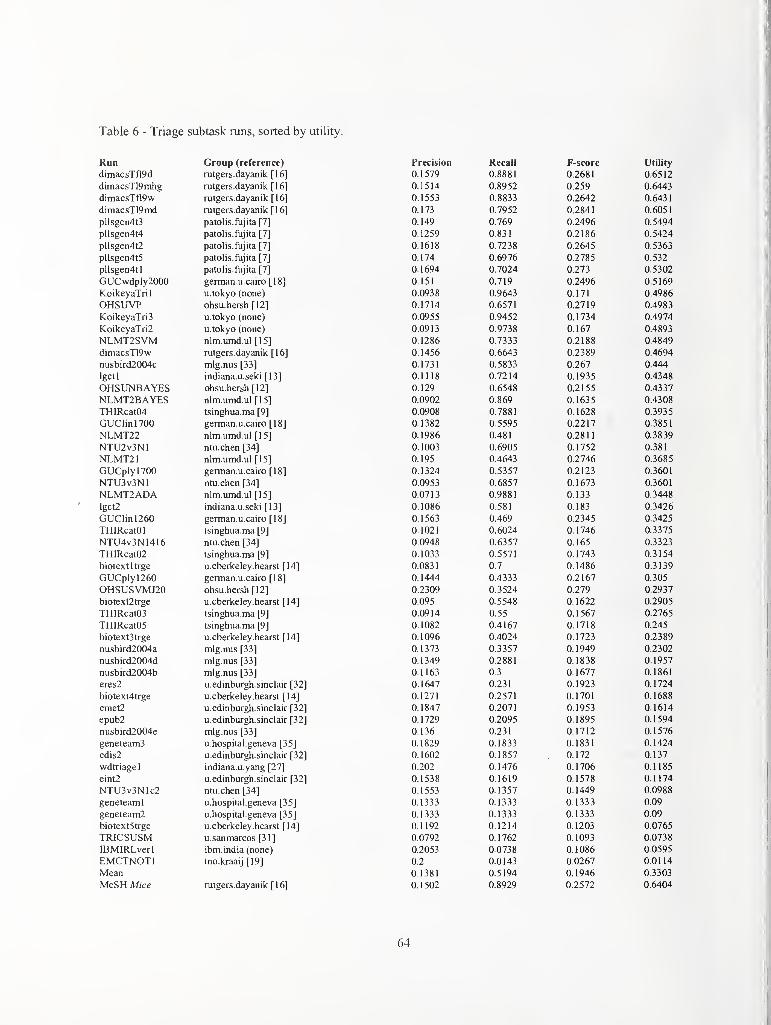
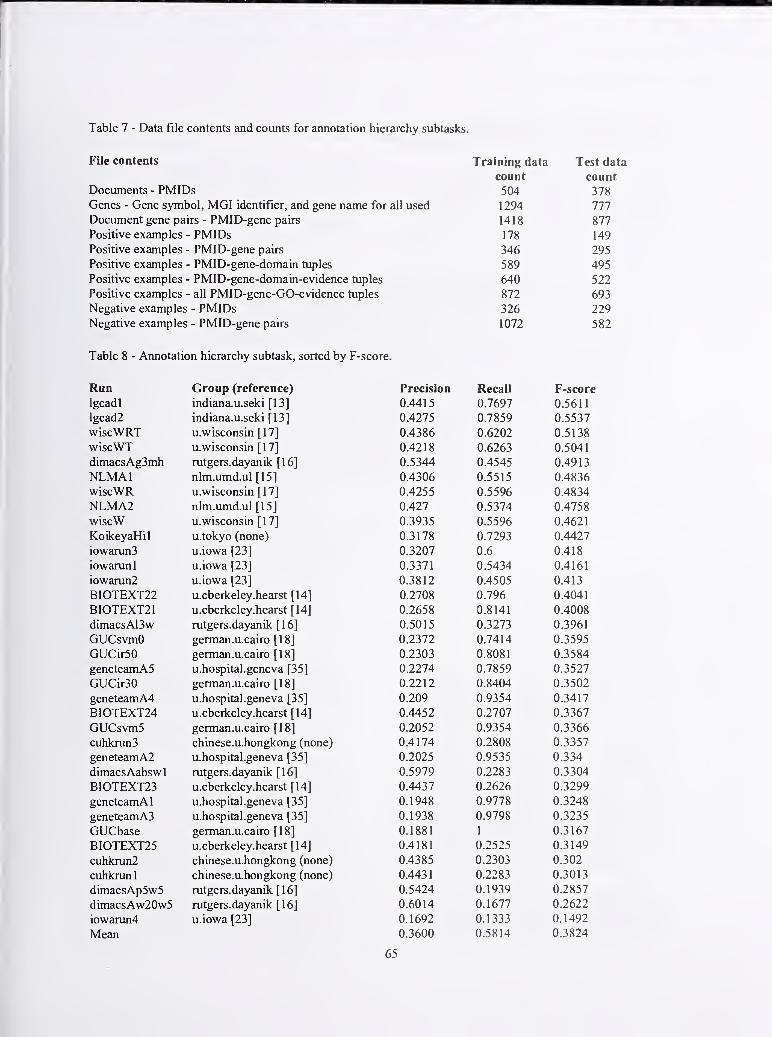
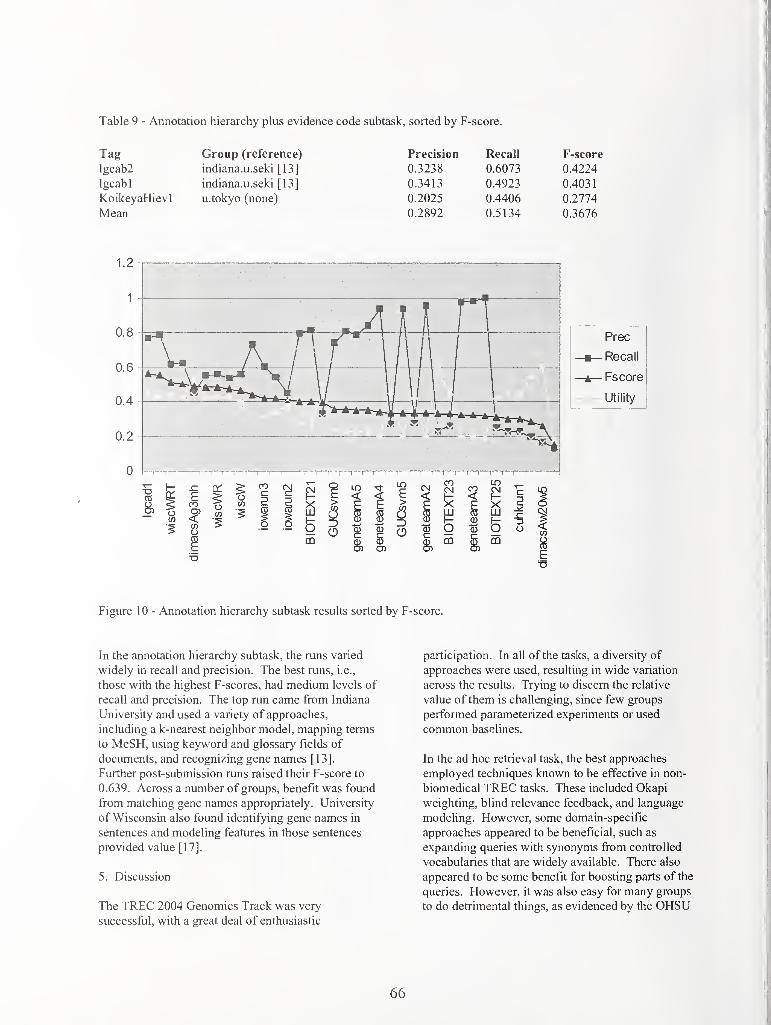
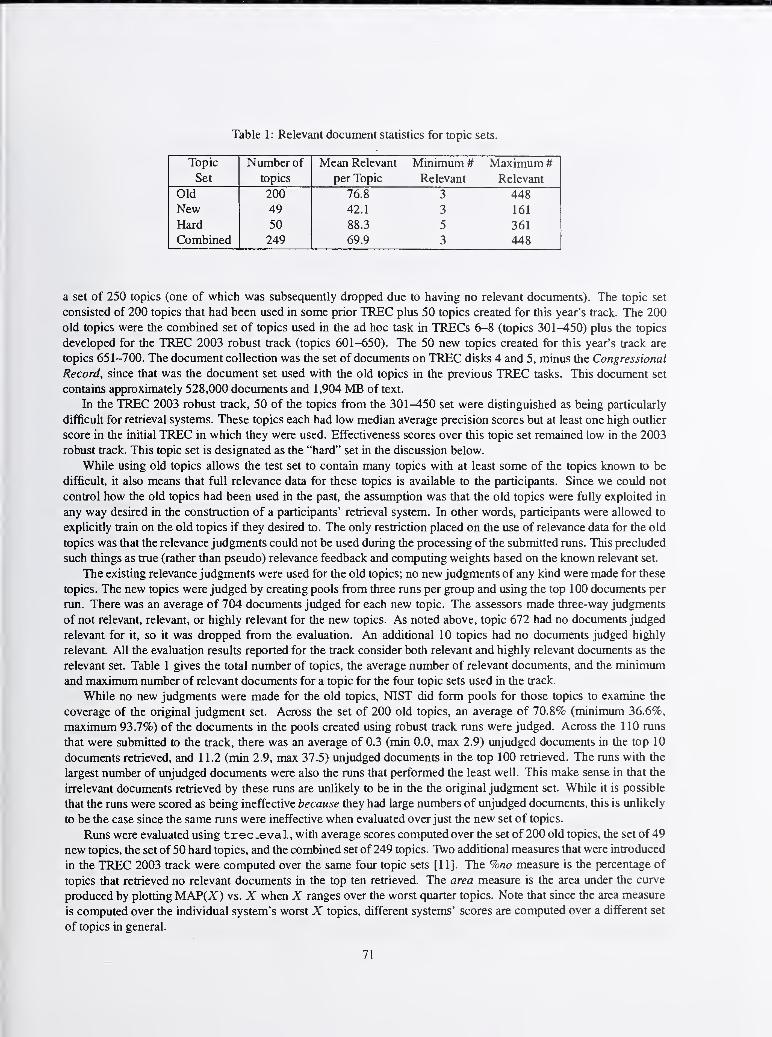

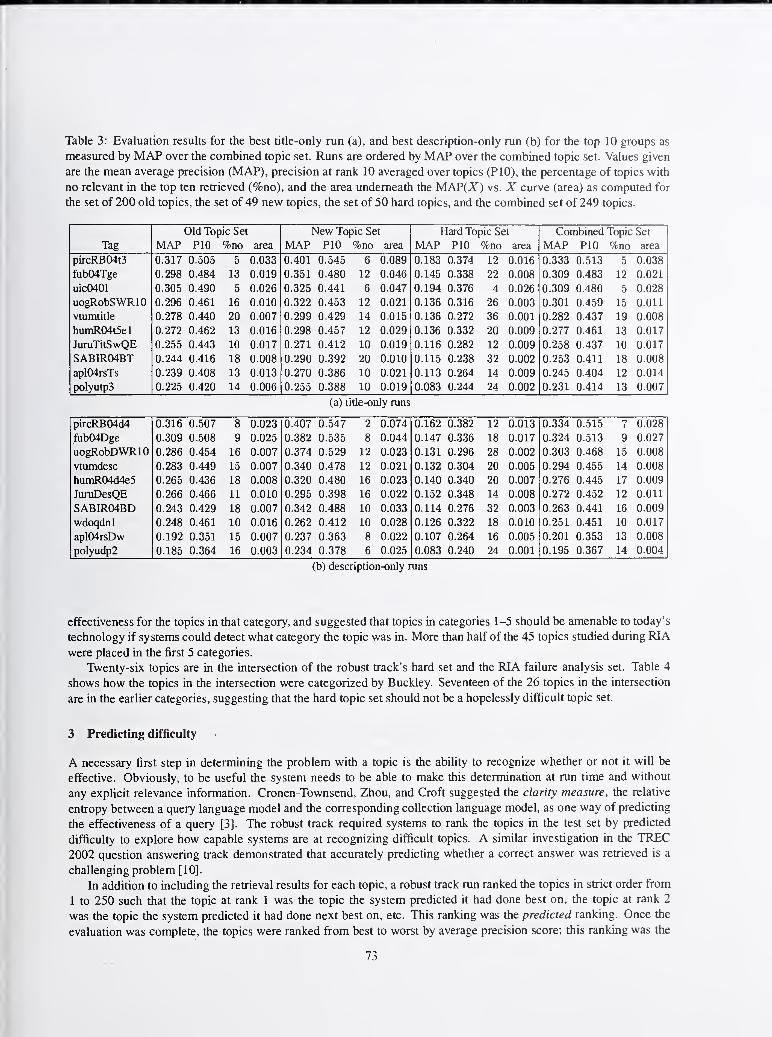
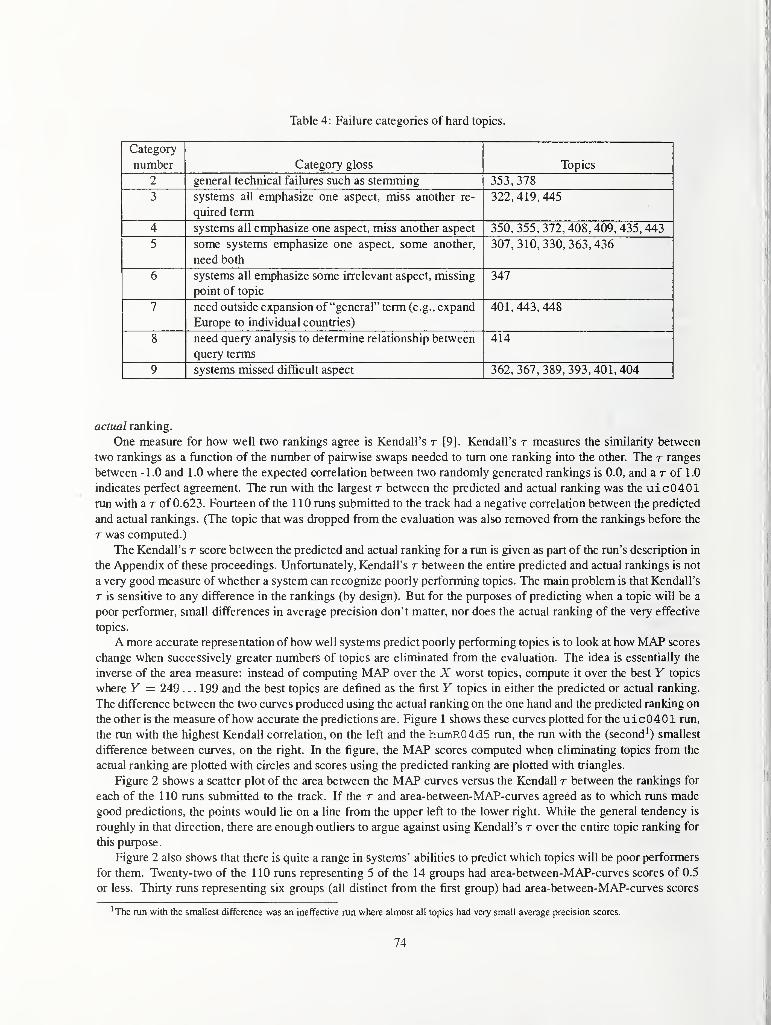
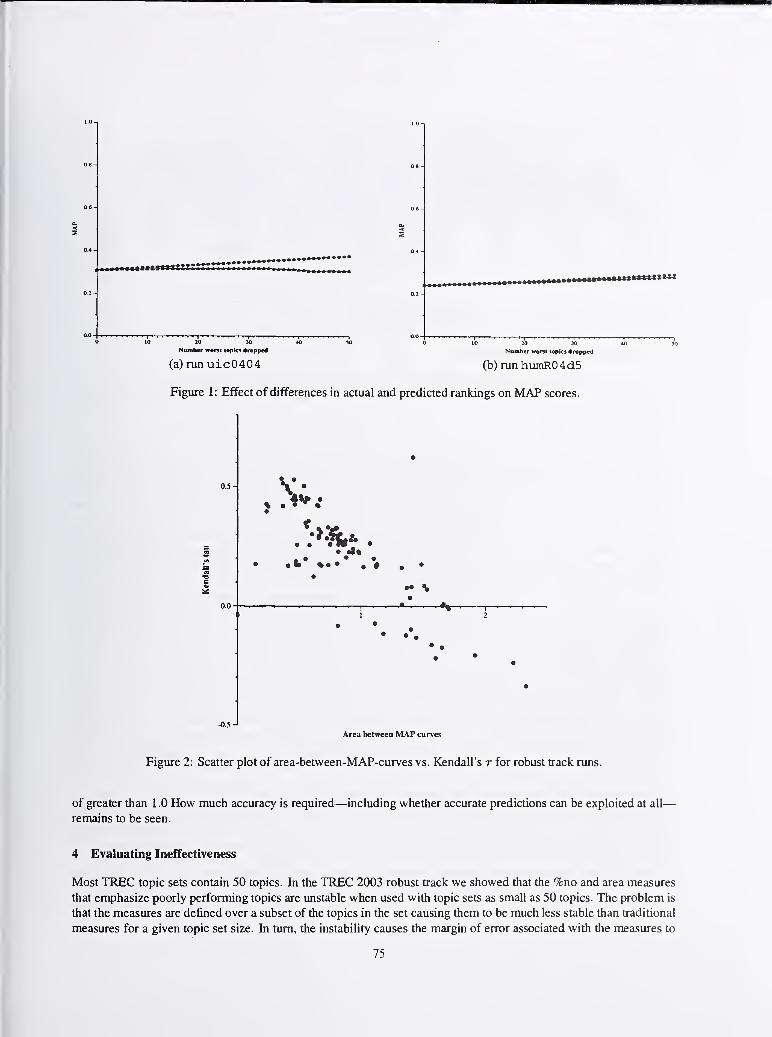
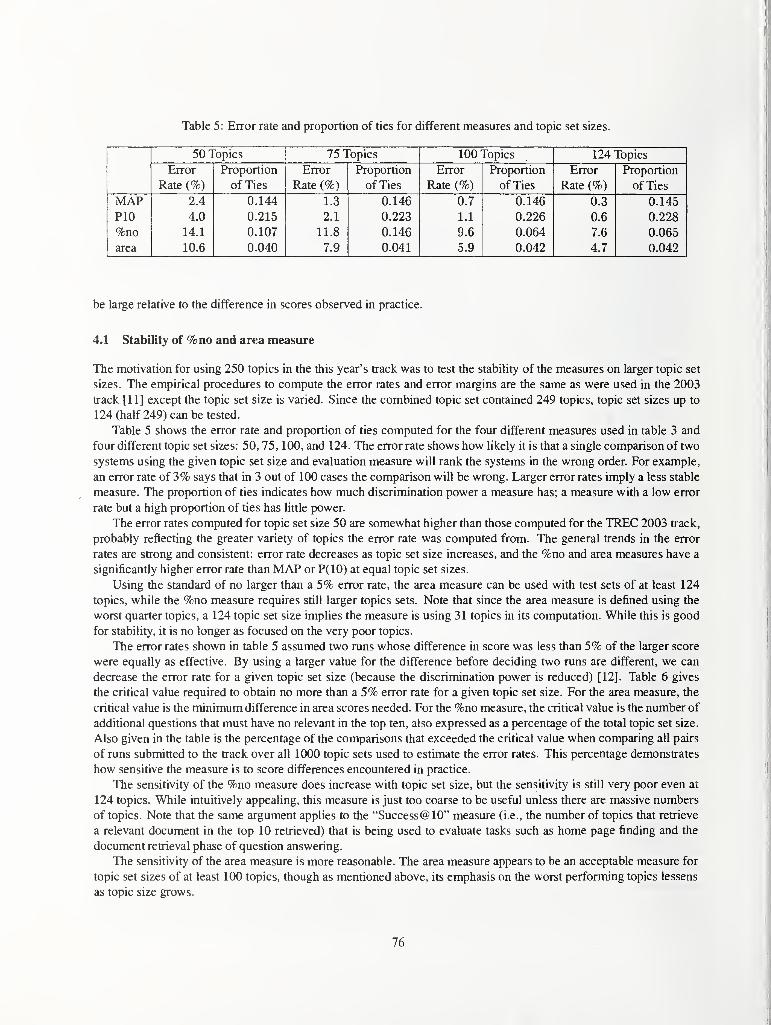
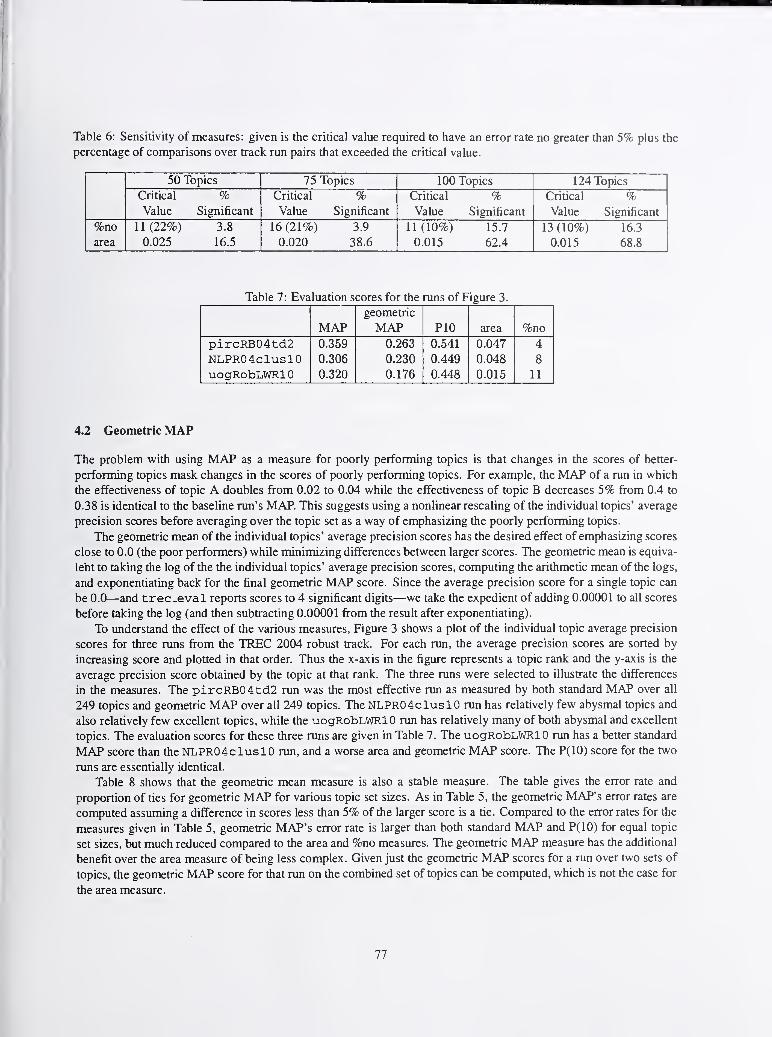
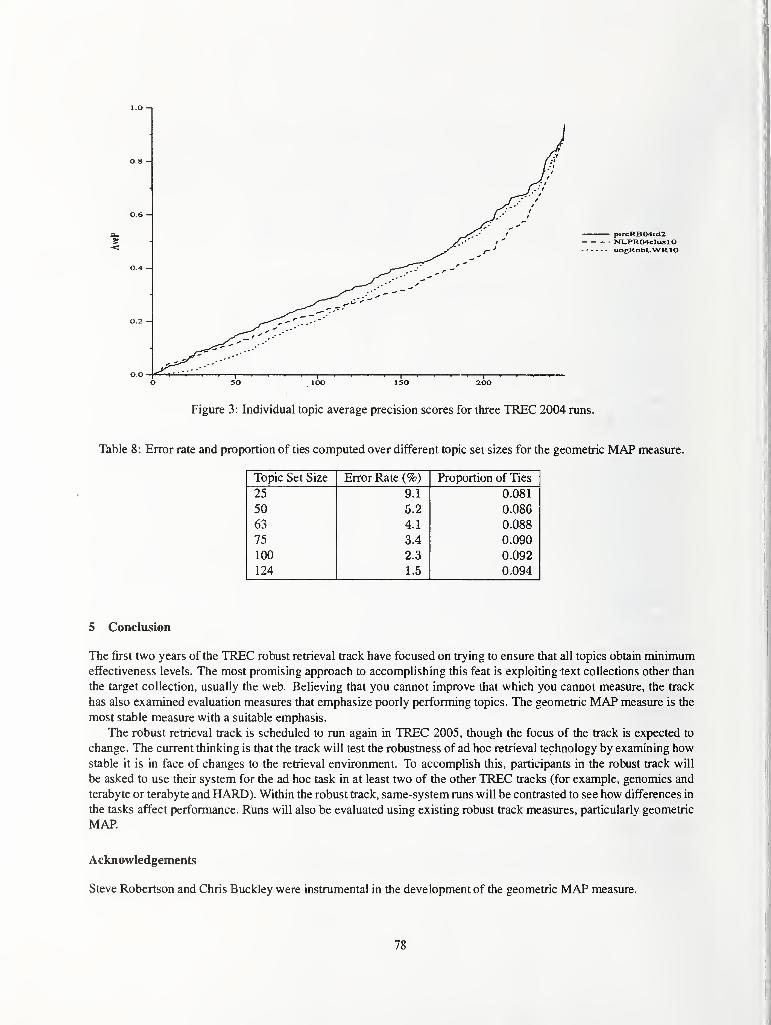
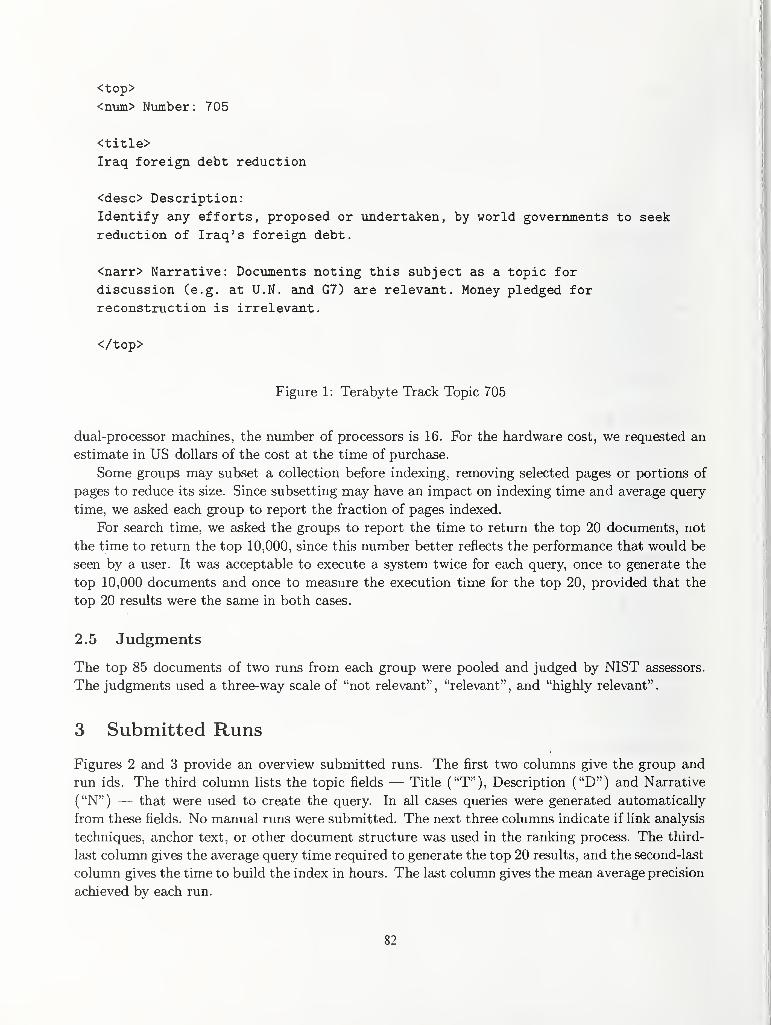
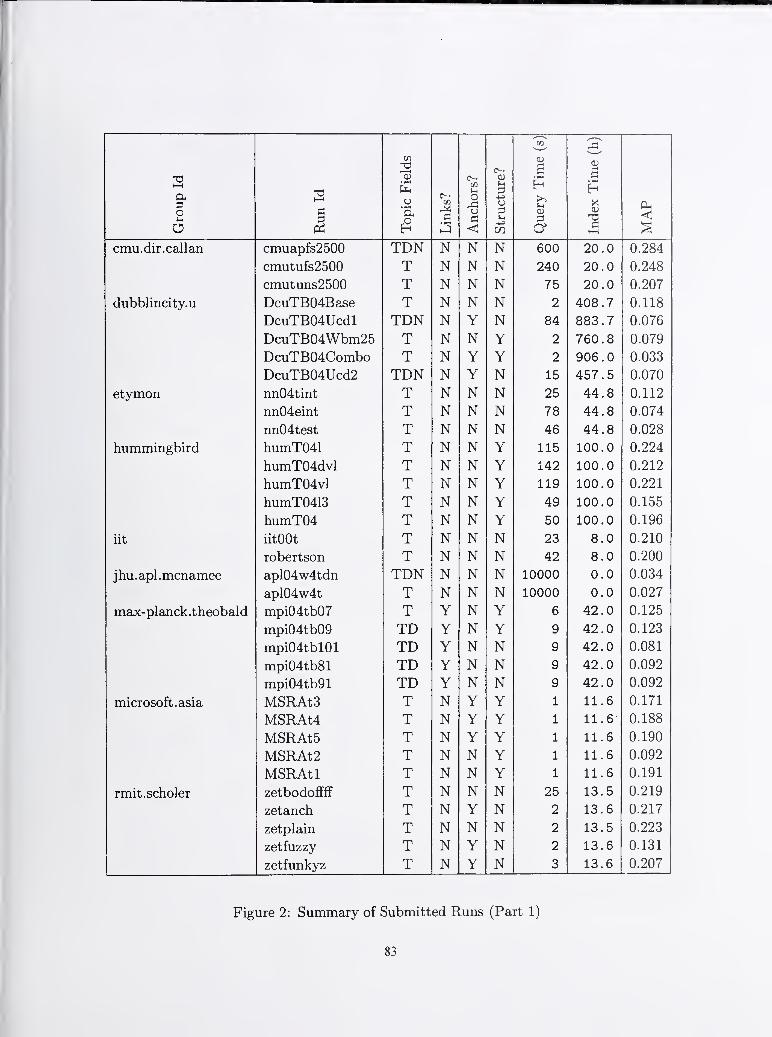
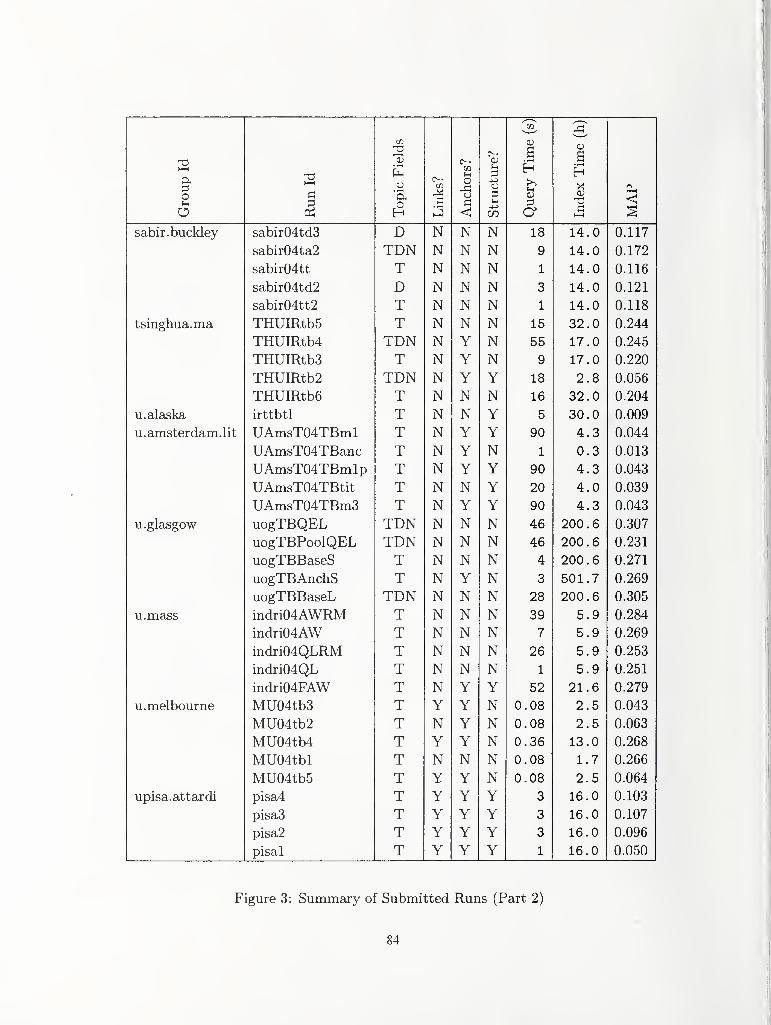
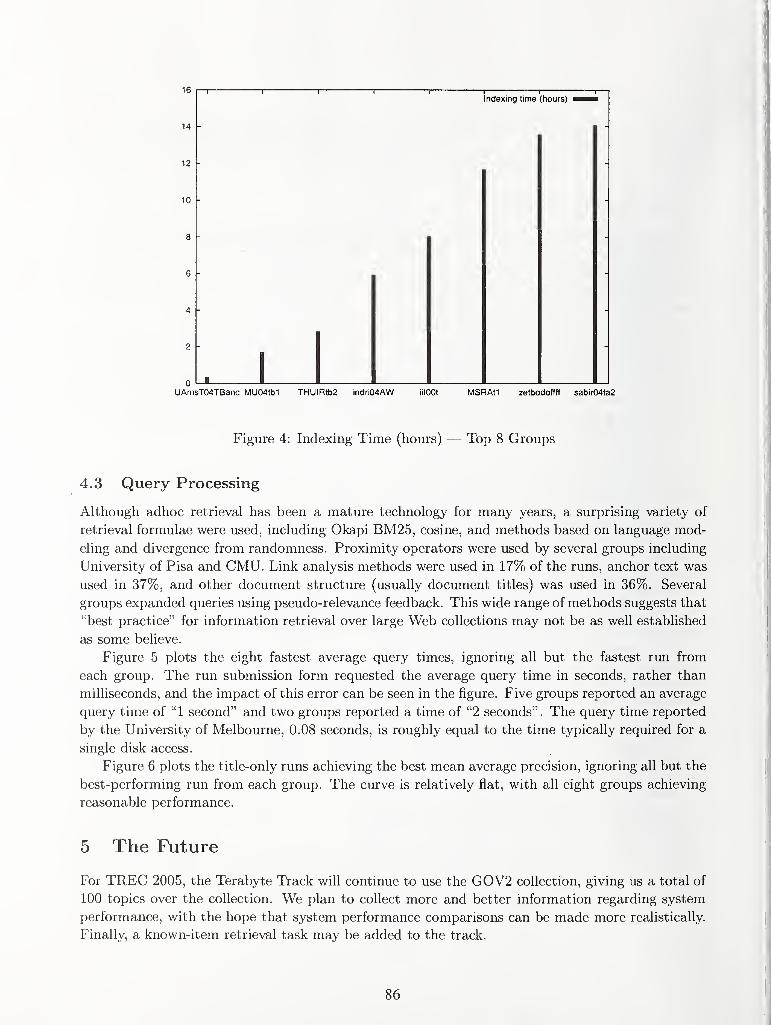

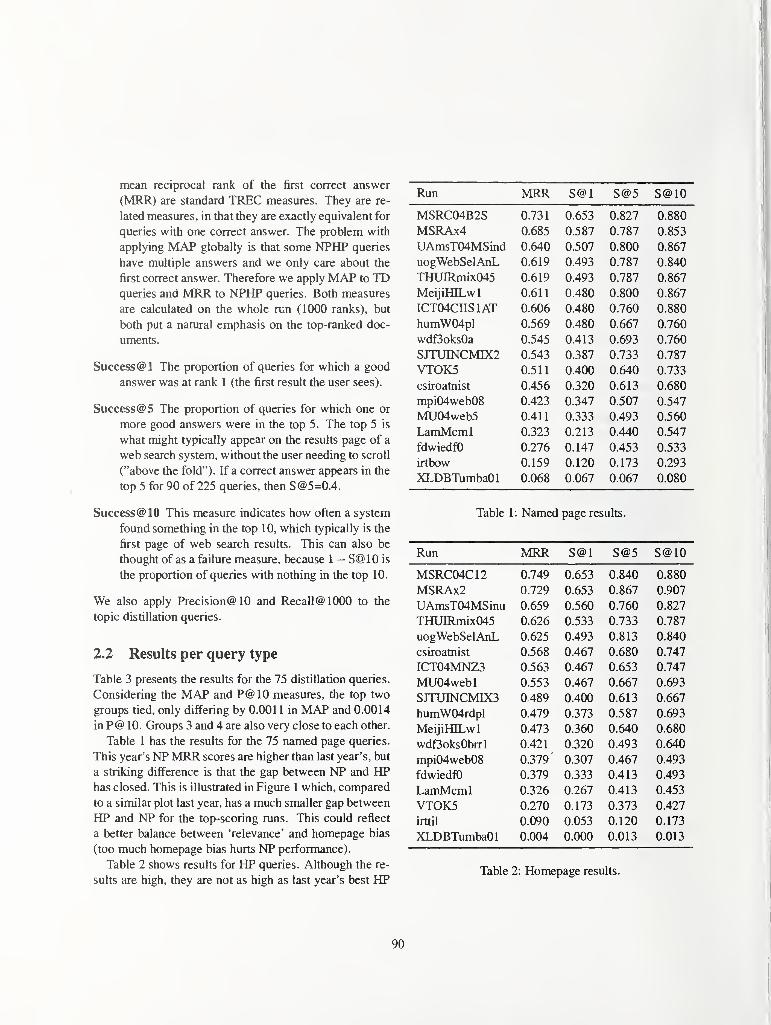
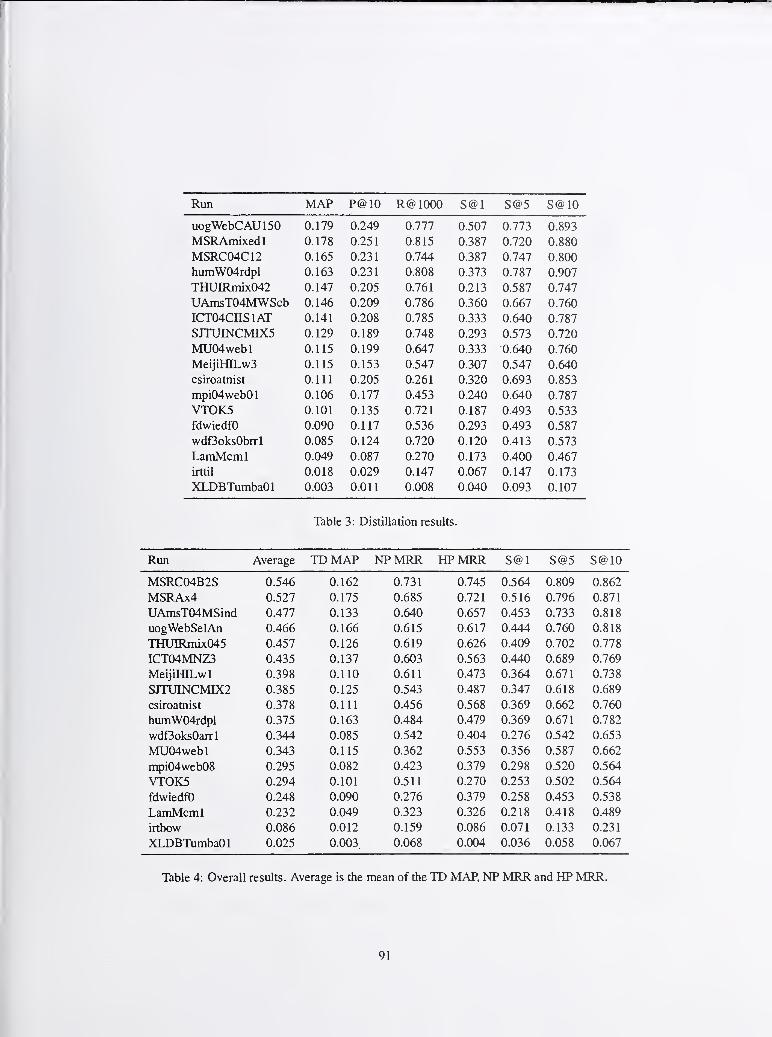

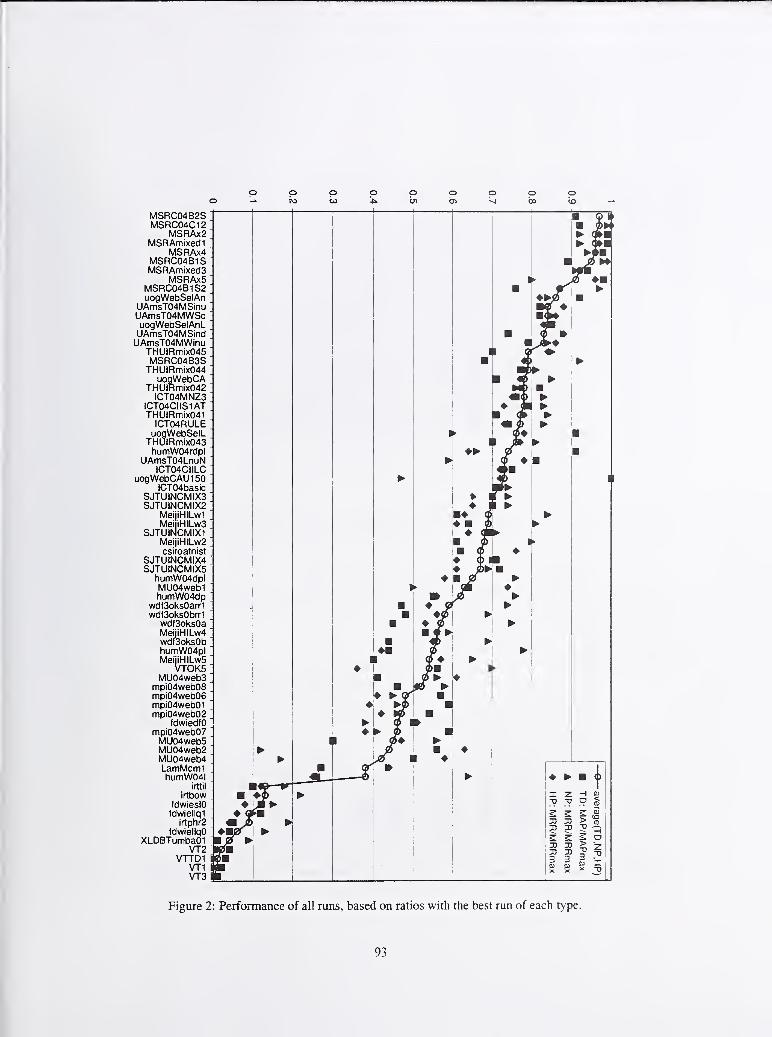

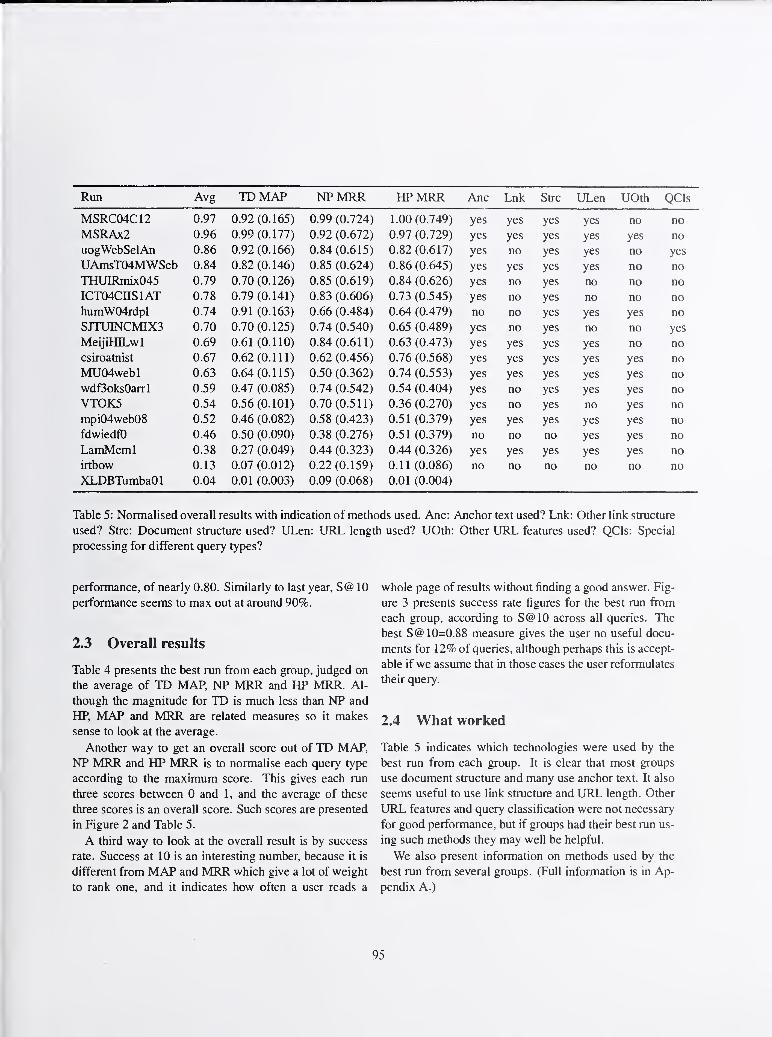
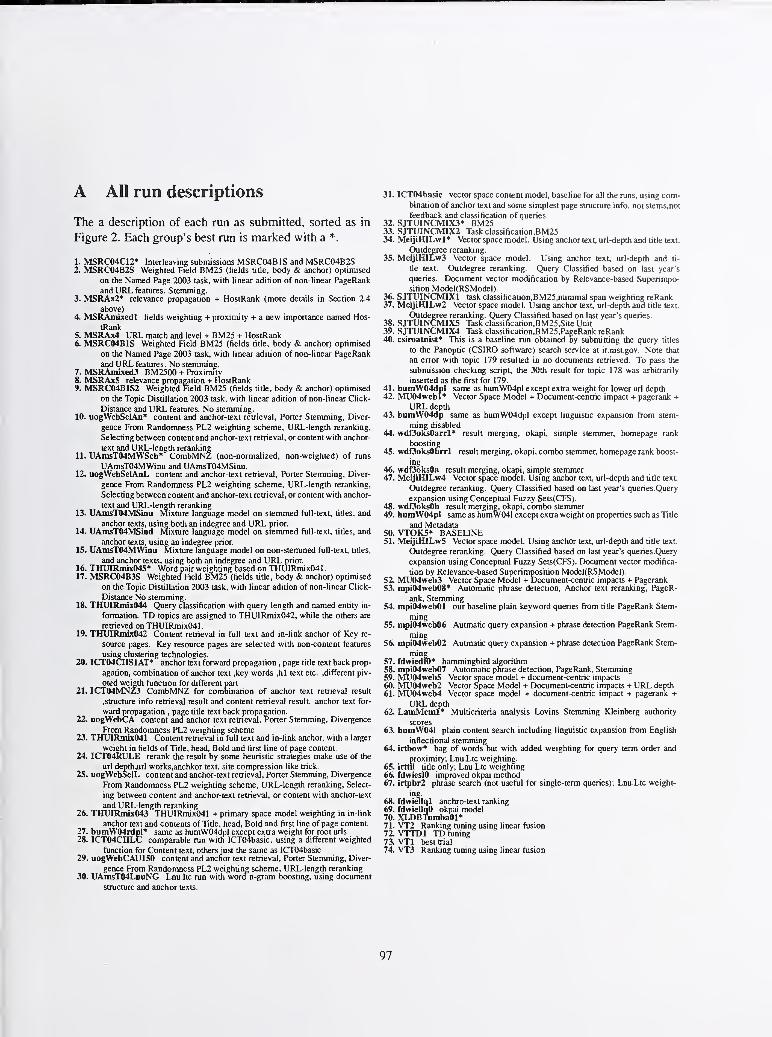


![[J. Res. Natl. Inst. Stand. Technol. 106 Phase Equilibria ...nvlpubs.nist.gov/nistpubs/jres/106/6/j66wwng.pdf · [J. Res. Natl. Inst. Stand. Technol. 106, 1097–1134 (2001)] Phase](https://static.documents.pub/doc/80x56/5a8290bb7f8b9aa24f8e2214/j-res-natl-inst-stand-technol-106-phase-equilibria-j-res-natl-inst.jpg)


![NATL INST OFSTAND S NI8T PUBLICATIONS AlllOt, …nvlpubs.nist.gov/nistpubs/Legacy/TN/nbstechnicalnote1544.pdf · Wenotethattheequation,asgivenby Gardiol[20],isusedtocalculatethe of](https://static.documents.pub/doc/80x56/5aa45dfa7f8b9a517d8bcfda/natl-inst-ofstand-s-ni8t-publications-alllot-asgivenby-gardiol20isusedtocalculatethe.jpg)


![[J. Res. Natl. Inst. Stand. Technol. 107 …[J. Res. Natl. Inst. Stand. Technol. 107, 509–529 (2002)] Decomposition of Wavelength Dispersive X-Ray Spectra Volume 107 Number 6 November–December](https://static.documents.pub/doc/80x56/5f267228aa582a024f7f15f3/j-res-natl-inst-stand-technol-107-j-res-natl-inst-stand-technol-107.jpg)


