25
NATS 101 Lecture 3 Climate and Weather
| Date post: | 20-Dec-2015 |
| Category: |
Documents |
| View: | 214 times |
| Download: | 0 times |

NATS 101
Lecture 3Climate and Weather

Climate and Weather
“Climate is what you expect.
Weather is what you get.”-Robert A. Heinlein

WeatherWeather – The state
of the atmosphere:
for a specific place
at a particular time
Weather Elements
1) Temperature
2) Pressure
3) Humidity
4) Wind
5) Visibility
6) Clouds
7) Significant Weather

Surface Station ModelTemperaturesPlotted F in U.S.Sea Level PressureLeading 10 or 9 is
not plotted Examples:1013.8 plotted as 138998.7 plotted as 9871036.0 plotted as 360Ahrens, p 431
Responsible for boxed parameters

Sky Cover and Weather Symbols
Ahrens, p 431
Ahrens, p 431
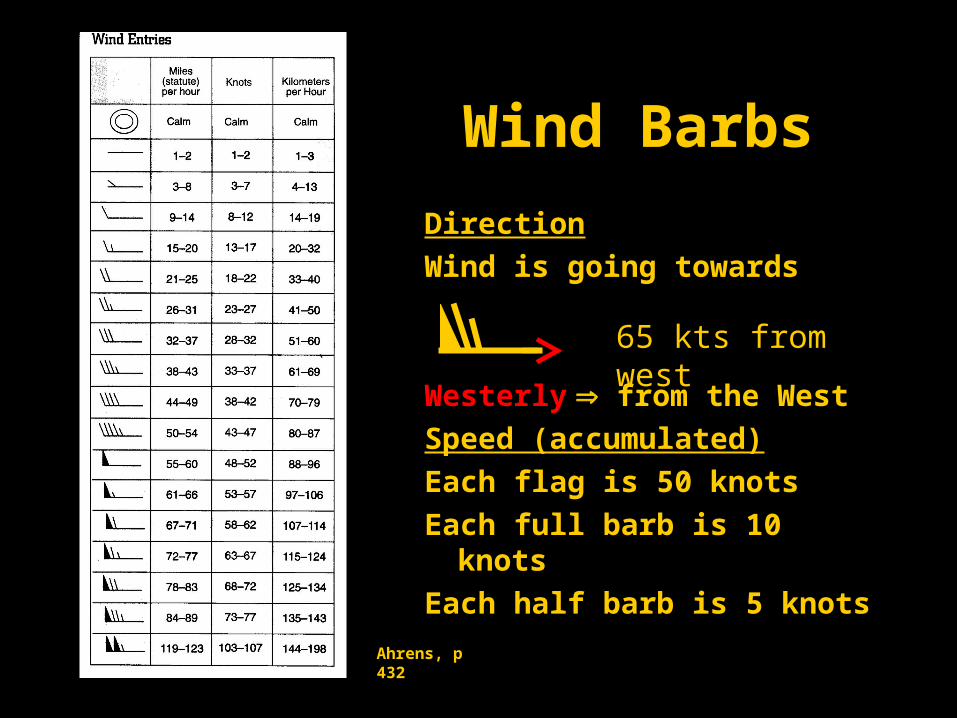
Wind Barbs
Direction
Wind is going towards
WesterlyWesterly from the West
Speed (accumulated)
Each flag is 50 knots
Each full barb is 10 knots
Each half barb is 5 knots
Ahrens, p 432
65 kts from west

temperature dew point
SLP pressure
wind
cloud cover
Ohio State website

Practice Surface Station
Temperate (oF)Pressure (mb) Last
Three Digits (tens, ones, tenths)
Dew Point (later) Moisture
Wind Barb Direction and Speed
Cloud Cover Tenths total coverage
Ahrens, p 431
72
58
111
Decimal point
What are Temp, Dew Point, SLP, Cloud Cover, Wind Speed and Direction?

Practice Surface Station
Sea Level Pressure
Leading 10 or 9 is not plotted
Examples:
1013.8 plotted as 138
998.7 plotted as 987
1036.0 plotted as 360Ahrens, p 431
42
18
998
Decimal point
What are Temp, Dew Point, SLP, Cloud Cover, Wind Speed and Direction?

Surface Map Symbols
• Fronts
Mark the boundary between different air masses…later
Significant weather occurs near fronts
Current US MapAhrens, p 432


Radiosonde
Weather balloons, or radiosondes, sample atmospheric to 10 mb.
They measuretemperature moisture
pressure
They are tracked to get winds
Ahrens, Fig. 1

Radiosonde Distribution
Radiosondes released at 0000 and at 1200 GMT for a global network of stations.
Large gaps in network over oceans and in less affluent nations.
Stations ~400 km apart over North America
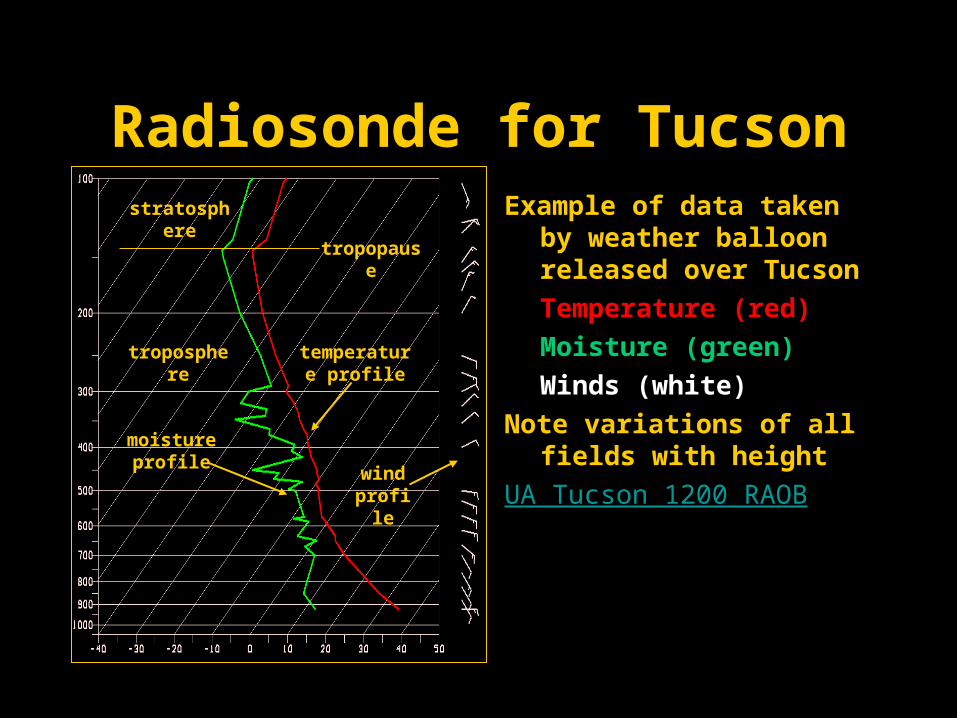
Radiosonde for TucsonExample of data taken by
weather balloon released over Tucson
Temperature (red)
Moisture (green)
Winds (white)
Note variations of all fields with height
UA Tucson 1200 RAOB
troposphere
stratosphere
tropopause
temperature profile
moisture profile
wind profile

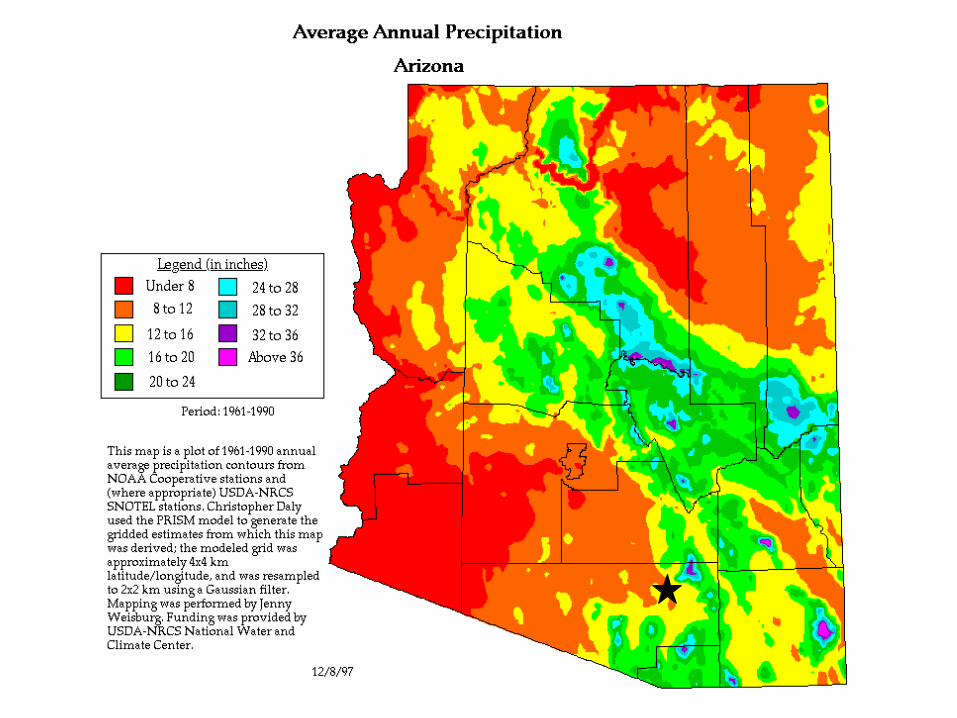
ClimateClimate - Average weather and range of
weather, computed over many years.
Whole year (mean annual precipitation for Tucson, 1970-present)
Season (Winter: Dec-Jan-Feb)
Month (January rainfall in Tucson)
Date (Average, record high and low temperatures for Jan 1 in Tucson)


Climate of TucsonMonthly Averages
Individual months can show significant deviations from long-term, monthly means.

Average and Record MAX and MIN
Temperatures for Date

Climate of TucsonProbability of Last Freeze
Cool Site: Western Region Climate Center

Climate of TucsonProbability of Rain
Cool Site: Western Region Climate Center
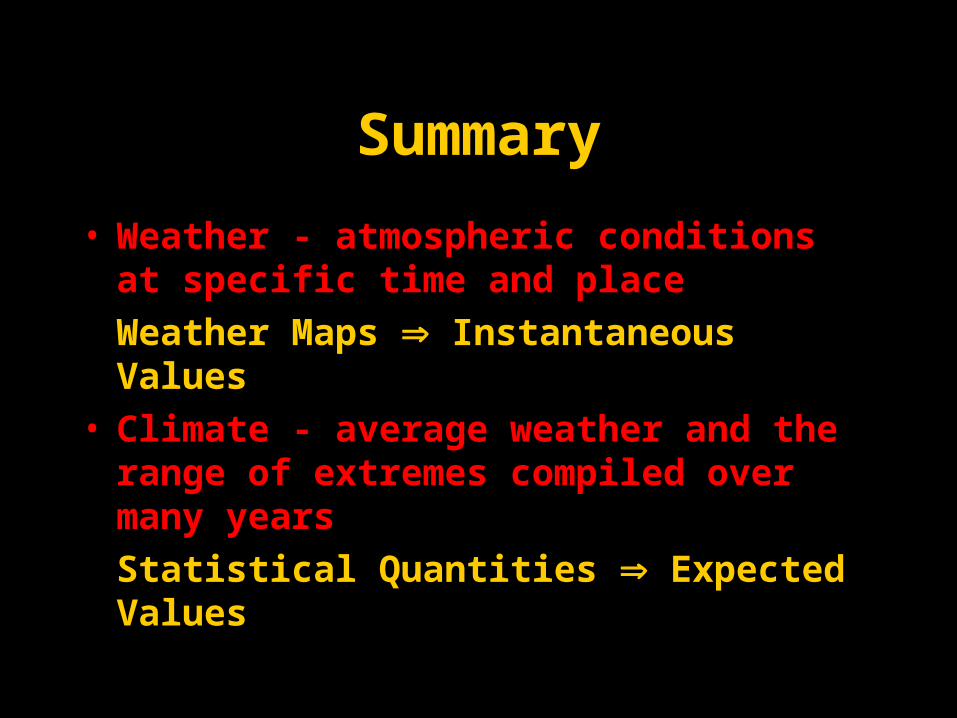
Summary
• Weather - atmospheric conditions at specific time and place
Weather Maps Instantaneous Values• Climate - average weather and the range
of extremes compiled over many years
Statistical Quantities Expected Values

Reading Assignment
• Ahrens
Pages 25-30
Problems 2.1-2.4
(2.1 Chapter 2, Problem 1)
• Don’t Forgot the 4”x 6” Index Cards…


