50
Natural Capital Degradation: Satellite Image of the Loss of Tropical Rain Forest 1975 2003
| Date post: | 29-Dec-2015 |
| Category: |
Documents |
| Upload: | sheila-osborne |
| View: | 216 times |
| Download: | 0 times |

Natural Capital Degradation: Satellite Image of the Loss of Tropical Rain Forest
1975 2003

Core Case Study: Tropical Rain Forests Are Disappearing
• Cover about 2% of the earth’s land surface
• Contain about 50% of the world’s known plant and animal species
• Disruption will have three major harmful effects– Reduce biodiversity– Accelerate global warming– Change regional weather patterns

Ecosystems: What Are They and How Do They Work?
Chapter 3

Cells Are the Basic Units of Life
• Cell Theory• Eukaryotic cell• Prokaryotic cell
Species Make Up the Encyclopedia of Life
• Species
• 1.75 Million species identified
• Insects make up most of the known species
• Perhaps 10–14 million species not yet identified
EOL
Census of Life
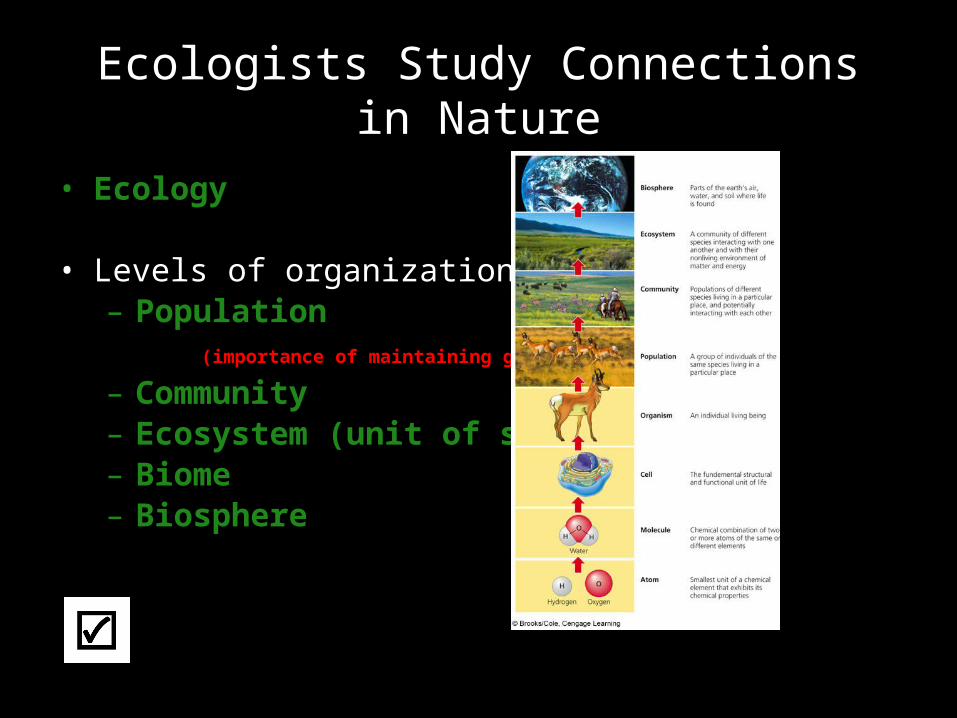
Ecologists Study Connections in Nature
• Ecology
• Levels of organization– Population (importance of maintaining genetic diversity)
– Community– Ecosystem (unit of study)– Biome– Biosphere

Genetic Diversity in a Caribbean Snail Population
Danger of having a population of clones?

Science Focus: Have You Thanked the Insects Today?
• Pollinators
• Eat other insects
• Loosen and renew soil
• Reproduce rapidly
• Very resistant to extinction
Natural services?
See Article

Image: Human eyesight Vs. Bee sight.
The waggle dance - the direction the bee moves in relation to the hive indicates direction; if it moves vertically upwards the direction to the source is directly towards the Sun, the duration of the waggle part of the dance signifies the distance

The Earth’s Life-Support System Has Four Major Components
• Atmosphere• Hydrosphere• Geosphere• Biosphere

Life Exists on Land and in Water
• Biomes
Major Biomes along the 39th Parallel in the U.S.
Study these
later

Aquatic life zonesFreshwater life zones
Lakes and streams
Marine life zonesCoral reefsEstuariesDeep ocean
Study these
later

Three Factors Sustain Life on Earth
• One-way flow of high-quality energy beginning with the sun
• Cycling of matter or nutrients
(Gravity)

What Happens to Solar Energy Reaching the Earth?
• UV, visible, and IR energy
• Radiation – Absorbed by ozone– Absorbed by the earth– Reflected by the earth– Radiated by the atmosphere as heat
• Natural greenhouse effect

Flow of Energy to and from the Earth

Ecosystems Have Living and Nonliving Components
• Abiotic– Water– Air– Nutrients– Rocks– Heat– Solar energy
• Biotic– Living and once living

Major Biotic and Abiotic Components of an Ecosystem
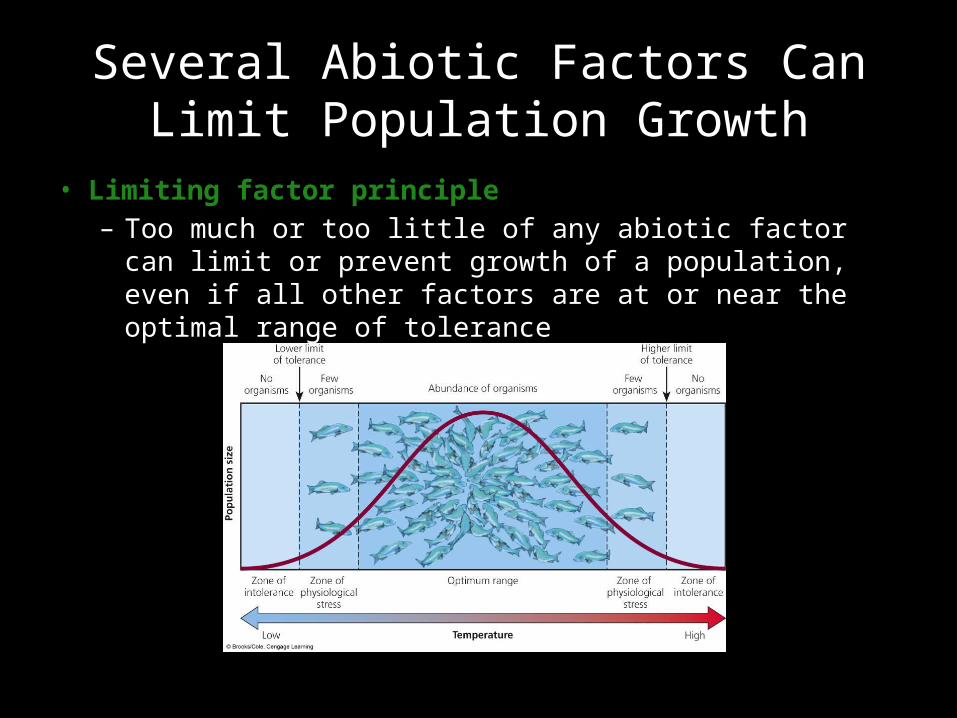
Several Abiotic Factors Can Limit Population Growth
• Limiting factor principle– Too much or too little of any abiotic factor can limit or
prevent growth of a population, even if all other factors are at or near the optimal range of tolerance

Major Trophic Levels
• Producers, autotrophs– Photosynthesis– Chemosynthesis
Consumers, heterotrophsPrimarySecondaryThird and higher level
Decomposers, heterotrophs

Herbivores . . . Carnivores . . . Detritovores . . . omnivores

Energy Metabolism
• Aerobic respiration
• Anaerobic respiration, fermentation

Energy Flow and Nutrient Cycling Sustain Ecosystems and the Biosphere
• One-way energy flow• Nutrient cycling of key materials
Don’t Forget!

Science Focus: Many of the World’s Most Important Species Are Invisible to Us
• Microorganisms– Bacteria– Protozoa– Fungi
Natural services?

Energy Flows Through Ecosystems in Food Chains and Food Webs
• Food chain
• Food web

A Food Chain
Producer . . . Primary consumer . . . Secondary consumer . . .etc.

Simplified Food Web in the Antarctic

Usable Energy Decreases with Each Link in a Food Chain or Web
• Biomass
• Ecological efficiency• Pyramid of energy flow
10%(Pyramid of numbers?)(Pyramid of biomass?)

10
Heat
Tertiaryconsumers(human)
Usable energy availableat each trophic level
(in kilocalories)
Heat
Secondaryconsumers(perch)
100
Fig. 3-15, p. 63
HeatDecomposersHeat
Primaryconsumers(zooplankton)
1,000
Heat
Producers(phytoplankton)
10,000
Stepped Art

Some Ecosystems Produce Plant Matter Faster Than Others Do
• Gross primary productivity (GPP)
• Net primary productivity (NPP)– Ecosystems and life zones differ in their NPP
NPP = GPP - R

Estimated Annual Average NPP in Major Life Zones and Ecosystems

Nutrients Cycle in the Biosphere
• Biogeochemical cycles, nutrient cycles (Homework Assignment)
– Hydrologic– Carbon– Nitrogen– Phosphorus– Sulfur
• Connect past, present , and future forms of life


Water Cycles through the Biosphere
• Natural renewal of water quality: three major processes– Evaporation– Precipitation– Transpiration
• Alteration of the hydrologic cycle by humans– Withdrawal of large amounts of freshwater at rates
faster than nature can replace it– Clearing vegetation– Increased flooding when wetlands are drained

Hydrologic Cycle Including Harmful Impacts of Human Activities
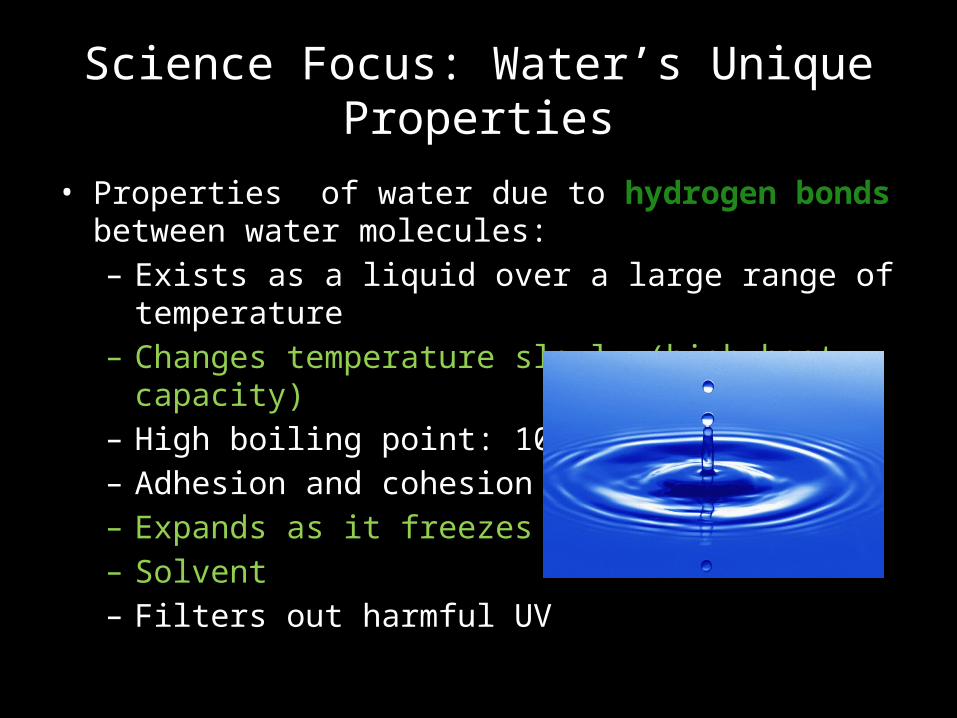
Science Focus: Water’s Unique Properties
• Properties of water due to hydrogen bonds between water molecules:– Exists as a liquid over a large range of temperature– Changes temperature slowly (high heat capacity)– High boiling point: 100˚C– Adhesion and cohesion– Expands as it freezes – Solvent– Filters out harmful UV

Carbon Cycle Depends on Photosynthesis and Respiration
• Link between photosynthesis in producers and respiration in producers, consumers, and decomposers
• Additional CO2 added to the atmosphere– Tree clearing– Burning of fossil fuels
Fossil Fuels

Natural Capital: Carbon Cycle with Major Harmful Impacts of Human Activities

Nitrogen Cycles through the Biosphere: Bacteria in Action
• Nitrogen fixation– Lightning– Nitrogen-fixing bacteria
• Denitrification
• Human intervention in the nitrogen cycle– Additional NO and N2O – Destruction of forest, grasslands, and wetlands– Add excess nitrates to bodies of water– Remove nitrogen from topsoil
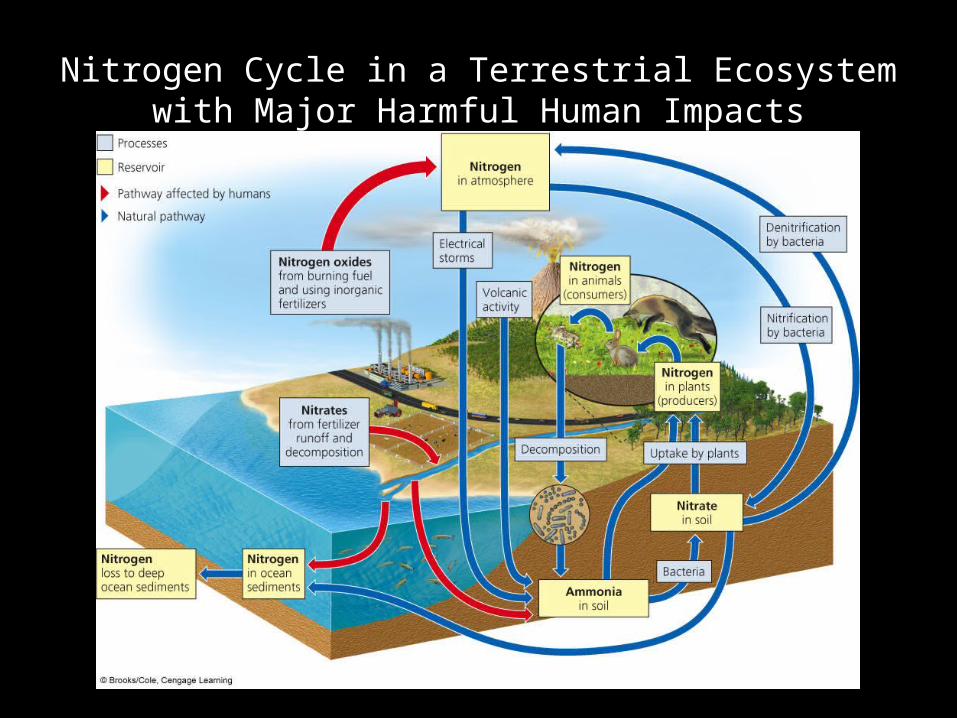
Nitrogen Cycle in a Terrestrial Ecosystem with Major Harmful Human Impacts
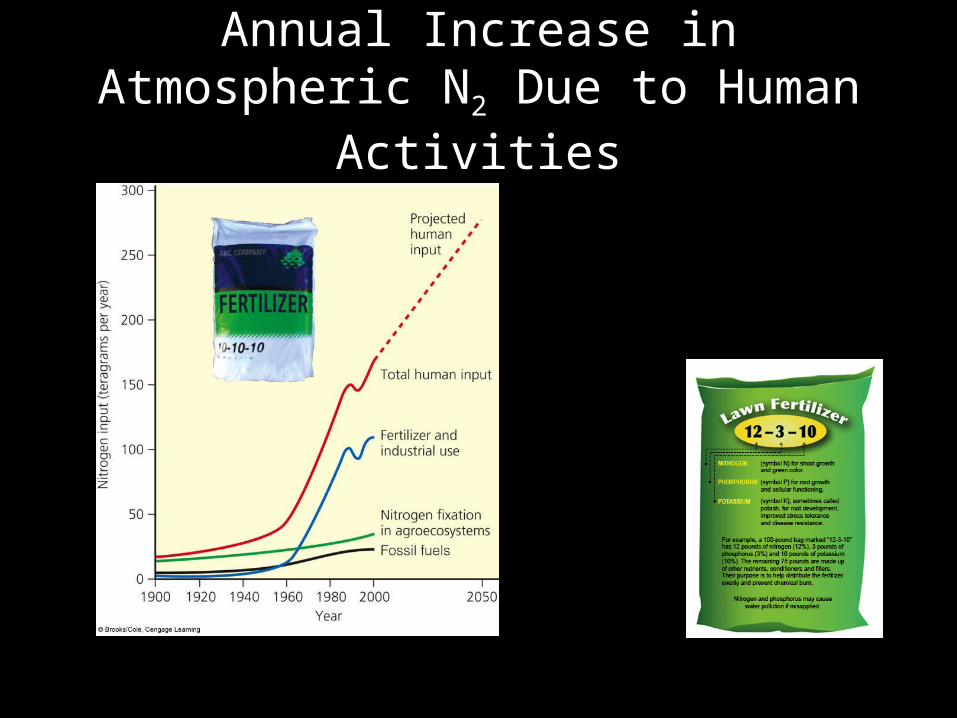
Annual Increase in Atmospheric N2 Due to Human Activities
Phosphorus Cycles through the Biosphere
• Cycles through water, the earth’s crust, and living organisms Erosion, transport, absorption• May be limiting factor for plant growth
• Impact of human activities– Clearing forests– Removing large amounts of phosphate from the earth to
make fertilizers

Phosphorus Cycle with Major Harmful Human Impacts

Sulfur Cycles through the Biosphere
• Sulfur found in organisms, ocean sediments, soil, rocks, and fossil fuels
• SO2 in the atmosphere
• H2SO4 and SO4-
• Human activities affect the sulfur cycle– Burn sulfur-containing coal and oil– Refine sulfur-containing petroleum– Convert sulfur-containing metallic mineral ores

Natural Capital: Sulfur Cycle with Major Harmful Impacts of Human Activities

Some Scientists Study Nature Directly
• Field research: “muddy-boots biology”
• New technologies available– Remote sensors– Geographic information system (GIS) software– Digital satellite imaging
• 2005, Global Earth Observation System of Systems (GEOSS)
Some Scientists Study Ecosystems in the Laboratory
• Simplified systems carried out in– Culture tubes and bottles– Aquaria tanks– Greenhouses– Indoor and outdoor chambers
• Supported by field research

Some Scientists Use Models to Simulate Ecosystems
• Computer simulations and projections
• Field and laboratory research needed for baseline data
We Need to Learn More about the Health of the World’s Ecosystems
• Determine condition of the world’s ecosystems
• More baseline data needed


