20
Vol. 4 No. 1 (Jan-Mar 2010) A Quarterly Newsletter Natural Disasters aND reNovatioN of BuilDiNgs

V o l . 4 N o . 1 ( J a n - M a r 2 0 1 0 ) A Q u a r t e r l y N e w s l e t t e r
Natural Disasters aND
reNovatioN of BuilDiNgs

2
the vulnerability Maps – an indispensable tool for Preparedness against Natural Hazards
With its vast territory, large population and unique geo-climatic conditions, the Indian sub-continent is exposed to natural catastrophes almost on a regular basis. The natural hazards like floods, cyclones, droughts and earthquakes are neither rare nor unusual in the country. While the vulnerability varies from region to region, a large tract of the country are often exposed to such natural hazards, which often turn into disasters causing significant injury, deaths and destruction of property. Concerned with the impact of natural hazards and realising that the preparedness and prevention are integral components of the process of development, the Governments at the Central and State levels have gradually introduced modernisation in such fields as forecasting, prevention and rescue operations, by applying satellite, remote sensing, computerised systems and other technologies.
Apropos the Yokohama Strategy for Safer World adopted at the UN sponsored Conference in 1994, the Ministry of Urban Development, Govt. of India had constituted an Expert Group to study various issues connected with preparedness, prevention and mitigation of natural disasters particularly with respect to housing. The Ministry had identified the following areas having a bearing on housing and related infrastructure where the following initiatives are required to be taken with regard to prevention:
There is a need to identify vulnerable areas with • reference to forms of natural disaster having a potential of damaging housing stock and related infrastructure, such as earthquake, cyclones, floods, etc. A basic requirement in this regard is to prepare what can be called a Vulnerability Atlas, showing the areas vulnerable on account of one or more natural disasters capable of damaging housing stock and related infrastructure.
For each area shown in the Vulnerability Atlas, • depending on the nature of natural disasters, a techno-legal regime can be worked out for propagation and enforcement.
Techno-legal regimes for the retrofitting of existing • housing stocks in vulnerable areas can be worked out and, on that basis, a programme for strengthening the existing housing stock can be chalked out and implemented, possible with assistance from suitable multi-lateral and bilateral foreign agencies.
Pursuant to the terms of reference, the Expert Group, inter alia, formulated the Vulnerability Atlas of India with respect to earthquakes, cyclones and floods. Recognising that rising population and urbanisation continue to
increase disaster risks, the Group has also made several recommendations with regard to prevention and preparedness and disaster resistant construction technologies which could be promoted through appropriate administrative action and modifications in the land use zoning practices, building bye-laws and regulations. The Atlas, with the help of State and Union Territory wise hazard maps as well as housing risk tables for each district, indicates the overall vulnerability of different regions and the recommendations of the Group provide technical guidelines for construction of new houses as well as for retrofitting of the existing ones in different zones. One of the major recommendations is to establish well structured techno-legal regimes for effective enforcement of disaster resistant planning and construction techniques.
Realizing the limitation of scale of the existing country level zoning maps for earthquakes, cyclones and floods the Group found it necessary to prepare the hazard maps on larger scale of each State and Union Territories so that the information is readily available to the planners, administrators and disaster managers. To facilitate action at state and district levels the Vulnerability Atlas contains the Seismic Hazard Map, Cyclone and Wind Hazard Map, Flood Prone Area Map for each State and Union Territory and the Housing Stock Vulnerability Table for each District indicating the level of risk to which different house types could be subjected during the occurrence of natural hazards in future.
Correlating the house types, the hazard intensities on the maps and the damage risk levels, the housing damage risk tables have been generated. For the country as a whole, for each state and union territory also an overall risk table has been developed. Such tables are then prepared for each of the districts state-wise.
For the sake of easy understanding, a few of the terms commonly used in dealing with natural disasters are defined below:
Hazard : a threatening event, or the probability of occurrence of a potentially damaging phenomenon (an earthquake, a cyclonic storm or a large flood) within a given time period and area.
Disaster : a serious disruption of the functioning of a society, causing widespread human, material and environmental losses which exceed the ability of the affected society to cope, using only its own resource. Disasters are often classified according to their speed of onset (sudden or slow) or according to their cause (natural or man-made).
From theEditor’s Desk

3
Risk : the expected number of lives lost, persons injured, damage to property and disruption of economic activity due to a particular natural phenomenon, and consequently the product of specific risk and element at risk.
Vulnerability : the degree of loss to a given element at risk or set of such elements resulting from occurrence of a natural phenomenon (or man made event) of a given magnitude and expressed on a scale from 0.0 (no damage or loss) to 1.0 (total loss).
Mitigation : measures taken in advance of a disaster aimed at decreasing or eliminating its impact on society and on environment.
Preparedness : activities designed to minimise loss of life and damage, to organise the temporary removal of people and property from a threatened location and facilitate timely and effective rescue, relief rehabilitation.
Prevention : encompasses activities designed to provide permanent protection from disasters. It includes engineering and other physical protective measures, and also legislative measures controlling land-use and urban planning.
This issue of the ‘Rebuild’ is devoted to offering some insight into the renovation and retrofitting of buildings damaged by the natural causes and more particularly by earthquakes.
We hope the information furnished here will be of interest to our readers and patrons.
The latest seismic Zoning Map of India and the Housing Vulnerability Table under various hazard intensities are provided for quick reference in page 4 and 5 respectively.

4
68 º 72 º 76 º 80 º 84 º 88 º 92 º 96 º
8 º
12 º
16 º
20 º
24 º
28 º
32 º
36 º
8 º
12 º
16 º
20 º
24 º
28 º
32 º
36 º
LEGENDZONE IIZONE IIIZONE IVZONE V
SRINAGAR
JAMMU
AMRITSAR
MEERUT
DEHRADUN
DELHI
AGRA
LUCKNOWKANPUR
VARANASIPATNA
INDOREBARODA
AHMEDABAD
BHAVNAGAR
JAMNAGAR RAJKOT
SURAT
PUNEBHIWANDI
NASHIK
MUMBAI
KOLKATA
BHUBANESWARCUTTACK
CHENNAI
VIJAYWADA
COIMBATORE
MANGALORE
TRIVANDRUM
GUWAHATI
JABALPUR
68 º 72 º 76 º 80 º 84 º 88 º 92 º 96 º
* This is a Guide Map. It has no correctness with State or International boundaries. Not to Scale
BAREILLY
KOCHI
CALICUTLAKSHADWEEP
ANDAMAN&
NICOBAR ISLAND
latest seismic Zoning Map of india

5
Cat
eg
ory
Ty
pe
of
Wal
lS
eis
mic
Zo
ne
Win
d V
elo
city
m/s
Flo
od
P
ron
e
VIV
IIIII
55
& 5
04
74
4 &
39
33
A1
Mu
d a
nd
Un
bu
rnt
Bri
ckV
HH
ML
VH
HM
LV
H
A2
S
ton
e W
all
VH
HM
LH
ML
VL
VH
B
Bu
rnt
Bri
cks
Wal
lH
ML
VL
HM
LV
LH
/M
C1
Co
ncr
ete
Wal
lM
LV
LV
LL
VL
VL
VL
L/V
L
C2
W
oo
d W
all
ML
VL
VL
VH
HM
LH
X
Oth
er M
ater
ials
MV
LV
LV
LV
HH
ML
VH
Cat
eg
ory
Ty
pe
of
Ro
of
R1
Lig
ht
Wei
gh
t S
lop
ing
Ro
of
MM
LV
LV
HV
HH
MV
H
R2
H
eavy
Wei
gh
t S
lop
ing
Ro
of
HM
LV
LH
ML
VL
H
R3
Fl
at R
oo
fD
amag
e R
isk
as p
er t
hat
fo
r th
e W
all s
up
po
rtin
g it
Bu
ildin
g C
ate
go
ry :
(By
Wal
l Mat
eri
al)
Cat
eg
ory
- A
:B
uild
ing
s in
fie
ld-s
ton
e, r
ura
l str
uct
ure
s u
nb
urn
t b
rick
ho
use
s cl
ay h
ou
ses.
Cat
eg
ory
- B
:O
rdin
ary
bri
ck b
uild
ing
, bu
ildin
gs
of
the
larg
e b
lock
an
d p
refa
bri
cate
d t
ype,
hal
f-ti
mb
ered
str
uct
ure
s, b
uild
ing
in n
atu
ral h
ewn
sto
ne.
Cat
eg
ory
- C
:R
ein
forc
ed c
on
cret
e b
uild
ing
, wel
l bu
ilt w
oo
den
str
uct
ure
s.
Cat
eg
ory
- X
:O
ther
mat
eria
ls n
ot
cove
red
in A
,B,C
, lik
e lig
ht
shee
ts a
nd
bio
mas
s m
ater
ials
No
te :
Dam
age
Ris
k is
ind
icat
ed a
ssu
min
g h
eavy
fla
t ro
of
in c
ases
A, B
an
d C
(R
ein
forc
ed C
on
cret
e) b
uild
ing
.
Bu
ildin
g C
ate
go
ry :
(By
Ro
of
Mat
eri
al)
Cat
eg
ory
- R
1 :
Lig
ht
Wei
gh
t S
lop
ing
Ro
of
(Gra
ss, T
hat
ch, B
amb
oo
, Wo
od
, Mu
d, P
last
ic, P
oly
then
e, G
I Met
al, A
sbes
tos,
Sh
eets
, etc
)
Cat
eg
ory
- R
2 :
Hea
vy W
eig
ht
Slo
pin
g R
oo
f (T
iles,
Sla
te)
Cat
eg
ory
- R
3 :
Flat
Ro
of
(Bri
ck, S
ton
e, C
on
cret
e)
No
tes
1. F
loo
d p
ron
e ar
ea in
clu
des
th
at p
rote
cted
are
a w
hic
h m
ay h
ave
mo
re s
ever
e d
amag
e u
nd
er f
ailu
re o
f p
rote
ctio
n w
ork
s. I
n s
om
e o
ther
are
as t
he
loca
l d
amag
e m
ay b
e se
vere
un
der
hea
vy r
ain
s an
d c
ho
cked
dam
age
EQ
Zo
ne
V :
Ver
y H
igh
Dam
age
Ris
k Z
on
e (M
SK
>IX
)E
Q Z
on
e IV
: H
igh
Dam
age
Ris
k Z
on
e (M
SK
VIII
)E
Q Z
on
e III
: M
od
erat
e D
amag
e R
isk
Zo
ne
(MS
K V
II)E
Q Z
on
e III
: L
ow
Dam
age
Ris
k Z
on
e (M
SK
<VI)
2
. So
urc
e o
f H
ou
sin
g D
ata
“Cen
sus
of
Ho
usi
ng
GO
I 20
01”
Hou
sin
g v
uln
erabilit
y t
able
, 2
00
6D
am
age
ris
k to
Hou
sin
g u
nder
vari
ou
s H
aza
rd i
nte
nsi
ties

6
seismic assessment & retrofitting of rC frame BuildingsAn abstract of lecture delivered by Dr. Sudhir Kumar Jain, Director, IIT Gandhinagar under Healthy Construction Series organized by Dr. Fixit Institute of Structural Protection & Rehabilitation at Ahmedabad on 20th August 2009.Dr. Jain is an eminent personality in the field of Earthquake Engineering and also a member of the Team for developing a Rapid Visual Screening(RVS) method for seismic assessment for Indian RC framed buildings.
Seismic retrofit is the method of modification of existing structures to enhance their capability to resist earthquakes. It may be executed on concrete masonry, unreinforced masonry and concrete tilt-up construction. The need for retrofitting arises after the modification of Codes and various other causes as shown in the Fig 1.
The specifications of IS 1893 : 1984 for seismic resistant design have been inadequate for peninsular India. Even the masonry buildings were never adequately covered before 2002. The current version, IS:1893-2002, made substantial upgradation of seismic zones in order to avoid such surpries in future. Even IS 13920 – 1993 does not incorporate explicitly the specifications for strong-column weak-beam concepts, which are essential for structural survivability. The codes of practice do not include specifications for the design of beam-column joints, however guidelines are available in literature.
The 2002 version of IS 1893 has more clearly defined the irregularities (vertical and horizontal) in the configuration of buildings than the earlier version
Comparison of 1984 & 2002 versions of is 1893
The deficiencies in the earlier Codes can be made by drawing a comparison with the latest codes.
The values of base shear coefficient Ah, where base shear
Vb = A
h W, Where W is total seismic weight of stucture,
for a few cities in different seismic zones are compared for the current and previous versions of the code. It is assumed that I (Importance factor)= 1.0 and β = 1.0; the normalized shape of “C” (IS 1893 – 1984) is more or less similar to the shape of spectral acceleration of the 2002 version (it is the same in short period range). Two cases are considered for comparison, namely case I wherein K = 1.6 (1984 version) and R (Response reduction factor) = 1.5 (current version), and case II wherein K = 1.3 (1984 version) and R = 3.0 (current version). The base shear coefficients are listed in Table 1 for cases I and II, respectively.
Table 1. Comparison of base shear coefficients for few cities
CITY IS : 1893 – 1984 IS 1893 (Part 1) : 2002
Case - I Case - II Case - I Case - II
K = 1.6 K = 1.3 R = 1.5 K = 3.0
Bhuj Ah = 0.128
[Zone V ]
Ah = 0.104
[Zone V ]
Ah = 0.300
[Zone V ]
Ah = 0.150
[Zone V ]
Delhi Ah = 0.080
[Zone IV]
Ah = 0.065
[Zone IV]
Ah = 0.200
[Zone IV]
Ah = 0.100
[Zone IV]
Kolkata,
Mumbai
Ah = 0.064
[Zone III]
Ah = 0.052
[Zone III]
Ah = 0.133
[Zone III]
Ah = 0.067
[Zone III]
Chennai Ah = 0.032
[Zone II ]
Ah = 0.026
[Zone II ]
Ah = 0.133
[Zone III]
Ah = 0.067
[Zone III]
Hyderabad,
Bangalore
Ah = 0.016
[Zone I ]
Ah = 0.013
[Zone I ]
Ah = 0.083
[Zone II ]
Ah = 0.041
[Zone II ]
Ah=V
b/W
The Tables indicate an across the board increase in the values of the 2002 version. However, it is more pronounced for the cities upgraded to more severe zone such as Chennai, Bangalore and Hyderabad. The increase in those cases varies from 300 to 500 percent depending on the type of structural systems.
However, there is no change in the values in the two versions in the case of Mumbai and Kolkata, , if reduction factor R = 5 and K = 1 (for ductile shear wall with Special Moment Resisting Frame or Special RC Moment-Resisting Frame). Obviously, as per IS 1893 : 2002, no place in India is deemed to be free from earthquake hazards.
Types
Deficient for gravity loads Deficient for seismic loads
Causes
InadequateDesign
InadequateConstruction
Deterioration inmaterialwith time
Major alterationin the building
Reasons
Up gradation ofseismic designrequirements
Advancementin engineering
knowledge
Lack ofunderstandingby the designer
Deficiencies indesign code
Fig.1 Types of deficient buildings their causes and reasons
7
features of is 1893 : 2002 (Part 1)
This fifth version of the code has given clearer definitions of irregularities in the vertical (elevation) and horizontal (plan) directions in the configuration of buildings. They are briefly as follows:
Plan irregularities causing torsion are re-entrant • corners, diaphragm discontinuity, out of plane offsets and non-parallel systems.
Vertical irregularities are caused by variations in • lateral stiffness, mass, vertical geometry, in-plane discontinuity in vertical elements resisting lateral force and discontinuity in capacity like weak story.
seismic assessment
The seismic evaluation can be made by following procedures.
Rapid Visual Screening Procedure: It is used to identify • and create an inventory of buildings, to rank buildings that are potentially hazardous. But there is relatively poor correlation between RVS and actual performance building by building. Hence it is useful in a broad sense and for prioritizing the buildings.
Approximate Seismic Evaluation. •
Detailed Assessment.•
Criteria developed under IITK-GSDMA Project on • Building Codes.
The assessment can be made by Push over analysis where investigation to be carried out at horizontal load steps equal to 2% of their design capacities and the corresponding inelastic displacements to be calculated.
a rapid visual screening (rvs) Method for indian rC frame Buildings
An inter-institutional collaboration between IIT Kanpur (Sudhir K Jain & Manish Kumar),Bengal Engg & Science University, Sibpur (Keya Mitra) and CEPT Ahmedabad (Mehul Shah) was being made to develop Rapid Visual Screening (RVS) method for seismic assessment for Indian RC Framed buildings. For developing RVS method 6670 buildings from Ahmedabad which is 250 km away from epicenter having shaking intensity of VII (MSK scale) in 2001 earthquake were assessed by CEPT, Ahmedabad. These buildings were assigned damage category (G0 to
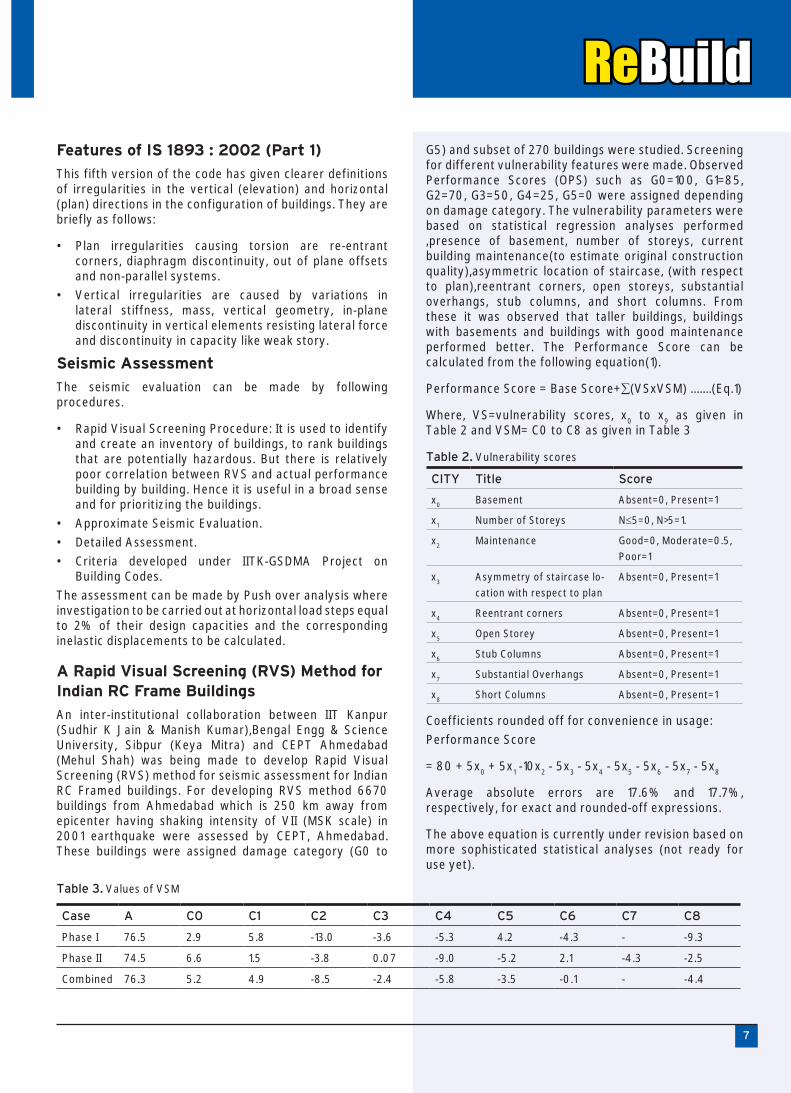
G5) and subset of 270 buildings were studied. Screening for different vulnerability features were made. Observed Performance Scores (OPS) such as G0=100, G1=85, G2=70, G3=50, G4=25, G5=0 were assigned depending on damage category. The vulnerability parameters were based on statistical regression analyses performed ,presence of basement, number of storeys, current building maintenance(to estimate original construction quality),asymmetric location of staircase, (with respect to plan),reentrant corners, open storeys, substantial overhangs, stub columns, and short columns. From these it was observed that taller buildings, buildings with basements and buildings with good maintenance performed better. The Performance Score can be calculated from the following equation(1).
Performance Score = Base Score+∑(VSxVSM) .......(Eq.1)
Where, VS=vulnerability scores, x0 to x
9 as given in
Table 2 and VSM= C0 to C8 as given in Table 3
Table 2. Vulnerability scores
CITY Title Score
x0
Basement Absent=0, Present=1
x1
Number of Storeys N≤5=0, N>5=1.
x2
Maintenance Good=0, Moderate=0.5,
Poor=1
x3
Asymmetry of staircase lo-
cation with respect to plan
Absent=0, Present=1
x4
Reentrant corners Absent=0, Present=1
x5
Open Storey Absent=0, Present=1
x6
Stub Columns Absent=0, Present=1
x7
Substantial Overhangs Absent=0, Present=1
x8
Short Columns Absent=0, Present=1
Coefficients rounded off for convenience in usage:
Performance Score
= 80 + 5x0 + 5x
1 -10x
2 - 5x
3 - 5x
4 - 5x
5 - 5x
6 - 5x
7 - 5x
8
Average absolute errors are 17.6% and 17.7%, respectively, for exact and rounded-off expressions.
The above equation is currently under revision based on more sophisticated statistical analyses (not ready for use yet).
Case A C0 C1 C2 C3 C4 C5 C6 C7 C8
Phase I 76.5 2.9 5.8 -13.0 -3.6 -5.3 4.2 -4.3 - -9.3
Phase II 74.5 6.6 1.5 -3.8 0.07 -9.0 -5.2 2.1 -4.3 -2.5
Combined 76.3 5.2 4.9 -8.5 -2.4 -5.8 -3.5 -0.1 - -4.4
Table 3. Values of VSM

8
Additional considerations were made for followings.
Analysis on several thousand buildings for building usage
Non-residential buildings performed better•
x• 9, such that x
9=1 for non residential, and 0 for
residential
Performance Score = 77.3 + 3.2x• 9
+5 points if building is non-residential•
Seismic Zone
+15 points for lower, -15 points for higher Seismic Zone•
Soil Type
+15 points for rocky soils•
-15 points for soft soils•
seismic evaluation
Evaluation criteria as per IITK-GSDMA gudelines was made. Modifications of loads where made such as forces were reduced to 0.67 of new buildings for reduced life-span. Also modification of loads were made by taking Potential Casualties Occupancy Risk Factor as 1.25 for Essential building,1 for buildings with crowd and 0.75 for other buildings.
The knowledge factor mk is given in Table 4.
Table 4. Knowledge factor
No Description of Building mk
1 Original construction documents available,
including post-construction activities, materials
testing undertaken.
1.00
2 Documentation as above in (1) but originally
specified values for materials
0.90
3 Documentation as above in (1), originally
specified values for materials & minor
deterioration of original condition
0.80
4 Incomplete but useable original construction
documents and originally specified values for
materials
0.70
5 Documentation as in (4) and limited inspection,
and verification of structural members,
materials test results with large variation
0.60
6 Little knowledge of details of component 0.50
During site visit verification and data collection of buildings for general information and structural system should be made. For general informations, dimensions, No. of storey’s, year of construction, occupancy, adjacent buildings and general condition (deterioration of materials) should be considered.
The evaluation was made in 2 stages known as primary evaluation as stage 1 and detailed evaluation as stage 2.The primary evaluation is being made to test seismic robustness.The test is being carried out for configuration and global strength to check shear stress and axial stress of columns.
seismic retrofitting
Seismic retrofitting may range from 5% to 50% of the replacement cost of the building and depends on a number of factors such as type of building, existing seismic resistance of the building, level of strengthening being achieved, whether cost mean only structural cost, or refurbishment cost also and if the cost associated with loss of function of the building. However, seismic strengthening requirements should be economically feasible, technically viable and functional constraints. Here the factors to be addressed are configuration, stiffness, ductility and strength. But the configuration problems are to remove the problem by addition of structural elements at appropriate location i.e torsion irregularity. Seismic Strengthening can be made by reducing the demand (seismic force), increasing dissipation of energy (damping) and increasing the supply (strength).Load carrying systems can be improved by following ways:
Addition of shear wall, braced frame, or moment-• resisting frame outside the building
Ensuring proper foundation to transmit large • overturning moment
Ensuring good connection between building and new • elements
Ensuring floor for transmitting the seismic load to • the new elements
Concluding remarks
A large number of buildings in the country are seismically deficient .Hence, there is need for further research and development work to size the problem and framing policy issues, economic issues and technology issues such as assessment methods and strengthening techniques In the meanwhile, there is also need to accumulate experience on seismic strengthening which is a specialized task. Further, each set of building poses unique set of constraints and problems which need to be studied in detail for seismic evaluation and retrofitting.

9
seismic evaluation and economical strengthening of reinforced Concrete BuildingsBy T. KabeyasawaEarthquake Research Institute, The University of Tokyo, Tokyo, Japan
(Extracted from Asian Journal of Civil Engineering (Building and Housing) Vol. 6, No. 6 , 2005 Pages 459-461)
The handbook, entitled Standard for Evaluation of Seismic Capacity of Existing RC Buildings, provides a method of expressing the seismic performance for existing reinforced concrete buildings through a continuous index and judges their seismic safety. The Standard for seismic evaluation in Japan is outlined in the following section.
seismic Performance index
The Standard provides an approximated calculation method for the seismic performance of buildings in terms of two indexes, the seismic index of structural elements, IS, and the seismic index of nonstructural elements, IN. The Standard was developed for the purpose of evaluating a large number of buildings in the shortest possible time. Therefore, while referring to other already-proposed seismic design and evaluation methods, the method was simplified as much as possible without losing the essence, so that three levels of calculation methods are provided from simple to sophisticated one called as the first, second and third screening levels.
In the Standard, the seismic performance index of a building is expressed by the Is-Index for each story and each direction, as shown in Eq. (1):
IS =E
0 .S
D.T….................................…………..…………....………………(1)
where:
E0 = Basic seismic index of structure.
SD = Irregularity index.
T = Time index.
E0 is a basic structural index calculated from strength
index (C), ductility index (F), and story index (Φ), C-Index denotes the lateral strength of the buildings in terms of shear force coefficient. F-Index denotes the ductility index of the building ranging from 0.8 (most brittle) to 3.2 (most ductile), depending on the sectional properties such as bar arrangement, member proportion, shear-to-flexural-strength ratio etc. Φ is a modification factor to allow for the mode shape of the response along the building height. Basically in the Standard, a
simple formula of Φ=(n+1)/(n+i) is employed for the i-th story level of an n-storied building by assuming straight mode and uniform mass distribution.
SD- and T-Index are reduction factors to allow for
the disadvantages in the seismic performance of structures. S
D-Index, basically ranging from 0.4 to 1.0,
is for modifying E0-Index due to unbalanced distribution
of stiffness both in the horizontal plane and along the height of the structure, resulting from irregularity and complexity of structural configuration. T-Index, ranging from 0.5 to 1.0, is employed to allow for the deterioration of strength and ductility due to age after construction, fire and uneven settlement of foundation.
The first level procedure is the simplest but most conservative since only the sectional areas of columns and walls and concrete strength are considered to calculate the strength, and the inelastic deformability is neglected. The ductility index is simply assumed as 1.0 in a case without extremely brittle columns or 0.8 otherwise.
In the second and third level procedures, ultimate lateral load carrying capacity of vertical members or frames are evaluated using material and sectional properties together with reinforcing details based on the field inspections and structural drawings. The basic index E0 is defined in the following ways:
Ductility-dominant basic seismic index of structure
E0 =( n+1)/(n+i) (E2
1 + E2
2 + E2
3) ...............………………..(2)
Ei = C
i x F
i
C1 , C
2 , C
3 = The strength index C of the first, second and
third group
F1 , F
2 , F
3 = The ductility index F of the first, second and
third group
E0 = (n+1)/(n+i) [C
1 + ∑ α
j C
j ]. F
1 ..……………………...……...(3)
where:
αj = Effective strength factor in the j-th group elements
at the ultimate deformation R1 corresponding to the first group elements (ductility index of F
1)
The basic index of Eq. (2) and Eq. (3) denotes the earthquake intensity when the inter-story drift response would attain its limit state. The second screening considers only the vertical members, such as columns and walls, while the third screening considers beams as well. The methods or Eqs. for evaluating strength and deformability of the members are prescribed in the standard.
The elements are classified into three groups at the maximum for calculating ductility-dominant basic seismic index. First group is for brittle element, third group is for ductile element, and second group is medium.
10
Strength Index
CT
0.30
Story Drift:
Ductility Index F:
1/500 1/250 1/150 1/120
0.8 1.0 1.27 1.5
1/80
2.0
1/30
3.0
E0 =n + 1
n + iC 1 +
j
j j F 1Cα .
E0 =
n + 1
n + iE
1
2+ E
2
2+ E
3
2
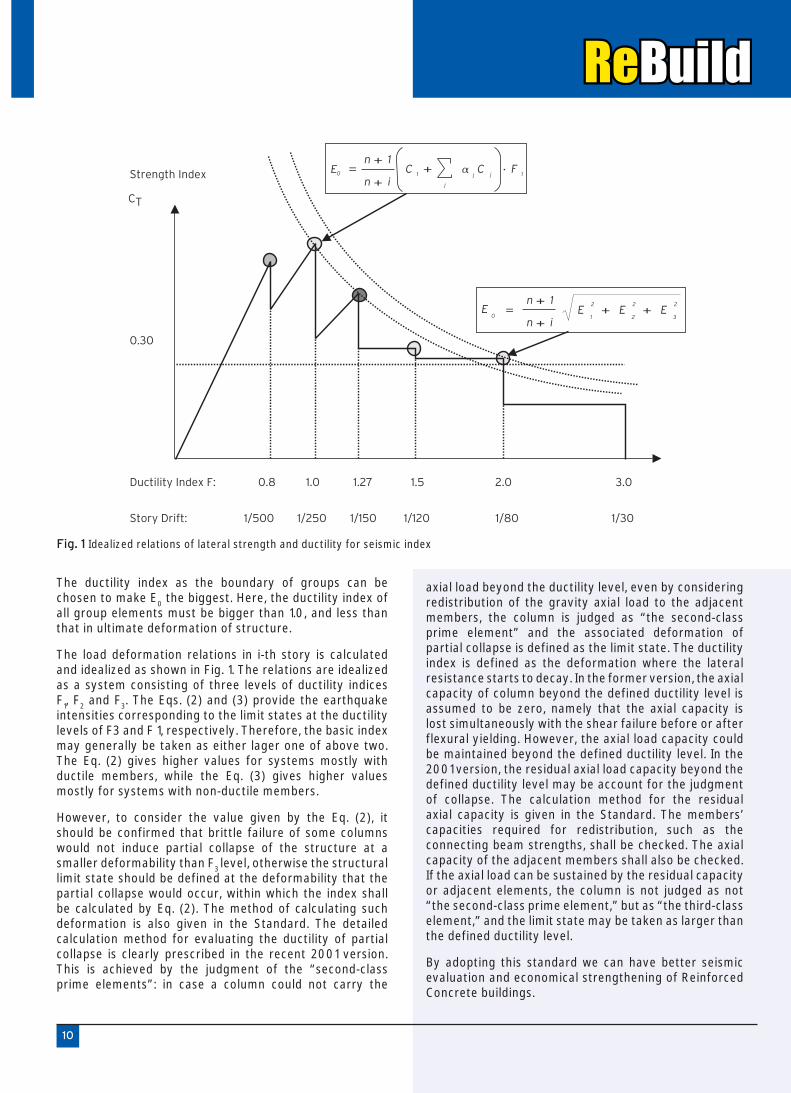
Fig. 1 Idealized relations of lateral strength and ductility for seismic index
The ductility index as the boundary of groups can be chosen to make E
0 the biggest. Here, the ductility index of
all group elements must be bigger than 1.0, and less than that in ultimate deformation of structure.
The load deformation relations in i-th story is calculated and idealized as shown in Fig. 1. The relations are idealized as a system consisting of three levels of ductility indices F
1, F
2 and F
3. The Eqs. (2) and (3) provide the earthquake
intensities corresponding to the limit states at the ductility levels of F3 and F 1, respectively. Therefore, the basic index may generally be taken as either lager one of above two. The Eq. (2) gives higher values for systems mostly with ductile members, while the Eq. (3) gives higher values mostly for systems with non-ductile members.
However, to consider the value given by the Eq. (2), it should be confirmed that brittle failure of some columns would not induce partial collapse of the structure at a smaller deformability than F
3 level, otherwise the structural
limit state should be defined at the deformability that the partial collapse would occur, within which the index shall be calculated by Eq. (2). The method of calculating such deformation is also given in the Standard. The detailed calculation method for evaluating the ductility of partial collapse is clearly prescribed in the recent 2001 version. This is achieved by the judgment of the “second-class prime elements”: in case a column could not carry the
axial load beyond the ductility level, even by considering redistribution of the gravity axial load to the adjacent members, the column is judged as “the second-class prime element” and the associated deformation of partial collapse is defined as the limit state. The ductility index is defined as the deformation where the lateral resistance starts to decay. In the former version, the axial capacity of column beyond the defined ductility level is assumed to be zero, namely that the axial capacity is lost simultaneously with the shear failure before or after flexural yielding. However, the axial load capacity could be maintained beyond the defined ductility level. In the 2001 version, the residual axial load capacity beyond the defined ductility level may be account for the judgment of collapse. The calculation method for the residual axial capacity is given in the Standard. The members’ capacities required for redistribution, such as the connecting beam strengths, shall be checked. The axial capacity of the adjacent members shall also be checked. If the axial load can be sustained by the residual capacity or adjacent elements, the column is not judged as not “the second-class prime element,” but as “the third-class element,” and the limit state may be taken as larger than the defined ductility level.
By adopting this standard we can have better seismic evaluation and economical strengthening of Reinforced Concrete buildings.

11
Methods for seismic retrofitting of structures(http://web.mit.edu/istgroup/ist/documents/earthquake/part5.pdf)
Retrofitting of existing structures with insufficient seismic resistance accounts for a major portion of the total cost of hazard mitigation.Thus, it is of critical importance that the structures that need seismic retrofitting are identified correctly, and an optimal retrofitting is conducted in a cost effective fashion. Once the decision is made, seismic retrofitting can be performed through several methods with various objectives such as increasing the load, deformation, and/or energy dissipation capacity of the structure. Conventional as well as emerging retrofit methods are briefly presented in the following subsections.
Conventional strengthening Methods
Conventional retrofitting methods include addition of new structural elements to the system and enlarging the existing members. Addition of shear walls and bracings shown in Fig. 1(a) is the most popular strengthening method due to its effectiveness, relative ease, and lower overall project cost compared to column and beam jacketing shown in Fig. 1(b) and (c), respectively. Relative effectiveness of various wall and bracing configurations are compared in Fig. 1(a). From this figure, it is seen that post-cast shear walls and
steel braced frames are the most effective strengthening techniques. Although the latter is more effective due to its much higher ductility, post-cast concrete shear walls are the most commonly applied method due to their lower cost and familiarity of the construction industry with the method. Design of additional shear walls is performed to resist a major fraction of the lateral loads likely to act on the structure. This reduces the demand on the beams and columns, hence increasing their safety. Those still likely to be overstressed are strengthened through concrete or steel jacketing, which are relatively more laborious applications. Fig. 2 shows applications of various conventional strengthening methods such as post-cast shear wall (a), additional foundation to support the shear walls to be constructed around the stairs (b), concrete jacketing of a column (c), and addition of column members to remedy vertical irregularities (d). The main research need associated with conventional strengthening methods is optimization of the retrofit design to achieve a satisfactory structural performance level at a minimum cost based on reliably characterized seismic demand and structural capacity.
retrofit of structures using innovative Materials
Current research on advanced materials in civil engineering is mainly concentrated on high performance
(C) Beam jacketing
(C) Column jacketing
(a) Effectiveness of structural walls and bracings (Sugano, 1989; CEB, 1997)
VW
Late
ral F
orce
V0
0.5 1.0 1.5
0.60-1.00VW
0.62VW
0.29VW
Lateral Drift ( )%
SteelFramedBrace
MonolithicWall
Post-CastWall
ConcreteBlocks
SteelBrace
OriginalFrame
PrecastPanels
Fig. 1 Conventional strengthening methods used for seismic retrofitting

12
concrete and steel, and fiber reinforced plastic (FRP) composites. FRP composite materials have experienced a continuous increase of use in structural strengthening and repair applications around the world in the last fifteen years. High specific stiffness and specific weight combined with superior environmental durability of these materials have made them a competing alternative to the conventional strengthening methods. It was shown through experimental and analytical studies that externally bonded FRP composites can be applied to various structural members including columns, beams, slabs, and walls to improve their structural performance such as stiffness, load carrying capacity, and ductility.
FRP composites have enjoyed varying degrees of success in different types of applications. In general, applications that allow complete wrapping of the member with FRP have proven to be effective. Wrapping of columns to increase their load and deformation capacity is the most effective and most commonly used method of retrofitting with composites. However, certain performance and failure mode issues regarding different wrapping configuration
and fiber orientations, shown in Fig. 3, still need to be well understood. When wrapping is difficult or not allowed, such as when strengthening beams, slabs, or walls, success of the method is sometimes hindered by premature debonding failures. Sometimes flexural strengthening of beams without proper attention to brittle shear and debonding failure modes not only renders the strengthening application ineffective, but also harms the member by decreasing its ductility. This constitutes one of the main factors, along with their high material costs, hindering wide-range use of FRP materials. Such problems can be reduced through proper design and anchorage of the external FRP reinforcement .Thus, decision makers must approach using these materials with caution and must ensure that the design is performed with adequate knowledge and skill, and verified through laboratory testing.
Limited research and applications regarding seismic retrofitting of building systems with FRP composites have shown that composites retrofitting does not
(a) failure modes(b) stress-strain curves of cylinders wrapped in variousconfigurations
7654321
00 0.005 0.01 0.02 0.030.015 0.025Axial strain
Axia
l str
ess
(ksi
) C2-WA1-UC1
C1-UC1
C2-UC1-WA1
C1-WA1C2-W1-WA1C1-W1Plain
concretecylinder
(b) Stress-strain curves of cylinders wrapped in various configurations
Fig. 2 Applications of conventional strengthening methods
Fig. 3 Performance and failure modes concrete cylinders wrapped with FRP composites in various fiber orientations
a) additional shear wall (b) additional foundations (c) jacketing (d) additional columns

13
significantly alter the stiffness and dynamic properties of the building. The main benefit of retrofitting with composites is the increase in deformation capacity of the building, and in its load capacity to an extent. This may achieve the retrofit objectives for buildings with lightly insufficient seismic resistance. For buildings with large seismic deficiencies, a combination of conventional and FRP strengthening techniques may prove to be an effective retrofitting solution. Fig. 4 shows such an application where a historical school building in Istanbul was retrofitted using steel and FRP composites. The 3-D computer model of the building is shown in Fig. 4(a), the analysis of which revealed that under seismic design loads excessive cracking is expected around the openings in the exterior unreinforced concrete walls in the short direction due to stress concentrations as shown in Fig. 4(b). As a practical and economical solution, the retrofit design involved replacement of the existing window frames with structural steel frames constructed from steel C-sections. A verification analysis of the retrofitted building showed that installation of steel window frames largely decreased the stress concentrations, but did not suffice to reduce all stresses to acceptable levels. For this reason, additional retrofitting was designed using externally bonded FRP composites around the openings in the walls to prevent or delay concrete crack propagation by bridging the stresses at crack locations. Thus, by combining conventional and innovative materials, an effective and economical retrofit design was achieved that did not significantly interfere with the function or historical and architectural character of the building.
Although FRP composites are known for their favorable durability characteristics, only limited information is available on long-term durability and performance of FRP bonded concrete and steel systems. These issues need to be investigated through accelerated test studies and related design, application and protection requirements must be included in the design codes.
Base isolation
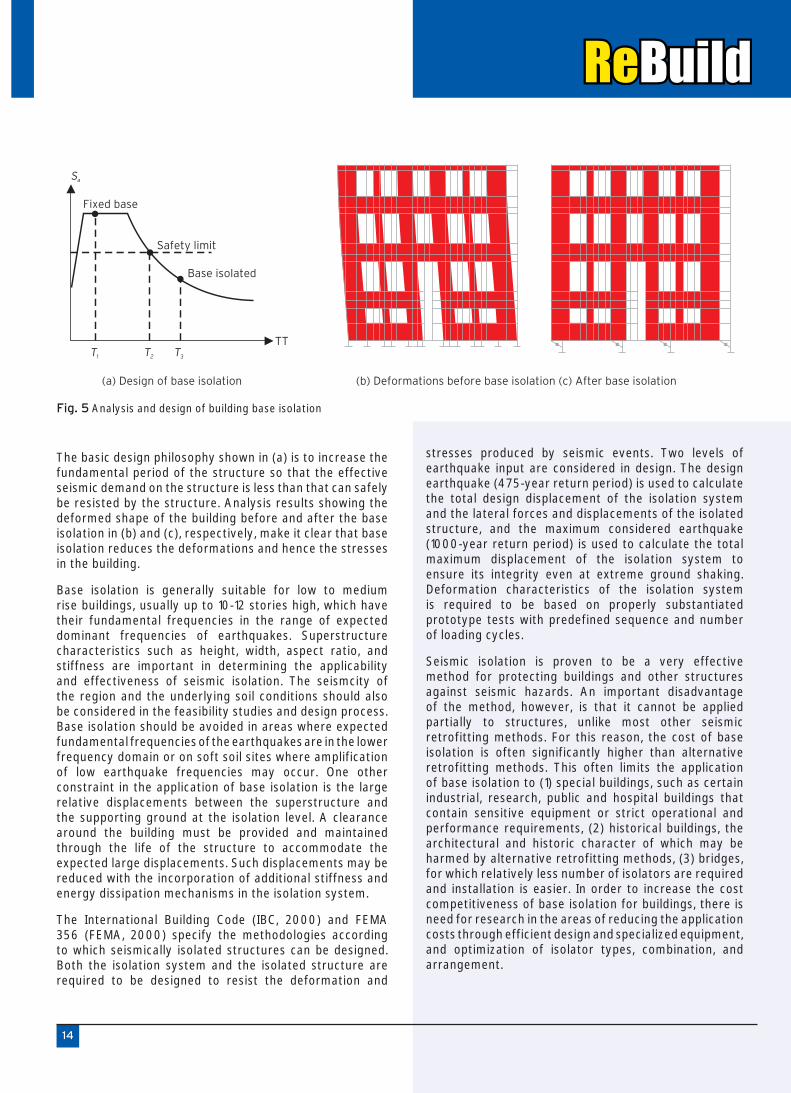
The seismic base isolation technology involves placing flexible isolation systems between the foundation and the superstructure. By means of their flexibility and energy absorption capability, the isolation systems reflect and absorb part of the earthquake input energy before this energy is fully transmitted to the superstructure, reducing the energy dissipation demand on the superstructure. Base isolation causes the natural period of the structure to increase and results in increased displacements across the isolation level and reduced accelerations and displacements in the superstructure during an earthquake. This not only provides safety against collapse, but also largely reduces damage, which is crucial for facilities that should remain operational after severe earthquakes such as emergency response centers, hospitals, and fire stations. Base isolation can also be used in seismic retrofitting of historic structures without impairing their architectural characteristics by reducing the induced seismic forces. Fig. 5 shows the results of a feasibility study for base isolation of a historical school building in Istanbul. The structural system of the building is formed by thick exterior unreinforced concrete walls resisting lateral loads and interior steel frames carrying the vertical loads. A combination of lead-plug rubber bearings and natural rubber bearings were considered for the exterior walls and the interior frames, respectively. The basic design philosophy shown in (a) is to increase the fundamental period of the structure so that the effective seismic demand on the structure is less than that can safely be resisted by the structure. Analysis results showing the deformed shape of the building before and after the base isolation in (b) and (c), respectively, make it clear that base isolation reduces the deformations and hence the stresses in the building.
Fig. 4 A retrofit application combining conventional and composites retrofitting
(a) 3-D building model (b) wall stresses before retrofitting
(c) after installation of steel window frames
(d) additional FRP retrofitting
14
The basic design philosophy shown in (a) is to increase the fundamental period of the structure so that the effective seismic demand on the structure is less than that can safely be resisted by the structure. Analysis results showing the deformed shape of the building before and after the base isolation in (b) and (c), respectively, make it clear that base isolation reduces the deformations and hence the stresses in the building.
Base isolation is generally suitable for low to medium rise buildings, usually up to 10-12 stories high, which have their fundamental frequencies in the range of expected dominant frequencies of earthquakes. Superstructure characteristics such as height, width, aspect ratio, and stiffness are important in determining the applicability and effectiveness of seismic isolation. The seismcity of the region and the underlying soil conditions should also be considered in the feasibility studies and design process. Base isolation should be avoided in areas where expected fundamental frequencies of the earthquakes are in the lower frequency domain or on soft soil sites where amplification of low earthquake frequencies may occur. One other constraint in the application of base isolation is the large relative displacements between the superstructure and the supporting ground at the isolation level. A clearance around the building must be provided and maintained through the life of the structure to accommodate the expected large displacements. Such displacements may be reduced with the incorporation of additional stiffness and energy dissipation mechanisms in the isolation system.
The International Building Code (IBC, 2000) and FEMA 356 (FEMA, 2000) specify the methodologies according to which seismically isolated structures can be designed. Both the isolation system and the isolated structure are required to be designed to resist the deformation and
stresses produced by seismic events. Two levels of earthquake input are considered in design. The design earthquake (475-year return period) is used to calculate the total design displacement of the isolation system and the lateral forces and displacements of the isolated structure, and the maximum considered earthquake (1000-year return period) is used to calculate the total maximum displacement of the isolation system to ensure its integrity even at extreme ground shaking. Deformation characteristics of the isolation system is required to be based on properly substantiated prototype tests with predefined sequence and number of loading cycles.
Seismic isolation is proven to be a very effective method for protecting buildings and other structures against seismic hazards. An important disadvantage of the method, however, is that it cannot be applied partially to structures, unlike most other seismic retrofitting methods. For this reason, the cost of base isolation is often significantly higher than alternative retrofitting methods. This often limits the application of base isolation to (1) special buildings, such as certain industrial, research, public and hospital buildings that contain sensitive equipment or strict operational and performance requirements, (2) historical buildings, the architectural and historic character of which may be harmed by alternative retrofitting methods, (3) bridges, for which relatively less number of isolators are required and installation is easier. In order to increase the cost competitiveness of base isolation for buildings, there is need for research in the areas of reducing the application costs through efficient design and specialized equipment, and optimization of isolator types, combination, and arrangement.
TTT1 T2 T3
Fixed base
Safety limit
Base isolated
Sa
(a) Design of base isolation (b) Deformations before base isolation (c) After base isolation
Fig. 5 Analysis and design of building base isolation
15
supplemental energy Dissipation and structural Control
An alternative and often more cost efficient retrofitting strategy compared to base isolation is installation of supplemental energy dissipation devices in structures as a means for passive or active structural control. The objective of structural control is to reduce structural vibrations for improved safety and/or serviceability under wind and earthquake loadings. Passive control systems reduce structural vibration and associated forces through energy dissipation devices that do not require external power. These devices utilize the motion of the structure to develop counteracting control forces and absorb a portion of the input seismic energy. Active control systems, however, enhance structural response through control forces developed by force delivery devices that rely on external power to operate. The actuator forces are controlled by real time controllers that process the information obtained from sensors within the structure. Semi-active control systems combine passive and active control devices and are sometimes used to optimize the structural performance with minimal external power requirements.
effects of seismic retrofitting on structural Performance
The seismic retrofit techniques briefly presented in the preceding sections vary in the mechanisms that they decrease the seismic risk of structures.Fig. 6 graphical illustrates these mechanisms by means of their effects on the seismic demand and structural capacity curves shown in Part 2. These effects are presented in the following paragraphs at a simplified conceptual level.
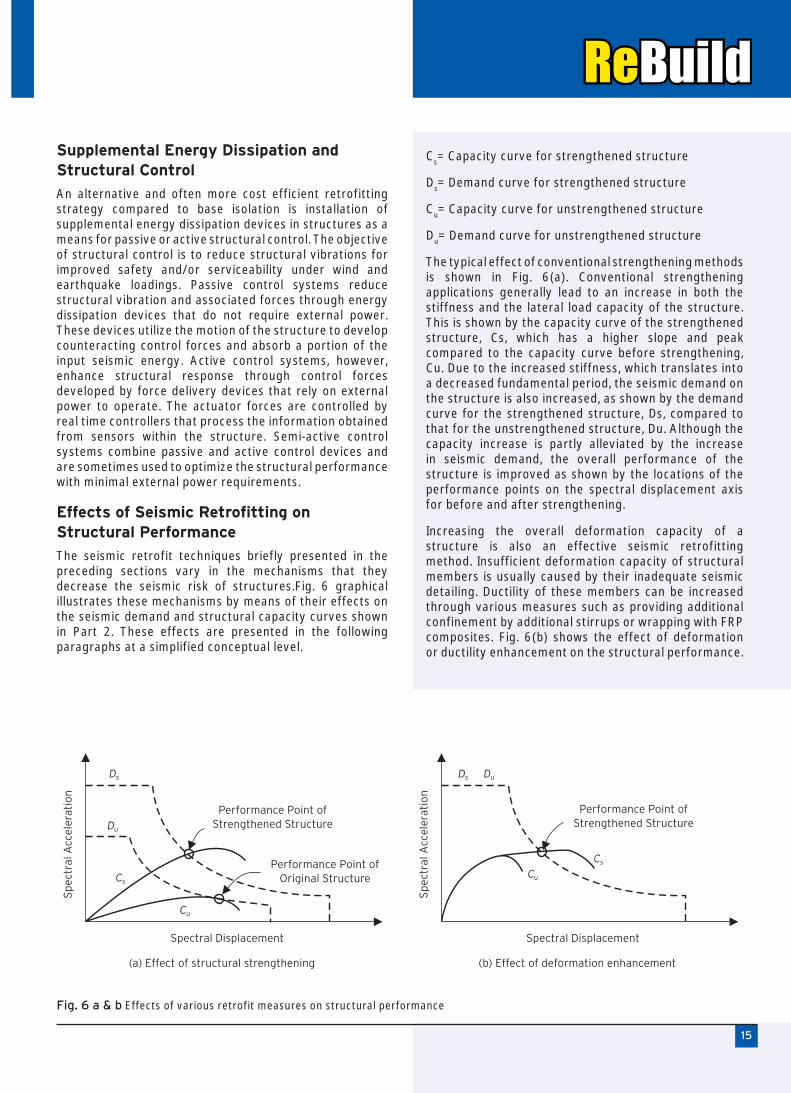
Cs= Capacity curve for strengthened structure
Ds= Demand curve for strengthened structure
Cu= Capacity curve for unstrengthened structure
Du= Demand curve for unstrengthened structure
The typical effect of conventional strengthening methods is shown in Fig. 6(a). Conventional strengthening applications generally lead to an increase in both the stiffness and the lateral load capacity of the structure. This is shown by the capacity curve of the strengthened structure, Cs, which has a higher slope and peak compared to the capacity curve before strengthening, Cu. Due to the increased stiffness, which translates into a decreased fundamental period, the seismic demand on the structure is also increased, as shown by the demand curve for the strengthened structure, Ds, compared to that for the unstrengthened structure, Du. Although the capacity increase is partly alleviated by the increase in seismic demand, the overall performance of the structure is improved as shown by the locations of the performance points on the spectral displacement axis for before and after strengthening.
Increasing the overall deformation capacity of a structure is also an effective seismic retrofitting method. Insufficient deformation capacity of structural members is usually caused by their inadequate seismic detailing. Ductility of these members can be increased through various measures such as providing additional confinement by additional stirrups or wrapping with FRP composites. Fig. 6(b) shows the effect of deformation or ductility enhancement on the structural performance.
(a) Effect of structural strengthening
Spectral Displacement
Ds
Du
Cs
Cu
Performance Point ofStrengthened Structure
Performance Point ofOriginal Structure
Sp
ectr
al A
ccel
erat
ion
Sp
ectr
al A
ccel
erat
ion
Ds
Du
Cu
Cs
(c) Effect of base isolation
Performance Point ofStrengthened Structure
lsolatorDisplacement
Sp
ectr
al A
ccel
erat
ion
Cs
Du
Ds
Performance Point ofStrengthened Structure
Performance Point ofOriginal Structure
(d) Effect of enhanced energy dissipation
Cu
Sp
ectr
al A
ccel
erat
ion
Spectral Displacement
(b) Effect of deformation enhancement
Ds Du
Cu
Cs
Performance Point ofStrengthened Structure
Fig. 6 a & b Effects of various retrofit measures on structural performance
16
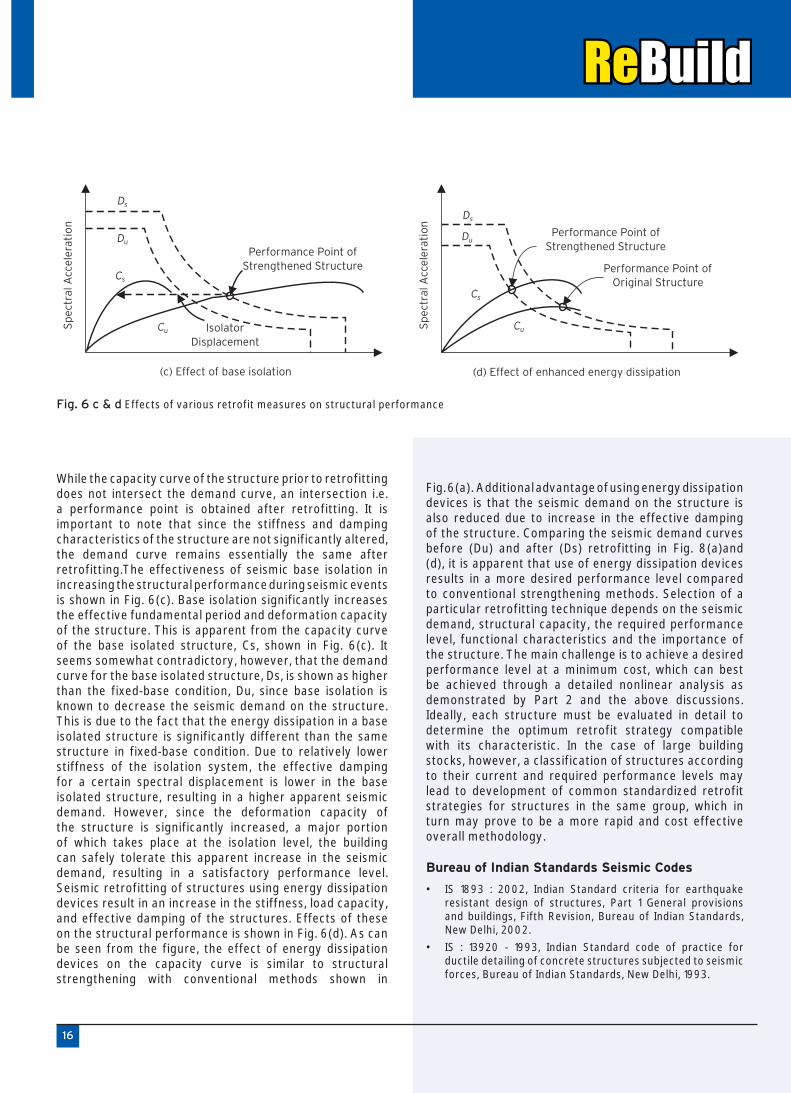
While the capacity curve of the structure prior to retrofitting does not intersect the demand curve, an intersection i.e. a performance point is obtained after retrofitting. It is important to note that since the stiffness and damping characteristics of the structure are not significantly altered, the demand curve remains essentially the same after retrofitting.The effectiveness of seismic base isolation in increasing the structural performance during seismic events is shown in Fig. 6(c). Base isolation significantly increases the effective fundamental period and deformation capacity of the structure. This is apparent from the capacity curve of the base isolated structure, Cs, shown in Fig. 6(c). It seems somewhat contradictory, however, that the demand curve for the base isolated structure, Ds, is shown as higher than the fixed-base condition, Du, since base isolation is known to decrease the seismic demand on the structure. This is due to the fact that the energy dissipation in a base isolated structure is significantly different than the same structure in fixed-base condition. Due to relatively lower stiffness of the isolation system, the effective damping for a certain spectral displacement is lower in the base isolated structure, resulting in a higher apparent seismic demand. However, since the deformation capacity of the structure is significantly increased, a major portion of which takes place at the isolation level, the building can safely tolerate this apparent increase in the seismic demand, resulting in a satisfactory performance level.Seismic retrofitting of structures using energy dissipation devices result in an increase in the stiffness, load capacity, and effective damping of the structures. Effects of these on the structural performance is shown in Fig. 6(d). As can be seen from the figure, the effect of energy dissipation devices on the capacity curve is similar to structural strengthening with conventional methods shown in
Fig. 6(a). Additional advantage of using energy dissipation devices is that the seismic demand on the structure is also reduced due to increase in the effective damping of the structure. Comparing the seismic demand curves before (Du) and after (Ds) retrofitting in Fig. 8(a)and (d), it is apparent that use of energy dissipation devices results in a more desired performance level compared to conventional strengthening methods. Selection of a particular retrofitting technique depends on the seismic demand, structural capacity, the required performance level, functional characteristics and the importance of the structure. The main challenge is to achieve a desired performance level at a minimum cost, which can best be achieved through a detailed nonlinear analysis as demonstrated by Part 2 and the above discussions. Ideally, each structure must be evaluated in detail to determine the optimum retrofit strategy compatible with its characteristic. In the case of large building stocks, however, a classification of structures according to their current and required performance levels may lead to development of common standardized retrofit strategies for structures in the same group, which in turn may prove to be a more rapid and cost effective overall methodology.
Bureau of indian standards seismic Codes
IS 1893 : 2002, Indian Standard criteria for earthquake • resistant design of structures, Part 1 General provisions and buildings, Fifth Revision, Bureau of Indian Standards, New Delhi, 2002.
IS : 13920 - 1993, Indian Standard code of practice for • ductile detailing of concrete structures subjected to seismic forces, Bureau of Indian Standards, New Delhi, 1993.
(a) Effect of structural strengthening
Spectral Displacement
Ds
Du
Cs
Cu
Performance Point ofStrengthened Structure
Performance Point ofOriginal Structure
Sp
ectr
al A
ccel
erat
ion
Sp
ectr
al A
ccel
erat
ion
Ds
Du
Cu
Cs
(c) Effect of base isolation
Performance Point ofStrengthened Structure
lsolatorDisplacement
Sp
ectr
al A
ccel
erat
ion
Cs
Du
Ds
Performance Point ofStrengthened Structure
Performance Point ofOriginal Structure
(d) Effect of enhanced energy dissipation
Cu
Sp
ectr
al A
ccel
erat
ion
Spectral Displacement
(b) Effect of deformation enhancement
Ds Du
Cu
Cs
Performance Point ofStrengthened Structure
Fig. 6 c & d Effects of various retrofit measures on structural performance

training Programmes
Organised Training Programme on “Structural Diagnosis & Condition Analysis of RC Structures” at DFI-SPR on 19th & 20th Nov 2009. The programme was attended by M.N. Dasture & Co., S.M. Protection, Municipal Corpn of Greater Mumbai, Bharat Petroleum Corporation, L&T, ECC Division, Saifi Waterproofing Co., Gherzi Eastern Ltd., Godrej Industries Limited.
Organised Training Programme in collaboration with Building Materials and Technology Promotion Council ( BMTPC) on “Advances in Concrete Mix Design & Role of Admixtures” at Hotel Atria, Bangalore on 17th & 18th Dec 2009.
Dfi-sPr Promotes global construction practices through its Healthy Construction lecture series:
DFI-SPR has recently organized technical seminar under “Healthy Construction Lecture Series” on 4th December 2009 in Chennai with Dr. P. R. Swarup, Director General and Secretary to the Board of Governors of CIDC. The theme of the lecture was “Repair and Maintenance needs of Concrete Structures in India”. The prominent leading architects and engineers from all over Tamil Nadu attended the evening programme.
The Institute’sActivities
17

18
training programmes for feb 2010
DFI– SPR has scheduled following training programme. This programme has been designed for upgradation of knowledge base of practicing engineers , Waterproofing and Repair Contractors, Consultants, Architects , Faculty from Engg. Colleges.
Sr. No. Month Date Topic Fees Details of the topic
1 February-10 26th February
Corrosion and Protective Coatings
Rs. 1500/-
Environmental distresses of concrete structures•
Assessment of corrosion in RC structures•
Methods of corrosion protection for reinforcements•
Protective coatings for concrete•
location
DFI– SPR Premises at Pidilite Industries Ltd., Ramkrishna Mandir Road, Andheri (E), Mumbai.
Corporate training Programme
In addition to above scheduled programme, we also organise separate corporate programme on specific topics as per the
needs of the customer.
Distance education Correspondences Courses jointly with NiCMar
Six Month Graduate Certificate Programmes are being organized by DFI-SPR, with NICMAR for Practicing Engineers in
following Subjects:
1) Waterproofing and Maintenance of Concrete Structures
2) Advanced Technology for Concrete Repair
3) Application of Polymeric Materials in Construction
Contact Details : Mr. Tirtha Pratim Banerjee Ms. Neelima Suryawanshi Sali Phone No. : (022) 2835 7683 Phone No. : (022) 2835 7979 Mobile No. : 9930650145 Mobile No. : 9969354030 E-mail : [email protected] E-mail : [email protected]
Publications of Dfi-sPr
The Guide Book of “Cracks and Crack Repairs” covers how to identify the various types of cracks, their causes and to make diagnosis of these cracks. It provides various types of materials and methods for treatment of structural and nonstructural cracks including cracks in water retaining structures. It also provides quality assurance for effectiveness of crack repair. The safety, health and environmental aspects are also covered. The guide book is illustrated with quite a large number of sketches and photographs. It will help in guiding all Practising Engineers, Architects, Contractors, Applicators for repairing all types of cracks in concrete structures.
The Manual on “Joints and Sealants” covers different types of joints and their need for providing in concrete structures. It explains the movement of joints and how to design such joints at different locations consisting of different materials of cast-in-situ as well as precast constructions. It also provides solutions to seal those joints with different types of sealants and also guides for selection of materials for structures with fluid pressure and industrial floor joints and how to install those sealants including use of water stops. The safety, health and environmental aspects are also covered. It will help all PractisingEngineers, Architects, Designers, Contractors, Applicators, Students and Faculties as a reference manual.
The International Journal of 3R's(Repair, Restoration and Renewal of Built Environment), Vol. 1, No. 1, Jan-Mar 2010 a quarterly international journal devoted primarily to recent advances and innovations in materials, systems, technologies, equipment and engineering of repair, renewal and restoration of both infra- and superstructures.
Training Programme,Courses and Publications
The purchase enquiries for the above publications may be sent to Deputy Director, Dr. Fixit Institute of Structural Protection & Rehabilitation, Ramkrishna Mandir Road , Andheri(E), Mumbai-400059, India. by Tel/ Fax : 00-91-22-28357149 or E-mail : [email protected] and [email protected]
DFI-SPR
visioN
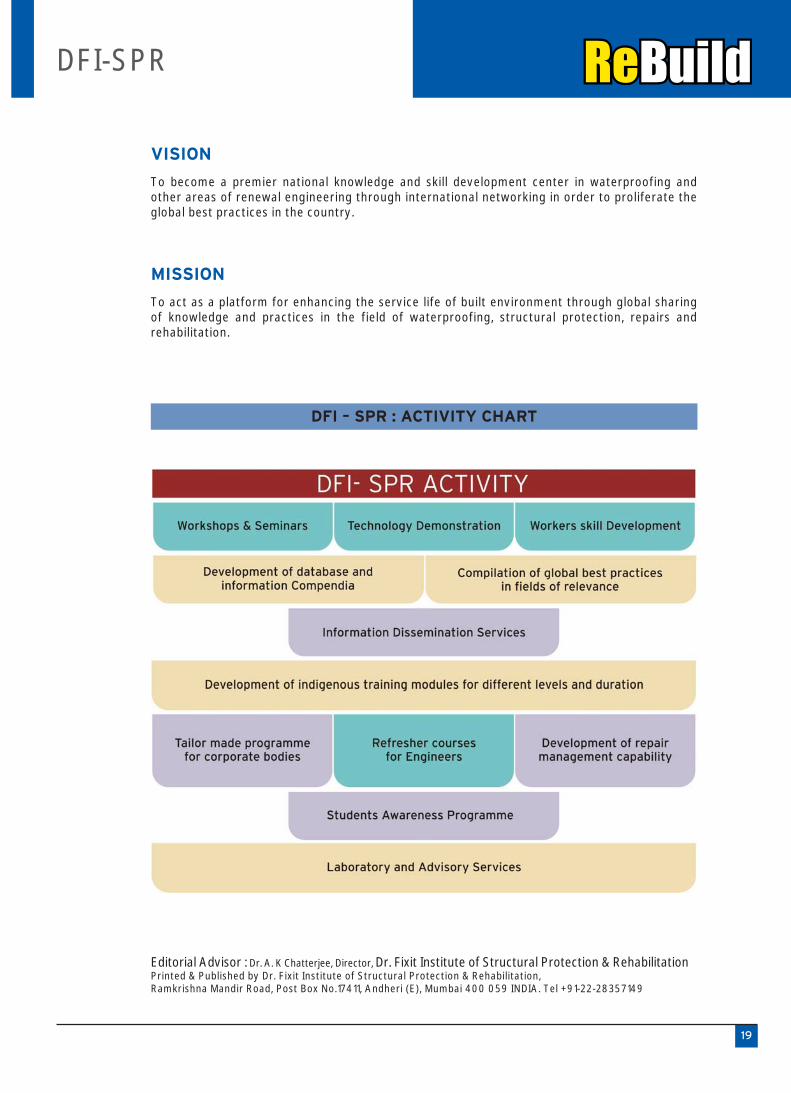
To become a premier national knowledge and skill development center in waterproofing and other areas of renewal engineering through international networking in order to proliferate the global best practices in the country.
MissioN
To act as a platform for enhancing the service life of built environment through global sharing of knowledge and practices in the field of waterproofing, structural protection, repairs and rehabilitation.
Editorial Advisor : Dr. A. K Chatterjee, Director, Dr. Fixit Institute of Structural Protection & RehabilitationPrinted & Published by Dr. Fixit Institute of Structural Protection & Rehabilitation, Ramkrishna Mandir Road, Post Box No.17411, Andheri (E), Mumbai 400 059 INDIA. Tel +91-22-28357149
Dfi – sPr : aCtivitY CHart
19

Reader’s Feedback & Interaction Solicited(For feedback kindly use our postpaid reply card placed inside)
Our Newsletter is focused on good concreting practices, waterproofing, repair, rehabilitation and maintenance of concrete structures and buildings. Any reader, who wishes to contribute his or her experience or achievements in this field to our Newsletter for wider dissemination, may send the details to:
The Editor-’Rebuild’Dr. Fixit Institute of Structural Protection & Rehabilitation
C/o Pidilite Industries Limited Ramkrishna Mandir Road, Andheri (E), Mumbai 400 059Tel : 2835 7000 / 2835 7149E-mail : [email protected] [email protected] us at : www.drfixitinstitute.com
![[PPT]Energy efficient in buildings - United Nationsunpan1.un.org/intradoc/groups/public/documents/UNGC/... · Web viewEnergy and buildings During building construction & renovation(Embodied](https://static.documents.pub/doc/80x56/5ab9d9dc7f8b9a684c8e5a78/pptenergy-efficient-in-buildings-united-viewenergy-and-buildings-during-building.jpg)


