15
www.gov.uk/natural-england Landscapes for Life Conference 2017 Briefing Natural England’s Landscape Monitoring Chris Bolton (Natural England) and Sally Marshall (Land Use Consultants)
| Date post: | 21-Jan-2018 |
| Category: |
Environment |
| Upload: | naaonb-landscapesforlife |
| View: | 59 times |
| Download: | 0 times |
www.gov.uk/natural-england
Landscapes for Life Conference 2017
Briefing
Natural England’s Landscape Monitoring
Chris Bolton (Natural England) and Sally Marshall (Land Use Consultants)

Some questions/issues.... to consider and feed
back to [email protected]
• How useful is FMEOPL to you since 2012? Any particular difficulties, issues,
(or benefits)
• What are you data analysis and evaluation needs? NE may be able to
contribute to this....collaboratively
• Is the Framework keeping in step with Management Planning data needs?
• Do you need data to inform Natural Capital – useful quantitative data on stock,
spend?
• Are you doing local landscape related monitoring? – or testing the national
trend data? - NE are interested in knowing more....
• Do we need more on land use/settlement change?
• Are you involved with any form of landscape observatory, bringing data
together locally?

Landscapes are changing
• Foresight: Land use futures –
making the most of land in the 21st century
2010 (gov.uk publications)
• Landscapes of the Future,
POSTNote 380, June 2011
• Going, Going, Gone? England’s Disappearing
Landscapes, CPRE, October 2013
• England’s Changing Landscapes: a review of landscape
change in England from 1940 to 2010. NE commissioned report from
Land Use Consultants, 2010
3

Landscape surveillance and monitoring strategy
National trends
Local insights People’s cultural values and response
Landscape Change
Monitoring

What is FMEOPL? .... Framework for Monitoring
Environmental Outcomes in Protected Landscapes
• Consistent framework - for monitoring environmental
outcomes delivered in protected landscapes
• Evidence – to support many purposes
• National datasets – brought together by NE
• Governance – five key partners on steering group
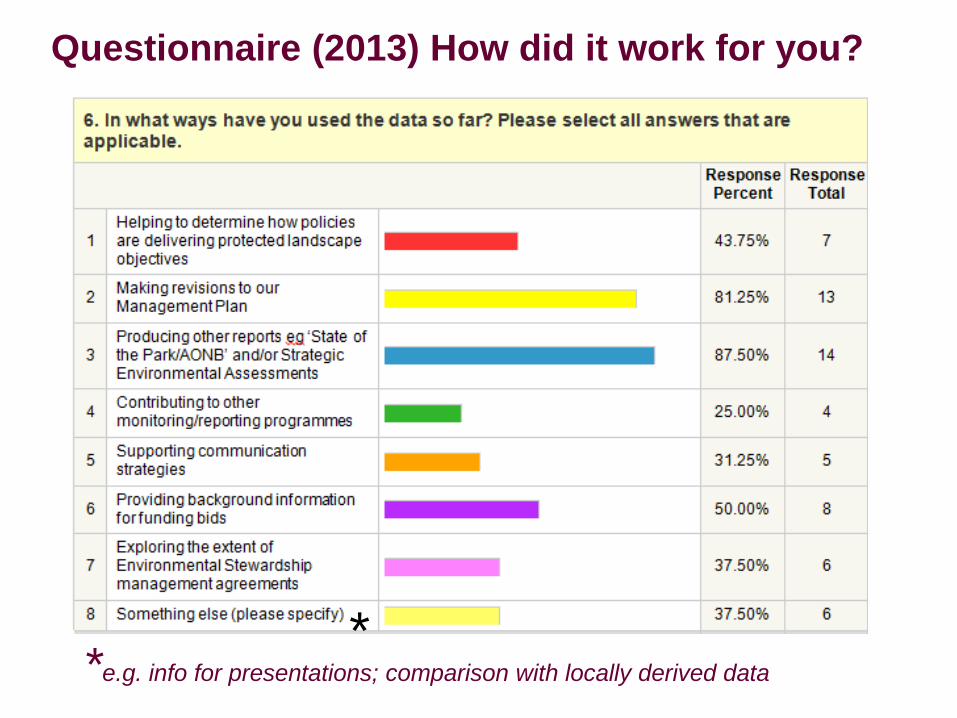
Questionnaire (2013) How did it work for you?
*e.g. info for presentations; comparison with locally derived data
*

Benefits include....
Evidence base to:
• Inform local review of statutory
management plans
• Monitor the ‘state of the park’/
AONB
• Identify exemplars
• Support funding bids
• Demonstrate benefits of
protected landscape
designation
• ‘Spine’ around which local data
can be added
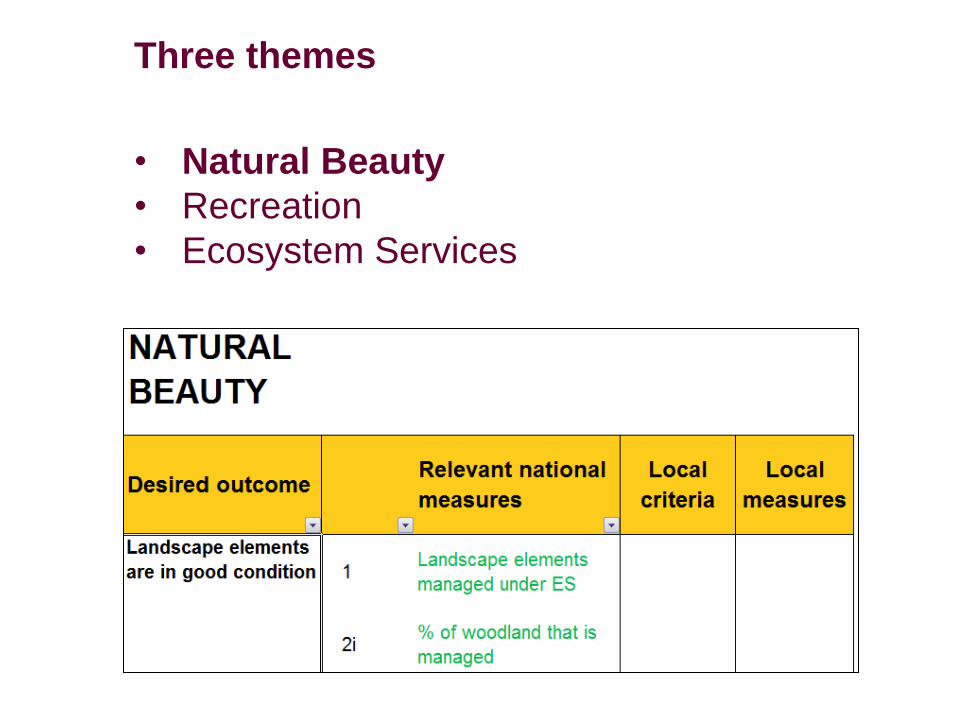
Three themes
• Natural Beauty
• Recreation
• Ecosystem Services

Example: Natural Beauty (PLNB) data
Interactive spreadsheets – Analysis tool for uptake of
agri-environment of options for management and
creation of:
• Archaeological features
• Hedgerows and hedgerow trees
• Woodlands
• Grassland (low input)
• Lowland heathland
• Moorland

The ES analysis tool– easy to use e.g. EK2 Permanent grassland with low inputs
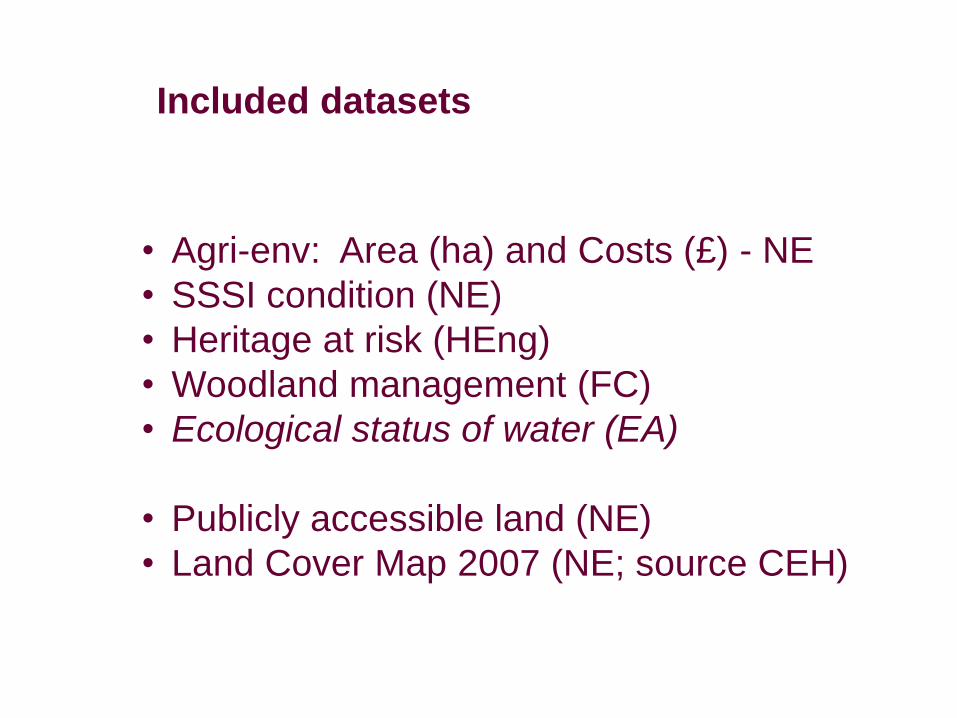
Included datasets
• Agri-env: Area (ha) and Costs (£) - NE
• SSSI condition (NE)
• Heritage at risk (HEng)
• Woodland management (FC)
• Ecological status of water (EA)
• Publicly accessible land (NE)
• Land Cover Map 2007 (NE; source CEH)

Trend analysis – examples only
Year Good Moderate Poor Bad
2012 1547 3183 789 39
2013 1509 2947 955 49
2014 1670 2899 1037 40
2015 1312 3185 1155 40
e.g. Water Quality (ecological status)
All AONBs (Km)

SSSI Condition for all AONBs (ha)
2012 - 2017
FAVOURABLE UNFAV RECOVING UNFAV NO CHANGE UNFAV DECLINING
2012 77,942 172,363 2,916 2,642
2013 80,053 166,670 2,912 6,243
2014 80,667 167,109 3,081 4,969
2015 81,134 166,603 3,153 4,881
2016 83,386 164,383 3,150 4,819
2017 84,629 159,361 7,040 4,712

All AONBs:
Area under
ES (ha)
2014 -17
Dorset AONB
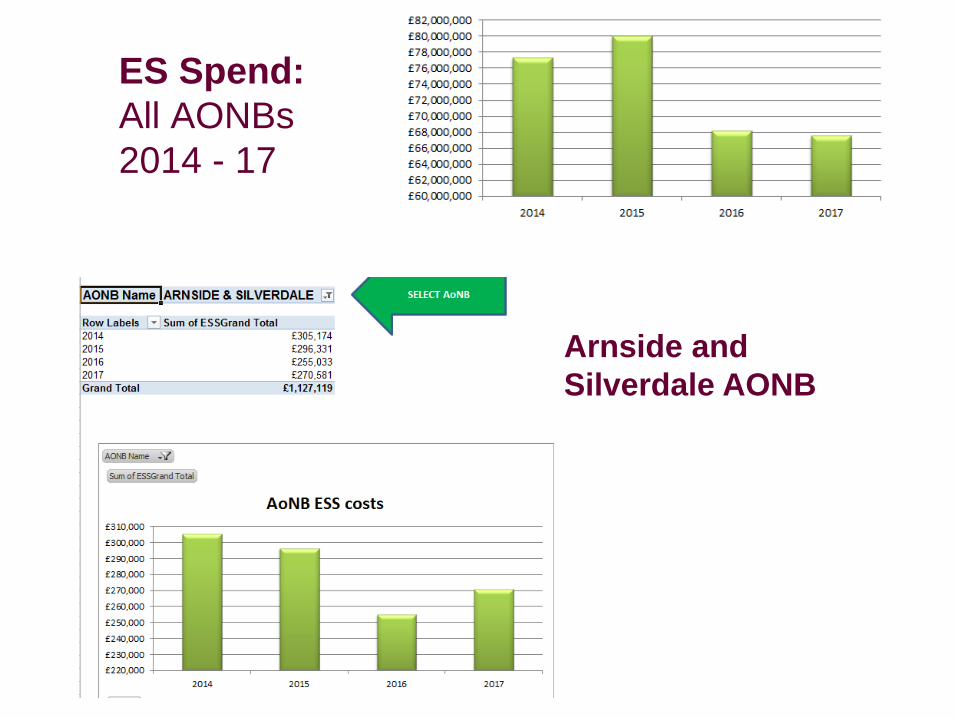
ES Spend:
All AONBs
2014 - 17
Arnside and
Silverdale AONB


