Natural Gas Dehydration Lessons Learned from Natural Gas STAR Producers and Processors Technology Transfer Workshop ConocoPhillips and EPA’s Natural Gas STAR Program Kenai, AK May 25, 2006 Natural Gas Dehydration: Agenda Methane Losses Methane Recovery Is Recovery Profitable? Industry Experience Discussion Questions 1
Transcript
Natural Gas Dehydration
Lessons Learned from Natural Gas STAR
Producers and Processors Technology Transfer Workshop
ConocoPhillips and EPA’s Natural Gas STAR Program
Kenai, AK May 25, 2006
Natural Gas Dehydration: Agenda
Methane Losses
Methane Recovery
Is Recovery Profitable?
Industry Experience
Discussion Questions
1
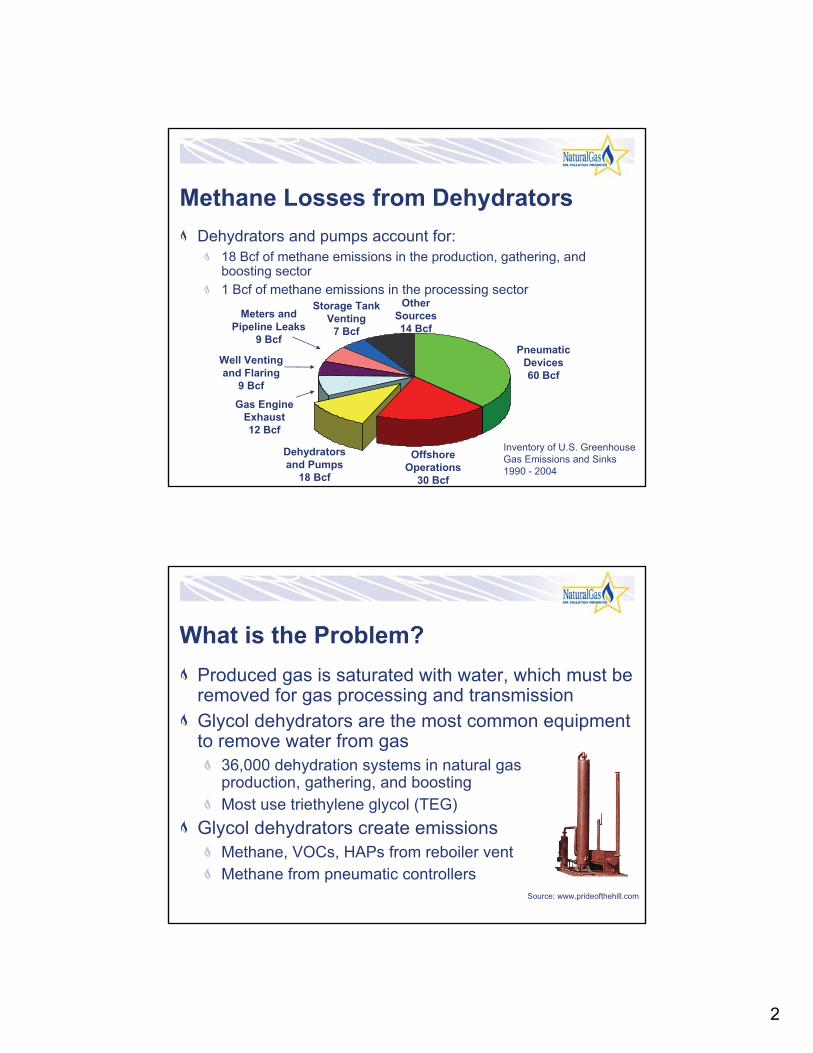
Methane Losses from Dehydrators
Dehydrators and pumps account for:
18 Bcf of methane emissions in the production, gathering, and boosting sector
1 Bcf of methane emissions in the processing sector Storage Tank Other
Meters and Venting Sources Pipeline Leaks
9 Bcf Pneumatic
Well Venting Devices and Flaring 60 Bcf
9 Bcf
Dehydrators and Pumps
18 Bcf
Offshore Operations
30 Bcf
7 Bcf 14 Bcf
Gas EngineExhaust12 Bcf
Inventory of U.S. Greenhouse Gas Emissions and Sinks 1990 - 2004
What is the Problem?
Produced gas is saturated with water, which must be removed for gas processing and transmission
Glycol dehydrators are the most common equipment to remove water from gas
36,000 dehydration systems in natural gas production, gathering, and boosting
Most use triethylene glycol (TEG)
Glycol dehydrators create emissions
Methane, VOCs, HAPs from reboiler vent
Methane from pneumatic controllers Source: www.prideofthehill.com
2
3
Methane Recovery: Five Options
Optimize glycol circulation rates
Flash tank separator (FTS) installation
Electric pump installation
Zero emission dehydrator
Replace glycol unit with desiccant dehydrator
Flare (no recovery)
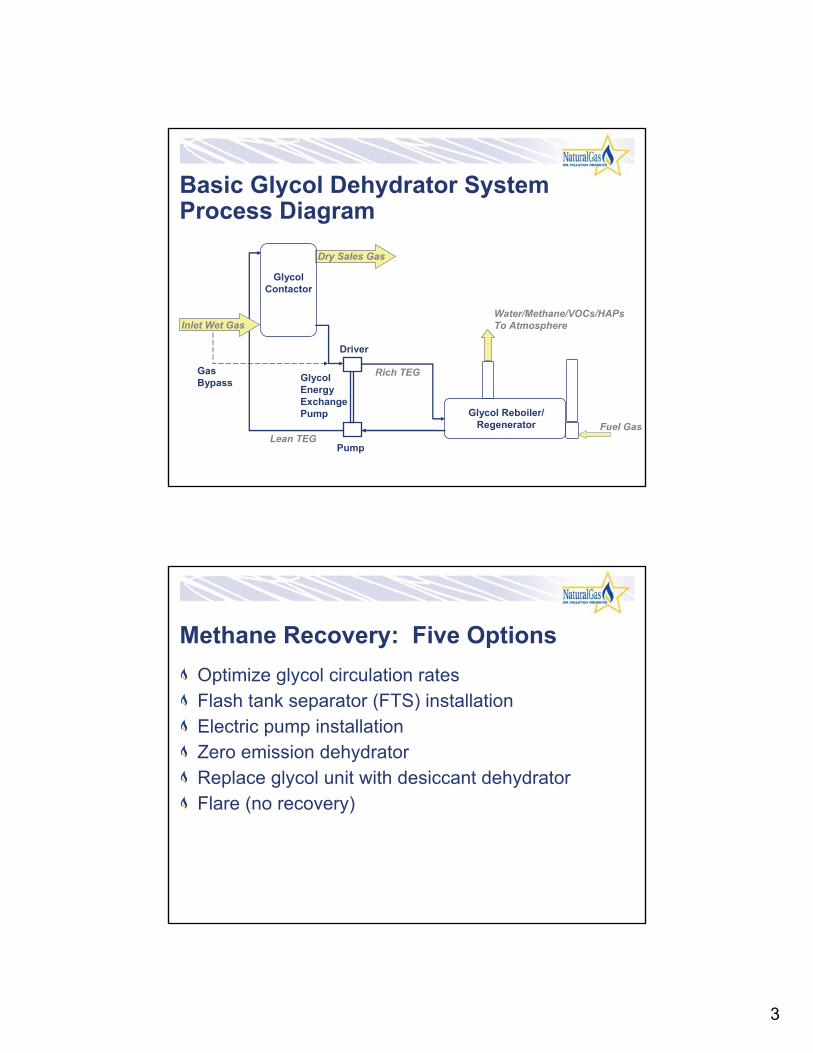
Glycol Energy Exchange Pump
Dry Sales Gas
Basic Glycol Dehydrator System Process Diagram
Glycol Contactor
Inlet Wet Gas
Lean TEG Pump
Driver
Water/Methane/VOCs/HAPs
To Atmosphere
Rich TEG
Fuel Gas
Glycol Reboiler/ Regenerator
Gas Bypass
Optimizing Glycol Circulation Rate
Gas well’s initial production rate decreases over its lifespan
Glycol circulation rates designed for initial, highest production rate
Operators tend to “set it and forget it”
Glycol overcirculation results in more methane emissions and fuel gas consumption without significant reduction in gas moisture content
Partners found circulation rates two to three times higher than necessary
Methane emissions and fuel gas consumption are directly proportional to circulation rate
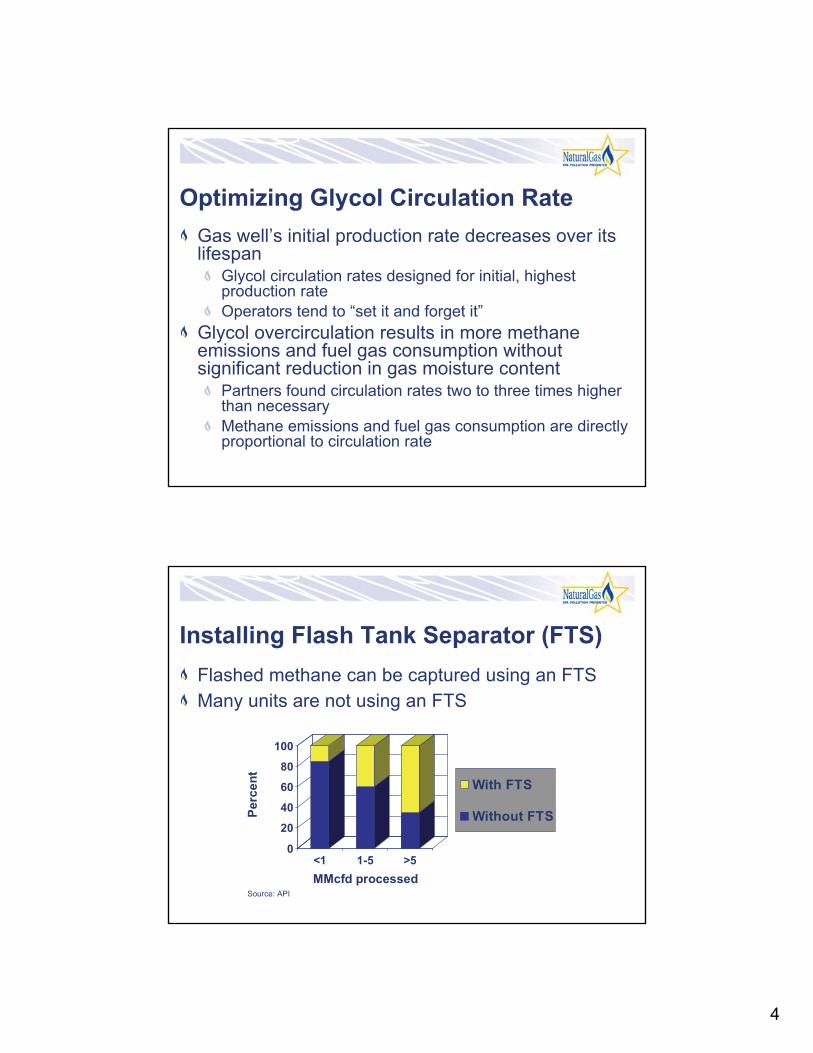
Installing Flash Tank Separator (FTS)
Flashed methane can be captured using an FTS
Many units are not using an FTS
0
20
40
60
80
100
Pe
rce
nt
<1 1-5 >5
MMcfd processed
With FTS
Without FTS
Source: API
4
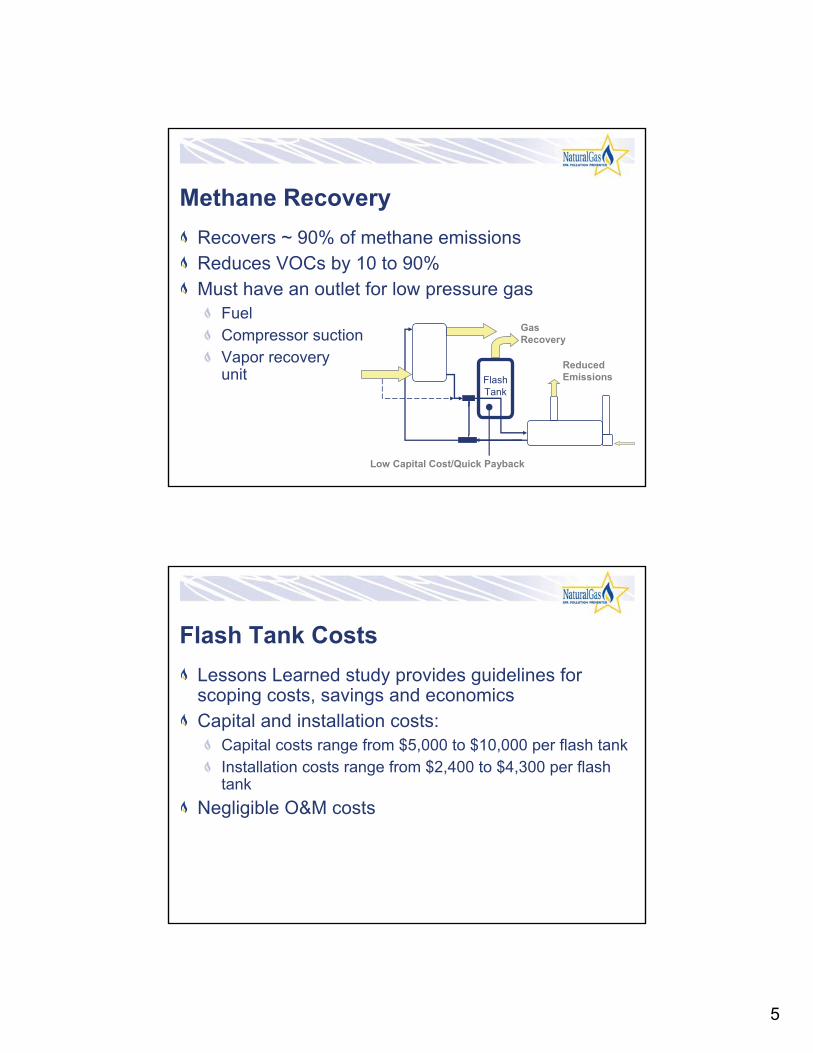
Methane Recovery
Recovers ~ 90% of methane emissions
Reduces VOCs by 10 to 90%
Must have an outlet for low pressure gas
Fuel
Compressor suction
Vapor recoveryunit Flash
Tank
Gas Recovery
Reduced Emissions
Low Capital Cost/Quick Payback
Flash Tank Costs
Lessons Learned study provides guidelines for scoping costs, savings and economics
Capital and installation costs:
Capital costs range from $5,000 to $10,000 per flash tank
Installation costs range from $2,400 to $4,300 per flash tank
Negligible O&M costs
5
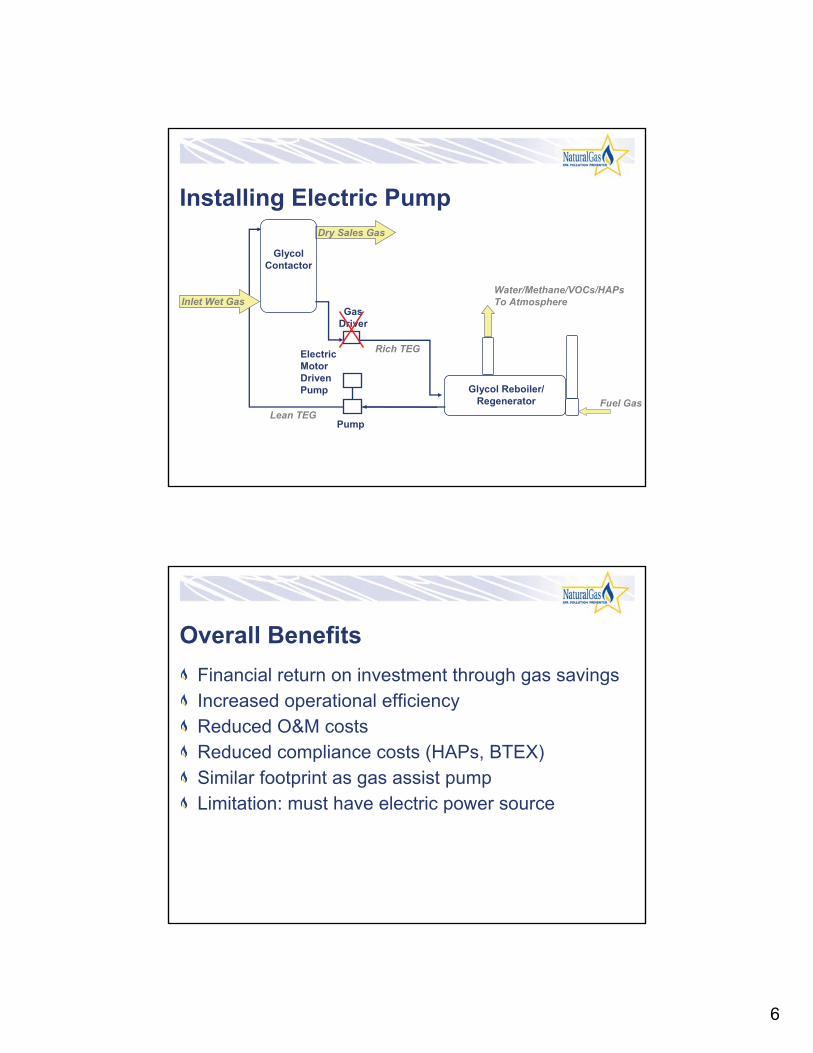
Installing Electric Pump
Glycol Contactor
Dry Sales Gas
Inlet Wet Gas
Lean TEG Pump
Gas Driver
Water/Methane/VOCs/HAPs
To Atmosphere
Rich TEG
Fuel Gas
Glycol Reboiler/ Regenerator
Electric Motor Driven Pump
Overall Benefits
Financial return on investment through gas savings
Increased operational efficiency
Reduced O&M costs
Reduced compliance costs (HAPs, BTEX)
Similar footprint as gas assist pump
Limitation: must have electric power source
6
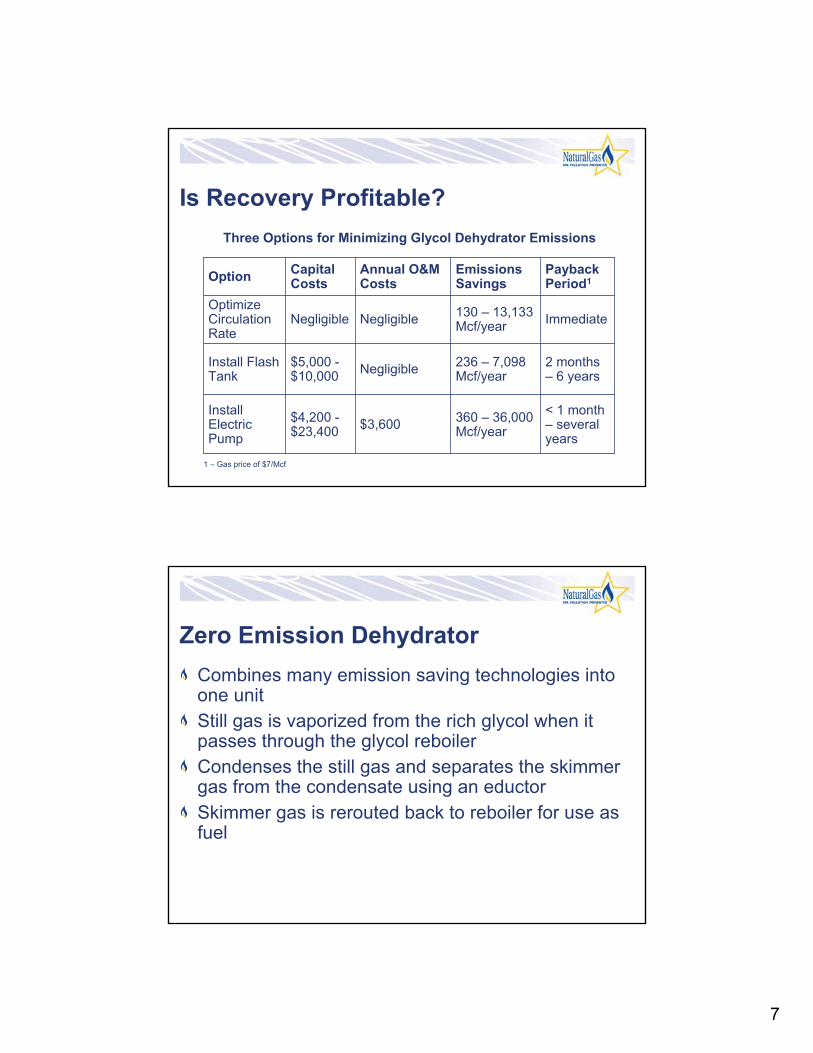
Is Recovery Profitable?
Three Options for Minimizing Glycol Dehydrator Emissions
Option Capital Costs
Annual O&M Costs
Emissions Savings
Payback Period1
Optimize Circulation Rate
Negligible Negligible 130 – 13,133 Mcf/year
Immediate
Install Flash Tank
$5,000 $10,000
Negligible 236 – 7,098 Mcf/year
2 months – 6 years
Install Electric Pump
$4,200 $23,400
$3,600 360 – 36,000 Mcf/year
< 1 month – several years
1 – Gas price of $7/Mcf
Zero Emission Dehydrator
Combines many emission saving technologies into one unit
Still gas is vaporized from the rich glycol when it passes through the glycol reboiler
Condenses the still gas and separates the skimmer gas from the condensate using an eductor
Skimmer gas is rerouted back to reboiler for use as fuel
7
Overall Benefits
Still gas is condensable (heavier hydrocarbons and water) and can be removed from the non-condensable components using a still condenser
The condensed liquid will be a mixture of water and hydrocarbons and can be further separated
Hydrocarbons (mostly methane) are valuable and can be recovered as fuel or product
By collecting the still column vent gas emissions are greatly reduced
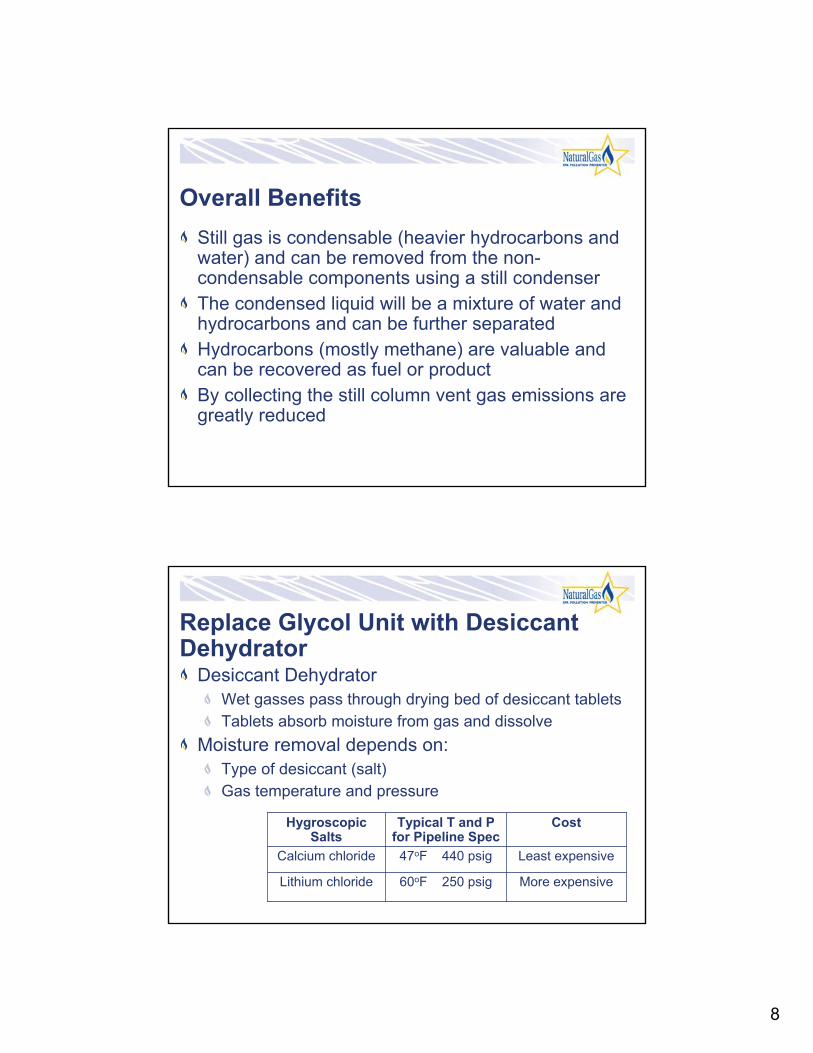
Replace Glycol Unit with Desiccant Dehydrator
Desiccant Dehydrator
Wet gasses pass through drying bed of desiccant tablets
Tablets absorb moisture from gas and dissolve
Moisture removal depends on:
Type of desiccant (salt)
Gas temperature and pressure
Hygroscopic Typical T and P Cost Salts for Pipeline Spec
Calcium chloride 47oF 440 psig Least expensive
Lithium chloride 60oF 250 psig More expensive
8
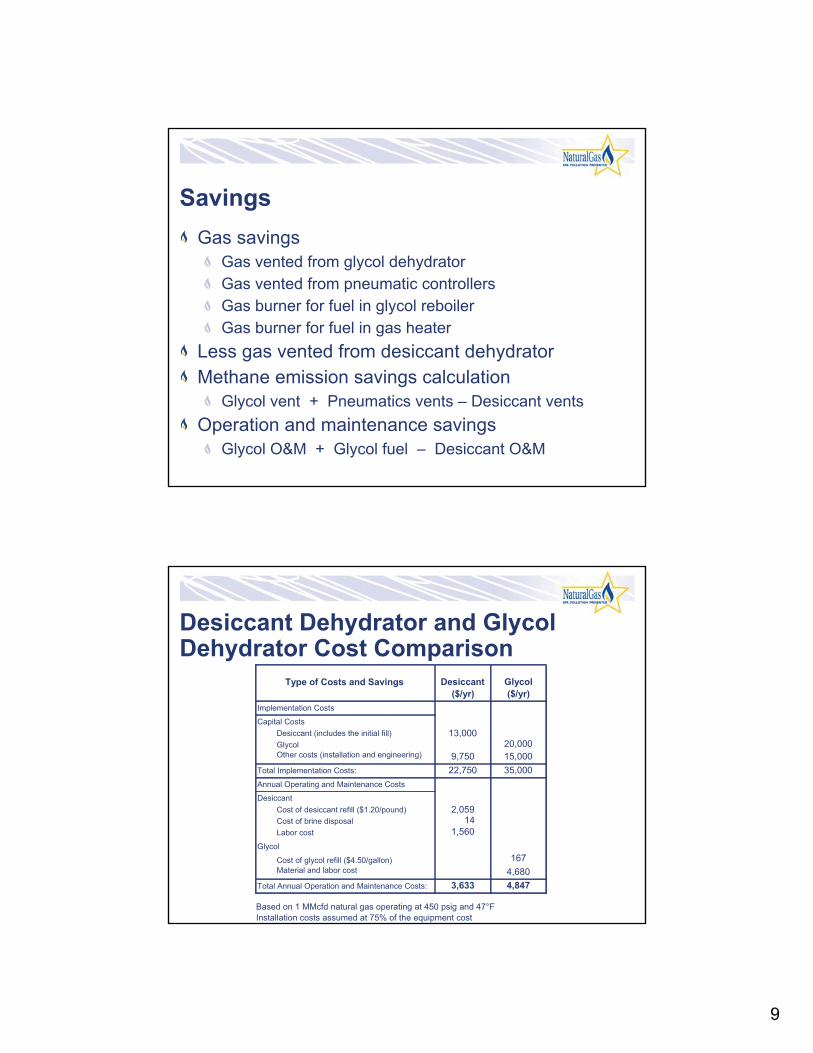
Savings
Gas savings
Gas vented from glycol dehydrator
Gas vented from pneumatic controllers
Gas burner for fuel in glycol reboiler
Gas burner for fuel in gas heater
Less gas vented from desiccant dehydrator
Methane emission savings calculation
Glycol vent + Pneumatics vents – Desiccant vents
Operation and maintenance savings
Glycol O&M + Glycol fuel – Desiccant O&M
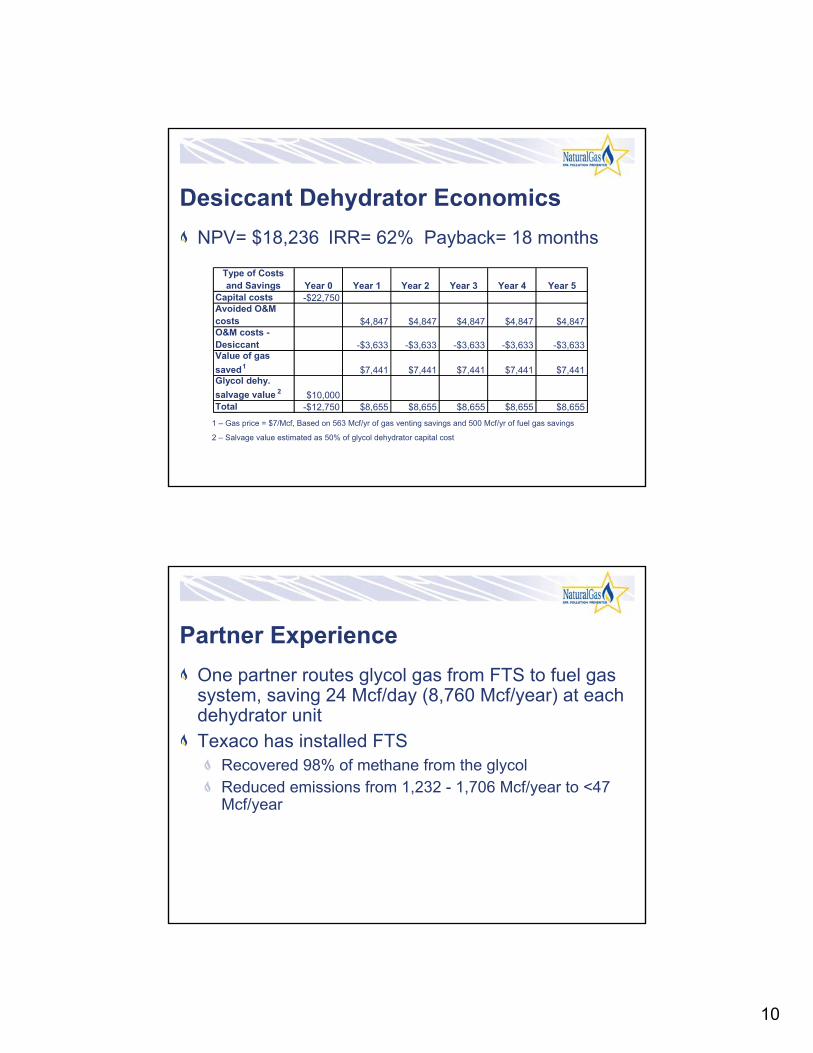
Desiccant Dehydrator and Glycol Dehydrator Cost Comparison
Type of Costs and Savings Desiccant
($/yr)
Glycol
($/yr)
Implementation Costs
13,000
9,750
20,000
15,000
Capital Costs
Desiccant (includes the initial fill)
Glycol
Other costs (installation and engineering)
Total Implementation Costs: 22,750 35,000
Annual Operating and Maintenance Costs
2,059 14
1,560
167
4,680
Desiccant
Cost of desiccant refill ($1.20/pound)
Cost of brine disposal
Labor cost
Glycol
Cost of glycol refill ($4.50/gallon)
Material and labor cost
Total Annual Operation and Maintenance Costs: 3,633 4,847
Based on 1 MMcfd natural gas operating at 450 psig and 47°F
Installation costs assumed at 75% of the equipment cost
9
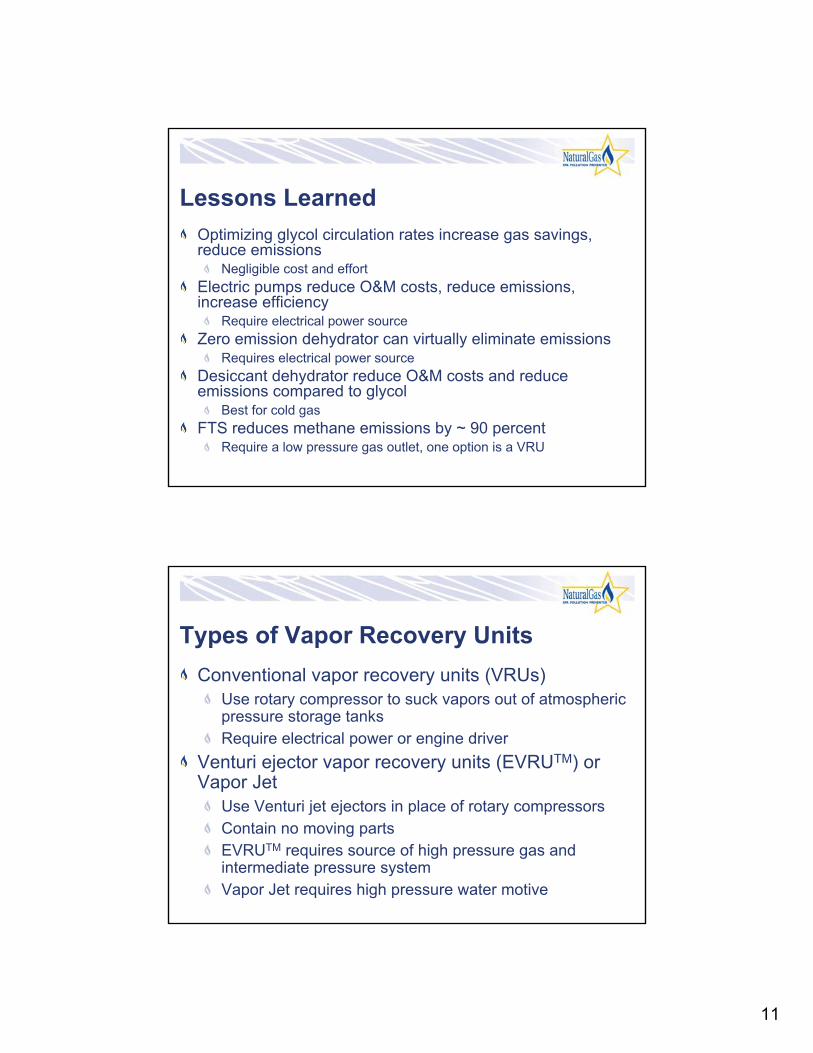
Desiccant Dehydrator Economics
NPV= $18,236 IRR= 62% Payback= 18 months
Type of Costs
and Savings Year 0 Year 1 Year 2 Year 3 Year 4 Year 5
Desiccant -$3,633 -$3,633 -$3,633 -$3,633 -$3,633 Value of gas
saved1 $7,441 $7,441 $7,441 $7,441 $7,441
Glycol dehy.
salvage value 2 $10,000
Total -$12,750 $8,655 $8,655 $8,655 $8,655 $8,655
1 – Gas price = $7/Mcf, Based on 563 Mcf/yr of gas venting savings and 500 Mcf/yr of fuel gas savings
2 – Salvage value estimated as 50% of glycol dehydrator capital cost
Partner Experience
One partner routes glycol gas from FTS to fuel gas system, saving 24 Mcf/day (8,760 Mcf/year) at each dehydrator unit
Texaco has installed FTS
Recovered 98% of methane from the glycol
Reduced emissions from 1,232 - 1,706 Mcf/year to <47 Mcf/year
10
Lessons Learned
Optimizing glycol circulation rates increase gas savings, reduce emissions
Negligible cost and effort
Electric pumps reduce O&M costs, reduce emissions, increase efficiency
Require electrical power source
Zero emission dehydrator can virtually eliminate emissions Requires electrical power source
Desiccant dehydrator reduce O&M costs and reduce emissions compared to glycol
Best for cold gas
FTS reduces methane emissions by ~ 90 percentRequire a low pressure gas outlet, one option is a VRU
Types of Vapor Recovery Units
Conventional vapor recovery units (VRUs)
Use rotary compressor to suck vapors out of atmospheric pressure storage tanks
Require electrical power or engine driver
Venturi ejector vapor recovery units (EVRUTM) or Vapor Jet
Use Venturi jet ejectors in place of rotary compressors
Contain no moving parts
EVRUTM requires source of high pressure gas and intermediate pressure system
Vapor Jet requires high pressure water motive
11
Types of Vapor Recovery Units
Conventional vapor recovery units (VRUs)
Use rotary compressor to suck vapors out of atmospheric pressure storage tanks
Require electrical power or engine driver
Venturi ejector vapor recovery units (EVRUTM) or Vapor Jet
Use Venturi jet ejectors in place of rotary compressors
Contain no moving parts
EVRUTM requires source of high pressure gas and intermediate pressure system
Vapor Jet requires high pressure water motive
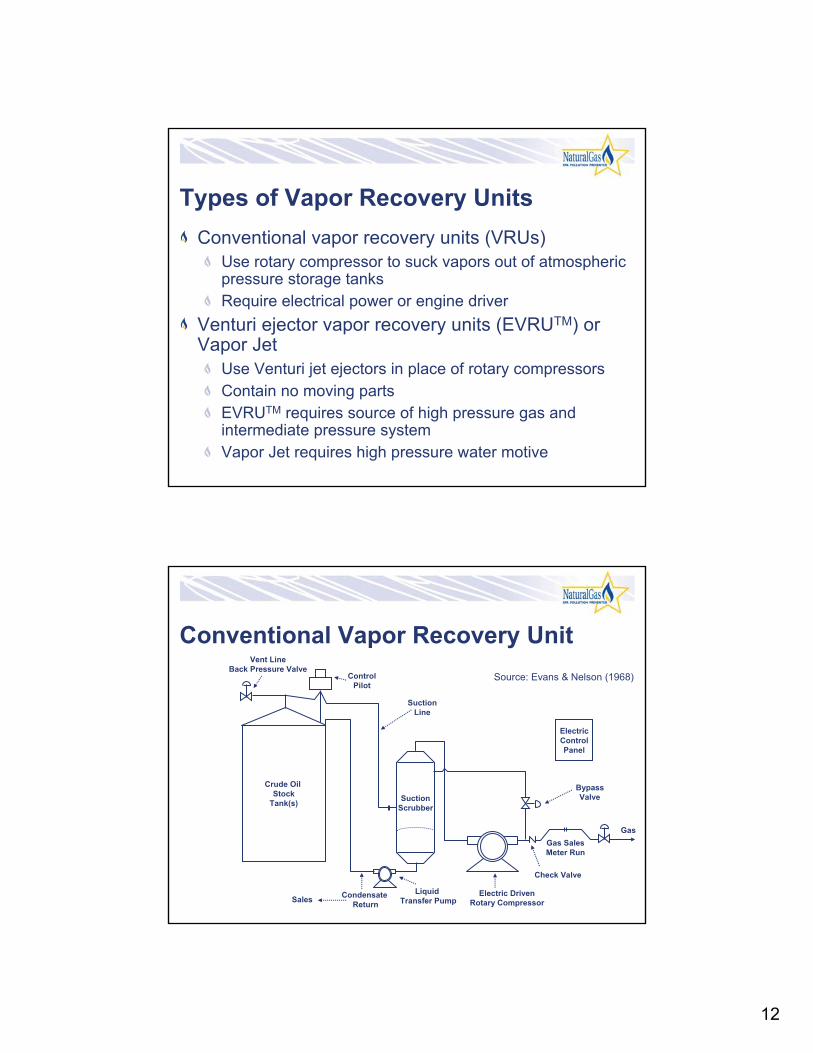
Conventional Vapor Recovery Unit
Crude Oil Stock
Tank(s)
Control Pilot
Vent Line Back Pressure Valve
Suction Scrubber
Suction Line
Condensate Return
Bypass Valve
Electric Control Panel
Electric Driven Rotary Compressor
Gas Sales Meter Run
Gas
Liquid Transfer Pump
Check Valve
Source: Evans & Nelson (1968)
Sales
12
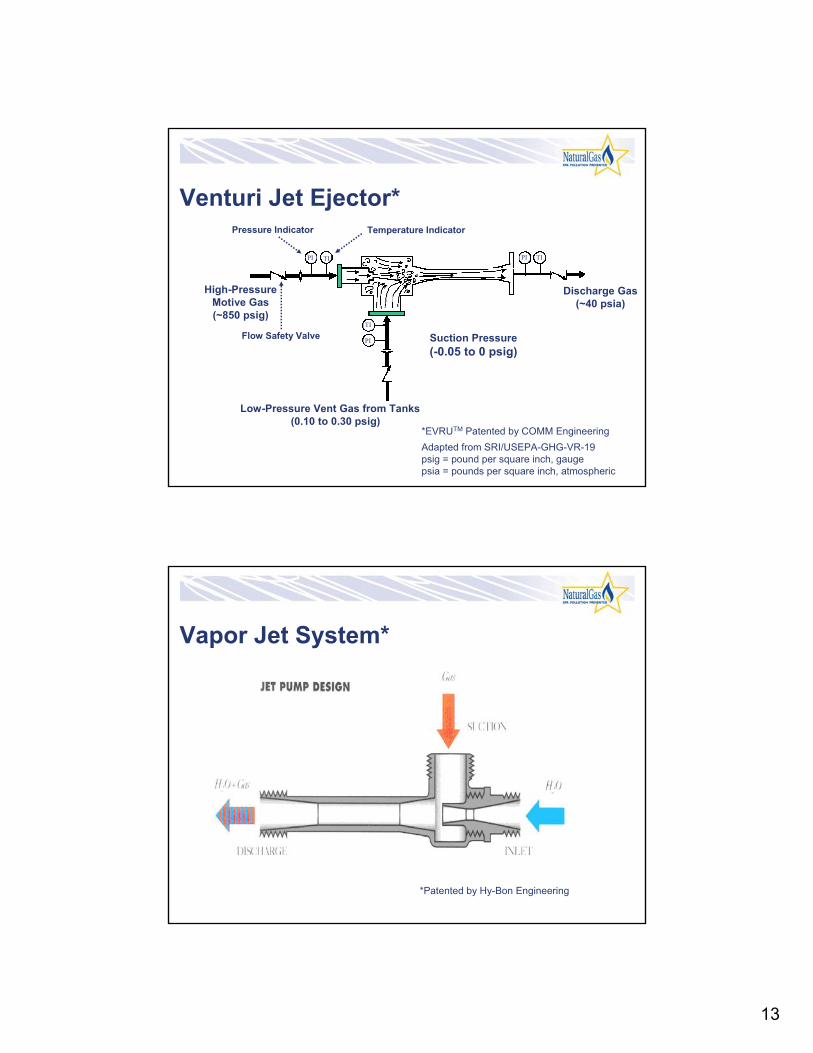
Venturi Jet Ejector*
High-Pressure Motive Gas (~850 psig)
Flow Safety Valve
Pressure Indicator Temperature Indicator
PI TI
TI
PI
Low-Pressure Vent Gas from Tanks (0.10 to 0.30 psig)
PI TI
Discharge Gas (~40 psia)
Suction Pressure
(-0.05 to 0 psig)
*EVRUTM Patented by COMM Engineering
Adapted from SRI/USEPA-GHG-VR-19 psig = pound per square inch, gauge psia = pounds per square inch, atmospheric
Vapor Jet System*
*Patented by Hy-Bon Engineering
13
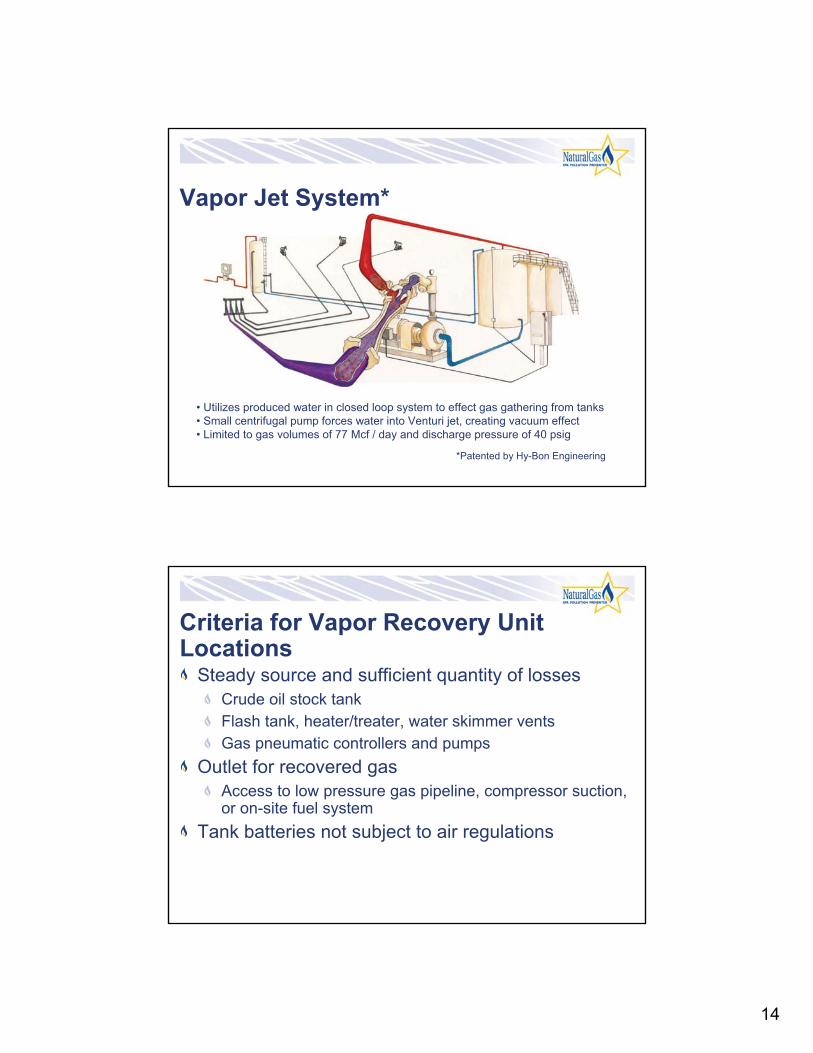
Vapor Jet System*
*Patented by Hy-Bon Engineering
• Utilizes produced water in closed loop system to effect gas gathering from tanks • Small centrifugal pump forces water into Venturi jet, creating vacuum effect • Limited to gas volumes of 77 Mcf / day and discharge pressure of 40 psig
Locations Steady source and sufficient quantity of losses
Criteria for Vapor Recovery Unit
Crude oil stock tank
Flash tank, heater/treater, water skimmer vents
Gas pneumatic controllers and pumps
Outlet for recovered gas
Access to low pressure gas pipeline, compressor suction, or on-site fuel system
Tank batteries not subject to air regulations
14
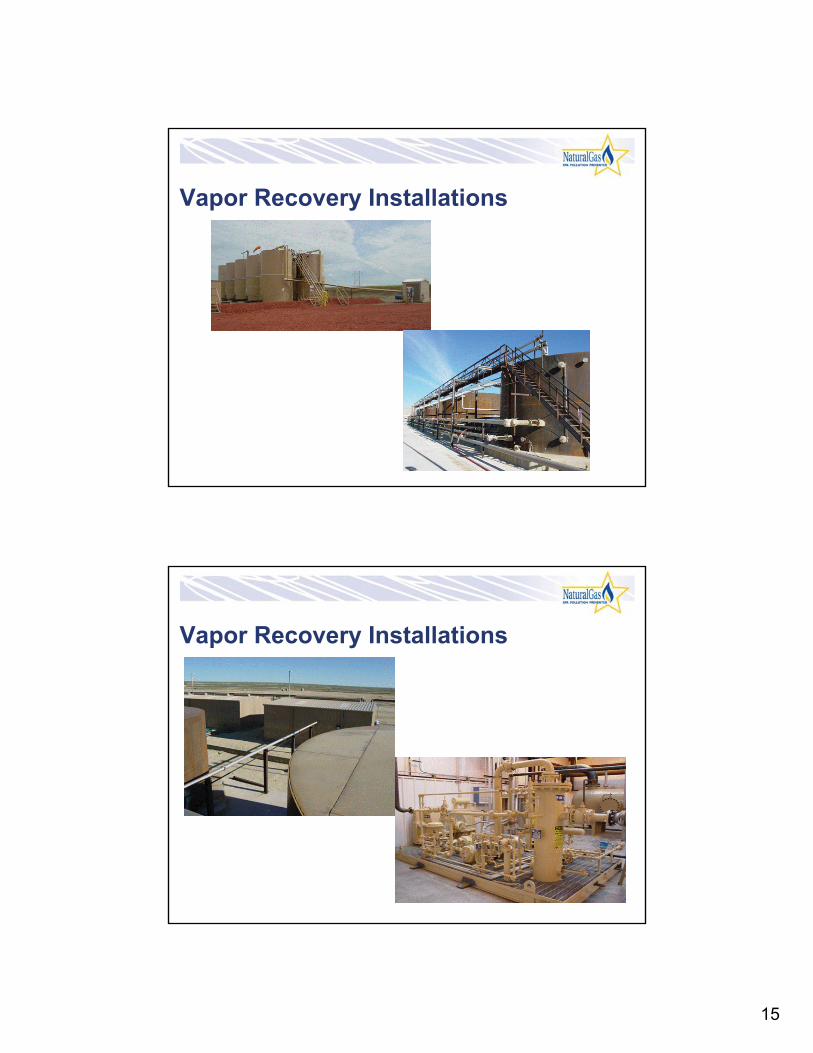
Vapor Recovery Installations
Vapor Recovery Installations
15
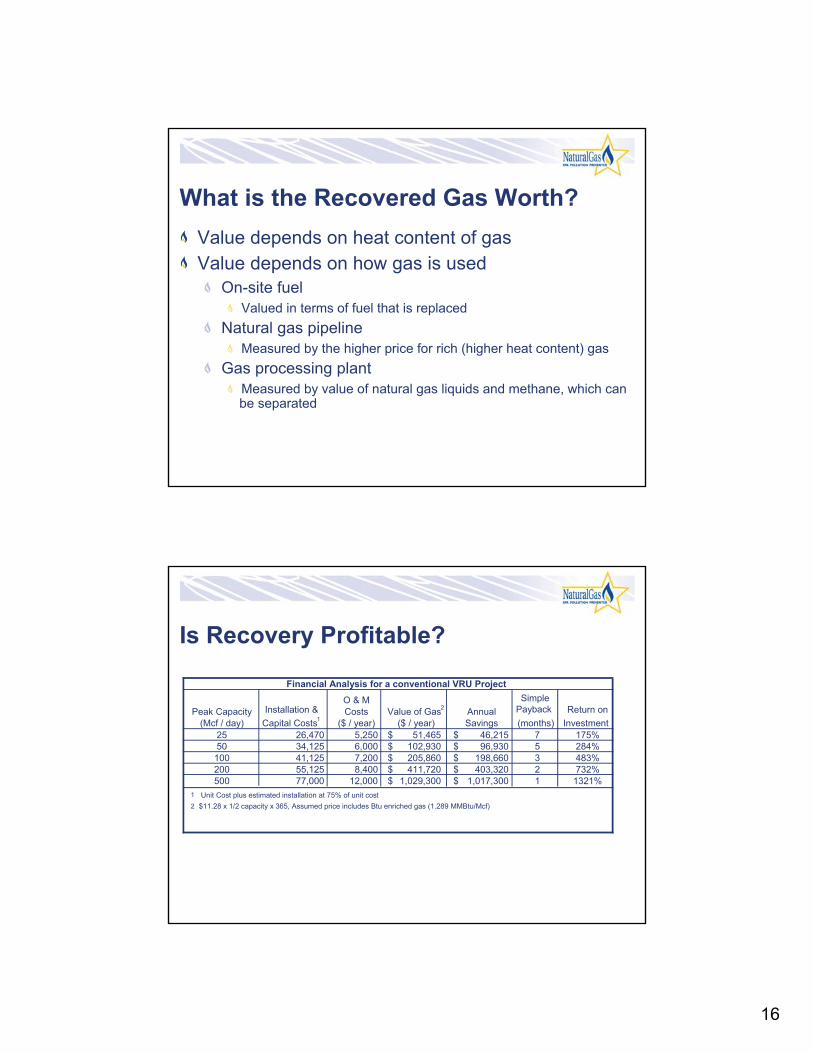
What is the Recovered Gas Worth?
Value depends on heat content of gas
Value depends on how gas is used
On-site fuel
Valued in terms of fuel that is replaced
Natural gas pipeline
Measured by the higher price for rich (higher heat content) gas
Gas processing plant
Measured by value of natural gas liquids and methane, which can be separated
1 Unit Cost plus estimated installation at 75% of unit cost
2 $11.28 x 1/2 capacity x 365, Assumed price includes Btu enriched gas (1.289 MMBtu/Mcf)
16
Discussion Questions
To what extent are you implementing these technologies?
How can the Lessons Learned studies be improved upon or altered for use in your operation(s)?
What are the barriers (technological, economic, lack of information, regulatory, focus, manpower, etc.) that are preventing you from implementing this technology?