13
ON IT Natural Gas Demand Growth and New Capacity Additions Peter Carnavos Consolidated Edison Company of New York NGA Regional Markets Forum 2013 April 30, 2013
ON IT
Natural Gas Demand Growth and New Capacity Additions
Peter CarnavosConsolidated Edison Company of New York
NGA Regional Markets Forum 2013April 30, 2013
ON IT
Agenda
• Consolidated Edison• Demand Growth
– Gas Customer and Power Generation
• Northeast Pipeline Expansions– Deliveries to Metro NY Area
2
ON IT
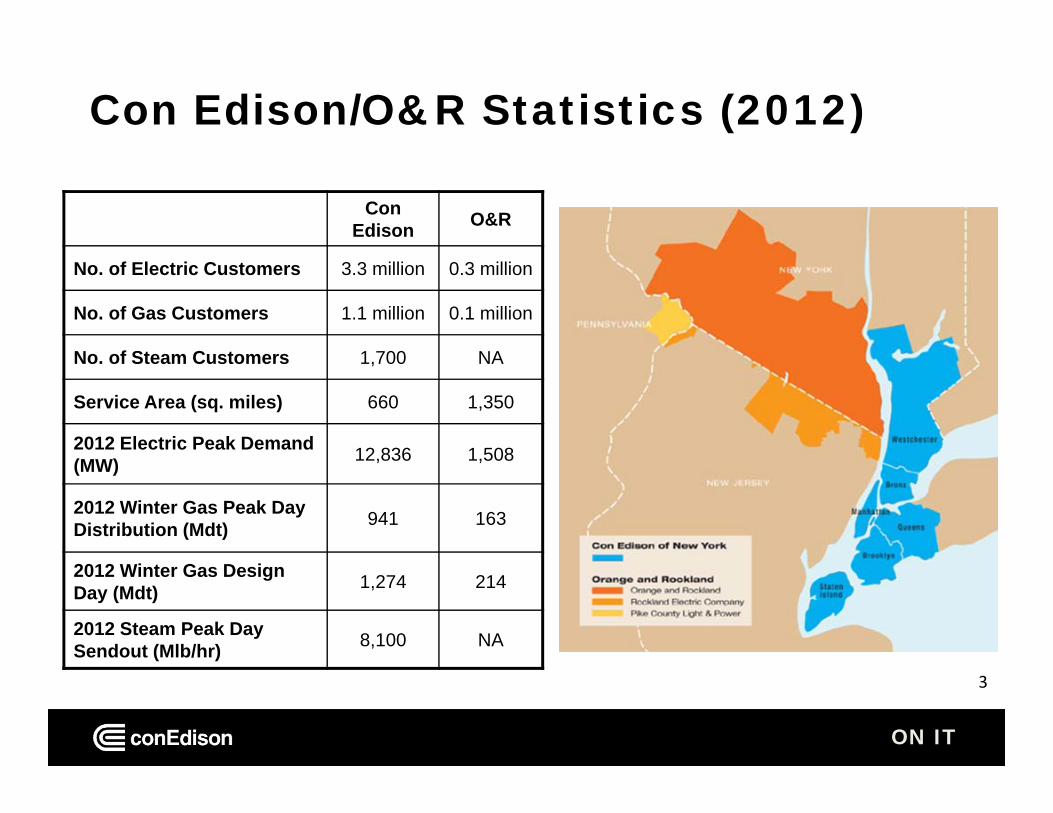
Con Edison/O&R Statistics (2012)
3
Con Edison O&R
No. of Electric Customers 3.3 million 0.3 million
No. of Gas Customers 1.1 million 0.1 million
No. of Steam Customers 1,700 NA
Service Area (sq. miles) 660 1,350
2012 Electric Peak Demand (MW) 12,836 1,508
2012 Winter Gas Peak Day Distribution (Mdt) 941 163
2012 Winter Gas Design Day (Mdt) 1,274 214
2012 Steam Peak Day Sendout (Mlb/hr) 8,100 NA
ON IT
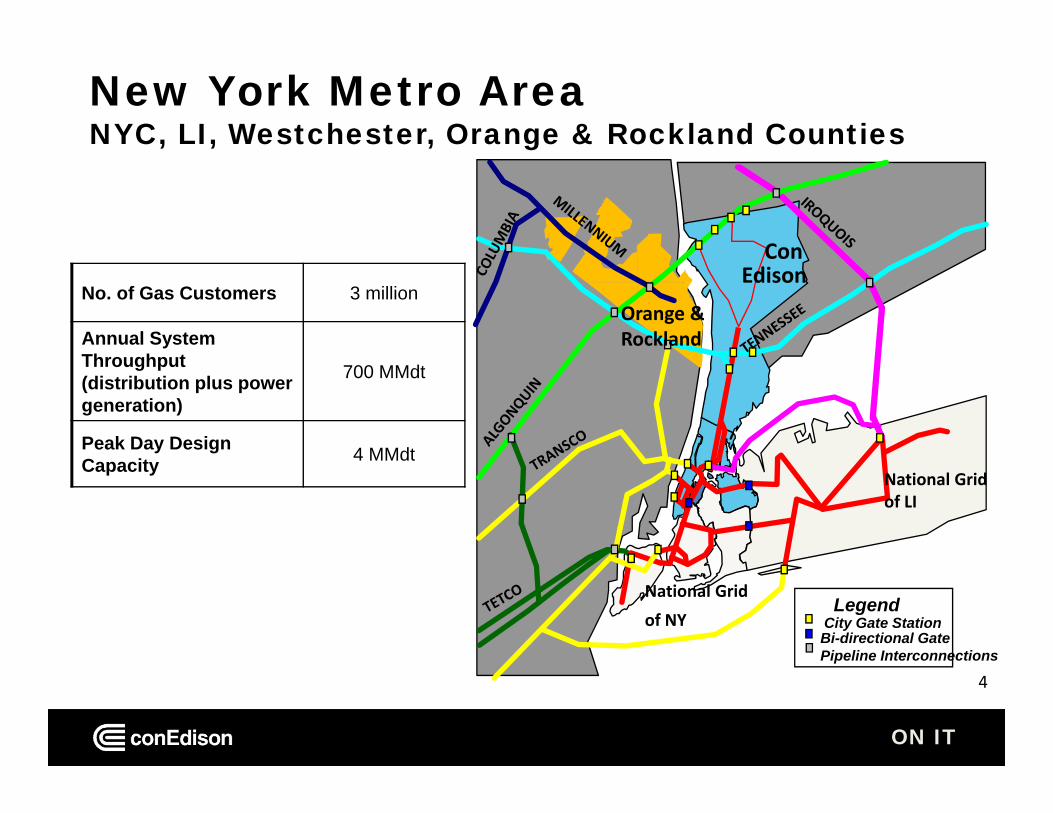
New York Metro AreaNYC, LI, Westchester, Orange & Rockland Counties
4
National Gridof LI
ConEdison
National Gridof NY
Orange &Rockland
LegendCity Gate StationBi-directional GatePipeline Interconnections
No. of Gas Customers 3 million
Annual System Throughput (distribution plus power generation)
700 MMdt
Peak Day Design Capacity 4 MMdt
ON IT
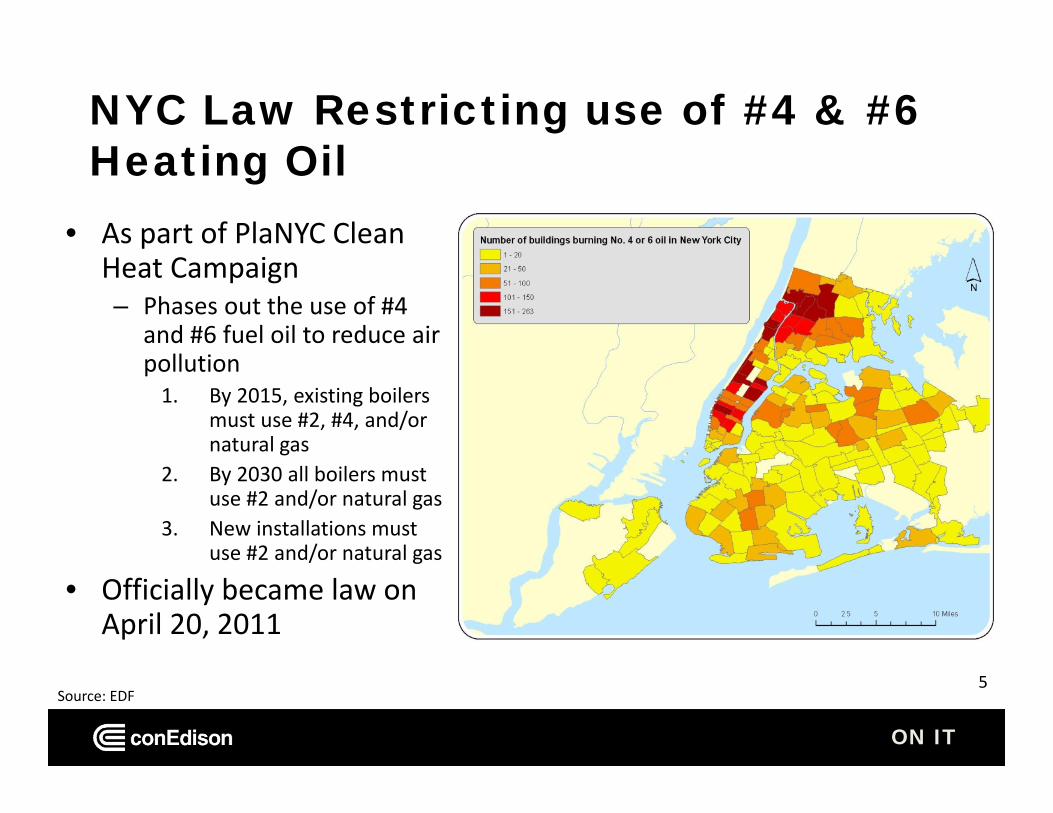
NYC Law Restricting use of #4 & #6 Heating Oil
• As part of PlaNYC Clean Heat Campaign– Phases out the use of #4
and #6 fuel oil to reduce air pollution1. By 2015, existing boilers
must use #2, #4, and/or natural gas
2. By 2030 all boilers must use #2 and/or natural gas
3. New installations must use #2 and/or natural gas
• Officially became law on April 20, 2011
5Source: EDF
ON IT
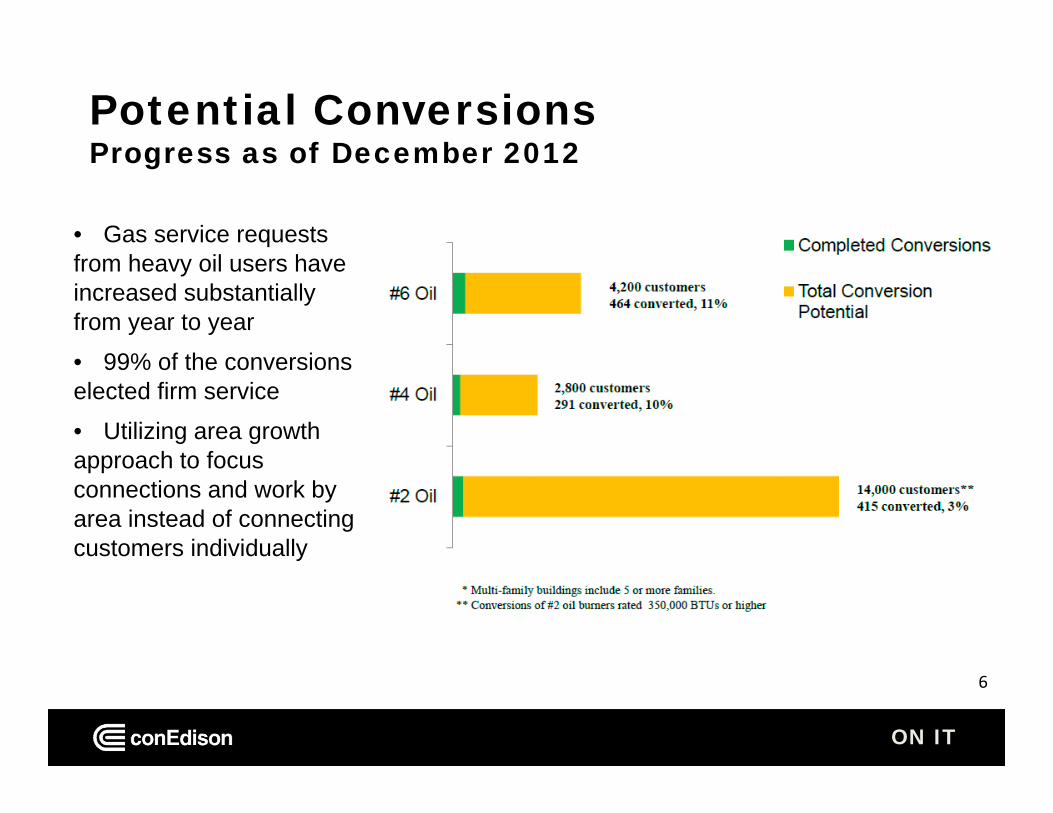
Potential ConversionsProgress as of December 2012
6
• Gas service requests from heavy oil users have increased substantially from year to year
• 99% of the conversions elected firm service
• Utilizing area growth approach to focus connections and work by area instead of connecting customers individually
ON IT
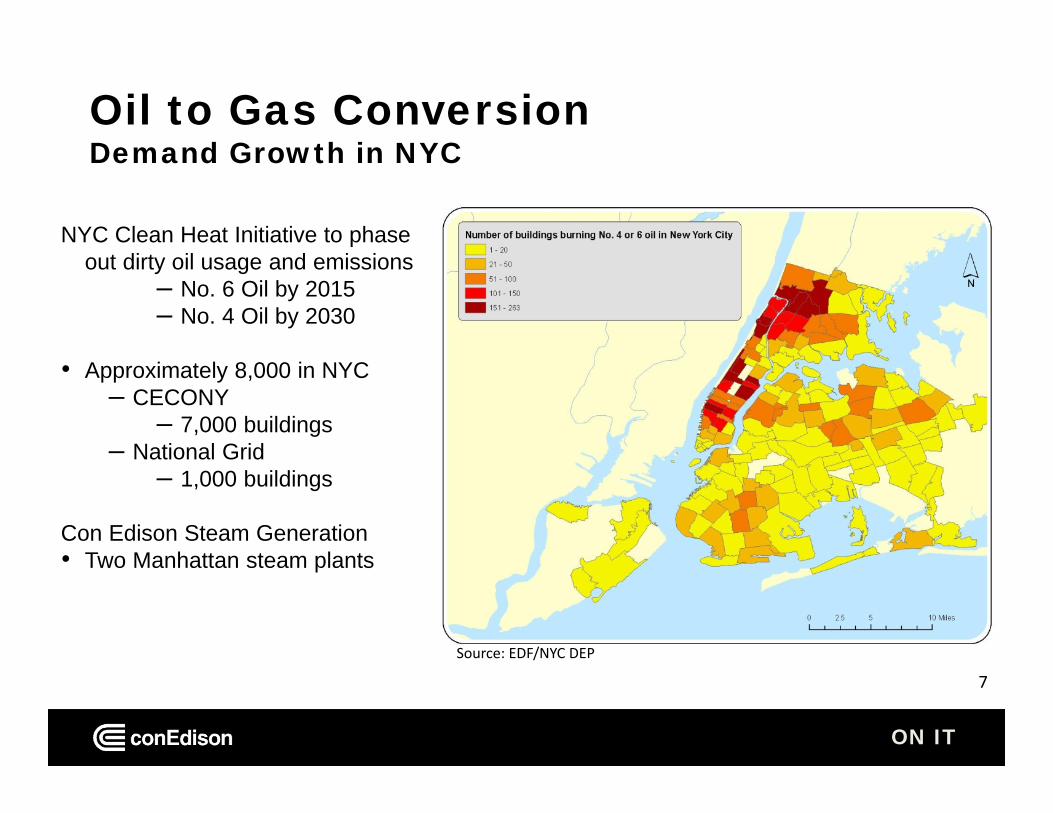
Oil to Gas Conversion Demand Growth in NYC
7
NYC Clean Heat Initiative to phase out dirty oil usage and emissions
– No. 6 Oil by 2015– No. 4 Oil by 2030
• Approximately 8,000 in NYC– CECONY
– 7,000 buildings– National Grid
– 1,000 buildings
Con Edison Steam Generation • Two Manhattan steam plants
Source: EDF/NYC DEP
ON IT
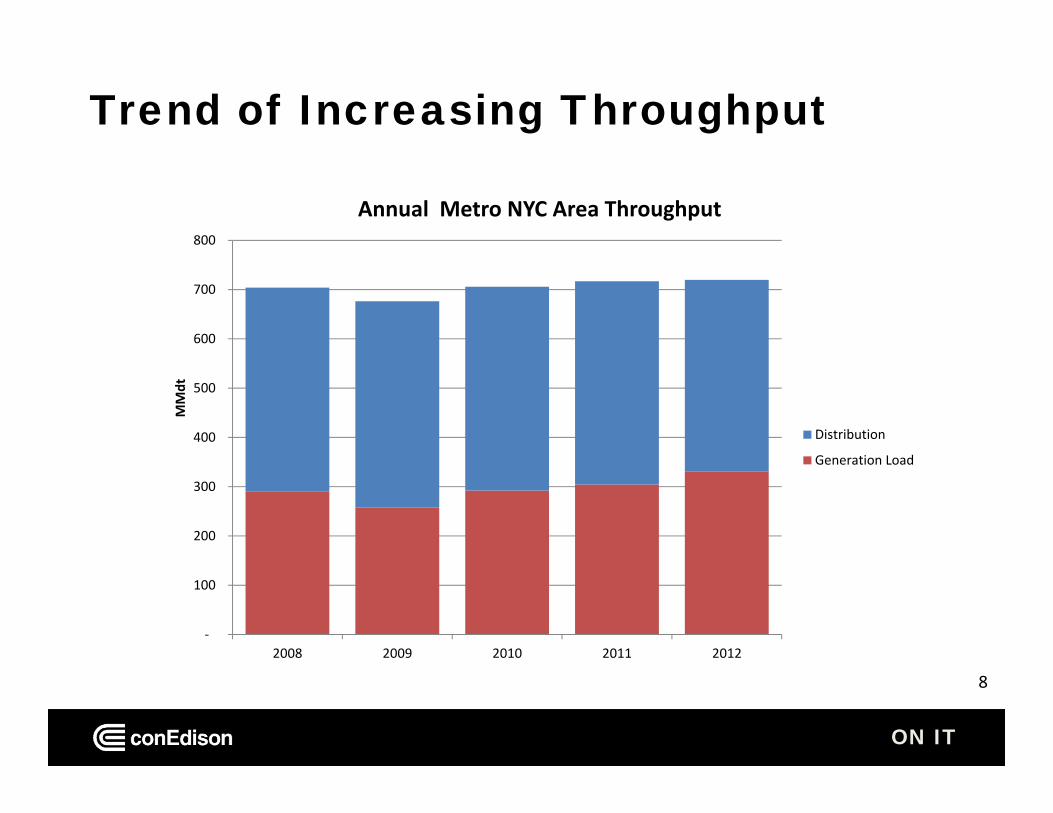
Trend of Increasing Throughput
8
‐
100
200
300
400
500
600
700
800
2008 2009 2010 2011 2012
MMdt
Annual Metro NYC Area Throughput
Distribution
Generation Load

ON IT
New pipeline infrastructure Required to meet reliability and demand growth
• Over 50% of the gas delivered to NYC is through existing delivery points in Manhattan
• New and enhanced pipeline connections help to enhance system reliability
• Meets future demand growth• Eliminates capacity constraints into the region • Provides diversity through increased access to multiple supply
sources • Provides increased commodity price competition and reduced
gas price volatility• Reduces air pollutants and greenhouse gases in the region by
bringing cleaner burning fuel supplies that will displace fuel oil9
ON IT
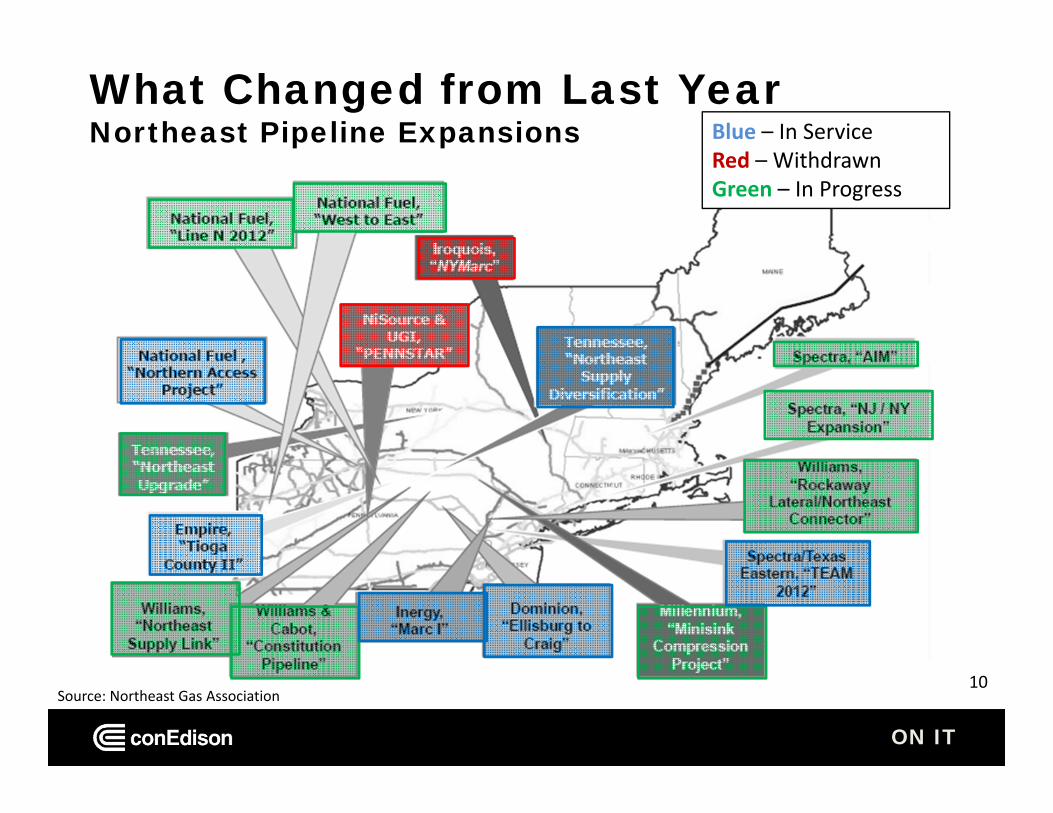
What Changed from Last YearNortheast Pipeline Expansions
10Source: Northeast Gas Association
Blue – In ServiceRed – WithdrawnGreen – In Progress
ON IT
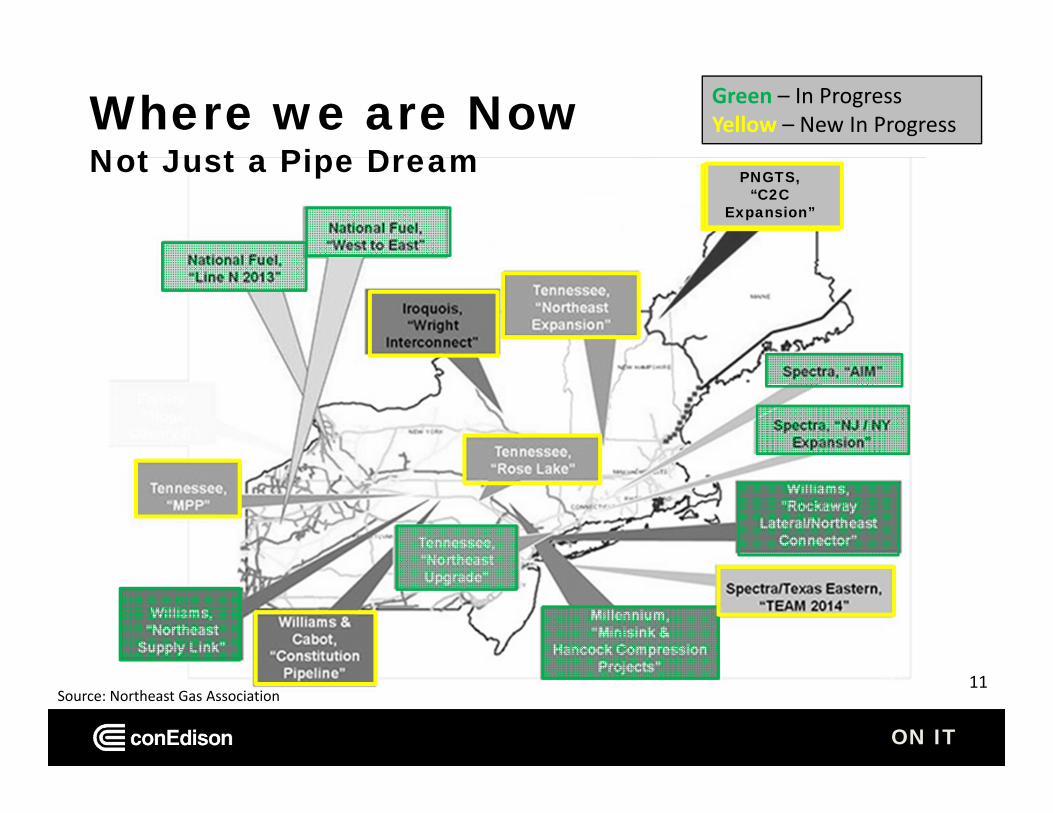
Where we are NowNot Just a Pipe Dream
11
Green – In ProgressYellow – New In Progress
Source: Northeast Gas Association
PNGTS,“C2C
Expansion”
ON IT
12
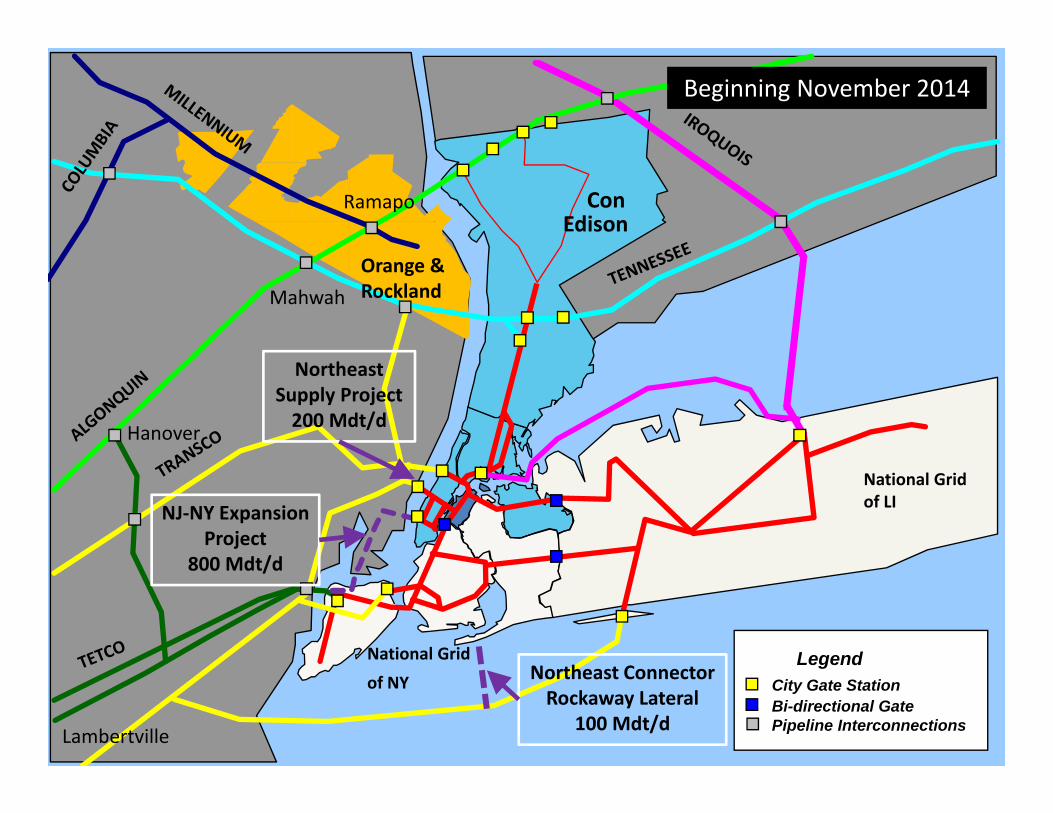
National Gridof LI
ConEdison
National Gridof NY
Orange &Rockland
LegendCity Gate StationBi-directional GatePipeline Interconnections
Northeast Supply Project200 Mdt/d
NJ‐NY Expansion Project
800 Mdt/d
Ramapo
Mahwah
Hanover
Lambertville
Beginning November 2013
Northeast Connector Rockaway Lateral
100 Mdt/d
Beginning November 2014

ON IT
QUESTIONS?
13


