46
Petroleum Production Engineering PROF. M. J. ECONOMIDES Natural Gas Flare-Ups: Present & Future Michael J. Economides ©2010
Petroleum Production Engineering PROF. M. J. ECONOMIDES
Natural Gas
Flare-Ups:
Present & Future
Michael J.
Economides
©2010
NATURAL GAS PROF. M. J. ECONOMIDES
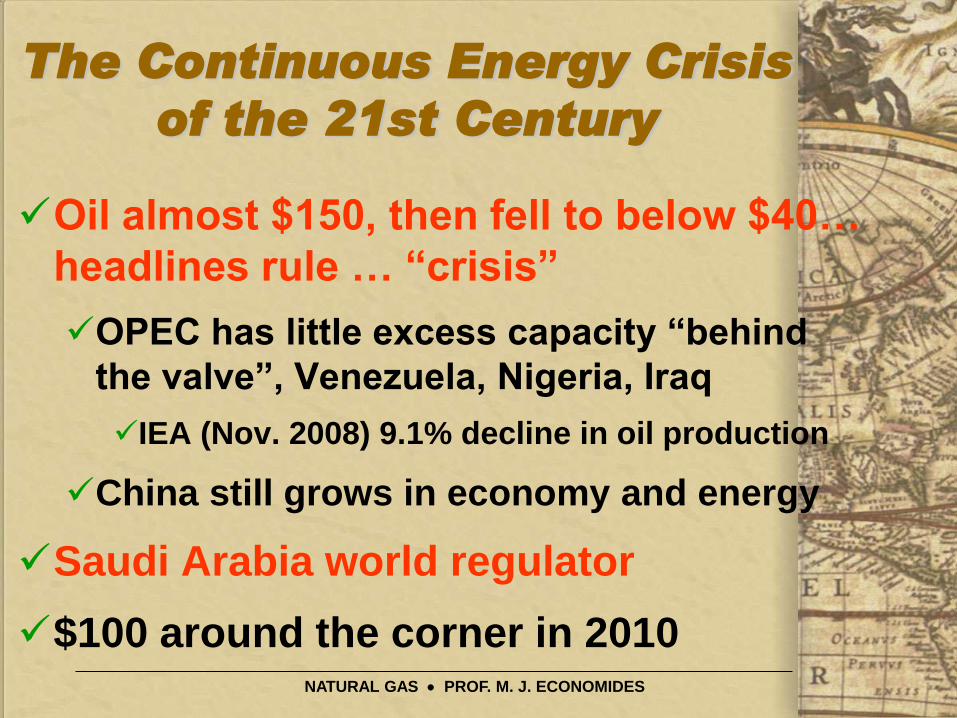
The Continuous Energy Crisis
of the 21st Century
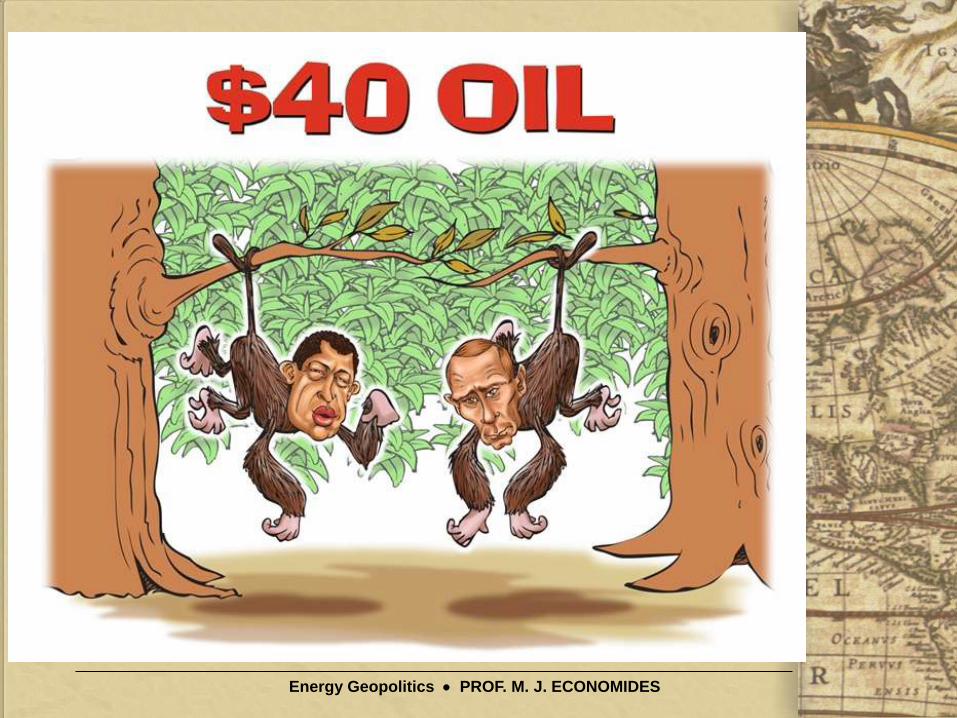
Oil almost $150, then fell to below $40…
headlines rule … “crisis”
OPEC has little excess capacity “behind
the valve”, Venezuela, Nigeria, Iraq
IEA (Nov. 2008) 9.1% decline in oil production
China still grows in economy and energy
Saudi Arabia world regulator
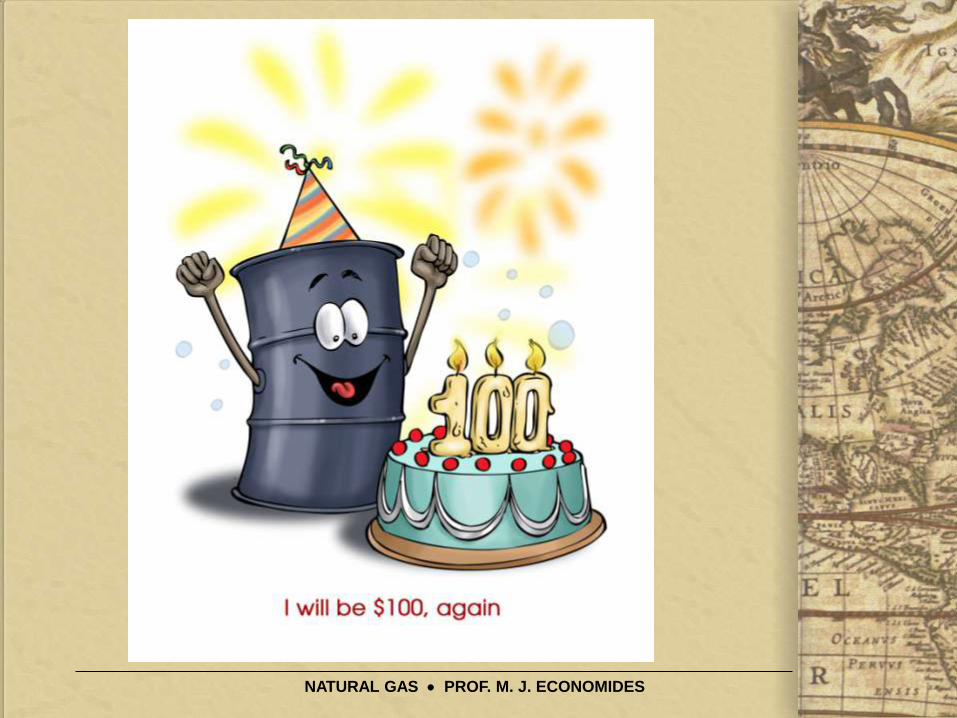
$100 around the corner in 2010
NATURAL GAS PROF. M. J. ECONOMIDES
Energy Geopolitics PROF. M. J. ECONOMIDES
Energy Geopolitics PROF. M. J. ECONOMIDES
0.0
0.5
1.0
1.5
2.0
2.5
3.0
80 90 00 10 20 30
0
10
20
30
40
50
60
80 90 00 10 20 30
0
50
100
150
200
250
300
350
400
80 90 00 10 20 30
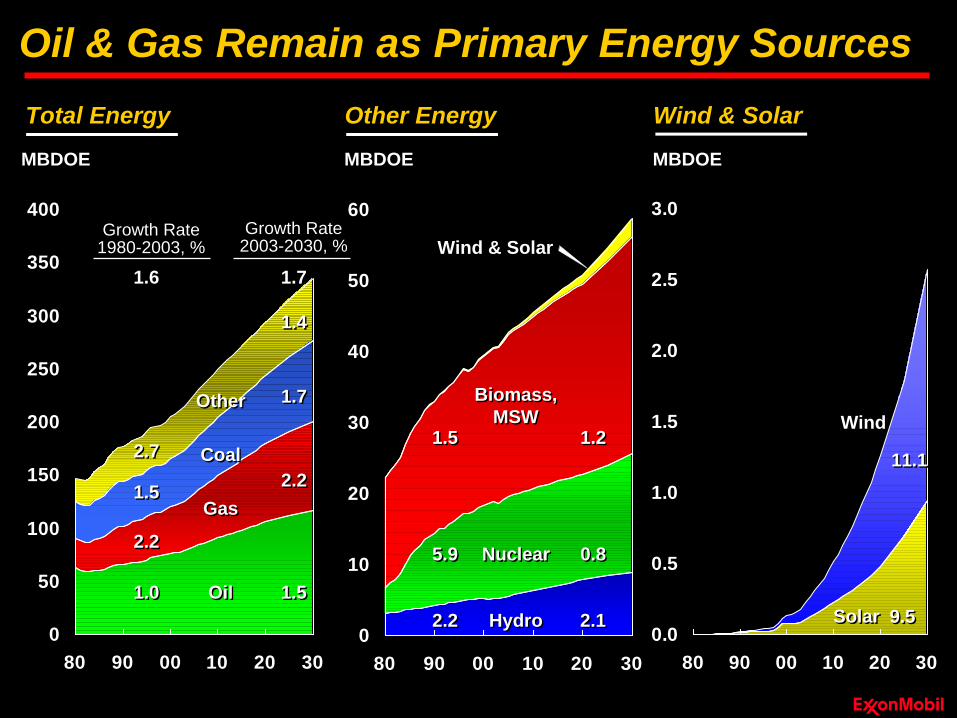
1.71.7
1.41.4
2.22.2
1.51.5
1.21.2
0.80.8
2.12.1 9.59.5
1.51.5
2.72.7
2.22.2
1.01.0
1.51.5
5.95.9
2.22.2
Total Energy Other Energy Wind & Solar
HydroHydro
NuclearNuclear
Biomass,
MSW
Biomass,
MSW
Wind & Solar
OilOil
GasGas
CoalCoal
OtherOther
Growth Rate2003-2030, %
SolarSolar
Wind
MBDOE MBDOE MBDOE
Growth Rate1980-2003, %
1.6 1.7
11.111.1
Oil & Gas Remain as Primary Energy Sources

Energy Geopolitics PROF. M. J. ECONOMIDES
Energy Geopolitics PROF. M. J. ECONOMIDES
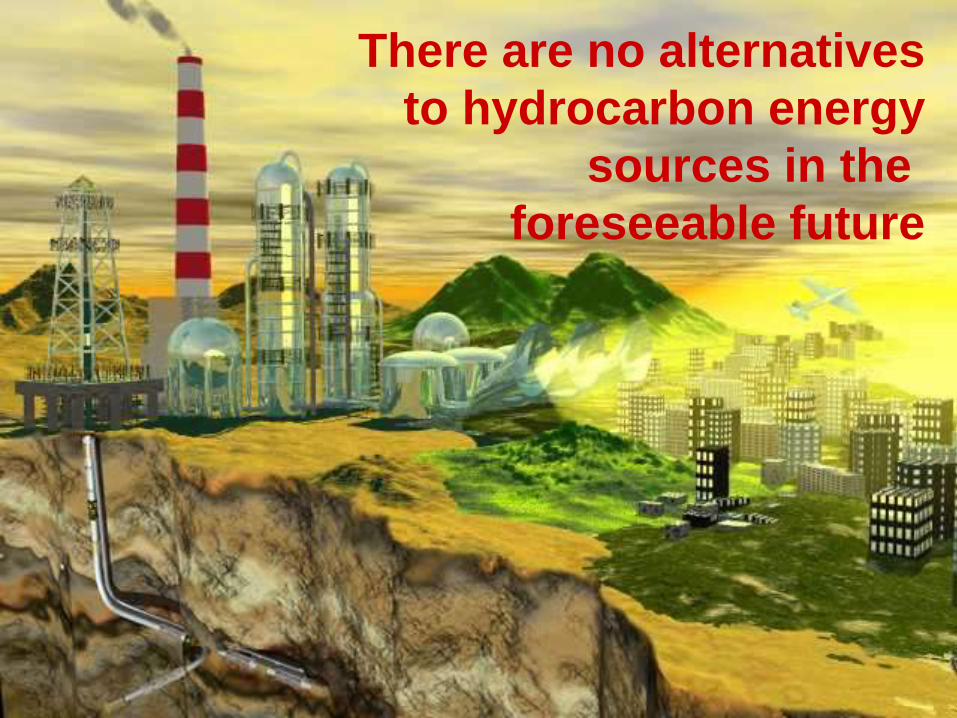
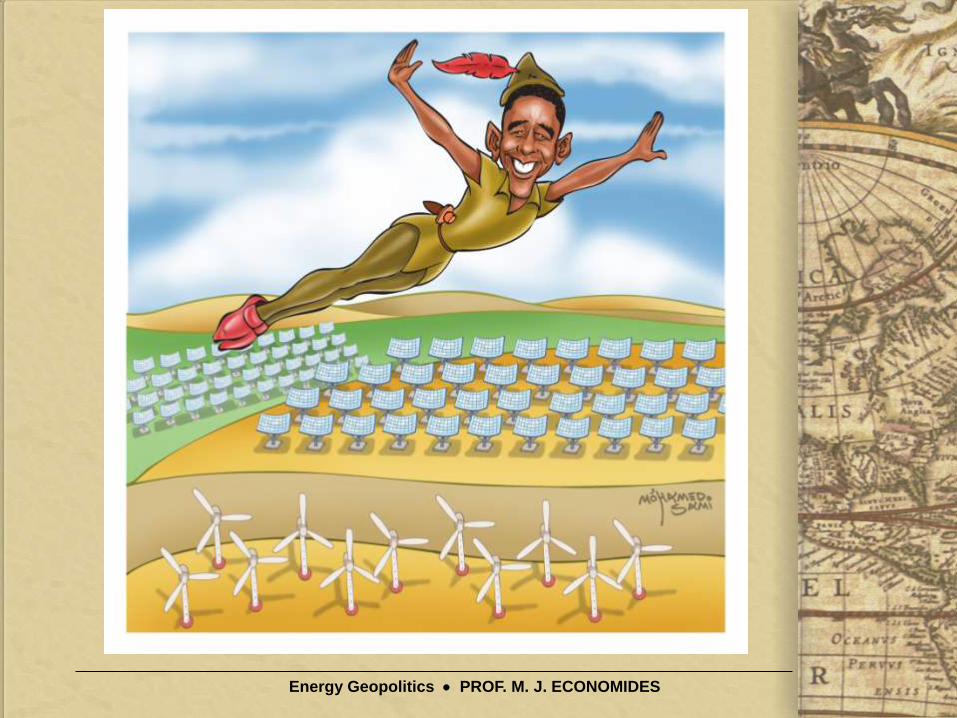
There are no alternatives
to hydrocarbon energy
sources in the
foreseeable future

Energy Geopolitics PROF. M. J. ECONOMIDES
````````

Energy Geopolitics PROF. M. J. ECONOMIDES
Golfing for Hydrogen
Energy Geopolitics PROF. M. J. ECONOMIDES
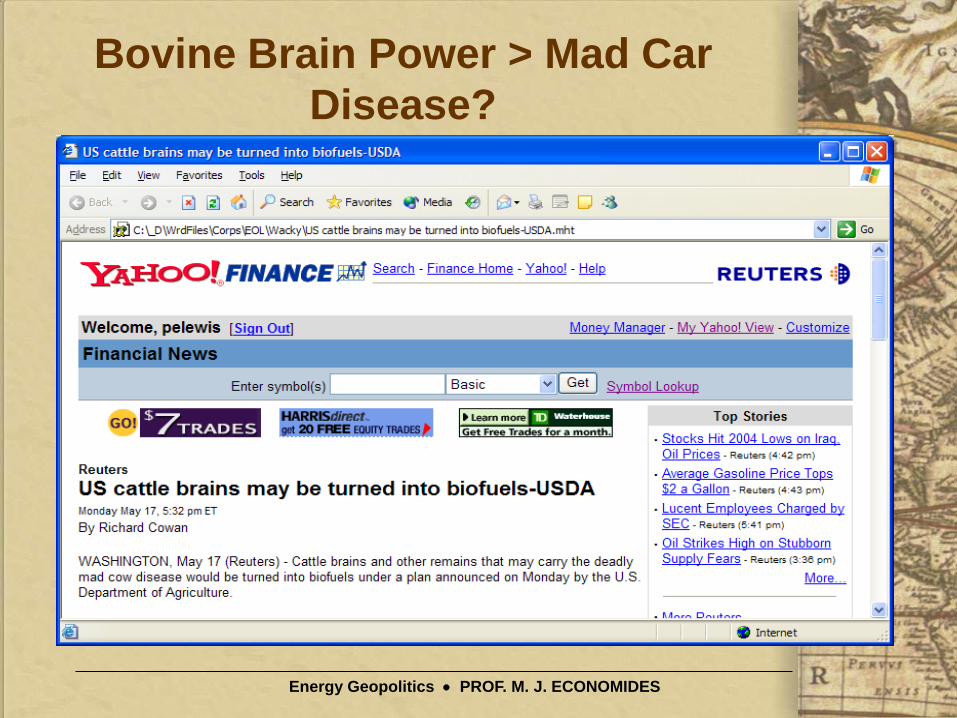
Bovine Brain Power > Mad Car
Disease?
Energy Geopolitics PROF. M. J. ECONOMIDES

Energy Geopolitics PROF. M. J. ECONOMIDES
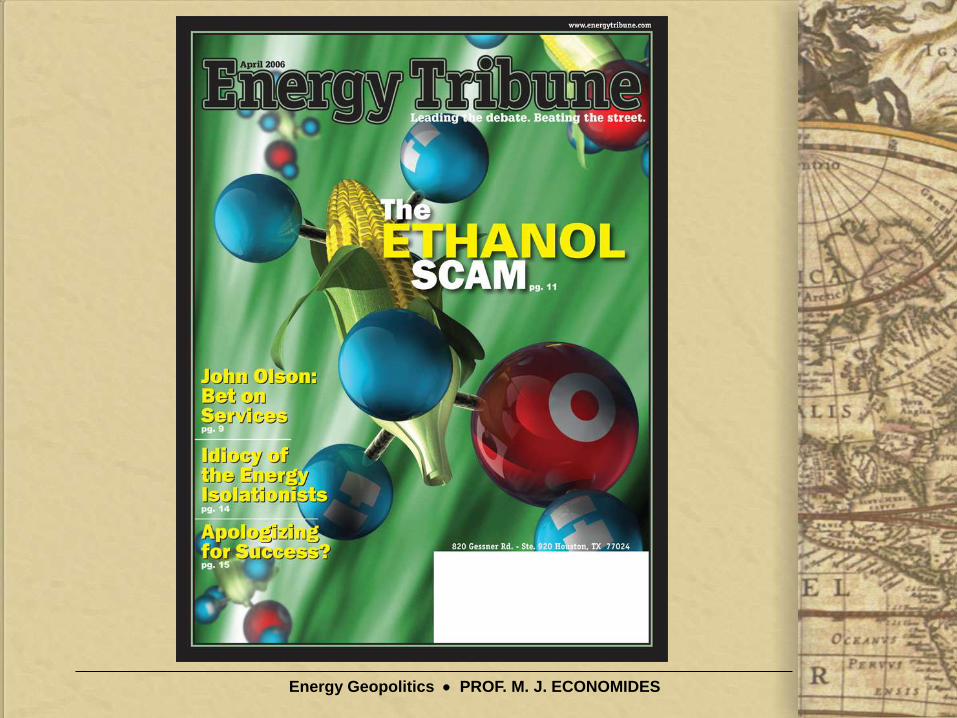
The Ethanol Scam
Energy Geopolitics PROF. M. J. ECONOMIDES
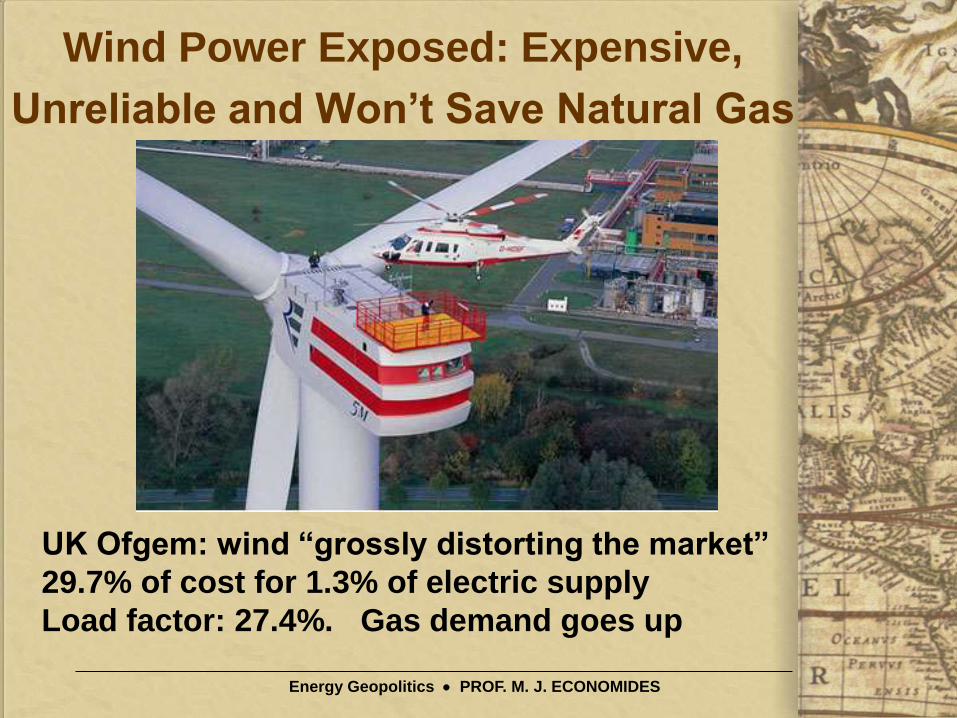
Wind Power Exposed: Expensive,
Unreliable and Won’t Save Natural Gas
UK Ofgem: wind “grossly distorting the market”
29.7% of cost for 1.3% of electric supply
Load factor: 27.4%. Gas demand goes up
Energy Geopolitics PROF. M. J. ECONOMIDES
Texas Wind
Installed capacity: 9,400 MW, #1 in the
United States
On February 2, 2010 at 9:50 AM, total
wind output was 527 MW
About 5.6 % of installed capacity (Clifton Andrews, Houston Chronicle, Feb. 7, 2010)

Energy Geopolitics PROF. M. J. ECONOMIDES
The New Energy Economy
• Wood (1800s)
• Coal
• Oil
• Natural Gas
• Hydrogen (envisioned)
Increasingly:
• Clean
• Energy intensive
• Technologically
sophisticated
• Distributed
Carbon
content:
High
Medium
Low
(Zero)
NATURAL GAS PROF. M. J. ECONOMIDES
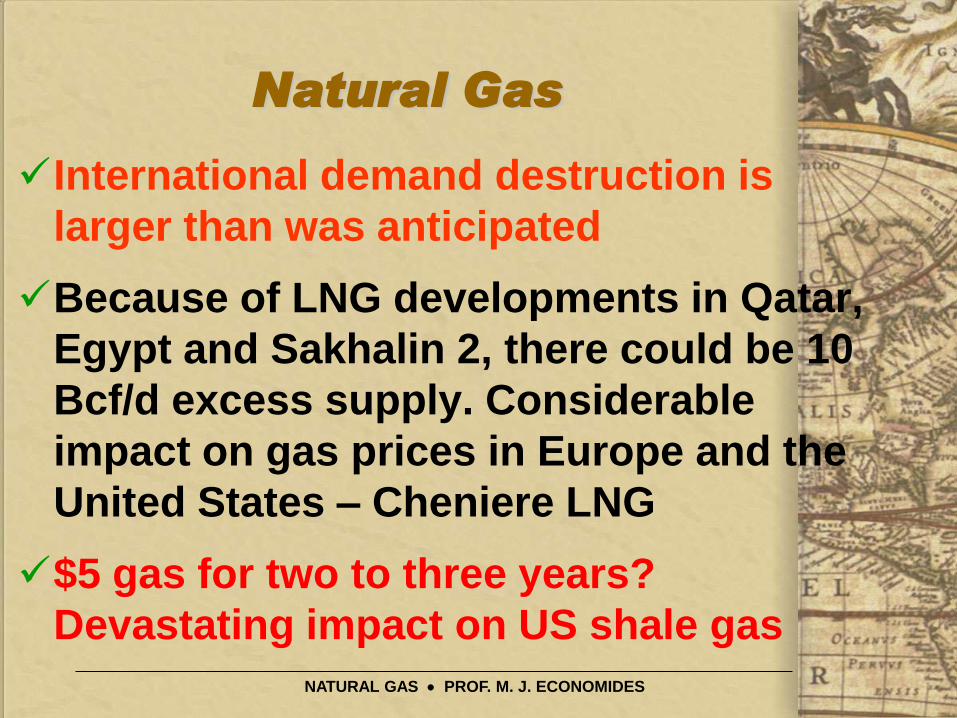
Natural Gas
International demand destruction is
larger than was anticipated
Because of LNG developments in Qatar,
Egypt and Sakhalin 2, there could be 10
Bcf/d excess supply. Considerable
impact on gas prices in Europe and the
United States – Cheniere LNG
$5 gas for two to three years?
Devastating impact on US shale gas
NATURAL GAS PROF. M. J. ECONOMIDES
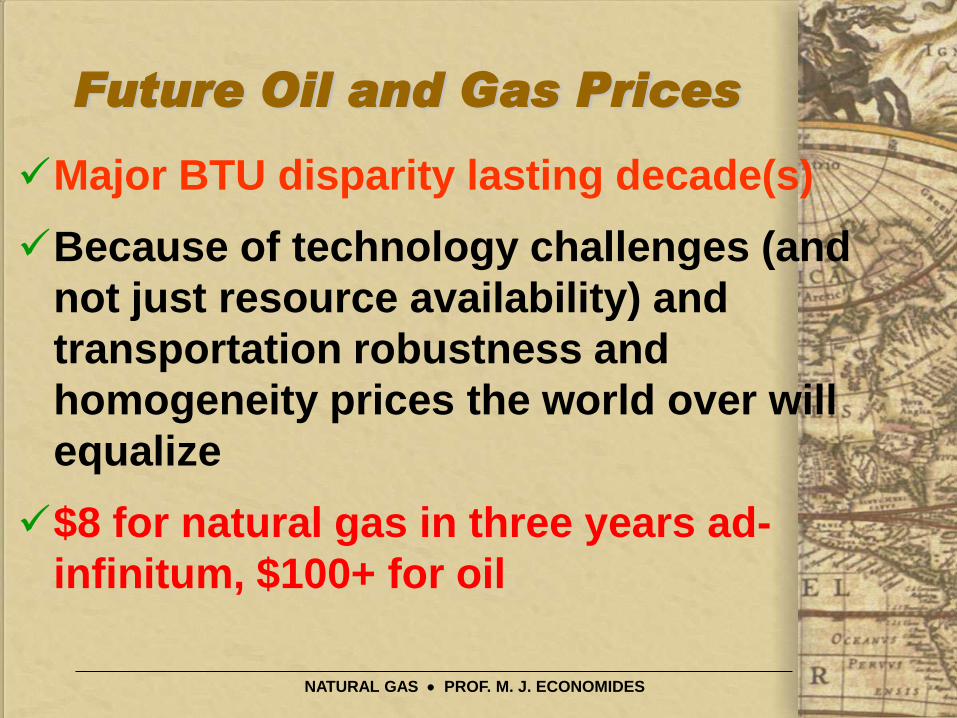
Future Oil and Gas Prices
Major BTU disparity lasting decade(s)
Because of technology challenges (and
not just resource availability) and
transportation robustness and
homogeneity prices the world over will
equalize
$8 for natural gas in three years ad-
infinitum, $100+ for oil
NATURAL GAS PROF. M. J. ECONOMIDES
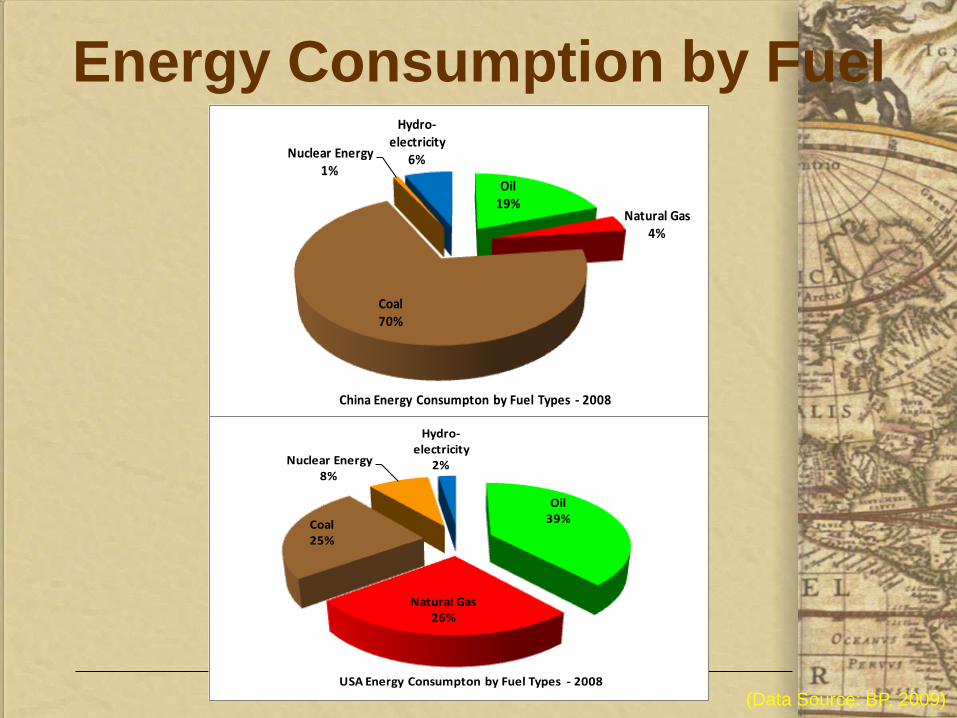
Energy Consumption by Fuel
Oil19%
Natural Gas4%
Coal70%
Nuclear Energy1%
Hydro-electricity
6%
China Energy Consumpton by Fuel Types - 2008
Oil39%
Natural Gas26%
Coal25%
Nuclear Energy8%
Hydro-electricity
2%
USA Energy Consumpton by Fuel Types - 2008
(Data Source: BP, 2009)
NATURAL GAS PROF. M. J. ECONOMIDES
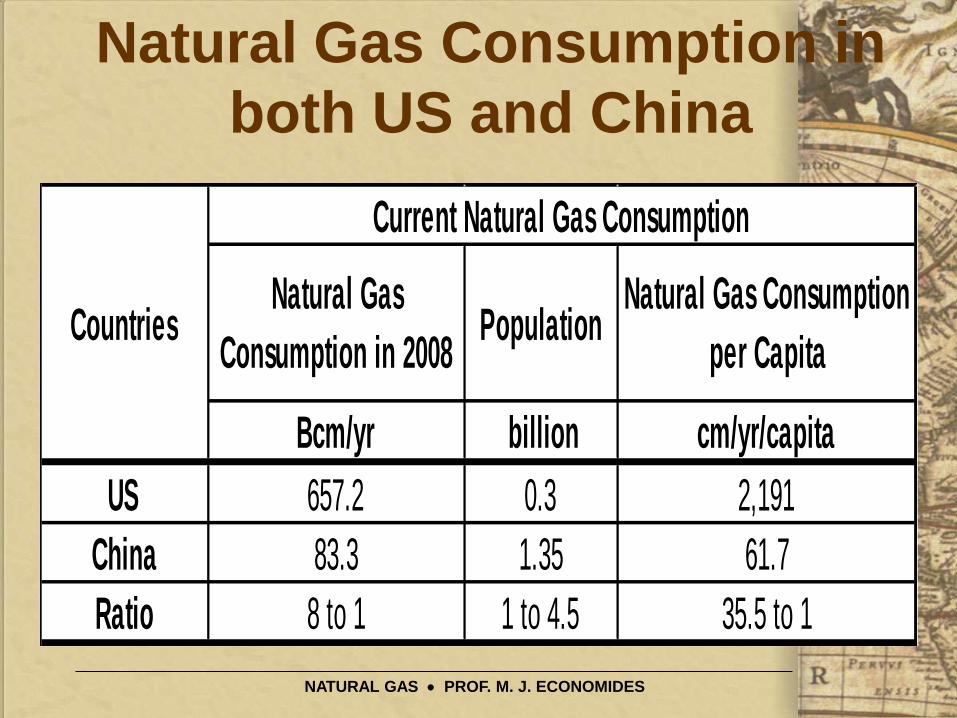
Natural Gas Consumption in
both US and China
Natural Gas
Consumption in 2008Population
Natural Gas Consumption
per Capita
Bcm/yr billion cm/yr/capita
US 657.2 0.3 2,191
China 83.3 1.35 61.7
Ratio 8 to 1 1 to 4.5 35.5 to 1
Current Natural Gas Consumption
Countries
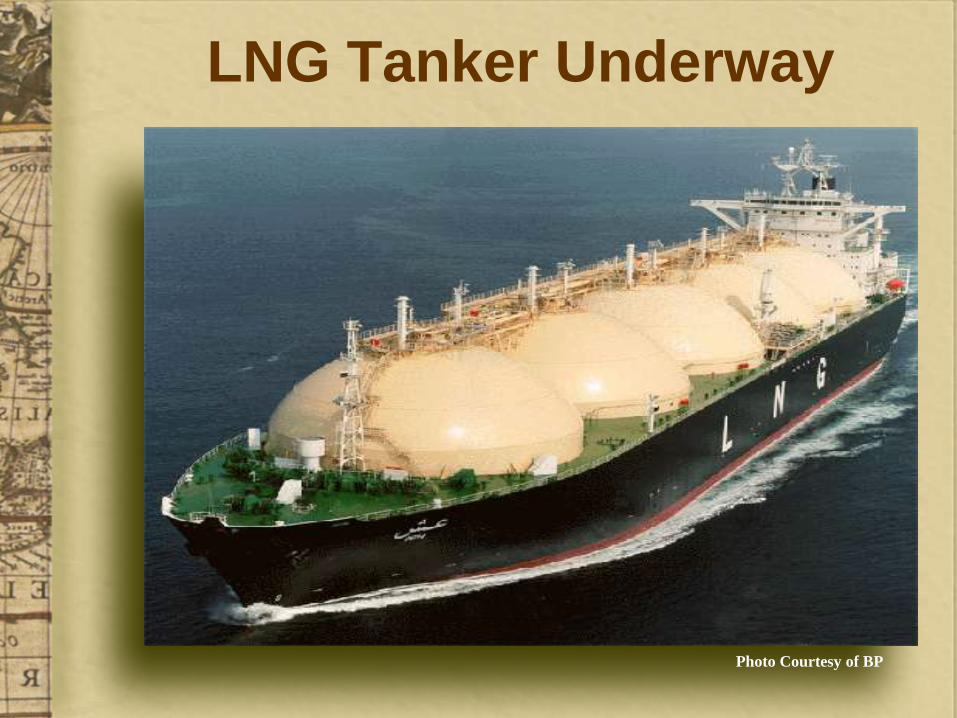
LNG Tanker Underway
Photo Courtesy of BP
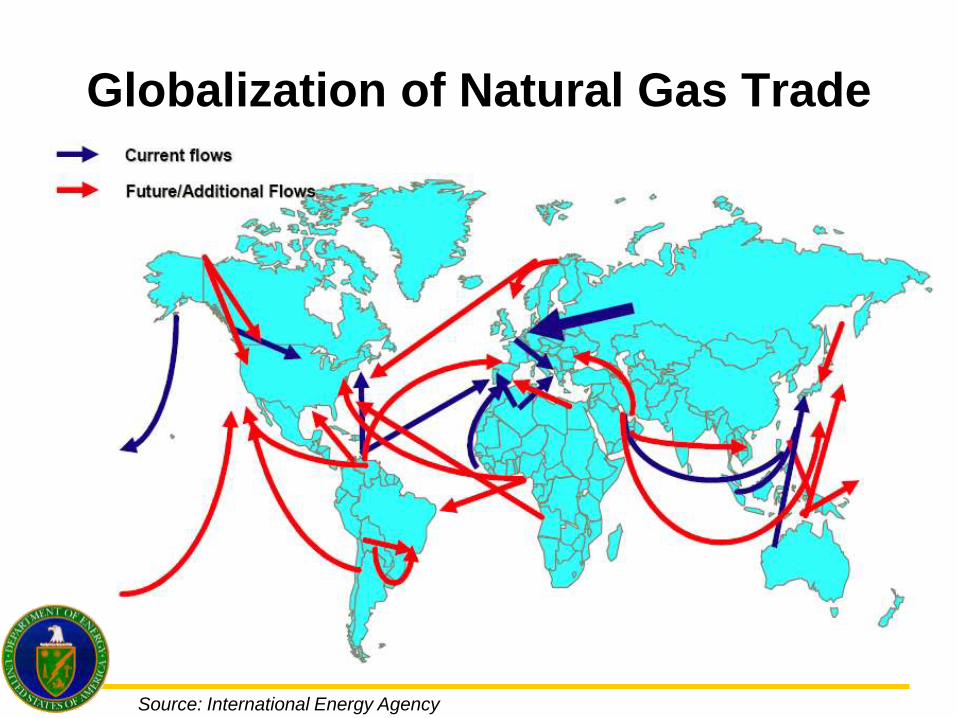
Globalization of Natural Gas Trade
Source: International Energy Agency
NATURAL GAS PROF. M. J. ECONOMIDES
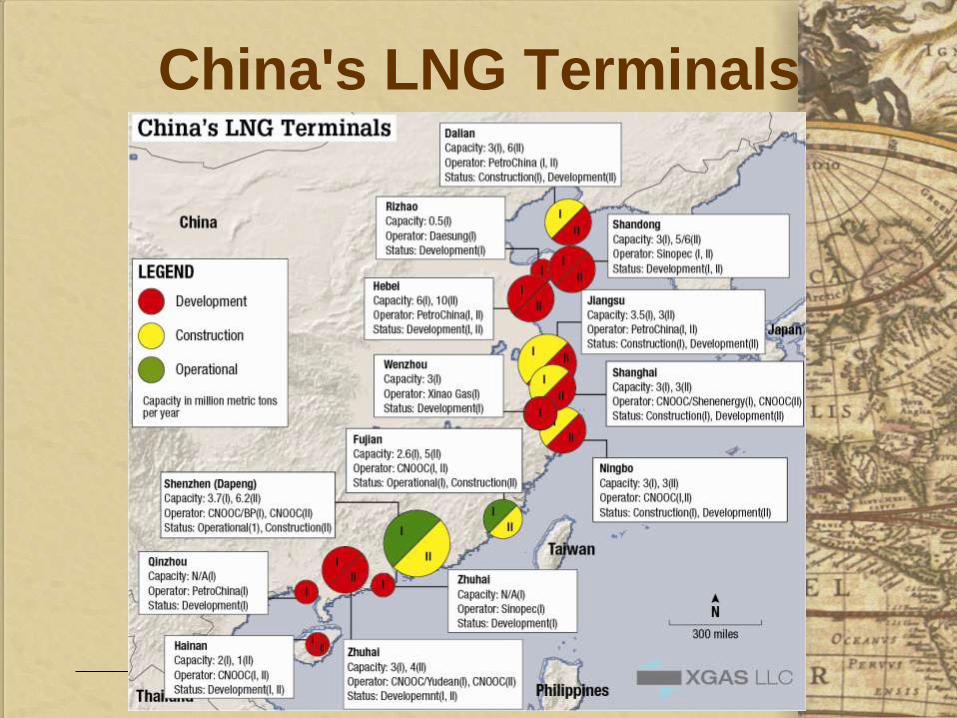
China's LNG Terminals
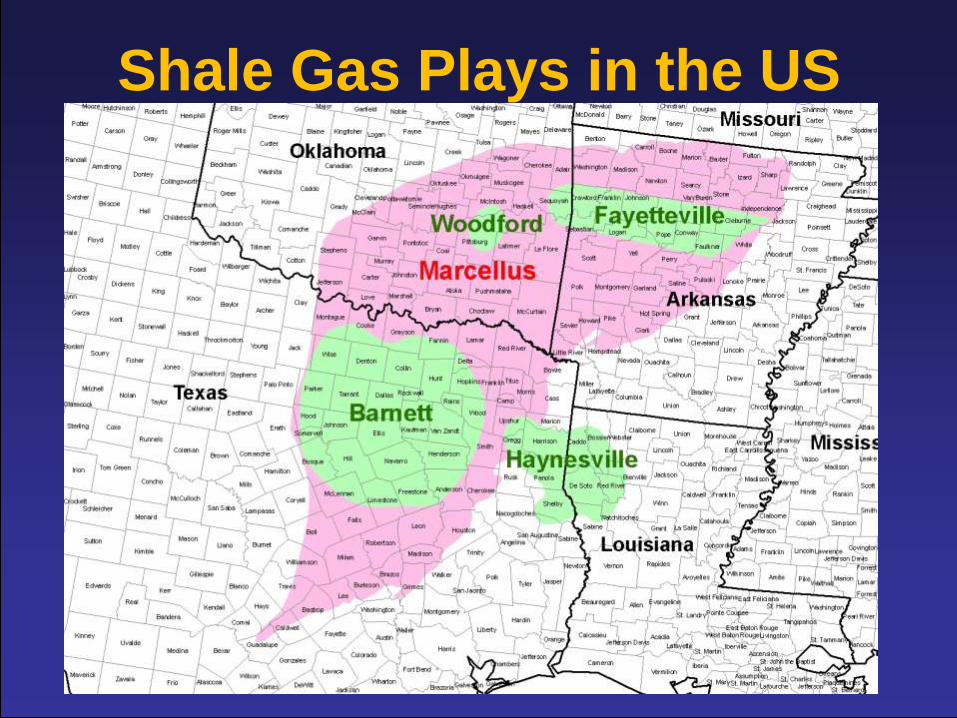
Shale Gas Plays in the US

NATURAL GAS PROF. M. J. ECONOMIDES
What is Shale Gas?
Unconventional
No porosity to speak off…. Essentially
no permeability. Much of the gas is
adsorbed on the rock surface.
Creating massive area by drilling
horizontal wells with multiple
transverse fractures is the obvious way
to produce. No other.
Technology made shale gas a reality.

MARCELLUS
SO HOW BIG IS IT???
Date Agency or Author Recoverable (TCF)
2009 Hiscock & Barclay 516
2008 IOGA of NY 500
2009 Engelder 489
2008 DOE 262
2007 Engelder & Lash 168
2008 NCI 34.2
2006 USGS 31
2002 USGS 0.8 to 30.7
2005 USGS 1.3
Wrightstone 2010
Courtesy Greg Wrightstone, 2010
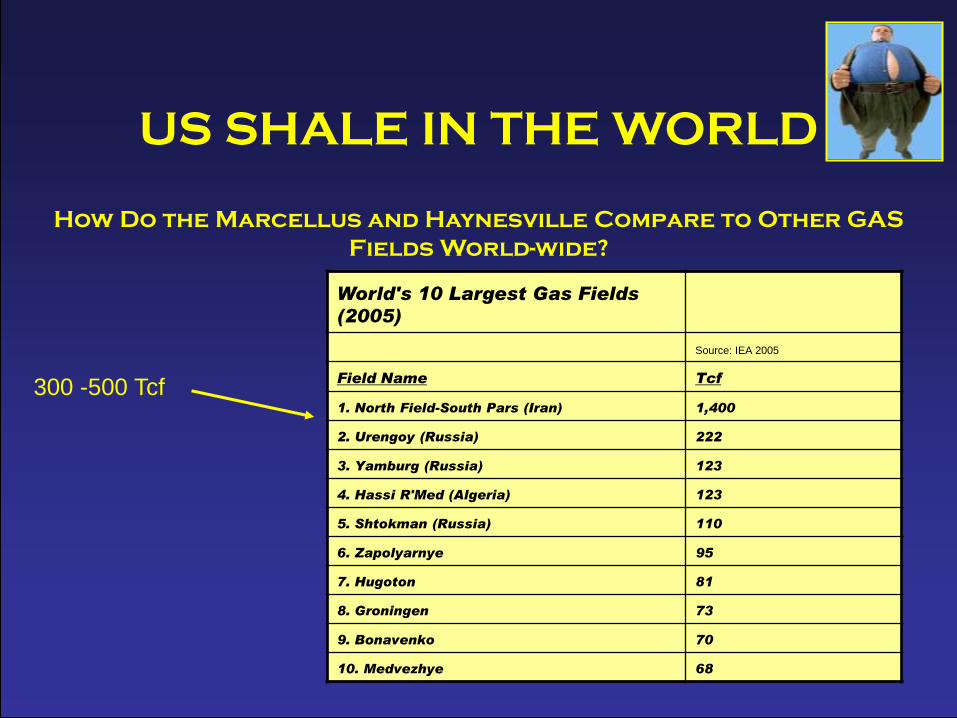
US SHALE IN THE WORLD
How Do the Marcellus and Haynesville Compare to Other GAS
Fields World-wide?
World's 10 Largest Gas Fields
(2005)
Source: IEA 2005
Field Name Tcf
1. North Field-South Pars (Iran) 1,400
2. Urengoy (Russia) 222
3. Yamburg (Russia) 123
4. Hassi R'Med (Algeria) 123
5. Shtokman (Russia) 110
6. Zapolyarnye 95
7. Hugoton 81
8. Groningen 73
9. Bonavenko 70
10. Medvezhye 68
300 -500 Tcf

NATURAL GAS PROF. M. J. ECONOMIDES
Fracturing and Gas Leaking
“A lie repeated many times becomes
reality” (Joseph Goebbels)
Fracturing is nothing new: 60 years old,
about 60,000 treatments per year, $13
billion business
We are worried about fracture height of 100 ft
not 8,000 ft. Impossible for gas to
contaminate drinking water aquifers. It would
have happened long before fracturing
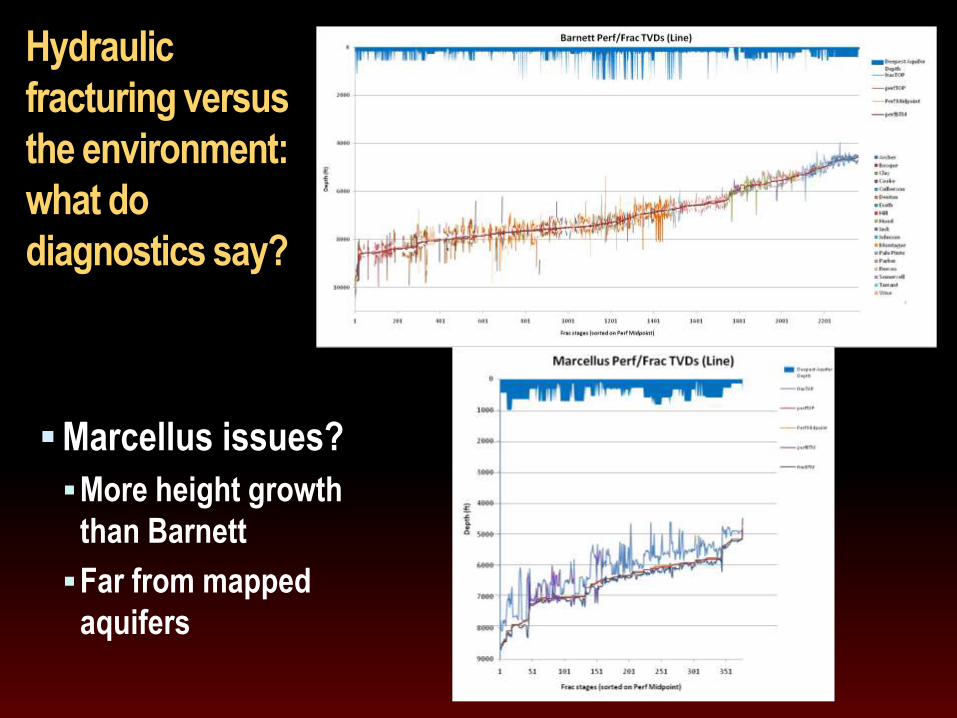
Hydraulic
fracturing versus
the environment:
what do
diagnostics say?
Marcellus issues?
More height growth
than Barnett
Far from mapped
aquifers
NATURAL GAS PROF. M. J. ECONOMIDES
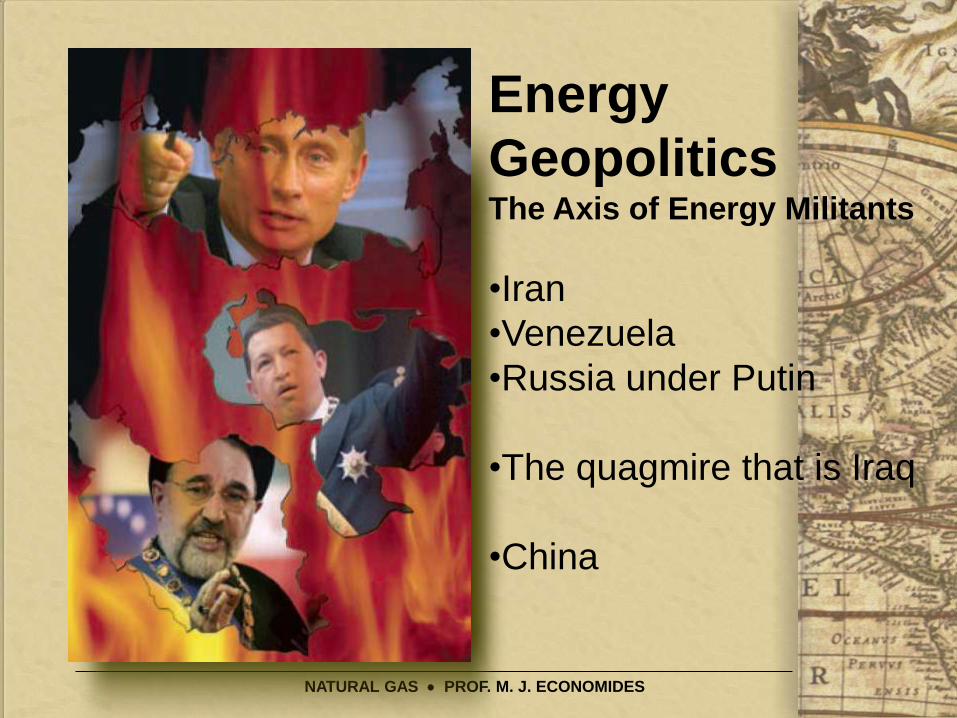
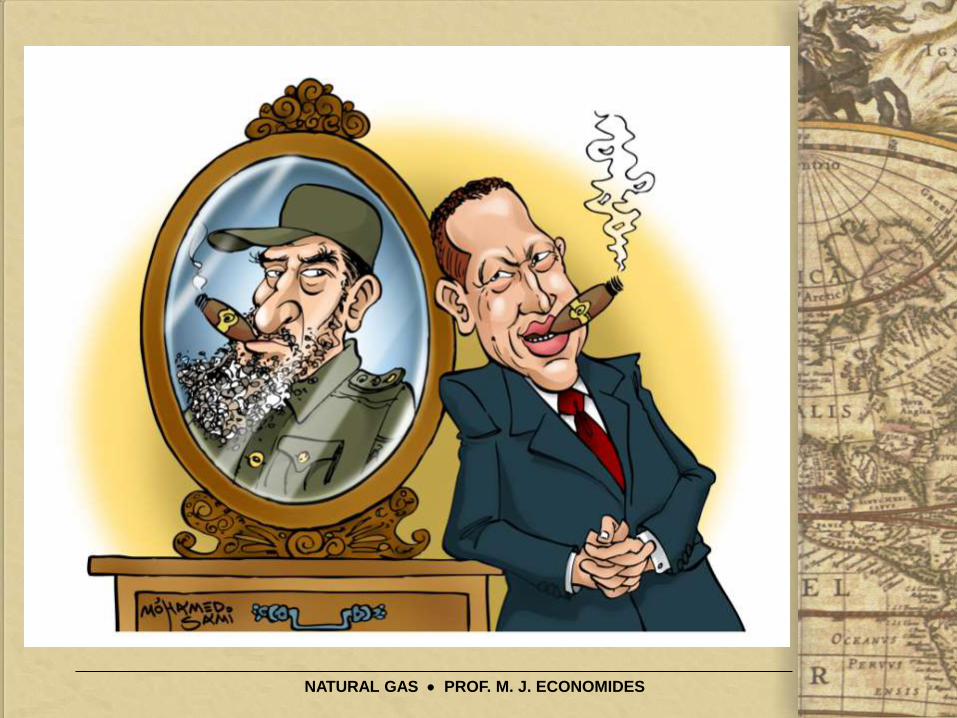
Energy
GeopoliticsThe Axis of Energy Militants
•Iran
•Venezuela
•Russia under Putin
•The quagmire that is Iraq
•China
NATURAL GAS PROF. M. J. ECONOMIDES
NATURAL GAS PROF. M. J. ECONOMIDES

NATURAL GAS PROF. M. J. ECONOMIDES
NATURAL GAS PROF. M. J. ECONOMIDES
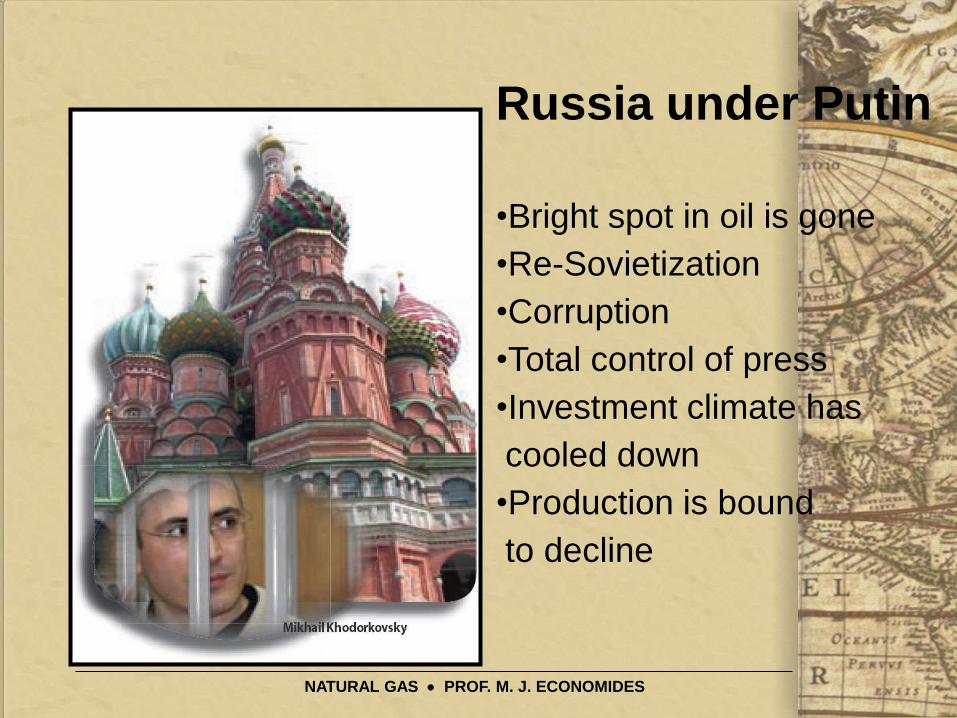
Russia under Putin
•Bright spot in oil is gone
•Re-Sovietization
•Corruption
•Total control of press
•Investment climate has
cooled down
•Production is bound
to decline
NATURAL GAS PROF. M. J. ECONOMIDES
NATURAL GAS PROF. M. J. ECONOMIDES

NATURAL GAS PROF. M. J. ECONOMIDES
ChinaCan
Keep the Lights On?

NATURAL GAS PROF. M. J. ECONOMIDES

NATURAL GAS PROF. M. J. ECONOMIDES
Energy: China’s Choke Point

NATURAL GAS PROF. M. J. ECONOMIDES
0
1
2
3
4
5
6
7
8
1980 1985 1990 1995 2000 2005 2010
Pro
du
cti
on
an
d C
on
su
mp
tio
n (
Millio
n B
arr
els
per
Day)
Year
China's Oil Production and Consumption
Production
Consumption
NATURAL GAS PROF. M. J. ECONOMIDES
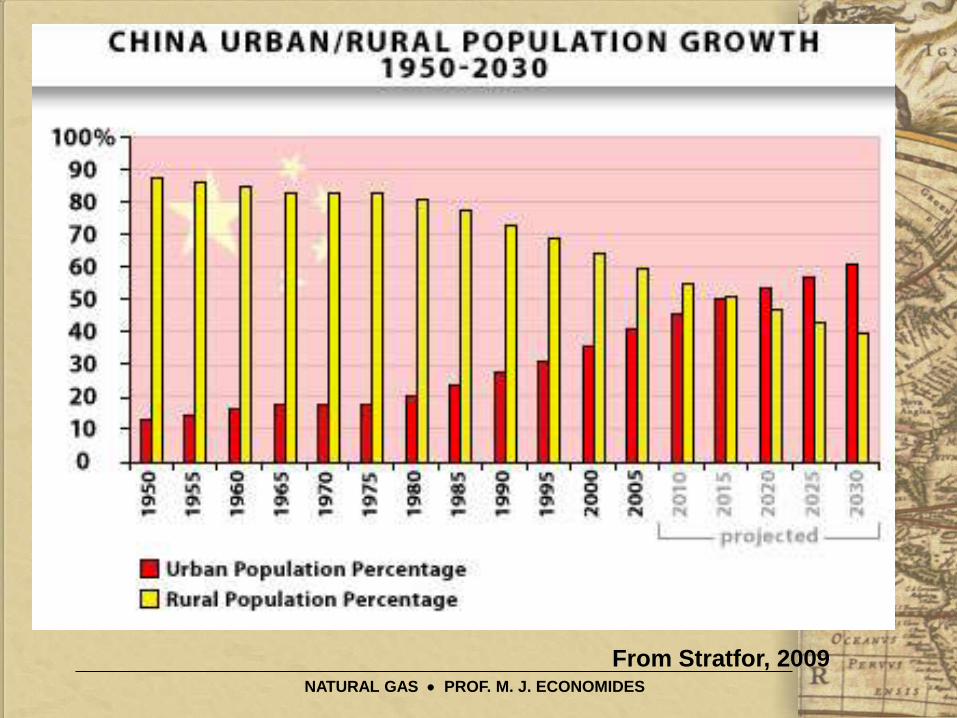
From Stratfor, 2009
NATURAL GAS PROF. M. J. ECONOMIDES
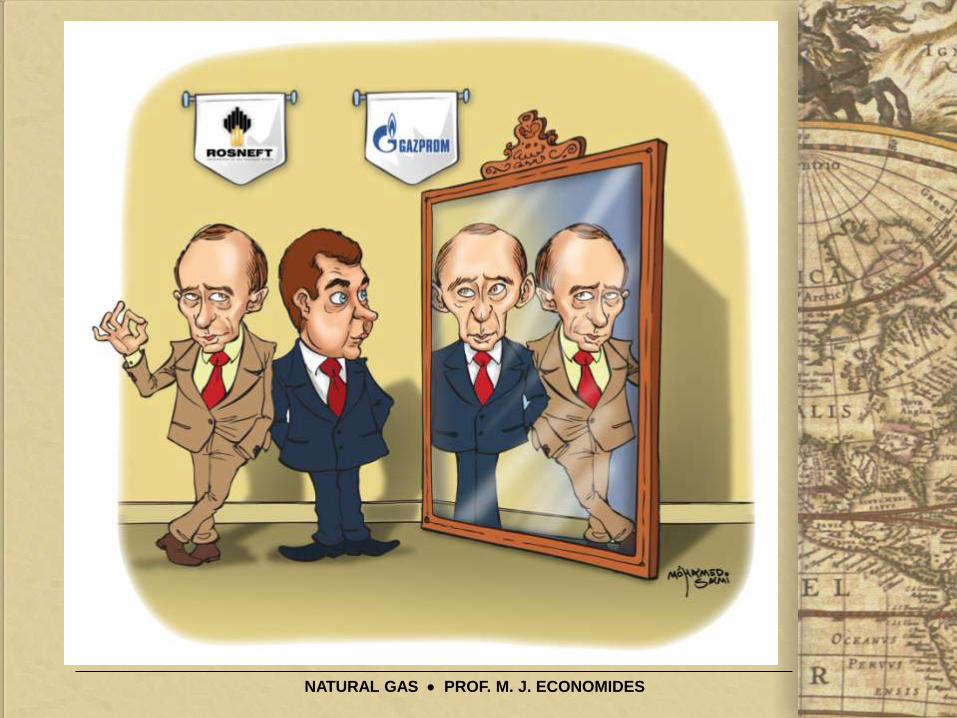
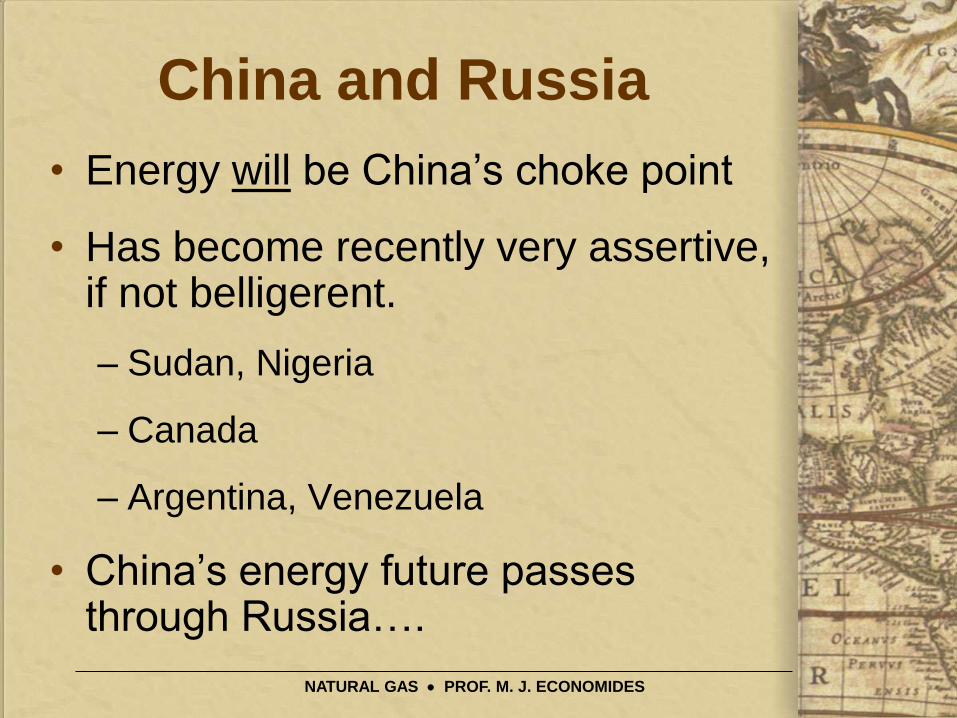
China and Russia
• Energy will be China’s choke point
• Has become recently very assertive, if not belligerent.
– Sudan, Nigeria
– Canada
– Argentina, Venezuela
• China’s energy future passes through Russia….
NATURAL GAS PROF. M. J. ECONOMIDES
Russia and China
NATURAL GAS PROF. M. J. ECONOMIDES
Russia, China and Japan
NATURAL GAS PROF. M. J. ECONOMIDES
China will probably lead


![[Economides] the Economics of Networks](https://static.documents.pub/doc/80x56/577cba421a28aba7118d9db4/economides-the-economics-of-networks.jpg)


