25
Natural Gas Markets: What Next? Ted Lenart AVP Supply Ventures Nicor Gas
| Date post: | 03-Jan-2016 |
| Category: |
Documents |
| Upload: | natalie-mcgee |
| View: | 215 times |
| Download: | 1 times |

Natural Gas Markets:What Next?
Ted LenartAVP Supply Ventures
Nicor Gas
Agenda
Status of Nicor Gas’ Customer Select ProgramCurrent Natural Gas Supply/Demand Forces at
WorkGas-Fired Power Generation

Customer Select
Q: What is Customer Select?
A: A Nicor Gas Program that allows eligible customers - business and residential - the opportunity to choose their natural gas provider

Why is Nicor Gas offering such a program?
Nicor Gas still transports gas / no earnings impact
Nicor Gas supports choice and deregulationCustomers should benefit from competition
(lower prices and new services)

Customer Select
Industrial32%
Residential43%
Commercial25%
2000 Deliveries = 526 Bcf

Customer Select
1984: Very large customers1986: All commercial/industrial customers
eligible1989: Comprehensive unbundling of tariffs1996: Significant tariff changes to further
enhance services1998: Customer Select pilot for
aggregation services
History of Nicor Gas Unbundling
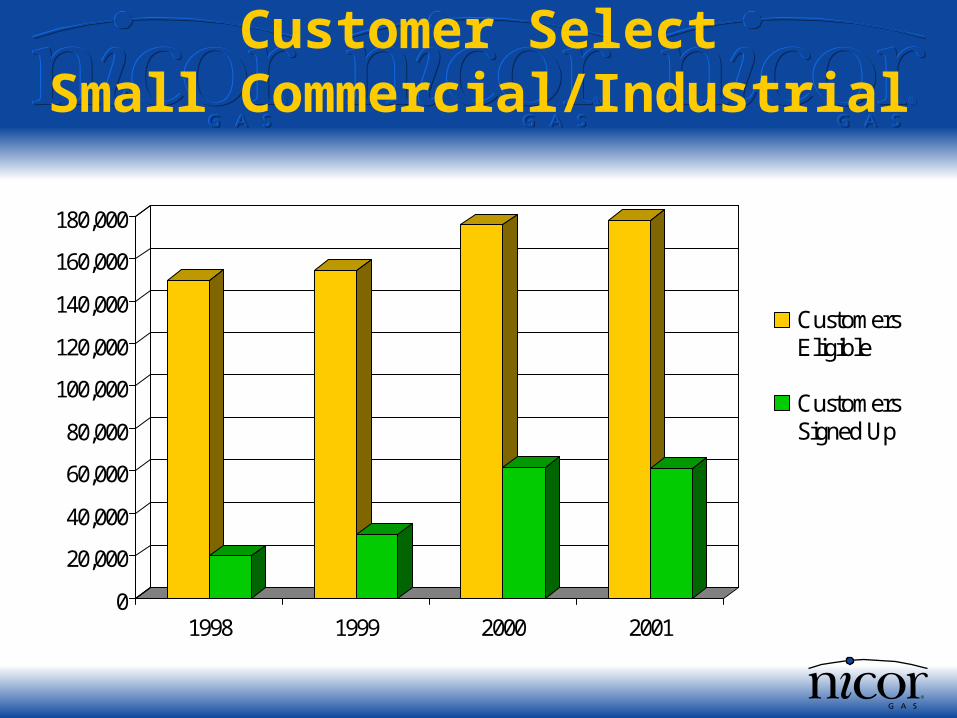
Customer SelectSmall Commercial/Industrial
0
20,000
40,000
60,000
80,000
100,000
120,000
140,000
160,000
180,000
1998 1999 2000 2001
CustomersEligible
CustomersSigned Up
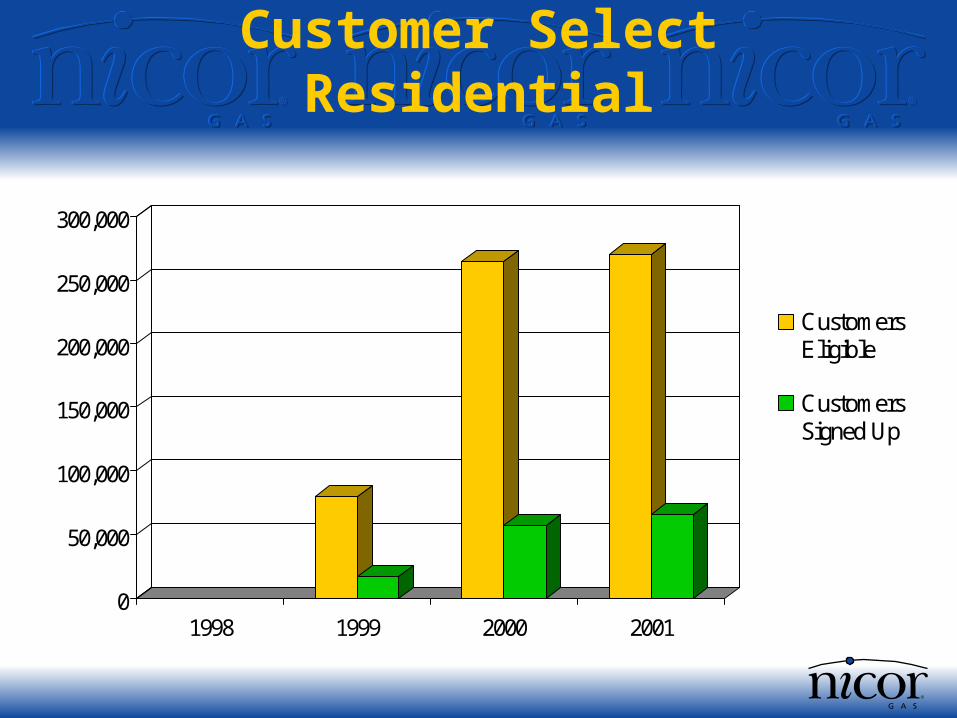
Customer SelectResidential
0
50,000
100,000
150,000
200,000
250,000
300,000
1998 1999 2000 2001
CustomersEligible
CustomersSigned Up
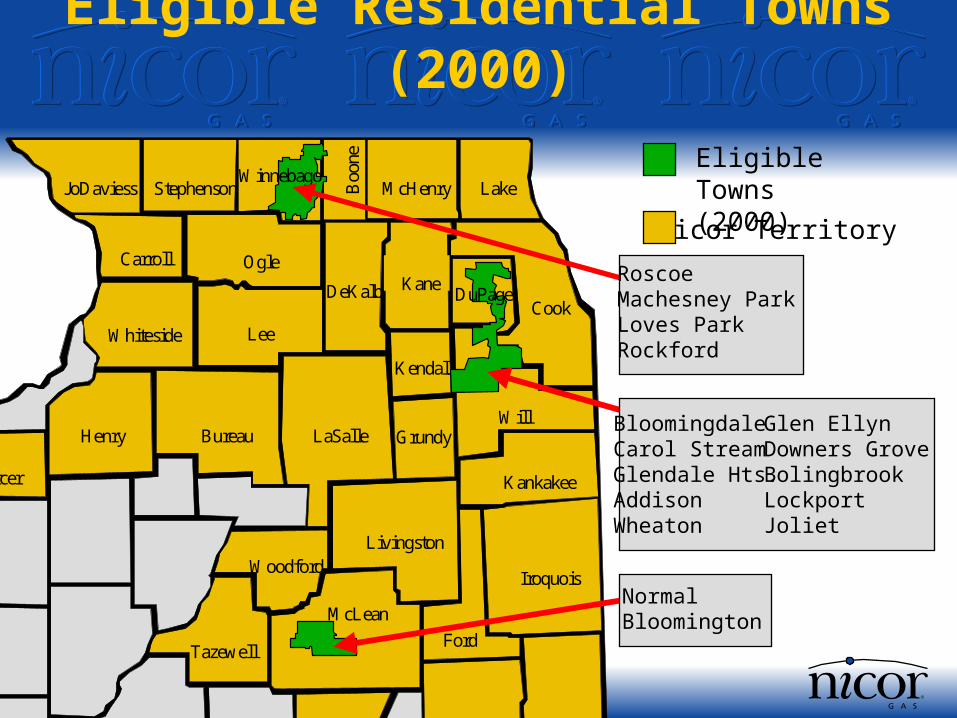
Eligible Residential Towns (2000)
Kane
LakeMcHenryBoo
ne
StephensonJoDaviess
CookDeKalb
Ogle
Lee
Carroll
Whiteside
Henry
Mercer
Bureau LaSalle
Kendall
Grundy
Kankakee
Iroquois
Livingston
Ford
Woodford
Tazewell
Hancock
Adams
Pike
DeWitt ChampaignVermillion
Will
McLean
DuPage
WinnebagoEligible Towns(2000)
Nicor Territory
BloomingdaleCarol StreamGlendale Hts.AddisonWheaton
NormalBloomington
Glen EllynDowners GroveBolingbrookLockportJoliet
RoscoeMachesney ParkLoves ParkRockford
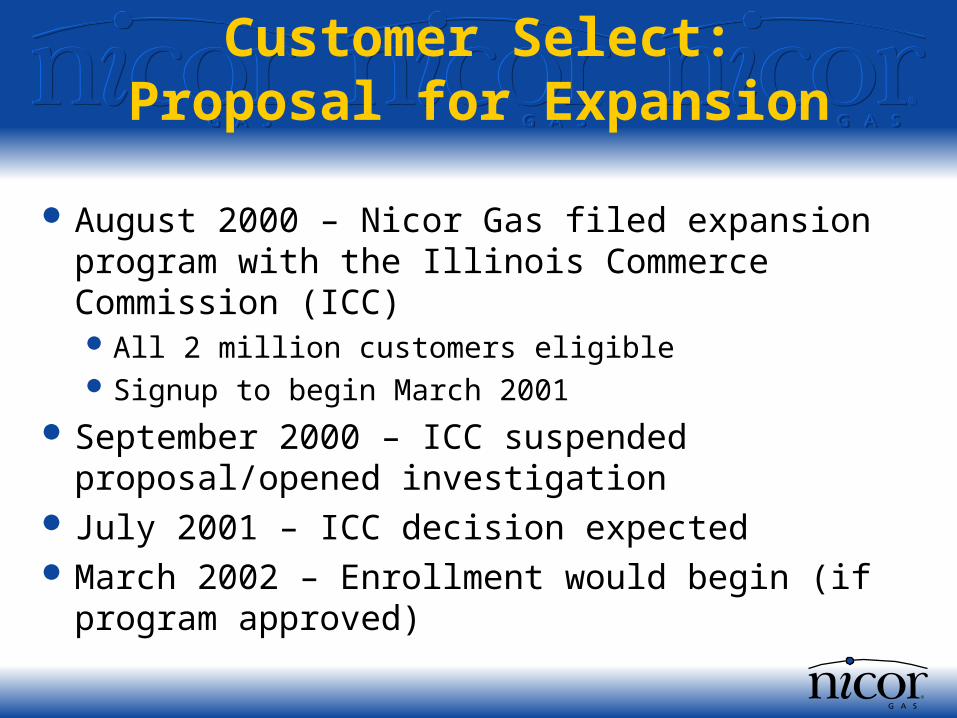
Customer Select:Proposal for Expansion
August 2000 – Nicor Gas filed expansion program with the Illinois Commerce Commission (ICC) All 2 million customers eligible Signup to begin March 2001
September 2000 – ICC suspended proposal/opened investigation
July 2001 – ICC decision expected March 2002 – Enrollment would begin (if program
approved)
Observations
Number of retail marketers has remained relatively stable
No fixed price offerings in 2001Nicor Gas is a leader in retail unbundlingNicor Gas will continue to offer a sales serviceCustomers benefit from choice
Gas Supply/Demand and Midwest Power Generation
Supply/Demand Forces
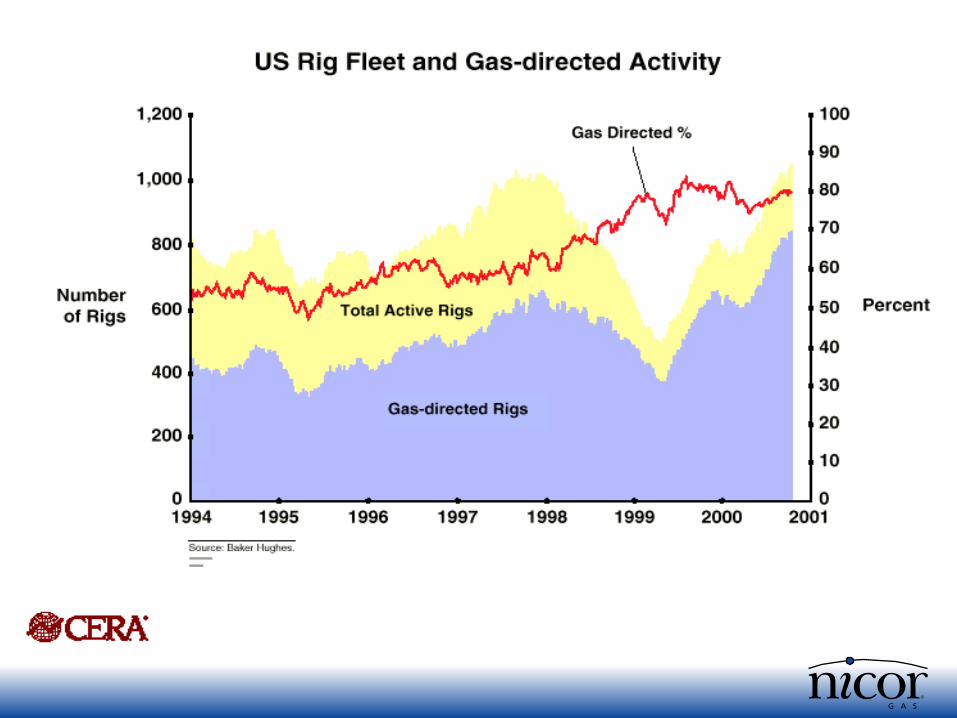
SupplyNatural Gas rig count @ 994 vs. 634 this week last
year2001 Production expected to average 600 MMcf/d
more than last year
Supply/Demand Forces
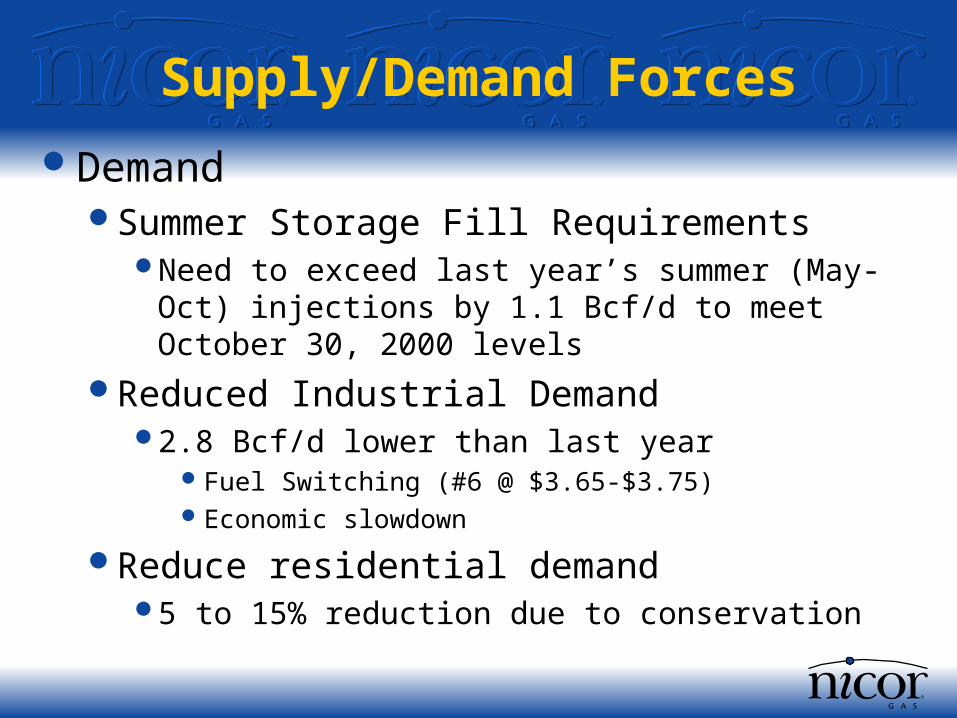
DemandSummer Storage Fill Requirements
Need to exceed last year’s summer (May-Oct) injections by 1.1 Bcf/d to meet October 30, 2000 levels
Reduced Industrial Demand2.8 Bcf/d lower than last year
Fuel Switching (#6 @ $3.65-$3.75)Economic slowdown
Reduce residential demand5 to 15% reduction due to conservation
Supply/Demand ForcesObservations
April 2001 storage injections exceeded April 2000 injections by 7 Bcf/d
Prices have moderated with improving level of storage inventory

North American GenerationProject Status
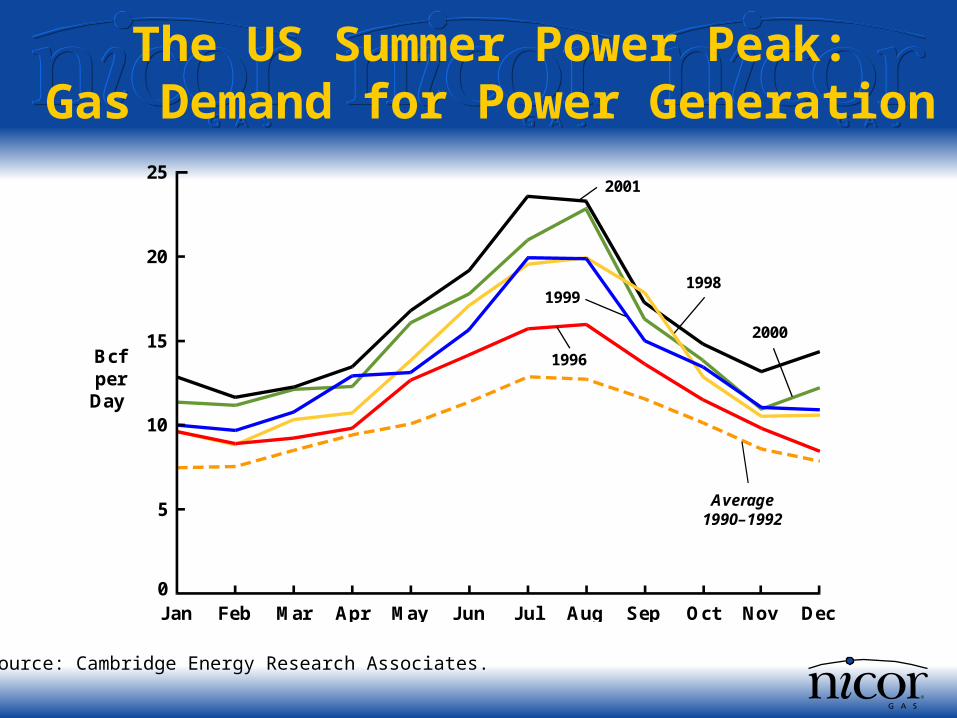
Source: Cambridge Energy Research Associates.
Complete
Under Construction
Proposed100
80
2005
70
60
50
40
30
20
10
0200420032002200120001999
Gigawatts
90
1999
Source: Cambridge Energy Research Associates.
25
Bcfper
Day
DecOctSepAugJulJunMayAprMarFebJan Nov
20
15
10
5
0
Average1990–1992
2000
1998
1996
1999
2001
The US Summer Power Peak:Gas Demand for Power Generation

MWs
Peakers 14,560
CombinedCycle 20,685
Total 35,245
WISCONSIN
MICHIGAN
ILLINOIS
INDIANA
MISSOURI
Peakers6,860 MW
CombinedCycle5,230 MW
Peakers940 MW
CombinedCycle2,650 MW
Peakers3,000 MW
CombinedCycle2,190 MW
Peakers2,220 MW
CombinedCycle5,180 MW
Peakers1,540 MW
CombinedCycle5,435 MW
Gas-Fired PowerGeneration
Midwest Power Plants(Proposed or Under Construction)

3,500
3,000
Nov
MillionCubic
Feetper
Day
Dec
20012000
1999
1998
1995
1990-1992Avg
2,500
2,000
1,500
1,000
500
0OctSepAugJulJunMayAprMarFebJan
Source: Cambridge Energy Research Associates.10310-4
The Growing Surge in Midwestern Summer Power Demand for Gas
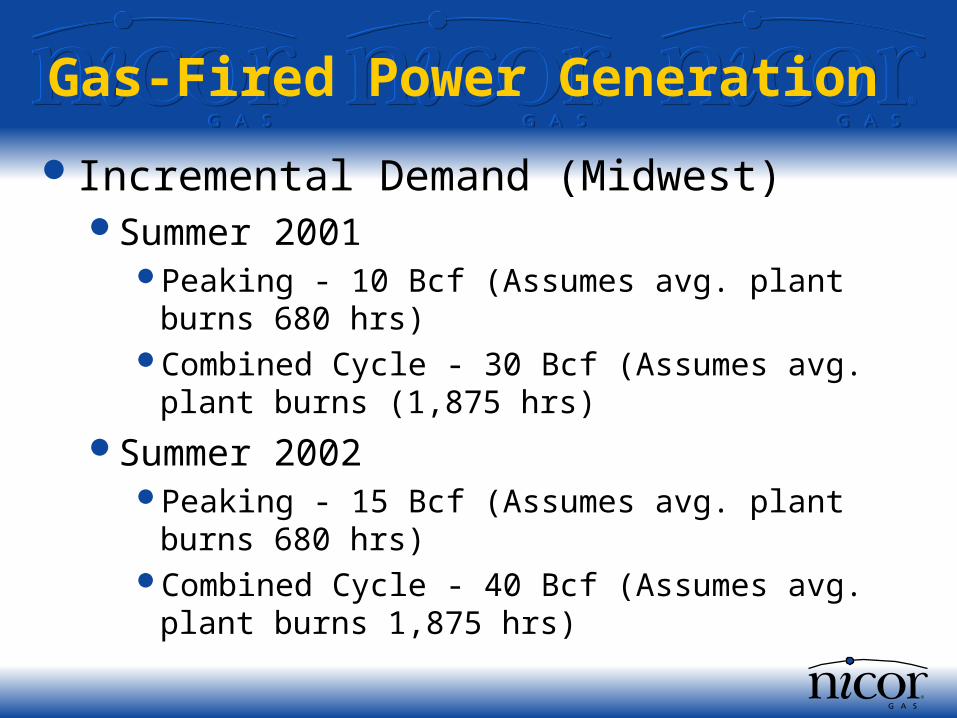
Gas-Fired Power Generation
Incremental Demand (Midwest)Summer 2001
Peaking - 10 Bcf (Assumes avg. plant burns 680 hrs)Combined Cycle - 30 Bcf (Assumes avg. plant burns
(1,875 hrs)
Summer 2002Peaking - 15 Bcf (Assumes avg. plant burns 680 hrs)Combined Cycle - 40 Bcf (Assumes avg. plant burns
1,875 hrs)
Conclusion
Strong early storage refill has improved short-term outlook
Summer power generation demand will slow storage refill rate
Growing natural gas supply is needed to satisfy new power generation demand and to moderate prices in the future


