Major Findings 17 0 1 2 3 4 5 6 7 8 0 200 400 600 800 1,000 1,200 1,400 1,600 1,800 AVRA VALLEY ELOY SANTA ROSA RAINBOW VALLEY GROUND-WATER BASIN SIERRA VISTA MEDIAN SPECIFIC CONDUCTANCE, IN MICROSIEMENS PER CENTIMETER MEDIAN NITRITE PLUS NITRATE, IN MILLIGRAMS PER LITER S a lt No data available Natural Ground-Water Quality It is important to understand how natural processes affect ground-water quality in order to identify the effects of urban and agricultural development under similar hydrogeologic conditions. In the CAZB, the majority of ground-water basins do not have significant urban or agricultural development. The ground-water quality in these basins is primarily a product of natural processes such as the interaction of ground water with rocks and sediment in the basins (Robertson, 1991). Natural sources of dissolved- solids and nitrate can control ground-water quality in basins with minimal urban develop- ment. Specific-conductance val- ues (an indirect measure of the dissolved-solids concentration) and nitrate concentrations for ground water in basins with minimal urban development increase northwest- ward from southeastern Arizona toward the central part of the State (figs. 16 and 17). The increasing specific-conductance values can be attributed to a corresponding increase in evaporite deposits in basin sediments from southeast to northwest (Gellenbeck and Coes, 1999). Evaporite deposits in the basins contain minerals such as halite (salt) and gypsum that can be easily dissolved in ground water. (Robertson, 1991). The increasing nitrate concentrations can be largely attributed to natural sources; however, human activities such as agriculture can be a source in some basins. In some locations in the CAZB, high nitrate concen- trations in ground water reported prior to any agricultural or urban development indicate that natural sources of nitrate are present in some basins (Hem, 1985; Robertson, 1991; Gellenbeck, 1994; Gellenbeck and Coes, 1999). Dissolution of evaporite deposits, decay of buried organic matter, precipitation, weather- ing of rocks and soils, and fixation by microorganisms are just a few of the possible sources of naturally occurring nitrate in ground water. Figure 17. Increasing specific conductance values in ground water from southeast to northwest can be attributed to an increase in soluble evaporite deposits in basin sediments. Increasing nitrate concentrations in the same direction may be the result of naturally occurring nitrate and of human activities that include agriculture. Figure 16. Nitrate concentrations and specific conductance values in ground water from basins with minimal urban development increase from the southeast to the northwest. (Basins shown below in figure 17.)
Transcript
Natural Ground-Water Quality
It is important to understand how natural processes affect ground-water quality in order to identify the effects of urban and agricultural development under similar hydrogeologic conditions. In the CAZB, the majority of ground-water basins do not have significant urban or agricultural development. The ground-water quality in these basins is primarily a product of natural processes such as the interaction of ground water with rocks and sediment in the basins (Robertson, 1991).
Natural sources of dissolved-solids and nitrate can control ground-water quality in basins with minimal urban develop-ment. Specific-conductance val-ues (an indirect measure of the dissolved-solids concentration) and nitrate concentrations for ground water in basins with minimal urban development increase northwest-ward from southeastern Arizona toward the central part of the State (figs. 16 and 17). The increasing specific-conductance values can be attributed to a corresponding increase in evaporite deposits in basin sediments from southeast to northwest (Gellenbeck and Coes, 1999). Evaporite deposits in the basins contain minerals such as halite (salt) and gypsum that can be easily dissolved in ground water. (Robertson, 1991). The increasing nitrate concentrations can be largely attributed to natural sources; however, human activities such as agriculture can be a source in some basins. In some locations in the CAZB, high nitrate concen-trations in ground water reported prior to any agricultural or urban development indicate that natural
0 1 2 3 4 5 6 7 8
0 200 400 600 800 1,000 1,200 1,400 1,600 1,800
AVRA VALLEY
ELOY
SANTA ROSA
RAINBOW VALLEY
GROUND-WATER BASIN
SIERRA VISTA
MEDIAN SPECIFIC CONDUCTANCE, IN MICROSIEMENS PER CENTIMETER
MEDIAN NITRITE PLUS NITRATE, IN MILLIGRAMS PER LITER
� �� �����
� �� ��������
��
�
��
��
�� �
����
����
����
Salt
No data available
�������
���
�����
��� �
����
�����
����
���
�����
��
�����
�����
��� �
����
�����
Figure 17. Increasing specific conductance values in ground water from southeast to northwest can be attributed to an increase in soluble evaporite deposits in basin sediments. Increasing nitrate concentrations in the same direction may be the result of naturally occurring nitrate and of human activities that include agriculture.
Figure 16. Nitrate concentrations and specific conductance values in ground water from basins with minimal urban development increase from the southeast to the northwest. (Basins shown below in figure 17.)
sources of nitrate are present in some basins (Hem, 1985; Robertson, 1991; Gellenbeck, 1994; Gellenbeck and Coes, 1999). Dissolution of evaporite deposits, decay of buried organic matter, precipitation, weather-ing of rocks and soils, and fixation by microorganisms are just a few of the possible sources of naturally occurring nitrate in ground water.
Major Findings 17
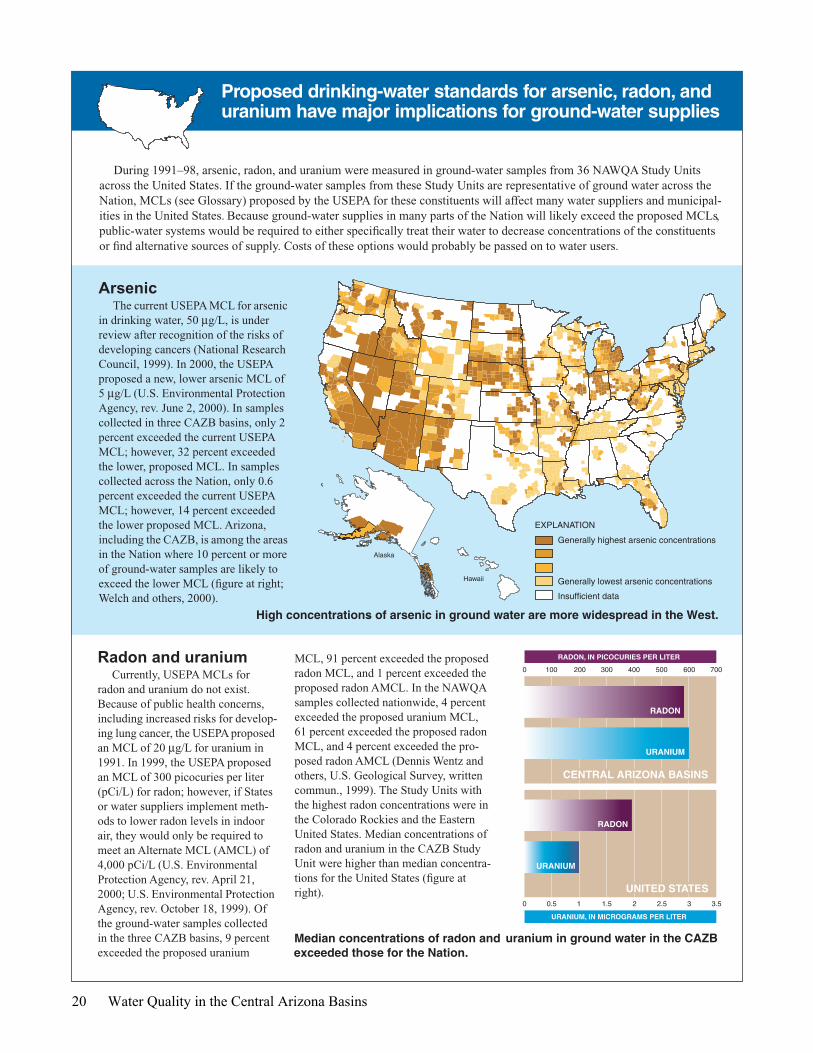
Concentrations of arsenic, fluoride, and molybde-num exceeded drinking-water standards in samples from major aquifers. The median arsenic concentration in ground water for the three CAZB basins sampled was4 µg/L. One sample from the Upper Santa Cruz Basin and one sample from the West Salt River Valley exceeded the current MCL for arsenic of 50 µg/L; however, a new, lower standard of 5 µg/L has been proposed by the USEPA because of the cancer risk posed by arsenic in drinking water (U.S. Environmental Protection Agency, rev. August 25, 2000). When arsenic concentrations in ground water sampled in the CAZB are compared to the proposed standard, more than 50 percent of samples from
18 Water Quality in the Central Arizona Basins
aquifers in West Salt River Valley that are used for drinking water exceed 5 µg/L. Seventeen percent of samples in the Upper Santa Cruz Basin and 10.5 per-cent of samples in the Sierra Vista subbasin exceed5 µg/L. The USEPA may not settle on 5 µg/L, but the new standard is likely to be significantly lower than the current MCL.
The median concentration of fluoride was 0.5 µg/L; about 2 percent of the samples exceeded the current MCL for fluoride of 4 µg/L. The median concentration of molybdenum was 3 µg/L; about 1 percent of the sam-ples exceeded the current lifetime health advisory for molybdenum of 40 µg/L established by the USEPA.
Most ground water sampled is more than 50 years old
Figure 18. Ground water sampled in the CAZB Study Unit generally is from greater depths than ground water sampled in NAWQA Study Units across the Nation.
������ �� ���� ���� ���
1,200
1,000
800
600
400
200
0
1,400T
RIT
IUM
CO
NC
EN
TR
AT
ION
IN P
RE
CIP
ITA
TIO
N,
DE
CA
YE
D T
O 1
998,
IN P
ICO
CU
RIE
S P
ER
LIT
ER
1960 1990198019701950 2000
33%
17%
29%4%
9%
34%
35%39%
CENTRAL ARIZONA BASINS
UNITED STATES WELL DEPTH— In feet
5 to 100
100 to 250
250 to 500
Greater than 500
Radon and uranium are detected in most ground-water samples. Radon is a colorless and odorless radioactive gas that is car-ried in the water pumped from wells (fig.19) and released to indoor air by activities such as cooking and showering. Breathing radon increases the risk of lung cancer (U.S. Environmental Pro-tection Agency, rev. October 18, 1999). Radon is naturally formed in rocks and soils from the radioac-tive decay of radium, an intermedi-ate product in the uranium decay process. In the CAZB Study Unit, radon was present in 100 percent of the samples, and uranium was detected in 90 percent of the sam-ples. The median concentrations for radon and uranium were 584 picocuries per liter and 3 micro-grams per liter, respectively. Cur-rently (2000), there are no USEPA MCLs for radon and uranium; however, proposed MCLs could result in increased costs for water suppliers to treat drinking water for these constituents or find alternate supplies. Additional costs would probably be passed on to the water user (see information on proposed standards for arsenic, radon, and uranium on p. 20).
Figure 19. Samples are collected at the well head for radon analysis to prevent possible sample contamination from exposure to the atmosphere.
Effects of Human Activities on Ground-Water Quality
The contamination of major aqui-fers is largely controlled by hydrol-ogy and land use (U.S. Geological Survey, 1999). In the CAZB Study Unit, deep ground water that was recharged prior to 1953 typically has not been affected by human activities (see p. 18). In areas with recent recharge (after 1953), ground water is more likely to be contaminated by nutrients and man-made chemicals associated with urban and agricultural land uses.
Ground-water quality deterio-rates in irrigated areas. Irrigation water that seeps downward is a prin-cipal source of ground-water recharge in irrigated areas of the CAZB. Dis-solved-solids concentrations in seep-age can be as much as five times those in the original irrigation water (Bouwer, 1990) because of concentra-tion by evaporation and plant use (see p. 9). The greater the dissolved-solids concentration in the applied irrigation water, the greater the concentration in the seepage moving downward to the ground water.
To determine the effects of irri-gated agriculture on shallow ground-water quality, nine monitoring wells
were drilled and sampled in the southwestern part of the West Salt River Valley (see “Study Unit Design,” p. 26). Because the aver-age depth to ground water in the nine wells is 32 feet (table 1) com-pared to 230 feet for wells sam-pled basinwide, irrigation seepage does not have to travel far to reach the shallow ground water in the agricultural area. Sources of irriga-tion water in this area include treated sewage effluent, water from the Salt River and CAP canal, irrigation return flows, and ground water. Dissolved-solids concentrations of these sources range from about 900 mg/L for treated sewage effluent (Tadayon and others, 1998) to 650 mg/L for CAP water and 470 mg/L for Salt River water (Salt River Project, 1997).
The median dissolved-solids concentration in water from the nine shallow wells exceeded 3,000 mg/L (table 1). In addition, the effects of nitrate from fertilizer applications and reuse of irrigation return flows were evident from the median nitrate concentration that was nearly twice the MCL of 10 mg/L (table 1).
Table 1. Median concentrations of nitrate and dissolved solids were highest in shallow ground water from an agricultural area in the West Salt River Valley
1 Maximum Contaminant Level.2 Secondary Maximum Contaminant Level.
Study area
Median concentration, in milligrams per liter
Average depth to ground water, in feet
Nitrate Dissolved
solids
West Salt River Valley Agricultural area Basinwide
19.02.7
3,050
560
32 230
Upper Santa Cruz Basin 1.5 305 230
Sierra Vista subbasin 0.78 262 171
U.S. Environmental Protection Agencydrinking-water standard 110 2500
Major Findings 19
Proposed drinking-water standards for arsenic, radon, anduranium have major implications for ground-water supplies
High concentrations of arsenic in ground water are more widespread in the West..
0 0.5 1 1.5 2 2.5 3 3.5
0 100 200 300 400 500 600 700
Alaska
Hawaii
EXPLANATION
Generally highest arsenic concentrations
Insufficient data
Generally lowest arsenic concentrations
RADON
URANIUM
UNITED STATES
RADON
URANIUM
CENTRAL ARIZONA BASINS
URANIUM, IN MICROGRAMS PER LITER
RADON, IN PICOCURIES PER LITER
20 Water Quality in the Central Arizona Basins
The highest concentrations of nitrate and dis-solved solids were in shallow ground water beneath an irrigated agricultural area. Shallow ground water from the agricultural land-use study area in the West Salt River Valley had median con-centrations of nitrate (19 mg/L) and dissolved solids (3,050 mg/L) that exceeded the USEPA MCL and SMCL, respectively (table 1). Nitrate and dissolved solids from irrigation and agricultural practices are accumulating in shallow ground water (see p. 9 and 11). The shallow ground water in this area is not used for drinking water, and clay beds reduce the
likelihood of contamination of the aquifers below that are used for drinking water (see p. 22).
Deeper ground water from urban, rangeland, and agri-cultural areas in other parts of the West Salt River Valley had a median nitrate concentration that was less than the MCL of 10 mg/L; however, the median concentration of dissolved solids exceeded the SMCL of 500 mg/L (table 1). Median concentrations of nitrate from the Upper Santa Cruz Basin and the Sierra Vista subbasin also were less than the MCL, and median concentrations of dissolved solids were less than the SMCL (table 1).
Nitrate concentrations in ground water in the West Salt River Valley are among the highest in the Nation
WEST SALTRIVER VALLEY
UPPER SANTACRUZ BASIN
CENTRALARIZONABASINS
SIERRA VISTASUBBASIN
PERCENTAGE OF SAMPLES EXCEEDING DRINKING-WATER STANDARD FOR NITRATE OF 10 MILLIGRAMS PER LITER— Each dot represents a major aquifer
BACKGROUND CONCENTRATION— Bold outline indicates median values greater than background concentration of 2 milligrams per liter
Greater than 10 percent Less than 10 percent Zero samples exceed standard
EXPLANATION
Major Findings 21
2
Occurrence and distribution of pesticides in ground water in the CAZB reflect both agricultural and urban land uses. Ten pesticides were detected in shallow ground water from the agricultural land-use study area in the West Salt River Valley, west of Phoenix (fig. 22). In other parts of the West Salt River Valley, consisting of agricultural, urban, and rangeland areas, eight pesticides were detected in ground water. Five pesticides were detected in ground water from the Upper Santa Cruz Basin, where there is a mixture of land-use types, but 60 per-cent of the basin is undeveloped rangeland (Coes and others, 2000). In the Sierra Vista subbasin, where urban and agricultural land uses are minimal (3.3 percent of basin; Coes and others, 1999) and have been minimal in the past, no pesticides were detected in ground-water sam-ples. During 1996–98, the largest quantities of pesticides used among the three basins were for agriculture in the West Salt River Valley (Ken Agnew, University of Arizona, Pesticide Information and Training Office, written commun., 1999).
2 Water Quality in the Central Arizona Basins
Figure 22. The largest number of pesticides was detected in an agricultural area in the West Salt River Valley.
SC 3
SC 5
SC 9
Central ArizonaBasins Boundary
BASIN FILL
EXPLANATION
CONSOLIDATED ROCKS
0 10 MILES
0 10 KILOMETERS
5
5
HIEROGLYPHICMOUNTAINS
HEDGPETHHILLS
PHOENIXMOUNTAINS
SOUTHMOUNTAINS
BUCKEYEHILLS
WHITE TANKMOUNTAINS
SIERRAESTRELLA
AGRICULTURAL AREA STUDIEDWHERE LOW-PERMEABILITY CLAY BEDS IMPEDE THE FLOW OF CONTAM-INATED SHALLOW GROUND WATER TO DEEPER DRINKING-WATER SUPPLIES
Clay beds that currently protect deep ground water from contamination may not do so in the future.
In the agricultural land-use study area of the West Salt River Valley (fig. 20), the tops of low-permeability clay beds are about 150 to 400 ft below the land surface. These clay beds impede the downward movement of irrigation seepage and reduce the likelihood of contaminants reaching deeper drink-ing-water supplies. Domestic wells in the area yield water from beneath the protective clay beds. Ground water above the clay beds has higher nitrate and dissolved-solids concentrations than ground water from beneath the clay beds (fig. 21). In this area, ground-water samples from above the clay beds had a median dissolved-solids concentration of 3,050 mg/L and a median nitrate concentration of 19.0 mg/L (table 1). Ground-water samples from below the clay beds had a median dis-solved-solids concentration of 702 mg/L and a median nitrate concentration of 1.9 mg/L. Care must be taken in drilling and completing drinking-water wells below the clay beds to ensure that shallow ground water above the clay beds does not con-taminate the well and aquifer below.
Analyses of the tritium from ground water in this area indicated that water above the clay beds gener-ally had been recharged after 1953, and water below the clay beds generally had been recharged before 1953 (see information about age dating ground water on p. 18). Although the clay beds currently reduce the likelihood that irrigation seepage will contami-nate the ground water below, future large-scale with-drawals of ground water from below the clay beds could possibly result in the movement of shallow, poor quality water through the clay beds and into the domestic ground-water supply. Figure 21. Ground water above the clay beds was recharged
after 1953 and has been affected by agricultural activities.
Figure 20. Low-permeability clay beds in an agricultural area in the West Salt River Valley reduce the likelihood of contamination reaching deeper drinking-water supplies.
Most of the pesticides detected in ground water in the CAZB were herbicides used to control unwanted plants in urban and agricultural areas (fig. 23). Herbi-cide use in urban areas is indicated by detections of simazine and prometon in the West Salt River Valley and prometon and 2,4-D in the Upper Santa Cruz Basin. These herbicides are used primarily in nonagricultural areas (U.S. Geo-logical Survey, 1999). Detections of atrazine and deethylatrazine (a breakdown product of atrazine) in the West Salt River Valley and the Upper Santa Cruz Basin are an indication that herbicides used in areas of present and historical agri-culture are affecting ground-water quality. Atrazine is one of the most heavily used herbicides in agricul-tural areas in the United States (U.S. Geological Survey, 1999).
Concentrations of pesticides in ground water did not exceed drinking-water standards or guidelines. Although deethylatra-zine, simazine, prometon, DDE, atrazine, and diuron were detected in more than 30 percent of the ground-water samples from the agricultural land-use study area of the West Salt River Valley, none of the concentrations exceeded drink-ing-water standards or guidelines. Similarly, pesticides detected in ground water from the basinwide sampling in the West Salt River Valley during 1996–98 did not exceed drinking-water standards or guidelines.
DDE was detected in 10 (56 percent) of the shallow ground-water samples from the agricul-tural land-use study area in the West Salt River Valley. Detections of DDE in this area are the result of the persistence of this insecticide breakdown product in the environ-ment and the physical characteris-tics of the ground-water system in
the area. In particular, the shallow depth to ground water in the agri-cultural land-use study area means that irrigation seepage and recharge, containing pesticides and their breakdown products, do not have to travel far to contaminate the ground water. Clay layers impede the movement of pesticides into the deeper aquifers in the area. The soils in the agricultural area have been identified as a source of DDE for the ground water (Brown, 1993). The only detection of DDE in the West Salt River Valley outside of the agricultural area was in a sample from the northern part of the Phoe-nix metropolitan area. DDE was not detected in samples from the Upper Santa Cruz Basin or the Sierra Vista subbasin.The large depths to ground water and small amounts of DDT used in most of the West Salt River Valley, the Upper Santa Cruz Basin, and the Sierra Vista subbasin limit the potential for introduction of DDE to the ground water.
0 2 4 6 8 10 12 14 16 18 20 22 24 26 28 30
DEETHYLATRAZINE
ATRAZINE
EPTCTRIFLURALIN
ACETOCHLORMETRIBUZIN
TRIALLATE
AGRICULTURAL HERBICIDES
PESTICIDES DETECTED IN GROUND WATER
SIMAZINE
DIURON
2,4-D
AGRICULTURAL/URBAN HERBICIDES
DDE
DIELDRINCHLORPYRIFOS
INSECTICIDES
PROMETON
URBAN HERBICIDES
AGRICULTURAL AREA
MIXED LAND-USE AREA
NUMBER OF DETECTIONS
Figure 23. Most of the pesticides detected in ground water in the CAZB were herbicides used in agricultural and urban environments.
Major Findings 23
Detections of multiple pesti-cides indicate the complexity of contamination from land-sur-face activities. No standards or guidelines currently exist for mix-tures of pesticides in drinking water because their effect on human health is not known (U.S. Geological Survey, 1999). All 9 wells in the agricultural land-use study area had 3 or more pesticides detected, whereas only 3 of the 35 wells sampled basinwide in the West Salt River Valley had 3 or more pesticides detected, and none of the wells in the Upper Santa Cruz Basin had 3 or more pesti-cides detected (fig. 24). No pesti-cides were detected in the Sierra Vista subbasin.
24 Water Quality in the Central Ar
����������� ��� �����
� ����
� �������
���������
���������� ����� ��������
���������� ������ �����
����� �� ���� ������
����� �� ���� ��� �� ��
��� ������� ���
Gila
Santa
Cruz
Alt
arW
ash
Waterm
anW
ash
Sant
aR
osa
Was
h San
PedroR
iverRiver
Santa
CruzW
ash
River
River
Brawley
Wash
Salt
No data availableNogales
PHOENIX
Eloy
SierraVista
TUCSON
ThreePoints
Casa Grande
Marana
Mobile
����
���� ���
�����
��� �������
����� ����
�����
����� ���
����
�����
���
����
����
�
��
�
��
�
��
�
�
�
��
Figure 24. Multiple pesticides were detected in all nine monitoring wells in the agricultural land-use study area of the West Salt River Valley.
izona Basins
Volatile organic compounds (VOCs), including gasoline compounds, solvents, and refrigerants, have been identified as a major concern for ground-water contami-nation in Arizona (Marsh, 1994). Leaking underground storage tanks and disposal of solvents have been linked to most of the doc-umented cases of ground-water contamina-tion by VOCs. Electronic- and aerospace-manufacturing facilities use solvents for degreasing and are known to be sources of some of the largest VOC contamination problems in Arizona. Disposal of solvents from these types of facilities has occurred since the 1950s (Marsh, 1994). Dry-cleaning facilities also have been identified as sources of recent ground-water contamination by VOCs. Some municipal supply wells in the urban areas of Phoenix and Tucson are no longer used because of contamination by VOCs (Marsh, 1994).
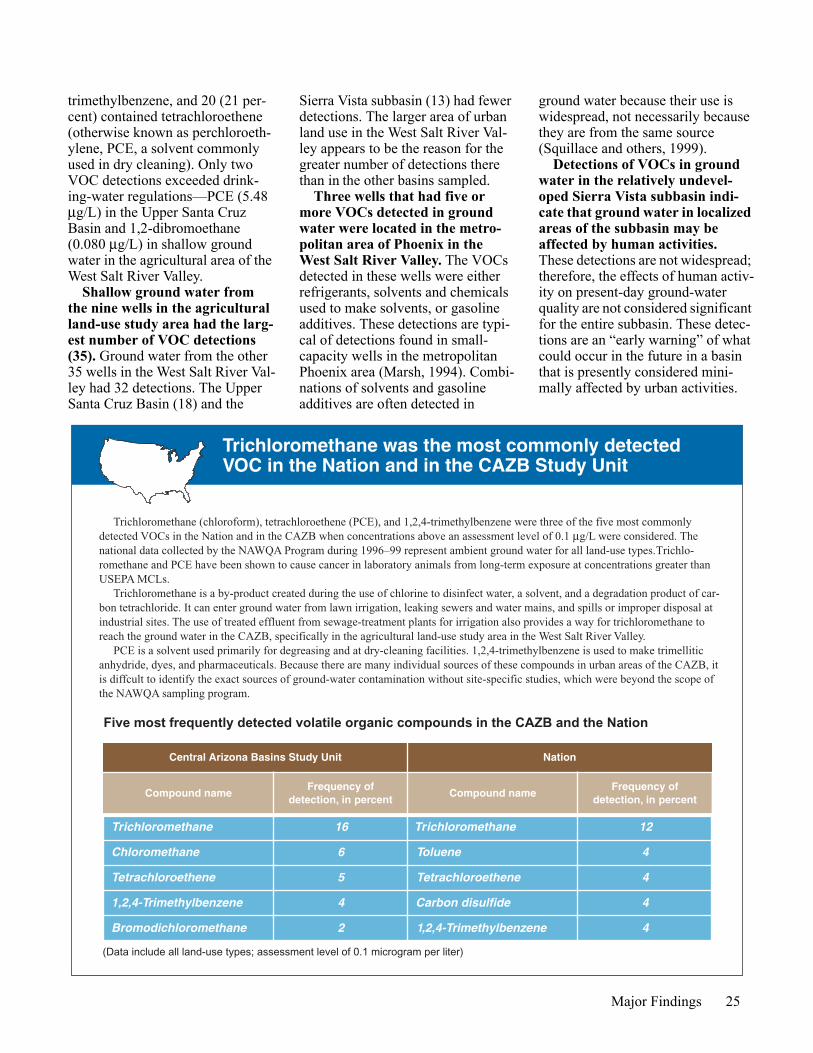
VOCs were detected in ground water from all three basins sampled during 1996–98 (fig. 25). Of the 96 samples col-lected, 33 (34 percent) contained trichlo-romethane, 24 (24 percent) contained 1,2,4-
� � � � � �� �� �� �� �� �� �� �� �� �� �� �� ��
�������������
� � ��������������
������ ������ ��������� ����� �� ������ ���
������������
�����������������
������������
����� ��������
������������������
� ������������
� �������������
��������
����� ��������� ���
����������
�������������������
� ��������������
������������������
����
��������
� � ��������������
� � ������������� � ��
�������������
����� ����
������������
����������
������������
����� �� �������� �� �� �����
Figure 25. The VOCs trichloromethane, 1,2,4-trimethylbenzene, and tetrachloroethene were detected most frequently in ground water.
trimethylbenzene, and 20 (21 per-cent) contained tetrachloroethene (otherwise known as perchloroeth-ylene, PCE, a solvent commonly used in dry cleaning). Only two VOC detections exceeded drink-ing-water regulations—PCE (5.48 µg/L) in the Upper Santa Cruz Basin and 1,2-dibromoethane (0.080 µg/L) in shallow ground water in the agricultural area of the West Salt River Valley.
Shallow ground water from the nine wells in the agricultural land-use study area had the larg-est number of VOC detections (35). Ground water from the other 35 wells in the West Salt River Val-ley had 32 detections. The Upper Santa Cruz Basin (18) and the
Sierra Vista subbasin (13) had fewer detections. The larger area of urban land use in the West Salt River Val-ley appears to be the reason for the greater number of detections there than in the other basins sampled.
Three wells that had five or more VOCs detected in ground water were located in the metro-politan area of Phoenix in the West Salt River Valley. The VOCs detected in these wells were either refrigerants, solvents and chemicals used to make solvents, or gasoline additives. These detections are typi-cal of detections found in small-capacity wells in the metropolitan Phoenix area (Marsh, 1994). Combi-nations of solvents and gasoline additives are often detected in
ground water because their use is widespread, not necessarily because they are from the same source (Squillace and others, 1999).
Detections of VOCs in ground water in the relatively undevel-oped Sierra Vista subbasin indi-cate that ground water in localized areas of the subbasin may be affected by human activities. These detections are not widespread; therefore, the effects of human activ-ity on present-day ground-water quality are not considered significant for the entire subbasin. These detec-tions are an “early warning” of what could occur in the future in a basin that is presently considered mini-mally affected by urban activities.
Trichloromethane was the most commonly detectedVOC in the Nation and in the CAZB Study Unit
Five most frequently detected volatile organic compounds in the CAZB and the Nation
(Data include all land-use types; assessment level of 0.1 microgram per liter)
Trichloromethane (chloroform), tetrachloroethene (PCE), and 1,2,4-trimethylbenzene were three of the five most commonly detected VOCs in the Nation and in the CAZB when concentrations above an assessment level of 0.1 µg/L were considered. The national data collected by the NAWQA Program during 1996–99 represent ambient ground water for all land-use types. Trichlo-romethane and PCE have been shown to cause cancer in laboratory animals from long-term exposure at concentrations greater than USEPA MCLs.
Trichloromethane is a by-product created during the use of chlorine to disinfect water, a solvent, and a degradation product of car-bon tetrachloride. It can enter ground water from lawn irrigation, leaking sewers and water mains, and spills or improper disposal at industrial sites. The use of treated effluent from sewage-treatment plants for irrigation also provides a way for trichloromethane to reach the ground water in the CAZB, specifically in the agricultural land-use study area in the West Salt River Valley.
PCE is a solvent used primarily for degreasing and at dry-cleaning facilities. 1,2,4-trimethylbenzene is used to make trimellitic anhydride, dyes, and pharmaceuticals. Because there are many individual sources of these compounds in urban areas of the CAZB, it is diffcult to identify the exact sources of ground-water contamination without site-specific studies, which were beyond the scope of the NAWQA sampling program.