46
NATURAL RESOURCE MANAGEMENT IN THE ALBERTINE GRABEN REGION OF UGANDA: Baseline Survey Report February, 2015 RESEARCH REPORT No. 12
| Date post: | 04-Jan-2017 |
| Category: |
Documents |
| Upload: | truongthuan |
| View: | 226 times |
| Download: | 1 times |
NATURAL RESOURCE MANAGEMENT IN THE ALBERTINE GRABEN REGION OF UGANDA: Baseline Survey Report
February, 2015
RESEARCH REPORT No. 12

NATU
RA
L RESO
UR
CE M
AN
AG
EMEN
T IN TH
E ALB
ERTIN
E GR
AB
EN R
EGIO
N O
F UG
AN
DA
:Baseline Survey Report February, 2015
i
NATURAL RESOURCE MANAGEMENT IN THE ALBERTINE GRABEN REGION OF UGANDA: Baseline Survey Report
February, 2015

NAT
UR
AL
RES
OU
RC
E M
AN
AG
EMEN
T IN
TH
E A
LBER
TIN
E G
RA
BEN
REG
ION
OF
UG
AN
DA
:Ba
selin
e Su
rvey
Rep
ort
Febr
uary
, 201
5
ii
Table of Contents1. Introduction 1 The Survey 3 Study Data and Methods 3 Study Design 4 Organization of the Report 52. Familiarity with Oil Activities and Observed Changes since 2008 6 Familiarity with Oil Operations in the Albertine Region 6 Support for oil operation in the Albertine Region 7 Changes in livelihoods after since commencement of oil exploration activities 7 Changes in the Availability of Commodities since the Onset of Oil Exploration 103. Readiness and Trust for Leaders Regarding Oil Regulations and Production 15 Readiness for Oil Activities in Uganda 15 Trust for Leaders by Communities 20 Perceptions Regarding the Addressing of Oil Concerns 22 Decision making Regarding Oil Activities 244. Expectations from Oil Activities/Revenues 28 The Sharing of Oil Resources 28 WhoIsExpectedtoBenefitfromOilResources? 28 WhoIsExpectedtoBenefittheMost? 31 WhatAretheOtherExpectedChangesasaResultofOilActivities? 315. Conclusions and Policy Options 34 Readiness to commence oil production: 34 Government’sabilitytoeffectivelyandefficientlymanagetheoilresource: 34 Institutions and leadership: 35 Impacts on livelihoods and availability of commodities and services 35 Gender, locational, ethnicity and income disparities. 35 Management of the environment: 36 Some Policy options: 36 Ensure Transparency and accountability at all levels of oil production: 36 Ensure strict implementation and coherence to the developed legal and institutional framework: 36 Empowering local governance structures and institutions in oil districts: 37 Ensure social equity: 37Appendix: 38 Map showing natural resource management in the Albertine Graben region baseline survey coverage 38
NATU
RA
L RESO
UR
CE M
AN
AG
EMEN
T IN TH
E ALB
ERTIN
E GR
AB
EN R
EGIO
N O
F UG
AN
DA
:Baseline Survey Report February, 2015
iii
List of Tables and Figures
Table 1. AverageHouseholdCharacteristicsbyStratificationArea 4Table 2. Knowledge about and support for oil 9Table 3. Reasons for the Changes in the Observed Availability of Products and Services in Intervention Districts 14Table 4. WhoIsExpectedtoBenefittheMostfromOilResources?(percent) 31
Figure 1. Changes in the Availability of Household Products and Services between2008and2014(percent) 11Figure 2. Uganda’s Readiness for Oil Activities 15Figure 3. Perceptions about Preparedness for Oil by Level of Education 17Figure 4. Perceptions Regarding Preparedness for Oil by Household Wealth Status 17Figure 5: Opinionregardingreadinessbymigrationstatus(%). 19Figure 6. Trust for Leaders to Make Laws 21Figure 7. Trust for Members of Parliament 21Figure 8. Trust for the Petroleum Exploration and Production Department 23Figure 9. WhereWouldYouMainlyGotoExpressOil-RelatedConcerns? 23Figure 10. DoYouThinkYourConcernsWouldBeAddressed? 25Figure 11. Who should be Responsible for Addressing Any Negative EffectsofOilOperations? 26Figure 12. WillOilProjectsBenefitthePoor? 29Figure 13. TheExpectedDistributionofBenefitsfromOil 30Figure 14. Perceptions Regarding Corruption as a Result of Oil Activities 32

NAT
UR
AL
RES
OU
RC
E M
AN
AG
EMEN
T IN
TH
E A
LBER
TIN
E G
RA
BEN
REG
ION
OF
UG
AN
DA
:Ba
selin
e Su
rvey
Rep
ort
Febr
uary
, 201
5
iv
NATU
RA
L RESO
UR
CE M
AN
AG
EMEN
T IN TH
E ALB
ERTIN
E GR
AB
EN R
EGIO
N O
F UG
AN
DA
:Baseline Survey Report February, 2015
1
1. IntroductionUganda discovered commercially viable oil reserves in its Albertine Graben region in 2006, and as of 2014, oil reserves were estimated at 6.5 billion barrels (1.4 billion barrels are estimated as recoverable) after exploration of only 40 percent of the region. With the proposed lifting of the moratorium on exploration in new areas, it is expected that known reserves could substantially increase and elevate Uganda to the rank of other mid-sized oil producers—roughly comparable to Gabon, the Republic of Congo, Chad and Trinidad and Tobago.1 Furthermore, during 1998-2013, Uganda managed to attract US$ 2.4 billion in foreign direct investment in petroleum exploration.2 It is expected that Uganda could earn at least $2 billion a year for 30 years once oil production commences. This prospect holds unprecedented potential to accelerate development and drive the country’s transformation into a regional and even global economic player. As envisioned in Uganda’s national oil and gas policy, the country’s oil resources could also be crucial for alleviating mass poverty and improving national living standards.
However, exploration of natural resources such as oil is also associated with pitfalls such as economic distortions; a weakening of the relationship between people and the government; increased corruption; and internal tensions, as is evident in countries like Nigeria, Angola, and Gabon.3 Additionally, if the exploitation of the resources is not well managed, it could have adverse effects on the environment, including national parks, bodies of water, game and forest reserves.4 Petroleum production can also affect air quality and the surrounding vegetation, as has been witnessed in the Niger Delta. Uganda’s Albertine Graben region, which stretches along the entire western border of the country, is host to rare biodiversity. At least 5,793 different plant varieties have been recorded in the region, and 551 of these species are endemic to it. The Albertine Graben’s Lake Albert has 53 different fish species, and approximately 10 of these are unique to the lake and thus are found nowhere else in the world. The region’s residents depend on these critical natural resources for their livelihoods—in agriculture, fishing and tourism—all of which could be adversely affected by oil exploitation.
The Government of Uganda has taken significant strides to ensure that the appropriate
1 In 2007, prior to the announcement of the discovery of commercial deposits of oil in Uganda, the government of Uganda placed a moratorium on the issuing of new licensing oil exploration licenses. The suspension of issuing of licenses was meant to enable the government put in place the necessary laws for the management of oil resources. Although, by June 2014, some of the required legislation was in place (e.g. Uganda’s upstream law, the Petroleum Exploration, Development, Production Act 2013); there were outstanding regulations—especially relating to management of the anticipated oil revenues. In June 2014, the Petroleum Exploration and Production Department announced that it expects the moratorium to be lifted by the second half of 2015.
2 Ministry of Energy and Mineral Development (2008) Progress of Implementation of the National Oil and Gas Policy for Uganda, June 2014. http://www.petroleum.go.ug/uploads/resources/Policy_Implementation,_June_2014_booklet.pdf
3 Choudhury, C., Coca, N., Jeansonne, M., Kawomoto, K., Lanier, F., Smith, I.D., Swaminathan, S., Wilhemlsen, F., and Radon, J (2012), “Oil: Uganda’s Oppor tunity for Prosperity,” School of Inter national and Public Affairs, Columbia University, New York, at http://www. acode-u.org/documents/oildocs/Co lumbia%20University%20-%20Ugan da%20OIL.pdf.
4 Ministry of Energy and Mineral Development (2008) National Oil and Gas Policy for Uganda. http://www.petroleum.go.ug/uploads/resources/17.NATIONALOILANDGASPOLICYFORUGANDA_.pdf
NAT
UR
AL
RES
OU
RC
E M
AN
AG
EMEN
T IN
TH
E A
LBER
TIN
E G
RA
BEN
REG
ION
OF
UG
AN
DA
:Ba
selin
e Su
rvey
Rep
ort
Febr
uary
, 201
5
2
policies, institutions and legal framework exist to harness the projected benefits of the Albertine Graben’s oil resources and concurrently to ensure that the environment is managed sustainably. The country already has a national oil and gas policy, and a number of laws meant to guide the management of oil resources have already been passed by in Parliament, including the 2013 Petroleum Exploration, Development and Production Bill; and the 2013 Petroleum Refining, Conversion, Transmission and Midstream storage Act. It is only the law relating to the management of oil revenues i.e. Public Finance Bill, 2012 that is yet to be passed by parliament.
Infrastructural developments to support the exploitation of oil reserves have been initiated with the construction of the Hoima-Kaiso-Tonya Road (2012–15) and the 9 megawatt Kabalega Power Station. Plans are also under way to build a medium-sized oil refinery in Hoima district. On the other hand, the developments in the Albertine region have also led to a heightened sense of insecurity. Specifically, while the government has embarked on mass infrastructural development that has necessitated the resettlement of some residents and natives of the Albertine region from their land (e.g., construction of a limited-access highway and the planned oil refinery); property and land transactions, along with incidences of perceived land grabbing (i.e., eviction from land without adequate compensation), have also been reported to have risen over time. In addition, an environment of mistrust had engulfed the country when allegation of corruption in the conduct of oil negotiation were tabled before the Parliament of Uganda.
Furthermore, the discovery of and continued exploration for oil in the Albertine region has raised the expectations of those living both in and outside it. Expectations range from opportunities for employment to increased business activity and in some cases direct monetary benefits from the oil revenue (e.g., grants). As a result, the region has witnessed an influx of new businesses and migrants from non-oil districts that have come in search for the promise of better economic opportunities.
This report presents the results of a baseline survey conducted Albertine region as well as neighbouring districts on experience of oil exploration activities and expectations from oil developments. The baseline seeks to identify the effects that oil exploration activities have had on the people and the region. As part of the pre-exploitation analysis, the baseline provides information on awareness about oil activities, expectations about the oil resources and people’s trust vis-à-vis the authorities with regard to the proposed exploitation and use of the expected resources. A primary object of the baseline is to establish a basis for future evaluation of the impact of exploitation-related activities on employment, migration, businesses, livelihood strategies and the environment.

NATU
RA
L RESO
UR
CE M
AN
AG
EMEN
T IN TH
E ALB
ERTIN
E GR
AB
EN R
EGIO
N O
F UG
AN
DA
:Baseline Survey Report February, 2015
3
The Survey
The baseline survey of natural resource management (NRM) in the Albertine region aims to bring new data, tools and analysis to the task of explaining the effects of oil activities on the region’s households. In particular, the survey collected information on ongoing oil exploration activities and expectations of oil revenues from both oil areas (called intervention districts) and non-oil areas (control districts). The initial phase was limited to 3 intervention districts and 9 other districts.
Specifically, this report aims to achieve the following objectives:• Assess household knowledge of ongoing oil activities in the Albertine region;• Assess what communities expect from the potential oil revenues; • Assess what types of individuals have benefited from the oil exploration activities
since 2008; and• Assess whether communities have experienced any negative effects arising from oil
activities (e.g., on the environment).
Study Data and Methods
The survey was based on a two-stage, stratified, random-sampling procedure. The stratification was based on (1) intervention districts (i.e., districts with ongoing oil exploration activities); (2) other intervention districts (districts with potential for future exploration/production activities); and (3) control (districts outside the Albertine Graben). Given that, at the baseline in 2014, there were no ongoing oil exploration activities in the “other intervention” areas, in the analysis, this category of districts is considered part of the control districts. For budgetary reasons, the initial phase of the NRM survey was based on a quantitative survey of 1,541 households. All the three intervention districts of Hoima, Bullisa and Nwoya were covered in the survey. The choice of these three intervention districts was guided by the fact that current oil activities—especially exploration—are concentrated in these specific districts. In addition, the survey covered four “other intervention” districts (i.e., Nebbi, Masindi, Kasese and Kabarole), as well as five control districts (i.e., Gulu, Oyam, Kamwenge, Rukungiri and Kyankwanzi).5 In the first stage, enumeration areas (EAs) were the principal sampling unit, and the selection of EAs was based on the 2014 census by the Uganda Bureau of Statistics. In the second stage, 10 households were randomly selected from each of the EAs. A total of 1,540 households were selected, of which 103 were dropped due to inaccessibility or because they could not be located, leaving 1,437 households. Table 1 gives the average demographic and spatial characteristics of the surveyed households. Forty well-trained, university-educated research assistants conducted the surveys over a two-month period (March–May 2014). In the following analysis, the “other intervention” districts are lumped together with the
5 A second phase, to include a community questionnaire, is currently being explored (see the map in the appendix showing the envisaged coverage of the baseline survey).
NAT
UR
AL
RES
OU
RC
E M
AN
AG
EMEN
T IN
TH
E A
LBER
TIN
E G
RA
BEN
REG
ION
OF
UG
AN
DA
:Ba
selin
e Su
rvey
Rep
ort
Febr
uary
, 201
5
4
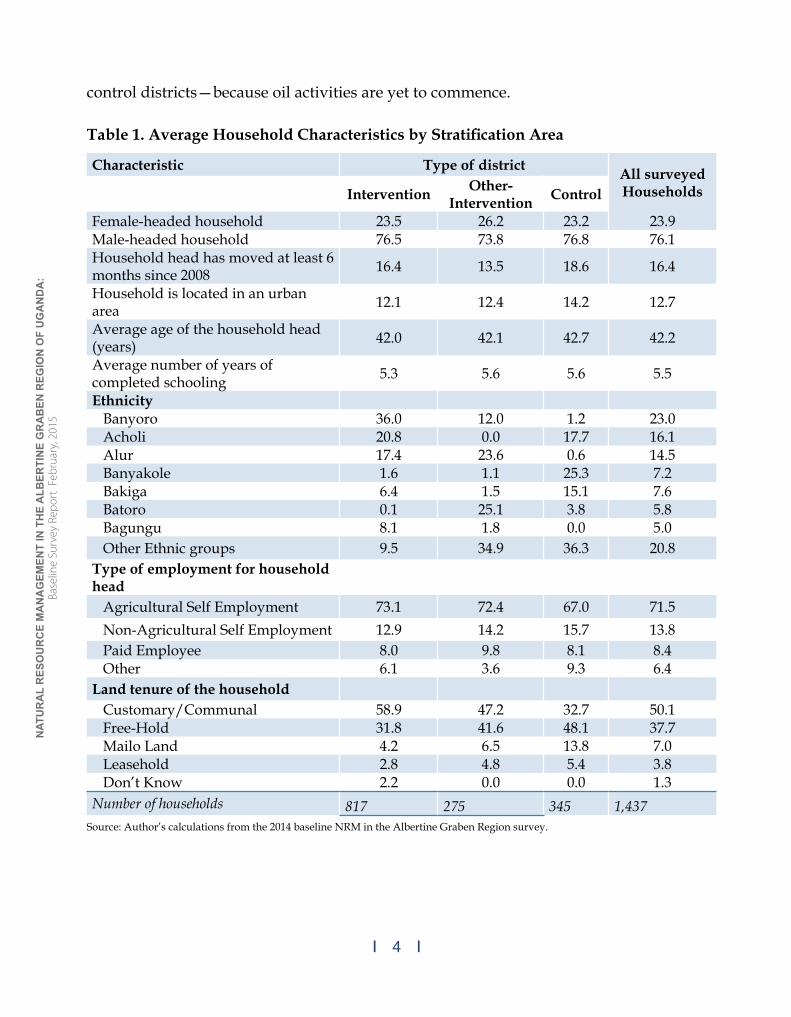
control districts—because oil activities are yet to commence.
Table 1. Average Household Characteristics by Stratification Area
Characteristic Type of district All surveyed Households Intervention Other-
Intervention Control
Female-headed household 23.5 26.2 23.2 23.9Male-headed household 76.5 73.8 76.8 76.1Household head has moved at least 6 months since 2008 16.4 13.5 18.6 16.4
Household is located in an urban area 12.1 12.4 14.2 12.7
Average age of the household head (years) 42.0 42.1 42.7 42.2
Average number of years of completed schooling 5.3 5.6 5.6 5.5
Ethnicity Banyoro 36.0 12.0 1.2 23.0 Acholi 20.8 0.0 17.7 16.1 Alur 17.4 23.6 0.6 14.5 Banyakole 1.6 1.1 25.3 7.2 Bakiga 6.4 1.5 15.1 7.6 Batoro 0.1 25.1 3.8 5.8 Bagungu 8.1 1.8 0.0 5.0 Other Ethnic groups 9.5 34.9 36.3 20.8Type of employment for household head Agricultural Self Employment 73.1 72.4 67.0 71.5 Non-Agricultural Self Employment 12.9 14.2 15.7 13.8 Paid Employee 8.0 9.8 8.1 8.4 Other 6.1 3.6 9.3 6.4Land tenure of the household Customary/Communal 58.9 47.2 32.7 50.1 Free-Hold 31.8 41.6 48.1 37.7 Mailo Land 4.2 6.5 13.8 7.0 Leasehold 2.8 4.8 5.4 3.8 Don’t Know 2.2 0.0 0.0 1.3Number of households 817 275 345 1,437
Source: Author’s calculations from the 2014 baseline NRM in the Albertine Graben Region survey.
NATU
RA
L RESO
UR
CE M
AN
AG
EMEN
T IN TH
E ALB
ERTIN
E GR
AB
EN R
EGIO
N O
F UG
AN
DA
:Baseline Survey Report February, 2015
5
Study Design
The survey was designed to assess retrospective oil activities as well as current ones. Although actual discoveries of oil were made in 2006, in the survey, we chose 2008 as our reference year. This choice was based on information collected from key stakeholders, which revealed that it was 2008 when “heavy machinery”—a characteristic of intensive oil exploration activities—started moving into the intervention districts. As such, all retrospective questions refer to activities since 2008.
Oil activities were assessed in different ways. First, detailed information was collected about any experience working for oil companies; familiarity with oil operations in the district; communication channels and access to information; any displacement due to oil-related activities; expectations and concerns regarding oil activities; environmental conditions in the community; and experiences of being consulted by various stakeholders on oil activities.
The survey also assessed various aspects of well-being, including migration status, education attainment, labor market participation, housing conditions; household and enterprise asset holdings and qualitative welfare indicators. Organization of the Report
The rest of this report is organized as follows. In section 2, we profile households’ familiarity with ongoing oil activities as well as observed changes in the availability of commodities since oil exploration activities started in 2008. Section 3 examines perceptions regarding the government’s preparations for oil production activities as well as its ability to manage oil revenues. This section also examines communities’ level of trust for their elected leaders to make appropriate decisions regarding the management of oil resources. Section 3 then analyzes who should address the issues/concerns arising from oil activities. Section 4 examines various expectations related to the use of oil resources—ranging from whether the poor will benefit to whether corruption will increase in government as a result of oil projects. Section 5 concludes and offers policy options.
NAT
UR
AL
RES
OU
RC
E M
AN
AG
EMEN
T IN
TH
E A
LBER
TIN
E G
RA
BEN
REG
ION
OF
UG
AN
DA
:Ba
selin
e Su
rvey
Rep
ort
Febr
uary
, 201
5
6
2. Familiarity with Oil Activities and Observed Changes since 2008
Familiarity with Oil Operations in the Albertine Region
An assessment of the perceived and anticipated effects of oil activities on the Ugandan public must start with an understanding of the public’s awareness and knowledge of these activities. Table 2 shows that 60 percent of all individuals interviewed are aware of ongoing oil operations but without specific knowledge of the various operations and activities being undertaken. Those who are familiar with some of the on-going oil operations account for 29 percent of respondents, while 11 percent have never heard of oil operations. Assuming that urban households have more and better access to information than rural households, they would be expected to be quite conversant with ongoing oil activities.6 Contrary to this supposition, 51 percent of urban respondents are not familiar with specific oil operations, 37 percent are familiar with and knowledgeable of some operations and 11 percent have never heard of the ongoing oil activities. Conversely, 62 percent of rural Individuals have heard of oil exploration/discovery but are not familiar with specific operations, 28 percent are familiar and 10 percent have absolutely no information on oil activities. In districts where oil deposits have been confirmed, only 35 percent of respondents are familiar with oil-related operations. Those who have never heard of and those who are aware of but are not familiar with specific oil operations being undertaken accounted for 8 and 57 percent, respectively.
With higher levels of education, there was a noted increase in the proportion of respondents familiar with oil operations. The proportion of respondents who are aware of ongoing oil operations but are not familiar with specific actions being undertaken is, respectively, 64, 62, 54 and 53 percent among those with no schooling, primary school, and O-level and A-level education categories. Familiarity with oil operations is recorded by 25 percent of respondents with no schooling, 28 percent with primary school, 36 percent with O-levels and 34 percent with A-levels and above. In addition to this, support for oil operations ranges between 46 and 49 percent of respondents for all education categories, while opposition to oil operations ranges between 12 and 15 percent of respondents across all levels of education.
When familiarity was examined through respondents’ wealth/income levels, the baseline results show that 68 percent and 51 percent of those in quintiles 1 and 5, respectively, have heard about ongoing oil operations but have no specific knowledge of activities being undertaken. Familiarity with oil operations ranges from 35 percent of respondents in
6 Following the 2014 Uganda Population and Housing Census (which was the basis for the sampling frame used in the NRM survey), urban areas are defined to include only the gazetted urban centers (city, municipalities, town councils and town boards). By August 2014, there were 197 urban centers, including 1 capital city, 22 municipalities and 179 town councils. See Uganda Bureau of Statistics, Uganda Population and Housing Census 2014: Provisional Results Report (Kampala: Uganda Bureau of Statistics, 2014).
NATU
RA
L RESO
UR
CE M
AN
AG
EMEN
T IN TH
E ALB
ERTIN
E GR
AB
EN R
EGIO
N O
F UG
AN
DA
:Baseline Survey Report February, 2015
7
quintile 5 to 23 percent in quintile 1.
Support for oil operation in the Albertine Region
The survey also inquired the extent to which residents of the oil exploration districts generally support on-going activities. Specifically, the survey asked “Today, to what extent do you support or oppose oil developments in your area?”. The possible answers ranged from oppose strongly to strongly support, including do not know. The analysis revealed that at least 70 percent of respondents support ongoing oil activities in Uganda, and these are composed of 22 percent who feel “strong support” as well as 48 percent who support the activities, though not strongly. At least 14 percent of the respondents oppose the activities, while 10 percent are indifferent to them. No differences were observed between the proportion of those who support, strongly support, oppose or are indifferent to oil operations by gender. Conversely, a slightly higher proportion of urban dwellers than rural dwellers support or strongly support oil operations in Uganda. Furthermore, 49 percent, 21 percent, 15 percent and 10 percent of respondents in oil-rich districts respectively support, strongly support, oppose or are indifferent to oil operations.
The proportion of respondents supporting or strongly supporting oil operations rises as wealth levels increase, with 59, 62, 71, 73 and 75 percent of those in, respectively, quintiles 1, 2, 3, 4 and 5 supporting oil activities. Opposition to oil operations in Uganda is low across all levels of wealth, ranging from 17 to 9 percent; the 9 percent was recorded in the highest wealth quintile.
Changes in livelihoods after since commencement of oil exploration activities
Information was also collected from households in the oil districts regarding any perceived change in livelihood status. Specifically, households were asked “On the whole, how, if at all would you say your life has changed since oil operations (including exploration work) began?”. The possible answers were: (a) my life is a lot worse; (b) my life is somewhat worse; (c) my life has not changed; (d) my life is somewhat better; and my life is better. The analysis revealed that since oil operations started, livelihoods were reported not to have changed, improved or worsened by, respectively, 87, 8 and 5 percent of respondents for the entire sample. Even within districts where oil deposits have been confirmed, changes in livelihoods was reported to have not changed, improved or worsened by, respectively, 84, 10 and 6 percent of respondents.
An improvement in livelihoods since oil operations started is reported by 14 and 12 percent of respondents who have attained O and A Levels of education, respectively.7
7 It should be noted that the reported changes are based on the respondent’s own self-assessment and are not attributed to any specific change (e.g., land values or business opportunities).
NAT
UR
AL
RES
OU
RC
E M
AN
AG
EMEN
T IN
TH
E A
LBER
TIN
E G
RA
BEN
REG
ION
OF
UG
AN
DA
:Ba
selin
e Su
rvey
Rep
ort
Febr
uary
, 201
5
8
However, only 7 percent of respondents with no schooling or primary school report an improvement in livelihood. No change of livelihood is reported by 90, 89, 81 and 82 percent of respondents with, respectively, no schooling, primary school and O-level and A-level categories of education.
Similar to what was observed in the education category, the majority of people across all wealth/income levels report that there has been no change in livelihood since oil operations started. This view is held by 92, 91, 86, 87 and 80 percent of respondents in, respectively, quintiles 1, 2, 3, 4 and 5. Accordingly, only 6 percent and 4 percent of respondents in, respectively, the first and second wealth quintiles report an improvement in livelihoods since oil activities commenced.

NATU
RA
L RESO
UR
CE M
AN
AG
EMEN
T IN TH
E ALB
ERTIN
E GR
AB
EN R
EGIO
N O
F UG
AN
DA
:Baseline Survey Report February, 2015
9
Tabl
e 2.
Kno
wle
dge
abou
t and
sup
port
for o
il ac
tiviti
es
A
ll Se
xLo
catio
nTy
pe o
f D
istr
ict
Hig
hest
Lev
el O
f Edu
ca-
tion
Atta
ined
Hou
seho
ld A
sset
Qun
-til
es
Mig
ratio
nEt
hinc
ity
Samp
ledMa
leFe
-ma
leUr
-ba
nRu
ral
Othe
rInt
er-
ven-
tion
No
Scho
ol-ing
Prim
ary
O- Leve
lA-
Leve
l+1
23
45
Non
Migr
ant
Bany
oro
Acho
liAl
urBa
nyak
oleBa
kiga
Bator
oBa
gung
uOt
her
Ethn
ic gr
oups
Kno
wle
dge
of o
il op
erat
ion
in th
e ar
ea
Hea
rd o
f it
but n
o sp
ecif-
ic k
now
ledg
e 60
5962
5162
7157
6462
5453
6863
5864
5161
5855
6462
1350
7769
62
Hav
e sp
ecifi
c kn
owle
dge
2931
2837
2811
3525
2836
3423
3033
2535
2932
3427
3059
4910
2921
N
ever
H
eard
, Don
t K
now
1010
1111
1018
811
1010
138
810
1114
1110
118
928
113
217
Sub
Tota
l10
010
010
010
010
010
010
010
010
010
010
010
010
010
010
010
010
010
010
010
010
010
010
010
010
0
Supp
ort f
or o
il ac
tiviti
es in
Uga
nda
Su
ppor
t48
4848
5148
4549
4948
4746
4455
4847
4748
4757
4840
5453
4039
49
Stro
ngly
Su
ppor
t22
2322
2622
2621
1922
2627
1517
2326
2821
2919
3318
2122
3214
24
O
ppos
e14
1414
1314
1215
1315
1412
1715
1714
915
129
1622
133
829
13
In
diffe
rent
1011
97
1010
1012
910
1316
77
614
107
90
1513
1616
148
D
ont K
now
55
62
67
56
64
28
55
72
65
63
60
74
46
Sub
Tota
l10
010
010
010
010
010
010
010
010
010
010
010
010
010
010
010
010
010
010
010
010
010
010
010
010
0
Cha
nges
In L
ivel
ihoo
d Si
nce
Oil
Ope
ratio
ns
Im
prov
ed8
89
108
410
77
1214
64
108
138
910
411
08
613
6
G
ot W
orse
56
55
53
63
48
53
55
57
57
62
50
70
143
N
o C
hang
e87
8787
8587
9384
9089
8182
9291
8687
8087
8484
9484
100
8694
7391
Sub
Tota
l10
010
010
010
010
010
010
010
010
010
010
010
010
010
010
010
010
010
010
010
010
010
010
010
010
0

NAT
UR
AL
RES
OU
RC
E M
AN
AG
EMEN
T IN
TH
E A
LBER
TIN
E G
RA
BEN
REG
ION
OF
UG
AN
DA
:Ba
selin
e Su
rvey
Rep
ort
Febr
uary
, 201
5
10
Changes in the Availability of Commodities since the Onset of Oil Exploration
Following the discovery of commercial deposits of oil in 2006, there was an intensification of oil exploration activities. These activities were accompanied by the migration of skilled personnel to manage and run the operations. As mentioned above, by 2008, communities in the Albertine region began to witness intensified oil exploration activities—often described by witnessing of movement of heavy machinery. This migration of highly skilled and better-paid employees has the potential to vastly affect the livelihoods of natives, especially when it comes to the cost of acquiring goods and services. In the questionnaire, households in the oil district were asked if they had witnessed any changes in the availability and costs of food and beverages, other nonfood household products, accommodations, and transportation services.
Figure 1 shows the distribution of the perceived changes in the availability of commodities—that is, whether the availability of various items increased or decreased, there was no change, or if the respondents did not know. Overall, a large proportion of households report an increase in the availability of commodities including food and beverages, other nonfood products, accommodations and transportation between 2008 and 2014. At least 55 percent of the households report an increase in the availability of food and nonfood products; 46 percent report an increase in the availability of accommodation; and 64 percent report an increase in the availability of transportation services. Conversely, a substantial proportion of households; that is, 18, 22, 33 and 19 percent of households indicate, respectively, that there were no changes in the availability of food and beverages, other nonfood products, accommodations and transportation.8
By gender, the distribution for reported changes was similar for all four products and services. Conversely, the share of households reporting an increase in the availability of all commodities is slightly higher in urban areas than rural areas. Specifically, urban dwellers reported an increase in food and beverages, other nonfood products, accommodations and transportation by, respectively, 65, 67, 65 and 78 percent of households. In comparison, an increase in the availability of food and beverages and nonfood products is reported by only 54 percent of rural dwellers. Accommodations and transportation availability is reported to have increased by 43 percent and 62 percent of households, respectively. Finally, the proportion of households reporting no change in availability for all commodities is slightly higher among rural than urban dwellers.
8 It is worth noting that in the survey, there was no distinction between physical availability and price—the goods could be available but the prices could be out of reach. It is possible that the increased availability of goods is a result of suppliers responding to exploit the market opportunity; nonetheless, this could have be achieved at a cost particularly to the indigenous populations. It is also possible that increased availability can be a result of higher production by the locals with expected positive externalities for the local population in terms of welfare.

NATU
RA
L RESO
UR
CE M
AN
AG
EMEN
T IN TH
E ALB
ERTIN
E GR
AB
EN R
EGIO
N O
F UG
AN
DA
:Baseline Survey Report February, 2015
11
Figure 1. Changes in the Availability of Household Products and Services between 2008 and 2014 (percent)
Source: Author’s calculations from the NRM Baseline survey

NAT
UR
AL
RES
OU
RC
E M
AN
AG
EMEN
T IN
TH
E A
LBER
TIN
E G
RA
BEN
REG
ION
OF
UG
AN
DA
:Ba
selin
e Su
rvey
Rep
ort
Febr
uary
, 201
5
12
The reported changes in the availability of commodities between 2008 and 2014 showed similarity across different households’ welfare quintiles. Across all the quintiles, the largest proportion of households report food availability to have increased (ranging between 51 percent and 58 percent). Households reporting a decrease in the availability of food and beverages constituted the second-largest proportion (ranging between 21 and 24 percent), followed by those who reported no changes (ranging between 17 and 20 percent). In the case of change in the availability of other nonfood products, the largest proportion of households reported an increase. No change observed and decrease in availability of other nonfood products constituted, respectively, the second- and third-largest proportions of households. Changes in the availability of accommodations and transportation show similar patterns in proportions of households. In both cases, most households report an increase in availability. Those that report no change, and those that did not know if any changes had occurred, account for, respectively, the second- and third-largest proportions of households.
Although the largest proportions of households across quintiles report an increase in the availability of commodities, an increase in the availability of transportation has the highest proportion across quintiles. An increase in the availability of commodities has the highest proportion of households among the top wealth quintile. Conversely, the bottom quintile has the lowest proportion of households reporting an increase in availability for all commodities as well as the highest proportion of households reporting no change in the availability for all commodities.
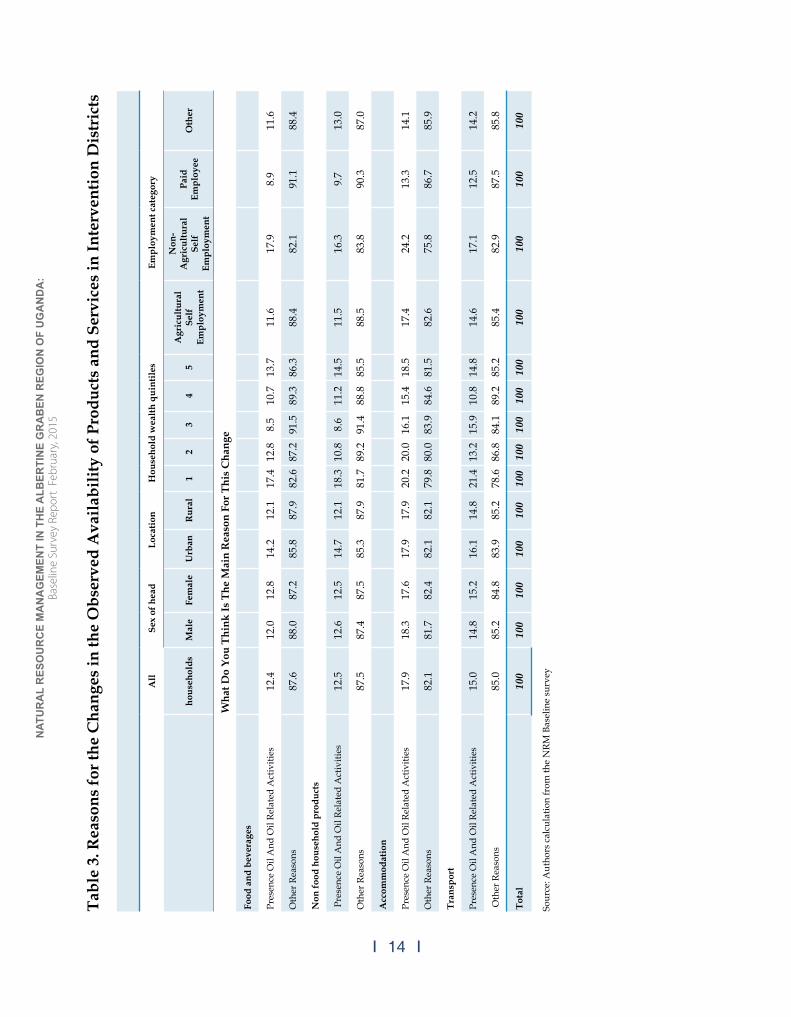
For households in the intervention districts that reported any changes in the availability of commodities, the survey inquired whether the respondents considered the change to be due to the presence of oil and oil-related activities in the region. Table 3 shows the reasons households gave to account for the noted changes in the availability of various goods and services. Most households associate changes in the availability of products/services with reasons other than the presence of oil and oil-related activities. Only about an eighth of all households associate the observed changes in the availability of food and beverages, and other nonfood products to the presence of oil and oil-related activities. The proportions of households who associate changes in the availability of accommodations and transportation with the presence of oil and oil-related activities are slightly higher than those who associate the same reason to a change in the observed availability of food and beverages, and other nonfood products. No notable differences are observed between different sexes on drivers of change in the availability of commodities.
With regard to respondents indicating no change in the availability of commodities, accommodation has the lowest proportion, which ranged between 30 to 35 percent. However, it is important to note that accommodations may not comparable to many other services—especially given that most residents of the area already have their own homes.

NATU
RA
L RESO
UR
CE M
AN
AG
EMEN
T IN TH
E ALB
ERTIN
E GR
AB
EN R
EGIO
N O
F UG
AN
DA
:Baseline Survey Report February, 2015
13
Indeed, at least 83 percent of the surveyed households were “owner occupiers.”
With regard to wealth status, again, most households associate changes in the availability of all commodities with reasons other than the presence of oil and oil-related activities. The proportions of households that associate changes in the availability of food and beverages with the presence of oil range between 8 and 17 percent among the different quintiles. Changes in the availability of other nonfood products is credited to the presence of oil by about 15 percent of households. A slightly higher proportion of households in all quintiles associate changes in the availability of accommodation with the presence of oil. A total of 8 and 9 percent of households in the third quintile of wealth associate changes in the availability of food and beverages, and other nonfood products, with the presence of oil.9
Turning to employment status, changes in the availability of food and beverages, other nonfood products, accommodations and transportation are associated with the presence of oil and associated exploration activities by, respectively, 18, 16, 24 and 17 percent of households involved in nonagricultural self-employment. Twelve percent of households engaged in agricultural self-employment attribute the changes in the availability of food and beverages, and other nonfood products, with the presence of oil. Changes in the availability of accommodations and transportation are attributed to reasons other than the presence of oil by, respectively, 81 and 84 percent of the agriculturally self-employed.
9 It is worth noting that respondents were asked whether the observed changes were due to oil-related activities or other reasons. The survey did not collect further information on the specifics of “other reasons.”
NAT
UR
AL
RES
OU
RC
E M
AN
AG
EMEN
T IN
TH
E A
LBER
TIN
E G
RA
BEN
REG
ION
OF
UG
AN
DA
:Ba
selin
e Su
rvey
Rep
ort
Febr
uary
, 201
5
14
Tabl
e 3.
Rea
sons
for t
he C
hang
es in
the
Obs
erve
d A
vaila
bilit
y of
Pro
duct
s an
d Se
rvic
es in
Inte
rven
tion
Dis
tric
ts
A
ll Se
x of
hea
dLo
catio
nH
ouse
hold
wea
lth q
uint
iles
Empl
oym
ent c
ateg
ory
hous
ehol
dsM
ale
Fem
ale
Urb
anR
ural
12
34
5A
gric
ultu
ral
Self
Em
ploy
men
t
Non
-A
gric
ultu
ral
Self
Em
ploy
men
t
Paid
Em
ploy
eeO
ther
W
hat D
o Yo
u Th
ink
Is T
he M
ain
Rea
son
For T
his
Cha
nge
Food
and
bev
erag
es
Pres
ence
Oil
And
Oil
Rela
ted
Act
iviti
es12
.412
.012
.814
.212
.117
.412
.88.
510
.713
.711
.617
.98.
911
.6
Oth
er R
easo
ns87
.688
.087
.285
.887
.982
.687
.291
.589
.386
.388
.482
.191
.188
.4
Non
food
hou
seho
ld p
rodu
cts
Pre
senc
e O
il A
nd O
il Re
late
d A
ctiv
ities
12.5
12.6
12.5
14.7
12.1
18.3
10.8
8.6
11.2
14.5
11.5
16.3
9.7
13.0
Oth
er R
easo
ns87
.587
.487
.585
.387
.981
.789
.291
.488
.885
.588
.583
.890
.387
.0
Acc
omm
odat
ion
Pres
ence
Oil
And
Oil
Rela
ted
Act
iviti
es17
.918
.317
.617
.917
.920
.220
.016
.115
.418
.517
.424
.213
.314
.1
Oth
er R
easo
ns82
.181
.782
.482
.182
.179
.880
.083
.984
.681
.582
.675
.886
.785
.9
Tran
spor
t
Pres
ence
Oil
And
Oil
Rela
ted
Act
iviti
es15
.014
.815
.216
.114
.821
.413
.215
.910
.814
.814
.617
.112
.514
.2
Oth
er R
easo
ns85
.085
.284
.883
.985
.278
.686
.884
.189
.285
.285
.482
.987
.585
.8
Tota
l10
010
010
010
010
010
010
010
010
010
010
010
010
010
0
Sour
ce: A
utho
rs c
alcu
latio
n fr
om th
e N
RM B
asel
ine
surv
ey

NATU
RA
L RESO
UR
CE M
AN
AG
EMEN
T IN TH
E ALB
ERTIN
E GR
AB
EN R
EGIO
N O
F UG
AN
DA
:Baseline Survey Report February, 2015
15
3. Readiness and Trust for Leaders Regarding Oil Regulations and Production
This section delves into issues of the perceptions about community consultations on oil activities but also explores issues related to Uganda’s readiness for oil production and the trust community members have that their leaders will deliver regulations that are responsive to their needs and concerns.
Readiness for Oil Activities in Uganda
Readiness for oil activities was assessed by two measures, the first being the extent to which people agreed that the country was adequately prepared for oil production, and the second being the extent to which they thought government was capable of successfully managing oil revenues. What follows is a breakdown of the different responses to these measures across the above-mentioned population categories—gender, geographical location, education, and so on.
Figure 2 shows that for all responses, there are few or no differences between men and women with regard to how prepared they think the government and the country were for oil production. Figure 2 also shows that there are no notable gender divisions regarding how much the surveyed individuals trust the authorities to adequately manage oil revenues and resources; about 55 percent of both women and men agree that the country was prepared for oil production, while 29 percent of men and 31 percent of women are
Figure 2. Uganda’s Readiness for Oil Activities

NAT
UR
AL
RES
OU
RC
E M
AN
AG
EMEN
T IN
TH
E A
LBER
TIN
E G
RA
BEN
REG
ION
OF
UG
AN
DA
:Ba
selin
e Su
rvey
Rep
ort
Febr
uary
, 201
5
16
uncertain. There was less confidence in the extent to which government can manage oil revenues, with 45 percent of either sex agreeing that oil revenues would be well managed by the government.
However, there is a notable division on these two questions by geographical location—that is, by rural and urban dwellers. Although a similar percentage of people agree that the country was prepared for oil and that the government could manage the ensuing revenues well, only 11 percent of urban respondents “strongly agreed” with this notion in comparison with the 21 percent of rural respondents. In line with this trend, urban dwellers are more skeptical than their rural counterparts of the government’s ability to manage oil revenues and of the country’s preparedness for oil production.
Both oil areas and non-oil districts had a similar outlook on how prepared they thought the country was for oil production, with an average of 28 percent (in each category) positive about the country’s readiness for production and with an average of only 7 percent in disagreement across both categories. However, oil districts are less optimistic about revenue management, with 41 percent of households in intervention areas agreeing that oil revenues could be well managed by the government, compared with 50 percent in other districts. In spite of this, responses between intervention and nonintervention were similar for those who doubted the government’s ability to manage oil revenues—respectively, 33 percent and 31 percent. On the whole, opinions in intervention areas are more uniform, with only a difference of 9 percent between those who are confident in the government’s ability to manage revenues and those who are doubtful (41 percent confident vs. 33 percent doubtful). In contrast to this, opinions are more split in nonintervention areas, with a difference of 19 percent between those in agreement and those in disagreement that the government could successfully manage oil revenues.
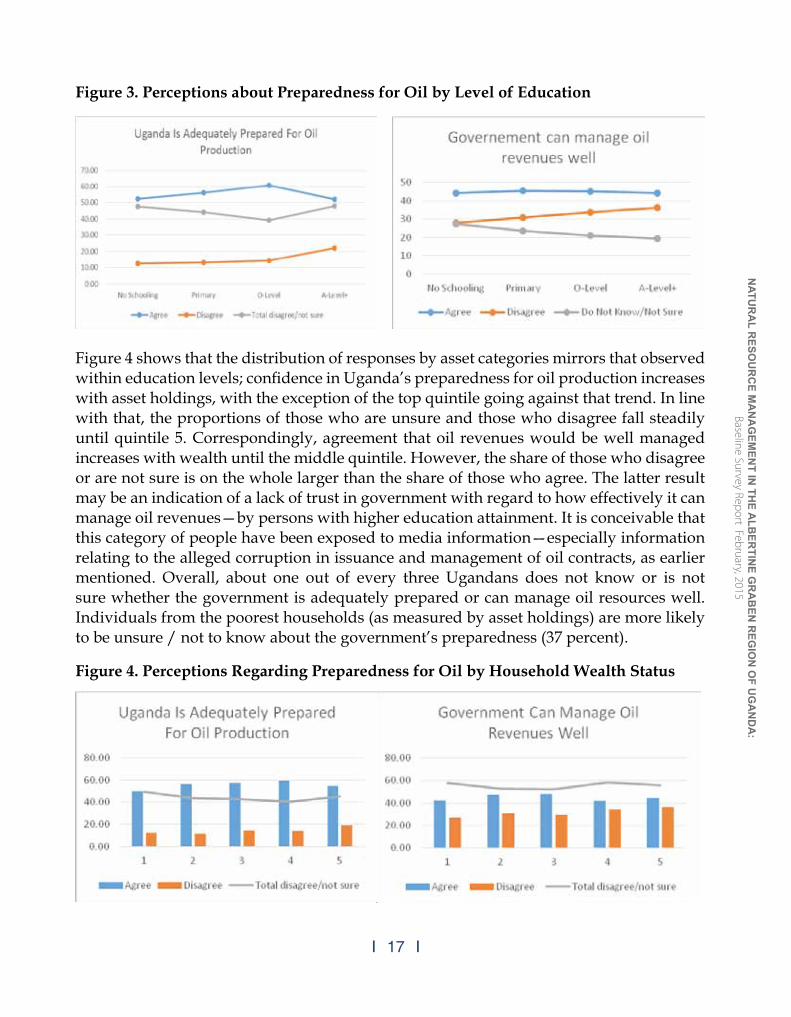
Turning to educational attainment, figure 3 shows that confidence in Uganda’s preparedness for oil production rises as the education level of respondents increases, with the exception of those with A-level qualifications and above bucking the trend. Individuals with an O-Level education were significantly positive, with 60 percent agreeing that the country is well prepared for oil production. This represents one of the most positive responses to the readiness measures across all demographic categories. Uncertainty vis-à-vis both measures of readiness rises with an increase in the level of education, while uncertainty decreases with education across both measures. In particular, 36 percent of the respondents with A-level qualifications and above disagreed with the idea that the government was capable of managing oil revenues well.
NATU
RA
L RESO
UR
CE M
AN
AG
EMEN
T IN TH
E ALB
ERTIN
E GR
AB
EN R
EGIO
N O
F UG
AN
DA
:Baseline Survey Report February, 2015
17
Figure 4 shows that the distribution of responses by asset categories mirrors that observed within education levels; confidence in Uganda’s preparedness for oil production increases with asset holdings, with the exception of the top quintile going against that trend. In line with that, the proportions of those who are unsure and those who disagree fall steadily until quintile 5. Correspondingly, agreement that oil revenues would be well managed increases with wealth until the middle quintile. However, the share of those who disagree or are not sure is on the whole larger than the share of those who agree. The latter result may be an indication of a lack of trust in government with regard to how effectively it can manage oil revenues—by persons with higher education attainment. It is conceivable that this category of people have been exposed to media information—especially information relating to the alleged corruption in issuance and management of oil contracts, as earlier mentioned. Overall, about one out of every three Ugandans does not know or is not sure whether the government is adequately prepared or can manage oil resources well. Individuals from the poorest households (as measured by asset holdings) are more likely to be unsure / not to know about the government’s preparedness (37 percent).
Figure 3. Perceptions about Preparedness for Oil by Level of Education
Figure 4. Perceptions Regarding Preparedness for Oil by Household Wealth Status

NAT
UR
AL
RES
OU
RC
E M
AN
AG
EMEN
T IN
TH
E A
LBER
TIN
E G
RA
BEN
REG
ION
OF
UG
AN
DA
:Ba
selin
e Su
rvey
Rep
ort
Febr
uary
, 201
5
18
Based on employment status, the results (not displayed in the tables and figures) show that the two categories of self-employed people have a similar response to the readiness measures, with 57 percent in either category in agreement that Uganda was ready for oil production and 45 percent (self-employment) and 48 percent (nonagricultural self-employment) positive about the government’s ability to suitably manage oil revenues. Only 52 percent of paid employees responded in agreement that Uganda was ready for oil production. In a similar trend to those in self-employment, a lower share of those in paid employment—39 percent—agree that the government is capable of managing oil revenues. Those in nonagricultural self-employment and paid employment are more inclined to disagree with both readiness measures, while uncertainty for both measures is most prevalent in the agricultural self-employment category.
An examination of the three previous categories (education, income/assets and employment) reveals that as the levels of those categories initially rise, so does the confidence in the assertion that “Uganda is prepared for oil production.” Working from the supposition that those with a higher level of education are most likely to be those in paid employment and also those with the most assets and vice versa, it appears that confidence in Uganda’s preparedness for oil production and managing the revenues earned from it is limited to the top asset/income, education and employment bracket. From these three categories, the middle bracket in each is the most optimistic about the prospect of oil, with the upper bracket accordingly being the most skeptical.
Given Ugandans’ attachment to ethnicity and cultural heritage, the baseline explored if and how perceptions of oil exploration vary across ethnic groups. Respondents were asked to indicate their main ethnic group in order to gauge whether views varied across groups. The responses (not shown in the tables and figures) indicate that the Alur (66 percent) and the Batoro (60 percent) are the ethnic groups that are most positive (i.e., agree or strongly agree) about Uganda’s preparedness for oil production, while the Banyankole are the most unsure (43 percent) and the Bagungu (21 percent) are the most negative. As a whole, all ethnic groups are less confident about the government’s readiness to manage oil revenues compared with preparedness for oil production. For instance, whereas only 5 percent of the Alur disagree with the view that Uganda is prepared for oil production, a much larger 29 percent disagree with the view that the government would be able to manage oil revenues well. Taking both readiness measures into consideration, the ethnic group that is most confident in the government preparedness for oil and the subsequent revenues is the Batoro, at 57 percent. Nonetheless, as indicated in table 1, which gives average statistics, the Batoro are resident in nonintervention districts.10
Working from the assumption that the majority of those who migrated into oil-rich
10 The three main ethnic groups in the intervention districts are Banyoro (35.8 percent), Acholi (21.2 percent) and Alur (17.6 percent). Together, the three dominant ethnic groups account for 74 percent of the households surveyed in the intervention districts.

NATU
RA
L RESO
UR
CE M
AN
AG
EMEN
T IN TH
E ALB
ERTIN
E GR
AB
EN R
EGIO
N O
F UG
AN
DA
:Baseline Survey Report February, 2015
19
areas did so in anticipation of a better financial life as a result of the projected increase in economic activity in the regions, one would expect the responses from migrants to be significantly more positive for the readiness measures. However, migrant status did not seem to be a major determining factor for respondents’ perceptions, with both migrants and nonmigrants optimistic about the country’s preparedness for oil production, although nonmigrants were more so (Figure 5). Both categories are less confident about the government’s capacity to manage oil revenues. Whereas 44 percent (nonmigrants) and 48 percent (migrants) disagree or are not sure if the country was ready for oil production, 55 percent (nonmigrants) and 55 percent (migrants) disagree or are uncertain of the government’s ability to proficiently manage oil revenues. It is possible to hypothesize that migrants could also be facing frustration because it may be taking longer to reap the expected benefits—in this sense, they could consider the government as not ready—especially after making the costly migration decision.
The discussion above is a clear illustration of a trend that cuts across all the respondent categories—gender, education, income, ethnicity, and so on. On average, 56 percent agree that the country was ready for oil production, but only 44 percent believe the government was ready to manage the resulting revenues. Similarly, though only an average of 45 percent disagree or are unsure about the country’s preparedness for oil production; 56 percent disagreed or were uncertain about the government’s ability to manage oil revenues. Overall, this signifies a lack of confidence in the Ugandan government to effectively and
Figure 5: Opinion regarding readiness by migration status (%).

NAT
UR
AL
RES
OU
RC
E M
AN
AG
EMEN
T IN
TH
E A
LBER
TIN
E G
RA
BEN
REG
ION
OF
UG
AN
DA
:Ba
selin
e Su
rvey
Rep
ort
Febr
uary
, 201
5
20
efficiently manage the funds and revenues generated from oil production.
The lack of confidence may suggest a communication gap between the GoU and communities in the oil districts. In particular, the government may not be adequately informing and updating the host communities regarding on-going and future oil operations and this may cloud the opinion of communities regarding the government’s abilities. Nonetheless, it is not only communities that express a lack of knowledge of what to expect from oil operations. The 2013 Industrial Baseline Survey by the International Oil Companies (IOC) in Uganda revealed that major industrial groups in Uganda cite a lack of knowledge as the leading barrier for participating in oil operations. Specifically, the Ugandan companies mention “a lack of visibility on future oil and gas projects. When will the needs start? What type of products and services will be required? At which standards? Timeline? Quantities…?” and this is attributed a communication gap between IOCs and Ugandan entrepreneurs.11In line with this, the next section examines trust between individuals and those are the various levels of government who would ultimately be in charge of revenue management.
Trust for Leaders by Communities
This section looks at which institutions and levels of government people trust to make laws and strategic decisions concerning the management of oil resources and the resulting revenues. The institutions considered were the local government structures i.e. Local Council 1 (LC1 ), Local Council III (LC3) and district executive (LC5) as well as non-local government institutions such as Members of Parliament (MPs) and the Petroleum Exploration and Production Department (PEPD). The inclusion of PEPD is due to the institution key role in negotiating and enforcing oil contracts in Uganda. At the aggregate level, the survey results indicate three emerging trends: (1) The majority of respondents trust their leaders, especially the locally elected leaders, with regard to coming up with appropriate laws; (2) the Petroleum Department is trusted highly, but not as much as the locally elected leaders; and (3) respondents express even higher trust in the village local councils, as shown in figure 6.
Indeed, the extent to which respondents expressed their trust in leaders decreases with the seniority of leadership: local village council leaders are trusted the most, and then, as shown in figure 4, Local Council 3 (LC3), Local Council 5 (LC5), members of Parliament (MPs) and the Petroleum Exploration and Production Department (PEPD) respectively follow in that order. Overall, people are most trusting of LC1, with an average of 67 percent agreeing that they would trust them to make appropriate laws relating to oil activities. MPs were generally the least trusted, along with the Petroleum Department, although not by a wide margin. Nonetheless, this implies that the community is more likely to trust leaders and institutions that are perceived to be closer than those perceived to be far off, possibly because the closer institutions would better understand and therefore make laws 11 Total, Tullow and CNOOC (2013) Industrial Baseline Survey in Uganda Report
NATU
RA
L RESO
UR
CE M
AN
AG
EMEN
T IN TH
E ALB
ERTIN
E GR
AB
EN R
EGIO
N O
F UG
AN
DA
:Baseline Survey Report February, 2015
21
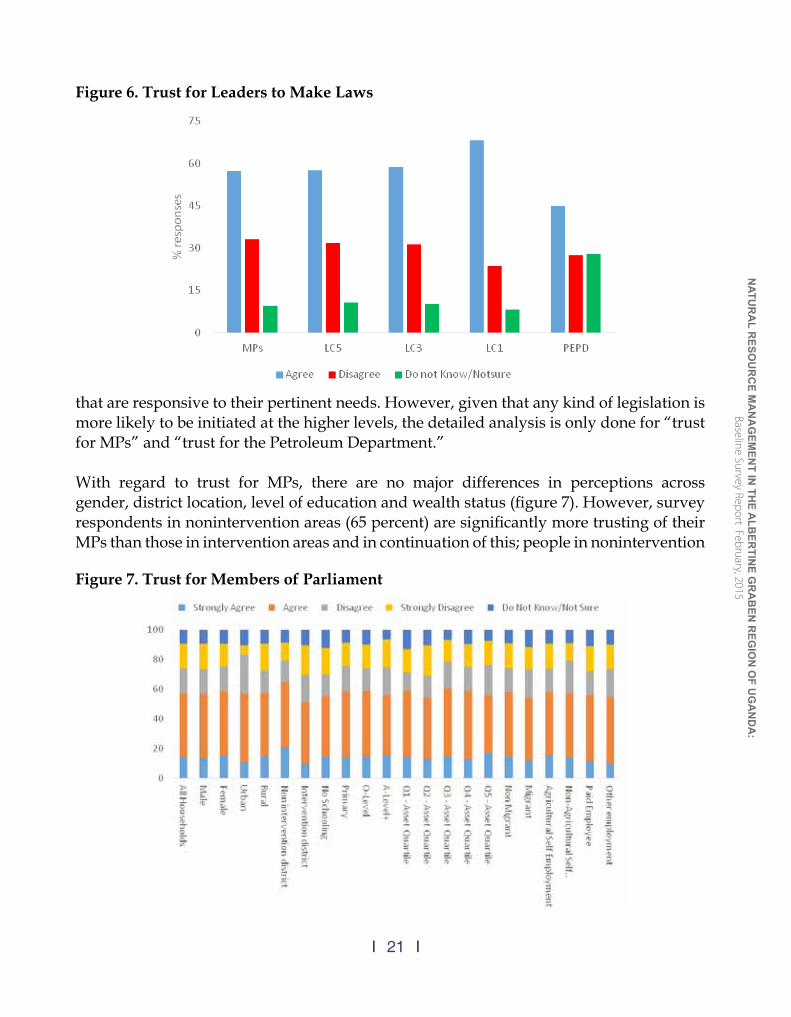
that are responsive to their pertinent needs. However, given that any kind of legislation is more likely to be initiated at the higher levels, the detailed analysis is only done for “trust for MPs” and “trust for the Petroleum Department.”
With regard to trust for MPs, there are no major differences in perceptions across gender, district location, level of education and wealth status (figure 7). However, survey respondents in nonintervention areas (65 percent) are significantly more trusting of their MPs than those in intervention areas and in continuation of this; people in nonintervention
Figure 6. Trust for Leaders to Make Laws
Figure 7. Trust for Members of Parliament
NAT
UR
AL
RES
OU
RC
E M
AN
AG
EMEN
T IN
TH
E A
LBER
TIN
E G
RA
BEN
REG
ION
OF
UG
AN
DA
:Ba
selin
e Su
rvey
Rep
ort
Febr
uary
, 201
5
22
areas are noticeably more trusting vis-à-vis all levels of governing authorities than those in intervention areas. In addition, respondents in urban areas express distrust in the ability (26 percent) of their MPs to make appropriate laws to manage oil resources.
Insofar as trusting MPs is concerned, there are major variations between the ethnicities (not shown in figure 6); the Banyankole (77 percent) and the Acholi (72 percent) record significantly more trust for MPs than all the other ethnicities, with the Bagungu recording the most distrust, and the Bagungu being predominantly residents in intervention districts.12
Urban residents are less trusting of the Locla Council 1s, with 40 percent doubting the LCs’ ability to implement appropriate laws in comparison with the 31 percent rural residents who distrusted the LCs. There are no significant differences in trust by levels of education; however, overall, those with A-levels and further qualifications are least trusting of their LCs and MPs. The middle-income bracket—asset quintile 3—is notably more trusting of the LC5 committee than people in all the other brackets, with 65 percent agreeing that the LC5 could do a good job at passing appropriate laws. Once again, the Banyoro (71 percent) and the Banyankole (83 percent) are more confident in their LC1 authority, in stark contrast to the Batoro (59 percent) and the Bagungu (56 percent).
Perhaps not surprisingly, respondents express the least trust in the Petroleum Department to be able to make appropriate laws to manage oil resources. A significant proportion of respondents (28 percent) either do not know or are not sure if they can trust the Petroleum Exploration and Production Department. This could be due to the fact that most people do not easily identify with the department and thus is not necessarily a testament to its limited capacity to legislate on oil management issues. Also, the less favourable rating of the PEPD could be attributed to the fact that it is not a widely recognized lawmaking body. Furthermore, the PEPD mainly interfaces with IOCs and government departments. Its activities at the community level are indirect through local governments. However, there are no significant differences in respondents’ perceived trust for the Petroleum Department with respect to gender, area of residence (rural/urban), district location (intervention/nonintervention), education, wealth and employment status (figure 8).
Perceptions Regarding the Addressing of Oil Concerns
Another important dimension that can illustrate the community’s level of trust for its leaders is whom its members believe can address their concerns. For example, if the members of a community had concerns about oil activities, where would they mainly go? Or if oil companies wanted to contribute to socioeconomic development, whom do the community’s members feel should represent them? These questions were analyzed
12 At least 93 percent of the respondents who subscribe to the Bagungu ethnicity are resident in intervention districts—especially in the Buliisa district.

NATU
RA
L RESO
UR
CE M
AN
AG
EMEN
T IN TH
E ALB
ERTIN
E GR
AB
EN R
EGIO
N O
F UG
AN
DA
:Baseline Survey Report February, 2015
23
to further explore the extent to which communities have trust for various leadership structures.
Results from this analysis confirm earlier findings that communities tend to trust local elected leaders. As shown in figure 8, to express concerns about oil activities, up to 60 percent of respondents prefer to go to their LC1, 18 percent would report to the district, and only 8 and 2 percent would report to the central government and police.
Figure 8. Trust for the Petroleum Exploration and Production Department
Figure 9. Where Would You Mainly Go to Express Oil-Related Concerns?
NAT
UR
AL
RES
OU
RC
E M
AN
AG
EMEN
T IN
TH
E A
LBER
TIN
E G
RA
BEN
REG
ION
OF
UG
AN
DA
:Ba
selin
e Su
rvey
Rep
ort
Febr
uary
, 201
5
24
The differences in the actual perceptions are associated with education, wealth and place of residence (rural/urban). For example, households with higher levels of education and that are better endowed with assets indicate a preference to report to the central government or district; households located in urban areas are less likely to express their concerns with the LC; and poorer households indicate a preference for LCs. There is little variation in the responses to this; however, those with no schooling are significantly more confident in the LCs, with 67 percent of them (higher than average) willing to take their concerns to the LC. Notably, those with A-Level qualifications and above are well below average, at 44 percent, and have more people looking to take their worries and grievances to the district / local government than any other category—28 percent—which is well over the average of 18 percent. The oil companies and the central government are the two places people are least likely to take their concerns.
Respondents from the poorest households (quintile 1) record a significantly higher response to taking their concerns to the LC (71 percent); in fact, the lower the asset quintile, the more people are likely to take their issues to the LC. The number of people likely to take their issues to the LC decreases as the asset level goes up, and only 43 percent of those in top quintile are likely to take their concerns to the LC. This is less than the 59 percent average but also significantly lower than the 71 percent response by those in quintile 1. This could be partly explained by the location of LCs in comparison with other elected representatives; it is easier to access LCs and more costly to reach other representatives who are not locally domiciled.
On the whole, an average of 65 percent feel that their concerns about oil-related activity would be acted on by someone. The majority of people (average of 63 percent) felt that their communities should be represented by the LC1 in the event that the oil companies wanted to contribute to development in the area. Interestingly, on average, only 14 percent felt that all members of the village should be involved in the negotiations.
The extent to which the community members trust their leadership is further confirmed by the fact that 66 percent of respondents believe that their concerns would be addressed, while the remaining 34 percent believe that their concerns would not be attended to (figure 10 below).
Decision making Regarding Oil Activities
Once again, the majority of people side with the village Local Council 1 when deciding who they thought should manage the funds if an oil company were to spend money in the community. Urban residents record the least positive responses to the LC1, with only 38 percent choosing the LC, a figure well below the general average of 49 percent but also significantly lower than the 52 percent of rural residents who think the LC1 was best suited for the task. In line with this, urban residents are the category that most leaned

NATU
RA
L RESO
UR
CE M
AN
AG
EMEN
T IN TH
E ALB
ERTIN
E GR
AB
EN R
EGIO
N O
F UG
AN
DA
:Baseline Survey Report February, 2015
25
toward the company spending the money in the community, at 34 percent, which is above the average 27 percent of the other respondents. Similarly, the Ankole (46 percent) and the Bangungu (42 percent) were the only groups to choose the company to manage the funds over the village LC1. It is worth noting that members of the Banyankole ethnic group are mainly resident in nonintervention districts, while the Bagungu, as mentioned above, are mainly resident in Buliisa—one of the three intervention districts.
Most respondents feel that it was the responsibility of the central government to address the negative effects of oil operations. Urban residents are the biggest proponents of this view, with 54 percent directing the responsibility to the central government, compared with only 34 percent of rural people; the Ankole share this view, with 65 percent agreeing that government should be responsible—figures that are well above the overall average of 38 percent. These results are in line with whom people saw as the main decisionmakers in their communities; 86 percent were of the view that the LC usually made the important decisions concerning local development.
The extent to which the community trusts its local leaders is further expressed in their confidence in the LC leaders (68 percent) to represent them in case oil companies wanted to contribute to local social and economic development programs in the area (figure 9). Further analysis indicates that the people who are less likely to trust the LC include those who reside in urban areas, the educated and the wealthy.
Given the high level of trust that communities have demonstrated in their local leaders in
Figure 10. Do You Think Your Concerns Would Be Addressed?

NAT
UR
AL
RES
OU
RC
E M
AN
AG
EMEN
T IN
TH
E A
LBER
TIN
E G
RA
BEN
REG
ION
OF
UG
AN
DA
:Ba
selin
e Su
rvey
Rep
ort
Febr
uary
, 201
5
26
LC1, it is not surprising that respondents feel that the LCs should manage any resources if an oil company decided to spend money in the community. Indeed, most respondents express the view that money should be managed by the village LC (50 percent) or the community (26 percent). The respondents who have expressed a preference for the money to be spent in the community are more likely to be educated and engaged in nonagricultural self-employment.
However, communities feel that it is the responsibility of the central government (37 percent of respondents) to address any negative effects of oil operations.13 Communities believe that the LCs (30 percent of respondents) would still have a big role to pay in case of an adverse impact of oil-related activities. District local governments (14 percent) and oil companies (9 percent) are considered as responsible for addressing any negative effects of oil-related activities (figure 10). In terms of distribution, the people who are more likely to favor the central government’s bearing the responsibility for any negative effects are likely to be the educated, wealthy and urbane and those who engage in nonagricultural employment.
13 This finding points to two competing theories: (1) Either communities feel that pollution and environmental damage are a public bad that can only be dealt with by government; or (2) communities can only trust government in negative situations, such as in the event of an adverse environmental impact.
Figure 11. Who should be Responsible for Addressing Any Negative Effects of Oil Operations?

NATU
RA
L RESO
UR
CE M
AN
AG
EMEN
T IN TH
E ALB
ERTIN
E GR
AB
EN R
EGIO
N O
F UG
AN
DA
:Baseline Survey Report February, 2015
27
An important finding that could explain the level of trust the community has for the LCs committees lies in their importance for delivering influential decisions that are beneficial to the communities. For example, up to 86 percent of respondents indicated that it is the LC committees that make the very important decisions about local development in the community. In terms of distribution across different subgroups, there are no major differences in expressed perceptions, except for the paid employee groups, which record a higher proportion, of 91 percent. By type of district, 83 percent of residents of intervention/oil districts indicate that it is the LCs that normally make important decisions on local development, compared with 90 percent for residents in non-oil districts.

NAT
UR
AL
RES
OU
RC
E M
AN
AG
EMEN
T IN
TH
E A
LBER
TIN
E G
RA
BEN
REG
ION
OF
UG
AN
DA
:Ba
selin
e Su
rvey
Rep
ort
Febr
uary
, 201
5
28
4. Expectations from Oil Activities/Revenues The Sharing of Oil Resources
The majority of respondents agree that all regions should benefit from oil revenues, although this was only a slight majority (46 percent), while 44 percent disagree and feel that only oil regions should benefit. There was significantly little support for the idea that distribution should be based on population—that is, places with more people should benefit the most. The above expressed opinions regarding revenue sharing are in contrast to the 2012 oil and gas revenue management policy which stipulates that “a maximum of 7 percent of royalty revenues arising from gross oil and gas production will be shared with local governments and communities, which will be directly affected by oil production. The remaining 93 percent is to be retained by the centre for the benefit of the entire country.”14
The sharpest contrasts in opinions are between rural and urban residents and between oil and non-oil districts. At least 63 percent of those living in urban areas express the view that oil regions should benefit more than other regions, while only 42 percent of their rural counterparts share this view. One of every two respondents in the oil districts are of the view that “those regions with oil activities should benefit more,” while only one out of three respondents in non-oil districts shares this view. In non-oil districts, the preference appears to be that all regions should benefit equally. In similar fashion, those with A-level qualifications and above are also of the opinion that regions with oil should benefit the most, with 54 percent of respondents taking this view—a percentage that is higher than all other levels of education.
Who Is Expected to Benefit from Oil Resources?
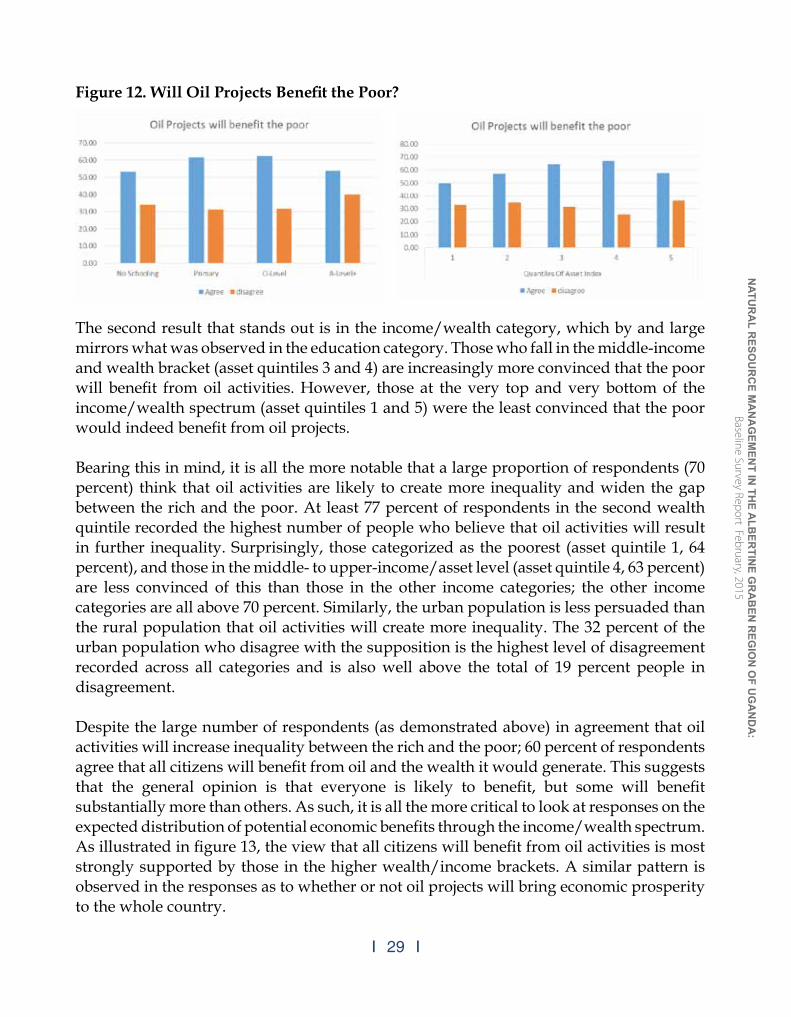
Most respondents—60 percent—agree that oil projects should benefit the poor. Although there are not significant differences in opinions on whether oil should benefit the poor, two strands of results stand out. The first is within the education-level category—where, as illustrated below, those in the middle of the education spectrum (primary school and O-level) were equally positive that oil would indeed benefit the poor. Interestingly, however, those with the highest level of education and those with no education have a similarly lower level of responsiveness to the view that oil projects will benefit the poor, as figure 12 shows.
14 Ministry of Finance Planning and Economic Development (2012) Oil and Gas Revenue Management Policy. http://www.petroleum.go.ug/uploads/resources/18.RevenueOilRevenueMgtPolicy_.pdf
NATU
RA
L RESO
UR
CE M
AN
AG
EMEN
T IN TH
E ALB
ERTIN
E GR
AB
EN R
EGIO
N O
F UG
AN
DA
:Baseline Survey Report February, 2015
29
The second result that stands out is in the income/wealth category, which by and large mirrors what was observed in the education category. Those who fall in the middle-income and wealth bracket (asset quintiles 3 and 4) are increasingly more convinced that the poor will benefit from oil activities. However, those at the very top and very bottom of the income/wealth spectrum (asset quintiles 1 and 5) were the least convinced that the poor would indeed benefit from oil projects.
Bearing this in mind, it is all the more notable that a large proportion of respondents (70 percent) think that oil activities are likely to create more inequality and widen the gap between the rich and the poor. At least 77 percent of respondents in the second wealth quintile recorded the highest number of people who believe that oil activities will result in further inequality. Surprisingly, those categorized as the poorest (asset quintile 1, 64 percent), and those in the middle- to upper-income/asset level (asset quintile 4, 63 percent) are less convinced of this than those in the other income categories; the other income categories are all above 70 percent. Similarly, the urban population is less persuaded than the rural population that oil activities will create more inequality. The 32 percent of the urban population who disagree with the supposition is the highest level of disagreement recorded across all categories and is also well above the total of 19 percent people in disagreement.
Despite the large number of respondents (as demonstrated above) in agreement that oil activities will increase inequality between the rich and the poor; 60 percent of respondents agree that all citizens will benefit from oil and the wealth it would generate. This suggests that the general opinion is that everyone is likely to benefit, but some will benefit substantially more than others. As such, it is all the more critical to look at responses on the expected distribution of potential economic benefits through the income/wealth spectrum. As illustrated in figure 13, the view that all citizens will benefit from oil activities is most strongly supported by those in the higher wealth/income brackets. A similar pattern is observed in the responses as to whether or not oil projects will bring economic prosperity to the whole country.
Figure 12. Will Oil Projects Benefit the Poor?

NAT
UR
AL
RES
OU
RC
E M
AN
AG
EMEN
T IN
TH
E A
LBER
TIN
E G
RA
BEN
REG
ION
OF
UG
AN
DA
:Ba
selin
e Su
rvey
Rep
ort
Febr
uary
, 201
5
30
Considering that those in asset quintiles 4 and 5 are the most likely to have higher education levels and the most likely to be in paid employment, this trend is apparent across the education and employment categories. While 68 percent of those with no education agree that oil projects would bring economic prosperity to the whole country, a larger proportion of those with education support the view—77 percent for primary school, O-level or A-level. Correspondingly, there is a larger proportion of those in paid employment (82 percent) who support this view than in all the other categories of employment—agricultural self-employment, 76 percent; and nonagricultural self-employment, 72 percent.
Even though 63 percent of respondents think that most of the financial revenue generated from oil projects would end up in the hands of foreign investors and firms, 68 percent think that from the remaining revenue, oil operations would still have positive social and economic effects on local villages. Significantly, in the urban/rural category, more rural residents than urban residents feel that foreign entities would receive most of the oil revenues. In a reversal of this, more urban than rural residents (76 and 66 percent, respectively) are of the view that oil projects would have a positive impact on local villages. In a manner observed above, those at the highest and lowest levels of education are equally less confident about the possibly positive economic and social effects than those with a mid-level education.
Although there are minimal differences in expectations about what will happen as a result of the exploitation of oil resources, residents of oil districts are generally less optimistic than their non-oil districts counterparts, the only exceptions are with regard to expectations of corruption and the expected benefits for foreign companies. Specifically, at least 74 percent residents of oil districts expect that oil projects will increase corruption in government, compared with 63 percent for residents in non-oil districts. Similarly, a high proportion of residents of oil districts (64 percent) agree that “most of the financial revenue generated from the oil projects will go to foreign companies,” compared with
Figure 13. The Expected Distribution of Benefits from Oil
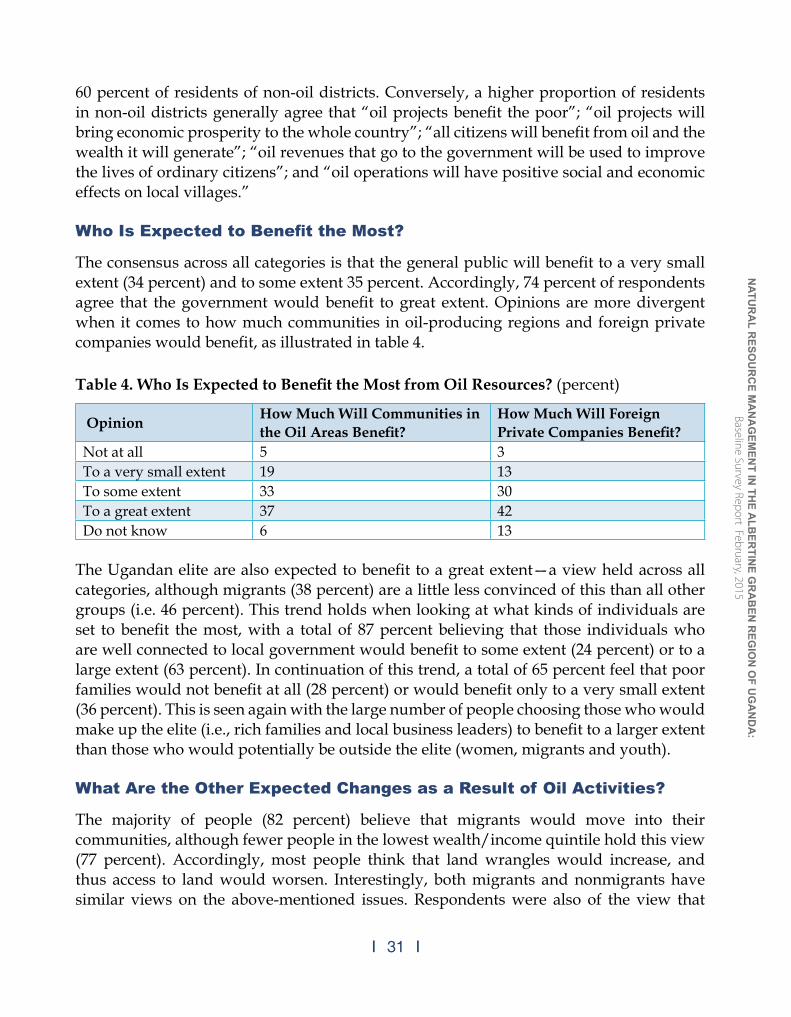
NATU
RA
L RESO
UR
CE M
AN
AG
EMEN
T IN TH
E ALB
ERTIN
E GR
AB
EN R
EGIO
N O
F UG
AN
DA
:Baseline Survey Report February, 2015
31
60 percent of residents of non-oil districts. Conversely, a higher proportion of residents in non-oil districts generally agree that “oil projects benefit the poor”; “oil projects will bring economic prosperity to the whole country”; “all citizens will benefit from oil and the wealth it will generate”; “oil revenues that go to the government will be used to improve the lives of ordinary citizens”; and “oil operations will have positive social and economic effects on local villages.”
Who Is Expected to Benefit the Most?
The consensus across all categories is that the general public will benefit to a very small extent (34 percent) and to some extent 35 percent. Accordingly, 74 percent of respondents agree that the government would benefit to great extent. Opinions are more divergent when it comes to how much communities in oil-producing regions and foreign private companies would benefit, as illustrated in table 4.
Table 4. Who Is Expected to Benefit the Most from Oil Resources? (percent)
Opinion How Much Will Communities in the Oil Areas Benefit?
How Much Will Foreign Private Companies Benefit?
Not at all 5 3To a very small extent 19 13To some extent 33 30To a great extent 37 42Do not know 6 13
The Ugandan elite are also expected to benefit to a great extent—a view held across all categories, although migrants (38 percent) are a little less convinced of this than all other groups (i.e. 46 percent). This trend holds when looking at what kinds of individuals are set to benefit the most, with a total of 87 percent believing that those individuals who are well connected to local government would benefit to some extent (24 percent) or to a large extent (63 percent). In continuation of this trend, a total of 65 percent feel that poor families would not benefit at all (28 percent) or would benefit only to a very small extent (36 percent). This is seen again with the large number of people choosing those who would make up the elite (i.e., rich families and local business leaders) to benefit to a larger extent than those who would potentially be outside the elite (women, migrants and youth).
What Are the Other Expected Changes as a Result of Oil Activities?
The majority of people (82 percent) believe that migrants would move into their communities, although fewer people in the lowest wealth/income quintile hold this view (77 percent). Accordingly, most people think that land wrangles would increase, and thus access to land would worsen. Interestingly, both migrants and nonmigrants have similar views on the above-mentioned issues. Respondents were also of the view that

NAT
UR
AL
RES
OU
RC
E M
AN
AG
EMEN
T IN
TH
E A
LBER
TIN
E G
RA
BEN
REG
ION
OF
UG
AN
DA
:Ba
selin
e Su
rvey
Rep
ort
Febr
uary
, 201
5
32
both access to education and health services would improve rather than worsen. Other expected improvements include access to electricity, clean drinking water and improved roads. Conversely, a majority of respondents (80 percent) expect environmental pollution to increase, with 61 percent expecting interference with livestock farming and grazing.
Although opinions on the above-mentioned changes are more straightforward, it was is less clear when it comes to the issue of whether or not there would be a loss of livelihoods, with 46 percent expecting no loss in livelihoods, and 54 percent expecting the opposite. Corruption
The survey captured information regarding perceptions about the likelihood of increased graft due to corruption. Specifically, households were asked: “To what extent do you agree with the following statement: ‘Oil projects will increase corruption in government’?” The possible answers were strongly agree, agree, disagree, strongly disagree and no opinion. Figure 14 shows that at least one in seven of the respondents either agrees or strongly agrees that corruption will increase—urban respondents are less optimistic; 76 percent indicate corruption will increase compared with 70 percent of rural respondents. Individuals from the poorest households are more optimistic—only 66 percent expect corruption to increase. Similarly, 77 percent of migrants expect corruption to increase. Figure 14 shows that there are large variation in expectations regarding corruption by the ethnicity of respondent. Most of the Banyakole (82 percent) surveyed, followed by the Acholi (78 percent), either agree or strongly agree that corruption in government will increase as a result of oil projects. Conversely, a lower proportion of the Bakiga (59 percent) and the Alur (66 percent) hold the same view.
Figure 14. Perceptions Regarding Corruption as a Result of Oil Activities
NATU
RA
L RESO
UR
CE M
AN
AG
EMEN
T IN TH
E ALB
ERTIN
E GR
AB
EN R
EGIO
N O
F UG
AN
DA
:Baseline Survey Report February, 2015
33
Furthermore, although the majority of respondents think that oil projects would increase corruption in government, a similarly large number of people feel that the oil revenues that go the government should be used to improve the lives of ordinary citizens. With these two propositions seeming to somewhat be diametrically opposed, the expectation would be that agreeing with one would mean one has to be in disagreement with the other, at least for the most part. This, however, is not what is revealed in the results; the majority of the categories show an almost similar agreement with both propositions. Nevertheless, there are some outliers from this general trend, while 69 percent of those with no schooling agree that oil projects would result in government corruption, at least 58 percent of those with no schooling think the government would use revenues to improve the lives of ordinary citizens. This type of difference is only observed on two other occasions in the wealth/income category: asset quintile 1 (66 percent) and asset quintile 3 (80 percent), believing in increased corruption, versus 56 percent and 68 percent, with the expectation that oil revenues should be used to the benefit of ordinary citizens. This fittingly sets the scene for an examination of which groups of people feel they are set to benefit the most or the least from oil projects.

NAT
UR
AL
RES
OU
RC
E M
AN
AG
EMEN
T IN
TH
E A
LBER
TIN
E G
RA
BEN
REG
ION
OF
UG
AN
DA
:Ba
selin
e Su
rvey
Rep
ort
Febr
uary
, 201
5
34
5. Conclusions and Policy Options The discovery of viable deposits of the oil resource in the Albertine region of Uganda has key implications for the socio economic development of the economy. This report provides the results of a baseline survey conducted in the oil exploration area. The baseline seeks to identify the impacts that oil exploration activities have had on the people and the region. As part of the pre-exploitation analysis, the baseline provides information on awareness about oil activities, expectations about the oil resources and trust of authorities in regard to the proposed exploitation and use of the expected resources. A primary object of the baseline is to establish a basis for future evaluation of the impact of the exploitation activities in terms of employment, migration, businesses, livelihood strategies and environment. Analysis of the above issues was made based on a number of categories- gender, education level, ethnicity and wealth /income status. In some incidences, results are4 also segregated based on the location of the area –urban or rural, or based on whether the respondents are from an oil or non-oil district. A number of conclusions of significant policy relevance and of importance for future evaluations can be drawn from the report. Readiness to commence oil production:
An intuitive observation from the results is that Ugandans seem not to be certain as to whether they are ready for the commencement in production of the oil resource. On the one hand, the results from this report seem to point to the fact that the citizens think that they are ready for the country’s production of oil and they do support commencement of production. On the other hand, exploring through some of the responses; on whether they think the government can effectively manage the oil revenues, on whether they trust their leaders particularly the members of parliament to ably represent them, on who they think will benefit immensely from the oil revenues and perceptions on whether corruption will increase- negative responses to these questions imply some bit of scepticism in regards to readiness for the country’s commencement of oil production. Given that the level of scepticism on some of these issues is high amongst the educated, urban dwellers and those in the oil regions (these categories have access to more accurate information) it is plausible to deduce that Ugandans are not certain on whether they are ready for oil production. Addressing issues on transparency, accountability, governance and leadership will be vital in encouraging citizen’s support and improving perception on the country’s readiness for oil production.
Government’s ability to effectively and efficiently manage the oil resource:
Another issue that emerges is that there is little trust in government’s ability to effectively and efficiently manage the oil resource. The general consensus across all categories considered was that the general public would benefit to very small or to some extent and it is the government that would benefit to a great extent. Ideally, it would be expected

NATU
RA
L RESO
UR
CE M
AN
AG
EMEN
T IN TH
E ALB
ERTIN
E GR
AB
EN R
EGIO
N O
F UG
AN
DA
:Baseline Survey Report February, 2015
35
that once the government benefits, then the benefits would be translated into better road infrastructure, health and other public services from which ordinary Ugandans would benefit from. However since a large number of respondents feel that corruption will increase in the government when oil revenues begin to flow in, it is crucial that efforts are directed towards addressing corruption charges to increase the confidence that people have in the government.
Institutions and leadership:
A related conclusion is that local council leaders particularly the local village leaders have a significant role to play in the emerging oil industry. The poor, uneducated and rural population believe that any crucial decisions regarding oil investments in their vicinity should be entrusted in the local leaders and institutions. Relatedly members of Parliament particularly those in the oil districts are trusted less as regards representation and decision making in the emerging oil industry. Local governance structures at the grass root level therefore matter more than leadership at higher levels for poor rural households.
Impacts on livelihoods and availability of commodities and services
Another observation that emerges is that at least by the time of the survey (2014), no significant impacts on livelihoods and general availability of commodities and services have been witnessed so far. Improvement in commodities and services such as transportation and accommodation cannot directly be attributed to the commencement of oil activities.
Gender, locational, ethnicity and income disparities.
Given no differences in most of responses (familiarity with oil activities and observed changes since 2008, changes in the availability of commodities, readiness and trust for leaders regarding oil regulations and production and expectations from the oil resource) between men and women, it is plausible to conclude that the oil sector has not yet caused any significant gender disparities in some of the emerging issues. It crucial that as exploration of the oil resource progresses to the production stages, any actions that may breed disparities in gender access or knowledge or benefits from the discovery of the oil resource are addressed instantly. There are some locational (rural and urban dwellers) and ethnicity (district of origin) disparities across some of the issues raised in the report although these may not be so pronounced as of now but may be crucial in the future when oil activities intensify. For example whereas a significant number of rural people greatly trust their local leaders particularly the local village leaders, urban people are a little less positive of the local leaders.
A major concern that is drawn from the results is the likelihood that the oil resource could breed or increase the occurrence of income inequality amongst the population. From the analysis, a majority of the population believe that the revenue accrued from the oil

NAT
UR
AL
RES
OU
RC
E M
AN
AG
EMEN
T IN
TH
E A
LBER
TIN
E G
RA
BEN
REG
ION
OF
UG
AN
DA
:Ba
selin
e Su
rvey
Rep
ort
Febr
uary
, 201
5
36
resource should be directed towards helping the poor. However, they also believe that this is not likely to be the case as the elites and those close to the local leaders will be the ones to benefit. Increasing income and locational inequality that may arise from the oil production can be curbed through directing the accrued revenues to infrastructural development and improvement in service delivery.15
Management of the environment:
Management of the environment is perceived to be the task of the Government. Whereas this might be the case, it’s important that the population particularly those in the oil districts are empowered (understand environmental issues) to ensure that they put to tasks oil companies to adequately address any emerging negative impacts of the environment.
Some Policy options:
The baseline report has been able to identify a number of pertinent issues that are crucial in ensuring that the country reaps from the oil resource. The issues also provide a bench mark upon which future evaluations of the impacts of the oil resource can be done. So as Uganda progresses from the exploration to the actual commencement of oil production, a number of policy options should be considered to address the above identified emerging issues.
Ensure Transparency and accountability at all levels of oil production:
If the government wants to ensure that stakeholders are convinced that the government’s actions in the sector are aimed at getting the best out of the oil revenues through effective and efficient resource management that the public supports, it is crucial that a proper communication strategy exists. All stages in oil production and corresponding legal frameworks developed should be translated to easy utilized materials by ordinary citizens. Members of Parliament particularly those in the oil districts should ensure that they reach out to their constituencies and explain some of the decisions reached at in Parliament. Accountability can be promoted by ensuring that those implicated of corruption charges are dealt with according to the law.
Ensure strict implementation and coherence to the developed legal and institutional framework:
Uganda has taken a considerable amount of time in ensuring that an appropriate legal and institutional framework exists so that the country reaps the benefits that will accrue from owning an oil resource. However if these legal frameworks remain on paper and are not adequately implemented as stipulated then the country is bound not to fall into
15 Collier, P. (2011), “Managing Uganda’s Oil Discovery,” Centre for the Study of Af rican Economies, Department of Eco nomics, Oxford University, at http:// www.bou.or.ug/export/sites/default/ bou/bou-downloads/publications/ special_pubs/2011/All/Managing_ Ugandas_Oil_Discovery_Prof_Col liers_paper__Oct_21.pdf

NATU
RA
L RESO
UR
CE M
AN
AG
EMEN
T IN TH
E ALB
ERTIN
E GR
AB
EN R
EGIO
N O
F UG
AN
DA
:Baseline Survey Report February, 2015
37
a resource curse. For example the National Environment Management Agency (NEMA) should strictly ensure that oil companies adhere to ensuring that an environmental impact assessment is done by the oil companies before they embark on oil developments.16
Empowering local governance structures and institutions in oil districts:
Given the significant role that local leaders and institutions will have in the emerging oil industry, it is crucial that their capacities are strengthened to be able to effectively manage the emerging challenges that accrue from hosting the resource. For example if local leaders are to be the “eyes” of the central government in identifying any negative environmental concerns such as pollution of water bodies it is important that they receive some form of training in order to be able to effectively do so.
Ensure social equity:
It is crucial that access to information, distribution of revenue benefits and settling grievances of affected persons does not segregate on gender, ethnicity and location. One way of addressing this concern is by ensuring that the legal and regulatory frameworks address all categories of people.
16 Kityo , R. (2011). The effects of the oil and gas exploration in the Albertine Rift region on biodiversity: A case of protected areas (Murchion Falls National Park). www.natureuganda.org/.../Oil%20and%20Gas%20%20in%20the%20AR

NAT
UR
AL
RES
OU
RC
E M
AN
AG
EMEN
T IN
TH
E A
LBER
TIN
E G
RA
BEN
REG
ION
OF
UG
AN
DA
:Ba
selin
e Su
rvey
Rep
ort
Febr
uary
, 201
5
38
Appendix: Map showing natural resource management in the Albertine Graben region baseline survey coverage


