Page 1
Nature and Science, 2011;9(12) http://www.sciencepub.net/nature
125
Species Diversity and Community Structure of a Temperate Mixed Rhododendron Forest along an Altitudinal
Gradient in West Siang District of Arunachal Pradesh, India
Sanjeeb Bharali 1, Ashish Paul
2, Mohamed Latif Khan
3, Lal Bihari Singha
4, *
* Department of Forestry, North Eastern Regional Institute of Science & Technology, (Deemed University), Nirjuli
– 791109 (Itanagar), Arunachal Pradesh, India. E-mail- [email protected] , Phone No. (+91) 9436094198
** Department of Forestry, North Eastern Regional Institute of Science & Technology, (Deemed University), Nirjuli
– 791109 (Itanagar), Arunachal Pradesh, India. E-mail- [email protected] , Phone No. (+91) 9862035885
*** Department of Forestry, North Eastern Regional Institute of Science & Technology, (Deemed University),
Nirjuli – 791109 (Itanagar), Arunachal Pradesh, India. E-mail- [email protected] , Phone No. (+91) 9425280739
**** Department of Forestry, North Eastern Regional Institute of Science & Technology, (Deemed University),
Nirjuli – 791109 (Itanagar), Arunachal Pradesh, India. E-mail- [email protected] . Phone No. (+91)
9436228916
Abstract: Species diversity and community structure of a Rhododendron forest along an altitudinal gradient was
studied through quadrat method and all important community parameters were worked out using standard
procedures. A total of 72 species representing 58 genera belonging to 35 families were recorded from the three study
stands at different altitudes. The species richness index of tree and shrub species was highest in Hanuman Camp
(mid altitude) while, for herb it was highest in Shegong (lower altitude). The richness index of tree species shows a
positive relation while, the shrub and herb species have a negative relation with the altitudinal gradient. Hanuman
Camp has highest tree species richness, tree density (individual ha-1
) and basal area (m2 ha
–1) with Rhododendron
grande as the dominant tree species. Rhododendron kenderickii and Rhododendron sp. (seems to be a new species
and nomenclature process is under process) dominates Shegong and Yarlung (Upper altitude) respectively. The α
diversity of shrub and herb species was found to be much higher in Shegong compared to the other two study stands.
The Shannon-Weiner diversity index of tree and shrub species shows a positive relation with increasing altitude
while, herb species have a negative relation with altitude. The Simpson’s dominance index for tree was recorded
highest in Shegong (0.08) while, it is similar (0.07) in both Hanuman Camp and Yarlung. On the other hand,
dominance index of shrub species have negative and the herb species have positive relation with the increasing
altitude. The high similarity was found between Shegong and Hanuman Camp. Further, it was found that most of the
species exhibits clump or contagious distribution in all study stands. The present study suggested that the variation
in species diversity and community structure of the Rhododendron forest in the three study stand is mainly regulated
by the altitude which may be due to the difference in microclimate and edaphic factors.
[Sanjeeb Bharali, Ashish Paul, Mohamed Latif Khan, Lal Bihari Singha. Species Diversity and Community
Structure of a Temperate Mixed Rhododendron Forest along an Altitudinal Gradient in West Siang District
of Arunachal Pradesh, India. Nature and Science 2011; 9(12):125-140]. (ISSN: 1545-0740).
http://www.sciencepub.net.
Key words: altitude; diversity; species richness; microclimate; edaphic factors; Himalaya.
1. Introduction
The nature of ecological communities is a
fundamental issue in ecology. Many have considered
communities as integrated, possibly discrete entities
with emergent structure and function shaped by species
interactions and co-evolution (Drake, 1990). The study
of species diversity is helpful to understanding
community composition, structure, change and
development (Li & Zhou, 2002). Moreover, species
diversity is affected by multi-environmental factors
(Gaston, 2000, Li & Zhou, 2002, Lan, 2003 and Tang,
2004) especially by the altitudinal gradient. The
altitudinal gradient is an important factor affecting
species composition and structure (Whittaker, 1972).
The change of abiotic condition (e.g. climate, soil and
temperature) along with the altitudinal gradient affects
species composition and distribution. The relationship
between vegetation and altitude has been studied since
the early 19th
century (Kala & Mathur, 2002). Climatic
and soil factors are deemed to be primary determinants
of change in species composition and community
structure in mountains (Whittaker, 1975).
Forest structure and composition are strongly
correlated with the environmental factors, such as
climate and topography (Schall & Pinaka, 1978, Wright,
1983 and Currie, 1991) while, vegetation within a forest
is greatly affected by differences in the microclimate,
aspect and altitude (Chaudhary, 1999 and Pande et al.,
2002). Structural and functional analysis of natural plant
communities provide a valuable sources of information
for understanding relationship between plant form,
vegetation structure and environment (Parsons, 1976).
Page 2
Nature and Science, 2011;9(12) http://www.sciencepub.net/nature
126
Species diversity has functional consequences, because
the number and kinds of species present in any area
determine the organismal traits, which influence
ecosystem processes. Species diversity reflects species
richness and evenness and expresses differences of
community structure, community composition and
community habitat conditions (Lan, 2003).
Understanding of forest structure is a pre-requisite to
describe various ecological processes and also dynamics
of forests (Elourard et al., 1997).
The present study deals with the floristic
composition, and quantitative analysis of the vegetation
of three Rhododendron forest stands along an altitudinal
gradient in Mechuka area of West Siang District,
Arunachal Pradesh. Further, the present study aims to
analyze (i) Is elevation has any impact on species
richness/diversity? (ii) Whether there is any variation in
community structure with change in altitude.
2. Materials and methods
2.1. Study site
The study was carried out in a Rhododendron
forest at Mechuka under the sub division Mechuka in
West Siang district of Arunachal Pradesh, northeast
India (Figure 1). The West Siang district lies between
Figure 1: Map showing location of the study stands in
Mechuka of West Siang district in Arunachal Pradesh,
India.
27° 32΄ to 28° 59΄ N latitude and 93°58΄ to 94° 58΄ E
longitude. The district is spread over 7,813 sq. km and
constitutes 9.33% of the total geographical area of the
state. The total forest cover of the district is 6,719 sq.
km (86 % of the total geographical area), out of which
very dense forest comprises of 2,478 sq. km, moderately
dense forest 2,741 sq. km and open forest covers about
1,501 sq. km (FSI, 2009). The climate of the area has a
markedly continental character with average annual
rainfall of 3000 mm. Temperature ranges from a
minimum of 5°C in winter to a maximum of 38° C in
summer at the foothills and plains, whereas it varies
from below freezing point to 25° C at higher reaches.
Various ecological zones, viz. tropical, subtropical,
temperate, subalpine and alpine are present in the
district.
Mechuka falls under the Himalayan range and
is characterised by rough topography with mountains,
deeply incised valleys, escarpments and plateaus.
Mechuka is bordered by Upper Siang district in the
northeast, Upper Subansiri district in southwest,
whereas, the northwestern side is bordered by China.
For the present, study the Rhododendron forest at
Mechuka was divided into three study stands along the
altitudinal gradient viz, Shegong (1900–2100m),
Hanuman camp (2100–2300m) and Yarlung (>2300m).
The forest is in climax stage and very old aged. The
precise age of the forest is not known due to non
availability of the forest history with the local forest
department. Thick spongy humus layer covers the forest
floor. The soil is coarse textured with sandy to loamy in
nature and the pH ranged from 4.08 to 4.71. The organic
carbon content ranged from 4.87% – 6.89% while the
total nitrogen, available phosphorus and potassium
content ranged from 0.15% to 0.25%, 0.007% to 0.01%
and 0.37% to 0.43% respectively.
2.2. Methods
The vegetation sampling was done by quadrat
method. The trees (>10 cm GBH) were measured and
recorded by randomly sampling with forty quadrats of
10 m x 10 m size in each study stand. The shrubs were
also recorded within the same 10 m x 10 m quadrat,
while herbs were recorded by placing two 1 m x 1 m
quadrat within each 10 m x 10 quadrats. Specimens of
all species were collected and herbariums were prepared
following Jain & Rao (1977) and identification was
done following flora references like, Materials for the
flora of Arunachal Pradesh, Flowers of Himalaya, and
Flora of Assam etc.
Important community parameters such as
frequency, density, abundance, basal area and
importance value index (IVI) of all the plant species
were worked out by following Misra (1968) and
Muller–Dombois & Ellenberg (1974). The IVI for tree
species calculated by summing up the relative values of
Page 3
Nature and Science, 2011;9(12) http://www.sciencepub.net/nature
127
frequency, density and basal area while, the IVI for
shrubs and herbs were obtained by summing the relative
values of frequency and density. The species richness
‘S’ was obtained by listing all the plant species
occurring in the respective study stands following
Whittaker (1972). The species richness index ‘d’ was
calculated for each altitudinal zone using the formula d
= S/√N given by Menhinick (1964); where, ‘S’ is the
total number of species occurred and ‘N’ is the total
number of individuals of all species. Alpha and beta
diversity were estimated following Whittaker (1960) as
α = S/log N; where, ‘S’ is the total number of species
present in each stand and ‘N’ is the total number of
individuals of all the species present in each stand and β
= (S/α)-1; where, ‘S’ is the total number of species
recorded in the two sites considering each species only
once and ‘α’ is the mean species richness of the two
sites. The species diversity index (H') was determined
by using the method given by Shannon & Wiener
(1963):
s H' = -Σ pi ln pi
i=1
Where, H' = Shannon -Weiner diversity index,
pi is the proportion of individuals in the ith species i.e
(ni/N); ni = importance value index of the species; and N
= importance value index of all the species. The
dominance index was calculated by Simpson’s index
(1949):
s
D = Σ (pi) 2
i=1
Where, pi is same as for the Shannon-Weiner
diversity. The similarity index was worked out by
following the formula SI = (2C/A+B) x 100 (Sorensen
1948); where, A is the total number of species in site A;
B is the total number of species in site B; and C is the
total number of common species in both the site A and
B. The evenness index (E) was calculated as E = H'/ ln
S following Pielou (1966); where, E is Pielou’s
evenness index, H' is Shannon-Weiner diversity index
and S is total number of species. The spatial distribution
patterns of various species in different altitudinal zone
were studied using the ratio of abundance to frequency
(A/F); the value <0.025 indicates regular distribution,
0.025 – 0.050 indicates random distribution, >0.050
indicates contagious or clump distribution (Whitford
1949).
3. Results
3.1. Floristic diversity of the study stands
A total of 72 species representing 58 genera
belonging to 35 families were recorded from the three
study stands. Of these, 30 were tree species (≥ 10cm
gbh) representing 23 genera belonging to 14 families.
16 species were shrubs belonging to 9 families and 11
genera, 26 species were herbs representing 18 families
and 26 genera. The families, genera and species of the
three study stands are given in table 1.
3.2. Species richness
The species richness was found to be highest in
Shegong with 52 species representing 46 genera under
35 families. Out of the 52 species 15 were tree species
belonging to 18 genera under 10 families, 13 were shrub
species from 9 genera under 8 families and 24 were
herbs belonging to 24 genera under 17 families. The
species richness in Hanuman Camp is represented by 51
species with 42 genera belonging to 31 families. Out of
these total 51 species, 21 tree species belonging to 17
genera under 12 families, 12 were shrubs from 7 genera
under 5 families while, herbs are represented by 18
species from 18 genera under 14 families. Yarlung have
the least species richness with 45 species made up of
tree, shrub and herb with 37 genera under 27 families.
The tree contribute 19 species from 15 genera belonging
to 10 families, 11 shrub species under 7 genera from 5
families and the herbs were represented by 15 species
under 15 genera belonging to 12 families (Table 2).
One Rhododendron tree species was seems to be a new
one and the process of identification and nomenclature
is under progress.
3.3. Density
The total density of all tree, shrub and herb was
highest in Shegong followed by Yarlung and lowest in
Hanuman Camp. However, tree density was recorded
highest in Hanuman Camp (963 individual ha-1
),
followed by Yarlung (823 individual ha-1
) and Shegong
(707 individual ha-1
) (Table 2). Tree species like
Rhododendron kenderickii, R. grande, Illicium griffithii,
Litsea sericea etc. contribute maximum density in
Shegong while, Rhododendron kenderickii, R. grande,
Illicium griffithii, Castanopsis tribuloides shows
maximum density in Hanuman Camp. In Yarlung, trees
like Illicium ghiffithii, Rhododendron sp.,
Rhododendron kenderickii, R. grande have maximum
density (Annexure I). In case of shrubs, maximum
density 2617 individual ha-1
was recorded in Shegong
followed by Yarlung (2157 individual ha-1
) and lowest
1387 individual ha-1
in Hanuman Camp (Table 2).
Herbs also shows maximum density (38000 individual
ha-1
) in Shegong followed by Yarlung (28667 individual
ha-1
) and minimum (28333 individual ha-1
) in Hanuman
Camp (Table 2).
3.4. Basal area
The total basal area of tree species was
recorded highest in Hanuman Camp (74.6 m2 ha
–1)
followed by Yarlung (63.2 m2 ha
–1) and minimum (54.2
m2 ha
–1) in Shegong (Table 2). Due to the presence of
large trees with high density, Hanuman Camp has the
Page 4
Nature and Science, 2011;9(12) http://www.sciencepub.net/nature
128
highest basal area (Figure 2). Tree species like
Rhododendron grande, Pinus wallichiana, Taxus
wallichiana, Abies densa share maximum basal area in
Shegong. In Hanuman Camp, species like Abies densa,
R. grande, Taxus wallichiana, unidentified sp. 1,
Castanopsis tribuloides contribute major basal area to
the study stand. While, in Yarlung major basal area was
shared by species like Abies densa, Illicium griffithii,
Pinus wallichiana, Quercus lamellosa, R. grande,
Rhododendron sp., Taxus wallichiana (Annexure I).
3.5. Dominance
Dominance of species was assigned based on
the calculated IVI values. It was found that in Shegong
R. kenderickii was the dominant species with highest
IVI (39.79) followed by species like R. grande (35.33),
Abies densa (30.08), Taxus wallichiana (28.86), Illicium
griffhithii (25.45), Pinus wallichiana (24.25) etc. The
shrub layer is dominated by Bamboo sp. with highest
IVI (81.30). R. grande (IVI=48.61) dominates the tree
layer in Hanuman Camp while, the species in the shrub
layer share almost equal IVI. The Rhododendron sp.
was the dominant tree species in Yarlung with highest
IVI (44.7) while, Dephne papyracea is the dominant
shrub (IVI=37.45). Dryopteris sp. dominates the ground
vegetation with highest IVI in all the study stands
(Annexure I).
The dominance-diversity curve (Figure 3) for
trees, shrubs and herbs shows that in all the three study
stands relatively few species had a high IVI value.
These curves illustrate resource partitioning among the
various species (Verma et al., 2001).
Table 1. Family, genera and species enumerated in the
three study stands. Family No. of genera No. of species
Aceraceae 1 1
Asteraceae 3 3
Begoniaceae 1 1
Berberidaceae 1 1
Betulaceae 1 1
Caprafoliaceae 1 1
Caryophyllaceae 1 1
Circaeasteraceae 1 1
Compositae 1 1
Cornaceae 2 2
Dryopteridaceae 2 2
Ericaceae 4 13
Fabaceae 1 1
Fagaceae 2 4
Gentianaceae 2 2
Illiciaceae 1 1
Lauraceae 3 5
Lycopodiaceae 1 1
Magnoliaceae 1 1
Malvaceae 1 1
Pinaceae 3 3
Plantaginaceae 1 1
Poaceae 4 4
Polygonaceae 2 2
Ranunculaceae 1 1
Rosaceae 5 5
Rutaceae 1 1
Scrophulariaceae 1 1
Taxaceae 1 1
Theaceae 1 2
Thelypteridaceae 1 1
Thymelaeaceae 1 1
Trilliaceae 1 1
Urticaceae 2 2
Vitaceae 1 1
Unidentified 1 1
Table 2. Various phyto–sociological characteristics of tree, shrub and herb of the three study stands.
Parameters Shegong Hanuman camp Yarlung
Tree Shrub Herb Tree Shrub Herb Tree Shrub Herb
Species richness (S) 15 13 24 21 12 18 19 11 15
No. of genera 13 9 24 17 7 18 15 7 15
No. of Family 10 8 17 12 5 14 10 5 12 Menhinick’s Species Richness Index (d) 1.03 0.46 2.25 1.24 0.59 1.95 1.21 0.43 1.62
α diversity 2.80 1.95 5.07 3.71 1.99 4.05 3.45 1.70 3.38
Shannon and Wiener diversity index (H') 2.59 2.13 3.01 2.80 2.46 2.67 2.78 2.32 2.49 Simpson’s index (D) 0.08 0.20 0.06 0.07 0.09 0.09 0.07 0.11 0.10
Species evenness index (E) 0.96 0.83 0.95 0.92 0.99 0.92 0.94 0.97 0.92
Density (Individual ha–1) 707 2617 38000 963 1387 28333 823 2157 28667 Basal area (m2 ha–1) 54.2 – – 74.6 – – 63.2 – –
Page 5
Nature and Science, 2011;9(12) http://www.sciencepub.net/nature
129
Figure 2. Stand density (ha
-1) and basal area (m
2 ha
-1)
of tree species in the three study stands.
3.6. Species richness index, α diversity, β diversity,
Shannon–Weiner Index, Simpson’s index The species richness index was found to be
fluctuating from stand to stand as well as among the
tree, shrub and herb. Hanuman Camp had the highest
tree species richness index 1.24 followed by Yarlung
and Shegong with 1.21 and 1.03 respectively. The shrub
shows the highest richness index (0.59) in Hanuman
camp followed by Shegong (0.46) and Yarlung (0.43).
On the other hand, the herb has the highest richness
index 2.25 in Shegong followed by Hanuman Camp and
Yarlung with 1.95 and 1.62 respectively (Table 2). The
α diversity of tree was highest in Hanuman camp (3.71)
followed by Yarlung (3.45) and lowest in Shegong
(2.80). While, α diversity for shrub was recorded
maximum in Shegong (1.95) followed by Hanuman
Camp (1.99) and minimum at Yarlung (1.70). The herb
also showed the same trend as the shrub having
maximum α diversity in Shegong (5.07) followed by
Hanuman Camp (4.05) and minimum (3.38) in Yarlung
(Table 2). The β diversity was recorded highest
between Hanuman camp and Yarlung (0.33) followed
by Shegong and Yarlung (0.31) while, minimum
between Shegong and Hanuman Camp (0.28) (Table 3).
The Shannon-Weiner diversity index for the
tree was recorded highest in Hanuman Camp (2.80)
followed by Yarlung (2.78) and lowest in Shegong
(2.59). The diversity index of shrub was maximum in
Hanuman Camp (2.46) followed by Yarlung (2.32) and
minimum in Shegong (2.13). While, the herb shows
highest diversity index (3.01) in Shegong followed by
Hanuman Camp (2.67) and minimum (2.49) in Yarlung
(Table 2).
The Simpson’s dominance index for tree was
found highest in Shegong (0.08) while, it is similar
(0.07) in both Hanuman Camp and Yarlung. For shrub,
the index was highest (0.20) in Shegong followed by
Yarlung (0.11) and lowest in Hanuman Camp (0.09).
For herb, the value is found maximum in Yarlung (0.10)
followed by Hanuman Camp (0.09) and minimum
(0.06) in Shegong (Table 2).
Table 3. β diversity among the three study stands.
Study stands Hanuman Camp Yarlung
Shegong 0.28 0.31
Hanuman Camp – 0.33
3.7. Similarity index
The overall species similarity was highest
(71.84%) between Shegong and Hanuman Camp. The
trees have 61.11 %, shrubs 72% and herbs 80.95%
similarity between these two study stands. On the other
hand, Hanuman Camp and Yarlung have least (66.67%)
similarity in all species. Trees have 60.00%, shrub
78.26% and herb 66.67% similarity between these two
study stands. Shegong and Yarlung have 64.58%
similarity in all species while, trees, shrubs and herbs
between these two study stand shows similarity of
58.82%, 75.00% and 66.67% respectively (Table 4).
3.8. Species evenness index
The evenness index (Table 2) of tree species
was found highest in Shegong (0.96) followed by
Yarlung (0.94) and minimum in Hanuman Camp (0.92).
The shrub species show highest evenness in Hanuman
Camp (0.99) followed by Yarlung (0.97) and lowest in
Shegong (0.83). The herb species show maximum
evenness in Shegong (0.95) while, Hanuman Camp and
Yarlung have similar evenness index (0.92). Figure 4
shows the co-relation between altitude and various
indices of tree, shrub and herb species.
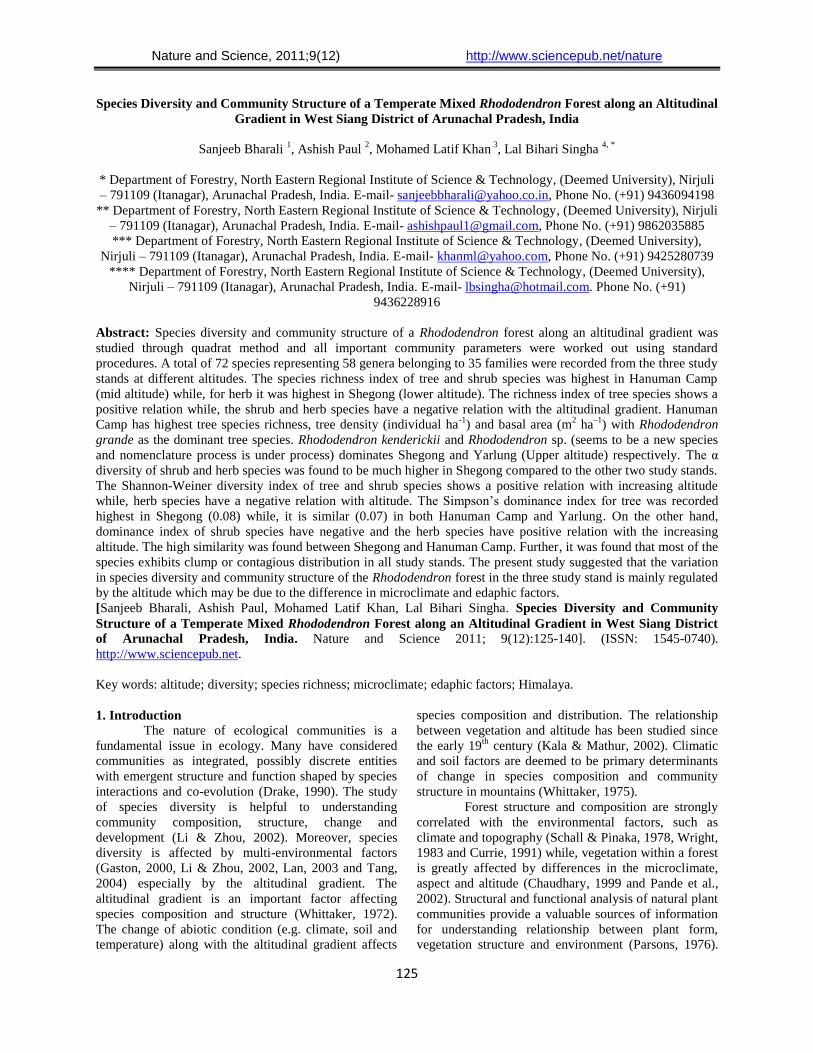
3.9. Distribution pattern
Table 5 shows the distribution pattern for all
the species from the three study stands. About 75 % of
the total species recorded from Shegong exhibits
clumped distribution, 23 % have random distribution
while, only 2 % exhibits regular distribution. In
Hanuman Camp 82 % species have clumped
distribution and 18 % exhibits random distribution.
None of the species from Hanuman Camp exhibits
regular distribution. In Yarlung also 76 % of the total
recorded species shows clumped distribution, 20%
exhibits random distribution whereas, only 4 % shows
regular distribution (Figure 5).
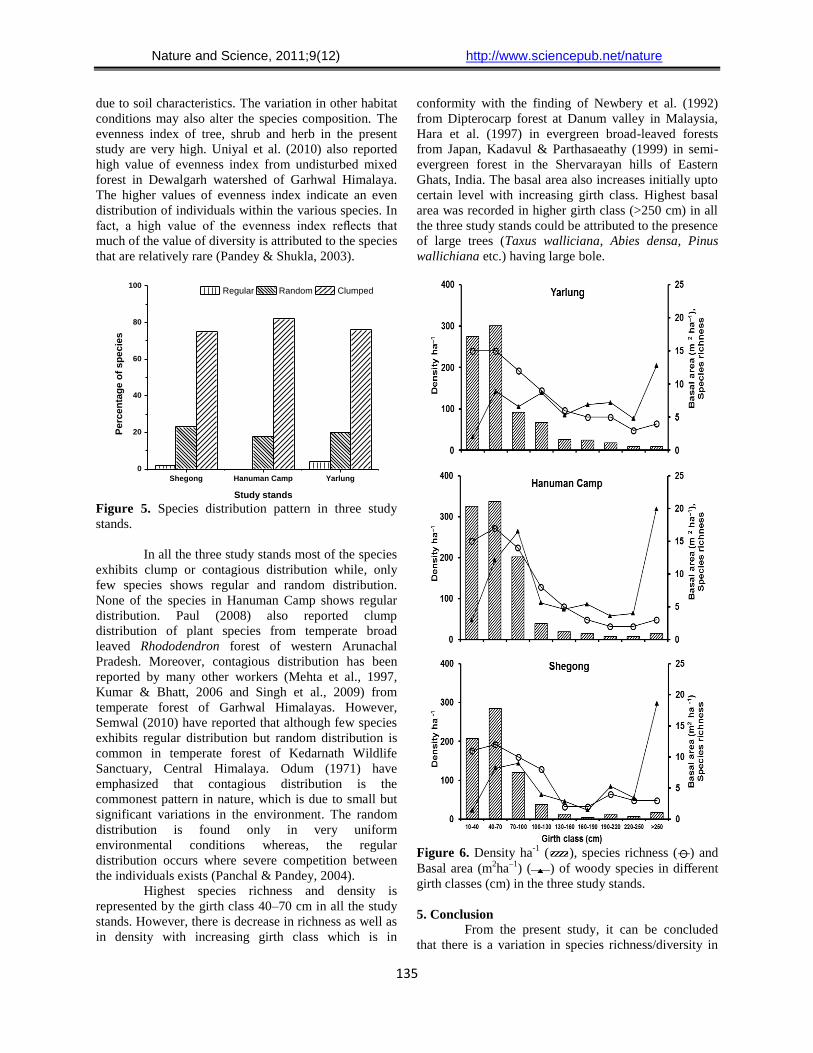
3.10. Density girth distribution, basal area and
species richness
The highest stand density and species richness
of the tree species in the three study stands were
recorded in the girth class 40–70 cm. Stand density and
species richness consistently decreased with increase in
girth. In Shegong and Hanuman Camp, it was found that
the basal area increases upto the girth class 70-100 cm
Page 6
Nature and Science, 2011;9(12) http://www.sciencepub.net/nature
130
and beyond it the basal area was unevenly distributed.
However, the girth class >250 cm recorded highest
basal area with low density and species diversity. While,
in Yarlung it was found that beyond girth class 40-70
cm there is an irregular distribution of basal area and
like the other two stands the girth class >250 cm
recorded highest basal area (Figure 6). In Shegong, the
girth class 160-190 cm shows minimum basal area (1.5
m2ha
–1), while the girth class >250 cm shows highest
basal area (18.6 m2ha
–1). In Hanuman Camp, the
minimum basal area (2.9 m2ha
–1) is recorded in girth
class 10-30 cm and highest (19.9 m2ha
–1) in girth class
>250 cm. From Yarlung minimum basal area (2.0 m2ha
–
1) was recorded in girth class 10-30 cm, while maximum
(12.8 m2ha
–1) in girth class >250cm.
4. Discussion
All together 72 plant species were recorded
from the three study stands belonging to 58 genera
under 35 families. The result of the present study is
much less than that of 113 species from temperate forest
between 1800-2200 m altitude of Subansiri district of
Arunachal Pradesh and 122 species from temperate
forest of rhododendrons of western Arunachal Pradesh
reported by Behera & Kushwaha (2007) and Paul
(2008) respectively, as well as from other temperate
forest (Kukshal et al., 2009; Semwal, 2010; Chandra et
al., 2010; Panthi et al., 2007 and Zegeye et al., 2011).
However, the plant species richness in this study is
much greater than that of 19 species from Southern
Manang Valley, Nepal (Ghimire et al., 2008), 40 species
from temperate/subalpine coniferous forest of Subansiri
District of Arunachal Pradesh (Behera et al., 2002), 45
species from temperate old growth evergreen broad
leaved forest in Japan (Manabe et al., 2000). Out of the
total species recorded from the three study stands, 31
were tree species, 15 were shrubs and 26 herb species.
However, Paul (2008) has reported 26 tree, 40 shrub
and 56 herb species from temperate forest of western
Arunachal Pradesh. The species richness of the
vegetation in the present study followed the trend as tree
layer>herb layer>shrub layer which is similar to that
reported by Negi (2008) from temperate forest of
Garhwal Himalaya in Chamoli district. On contrary,
Paul (2008) have reported the species richness in
temperate broadleaved Rhododendron forest from
western Arunachal Pradesh following the trend as
herb>shrub>tree. Ericaceae is most dominant family in
the study site followed by Poaceae and Rosaceae. In
addition, Lauraceae, Asteraceae and Pinaceae were the
other co-dominant families. Behera et al. (2002) and
Paul (2008) have also reported similar dominant
families (Asteraceae, Ericaceae and Rosaceae) from
temperate/subalpine forest of Arunachal Himalaya.
0 2 4 6 8 10 12 14 16 18 20 22 24 26
1
10
100
0 2 4 6 8 10 12 14 16 18 20 22 24 26
1
10
100
0 2 4 6 8 10 12 14 16 18 20 22 24 26
1
10
100
Shegong
Hanuman Camp
Yarlung
Log1
0IV
I
Tree
Lo
g1
0IV
I
Shrub
Lo
g1
0IV
I
Species Sequence
Herb
Figure 3. Dominance-diversity curve of tree, shrub and
herb species in the three study stands.
The species richness of the three study stands
vary from each other where, Shegong have the highest
richness with 52 species, followed by Hanuman camp
with 51 species while, Yarlung have least richness with
45 species. However, the tree species richness is highest
in Hanuman Camp followed by Yarlung and lowest in
Shegong. This variation in tree species among the study
stands may be attributed to the microclimate and
edaphic characteristics.
Page 7
Nature and Science, 2011;9(12) http://www.sciencepub.net/nature
131
Table 4. Similarity Index (%) of tree, shrub and herb species between different study stands.
Study stands Hanuman Camp Yarlung
A T S H A T S H
Shegong
A 71.84 – – – 64.58 – – –
T 61.11 – – – 58.82 – –
S 72.00 – – – 75.00 –
H 80.95 – – – 66.67
Hanuman
Camp
A 66.67 – – –
T 60.00 – –
S 78.26 –
H 66.67
A – All species, T – Trees, S – Shrubs, H – Herbs.
The overall pattern of species richness shows
inverse relationship with increasing altitude. Kharkwal
et al., (2005) and Goirala et al., (2008) also shows a
similar pattern of decreasing species richness along
altitudinal gradient in temperate and alpine zone of
central Himalaya and Western Himalaya respectively.
Several other workers also reported similar patterns of
decreasing species richness along altitudinal gradient
(Kitayama, 1992, Odland & Birks, 1999, Wang et al.,
2007 and Ghimire et al., 2008). Further, this decrease in
diversity and species richness along the altitude could
be due to ecophysiological constraints, such as
reduced growing season, low temperature and low
productivity (Korner, 1998). Ellu & Obua (2005) have
also suggested that different altitudes and slopes
influence the species richness. Moreover, Sharma et al.,
(2009) reported that the distribution and species
richness pattern of different species are largely
regulated by the altitude and climatic factors.
The tree density in the present study ranged
between 707 to 963 individual ha–1
which is within the
ranged values 192 to 1852 individual ha–1
reported by
Paul (2008) from Arunachal Himalaya, 420 to 1640
individual ha–1
from temperate forests of Kumaon
Himalaya (Saxena & Singh, 1982), 652 to 1028
individual ha–1
from Garhwal Himalaya (Kumar et al.,
2009). However, many other workers have reported
much higher density from Himalayan temperate forest,
1570–1785 individual ha-1
in the montane forests of
Garhwal Himalaya (Bhandari & Tiwari, 1997), 2090 to
2100 individual ha-1
from Dolpa district of mid-west
Nepal (Kunwar & Sharma, 2004). The density of shrub
is within the range value of 504 to 3576 individual ha-1
reported by Paul (2008) from temperate forest of
western Arunachal Pradesh. However, it is much lower
than that reported by Koirala (2004) from Tinjure-Milke
region, Nepal. The herb species also show similar
pattern as the shrub and has the density of 28,333 to
38,000 individual ha-1
and is within the range value
(14380 to 45000 individual ha-1
) that reported by Paul
(2008) from Arunachal Himalaya. However, the total
density of herb in the present study is much lower
compared to the reported values by other workers from
Himalayan forest (Kumar & Ram, 2005, Uniyal, 2010
and Kharkwal & Rawat, 2010). Highest density and
species richness of herbs and shrubs in Shegong may be
because of open canopy. The altitude, environmental
factors, habitat and soil characteristics may be the main
factors which eventually lead to the variations in species
diversity and density in the three study stands.
The basal area recorded is ranged between 54.2
to 74.6 m2 ha
–1 which is within the range value 9.38 to
137.45 m2 ha
–1 reported by Paul (2008) from Arunachal
Himalaya as well as 17.9 to 180.1 m2 ha
–1 reported from
other part of temperate forest of Himalaya (Baduni,
1996, Ghildiyal et al., 1998, Sharma & Baduni, 2000
and Ram et al., 2004). Highest basal area was recorded
from Hanuman Camp while, minimum from Shegong.
The less basal area in Shegong could be due to less
density and sparse distribution of tree species.
Moreover, Shegong is the transition zone between the
forested area and open bare land of Mechuka valley.
Page 8
Nature and Science, 2011;9(12) http://www.sciencepub.net/nature
132
The higher basal area in Hanuman Camp may be due to
higher density, diversity of trees and more favorable
micro climatic as well as edaphic condition for growth.
Moreover, the variation in basal area of all the study
stands may be due to presence or absence of higher
number of individuals having larger girth which
contributes to the greater basal area.
Figure 4. Scatter plot showing relation between altitude
and various species richness and diversity parameters.
In Shegong R. kenderickii have maximum IVI
(39.79) with density of 143 individuals ha-1
followed by
R. grande (35.33) with 93 individuals ha-1
. While,
bamboo is dominated shrub in Shegong with highest IVI
(81.3) and density of 1723 individuals ha-1
. On the other
hand, all the herb species share more or less equal IVI.
In Hanuman Camp R. grande was the dominant tree
species with IVI (48.6) and density 223 individuals ha-1
while, the shrub and herb species share almost similar
IVI. Yarlung is dominated by Rhododendron sp. with
highest IVI (44.7) and density 127 individuals ha-1
.
However, the IVI of the dominant species of the three
study stands are lower than that reported by Majila &
Kala (2010) from temperate forest of Uttarakhand
Himalaya. He studied the four geographical aspects in
the forest viz., east, west, north and south and found the
IVI of the dominant species as 94.73, 65.64, 111.14 and
107.09 respectively.
The species richness index of the three study
stands were in the order of herb>tree>shrub. However,
there is variation in richness indices within herb, shrub
and tree species at different altitudes. The species
richness index of tree and shrub species was highest in
Hanuman Camp while, for herb it was highest in
Shegong. The richness index of tree species shows a
positive relation with increasing altitude while, the
shrub and herb species have a negative relation with the
altitudinal gradient. However, Sharma et al. (2009) have
reported a negative relation of tree species richness
index with increasing altitude. Menhinick’s index of
species richness presupposed that a kind of functional
relationship existed between the number of species and
individuals present in the community. The richness
index for tree species is more than that reported by
Sharma et al. (2009) from temperate forest of Garhwal
Himalaya, while, it is much lower than that reported by
Behera et al. (2002), from temperate forest of Arunachal
Himalaya. On the other hand, the richness index of tree
and herb species from the present study is more and the
richness index of shrub is less than that reported by Paul
(2008) from western Arunachal Himalaya.
Table 5. Distribution pattern of tree, shrub and herb species at the three study stands.
Species
TREE
Family
Study stands
Shegong Hanuman
Camp Yarlung
Abies densa Griff. Pinaceae 0.094 (C) 0.100 (C) 0.075 (C)
Acer caesium Wall. ex Brandis Aceraceae – 0.075 (C) –
Alnus nepalensis D.Don. Betulaceae 0.015 (Re) – –
Castanopsis armata Roxb. Fagaceae – – 0.043 (R)
Castanopsis tribuloides (Smith) A. DC. Fagaceae 0.047 (R) 0.028 (R) –
Castanopsis indica Roxb. Fagaceae 0.067 (C) 0.025 (R) –
Cinnamomum glaucescens Nees. Lauraceae – – 0.055 (C)
Cornus capitata Wallich Cornaceae – 0.108 (C) –
Page 9
Nature and Science, 2011;9(12) http://www.sciencepub.net/nature
133
Eurya accuminata DC. Theaceae – – 0.060 (C)
Eurya sp. Theaceae 0.067 (C) 0.055 (C) –
Grewia sp Malvaceae – – 0.058 (C)
Illicium griffithii Hook.f. & Thomson Illiciaceae 0.037 (R) 0.050 (C) 0.056 (C)
Leea sp. Vitaceae 0.042 (R) 0.094 (C) 0.049 (R)
Litsea sericea (Nees) Hook. f. Lauraceae 0.081 (C) 0.047 (R) 0.033 (R)
Litsea glutinousa (Lour.) Robinson Lauraceae – 0.044 (R) 0.052 (C)
Litsea sp. Lauraceae – – 0.075 (C)
Lyonia ovalifolia (Wall.) Drude Ericaceae 0.042 (R) – –
Magnolia hodgsonii Hook.f. & Thomson Magnoliaceae 0.037 (R) 0.052 (C) 0.056 (C)
Persea sp. Lauraceae – 0.100 (C)
Pinus wallichiana A.B. Jacks. Pinaceae 0.050 (R) – 0.075 (C)
Prunus cerasoides D.Don. Rosaceae – 0.096 (C) –
Quercus lamellosa Sm. Fagaceae 0.047 (R) – 0.150 (C)
Rhododendron arizelum I. B. Balfour & Forrest Ericaceae – 0.072 (C) 0.019 (Re)
R. grande Wight Ericaceae 0.050 (C) 0.042 (R) 0.098 (C)
R. kenderickii Nutt. Ericaceae 0.040 (R) 0.044 (R) 0.057 (C)
Rhododendron sp. * Ericaceae – 0.045 (R) 0.018 (Re)
Taxus wallichiana Zuccarni. Taxaceae 0.042 (R) 0.083 (C) 0.036 (R)
Tsuga sp. Pinaceae – 0.075 (C) –
Unidentified 1 Rosaceae – 0.075 (C) 0.133 (C)
Unidentified 2 – – 0.167 (C) –
SHRUB
Aconogonum molle D.Don. Polygonaceae 0.058 (C) – 0.083 (C)
Bamboo sp. Poaceae 0.352 (C) 0.375 (C) –
Berberis wallichiana DC. Berberidaceae – 0.220 (C) 0.230 (C)
Daphne papyracea Wall. ex. Steud Thymelaeaceae 0.092 (C) 0.096 (C) 0.175 (C)
Gaultheria trichophylla Royle Ericaceae 0.075 (C) 0.122 (C) 0.079 (C)
G. fragrantissima Wall. Ericaceae 0.104 (C) 0.097 (C) 0.047 (R)
Gaultheria sp. Ericaceae – 0.061 (C) 0.063 (C)
Helwingia himalaica J. D. Hooker & Thomson ex C.
B. Clarke Cornaceae 0.063 (C) 0.102 (C) –
Lonicera sp. Caprafoliaceae 0.125 (C) – 0.094 (C)
Rhododendron bothii Nutt. Ericaceae 0.070 (C) 0.129 (C) 0.052 (C)
R. vaccinoides Hook. f. Ericaceae 0.060 (C) 0.097 (C) 0.097 (C)
R. edgeworthii Hook. f. Ericaceae 0.052 (C) 0.083 (C) 0.049 (R)
Rhododendron sp. Ericaceae 0.057 (C) 0.079 (C) 0.096 (C)
Spiraea canescens D. Don Rosaceae 0.069 (C) – –
Vaccinium nummularia Hook. f. and Thomson ex C.
B. Clarke Ericaceae – 0.141 (C) –
Zanthoxylum sp. Rutaceae 0.089 (C) – –
HERB
Anaphalis busua Buch.-Ham. ex D. Don. Asteraceae 0.133 (C) 0.094 (C) –
Artemisia nilagirica Clarke Asteraceae 0.225 (C) – 0.094 (C)
Begonia sp. Begoniaceae 0.300 (C) 0.094 (C) 0.150 (C)
Bidens pilosa Linn. Asteraceae 0.150 (C) 0.100 (C) –
Circaeaster agrestis Maxim Circaeasteraceae 0.100 (C) 0.150 (C) –
Crawfurdia speciosa Wallich Gentianaceae 0.525 (C) 0.150 (C) 0.133 (C)
Cyclosorus appendiculatus C. Presl Thelypteridaceae 0.049 (R) 0.066 (C) 0.043 (R)
Desmodium triflorum DC. Fabaceae 0.150 (C) – –
Diplazium caudatum J.Smith Dryopteridaceae 0.037 (R) 0.047 (R) 0.044 (R)
Drymaria diandra Blume Caryophyllaceae 0.225 (C) – –
Dryopteris sp. Dryopteridaceae 0.042 (R) 0.042 (R) 0.050 (R)
Elatostema sessile J.R.Forst. & G.Forst Urticaceae 0.100 (C) 0.200 (C) 0.150 (C)
Fragaria vesca L. Rosaceae 0.133 (C) 0.225 (C) 0.167 (C)
Halenia elliptica D.Don Gentianaceae 0.167 (C) 0.150 (C) –
Page 10
Nature and Science, 2011;9(12) http://www.sciencepub.net/nature
134
Hypochaeris radicata Linn. Compositae 0.225 (C) 0.133 (C) 0.150 (C)
Lycopodium clavatum Linn. Lycopodiaceae 0.167 (C) 0.100 (C) –
Panicum sp. Poaceae 0.150 (C) 0.225 (C) 0.075 (C)
Paris polyphylla Sm. Trilliaceae 0.150 (C) – –
Paspalum sp. Poaceae 0.233 (C) – –
Persicaria capitata Buch.-Ham. ex D. Don Polygonaceae 0.075 (C) 0.225 (C) 0.200 (C)
Pilea umbrosa Blume Urticaceae 0.100 (C) – 0.133 (C)
Plantago major Linn. Plantaginaceae 0.225 (C) 0.150 (C) –
Poa annua Linn. Poaceae 0.300 (C) 0.150 (C) –
Potentilla microphylla D. Don Rosaceae – – 0.600 (C)
Ranunculus sp. Ranunculaceae 0.200 (C) – 0.096 (C)
Wulfenia amherstiana Benth. Scrophulariaceae – 0.150 (C) 0.100 (C)
Re= Regular, R= Random, C= Clumped.
(*Seems to be a new Rhododendron tree species and the process of identification and nomenclature is under progress)
Alpha diversity of shrub and herb species was
found to be much highest in Shegong compared to the
other two study stands. This may be due to sparse
canopy of the tree layer which provides suitable light
condition and favours the growth of herbs (Bhatnagar
1966). On the other hand, α diversity of tree is much
higher in Hanuman Camp. This may be due to
favourable growth conditions for tree species. The α
diversity of trees and herbs in the present study is more
while, it is less for shrubs compared to that reported by
Paul (2008) from western Arunachal Himalaya. The
calculated β diversity values elucidate that the extent of
changes of species in the tree layer was highest between
Hanuman Camp and Yarlung. Different topography,
microclimate, edaphic factors may have contributed to
the different species composition between these stands.
The variation in β diversity value of the three stands
shows that species composition varies through the
altitudinal gradient. Mehta et al. (1997) also reported
high β diversity between the four sites in temperate
forest of Garhwal Himalayas. Pande et al. (1996) argued
that the altitude and different aspects, significantly
affect the turnover of species. The range of diversity
index values recorded in the present study falls within
the lower limit of the values recorded for temperate
forests of Himalaya and other parts of the world (Ralhan
et al., 1982, Upreti et al., 1985, Bahera et al., 2002 and
Paul, 2008). The low Shannon-Wiener diversity value
of the forest stands indicats that the ecological structure
is less complex (Odum, 1971). However, the diversity
index of tree species is more than that reported by
Kunwar & Sharma (2004) and Sharma et al. (2009)
from temperate forest of Nepal Himalaya and Garhwal
Himalaya respectively. Moreover, there is variation in
diversity index of tree, shrub and herb species along the
altitude. Diversity index of tree and shrub species shows
a positive relation with increasing altitude while, herb
species have a negative relation with altitude. The
variation of Shannon–Weiner index along the altitudinal
gradient suggests an unimodal relationship between the
species richness and the environmental condition with
regards to altitudinal factors (Jiang et al., 2007). The
diversity of vegetation patterns and the spatial variation
of Shannon–Weiner index of plant communities might
be the simple but effective indicators for predicting the
species richness level (Jiang et al., 2007).
The Simpson’s dominance index of tree
species in the study stands were less than that reported
by Behera (2002) and Paul (2008) from Arunachal
Himalaya. The shrub species showed the negative
while, the herb species have positive relation with the
increasing altitude. Kunwar & Sharma (2004) and
Koirala (2004) also reported very low value of
dominance index from Nepal Himalaya. Low value of
Simpson’s index of dominance indicates that the stands
are more stabilized and more active (Odum, 1971).
Moreover, high diversity and low dominance index may
be due to the different microclimatic influence in the
study stands. In general, species diversity and
dominance index showed inverse relationship (Murthy
& Pathak, 1972 and Joshi & Behera, 1991) and
Simpson’s index is heavily weighed towards the most
abundant species in the sample and is less sensitive to
species having only a few individuals (Magurran, 1988).
High similarity in species composition was
found between Shegong and Hanuman Camp while, it
was less between Hanuman Camp and Yarlung. The
high similarity could be attributed to the presence of
some species which have wide geographical range.
Moreover, there is high similarity between herbs of
these two study stands and it is a known fact that the
herbs have a very wide geographical range in
distribution. Further, there is a gradual change in
altitude between these two study stands. There is a very
low similarity between trees of Hanuman Camp and
Yarlung and as a result the similarity value of all species
between these two stands drops. This could be due to
the reason that there is an abrupt change in altitude
between Hanuman Camp and Yarlung and as a result a
rapid turn over of tree species occurs. Murphy & Logo
(1986) suggested that the differences in the species
composition and physiognomy of vegetation might be
Page 11
Nature and Science, 2011;9(12) http://www.sciencepub.net/nature
135
due to soil characteristics. The variation in other habitat
conditions may also alter the species composition. The
evenness index of tree, shrub and herb in the present
study are very high. Uniyal et al. (2010) also reported
high value of evenness index from undisturbed mixed
forest in Dewalgarh watershed of Garhwal Himalaya.
The higher values of evenness index indicate an even
distribution of individuals within the various species. In
fact, a high value of the evenness index reflects that
much of the value of diversity is attributed to the species
that are relatively rare (Pandey & Shukla, 2003).
Shegong Hanuman Camp Yarlung
0
20
40
60
80
100
Pe
rce
nta
ge
of
sp
ec
ies
Study stands
Regular Random Clumped
Figure 5. Species distribution pattern in three study
stands.
In all the three study stands most of the species
exhibits clump or contagious distribution while, only
few species shows regular and random distribution.
None of the species in Hanuman Camp shows regular
distribution. Paul (2008) also reported clump
distribution of plant species from temperate broad
leaved Rhododendron forest of western Arunachal
Pradesh. Moreover, contagious distribution has been
reported by many other workers (Mehta et al., 1997,
Kumar & Bhatt, 2006 and Singh et al., 2009) from
temperate forest of Garhwal Himalayas. However,
Semwal (2010) have reported that although few species
exhibits regular distribution but random distribution is
common in temperate forest of Kedarnath Wildlife
Sanctuary, Central Himalaya. Odum (1971) have
emphasized that contagious distribution is the
commonest pattern in nature, which is due to small but
significant variations in the environment. The random
distribution is found only in very uniform
environmental conditions whereas, the regular
distribution occurs where severe competition between
the individuals exists (Panchal & Pandey, 2004).
Highest species richness and density is
represented by the girth class 40–70 cm in all the study
stands. However, there is decrease in richness as well as
in density with increasing girth class which is in
conformity with the finding of Newbery et al. (1992)
from Dipterocarp forest at Danum valley in Malaysia,
Hara et al. (1997) in evergreen broad-leaved forests
from Japan, Kadavul & Parthasaeathy (1999) in semi-
evergreen forest in the Shervarayan hills of Eastern
Ghats, India. The basal area also increases initially upto
certain level with increasing girth class. Highest basal
area was recorded in higher girth class (>250 cm) in all
the three study stands could be attributed to the presence
of large trees (Taxus walliciana, Abies densa, Pinus
wallichiana etc.) having large bole.
Figure 6. Density ha
-1 ( ), species richness ( ) and
Basal area (m2ha
–1) ( ) of woody species in different
girth classes (cm) in the three study stands.
5. Conclusion
From the present study, it can be concluded
that there is a variation in species richness/diversity in
Page 12
Nature and Science, 2011;9(12) http://www.sciencepub.net/nature
136
the three study stands along the altitudinal gradient.
Moreover, it was found that there is considerable
difference between the study stands in species
composition and community structure. The lower
altitude has more species richness and decreases with
the increase in altitude. The change in species
composition along the altitudinal gradient may be due to
variation in microclimate and edaphic factors. The
species richness of trees, shrubs and herbs is one of the
major considerations in recognizing of an area for
conservation. According to Whittaker (1972) the
altitudinal gradient is an important factor affecting
species composition and structure and climatic and soil
factors changed in a regular way along altitudinal
gradient.
Acknowledgements:
Financial support was provided by the University Grant
Commission, New Delhi through Rajiv Gandhi Nation
Fellowship award.
Authors:
Sanjeeb Bharali*
Department of Forestry, North Eastern Regional
Institute of Science & Technology
(Deemed University), Nirjuli – 791109 (Itanagar),
Arunachal Pradesh, India.
E-mail- [email protected]
Phone No. (+91) 9436094198
Ashish Paul
Department of Forestry, North Eastern Regional
Institute of Science & Technology
(Deemed University), Nirjuli – 791109 (Itanagar),
Arunachal Pradesh, India.
E-mail- [email protected]
Phone No. (+91) 9402617578
Mohamed Latif Khan1
Department of Forestry, North Eastern Regional
Institute of Science & Technology
(Deemed University), Nirjuli – 791109 (Itanagar),
Arunachal Pradesh, India.
E-mail- [email protected]
Phone No. (+91) 9425280739
Lal Bihari Singha
Department of Forestry, North Eastern Regional
Institute of Science & Technology
(Deemed University), Nirjuli – 791109 (Itanagar),
Arunachal Pradesh, India.
E-mail- [email protected]
Phone No. (+91) 9436228916
*For correspondence
1Present address – Department of Botany, Guru
Ghasidas University, Koni 495009, Bilaspur,
Chhattisgarh, India.
Reference 1. Baduni NP. Growing stock variation in different forest
cover types of Pauri Garhwal. PhD thesis, HNB
Garhwal University, Srinagar (Garhwal) Uttaranchal,
India, 1996.
2. Behera MD, Kushwaha SPS. An analysis of altitudinal
behavior of tree species in Subansiri district, Eastern
Himalaya. Biodiversity and Conservation 2007; 16(6):
1851–1865.
3. Behera MD, Kushwaha SPS, Roy PS, Srivastava S,
Singh TP, Dubey RC. Comparing structure and
composition of coniferous forests in Subansiri district,
Arunachal Pradesh. Current Science 2002; 82(1): 70–
76.
4. Bhandari BS, Tiwari SC. Dominance and diversity
along an altitudinal gradient in a montane forest of
Garhwal Himalaya. Proceedings of the Indian
National Science Academy. Part B, Biological
sciences 1997; 63(6): 639–646.
5. Bhatnagar HP. Phytosociological studies in some
evergreen (Hollong–Nahor) forests of Assam.
Tropical Ecology 1966; 7: 8–13.
6. Chandra J, Rawat VS, Rawat YS, Ram J. Vegetational
diversity along an altitudinal range in Garhwal
Himalaya. International Journal of Biodiversity and
Conservation 2010; 2(1): 14–18.
7. Chaudhary RP. Vegetation Pattern. In: Majpuria T.C.
eds. Nepal natuer's paradise. M. Devi, Gwalior, India,
1999.
8. Currie DJ. Energy and large scale patterns of animal
and plant species richness. The American Naturalist
1991; 137 (1): 27–49.
9. Drake JA. The mechanics of community assembly and
succession. Journal of Theoretical Biology 1990;
147(2): 213–233.
10. Ellu G, Obua J. Tree condition and natural
regeneration in disturbed sites of Bwindi
Impenetrable forest national park, southwestern
Uganda. Tropical Ecology 2005; 46(1): 99–111.
11. FSI. State of Forest Report. Ministry of Environment
and forest, Govt. of India, Dehra Dun, 2009.
12. Elourard C, Pascal JP, Pelissier R, Ramesh BR,
Houllier F, Durand M, Aravajy S, Moravie MA,
Gimaret–Carpentier C. Monitoring the structure and
dynamics of a dense moist evergreen forest in the
Western Ghats (Kodagu District, Karnataka, India).
Tropical Ecology 1997; 38: 193–214.
13. Gairola S, Rawal RS, Todaria NP. Forest vegetation
patterns along an altitudinal gradient in sub–alpine
zone of west Himalaya, India. African Journal of Plant
Science 2008; 2 (6): 42–48.
14. Gaston KJ. Global patterns in biodiversity. Nature
2000; 405(6783): 220–226.
15. Ghildiyal SK, Baduni NP, Khanduri VP, Sharma CM.
Community Structure and composition of oak forests
Page 13
Nature and Science, 2011;9(12) http://www.sciencepub.net/nature
137
along altitudinal gradient in Garhwal Himalaya. Indian
journal of Forestry 1998; 21(3): 242–247.
16. Ghimire BK, Lekhak HD, Chaudhary RP, Vetaas OR.
Vegetation analysis along an altitudinal gradient of
Juniperus indica forest in Southern Manang Valley,
Nepal. International Journal of Ecology &
Development 2008; 9: 20–29.
17. Hara M, Hirata K, Fujihara M, Oono K, Hsieh CF.
Floristic composition and stand structure of three
evergreen broad–leaved forests in Taiwan, with
special reference to the relationship between micro–
landform and vegetation pattern. Natural History
Research 1997; 4: 81–112.
18. Jain SK, Rao RR. A handbook of field and herbarium
technique. Today and Tomorrow Publisher. New
Delhi, India, 1977; 157 pp.
19. Jiang Y, Kang M, Zhu Y, Xu G. Plant biodiversity
patterns on Helan Mountain, China. Acta Oecologica
2007; 32(2): 125–133.
20. Joshi SK, Behera N. Qualitative analysis of vegetation
from a mixed tropical forest of Orissa, India. Indian
Forester 1991; 117: 200–206.
21. Kadavul K, Parthasaeathy N. Plant biodiversity and
conservation of tropical semi–evergreen forest in the
Shervarayan hills of Eastern Ghats, India. Biodiversity
and Conservation 1999; 8(3): 421–439.
22. Kala CP, Mathur VB. Patterns of Plant Species
Distribution in the Trans-Himalayan Region of
Ladakh, India. Journal of Vegetation Science 2002;
13(6): 751–754.
23. Kharkwal G, Rawat YS. Structure and composition of
vegetation in subtropical forest of Kumaun Himalaya.
African Journal of Plant Science 2010; 4(4): 116–121.
24. Kharkwal G, Mehrotra P, Rawat YS, Pangtey YPS.
Phytodiversity and growth form in relation to
altitudinal gradient in the Central Himalayan
(Kumaun) region of India. Current Science 2005;
89(5): 873–878.
25. Kitayama K. An altitudinal transect study of the
vegetation on Mount Kinabalu, Borneo. Plant Ecology
1992; 102(2): 149–171.
26. Koirala M. Vegetation composition and diversity of
Piluwa micro–watershed in Tinjure–Milke region,
East Nepal. Himalayan Journal of Sciences 2004;
2(3): 29–32.
27. Korner C. A re–assessment of high elevation treeline
positions and their explanation. Oecologia 1998;
115(4): 445–459.
28. Kukshal S, Nautiyal BP, Anthwal A, Sharma A, Bhatt
AB. Phytosociological Investigation and life form
pattern of grazingglands under pine canopy in
temperate zone, northwestern Himalaya, India.
Research Journal of Botany 2009; 4(2): 55–69.
29. Kumar A, Ram J. Anthropogenic disturbances and
plant biodiversity in forests of Uttaranchal, central
Himalaya. Biodiversity and Conservation 2005; 14(2):
309–331.
30. Kumar M, Bhatt VP. Plant biodiversity and
conservation of forests in foot hills of Garhwal
Himalaya. Journal of Ecology and Application 2006;
11(2): 43–59.
31. Kumar M, Sharma CM, Rajwar GS. The effect of
disturbance on forest structure and diversity at
different altitude in Garhwal Himalaya. Chinese
Journal of Ecology 2009; 28(3): 424–432.
32. Kunwar RM, Sharma SP. Quantitative analysis of tree
species in two community forests of Dolpa district,
mid–west Nepal. Himalayan Journal of Sciences 2004;
2(3): 23–28.
33. Lan S. Plant species diversity in Wuyishan national
nature reserve. Scientia Silvae Sinicae 2003; 29(1):
36–43.
34. Li Q, Yang L, Zhou J. Comparative analysis on
species diversity of hillcolsed afforested plant
community in Beijing Jiulong Mountain. Chinese
journal of applied ecology 2002; 13(9): 1065–1068.
35. Magurran AE. Ecological Diversity and Its
Measurement. Croom Helm, London, 1988.
36. Majila BS, Kala CP. Forest Structure and
Regeneration along the Altitudinal Gradient in the
Binsar Wildlife Sanctuary, Uttarakhand Himalaya,
India. Russian Journal of Ecology 2010; 41(1): 75–83.
37. Manabe T, Nishimura N, Miura M, Yamamoto S.
Population structure and spatial patterns for trees in a
temperate old–growth evergreen broad–leaved forest
in Japan. Plant Ecology 2000; 151(2): 181–197.
38. Mehta JP, Tewari SC, Bhandari BS. Phytosociology
of woody vegetation under different management
regimes in Garhwal Himalaya. Journal of tropical
Forest Science 1997; 10(1): 24–34.
39. Menhinick EF. A comparison of some species–
individuals diversity indices applied to samples of
field insects. Ecology 1964; 45(4): 859–861.
40. Misra R. Ecology Work Book. Oxford and IBH
Publishing Company, New Delhi, 1968.
41. Mueller–Dombois D. and Ellenberg H. Aims and
Methods of Vegetation Ecology. John Wiley and sons,
New York, 1974.
42. Murphy PG, Lugo AE. Ecology of dry tropical forest.
Ecology, Evolution and systematics 1986; 17: 67–88.
43. Murthy NS, Pathak SJ. Dominance, diversity and net
primary production in grassland at Rajkot, India.
Japanese Journal of Ecology 1972; 222: 1–21.
44. Negi BS, Chauhan DS, Todaria NP. Comparative
plant diversity between panchayat and adjoining
reserve forest in Garhwal Himalaya. Indian Journal of
Forestry 2008; 31(4): 585–593.
45. Newbery D, McC EJF, Campbell YF, Lee CFR, Still
MJ. Primary lowland Dipterocarp forest at Danum
valley. Sabah. Malayisa: Structure, relative abundance
and family composition. Proc. Trans. Royal Society
London 1992; 335(B): 341–356.
46. Odland A, Birks HJB. The altitudinal gradient of
vascular plant species richness in Aurland, western
Norway. Ecography 1999; 22(5):548–566.
47. Odum EP. Fundamentals of Ecology. 3rd
Edition. WB
Saunders Company, Philadelphia, USA, 1971.
Page 14
Nature and Science, 2011;9(12) http://www.sciencepub.net/nature
138
48. Panchal NS, Pandey AN. Analysis of vegetation of
Rampara forest in Saurashtra region of Gujarat state of
India. Tropical Ecology 2004; 45(2): 223–231.
49. Pande PK, Negi JDS, Sharma SC. Plant species
diversity and vegetation analysis in moist temperate
Himalayan Forests. Abstract, First Indian Ecological
Congress 27–31 December 1996, New Delhi.
50. Pande PK, Negi JDS, Sharma SC. Plant species
diversity, composition, gradient analysis and
regeneration behavior of some tree species in a moist
temperate western––Himalayan forest ecosystem.
Indian Forester 2002; 128(8): 869–886.
51. Pandey SK, Shukla RP. Plant diversity in managed sal
(Shorea robusta Gaertn.) forests of Gorakhpur, India:
species composition, regeneration and conservation.
Biodiversity and Conservation 2003; 12(11): 2295–
2319.
52. Panthi MP, Chaudhary RP, Vetaas OR. Plant species
richness and composition in a trans–Himalayan inner
valley of Manang district, central Nepal. Himalayan
Journal of Sciences 2007; 4(6): 57–64.
53. Parsons DJ. Vegetation structure in the mediterranean
scrub communities of California and Chile. Journal of
Ecology 1976; 64(2): 435–447.
54. Paul A. Studies on diversity and regeneration ecology
of Rhododendrons in Arunachal Pradesh. Ph.D. thesis,
Assam University, Silchar, Assam, India, 2008.
55. Pielou EC. The measurement of diversity in different
types of biological collections. Journal of Theoretical
Biology 1966; 13: 131–144.
56. Ralhan PK, Saxena AK, Singh JS. Analysis of forest
vegetation at and around Nainital in Kumaun
Himalaya. Proceedings of Indian National Science
Academy 1982; 48(B): 121–137.
57. Ram J, Kumar A, Bhatt J. Plant diversity in six forest
types of Uttaranchal, Central Himalaya, India. Current
Science 2004; 86(7): 975–978.
58. Saxena AK, Singh JS. A phytosociological analysis of
forest communities of part of Kumaun Himalaya.
Plant Ecology 1982; 50(1): 3–22.
59. Schall JJ, Pianka ER. Geographical trends in numbers
of species. Science 1978; 201(4357): 679–686.
60. Semwal DP, Uniyal PL, Bhatt AB. Structure,
Composition and Dominance–Diversity Relations in
Three Forest Types of a Part of Kedarnath Wildlife
Sanctuary, Central Himalaya, India. Notulae Scientia
Biologicae 2010; 2(3): 128–132.
61. Shannon CE, Wiener W. The mathematical theory of
communities. University of Illionis Press, Urbana,
1963.
62. Sharma CM, Baduni NP. Effect of aspect on the
structure of some natural stands of Abies pindrow in
Himalayan moist temperate forests. The
Environmentalist 2000; 20(4): 309–317.
63. Sharma CM, Suyal S, Gairola S, Ghildiyal SK.
Species richness and diversity along an altitudinal
gradient in moist temperate forest of Garhwal
Himalaya. The Journal of American Science 2009;
5(5):119–128.
64. Simpson EM. 1949. Measurements of diversity.
Nature 163(4148): 688.
65. Singh H, Kumar M, Sheikh MA. Distribution pattern
of Oak and Pine along altitudinal gradients in Garhwal
Himalaya. Nature and Science 2009; 7(11): 81–85.
66. Sorensen T. A method of establishing groups of equal
amplitude in plant sociology based on similarity of
species and its application to analyses of the
vegetation on Danish commons. Biologiske Skrifter /
Kongelige Danske Videnskabernes Selskab 1948; 5:
1–34.
67. Tang Z, Fang J, Zhang L. Patterns of woody plant
species diversity along environmental gradients on
Mt.Taibai, Qinling Mountains. Biodiversity Science
2004;12(1): 115–122.
68. Uniyal P, Pokhriyal P, Dasgupta S, Bhatt D, Todaria
NP. Plant diversity in two forest types along the
disturbance gradient in Dewalgarh Watershed,
Garhwal Himalaya. Current Science 2010; 98(7): 938–
943.
69. Upreti N, Tewari JC, Singh SP. The oak forests of
Kumaun Himalaya (India): Composition, Diversity,
and regeneration. Mountain Research and
Development 1985; 5(2): 163–174.
70. Verma RK, Shadangi DK, Totey NC. Analysis of
biodiversity and improvement in soil quality under
plantations on degraded land. Indian Journal of
Forestry 2001; 24(1): 21-28.
71. Wang Z, Tang Z, Fan J. Altitudinal patterns of seed
plant richness in the Gaoligong Mountains, south–east
Tibet, China. Diversity and Distributions 2007; 13(3):
845–854.
72. Whitford PB. Distribution of woodland plants in
relation to succession and clonal growth. Ecology
1949; 30(2): 199–208.
73. Whittaker RH. Vegetation of Siskiyou Mountains,
Oregon and California. Ecological Monographs 1960;
30(3): 279–338.
74. Whittaker RH. Evolution and measurement of species
diversity. Taxon 1972; 21(2/3): 213–251.
75. Whittaker RH. Communities and Ecosystems.
Macmillan Publisher, New York, 1975.
76. Wright DH. Species–energy theory: an extension of
species–area theory. Oikos 1983; 41(3): 496–506.
77. Zegeye H, Teketay D, Kelbessa E. Diversity and
regeneration status of woody species in Tara Gedam
and Abebaye forests, northwestern Ethiopia. Journal
of Forestry Research 2011; 22(3): 315–328.
Page 15
Nature and Science, 2011;9(12) http://www.sciencepub.net/nature
139
Annexure I. Structure and composition of trees, shrubs and herbs in the three studied stands (Density in ha-1
and
basal area in m2 ha
-1).
Name of Species
Shegong Hanuman Camp Yarlung
Density BA IVI Density BA IVI Density BA IVI
TREES
Abies densa Griff. 17 13.4 30.08 10 11.98 18.88 13 5.8 13.2
Acer caesium Wall. ex Brandis – – – 30 1.69 8.95 – – –
Alnus nepalensis D.Don. 27 0.27 7.29 – – – – – –
Castanopsis armata Roxb. – – – – – – 23 2.2 10.5
Castanopsis tribuloides (Smith) A. DC. 37 1.61 15.73 53 5.34 20.43 – – –
Castanopsis indica Roxb. 27 1.43 10.95 47 1.14 14.12 – – –
Cinnamomum glaucescens Nees. – – – – – – 30 0.2 8.2
Cornus capitata Wallich – – – 30 0.12 6.25 – – –
Eurya accuminata DC. – – – – – – 17 0.2 5.3
Eurya sp. 27 0.33 8.93 30 0.07 7.38 – – –
Grewia sp – – – – – – 23 0.1 6.6
Illicium griffithii Hook.f. & Thomson 70 3.09 25.45 80 3.2 19.75 90 2.0 21.3
Leea sp. 30 0.83 11.83 17 0.12 4.27 27 0.5 8.2
Litsea sericea (Nees) Hook. f. 73 1.43 19.82 40 0.48 10.16 43 3.6 18.7
Litsea glutinousa (Lour.) Robinson – – – 33 1.59 10.35 47 2.2 14.5
Litsea sp. – – – – – – 30 0.7 8.3
Lyonia ovalifolia (Wall.) Drude 30 0.66 11.52 – – – – – –
Magnolia hodgsonii Hook.f. & Thomson 50 1.07 17.38 47 2.23 13.2 40 2.2 13.5
Persea sp. – – – 10 0.18 3.06 – – –
Pinus wallichiana A.B. Jacks. 20 9.14 24.25 – – – 13 5.3 12.4
Prunus cerasoides D.Don. – – – 27 0.72 6.72 – – –
Quercus lamellosa Sm. 33 1.06 12.72 – – – 7 10.1 18.0
Rhododendron arizelum I. B. Balfour & Forrest – – – 20 0.29 5.44 60 0.7 18.6
R. grande Wight 93 6.65 35.33 223 9.19 48.61 70 3.5 18.8
R. kenderickii Nutt. 143 3.18 39.79 140 2.77 28.39 110 3.4 27.1
Rhododendron sp. – – – 50 1.46 13.09 127 9.0 44.7
Taxus wallichiana Zuccarni. 30 10.06 28.86 33 19.26 32.86 40 11.1 28.4
Tsuga sp. – – – 13 1.88 6.28 – – –
Unidentified 1 – – – 13 7.87 14.31 13 0.4 4.0
Unidentified 2 – – – 17 3.02 7.56 – – –
Density IVI Density IVI Density IVI
SHRUBS
Aconogonum molle D.Don. – 93 12.39 – – – – 207 19.58
Bamboo sp. – 1723 81.30 – 150 16.18 – – –
Berberis wallichiana DC. – – – – 120 14.90 – 163 12.91
Daphne papyracea Wall. ex. Steud – 123 12.80 – 87 14.29 – 563 37.45
Gaultheria trichophylla Royle – 53 7.92 – 67 11.06 – 127 13.87
G. fragrantissima Wall. – – – – 33 8.66 – 57 8.63
Gaultheria sp. – 57 7.31 – 130 19.2 – 117 15.41
Helwingia himalaica J. D. Hooker & Thomson ex C. B. Clarke – 70 10.03 – 137 19.68 – – –
Lonicera sp. – 50 6.32 – – – – 127 13.21
Rhododendron bothii Nutt. – 50 7.79 – 173 22.33 – 207 22.25
R. vaccinoides Hook. f. – 66 9.90 – 130 19.20 – 243 21.28
R. edgeworthii Hook. f. – 83 12.01 – 133 20.34 – 107 14.28
Rhododendron sp. – 107 13.64 – 127 19.86 – 240 21.13
Page 16
Nature and Science, 2011;9(12) http://www.sciencepub.net/nature
140
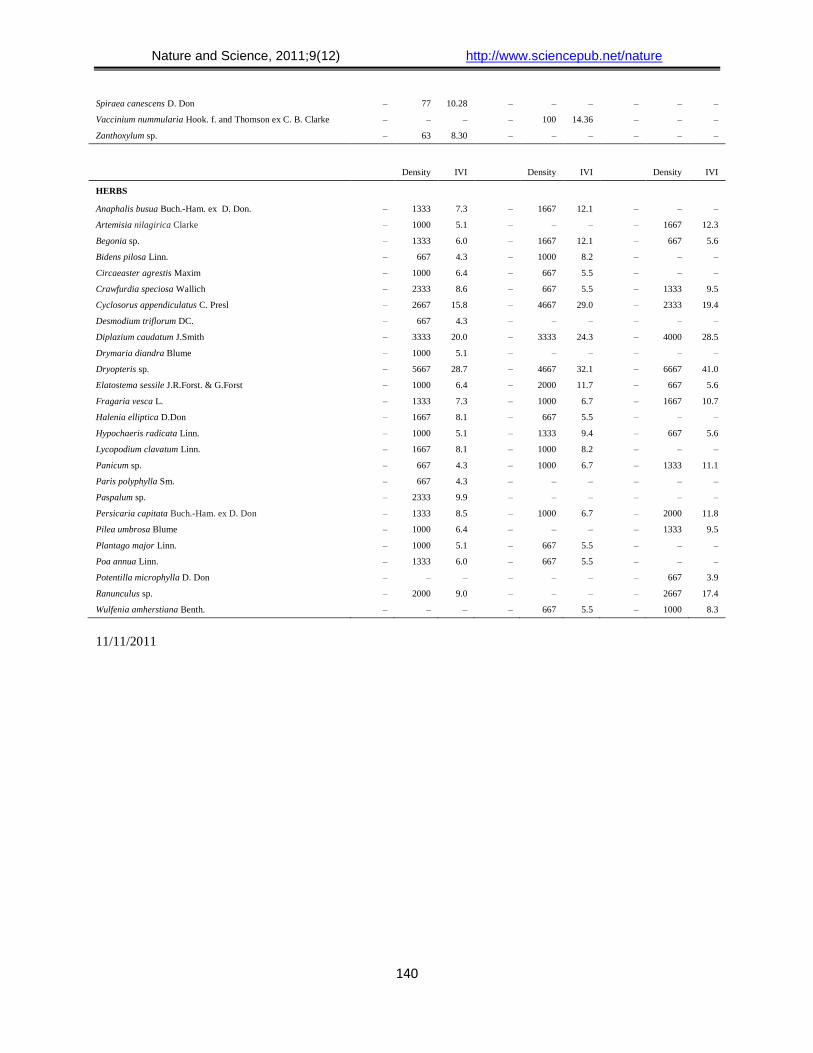
Spiraea canescens D. Don – 77 10.28 – – – – – –
Vaccinium nummularia Hook. f. and Thomson ex C. B. Clarke – – – – 100 14.36 – – –
Zanthoxylum sp. – 63 8.30 – – – – – –
Density IVI Density IVI Density IVI
HERBS
Anaphalis busua Buch.-Ham. ex D. Don. – 1333 7.3 – 1667 12.1 – – –
Artemisia nilagirica Clarke – 1000 5.1 – – – – 1667 12.3
Begonia sp. – 1333 6.0 – 1667 12.1 – 667 5.6
Bidens pilosa Linn. – 667 4.3 – 1000 8.2 – – –
Circaeaster agrestis Maxim – 1000 6.4 – 667 5.5 – – –
Crawfurdia speciosa Wallich – 2333 8.6 – 667 5.5 – 1333 9.5
Cyclosorus appendiculatus C. Presl – 2667 15.8 – 4667 29.0 – 2333 19.4
Desmodium triflorum DC. – 667 4.3 – – – – – –
Diplazium caudatum J.Smith – 3333 20.0 – 3333 24.3 – 4000 28.5
Drymaria diandra Blume – 1000 5.1 – – – – – –
Dryopteris sp. – 5667 28.7 – 4667 32.1 – 6667 41.0
Elatostema sessile J.R.Forst. & G.Forst – 1000 6.4 – 2000 11.7 – 667 5.6
Fragaria vesca L. – 1333 7.3 – 1000 6.7 – 1667 10.7
Halenia elliptica D.Don – 1667 8.1 – 667 5.5 – – –
Hypochaeris radicata Linn. – 1000 5.1 – 1333 9.4 – 667 5.6
Lycopodium clavatum Linn. – 1667 8.1 – 1000 8.2 – – –
Panicum sp. – 667 4.3 – 1000 6.7 – 1333 11.1
Paris polyphylla Sm. – 667 4.3 – – – – – –
Paspalum sp. – 2333 9.9 – – – – – –
Persicaria capitata Buch.-Ham. ex D. Don – 1333 8.5 – 1000 6.7 – 2000 11.8
Pilea umbrosa Blume – 1000 6.4 – – – – 1333 9.5
Plantago major Linn. – 1000 5.1 – 667 5.5 – – –
Poa annua Linn. – 1333 6.0 – 667 5.5 – – –
Potentilla microphylla D. Don – – – – – – – 667 3.9
Ranunculus sp. – 2000 9.0 – – – – 2667 17.4
Wulfenia amherstiana Benth. – – – – 667 5.5 – 1000 8.3
11/11/2011