j ourna l h omepa ge: www.elsev ier .com/ locate /apcatb
ature of active sites in Ni2P hydrotreating catalysts as probedy iron substitution
aiyan Zhaoa,b, S. Ted Oyamaa,c,∗, Hans-Joachim Freundd,adosław Włodarczyke, Marek Sierka f
Department of Chemical Engineering, Virginia Tech, Blacksburg, VA 24061, USADepartment of Chemical Engineering, University of Idaho, Idaho Falls, ID 83402, USADepartment of Chemical Systems Engineering, The University of Tokyo, 7-3-1 Hongo, Bunkyo-ku, Tokyo 113-8656, JapanDepartment of Chemical Physics, Fritz Haber Institute of the Max Planck Society, Faradayweg 4-6, Berlin 14195, GermanyInstitut für Chemie, Humboldt-Universität zu Berlin, Unter den Linden 6, 10099 Berlin, GermanyOtto-Schott-Institut für Materialforschung, Friedrich-Schiller-Universität Jena, Löbdergraben 32, D-07743 Jena, Germany
r t i c l e i n f o
rticle history:eceived 18 June 2014eceived in revised form 28 August 2014ccepted 6 September 2014vailable online 16 September 2014
a b s t r a c t
A series of NiFeP/SiO2 catalysts with different Ni:Fe molar ratios (1:0, 3:1, 1:1, 1:3, 0:1) was investigatedfor the hydrodesulfurization (HDS) of 4,6-dimethyldibenzothiophene. The Fe component is a good probefor active sites because Ni2P and Fe2P adopt the same hexagonal crystal structure, yet Fe2P is completelyinactive for HDS. X-ray diffraction analysis and FTIR spectroscopy of adsorbed CO indicated the formationhomologous alloys. At 3.1 MPa and 613 K (340 ◦C) the activity of the alloys was similar to that of Ni2P,
eywords:irect hydrodesulfurizationickel iron phosphides,6-DimethyldibenzothiopheneTIRXAFS
which was very high. There was also unprecedented selectivity toward direct desulfurization (DDS). Areconstruction of the NiFe phase occurred to expose more Ni sites, likely driven by the formation ofsurface Ni-S bonds as observed by EXAFS. The analysis showed that Ni(2) pyramidal sites responsible forhydrogenation were largely replaced by Fe. This left behind Ni(1) tetrahedral sites which favor DDS andexplains the reactivity results.
The removal of sulfur from petroleum is important for produc-ng clean transportation fuels and is an area of active research1,2]. The US Environmental Protection Agency recently issued anal rule requiring refineries to cut sulfur levels in gasoline from0 ppm to 10 ppm by Jan. 2017 [3]. Current topics of study include
nvestigation of the nitrogen tolerance [4], trimetallic composi-ions [5], the addition of additives like P and B [6] and Ga [7], these of egg-shell or hierarchical supports [8], the use of compos-
te supports [9,10], the use of zeolites [11], the use of mesoporousupports [12,13], oxidative desulfurization [14], and noble metals15]. Metal phosphides have recently received extensive attentions a new type of hydrodesulfurization (HDS) catalyst because of
heir high activity and stability in the HDS and hydrodenitrogena-ion (HDN) of model and real feeds [8,16–22]. In initial studies it waseported that the activity of common phosphides follows the order:
∗ Corresponding author at: Department of Chemical Engineering, Virginia Tech,lacksburg, VA 24061, USA. Tel.: +1 540 231 5309; fax: +1 540 231 5022.
Ni2P > WP > MoP > CoP > Fe2P in the simultaneous HDS of diben-zothiophene (3000 ppm S) and HDN of quinoline (2000 ppm N) at643 K (370 ◦C) and 3.1 MPa, with the comparison based on equalsites (240 �mol CO chemisorption for phosphides) [23,24]. A num-ber of bimetallic phosphides such as NixMoyP [25–30], CoxMoyP[31] and NixCoyP [32,33] have also been studied because a syner-gistic effect between the components was foreseen as found forpromoted metal sulfides. Unexpectedly, however, these bimetallicphosphide phases did not show enhanced activity over the compo-nent Ni, Co or Mo phosphides, except for the case of CoxNiyP [20]where a 50% increase in conversion was found.
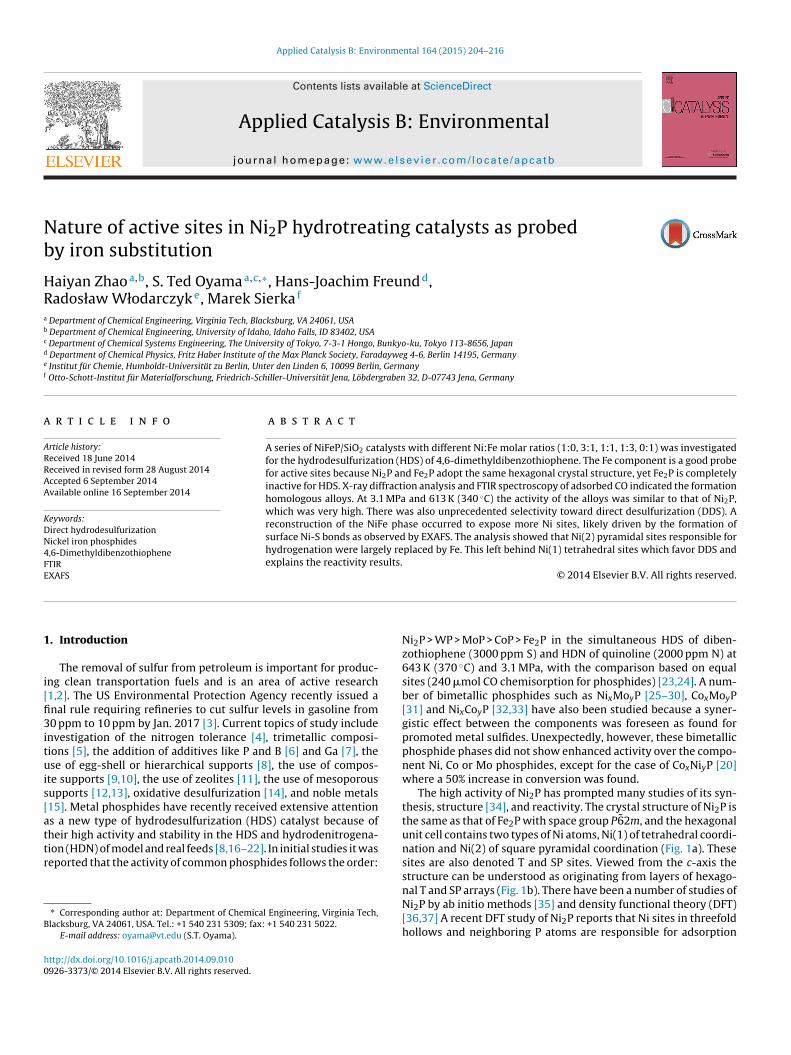
The high activity of Ni2P has prompted many studies of its syn-thesis, structure [34], and reactivity. The crystal structure of Ni2P isthe same as that of Fe2P with space group P62m, and the hexagonalunit cell contains two types of Ni atoms, Ni(1) of tetrahedral coordi-nation and Ni(2) of square pyramidal coordination (Fig. 1a). Thesesites are also denoted T and SP sites. Viewed from the c-axis thestructure can be understood as originating from layers of hexago-
nal T and SP arrays (Fig. 1b). There have been a number of studies ofNi2P by ab initio methods [35] and density functional theory (DFT)[36,37] A recent DFT study of Ni2P reports that Ni sites in threefoldhollows and neighboring P atoms are responsible for adsorption
Fig. 1. Fe2P and Ni2P crystal structure with symmetry equivalent sites (Refs.[10,11]). Metal atoms occupy tetrahedral (T) sites (orange) and square pyramidal(SP) sites (green), while phosphorus atoms are located in P1 and P2 sites. (a) Unitcell. (b) Top view showing two hexagonal layers in the c direction. (For interpreta-tion of the references to color in this figure legend, the reader is referred to the webv
oef
pciistIFC(t
2
2
pt(l(l9HR(a
equation, Dc = K�/ cos(�), where K is a constant as 0.9, � is thewavelength of the X-ray radiation, is the peak width in radians at
ersion of this article.)
f H and OH [38]. In the present work DFT is used to examine thenergetics of substitution of Fe for Ni in the Ni2P lattice, and it isound that the energy differences are small.
A recent study indicated that the pyramidal Ni(2) type wasarticularly active for HDS by the hydrogenation route [39]. Theompound Fe2P is isostructural with Ni2P [40,41], and it was ofnterest to study NiFeP alloys because Fe2P itself has very low activ-ty, so in a preliminary study by the authors it was surmised thatubstitution of Fe for Ni could provide confirmation of the role of thewo types of Ni atoms [42]. This work extends the previous study.n order to gain insight into the nature of the surface active sitesourier transform infrared (FTIR) spectroscopy is employed usingO as the probe molecule. Extended X-ray absorption fine structureEXAFS) measurements are carried out to elucidate the structure ofhe alloy formed by substitution of the Fe atom in the active phase.
. Experimental
.1. Materials
The support fumed silica EH-5 (Surface area = 350 m2 g−1) wasrovided by Cabot Corp. The chemicals used in the synthesis ofhe catalysts were Fe(NO3)3·9H2O (Aldrich, 99%), Ni (NO3)2·6H2OAlfa Aesar, 99%), (NH4)2HPO4 (Aldrich, 99%). The chemicals uti-ized in the reactivity study were 4,6-dimethyldibenzothiophenesynthesized, 95%), dimethyl disulfide (Acros Organics, 99%), quino-ine (Aldrich, 98%), tetralin (Aldrich, 97%), n-octane (Acros Organics,9%), and n-tridecane (Alfa Aesar, 99%). The gases employed were2 (Airco, Grade 5, 99.99%), He (Airco, Grade 5, 99.99%), CO (Lindeesearch Grade, 99.97%), 0.5% O2/He (Airco, UHP Grade, 99.99%), O2
The NiFeP catalysts were prepared by temperature-programmed reduction (TPR), following procedures reportedpreviously [43,44]. Briefly, the synthesis of the catalysts involvedtwo stages. First, solutions of the corresponding metal phosphateprecursors were prepared by dissolving appropriate amounts ofFe(NO3)3·9H2O, Ni(NO3)2·6H2O, with ammonium phosphate indistilled water, and these solutions were used to impregnate silicaEH-5 by the incipient wetness method. The obtained samples weredried and calcined at 500 ◦C for 6 h, then ground with a mortarand pestle, pelletized with a press (Carver, Model C), and sievedto particles of 650–1180 �m diameter (16/20 mesh). Second,the solid phosphates were reduced to phosphides at 2 ◦C min−1
in flowing H2 [1000 cm3 (NTP) min−1 g−1]. The reduction tem-peratures were 825 K (552 ◦C) for Ni2P/SiO2, 835 K (562 ◦C) forNiFeP(3:1)/SiO2, 840 K (567 ◦C) for NiFeP(1:1)/SiO2, 845 K (572 ◦C)for NiFeP(1:3)/SiO2 and for Fe2P/SiO2. The samples were kept atthe reduction temperatures for 2 h, followed by cooling to roomtemperature under He flow [100 cm3 (NTP) min−1], and thenpassivated at room temperature in a 0.5% O2/He for 4 h. The totalmetal molar loading was 1.6 mmol g−1 (mmol per g of support)in all cases and the metal to phosphorus ration in the precursoris 1:2. Compositions prepared were Ni2P/SiO2, NiFeP(3:1)/SiO2,NiFeP(1:1)/SiO2, NiFeP(1:3)/SiO2, and Fe2P/SiO2, where the num-bers in parenthesis are molar ratios. The overall weight loadingsfor all of the metal phosphide catalysts were very close around8 wt.% (see Table 3).
2.3. Characterization
Temperature-programmed reduction (TPR) was carried out onpelletized catalyst samples (typically 0.2 g) placed in quartz U-tubereactors. The samples were heated with linear temperature rampsin flowing hydrogen to reduce the metal phosphate to metal phos-phide. The temperature was increased from room temperature to973 K (700 ◦C) at 2 ◦C with a hydrogen flow rate of 200 cm3 (NTP)min−1. A portion of the exit gas flow was sampled through a leakvalve into a mass spectrometer and the masses 2 (H2), 18 (H2O), 31(P) and 34 (PH3) were monitored during the experiment and usedto decide the optimal reduction temperature.
Irreversible CO uptake measurements were used to titrate thesurface metal atoms and to provide an estimate of the active sites onthe catalysts for the transition metal phosphides. Usually, 0.3 g of apassivated sample was loaded into a quartz reactor. The passivatedtransition metal phosphides were reduced at 450 ◦C for 2 h. Aftercooling in He, pulses of CO in a He carrier at 65 cm3 (NTP) min−1
were injected at room temperature through a sampling valve, andthe mass 28 (CO) signal was monitored with mass spectrometer. COuptake was calculated by measuring the decrease in the peak areascaused by adsorption in comparison with the area of the calibratedvolume of 19.5 �mol gas.
Surface areas of the samples were obtained using the BETmethod based on adsorption isotherms at liquid nitrogen temper-ature, and using a value of 0.162 nm2 for the cross-sectional area ofa N2 molecule. The measurements were performed in a volumet-ric adsorption unit (Micromeritics ASAP 2000). X-ray diffraction(XRD) patterns of the samples were obtained with a Scintag XDS-2000 powder diffractometer operated at 45 kV and 40 mA, using CuK� monochromatized radiation (� = 0.154178 nm). The crystallitesize of the supported samples was calculated using the Scherrer
half-maximum, corrected for instrumental broadening (0.1◦), and2� is the Bragg angle.
X-ray absorption spectra at the Ni K-edge (8.333 keV) and Fe K-dge (7.112 keV) of reference and catalyst samples were recorded inhe energy range 8.233–9.283 keV at beam line X18B at the Nationalynchrotron Light Source at Brookhaven National Laboratory. The-ray ring at the National Synchrotron Light Source has a flux of
× 1010 photons s−1 at 100 mA and 2.5 GeV. The monochromators equipped with a Si(1 1 1) channel-cut single crystal and has annergy range capability of 5.8–40 keV. The crystal was detunedlightly to prevent glitches due to harmonics. EXAFS spectra wereecorded at ambient temperature in transmission mode using ion-zation chambers for the detection of primary (I0, 100% N2) andransmitted (It, 75% N2, balance Ar) beam intensities.
Samples before reaction (labeled as fresh) were reduced inydrogen as for the reactivity studies, and were loaded into cellsith Kapton windows without exposure to the atmosphere. Sam-les after reaction (denoted as spent) were removed from theeactor and placed in a hexane solvent and washed and dried beforeeing transferred to the EXAFS cell, all without exposure to air. Bulkeference samples were diluted with BN (0.1 g cat + 0.3 g BN). TheXAFS data were reduced and analyzed by the program Athena andrtemis [45]. To fit the experimental EXAFS spectra for the fresh andpent samples, theoretical EXAFS models were constructed fromhe software FEFF8 [46] based on the crystal structures of Ni2P ande2P [44]. The Fourier transform (FT) spectra are shown withouthase correction. The FT of the measured spectra was fitted with
k-weight of 1, 2, and 3. The FT figures of the experimental andodeling data are shown with the data processed with a k-weight
f 3.The EXAFS data from the supported Ni2P and Fe2P were trans-
ormed over the data range from 20 to 120 nm−1 and modeled inhe region from 0.1 to 0.3 nm−1. The EXAFS models based on therystal structures of Ni2P and Fe2P contains parameters: energyhift values, coordination number values, �2. The quantity Reff ishe initial reference half path length (bond length for single scat-ering path) as calculated by FEFF. The EXAFS best-fit values forhe half path lengths (R) and �2 are listed in Tables S5–S8 (Sup-lementary information). Multi-edge fittings were carried out forhe samples NiFeP(3:1)/SiO2, NiFeP(1:1)/SiO2, NiFeP(1:3)/SiO2. Forhe spent and fresh NiFeP(1:1)/SiO2, difference spectra of the rawbsorption data between spent and fresh samples were obtainedo show the presence of a small oscillation.
.4. Reactivity studies
Hydrotreating activities of the samples were measured in ahree-phase, packed-bed reactor operated at 3.1 MPa and 613 K340 ◦C) with a model feed liquid containing 500 ppm sulfur as 4,6-MDBT, 3000 ppm sulfur as dimethyl disulfide, 200 ppm nitrogens quinoline, 1 wt.% tetralin, 0.5 wt.% n-octane as internal standard,nd balance n-tridecane. Lack of mass and heat transfer limita-ions was ascertained by making sure that the Weisz-Prater and
ears criteria were satisfied (Supplementary Information). Thechematic of the testing system was described in an earlier paper47]. Briefly, the testing unit consisted of three parallel reactorsmmersed in a fluidized sand bath (Techne, Model SBL-2) whoseemperature was controlled by a temperature controller (Omega,
odel 6015 K). The reactors were 19 mm/16 mm (o.d./i.d.) 316tainless steel tubes with central thermocouples monitoring theemperature of the catalyst. The catalysts were in the form of pel-ets (16/20 mesh), and were supported between quartz wool plugsn a 13 mm i.d. 316 stainless steel basket. The hydrogen flow rate
as set to 100 �mol s−1 (150 cm3 min−1, NTP) with a mass flow
ontroller (Brooks, Model 5850E), and the feed liquid was injectedy a high-pressure liquid pump (LDC Analytical, Model NCI 11D5) at
flow rate of 5 cm3 h−1. Quantities of catalysts loaded in the reac-ors corresponded to the same amount of CO uptake (240 �mol).
2
NiFeP(1:3)/SiO2 40.8Fe2P/SiO2 40.2
The weight of the catalysts used for reactivity test is reported inTable S2 in the supplemental information. The LHSVs for the 5 cata-lysts Ni2P/SiO2, NiFeP(3:1)/SiO2, NiFeP(1:1)/SiO2, NiFeP(1:3)/SiO2,and Fe2P/SiO2 are 1.6 h−1, 1.4 h−1, 0.8 h−1, 0.7 h−1, and 0.8 h−1,respectively. Prior to the reactivity testing, the catalysts were pre-treated in H2 at 723 K (450 ◦C) for 2 h. Hydrotreating products werecollected every few hours in sealed septum vials and were ana-lyzed by a gas chromatograph (Hewlett-Packard, 5890A) equippedwith a 0.32 mm i.d. × 50 m fused silica capillary column (CPSIL-5CB,Chrompack, Inc.) and a flame ionization detector.
2.5. CO-FTIR
Transmission infrared spectra of pressed wafers (∼50 mg) ofcatalysts were collected in situ in a reactor cell placed in aFourier transform infrared (FTIR) spectrometer (Bio-Rad Model FTS3000MX) at a resolution of 4 cm−1 and using 64 scans spectrum.The IR cell was equipped with water-cooled KBr windows, con-nections for inlet and outlet flows, and thermocouples to monitorand control the temperature. Before dosing CO, the samples werereduced in H2 at 723 K (450 ◦C) for 2 h at the same conditions usedfor CO chemisorption and reactivity studies, then cooled to roomtemperature in a He flow and exposed to CO until saturation wasachieved. The samples were then purged in He carrier for 300 s toremove gaseous and weakly adsorbed CO species. The spectra wereobtained in the absorbance mode and are shown after subtractionof a background spectrum obtained on the freshly reduced samplesto make the spectral features more clear.
2.6. Computational details
Periodic density functional theory (DFT) calculations were car-ried out using the Vienna Ab Initio Simulation package (VASP)[48,49] and the Perdew, Burke and Ernzerhof (PBE) exchange-correlation functional [50]. The calculations were performed usingthe projector augmented wave method (PAW), originally devel-oped by Blöchl [51] and adapted by Kresse and Joubert [52]. Only thevalence electrons were explicitly considered. Optimizations of cellparameters used a 7 × 7 × 13 Monkhorst-Pack k-point mesh [53]for the Brillouin-zone sampling and an energy cutoff of 1000 eV fora plane wave basis set. The Pulay stress arising from the incom-plete basis set was minimized by restarting the optimization untilself-consistency of the total energy was reached. Optimizations ofatomic positions for the structures shown in Table 1 were per-formed with a 4 × 4 × 7 Monkhorst-Pack k-point mesh and a planewave cutoff of 400 eV. Optimizations of atomic positions for the
structures shown in Table 2 were performed with a plane wavecutoff of 500 eV. Optimizations of atomic positions for 1 × 1 × 2supercells were performed with 4 × 4 × 4 Monkhorst-Pack k-pointmesh.
H. Zhao et al. / Applied Catalysis B: Environmental 164 (2015) 204–216 207
F1
3
3
sntpiTir
avtpamest7wir1pcNs
3
NpfldFPpw
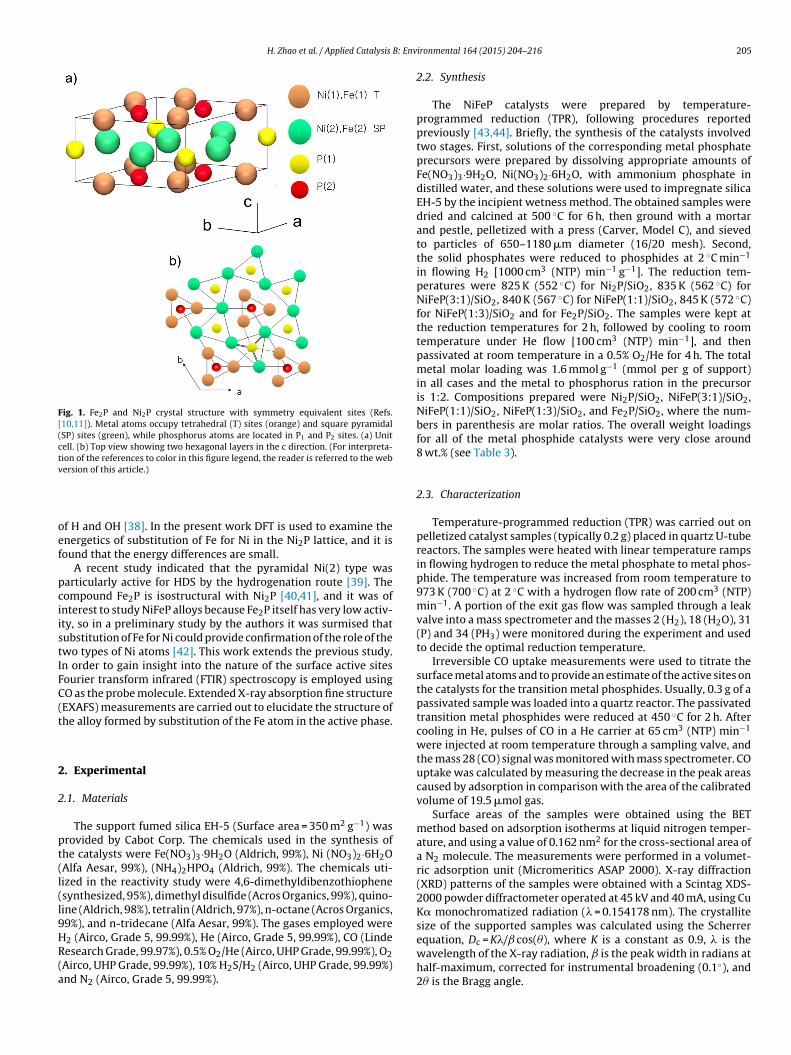
ig. 2. Temperature programmed reduction of Ni2P, Fe2P and NiFeP samples (mass8 signal).
. Results and discussion
.1. Temperature-programmed reduction
The supported nickel-iron phosphides were prepared in twotages as described in the experimental part. First, solutions of theickel-iron and phosphorous components were impregnated onhe silica support and the materials were dried to form supportedhosphate precursors. Second, the phosphates were transformed
nto phosphides by temperature-programmed reduction (TPR). ThePR experiments were carried out to understand the phenomenanvolved in the reduction process and to determine the optimumeduction conditions used for large scale catalyst preparation.
Fig. 2 shows mass 18 for the water evolution during the temper-ture programmed reduction for the NiFeP/SiO2 precursors witharious Ni to Fe ratios. Here only water evolution is shown becausehe other masses provided little additional information. The TPReak for Fe2P/SiO2 is wider than that of Ni2P/SiO2 and has a trailingt high-temperature side which indicates that Fe2P is intrinsicallyore difficult to reduce than Ni2P and thus is probably more het-
rogeneously dispersed. With increasing Fe contents, the TPR traceshowed more peaks and a more complicated overall reduction pat-ern than that of the higher Ni content samples. When Fe reached5% for the sample with Ni to Fe ratio 1:3, two distinct TPR peaksere observed. One peak is very close to the peak temperature of
ron phosphide, the other one overlaps the initial nickel phosphateeduction temperature. As the Ni/Fe ratio decreases (1:0, 3:1, 1:1,:3, 0:1), the reduction peaks for NiFeP catalysts shift to higher tem-erature from 825 to 845 K (552–572 ◦C). These temperatures werehosen for the NiFeP precursor reduction with the correspondingi/Fe ratio to make sure NiFeP catalysts were fully reduced at the
ame time to minimize particles sintering.
.2. X-ray diffraction analysis
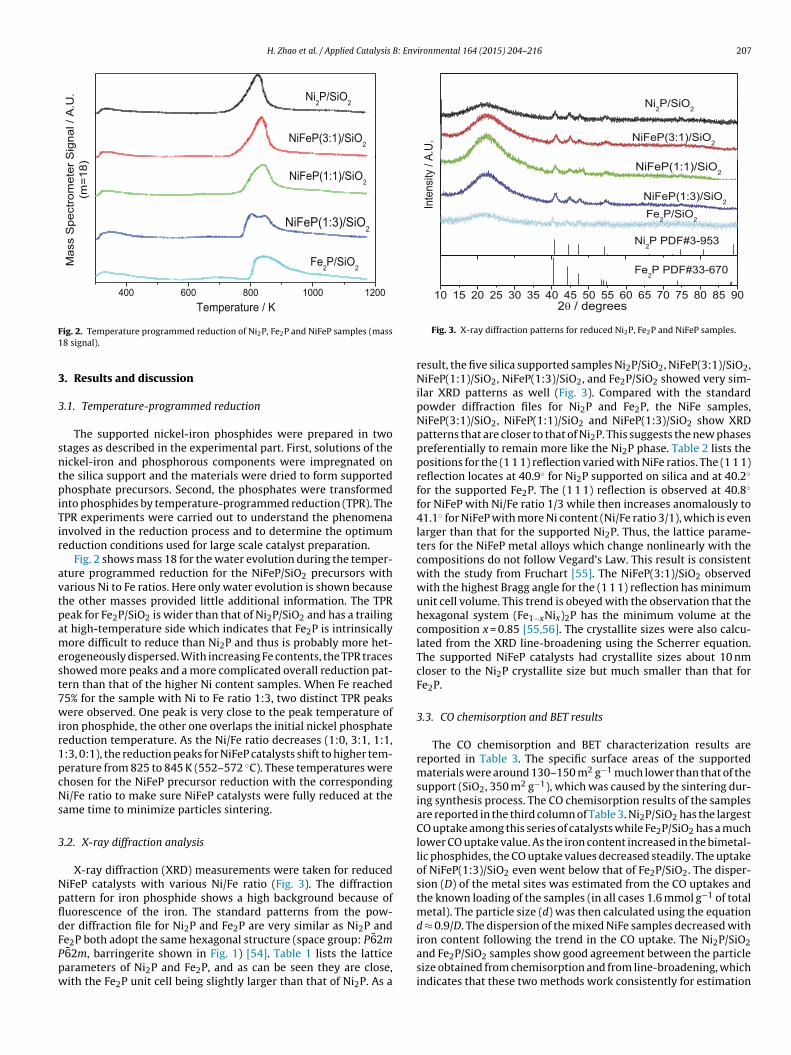
X-ray diffraction (XRD) measurements were taken for reducediFeP catalysts with various Ni/Fe ratio (Fig. 3). The diffractionattern for iron phosphide shows a high background because ofuorescence of the iron. The standard patterns from the pow-er diffraction file for Ni2P and Fe2P are very similar as Ni2P and
e2P both adopt the same hexagonal structure (space group: P62m62m, barringerite shown in Fig. 1) [54]. Table 1 lists the latticearameters of Ni2P and Fe2P, and as can be seen they are close,ith the Fe2P unit cell being slightly larger than that of Ni2P. As a
Fig. 3. X-ray diffraction patterns for reduced Ni2P, Fe2P and NiFeP samples.
result, the five silica supported samples Ni2P/SiO2, NiFeP(3:1)/SiO2,NiFeP(1:1)/SiO2, NiFeP(1:3)/SiO2, and Fe2P/SiO2 showed very sim-ilar XRD patterns as well (Fig. 3). Compared with the standardpowder diffraction files for Ni2P and Fe2P, the NiFe samples,NiFeP(3:1)/SiO2, NiFeP(1:1)/SiO2 and NiFeP(1:3)/SiO2 show XRDpatterns that are closer to that of Ni2P. This suggests the new phasespreferentially to remain more like the Ni2P phase. Table 2 lists thepositions for the (1 1 1) reflection varied with NiFe ratios. The (1 1 1)reflection locates at 40.9◦ for Ni2P supported on silica and at 40.2◦
for the supported Fe2P. The (1 1 1) reflection is observed at 40.8◦
for NiFeP with Ni/Fe ratio 1/3 while then increases anomalously to41.1◦ for NiFeP with more Ni content (Ni/Fe ratio 3/1), which is evenlarger than that for the supported Ni2P. Thus, the lattice parame-ters for the NiFeP metal alloys which change nonlinearly with thecompositions do not follow Vegard’s Law. This result is consistentwith the study from Fruchart [55]. The NiFeP(3:1)/SiO2 observedwith the highest Bragg angle for the (1 1 1) reflection has minimumunit cell volume. This trend is obeyed with the observation that thehexagonal system (Fe1−xNix)2P has the minimum volume at thecomposition x = 0.85 [55,56]. The crystallite sizes were also calcu-lated from the XRD line-broadening using the Scherrer equation.The supported NiFeP catalysts had crystallite sizes about 10 nmcloser to the Ni2P crystallite size but much smaller than that forFe2P.
3.3. CO chemisorption and BET results
The CO chemisorption and BET characterization results arereported in Table 3. The specific surface areas of the supportedmaterials were around 130–150 m2 g−1 much lower than that of thesupport (SiO2, 350 m2 g−1), which was caused by the sintering dur-ing synthesis process. The CO chemisorption results of the samplesare reported in the third column of Table 3. Ni2P/SiO2 has the largestCO uptake among this series of catalysts while Fe2P/SiO2 has a muchlower CO uptake value. As the iron content increased in the bimetal-lic phosphides, the CO uptake values decreased steadily. The uptakeof NiFeP(1:3)/SiO2 even went below that of Fe2P/SiO2. The disper-sion (D) of the metal sites was estimated from the CO uptakes andthe known loading of the samples (in all cases 1.6 mmol g−1 of totalmetal). The particle size (d) was then calculated using the equationd ≈ 0.9/D. The dispersion of the mixed NiFe samples decreased with
iron content following the trend in the CO uptake. The Ni2P/SiO2and Fe2P/SiO2 samples show good agreement between the particlesize obtained from chemisorption and from line-broadening, whichindicates that these two methods work consistently for estimation
208 H. Zhao et al. / Applied Catalysis B: Environmental 164 (2015) 204–216
Table 3Characterization of NiFeP/SiO2 samples.
Sample Loading (wt.%) BET surface area (m2 g−1) CO uptake (�mol g−1) Dispersion (%) Particle sizea (nm) Crystallite sizeb (nm)
a The particle size estimated by 0.9/D based on the CO chemisorption.b The crystallite sizes estimated by the Scherrer equation based on the XRD line-broad
2200 200 0 180 0
0.5 A
2079
2081
2084
2086
NiFeP(1:3 )/SiO2
NiFeP(1:1)/SiO2
Fe2P/SiO
2
NiFeP(3:1 )/SiO2
Ni2P/SiO
2
Abs
orba
nce
/ A.U
.
Wavenumbers / c m -1
0.2 A 2003
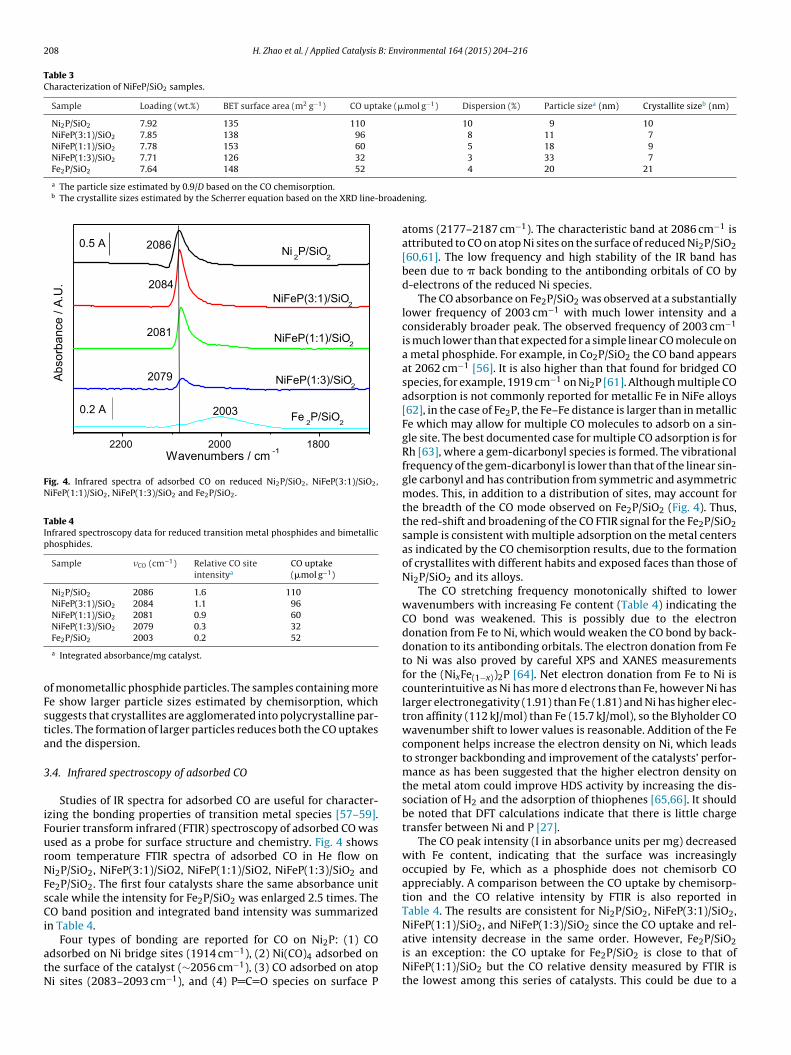
Fig. 4. Infrared spectra of adsorbed CO on reduced Ni2P/SiO2, NiFeP(3:1)/SiO2,NiFeP(1:1)/SiO2, NiFeP(1:3)/SiO2 and Fe2P/SiO2.
Table 4Infrared spectroscopy data for reduced transition metal phosphides and bimetallicphosphides.
f monometallic phosphide particles. The samples containing moree show larger particle sizes estimated by chemisorption, whichuggests that crystallites are agglomerated into polycrystalline par-icles. The formation of larger particles reduces both the CO uptakesnd the dispersion.
.4. Infrared spectroscopy of adsorbed CO
Studies of IR spectra for adsorbed CO are useful for character-zing the bonding properties of transition metal species [57–59].ourier transform infrared (FTIR) spectroscopy of adsorbed CO wassed as a probe for surface structure and chemistry. Fig. 4 showsoom temperature FTIR spectra of adsorbed CO in He flow oni2P/SiO2, NiFeP(3:1)/SiO2, NiFeP(1:1)/SiO2, NiFeP(1:3)/SiO2 ande2P/SiO2. The first four catalysts share the same absorbance unitcale while the intensity for Fe2P/SiO2 was enlarged 2.5 times. TheO band position and integrated band intensity was summarized
n Table 4.
Four types of bonding are reported for CO on Ni2P: (1) CO
dsorbed on Ni bridge sites (1914 cm−1), (2) Ni(CO)4 adsorbed onhe surface of the catalyst (∼2056 cm−1), (3) CO adsorbed on atopi sites (2083–2093 cm−1), and (4) P C O species on surface P
ening.
atoms (2177–2187 cm−1). The characteristic band at 2086 cm−1 isattributed to CO on atop Ni sites on the surface of reduced Ni2P/SiO2[60,61]. The low frequency and high stability of the IR band hasbeen due to � back bonding to the antibonding orbitals of CO byd-electrons of the reduced Ni species.
The CO absorbance on Fe2P/SiO2 was observed at a substantiallylower frequency of 2003 cm−1 with much lower intensity and aconsiderably broader peak. The observed frequency of 2003 cm−1
is much lower than that expected for a simple linear CO molecule ona metal phosphide. For example, in Co2P/SiO2 the CO band appearsat 2062 cm−1 [56]. It is also higher than that found for bridged COspecies, for example, 1919 cm−1 on Ni2P [61]. Although multiple COadsorption is not commonly reported for metallic Fe in NiFe alloys[62], in the case of Fe2P, the Fe–Fe distance is larger than in metallicFe which may allow for multiple CO molecules to adsorb on a sin-gle site. The best documented case for multiple CO adsorption is forRh [63], where a gem-dicarbonyl species is formed. The vibrationalfrequency of the gem-dicarbonyl is lower than that of the linear sin-gle carbonyl and has contribution from symmetric and asymmetricmodes. This, in addition to a distribution of sites, may account forthe breadth of the CO mode observed on Fe2P/SiO2 (Fig. 4). Thus,the red-shift and broadening of the CO FTIR signal for the Fe2P/SiO2sample is consistent with multiple adsorption on the metal centersas indicated by the CO chemisorption results, due to the formationof crystallites with different habits and exposed faces than those ofNi2P/SiO2 and its alloys.
The CO stretching frequency monotonically shifted to lowerwavenumbers with increasing Fe content (Table 4) indicating theCO bond was weakened. This is possibly due to the electrondonation from Fe to Ni, which would weaken the CO bond by back-donation to its antibonding orbitals. The electron donation from Feto Ni was also proved by careful XPS and XANES measurementsfor the (NixFe(1−x))2P [64]. Net electron donation from Fe to Ni iscounterintuitive as Ni has more d electrons than Fe, however Ni haslarger electronegativity (1.91) than Fe (1.81) and Ni has higher elec-tron affinity (112 kJ/mol) than Fe (15.7 kJ/mol), so the Blyholder COwavenumber shift to lower values is reasonable. Addition of the Fecomponent helps increase the electron density on Ni, which leadsto stronger backbonding and improvement of the catalysts’ perfor-mance as has been suggested that the higher electron density onthe metal atom could improve HDS activity by increasing the dis-sociation of H2 and the adsorption of thiophenes [65,66]. It shouldbe noted that DFT calculations indicate that there is little chargetransfer between Ni and P [27].
The CO peak intensity (I in absorbance units per mg) decreasedwith Fe content, indicating that the surface was increasinglyoccupied by Fe, which as a phosphide does not chemisorb COappreciably. A comparison between the CO uptake by chemisorp-tion and the CO relative intensity by FTIR is also reported inTable 4. The results are consistent for Ni2P/SiO2, NiFeP(3:1)/SiO2,NiFeP(1:1)/SiO2, and NiFeP(1:3)/SiO2 since the CO uptake and rel-
ative intensity decrease in the same order. However, Fe2P/SiO2is an exception: the CO uptake for Fe2P/SiO2 is close to that ofNiFeP(1:1)/SiO2 but the CO relative density measured by FTIR isthe lowest among this series of catalysts. This could be due to a
H. Zhao et al. / Applied Catalysis B: Env
020406080
100
0 20 40 60 80 10 00
20406080
100
020406080
1000.02% N0.6% S
ii) 0.05% S
0.02% N0.3% S
i) 0.05% S4,6-D MDB T:DMDS:Quinoline:
c) N iFeP( 1:1)/ SiO2
b) N iFeP( 3:1)/ SiO2
HD
S c
onve
rsio
n / %
Time on Stream / h
a) Ni2P/SiO
2
F ◦
a
ml
3
toooIN(drct4irTasetolaat(s[
ooa[fapi
The Fourier-transformed EXAFS spectra at the Ni K-edge
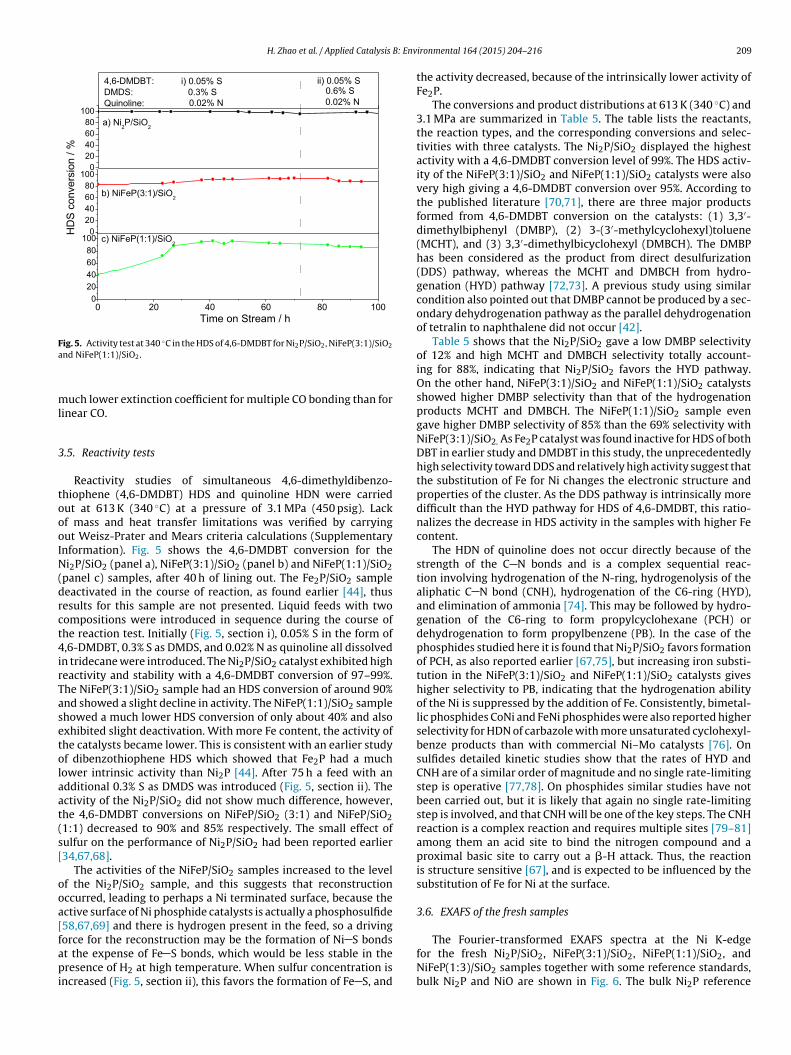
ig. 5. Activity test at 340 C in the HDS of 4,6-DMDBT for Ni2P/SiO2, NiFeP(3:1)/SiO2
nd NiFeP(1:1)/SiO2.
uch lower extinction coefficient for multiple CO bonding than forinear CO.
.5. Reactivity tests
Reactivity studies of simultaneous 4,6-dimethyldibenzo-hiophene (4,6-DMDBT) HDS and quinoline HDN were carriedut at 613 K (340 ◦C) at a pressure of 3.1 MPa (450 psig). Lackf mass and heat transfer limitations was verified by carryingut Weisz-Prater and Mears criteria calculations (Supplementarynformation). Fig. 5 shows the 4,6-DMDBT conversion for thei2P/SiO2 (panel a), NiFeP(3:1)/SiO2 (panel b) and NiFeP(1:1)/SiO2
panel c) samples, after 40 h of lining out. The Fe2P/SiO2 sampleeactivated in the course of reaction, as found earlier [44], thusesults for this sample are not presented. Liquid feeds with twoompositions were introduced in sequence during the course ofhe reaction test. Initially (Fig. 5, section i), 0.05% S in the form of,6-DMDBT, 0.3% S as DMDS, and 0.02% N as quinoline all dissolved
n tridecane were introduced. The Ni2P/SiO2 catalyst exhibited higheactivity and stability with a 4,6-DMDBT conversion of 97–99%.he NiFeP(3:1)/SiO2 sample had an HDS conversion of around 90%nd showed a slight decline in activity. The NiFeP(1:1)/SiO2 samplehowed a much lower HDS conversion of only about 40% and alsoxhibited slight deactivation. With more Fe content, the activity ofhe catalysts became lower. This is consistent with an earlier studyf dibenzothiophene HDS which showed that Fe2P had a muchower intrinsic activity than Ni2P [44]. After 75 h a feed with andditional 0.3% S as DMDS was introduced (Fig. 5, section ii). Thectivity of the Ni2P/SiO2 did not show much difference, however,he 4,6-DMDBT conversions on NiFeP/SiO2 (3:1) and NiFeP/SiO21:1) decreased to 90% and 85% respectively. The small effect ofulfur on the performance of Ni2P/SiO2 had been reported earlier34,67,68].
The activities of the NiFeP/SiO2 samples increased to the levelf the Ni2P/SiO2 sample, and this suggests that reconstructionccurred, leading to perhaps a Ni terminated surface, because thective surface of Ni phosphide catalysts is actually a phosphosulfide58,67,69] and there is hydrogen present in the feed, so a drivingorce for the reconstruction may be the formation of Ni S bonds
t the expense of Fe S bonds, which would be less stable in theresence of H2 at high temperature. When sulfur concentration is
ncreased (Fig. 5, section ii), this favors the formation of Fe S, and
ironmental 164 (2015) 204–216 209
the activity decreased, because of the intrinsically lower activity ofFe2P.
The conversions and product distributions at 613 K (340 ◦C) and3.1 MPa are summarized in Table 5. The table lists the reactants,the reaction types, and the corresponding conversions and selec-tivities with three catalysts. The Ni2P/SiO2 displayed the highestactivity with a 4,6-DMDBT conversion level of 99%. The HDS activ-ity of the NiFeP(3:1)/SiO2 and NiFeP(1:1)/SiO2 catalysts were alsovery high giving a 4,6-DMDBT conversion over 95%. According tothe published literature [70,71], there are three major productsformed from 4,6-DMDBT conversion on the catalysts: (1) 3,3′-dimethylbiphenyl (DMBP), (2) 3-(3′-methylcyclohexyl)toluene(MCHT), and (3) 3,3′-dimethylbicyclohexyl (DMBCH). The DMBPhas been considered as the product from direct desulfurization(DDS) pathway, whereas the MCHT and DMBCH from hydro-genation (HYD) pathway [72,73]. A previous study using similarcondition also pointed out that DMBP cannot be produced by a sec-ondary dehydrogenation pathway as the parallel dehydrogenationof tetralin to naphthalene did not occur [42].
Table 5 shows that the Ni2P/SiO2 gave a low DMBP selectivityof 12% and high MCHT and DMBCH selectivity totally account-ing for 88%, indicating that Ni2P/SiO2 favors the HYD pathway.On the other hand, NiFeP(3:1)/SiO2 and NiFeP(1:1)/SiO2 catalystsshowed higher DMBP selectivity than that of the hydrogenationproducts MCHT and DMBCH. The NiFeP(1:1)/SiO2 sample evengave higher DMBP selectivity of 85% than the 69% selectivity withNiFeP(3:1)/SiO2. As Fe2P catalyst was found inactive for HDS of bothDBT in earlier study and DMDBT in this study, the unprecedentedlyhigh selectivity toward DDS and relatively high activity suggest thatthe substitution of Fe for Ni changes the electronic structure andproperties of the cluster. As the DDS pathway is intrinsically moredifficult than the HYD pathway for HDS of 4,6-DMDBT, this ratio-nalizes the decrease in HDS activity in the samples with higher Fecontent.
The HDN of quinoline does not occur directly because of thestrength of the C N bonds and is a complex sequential reac-tion involving hydrogenation of the N-ring, hydrogenolysis of thealiphatic C N bond (CNH), hydrogenation of the C6-ring (HYD),and elimination of ammonia [74]. This may be followed by hydro-genation of the C6-ring to form propylcyclohexane (PCH) ordehydrogenation to form propylbenzene (PB). In the case of thephosphides studied here it is found that Ni2P/SiO2 favors formationof PCH, as also reported earlier [67,75], but increasing iron substi-tution in the NiFeP(3:1)/SiO2 and NiFeP(1:1)/SiO2 catalysts giveshigher selectivity to PB, indicating that the hydrogenation abilityof the Ni is suppressed by the addition of Fe. Consistently, bimetal-lic phosphides CoNi and FeNi phosphides were also reported higherselectivity for HDN of carbazole with more unsaturated cyclohexyl-benze products than with commercial Ni–Mo catalysts [76]. Onsulfides detailed kinetic studies show that the rates of HYD andCNH are of a similar order of magnitude and no single rate-limitingstep is operative [77,78]. On phosphides similar studies have notbeen carried out, but it is likely that again no single rate-limitingstep is involved, and that CNH will be one of the key steps. The CNHreaction is a complex reaction and requires multiple sites [79–81]among them an acid site to bind the nitrogen compound and aproximal basic site to carry out a �-H attack. Thus, the reactionis structure sensitive [67], and is expected to be influenced by thesubstitution of Fe for Ni at the surface.
3.6. EXAFS of the fresh samples
for the fresh Ni2P/SiO2, NiFeP(3:1)/SiO2, NiFeP(1:1)/SiO2, andNiFeP(1:3)/SiO2 samples together with some reference standards,bulk Ni2P and NiO are shown in Fig. 6. The bulk Ni2P reference
210 H. Zhao et al. / Applied Catalysis B: Environmental 164 (2015) 204–216
Table 5Conversions and selectivities of the silica-supported nickel phosphides and nickel iron phosphides at 613 K and 3.1 MPa with feed b after 110 h on stream.
Reactants Type Conversion (%) Products Selectivity (%)
ample shows two peaks at distances of 0.17 nm and 0.23 nmoughly corresponding to Ni P and Ni Ni bond distances. The sup-orted Ni2P samples show two distinctive peaks at similar positionss the bulk Ni2P but the Ni P peak intensity in the supported Ni2Ps much stronger than the Ni Ni peak. This is due to the presence ofmall Ni2P crystallites with excess Ni(2) atoms on the surface whichave a pyramidal five fold coordination of phosphorus [39,55]. Theermination of the crystallites with the Ni(2) atoms as opposed tohe tetrahedral Ni(1) atoms results in high phosphorus levels inhe sample. The samples with Fe content also show peaks at simi-ar bond distances. A Ni atom probed by EXAFS can have either Nir Fe neighbors, therefore the neighboring atoms are all denoteds M. Although there is some variation from sample to sample, ashe Fe content increases the Ni M peak intensity also grows whilehe Ni P intensity decreases. This is possibly due to the decreasingumber of Ni(2) sites at the surface of the crystallites because of thee substitution for the Ni(2) site positions. Since these Ni(2) sitesere found to be more active [39], the decreasing number of Ni(2)
ites on the surface would account for the initial low activity of theamples containing Fe (Fig. 5, section i).
The Fourier-transform EXAFS spectra at Fe K-edge of the freshiFeP(3:1)/SiO2, NiFeP(1:1)/SiO2, NiFeP(1:3)/SiO2, and Fe2P/SiO2
amples together with reference standards, FeS and FeO are shownn Fig. 7. The supported Fe2P sample shows two peaks at distancesf 0.18 nm and 0.23 nm roughly corresponding to Fe P and Fe Feistances, which are similar to those of Ni2P as Ni2P and Fe2P havehe same crystal structure. The supported NiFeP samples show twoeaks at similar positions as supported Fe2P. However, in the higheri content catalysts the Fe P peak moved from 0.18 nm to 0.17 nmnd the peak intensity becomes stronger. This indicates that the
e in the NiFe samples takes a structure with lattice parametersloser to Ni2P which makes the Fe-P distance shorter. Overall, theeak intensities of the Fe-P bond were higher than those of the
Fig. 7. Comparison of Fourier transforms of the Fe K-edge EXAFS spectra for freshNiFeP(3:1)/SiO2, fresh NiFeP(1:1)/SiO2, fresh NiFeP(1:3)/SiO2, fresh Fe2P:SiO2, bulkFeO, bulk FeS.
Fe-M bond, as found for the Fe2P/SiO2 sample, indicating that theFe was fully phosphided.
To extract quantitative information from the EXAFS, theEXAFS data of the Ni and Fe K-edge for the samples Ni2P/SiO2,NiFeP(3:1)/SiO2, NiFeP(1:1)/SiO2, NiFeP(1:3)/SiO2, and Fe2P/SiO2were Fourier transformed over the data range from 20 to 120 nm−1
(2–12 ´A−1) and modeled within the region from 0.1 to 0.3 nm. A NiK-edge EXAFS model for the Ni2P/SiO2 was built using FEFF7, basedon the crystal structure of Ni2P, and gave a reasonable fit with low Rvalue as shown in Table S5a (Supplementary information). R standsfor the residual, defined in Eq. (1).
R =∑N
i=1|yexp(i0) − ytheo(i)|∑N
i=1yexp(i)(1)
The model used 7 paths including both Ni(1) and Ni(2) asabsorbers, so it accounts for the known structural details fromthe crystallography of the compound. The model determines twoenergy shift parameters for M(1) and M(2) paths respectively, twoDebye-Waller parameters, two expansion/contraction terms [82]for the distances to these neighboring atoms, and three scaling fac-tors for coordination numbers, which totally contains 9 parameters.Because the number of independent fitting parameters is limited by14 as given by the formula below [83], this model with 9 parametersis well constrained and permissible.
Nind = 2kR
�+ 2 (2)
The best fit parameters for Fe2P/SiO2 are shown in Table S5b
for Fe2P. The ratio of the scaling factor for coordination numbers ofM(1) and M(2) in Ni K-edge and Fe K-edge are both 0.9 in Ni2P/SiO2and Fe2P/SiO2 (Table 6).
H. Zhao et al. / Applied Catalysis B: Environmental 164 (2015) 204–216 211
a
b
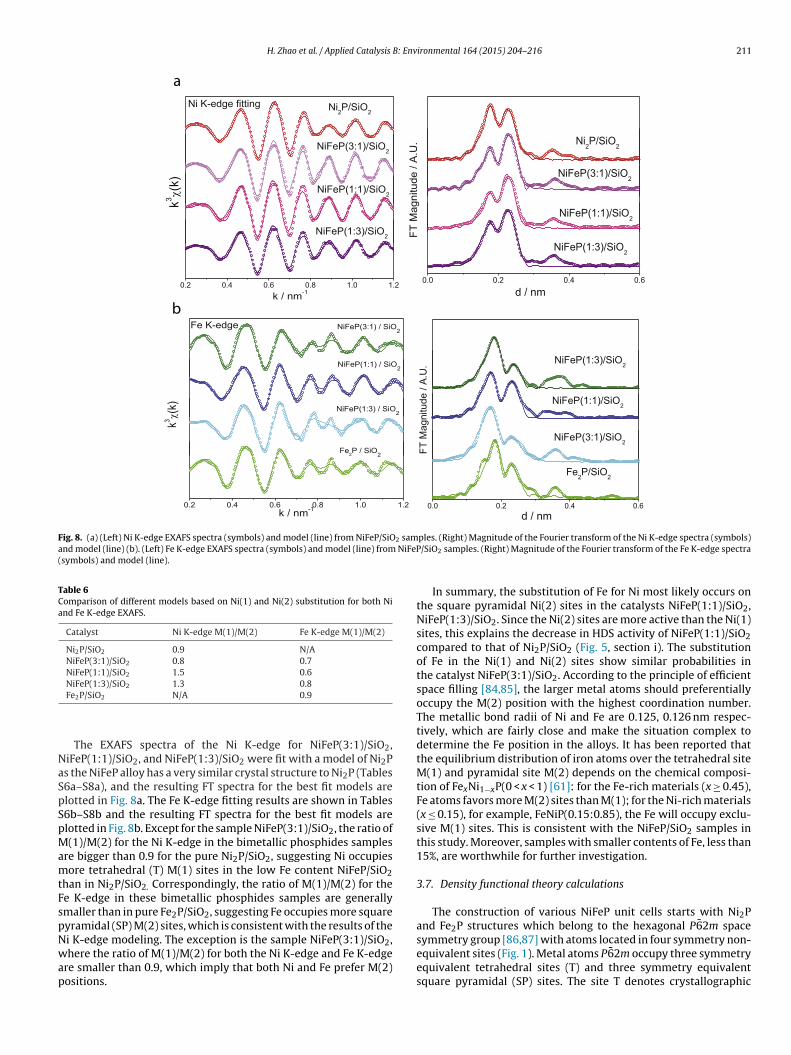
Fig. 8. (a) (Left) Ni K-edge EXAFS spectra (symbols) and model (line) from NiFeP/SiO2 samand model (line) (b). (Left) Fe K-edge EXAFS spectra (symbols) and model (line) from NiFeP(symbols) and model (line).
Table 6Comparison of different models based on Ni(1) and Ni(2) substitution for both Niand Fe K-edge EXAFS.
symmetry group [86,87] with atoms located in four symmetry non-
Fe2P/SiO2 N/A 0.9
The EXAFS spectra of the Ni K-edge for NiFeP(3:1)/SiO2,iFeP(1:1)/SiO2, and NiFeP(1:3)/SiO2 were fit with a model of Ni2Ps the NiFeP alloy has a very similar crystal structure to Ni2P (Tables6a–S8a), and the resulting FT spectra for the best fit models arelotted in Fig. 8a. The Fe K-edge fitting results are shown in Tables6b–S8b and the resulting FT spectra for the best fit models arelotted in Fig. 8b. Except for the sample NiFeP(3:1)/SiO2, the ratio of(1)/M(2) for the Ni K-edge in the bimetallic phosphides samples
re bigger than 0.9 for the pure Ni2P/SiO2, suggesting Ni occupiesore tetrahedral (T) M(1) sites in the low Fe content NiFeP/SiO2
han in Ni2P/SiO2. Correspondingly, the ratio of M(1)/M(2) for thee K-edge in these bimetallic phosphides samples are generallymaller than in pure Fe2P/SiO2, suggesting Fe occupies more squareyramidal (SP) M(2) sites, which is consistent with the results of thei K-edge modeling. The exception is the sample NiFeP(3:1)/SiO2,
here the ratio of M(1)/M(2) for both the Ni K-edge and Fe K-edge
re smaller than 0.9, which imply that both Ni and Fe prefer M(2)ositions.
ples. (Right) Magnitude of the Fourier transform of the Ni K-edge spectra (symbols)/SiO2 samples. (Right) Magnitude of the Fourier transform of the Fe K-edge spectra
In summary, the substitution of Fe for Ni most likely occurs onthe square pyramidal Ni(2) sites in the catalysts NiFeP(1:1)/SiO2,NiFeP(1:3)/SiO2. Since the Ni(2) sites are more active than the Ni(1)sites, this explains the decrease in HDS activity of NiFeP(1:1)/SiO2compared to that of Ni2P/SiO2 (Fig. 5, section i). The substitutionof Fe in the Ni(1) and Ni(2) sites show similar probabilities inthe catalyst NiFeP(3:1)/SiO2. According to the principle of efficientspace filling [84,85], the larger metal atoms should preferentiallyoccupy the M(2) position with the highest coordination number.The metallic bond radii of Ni and Fe are 0.125, 0.126 nm respec-tively, which are fairly close and make the situation complex todetermine the Fe position in the alloys. It has been reported thatthe equilibrium distribution of iron atoms over the tetrahedral siteM(1) and pyramidal site M(2) depends on the chemical composi-tion of FexNi1−xP(0 < x < 1) [61]: for the Fe-rich materials (x ≥ 0.45),Fe atoms favors more M(2) sites than M(1); for the Ni-rich materials(x ≤ 0.15), for example, FeNiP(0.15:0.85), the Fe will occupy exclu-sive M(1) sites. This is consistent with the NiFeP/SiO2 samples inthis study. Moreover, samples with smaller contents of Fe, less than15%, are worthwhile for further investigation.
3.7. Density functional theory calculations
The construction of various NiFeP unit cells starts with Ni2Pand Fe2P structures which belong to the hexagonal P62m space
equivalent sites (Fig. 1). Metal atoms P62m occupy three symmetryequivalent tetrahedral sites (T) and three symmetry equivalentsquare pyramidal (SP) sites. The site T denotes crystallographic
212 H. Zhao et al. / Applied Catalysis B: Environmental 164 (2015) 204–216
e in SP
ptx
ct
uwatss
fs6(bs
N(oe
es
fTpg
Fsa
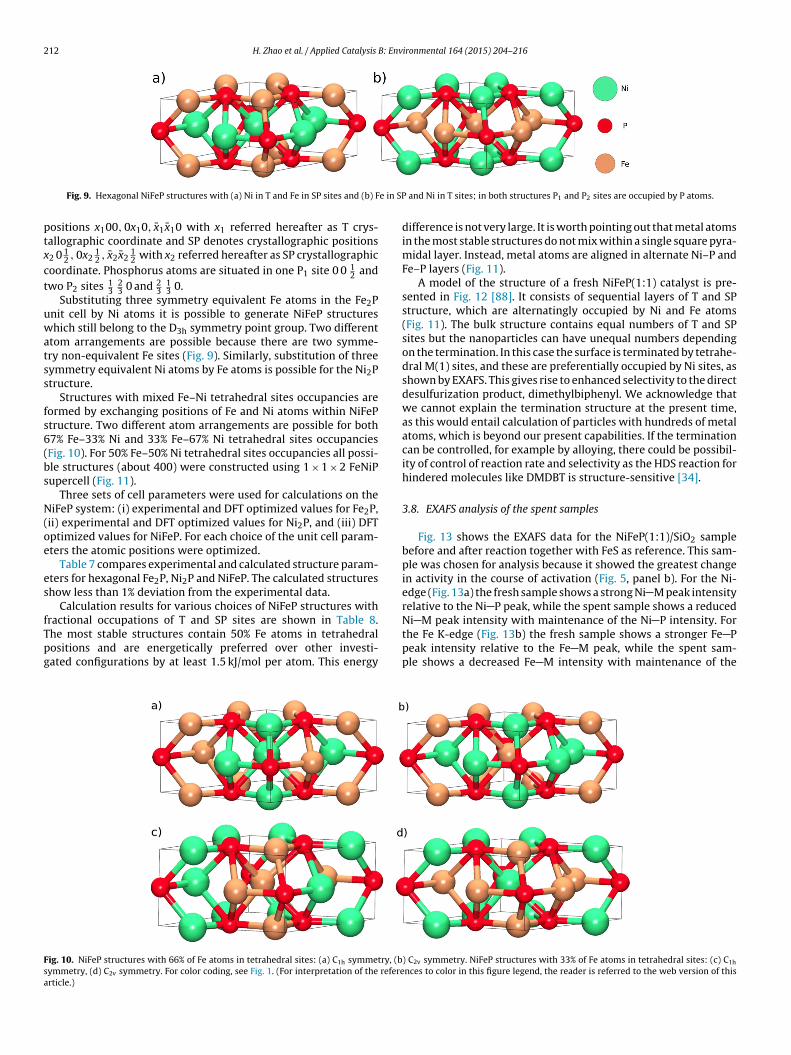
Fig. 9. Hexagonal NiFeP structures with (a) Ni in T and Fe in SP sites and (b) F
ositions x100, 0x10, x1x10 with x1 referred hereafter as T crys-allographic coordinate and SP denotes crystallographic positions2 0 1
2 , 0x212 , x2x2
12 with x2 referred hereafter as SP crystallographic
oordinate. Phosphorus atoms are situated in one P1 site 0 0 12 and
wo P2 sites 13
23 0 and 2
313 0.
Substituting three symmetry equivalent Fe atoms in the Fe2Pnit cell by Ni atoms it is possible to generate NiFeP structureshich still belong to the D3h symmetry point group. Two different
tom arrangements are possible because there are two symme-ry non-equivalent Fe sites (Fig. 9). Similarly, substitution of threeymmetry equivalent Ni atoms by Fe atoms is possible for the Ni2Ptructure.
Structures with mixed Fe–Ni tetrahedral sites occupancies areormed by exchanging positions of Fe and Ni atoms within NiFePtructure. Two different atom arrangements are possible for both7% Fe–33% Ni and 33% Fe–67% Ni tetrahedral sites occupanciesFig. 10). For 50% Fe–50% Ni tetrahedral sites occupancies all possi-le structures (about 400) were constructed using 1 × 1 × 2 FeNiPupercell (Fig. 11).
Three sets of cell parameters were used for calculations on theiFeP system: (i) experimental and DFT optimized values for Fe2P,
ii) experimental and DFT optimized values for Ni2P, and (iii) DFTptimized values for NiFeP. For each choice of the unit cell param-ters the atomic positions were optimized.
Table 7 compares experimental and calculated structure param-ters for hexagonal Fe2P, Ni2P and NiFeP. The calculated structureshow less than 1% deviation from the experimental data.
Calculation results for various choices of NiFeP structures with
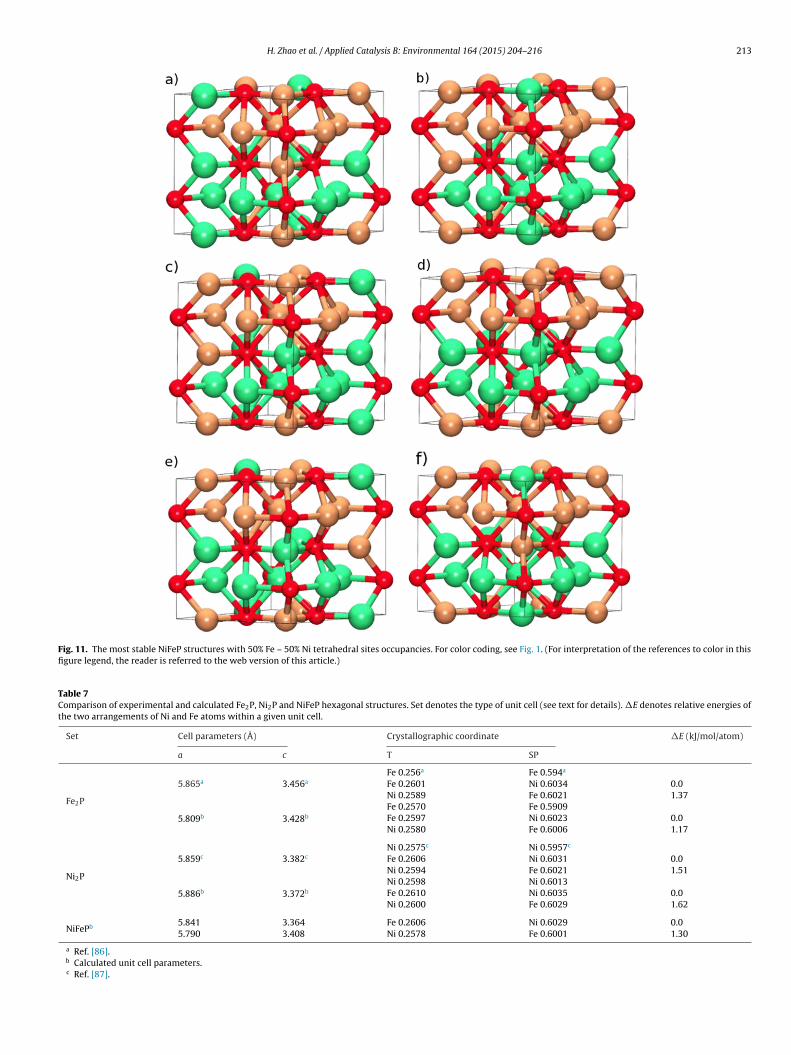
ractional occupations of T and SP sites are shown in Table 8.he most stable structures contain 50% Fe atoms in tetrahedralositions and are energetically preferred over other investi-ated configurations by at least 1.5 kJ/mol per atom. This energy
ig. 10. NiFeP structures with 66% of Fe atoms in tetrahedral sites: (a) C1h symmetry, (bymmetry, (d) C2v symmetry. For color coding, see Fig. 1. (For interpretation of the refererticle.)
and Ni in T sites; in both structures P1 and P2 sites are occupied by P atoms.
difference is not very large. It is worth pointing out that metal atomsin the most stable structures do not mix within a single square pyra-midal layer. Instead, metal atoms are aligned in alternate Ni–P andFe–P layers (Fig. 11).
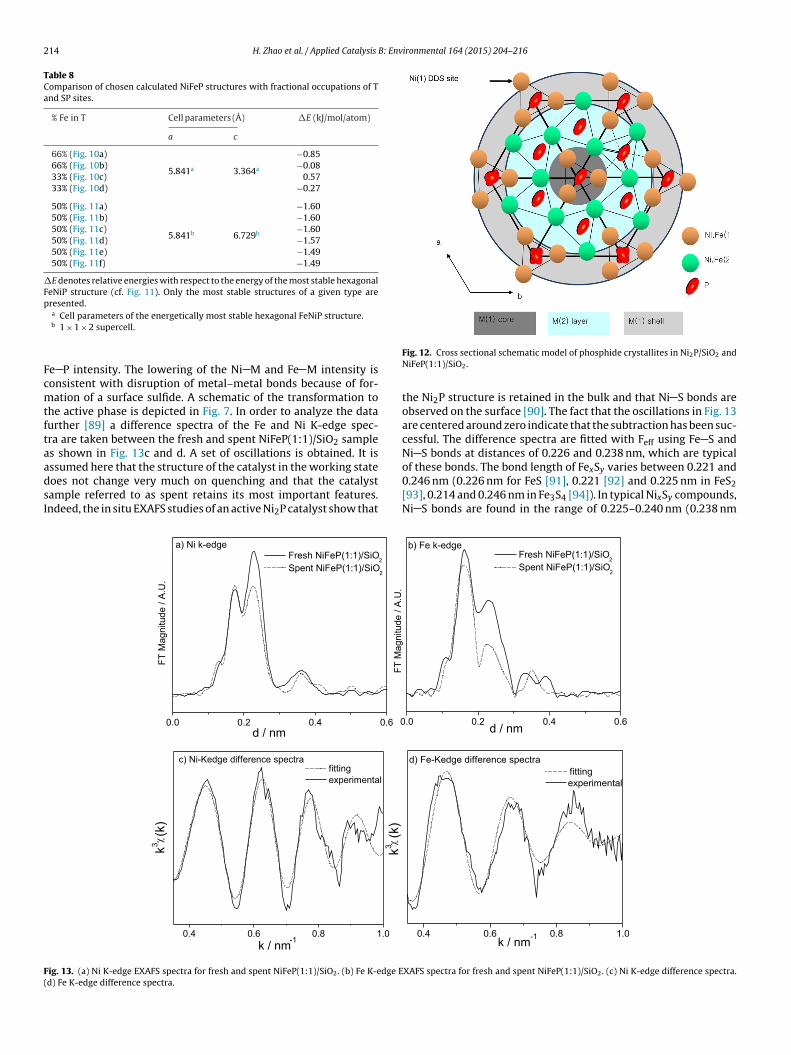
A model of the structure of a fresh NiFeP(1:1) catalyst is pre-sented in Fig. 12 [88]. It consists of sequential layers of T and SPstructure, which are alternatingly occupied by Ni and Fe atoms(Fig. 11). The bulk structure contains equal numbers of T and SPsites but the nanoparticles can have unequal numbers dependingon the termination. In this case the surface is terminated by tetrahe-dral M(1) sites, and these are preferentially occupied by Ni sites, asshown by EXAFS. This gives rise to enhanced selectivity to the directdesulfurization product, dimethylbiphenyl. We acknowledge thatwe cannot explain the termination structure at the present time,as this would entail calculation of particles with hundreds of metalatoms, which is beyond our present capabilities. If the terminationcan be controlled, for example by alloying, there could be possibil-ity of control of reaction rate and selectivity as the HDS reaction forhindered molecules like DMDBT is structure-sensitive [34].
3.8. EXAFS analysis of the spent samples
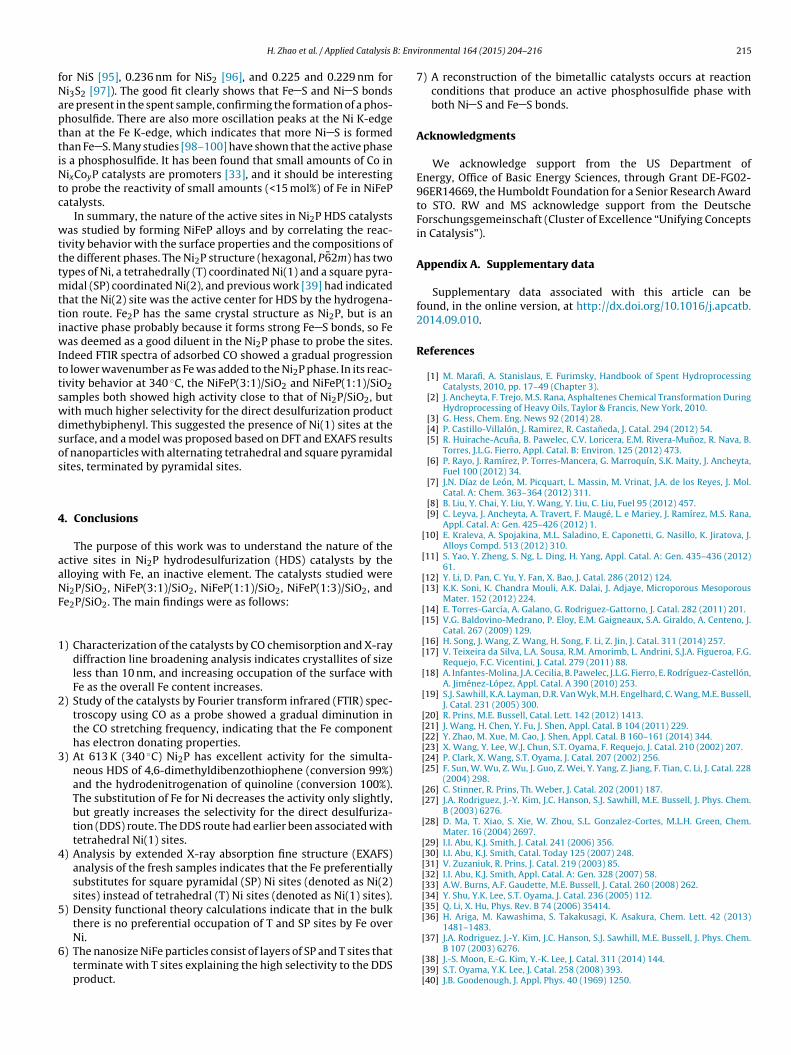
Fig. 13 shows the EXAFS data for the NiFeP(1:1)/SiO2 samplebefore and after reaction together with FeS as reference. This sam-ple was chosen for analysis because it showed the greatest changein activity in the course of activation (Fig. 5, panel b). For the Ni-edge (Fig. 13a) the fresh sample shows a strong Ni M peak intensityrelative to the Ni P peak, while the spent sample shows a reduced
Ni M peak intensity with maintenance of the Ni P intensity. Forthe Fe K-edge (Fig. 13b) the fresh sample shows a stronger Fe Ppeak intensity relative to the Fe M peak, while the spent sam-ple shows a decreased Fe M intensity with maintenance of the
) C2v symmetry. NiFeP structures with 33% of Fe atoms in tetrahedral sites: (c) C1h
nces to color in this figure legend, the reader is referred to the web version of this
H. Zhao et al. / Applied Catalysis B: Environmental 164 (2015) 204–216 213
Fig. 11. The most stable NiFeP structures with 50% Fe – 50% Ni tetrahedral sites occupancies. For color coding, see Fig. 1. (For interpretation of the references to color in thisfigure legend, the reader is referred to the web version of this article.)
Table 7Comparison of experimental and calculated Fe2P, Ni2P and NiFeP hexagonal structures. Set denotes the type of unit cell (see text for details). �E denotes relative energies ofthe two arrangements of Ni and Fe atoms within a given unit cell.
Set Cell parameters (Å) Crystallographic coordinate �E (kJ/mol/atom)
a c T SP
Fe2P
5.865a 3.456aFe 0.256a Fe 0.594a
Fe 0.2601 Ni 0.6034 0.0Ni 0.2589 Fe 0.6021 1.37
5.809b 3.428bFe 0.2570 Fe 0.5909Fe 0.2597 Ni 0.6023 0.0Ni 0.2580 Fe 0.6006 1.17
Ni2P
5.859c 3.382cNi 0.2575c Ni 0.5957c
Fe 0.2606 Ni 0.6031 0.0Ni 0.2594 Fe 0.6021 1.51
5.886b 3.372bNi 0.2598 Ni 0.6013Fe 0.2610 Ni 0.6035 0.0Ni 0.2600 Fe 0.6029 1.62
NiFePb 5.841 3.364 Fe 0.2606 Ni 0.6029 0.05.790 3.408 Ni 0.2578 Fe 0.6001 1.30
a Ref. [86].b Calculated unit cell parameters.c Ref. [87].
214 H. Zhao et al. / Applied Catalysis B: Environmental 164 (2015) 204–216
Table 8Comparison of chosen calculated NiFeP structures with fractional occupations of Tand SP sites.
�E denotes relative energies with respect to the energy of the most stable hexagonalFeNiP structure (cf. Fig. 11). Only the most stable structures of a given type arepresented.
FcmtftaadsI
F(
a Cell parameters of the energetically most stable hexagonal FeNiP structure.b 1 × 1 × 2 supercell.
e P intensity. The lowering of the Ni M and Fe M intensity isonsistent with disruption of metal–metal bonds because of for-ation of a surface sulfide. A schematic of the transformation to
he active phase is depicted in Fig. 7. In order to analyze the dataurther [89] a difference spectra of the Fe and Ni K-edge spec-ra are taken between the fresh and spent NiFeP(1:1)/SiO2 samples shown in Fig. 13c and d. A set of oscillations is obtained. It isssumed here that the structure of the catalyst in the working state
oes not change very much on quenching and that the catalystample referred to as spent retains its most important features.ndeed, the in situ EXAFS studies of an active Ni2P catalyst show that
k3(k
)
0.4 0.6 0.8 1.0k / nm-1
k3(k
)
c) Ni-Kedge difference spe ctra fitt ing experimen tal
0
FT M
agni
tude
/ A
.U.
0.0 0.2 0.4 0.6
a) Ni k-edge Fresh NiFeP(1:1)/SiO
2 Spent NiFeP(1:1) /SiO
2
FT M
agni
tude
/ A
.U.
d / nm
ig. 13. (a) Ni K-edge EXAFS spectra for fresh and spent NiFeP(1:1)/SiO2. (b) Fe K-edge Ed) Fe K-edge difference spectra.
Fig. 12. Cross sectional schematic model of phosphide crystallites in Ni2P/SiO2 andNiFeP(1:1)/SiO2.
the Ni2P structure is retained in the bulk and that Ni S bonds areobserved on the surface [90]. The fact that the oscillations in Fig. 13are centered around zero indicate that the subtraction has been suc-cessful. The difference spectra are fitted with Feff using Fe S andNi S bonds at distances of 0.226 and 0.238 nm, which are typicalof these bonds. The bond length of FexSy varies between 0.221 and
0.246 nm (0.226 nm for FeS [91], 0.221 [92] and 0.225 nm in FeS2[93], 0.214 and 0.246 nm in Fe3S4 [94]). In typical NixSy compounds,Ni S bonds are found in the range of 0.225–0.240 nm (0.238 nm
0.4 0.6 0.8 1.0
d) Fe-Kedge di fferen ce spe ctra
k / nm-1
fitting experi men tal
.0 0.2 0.4 0.6
b) Fe k-edge
d / nm
Fresh NiFeP(1:1)/SiO2
Spen t NiFeP(1 :1) /SiO2
XAFS spectra for fresh and spent NiFeP(1:1)/SiO2. (c) Ni K-edge difference spectra.
B: Env
fNapttiNtc
wtttmttiwIttswdsos
4
aaNF
1
2
3
4
5
6
H. Zhao et al. / Applied Catalysis
or NiS [95], 0.236 nm for NiS2 [96], and 0.225 and 0.229 nm fori3S2 [97]). The good fit clearly shows that Fe S and Ni S bondsre present in the spent sample, confirming the formation of a phos-hosulfide. There are also more oscillation peaks at the Ni K-edgehan at the Fe K-edge, which indicates that more Ni S is formedhan Fe S. Many studies [98–100] have shown that the active phases a phosphosulfide. It has been found that small amounts of Co inixCoyP catalysts are promoters [33], and it should be interesting
o probe the reactivity of small amounts (<15 mol%) of Fe in NiFePatalysts.
In summary, the nature of the active sites in Ni2P HDS catalystsas studied by forming NiFeP alloys and by correlating the reac-
ivity behavior with the surface properties and the compositions ofhe different phases. The Ni2P structure (hexagonal, P62m) has twoypes of Ni, a tetrahedrally (T) coordinated Ni(1) and a square pyra-
idal (SP) coordinated Ni(2), and previous work [39] had indicatedhat the Ni(2) site was the active center for HDS by the hydrogena-ion route. Fe2P has the same crystal structure as Ni2P, but is annactive phase probably because it forms strong Fe S bonds, so Fe
as deemed as a good diluent in the Ni2P phase to probe the sites.ndeed FTIR spectra of adsorbed CO showed a gradual progressiono lower wavenumber as Fe was added to the Ni2P phase. In its reac-ivity behavior at 340 ◦C, the NiFeP(3:1)/SiO2 and NiFeP(1:1)/SiO2amples both showed high activity close to that of Ni2P/SiO2, butith much higher selectivity for the direct desulfurization productimethybiphenyl. This suggested the presence of Ni(1) sites at theurface, and a model was proposed based on DFT and EXAFS resultsf nanoparticles with alternating tetrahedral and square pyramidalites, terminated by pyramidal sites.
. Conclusions
The purpose of this work was to understand the nature of thective sites in Ni2P hydrodesulfurization (HDS) catalysts by thelloying with Fe, an inactive element. The catalysts studied werei2P/SiO2, NiFeP(3:1)/SiO2, NiFeP(1:1)/SiO2, NiFeP(1:3)/SiO2, ande2P/SiO2. The main findings were as follows:
) Characterization of the catalysts by CO chemisorption and X-raydiffraction line broadening analysis indicates crystallites of sizeless than 10 nm, and increasing occupation of the surface withFe as the overall Fe content increases.
) Study of the catalysts by Fourier transform infrared (FTIR) spec-troscopy using CO as a probe showed a gradual diminution inthe CO stretching frequency, indicating that the Fe componenthas electron donating properties.
) At 613 K (340 ◦C) Ni2P has excellent activity for the simulta-neous HDS of 4,6-dimethyldibenzothiophene (conversion 99%)and the hydrodenitrogenation of quinoline (conversion 100%).The substitution of Fe for Ni decreases the activity only slightly,but greatly increases the selectivity for the direct desulfuriza-tion (DDS) route. The DDS route had earlier been associated withtetrahedral Ni(1) sites.
) Analysis by extended X-ray absorption fine structure (EXAFS)analysis of the fresh samples indicates that the Fe preferentiallysubstitutes for square pyramidal (SP) Ni sites (denoted as Ni(2)sites) instead of tetrahedral (T) Ni sites (denoted as Ni(1) sites).
) Density functional theory calculations indicate that in the bulkthere is no preferential occupation of T and SP sites by Fe over
Ni.
) The nanosize NiFe particles consist of layers of SP and T sites thatterminate with T sites explaining the high selectivity to the DDSproduct.
ironmental 164 (2015) 204–216 215
7) A reconstruction of the bimetallic catalysts occurs at reactionconditions that produce an active phosphosulfide phase withboth Ni S and Fe S bonds.
Acknowledgments
We acknowledge support from the US Department ofEnergy, Office of Basic Energy Sciences, through Grant DE-FG02-96ER14669, the Humboldt Foundation for a Senior Research Awardto STO. RW and MS acknowledge support from the DeutscheForschungsgemeinschaft (Cluster of Excellence “Unifying Conceptsin Catalysis”).
Appendix A. Supplementary data
Supplementary data associated with this article can befound, in the online version, at http://dx.doi.org/10.1016/j.apcatb.2014.09.010.
References
[1] M. Marafi, A. Stanislaus, E. Furimsky, Handbook of Spent HydroprocessingCatalysts, 2010, pp. 17–49 (Chapter 3).
[2] J. Ancheyta, F. Trejo, M.S. Rana, Asphaltenes Chemical Transformation DuringHydroprocessing of Heavy Oils, Taylor & Francis, New York, 2010.
[3] G. Hess, Chem. Eng. News 92 (2014) 28.[4] P. Castillo-Villalón, J. Ramirez, R. Castaneda, J. Catal. 294 (2012) 54.[5] R. Huirache-Acuna, B. Pawelec, C.V. Loricera, E.M. Rivera-Munoz, R. Nava, B.
Torres, J.L.G. Fierro, Appl. Catal. B: Environ. 125 (2012) 473.[6] P. Rayo, J. Ramírez, P. Torres-Mancera, G. Marroquín, S.K. Maity, J. Ancheyta,
Fuel 100 (2012) 34.[7] J.N. Díaz de León, M. Picquart, L. Massin, M. Vrinat, J.A. de los Reyes, J. Mol.
Catal. A: Chem. 363–364 (2012) 311.[8] B. Liu, Y. Chai, Y. Liu, Y. Wang, Y. Liu, C. Liu, Fuel 95 (2012) 457.[9] C. Leyva, J. Ancheyta, A. Travert, F. Maugé, L. e Mariey, J. Ramírez, M.S. Rana,
Appl. Catal. A: Gen. 425–426 (2012) 1.[10] E. Kraleva, A. Spojakina, M.L. Saladino, E. Caponetti, G. Nasillo, K. Jiratova, J.
Alloys Compd. 513 (2012) 310.[11] S. Yao, Y. Zheng, S. Ng, L. Ding, H. Yang, Appl. Catal. A: Gen. 435–436 (2012)
61.[12] Y. Li, D. Pan, C. Yu, Y. Fan, X. Bao, J. Catal. 286 (2012) 124.[13] K.K. Soni, K. Chandra Mouli, A.K. Dalai, J. Adjaye, Microporous Mesoporous
Mater. 152 (2012) 224.[14] E. Torres-García, A. Galano, G. Rodriguez-Gattorno, J. Catal. 282 (2011) 201.[15] V.G. Baldovino-Medrano, P. Eloy, E.M. Gaigneaux, S.A. Giraldo, A. Centeno, J.
Catal. 267 (2009) 129.[16] H. Song, J. Wang, Z. Wang, H. Song, F. Li, Z. Jin, J. Catal. 311 (2014) 257.[17] V. Teixeira da Silva, L.A. Sousa, R.M. Amorimb, L. Andrini, S.J.A. Figueroa, F.G.
Requejo, F.C. Vicentini, J. Catal. 279 (2011) 88.[18] A. Infantes-Molina, J.A. Cecilia, B. Pawelec, J.L.G. Fierro, E. Rodríguez-Castellón,
A. Jiménez-López, Appl. Catal. A 390 (2010) 253.[19] S.J. Sawhill, K.A. Layman, D.R. Van Wyk, M.H. Engelhard, C. Wang, M.E. Bussell,
J. Catal. 231 (2005) 300.[20] R. Prins, M.E. Bussell, Catal. Lett. 142 (2012) 1413.[21] J. Wang, H. Chen, Y. Fu, J. Shen, Appl. Catal. B 104 (2011) 229.[22] Y. Zhao, M. Xue, M. Cao, J. Shen, Appl. Catal. B 160–161 (2014) 344.[23] X. Wang, Y. Lee, W.J. Chun, S.T. Oyama, F. Requejo, J. Catal. 210 (2002) 207.[24] P. Clark, X. Wang, S.T. Oyama, J. Catal. 207 (2002) 256.[25] F. Sun, W. Wu, Z. Wu, J. Guo, Z. Wei, Y. Yang, Z. Jiang, F. Tian, C. Li, J. Catal. 228
(2004) 298.[26] C. Stinner, R. Prins, Th. Weber, J. Catal. 202 (2001) 187.[27] J.A. Rodriguez, J.-Y. Kim, J.C. Hanson, S.J. Sawhill, M.E. Bussell, J. Phys. Chem.
B (2003) 6276.[28] D. Ma, T. Xiao, S. Xie, W. Zhou, S.L. Gonzalez-Cortes, M.L.H. Green, Chem.
Mater. 16 (2004) 2697.[29] I.I. Abu, K.J. Smith, J. Catal. 241 (2006) 356.[30] I.I. Abu, K.J. Smith, Catal. Today 125 (2007) 248.[31] V. Zuzaniuk, R. Prins, J. Catal. 219 (2003) 85.[32] I.I. Abu, K.J. Smith, Appl. Catal. A: Gen. 328 (2007) 58.[33] A.W. Burns, A.F. Gaudette, M.E. Bussell, J. Catal. 260 (2008) 262.[34] Y. Shu, Y.K. Lee, S.T. Oyama, J. Catal. 236 (2005) 112.[35] Q. Li, X. Hu, Phys. Rev. B 74 (2006) 35414.[36] H. Ariga, M. Kawashima, S. Takakusagi, K. Asakura, Chem. Lett. 42 (2013)
1481–1483.
[37] J.A. Rodriguez, J.-Y. Kim, J.C. Hanson, S.J. Sawhill, M.E. Bussell, J. Phys. Chem.
B 107 (2003) 6276.[38] J.-S. Moon, E.-G. Kim, Y.-K. Lee, J. Catal. 311 (2014) 144.[39] S.T. Oyama, Y.K. Lee, J. Catal. 258 (2008) 393.[40] J.B. Goodenough, J. Appl. Phys. 40 (1969) 1250.
[41] J.P. Sénateur, A. Rouault, P. L’Héritier, A. Krumbügel-Nylund, R. Fruchart, D.Fruchart, P. Convert, E. Roudaut, Mater. Res. Bull. 8 (1973) 229.
[42] S.T. Oyama, H. Zhao, H.-J. Freund, K. Asakura, R. Włodarczyk, M. Sierka, J. Catal.285 (2012) 1–5.
[43] J.F. Deng, H. Li, W. Wang, Catal. Today 51 (1999) 113.[44] X. Wang, P. Clark, S.T. Oyama, J. Catal. 208 (2002) 321.[45] B. Ravel, M. Newville, J. Synchrotron Rad. 12 (2005) 537.[46] J.J. Rehr, R.C. Albers, Rev. Mod. Phys. 72 (2000) 621.[47] S. Ramanathan, S.T. Oyama, J. Phys. Chem. 99 (1995) 16365.[48] G. Kresse, J. Hafner, Phys. Rev. B 47 (1993) 558.[49] G. Kresse, J. Furthmüller, Comput. Mater. Sci. 6 (1996) 15.[50] J.P. Perdew, K. Burke, M. Ernzerhof, Phys. Rev. Lett. 77 (1996) 3865.[51] P.E. Blöchl, Phys. Rev. B 50 (1994) 17953.[52] G. Kresse, D. Joubert, Phys. Rev. B 59 (1999) 1758.[53] H.J. Monkhorst, J.D. Pack, Phys. Rev. B 13 (1976) 5188.[54] H. Fujii, S. Komura, T. Takeda, T. Okamoto, Y. Ito, J. Akimitsu, J. Phys. Soc. Jpn.
46 (1979) 1616.[55] R. Fruchart, A. Roger, J.P. Senateur, J. Appl. Phys. 40 (1969) 1250.[56] A. Gaudette, A.W. Burns, J.R. Hayes, M.C. Smith, R.H. Bowker, T. Seda, M.E.
Bussell, J. Catal. 272 (2010) 18.[57] K.I. Hadjiivanov, G.N. Vayssilov, Adv. Catal. 47 (2002) 307.[58] K.A. Layman, M.E. Bussel, J. Phys. Chem. B 108 (2004) 10930.[59] A.W. Burns, K.A. Layman, D.H. Bale, M.E. Bussell, Appl. Catal. A: Gen. 343 (2008)
68.[60] S.J. Sawhill, K.A. Layman, D.R. Van Wyk, M.H. England, C. Wang, M.E. Bussell,
J. Catal. 231 (2005) 300.[61] Y.K. Lee, S.T. Oyama, J. Catal. 239 (2006) 376.[62] E. Boellaard, A.M. van der Kraan, J.W. Geus, Appl. Catal. A: Gen. 224 (2002)
1.[63] M. Lepage, T. Visser, F. Soulimani, A.M. Beale, A. Iglesias-Juez, A.M.J. van der
Eerden, B.M. Weckhuysen, J. Phys. Chem. C 112 (2008) 9394.[64] P.E.R. Blanchard, A.P. Grosvenor, R.G. Cavell, A. Mar, J. Mater. Chem. 19 (33)
(2009) 6015.[65] H. TopsØe, B.S. Clausen, F.E. Massoth, J.R. Anderson, M. Boudard, Catalysis
Science and Technology, vol. 11, Springer-Verlag, New York, 1996.
[66] J.A. Rodriguez, J. Phys. Chem. B 101 (1997) 7524.[67] S.T. Oyama, X. Wang, Y.K. Lee, K. Bando, F.G. Requejo, J. Catal. 210 (2002) 207.[68] S.T. Oyama, J. Catal. 2106 (2003) 343.[69] A.E. Nelson, M. Sun, A.S.M. Junaid, J. Catal. 241 (2006) 188.[70] V. Vanrysselberghe, G.F. Froment, Ind. Eng. Chem. Res. 35 (1996) 3311.
[72] J.H. Kim, X. Ma, C. Song, Y.-K. Lee, S.T. Oyama, Energy Fuels 19 (2005) 353.[73] R. Prins, M. Egorava, A. Rothlishberger, Y. Zhao, N. Sivasankar, P. Kukula, Catal.
Today 111 (84) (2006).[74] G. Perot, Catal. Today 10 (1991) 447.[75] R. Prins, M. Jian, M. Flechsenhar, Polyhedron 16 (1997) 3235.[76] R.H. Bowker, B.A. Carrillo, B. Ilic, M.A. Reynolds, M.E. Bussell, Appl. Catal. A
482 (2014) 221.[77] B.K. Hodnett, B. Delmon, Stud. Surf. Sci. Catal. 27 (1986) 53.[78] I.A. van Parijs, G.F. Froment, B. Delmon, Bull. Soc. Chim. Belg. 93 (1984) 823.[79] J.A. Marzari, S. Rajagopal, R. Miranda, J. Catal. 156 (1995) 255.[80] M. Jian, R. Prins, J. Catal. 179 (1998) 18.[81] F. Rota, R. Prins, J. Mol. Catal. A 162 (2000) 359.[82] S.D. Kelly, N. Yang, G.E. Mickelson, N. Greenlay, E. Karapetrova, W. Sinkler,
S.R. Bare, J. Catal. 263 (2009) 16.[83] E.A. Stern, Phys. Rev. B 48 (1993) 9825.[84] Y. Maeda, Y. Takashima, J. Inorg. Nucl. Chem. 35 (1973) 1963.[85] R.C. Buchanan, T. Park, Materials Crystal Chemistry, Mrcel Dekker Inc., 1997.[86] S. Rundqvist, F. Jellinek, Acta Chem. Scand. 13 (1959) 425.[87] S. Rundqvist, Acta Chem. Scand. 16 (1962) 992.[88] J. Ren, C.F. Huo, X.D. Wen, Z. Cao, J. Wang, Y.W. Li, H. Jiao, J. Phys. Chem. B 110
(2006) 22563–22569.[89] T. Kawai, K.K. Bando, Y.-K. Lee, S.T. Oyama, W.-J. Chun, K. Asakura, J. Catal. 241
(2006) 20.[90] T. Kawai, W.J. Chun, K. Asakura, Y. Koike, M. Nomura, K.K. Bando, S.T. Oyama,
H. Sumiya, Rev. Sci. Instrum. 79 (2008) 014101-1.[91] A.R. Lennie, S.A.T. Redfern, P.F. Schofield, D.J. Vaughan, Mineral. Mag. 59
(1995) 677.[92] M.J. Buerger, Am. Mineral. 16 (1931) 361.[93] M. Rieder, J.C. Crelling, O. Sustai, M. Drabek, Z. Weiss, M. Klementova, Int. J.
Coal Geol. 71 (2007) 115.[94] B.J. Skinner, R.C. Erd, F.S. Grimaldi, Am. Mineral. 49 (1964) 543.[95] J. Trahan, R.G. Goodrich, S.F. Watkins, Phys. Rev. B 2 (1970) 2859.[96] T. Fujii, K. Tanaka, F. Marumo, Y. Noda, Miner. J. 13 (1987) 448.
[97] J.B. Parise, Acta Crystallogr. B 36 (1179) (1980).[98] S.T. Oyama, X. Wang, Y.K. Lee, W.J. Chun, J. Catal. 221 (2004) 263.[99] T. Kawai, K.K. Bando, Y.K. Lee, S.T. Oyama, W.J. Chun, K. Asakura, J. Catal. 242
(2006) 20.[100] Y.K. Lee, Y. Shu, S.T. Oyama, Appl. Catal. A: Gen. 322 (2007) 191.