Supplementary Figure 1 Landmarks of sexual differentiation and distribution of reads across mRNA features. (A) Kinetics of sexual differentiation. Diploid cells are synchronized in G1 by nitrogen starvation and meiosis is induced at time 0 by heat inactivation of thermo-sensitive Pat1. S phase (S) takes place 2 hours after meiotic induction. The meiotic divisions occur at 5 hours (MI) and 5.5 hours (M II). The precursor to the spore plasma membrane (forespore membrane, F) is generated between 5.5 and 6.5 hours, and the spore cell wall appears at 10-12 hours (Spo). The progression of the meiotic divisions was followed by staining cells with DAPI followed by quantification of cells with 1 nucleus (before the meiotic divisions), 2 nuclei (after the first division) and four nuclei (after the second division). The data correspond to a single experiment. (B) Distribution of reads across RNA features. The fraction of reads mapping to coding sequences (CDS), 5’ leader regions and 3’-UTRs is shown for RPFs and mRNAs. (Left) Unnormalized data. (Right) Data normalized by the length of the corresponding genomic feature. Nature Structural and Molecular Biology: doi:10.1038/nsmb.2843
Transcript
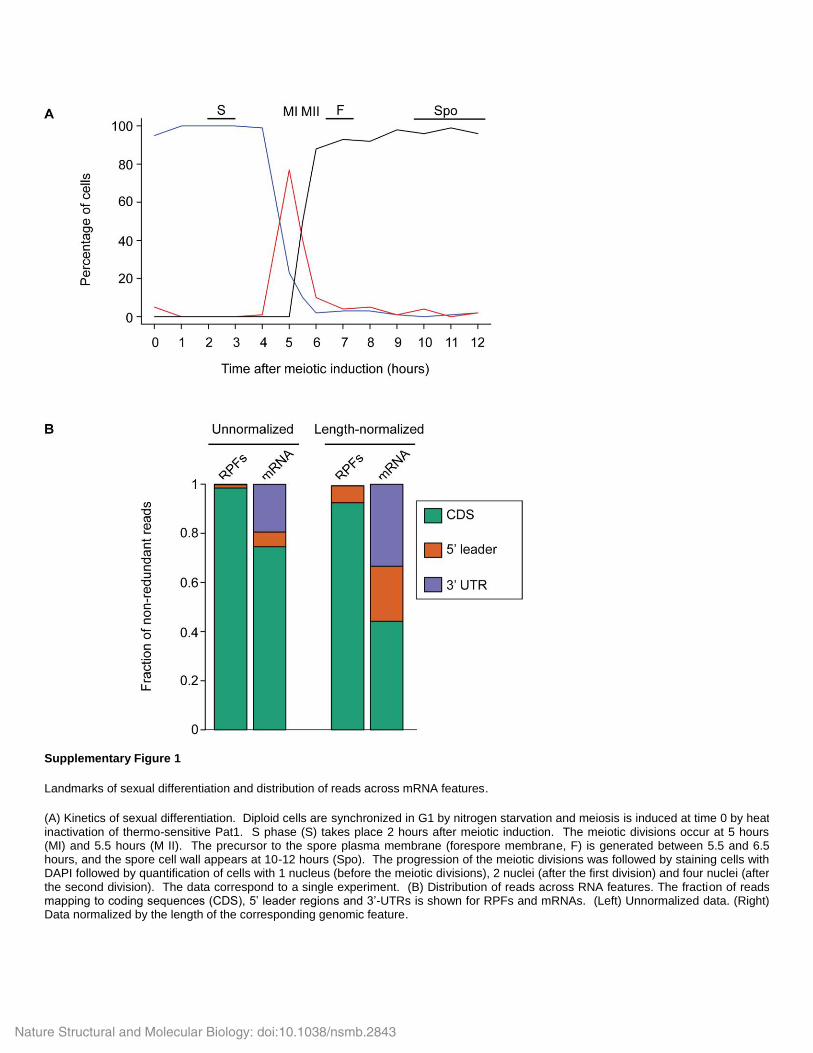
Supplementary Figure 1
Landmarks of sexual differentiation and distribution of reads across mRNA features.
(A) Kinetics of sexual differentiation. Diploid cells are synchronized in G1 by nitrogen starvation and meiosis is induced at time 0 by heat inactivation of thermo-sensitive Pat1. S phase (S) takes place 2 hours after meiotic induction. The meiotic divisions occur at 5 hours (MI) and 5.5 hours (M II). The precursor to the spore plasma membrane (forespore membrane, F) is generated between 5.5 and 6.5 hours, and the spore cell wall appears at 10-12 hours (Spo). The progression of the meiotic divisions was followed by staining cells with DAPI followed by quantification of cells with 1 nucleus (before the meiotic divisions), 2 nuclei (after the first division) and four nuclei (after the second division). The data correspond to a single experiment. (B) Distribution of reads across RNA features. The fraction of reads mapping to coding sequences (CDS), 5’ leader regions and 3’-UTRs is shown for RPFs and mRNAs. (Left) Unnormalized data. (Right) Data normalized by the length of the corresponding genomic feature.
Nature Structural and Molecular Biology: doi:10.1038/nsmb.2843
Supplementary Figure 2
Nature Structural and Molecular Biology: doi:10.1038/nsmb.2843
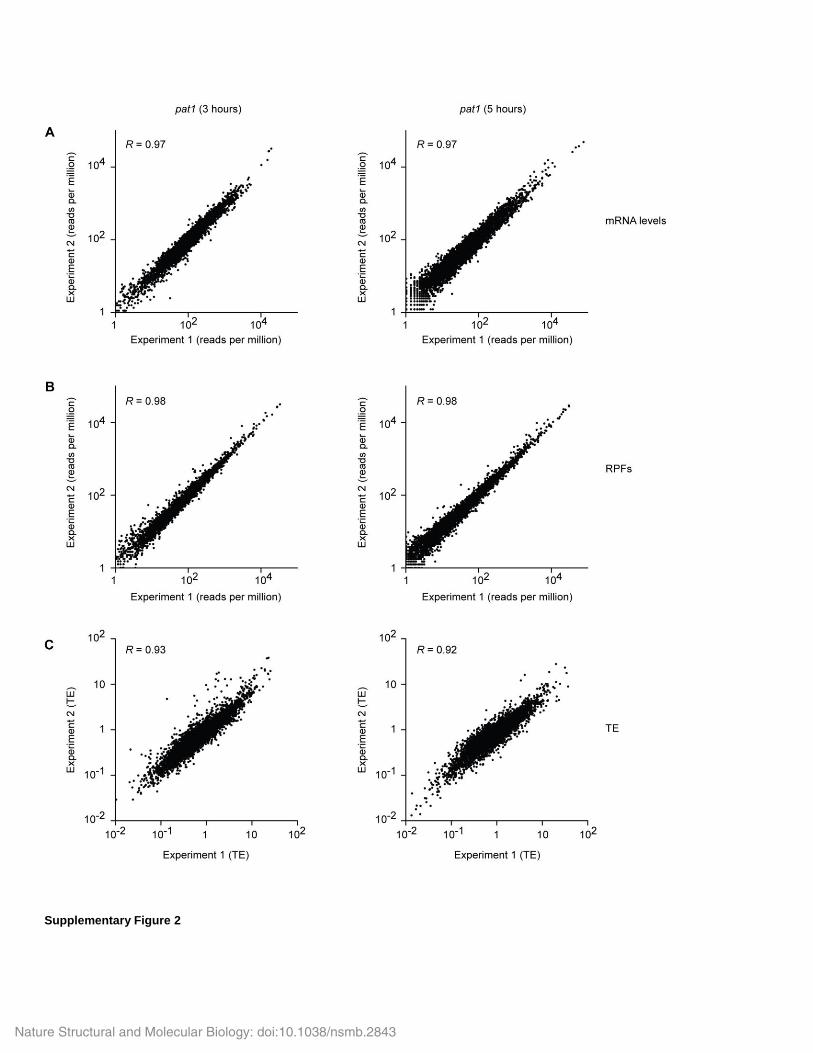
Reproducibility of RPF and mRNA measurements.
(A) Scatter plot comparing mRNA read counts (in reads per million) for every CDS for two independent biological repeats of pat1 cells 3 hours (left) or 5 hours (right) after meiotic induction. No filtering was applied to the data. Pearson correlation coefficients are indicated inside the boxes. (B) As in A, but showing RPF counts. (C) As in A, but displaying TEs, calculated by normalizing RPF counts for every CDS by the corresponding number of mRNA counts. Data are shown only for genes that had at least 10 reads in both the mRNA and the RPF data. Note that these are completely independent samples, as the two cultures were harvested on different days, and the libraries were prepared and sequenced separately.
Nature Structural and Molecular Biology: doi:10.1038/nsmb.2843
Supplementary Figure 3
Nature Structural and Molecular Biology: doi:10.1038/nsmb.2843
Global changes in translation and mRNA levels during meiosis.
(A) The 1,719 genes showing strongest changes in expression during a meiotic time course were clustered based on their RPF profiles. The heat map shows mRNA data based on a published microarray experiment, mRNA-seq data from this work (middle) and RPF changes (right). The colors represent log ratios of gene expression compared to the corresponding vegetative cells. (B) Correlations between the TE of uORFs and their corresponding ORFs. Boxplots displaying the log2 ratios between TEs of every translated uORF and its downstream ORF. TEs were calculated for each time point and normalized by the mean TE over the time course. Veg indicates cells growing vegetatively, and the time is the number of hours since the temperature-shift to induce meiosis. (C) Translation of the SPBPB10D8.07c mRNA. The y axis represents the TE for the uORF (red) and the corresponding ORF (blue) for each time point of the meiotic time course. SPBPB10D8.07c displays high correlation between TE changes of the uORF and ORF (Pearson coefficient = 0.99). (D) Translation of the SPBC1773.04 mRNA, which showed a negative correlation between uORF and ORF TEs (Pearson coefficient = –0.74). Labelling as in (C).
Nature Structural and Molecular Biology: doi:10.1038/nsmb.2843
Nature Structural and Molecular Biology: doi:10.1038/nsmb.2843
Supplementary Figure 4
Improvements to fission-yeast gene annotation.
(A) Periodicity scores separate mRNA and RPF data. Distribution of periodicity scores in frame number 1 of all CDS for mRNA fragments (blue) and RPFs (red). We chose a threshold of 0.6 to define newly discovered ORFs as translated (arrow). Only 0.1% of CDS in the mRNA dataset show a periodicity score over this threshold (in any reading frame). Genes with low periodicity scores in the RPF data are potentially mis-annotated. For example, SPAC823.02 shows a periodicity score of 0.15 in frame 1, but a clear enrichment in frame 3 (0.70). (B) Translational profile of SPAC823.02. The heat maps show mRNA and RPF levels across meiosis, starting with
vegetative cells and progressing downwards. The brightness of the red color is proportional to the read number. The schemes show the position of the UTRs (lines) and the ORF (boxes) for the proposed new structures and the annotated models. Translation is predicted to occur at different frames from those annotated for both exons. (C) Translational profile of tom7, labelled as in B. (D) Translational profile of pis1, annotated as in B. In pis1 RPF data demonstrates the existence of two mRNA isoforms created by the splicing or retention of an
intron. The gene contains two cleavage and polyadenylation sites (P1 and P2), one of which is located inside the intron, suggesting that intron retention may be associated with a shorter mRNA. The proposed splicing models were validated by the existence of ‘trans’ reads that spanned exon-exon junctions (green line, Read 1) or exon-intron junctions (green line, Read 2). All three new predicted proteins (B-D) showed high similarity to proteins from other Schizosaccharomyces species.
Nature Structural and Molecular Biology: doi:10.1038/nsmb.2843
Supplementary Figure 5
Polymorphism of the nup184 gene and translation of new genes.
A. Alignment of the 3’ end sequence of the nup184 gene of S. pombe, S. cryophilus and S. octosporus. The S. pombe reference sequence (from the 972 h- strain) contains a single nucleotide deletion (yellow) that creates an in-frame stop codon (green) that should prevent production of the C-terminal part of the Nup184 protein. B. Polymorphisms in the nup184 locus. Our wild type strain (968 h90) contains an insertion of a C at this position (yellow) that reverts the effect of the deletion. In the pat1 diploid, one chromosome appeared
Nature Structural and Molecular Biology: doi:10.1038/nsmb.2843
to have the insertion, while the second one contained the deletion associated with two upstream single nucleotide polymorphisms (green). Translation downstream of the predicted stop codon takes place in a frame consistent with the presence of the insertion. (C) Length distribution of novel translated regions (in nucleotides).
Nature Structural and Molecular Biology: doi:10.1038/nsmb.2843
Supplementary Figure 6
Examples of nested antisense genes and overlapping uORFs.
Nature Structural and Molecular Biology: doi:10.1038/nsmb.2843
(A) Translation of the spt16 locus. The heat maps show mRNA (top) and RPF levels (bottom) across the meiotic time course, starting with vegetative cells at the top and progressing downwards. The top graphs correspond to the sense strand, and the bottom ones to the antisense. The brightness of the red color is proportional to the number of reads. The scheme shows the position of the UTRs (arrows) and the ORF (boxes). LS corresponds to the long annotated sense gene and AS to the novel antisense translated coding sequence. (B) Triplet periodicity for the LS and AS forms of the spt16 locus. The graphs show the fraction of codons in which a majority of the reads map to nucleotides 1, 2 or 3 for the AS and LS ORFs. (C) Translation of the SPCC1235.01 locus. The top graphs shows the triplet periodicity across the gene calculated for a running window of 35 codons, and represented as the fraction of codons with a majority of reads in nucleotide 1, 2 or 3 within a codon. The heat maps are labelled as in (A). L corresponds to the annotated gene and S to the predicted overlapping uORFs. Note the change in reading frame as the window moves from one ORF to the next one. S overlaps with L and is more heavily translated, and is thus the dominant frame. P1 and P2 represent cleavage and polyadenylation sites. The fact that the 3’ region of the gene contains a lower number of mRNA reads and the presence of an internal cleavage site (P1) suggests the existence of two different isoforms of the gene. (B) Translation of the SPAC6G9.05 locus. Annotations as in (B).
Nature Structural and Molecular Biology: doi:10.1038/nsmb.2843
Supplementary Figure 7
Full scans for all Western blots presented in the main text.
Nature Structural and Molecular Biology: doi:10.1038/nsmb.2843
Supplementary Figure 8
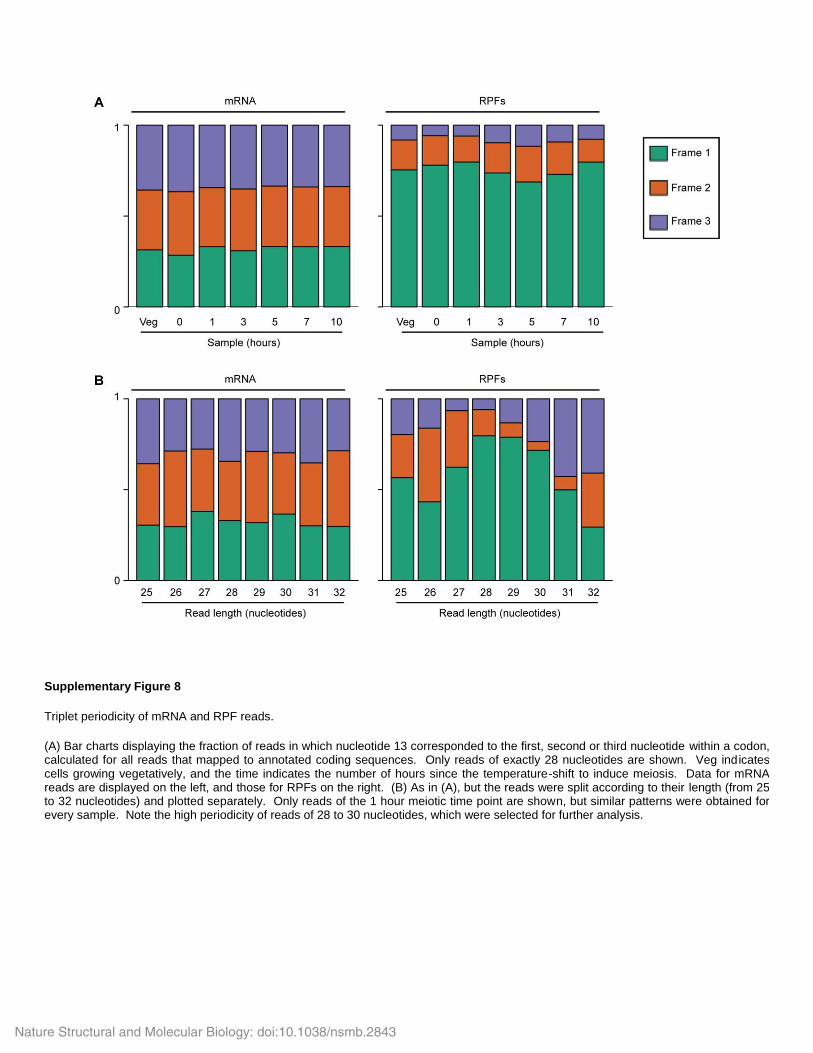
Triplet periodicity of mRNA and RPF reads.
(A) Bar charts displaying the fraction of reads in which nucleotide 13 corresponded to the first, second or third nucleotide within a codon, calculated for all reads that mapped to annotated coding sequences. Only reads of exactly 28 nucleotides are shown. Veg indicates cells growing vegetatively, and the time indicates the number of hours since the temperature-shift to induce meiosis. Data for mRNA reads are displayed on the left, and those for RPFs on the right. (B) As in (A), but the reads were split according to their length (from 25 to 32 nucleotides) and plotted separately. Only reads of the 1 hour meiotic time point are shown, but similar patterns were obtained for every sample. Note the high periodicity of reads of 28 to 30 nucleotides, which were selected for further analysis.
Nature Structural and Molecular Biology: doi:10.1038/nsmb.2843