♥ Student Research 333 Nature’s Early Warning Directions for Teachers Nature’s Early Warning Systems Note to Teachers: Information below is given for the Core Experiment. Additional information needed for each variation of the Core Experiment may be found beginning on page 345. For a specific variation, check the At-A-Glance Map. GETTING READY See sidebars for additional information regarding preparation of the lab. OBJECTIVES FOR CORE EXPERIMENT At the end of this lab, students will be able to: • Describe possible physiological or behavioral effects of sublethal doses of toxins on Daphnia. MATERIALS NEEDED You will need the following for a class of 24: ♥ 1 Daphnia culture ♥ 3 1.4 or 3.8-L (0.5 or 1-gallon) jars ♥ 1 Selenastrum capricornutum culture ♥ 3 L spring, aquarium, or reconstituted hard water ♥ 4.0 mL ethanol ♥ 196.0 mL filtered culture water ♥ 1 250-mL graduated cylinder or volumetric flask You will need the following for each group of three students in a class of 24: ♥ 15 Daphnia ♥ 1 culture dish ♥ 2 50-mL jars or beakers ♥ 1 wide-bore pipette ♥ 2 1-mL plastic, disposable pipettes ♥ 1 compound microscope ♥ 1 depression slide and cover slip ♥ 1 lab journal ♥ 1 pencil TEACHER PARTNERS Michelle Bagley Centennial High School 4300 Centennial Lane Ellicott City, MD 21403 Domenic Thompson Baltimore City College High School, 3220 The Alameda Baltimore, MD 21218 SCIENTIST PARTNER Brian Bradley University of Maryland, Baltimore County Biological Sciences, Room 480 5401 Wilkens Avenue Baltimore, MD 21228 SYNOPSIS FOR CORE EXPERIMENT Students will predict and test the effects of the etha- nol on the heart rate of Daphnia. APPROPRIATE BIOLOGY LEVEL Introductory or advanced LENGTH OF LAB A suggested time allotment follows: Day 1 (50 minutes) • Explain activity. Draw Daphnia from microscopic observations. Practice counting heartbeats. Day 2 (50 minutes) • Discuss and form hypothesis. Provide an opportunity to read about Daphnia. Day 3 (50 minutes) • Observe the heart rate under normal conditions and exposure to ethanol. Analyze and interpret results. PREPARATION TIME REQUIRED 30 to 40 minutes • Order Daphnia, purchase spring water, and gather materials. 20 minutes • Set up cultures. 5 minutes • Prepare the solution of ethanol.
Transcript
♥ Student Research 333Nature’s Early Warning
Directions for Teachers
Nature’s Early Warning Systems
Note to Teachers: Information below is given for the Core Experiment. Additionalinformation needed for each variation of the Core Experiment may be found beginningon page 345. For a specific variation, check the At-A-Glance Map.
GETTING READY
See sidebars for additional information regarding preparation of the lab.
OBJECTIVES FOR CORE EXPERIMENT
At the end of this lab, students will be able to:• Describe possible physiological or behavioral effects of sublethal doses of toxins
on Daphnia.
MATERIALS NEEDEDYou will need the following for a class of 24:
♥ 1 Daphnia culture
♥ 3 1.4 or 3.8-L (0.5 or 1-gallon) jars
♥ 1 Selenastrum capricornutum culture
♥ 3 L spring, aquarium, or reconstituted hard water
♥ 4.0 mL ethanol
♥ 196.0 mL filtered culture water
♥ 1 250-mL graduated cylinder or volumetric flask
You will need the following for each group of three students in a class of 24:
♥ 15 Daphnia
♥ 1 culture dish
♥ 2 50-mL jars or beakers
♥ 1 wide-bore pipette
♥ 2 1-mL plastic, disposable pipettes
♥ 1 compound microscope
♥ 1 depression slide and cover slip
♥ 1 lab journal
♥ 1 pencil
TEACHER PARTNERS
Michelle BagleyCentennial High School4300 Centennial LaneEllicott City, MD 21403Domenic ThompsonBaltimore City College HighSchool, 3220 The AlamedaBaltimore, MD 21218
SCIENTIST PARTNER
Brian BradleyUniversity of Maryland,Baltimore CountyBiological Sciences, Room 4805401 Wilkens AvenueBaltimore, MD 21228
SYNOPSIS FOR CORE EXPERIMENTStudents will predict and test the effects of the etha-nol on the heart rate of Daphnia.
• Discuss and form hypothesis. Providean opportunity to read about Daphnia.
Day 3 (50 minutes)
• Observe the heart rate under normalconditions and exposure to ethanol.Analyze and interpret results.
PREPARATION TIMEREQUIRED
30 to 40 minutes
• Order Daphnia, purchase spring water,and gather materials.
20 minutes
• Set up cultures.
5 minutes
• Prepare the solution of ethanol.
♥334 Student Research Nature’s Early Warning
♥ 1 clock with second hand or a stopwatch
♥ 1 calculator
♥ several paper towels or filter paper
♥ 2 pairs of latex gloves (optional)
♥ 25.0 mL 2.0% ethanol solution
DIRECTIONS FOR SETTING UP THE LAB• Glassware should be cleaned with hot water and rinsed thoroughly.
• Prepare the 2.0% ethanol solution by combining 4.0 mL ethanol and 196.0 mLfiltered culture water in a graduated cylinder or volumetric flask.
TEACHER BACKGROUND
Content InformationDaphnia, commonly called water fleas, are not insects, but small freshwater crusta-ceans (Class Crustacea, Subclass Brachiopoda, Order Diplostraca, SuborderCladocera). They are an important source of food for young fish. A transparentexoskeleton covers the entire body. Through it, one can see eggs in a female’s broodpouch hatch and develop. While still in the brood pouch their paired lateral eyescombine, forming the large single eye characteristic of adults. The light-colored or-gan lying above the eye is the brain. Two pairs of antennae protrude from the head.The smaller pair bears sensory organs. The larger, branched pair of antennae is usedas oars to move the water flea up and down. It cannot move forward or backward(Kramer, 1987).
Inside the exoskeleton are five pairs of legs with comb-like gills attached to them.When the legs kick forward, they bring a stream of water across the gills and washbits of food up to the mouth that lies just beneath the beak. The preferred food forDaphnia is bacteria, but for most species it is unicellular algae (Weber, 1991). Thefood travels from the mouth, through the esophagus, to the stomach that connectsto the intestine. The dorsal heart is clearly visible even though the blood cells arecolorless. In females, a large brood chamber that usually contains eggs ((2 to 40) isposterior to the heart. As the eggs develop they become less distinct. Secretions fromthe walls of the brood pouch nourish the developing Daphnia. See Figure 1.
Wear goggles and a lab apron when working with chemicals.
Do not use caffeine or nicotine.
Avoid pesticides and insecticides.
Use only substances that can be poured safely down the sink to makedisposal easier.
Work away from any open flames when using ethanol.
Prepare the student dilutions in a ventilation hood.
Wear latex gloves when working with ethanol. It can be absorbedthrough the skin.
Wash your hands after all work is completed.
Do not consume ethanol.
Dispose of broken glass in the proper receptacle.
Use KittyLitter to absorb any large spills. Sweep up the KittyLitter .
TEACHER’S NOTES
Inhaleor
Drink
ALCOHOL
GlassOnly
✴�✵��
SAFETY PROCEDURES
NicotineCaffeine
ALCOHOL
♥ Student Research 335Nature’s Early Warning
Figure 1. A species of Daphnia with several internal structures identified. (Used withpermission. Collins, K. & B. (1985). Daphnia — A Handy Guide. The AmericanBiology Teacher, 47(50), 299.
Only female Daphnia can be found in nature, during the spring and summer. Thesefemales reproduce parthenogenetically when they are about 10 days old, producingoffspring that are identical to themselves. Later in the year, in response to changes intemperature, light and food availability, small males are produced also. Sexual re-production produces fewer, but larger eggs. These eggs contain more yolk and thickershells that nourish and protect the offspring until conditions improve. As furtherprotection from a harsh environment, the walls of the female’s brood pouch alsothicken. When she molts, the walls remain around the eggs.
Daphnia have many uses in the laboratory. Their transparent covering allows theirphysiology to be studied while they are alive. They also may be used as food forhydra or aquarium fish. They represent an important link in many freshwater eco-systems. The stomach contents of young fish are rarely less than 10% Daphnia andmay be as much as 95% Daphnia (Pennak, 1989). Indicator species serve as an earlywarning that a community or an ecosystem is being degraded. Since the 1940’s,Daphnia have been used as an indicator species in lab tests for toxicity thresholds ofindustrial wastes. They are more sensitive than trout, a fish known for its suscepti-bility to poisons. Standards for using them in detecting toxic materials in freshwaterare established by the Environmental Protection Agency (EPA) (Weber, 1991). Those
TEACHER’S NOTESAntennae
Compound eye
Esophagus
Intestine
Heart
Breathing legs
Brood sac
Abdominal claw
Beak(rostrum)
♥336 Student Research Nature’s Early Warning
guidelines even specify the appropriate food to give animals used in toxicity tests.For example, Daphnia fed diatoms are more tolerant to pollutants than those fedgreen algae alone.
A chemical may be beneficial, toxic, or lethal to Daphnia. A chemical can be benefi-cial if the exposure is moderate and the chemical is used under the proper circum-stances. Under certain conditions, it can be toxic: causing harm, but not killing theDaphnia. A chemical is lethal if it kills the Daphnia. Factors that affect whether achemical is beneficial, toxic, or lethal include how it enters the body, the body weight,exposure time, and the amount of chemical. A chemical may be very toxic in a lowdosage, but lethal to the same individual at a higher dosage.
Like many planktonic organisms, Daphnia migrate up and down. They usually arefound actively swimming in the early morning and late afternoon when the sun islow, but have inconspicuously retreated to the bottom of a shallow lake in the middleof the day. Experimentally blinded animals still migrate (Pennak, 1989). Is there alight sensor somewhere else in the body? Is the rhythm endogenous? Can disrup-tions of this behavior occur if sublethal amounts of toxins are in the environment?At least the last of these questions has been addressed. Goodrich and Lech (1990)developed an assay to assess the disruption of spatial orientation of Daphnia magna.
Pedagogical InformationThe following is a chart of some concepts related to this lab and some student mis-conceptions of these concepts:
INSTRUCTIONAL PROCEDURES FOR THE CORE EXPERIMENT
IntroductionThe teacher should begin the Core Experiment by giving each laboratory group aflask or culture dish containing Daphnia. As the students observe the specimens, theteacher can prompt a discussion with the following questions:• Are all of the organisms of the same species or different species?
• Compare and contrast the organisms’ size, swimming motion, number of append-ages, and degree of transparency.
• If they are the same species, what inferences might be made to explain the differ-ences in size?
HYPOTHESIS GENERATION
The following discussion and activities are designed to elicit questions that studentscan transform into hypotheses.
TEACHING TIPS• When transferring Daphnia from
one container to another, never pourthe liquid through the air. Air maybecome trapped under theircarapaces, causing them to float.They are unable to break the surfacetension of the water and will betrapped above the water surface anddie. Instead, keep the pipette tipsubmerged.
• If Daphnia are to be used more thana couple of days, feed them with anon-filamentous alga such asSelenastrum capricornutum.Biological supply companies also sella concentrated food.
• A 3-L culture of 30 animals shouldprovide about 300 young Daphniaper week (Weber, 1991).
• At 28°C, Daphnia live an average of26 days; at 18°C, 42 days; and at8°C, 108 days (Pennak, 1989).
• Aerate the culture lightly and providea light cycle of 16 hours light/8 hoursdark. Low oxygen concentrations arewell tolerated, so you may not needto aerate.
• At weekly intervals, siphon off anddiscard 90% of the culture medium.Cover the end of the siphon tubewith fine mesh, such as organza, toavoid removing Daphnia. Gentlypour the remaining 10% of themedium with animals into freshculture medium. The tube may bemade from glass tubing, a Pasteurpipette, or plastic transfer pipette.
• Spring water is obtained easily fromsupermarkets or from biologicalsupply houses. You may have greatersurvival with aquarium water or withreconstituted hard water (Weber,1991).
• Use a dishwasher to clean allglassware if one is easily accessiblewithin the school.
• Glass should be cleaned betweeneach use.
• Sublethal solutions of toxins shouldbe measured in terms of the percentof solute in the solvent (weight/volume or volume/volume).
• Encourage your students to think ofconditions they might need tocontrol in measuring heart rate.Consider how the temperature andlight might change if they leave theirslides on the microscope stage withthe light.
Correct Concept• Low levels of toxins can affect organ-
isms.
• Clear water may contain toxins.
• Indicator species as small as Daphniaserve as an early warning that a com-munity or an ecosystem is being de-graded.
Misconception• It takes high levels of toxins to af-
fect organisms.
• Clear water is free of chemical toxins.
• Only large, complex organisms aregood indicator species for observ-ing the effects of pollution.
• Indicator species serve as early warn-ings that a community or an eco-system is being depleted.
♥ Student Research 337Nature’s Early Warning
After observing the cultures, have students read “Canaries of the Stream” (Essman& Zarpas, 1990). Follow the reading with a discussion of chemical pollution in ourstreams and rivers by industry, farms, cities, and individuals. Bring in examples oflocal industries and other sources. Lawn care products and automobile maintenancewastes are sources of pollution in even the most clean industrial area. Companieswhose products involve making or using glues or resins are likely to have the poten-tial to discharge waste alcohol. Ask the following questions:• What activities did you observe in your Daphnia?• Do you expect the activities to change if the environment of the Daphnia changes?• How could you measure or quantify those activities?• What environmental changes might occur in a lake or pond as a result of human
activity?• What environmental changes occur in a lake or pond even without human activ-
ity?
Sample Hypotheses• The heart rate of Daphnia will decrease when the culture is enriched with lawn
fertilizer.• The exposure of Daphnia to rain run-off from the school parking lot will cause a
reduction in the population growth.• Exposure to ethanol will result in a decrease in the percentage of Daphnia show-
ing positive phototaxis.
On the following pages are a sample hypothesis, procedure, and data analysis set withinterpretation that students might develop for the Core Experiment. It is followed by arelated test question and answer for teacher evaluation. This example has been includedas a potential outcome of the activity and should not be given to the students. Studentsshould develop their own hypotheses and procedures. Make sure they understand thatthere is not just one correct hypothesis, procedure, or data set. The Variations of the CoreExperiment will give each team of students the opportunity to expand on the Core Hy-pothesis. Additional test questions are found on page 343.
QuestionWhat is the effect of ethanol on the Daphnia heart rate?
HypothesisExposure to ethanol will cause a decrease in the Daphnia heart rate.
RationaleEthanol depresses the heart rate in humans and may have the same effect on Daph-nia.
Procedure1. Obtain 15 Daphnia with a wide bore pipette. Place in a 50-mL jar filled with
culture water.2. Set up a second jar or culture dish with culture water to act as a recovery area for
treated Daphnia.3. Prepare a wet mount of an adult Daphnia using culture water. Use a depression
slide to avoid crushing the animal. Pieces of a broken cover glass or a ring of gelmay be used to support the cover slip.
4. Observe the Daphnia under low power. Identify the following structures: heart,brood sac, swimmers, beak, eye, and antennae. Note the location of the heart andits rate.
(
• Many factors may influence the heartrate:
- The heart rate may increase afterfeeding (Baylor, 1942 in Maynard,1960).
- Light may increase the heart ratefor animals kept in dim light(Schulz, 1928 in Maynard, 1960).
- Circadian rhythms influence theheart rate. Daphnia’s heart rate isgreatest in late afternoon and earlyevening (Tonolli, 1947 in Maynard,1960).
- Some materials in the environmentwill not affect the heart rate, but ifthey are in the circulatory systemthey will affect it (Lévy, 1927 inMaynard, 1960).
- Increasing temperature, over thenormal environmental range,increases the rate of heart con-tractions about 50 at 5°C to about200 at 27°C (MacArthur & Baillie,1929 in Maynard, 1960).
• A constant temperature is necessaryto ensure consistent experimentalresults. For standard toxicity assays,the culture temperature should be 20± 2°C (Weber, 1991), but normalgrowth will occur from 18 to 26°C.
• If you want your students to appre-ciate the probabilistic nature ofscience, encourage them to analyzetheir results statistically. For paired setsof data, a Sign Test or t-test of PairedComparisons is appropriate as is theWilcoxon’s Signed-Rank Test. Thelatter is explained in the analysis ofthe Core Experiment. For all of thesetests, the tabled values for comparisonshould be considered a black box;simply use the values without concernfor their derivation.
TEACHING TIPS
♥338 Student Research Nature’s Early Warning
5. Sketch the Daphnia using these observations.6. After 20 minutes of observation, select a team number assignment from 1 through
10.7. Student Teams 6 through 10 should go to Step 8. Student Teams 1 through 5
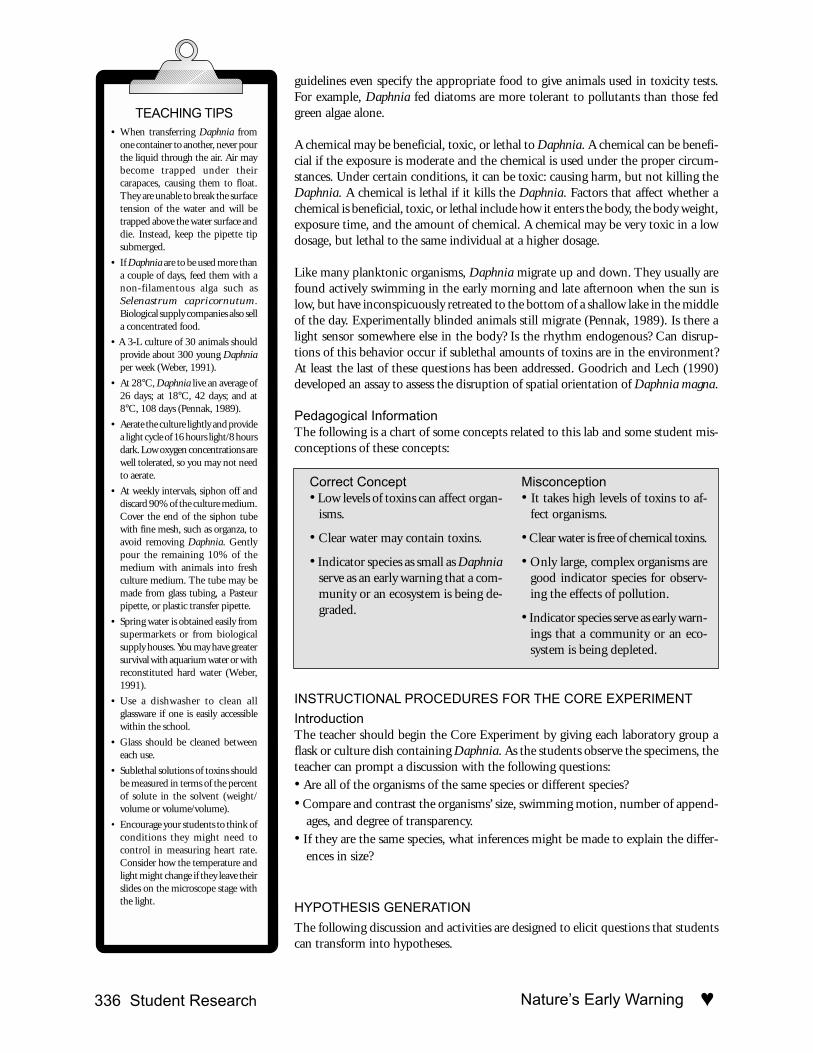
should do the following procedure:a. Remove the cover slip and use a paper towel or filter paper to remove all the
culture water carefully from under the cover slip of the depression slide well.Alternatively, use a disposable, plastic 1-mL pipette to remove a majority of theculture water from the depression slide so that area of movement of the Daph-nia is reduced significantly. This will improve the process of counting heartbeats.
Use pipette to removewater from slide
Figure 2. Removing water from Daphnia in a depression slide.
b. Count the number of heartbeats in 15 seconds with a calculator as follows:Step 1: The student who will be counting the heartbeats should enter 1 + 1 on
the calculator and focus on the Daphnia’s heart.Step 2: At the other partner’s signal, the student observing the heart rate should
count heartbeats by tapping the “=” key on the calculator for each heartbeatobserved.
Step 3: After the 15-second signal provided by the partner, the student observ-ing the heartbeats should stop entering heartbeats on the calculator.
Step 4: Calculate the number of heartbeats per minute by subtracting the addi-tional “1” that was entered initially and multiply this value by 4. For ex-ample, if the calculator reads 84 beats at the end of the 15-second interval,subtract “1” for a value of 83. Multiply this value by 4 for the number ofheartbeats per minute: 332.
TEACHER’S NOTES
(continued on p. 341)
♥ Student Research 339Nature’s Early Warning
c. Use a second 1-mL disposable pipette to replace the water with enough 2.0%ethanol solution to submerge the Daphnia.
d. Count the Daphnia heartbeats at 2-minute intervals over a 10-minute periodas described in 7b, Steps 1 to 4. Team 1 should observe their Daphnia at 2minutes; Team 2 at 4 minutes; Team 3 at 6 minutes; Team 4 at 8 minutes; andTeam 5 at 10 minutes.
e. After the count is made, quickly remove the alcohol with the disposable plasticpipette. Exposure time of each specimen should be minimized where possible.Return the specimen to a culture container reserved for specimens that alreadyhave been subjected to the alcohol treatment. This will eliminate the chance ofusing a specimen more than once and reduce the risk of contaminating theculture with residual ethanol.
8. Student Teams 6 through 10 should do the following procedure:a. Remove the cover slip and use a paper towel or filter paper to remove all the
culture water carefully from under the cover slip of the depression slide well.Alternatively, use a disposable, plastic 1-mL pipette to remove a majority of theculture water from the depression slide so that area of movement of the Daph-nia is significantly reduced to improve the process of counting heartbeats.
b. Replace the water with enough 2.0% ethanol solution to submerge the Daph-nia.
c. Observe the Daphnia heartbeat at 2-minute intervals over a 10-minute periodas described in Steps 7 a to c. Team 6 should observe their Daphnia at 2 min-utes; Team 7 at 4 minutes; Team 8 at 6 minutes; Team 9 at 8 minutes; andTeam 10 at 10 minutes.
d. After the count is made, quickly remove the ethanol from the slide. Replace itwith a drop of culture water. Exposure time of each specimen to the ethanolshould be minimized.
e. After 5 minutes in the culture water solution, count the number of heartbeatsin 15 seconds and record the heart rate of the specimen in beats per minute.Return the specimen to a culture container reserved for specimens that havebeen used already to eliminate the chance of using a specimen more than onceand reduce the risk of contaminating the culture with residual ethanol.
f. Pool class data for analysis.
SAMPLE DATA ANALYSIS AND INTERPRETATION
Sample Data
Table 1. Effect of 2.0% ethanol on the heart rate of Daphnia.
Student team Untreated Ethanol exposed Retreated (beats/minute) (beats/minute) with culture
water (beats/minute)
1 296 184
2 312 221
3 288 133
4 336 121
5 296 65
6 252 156 224
7 220 155 198
8 244 112 225
9 252 91 150
10 248 54 98
TEACHER’S NOTES
♥340 Student Research Nature’s Early Warning
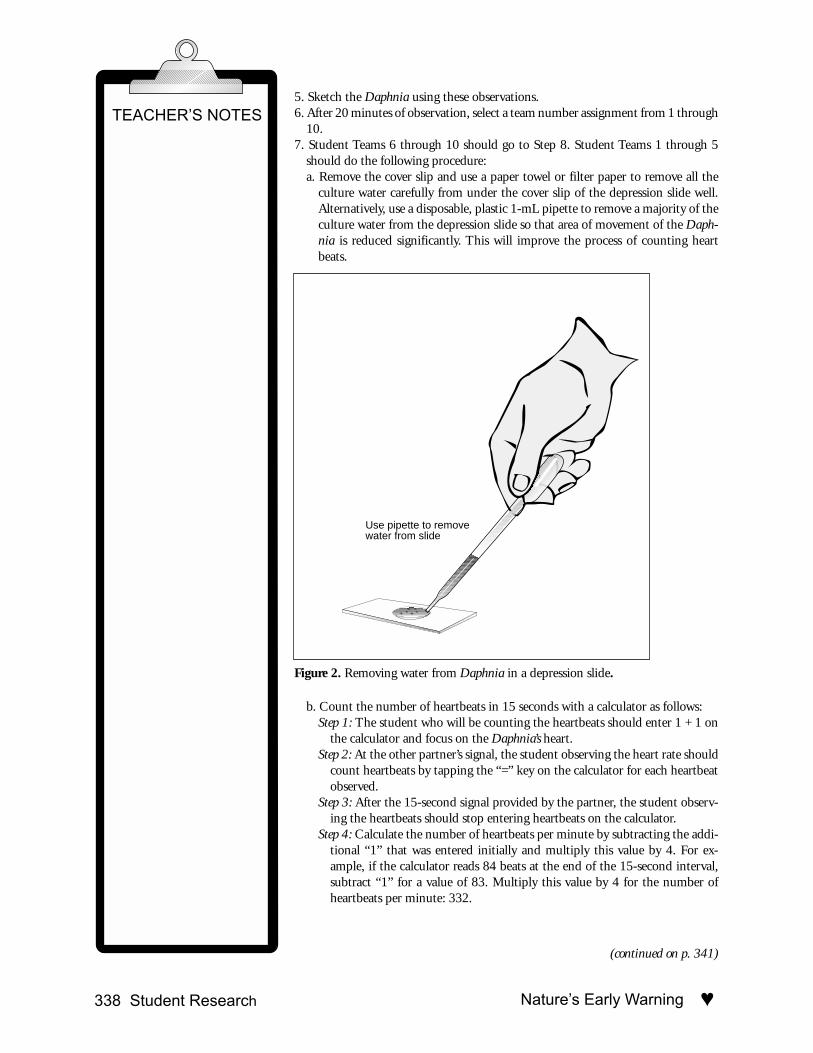
Graph A. Daphnia heart rate before and after exposure to 2.0% ethanol, and recoveryperiod.
TEST QUESTION
Why must half the Daphnia be evaluated first with ethanol and the other half evalu-ated first with culture water?
STUDENT DESIGN OF THE NEXT EXPERIMENT
After the students have collected and analyzed these data from their experiments andshared results and conclusions with the class, encourage them to brainstorm ideasfor experiments they could do next. They should think of questions that occurred tothem as they conducted their first experiments. Ask them what quantifiable experi-ments could be done based on observations they have made.
Have students return to their experimental lab groups to share ideas before writingtheir proposals. Questions students may suggest include the following:• Are there physiological or behavioral effects that you observed that might be a
result of the low levels of toxin?• Was time a factor?• What is the value of indicator species such as Daphnia?• If Daphnia is a good indicator organism for low levels of ethanol, to what else
might it be sensitive?• Is there a level at which you can kill the indicator species?• What might be the long term effects of sublethal doses of toxins?• How might sublethal doses affect longevity?
SUGGESTED MODIFICATIONS FOR STUDENTS WHO ARE EXCEPTIONAL
These are possible ways to modify this specific activity for students who have specialneeds, if they have not already developed their own adaptations. General suggestionsfor modification of activities for students with disabilities are found in the AAASBarrier-Free in Brief publications. Refer to p. 15 of the introduction of this book forinformation on ordering FREE copies of these publications. Some of these bookletshave addresses of agencies that can provide information about obtaining assistivetechnology, such as Assistive Listening Devices (ALDs); light probes; and talkingthermometers, calculators, and clocks.
InterpretationThese data support the hypothesis thatethanol will cause a decrease in theheart rate of Daphnia. The heart rateof Daphnia exposed to ethanol over a10-minute interval was depressed by78%. At a concentration of 2.0%,Daphnia detect ethanol as a toxin.
Answer to Test QuestionDividing the sample removes thevariable of handling introduced bydistributing the effect of handlingequally between the ethanol-exposedand unexposed specimens, leavingonly exposure as the variable toevaluate.
0
50
100
150
200
250
300
350
Minutes exposed to ethanol
2 4 6 8 10
ControlTreated Retreated
AverageDaphnia
heart rate(beats/minute)
Ethanol effects on Daphnia heart rate over a 10-minute interval
♥ Student Research 341Nature’s Early Warning
Blind or Visually Impaired• Provide a complete copy of the laboratory experiment printed in braille. An en-
larged diagram of the structures of Daphnia (Figure 1) should be included as araised-line drawing.
• Encourage the visually impaired student to record lab data in braille and make atypewritten copy for the team. A computer enables a visually impaired student toact as a recorder for the team.
• Ask the visually impaired student to provide a typed lab report and to keep abraille copy for personal use.
• Ask the visually impaired student to make graphs of data collected to accompanythe team lab report.
Deaf or Hard-of-Hearing• Allow hearing impaired students to participate fully in the experiment.
Mobility Impaired• Provide a lab table with a height that accommodates wheelchair access.• Permit wheelchair movement if the classroom is large enough to allow the mobil-
ity impaired student to obtain supplies as needed.• Have lab team members prepare slides for the manually impaired student to ob-
serve and count the heartbeat of Daphnia.• Provide the manually impaired student with a tape recorder or other means to
collect data and to take notes.• Provide the manually impaired student with a microscope equipped with levers
that can focus the fine adjustment.
ADDITIONAL TEST QUESTIONS
Test questions for the Core Experiment also may include the following:1. Ethanol, the alcohol in liquor, is a depressant for humans. If methanol, a poison
for humans, is a depressant for offspring, do these data graphed below supportyour expectation? Explain.
Graph B. Influence of methanol on heart rate of Daphnia.
2. Why was it desirable to pool class data to evaluate the effect of ethanol on theheart rate of water fleas?
Answers to AdditionalTest Questions
1. The expectation was that the meth-anol would depress or lower the heartrate of water fleas, or maybe even killthem. For three of the four testedanimals, the heart rate was loweredand for the fourth there was nochange. This supports the hypothesis.The number of water fleas examinedis too small to dismiss the possibilitythat chance alone accounts for theseobservations.
2. Many factors can influence theresponses of an organism. Here, therewas no control over or no way to mea-sure the age of the animal, the amountof heat supplied by the microscopelight, the oxygen deprivation providedby reduced water, or handling stress.Since these, and possibly other factors,could provide variations in theresponse, several samples were neededto obtain a measure of the trueresponse.
0
50
100
150
200
250
Trial
1 2 3 4
Exposed Unexposed
Daphniaheart rate
(beats/minute)
Heart rate of methanol-exposed and unexposed Daphnia
♥342 Student Research Nature’s Early Warning
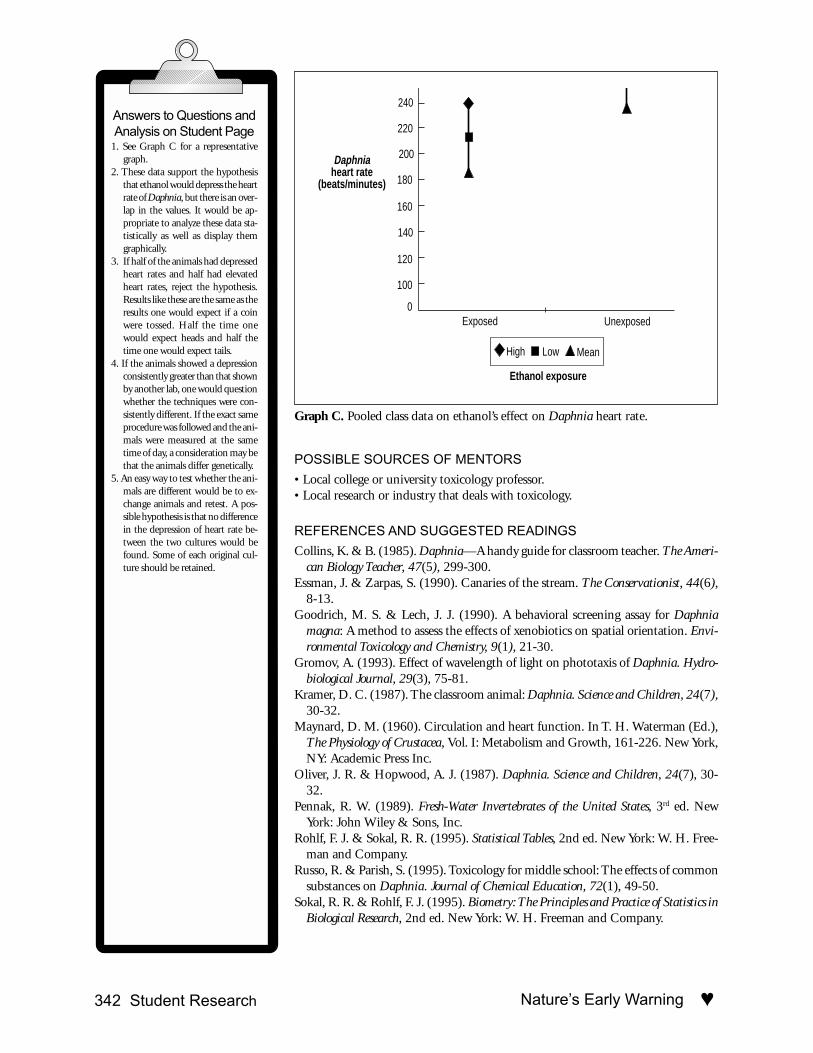
Graph C. Pooled class data on ethanol’s effect on Daphnia heart rate.
POSSIBLE SOURCES OF MENTORS
• Local college or university toxicology professor.• Local research or industry that deals with toxicology.
REFERENCES AND SUGGESTED READINGS
Collins, K. & B. (1985). Daphnia—A handy guide for classroom teacher. The Ameri-can Biology Teacher, 47(5), 299-300.
Essman, J. & Zarpas, S. (1990). Canaries of the stream. The Conservationist, 44(6),8-13.
Goodrich, M. S. & Lech, J. J. (1990). A behavioral screening assay for Daphniamagna: A method to assess the effects of xenobiotics on spatial orientation. Envi-ronmental Toxicology and Chemistry, 9(1), 21-30.
Gromov, A. (1993). Effect of wavelength of light on phototaxis of Daphnia. Hydro-biological Journal, 29(3), 75-81.
Kramer, D. C. (1987). The classroom animal: Daphnia. Science and Children, 24(7),30-32.
Maynard, D. M. (1960). Circulation and heart function. In T. H. Waterman (Ed.),The Physiology of Crustacea, Vol. I: Metabolism and Growth, 161-226. New York,NY: Academic Press Inc.
Oliver, J. R. & Hopwood, A. J. (1987). Daphnia. Science and Children, 24(7), 30-32.
Pennak, R. W. (1989). Fresh-Water Invertebrates of the United States, 3rd ed. NewYork: John Wiley & Sons, Inc.
Rohlf, F. J. & Sokal, R. R. (1995). Statistical Tables, 2nd ed. New York: W. H. Free-man and Company.
Russo, R. & Parish, S. (1995). Toxicology for middle school: The effects of commonsubstances on Daphnia. Journal of Chemical Education, 72(1), 49-50.
Sokal, R. R. & Rohlf, F. J. (1995). Biometry: The Principles and Practice of Statistics inBiological Research, 2nd ed. New York: W. H. Freeman and Company.
Answers to Questions andAnalysis on Student Page
1. See Graph C for a representativegraph.
2. These data support the hypothesisthat ethanol would depress the heartrate of Daphnia, but there is an over-lap in the values. It would be ap-propriate to analyze these data sta-tistically as well as display themgraphically.
3. If half of the animals had depressedheart rates and half had elevatedheart rates, reject the hypothesis.Results like these are the same as theresults one would expect if a coinwere tossed. Half the time onewould expect heads and half thetime one would expect tails.
4. If the animals showed a depressionconsistently greater than that shownby another lab, one would questionwhether the techniques were con-sistently different. If the exact sameprocedure was followed and the ani-mals were measured at the sametime of day, a consideration may bethat the animals differ genetically.
5. An easy way to test whether the ani-mals are different would be to ex-change animals and retest. A pos-sible hypothesis is that no differencein the depression of heart rate be-tween the two cultures would befound. Some of each original cul-ture should be retained.
Exposed0
100
120
140
160
180
200
220
Daphniaheart rate
(beats/minutes)
Ethanol exposure
240
Unexposed
High Low Mean
♥ Student Research 343Nature’s Early Warning
Weber, C. I. (Ed.). (1991). Methods for Measuring the Acute Toxicity of Effluents andReceiving Waters to Freshwater and Marine Organisms, 4th ed. Cincinnati, OH:U.S. Environmental Protection Agency.
Wolvekamp, H. P. & Waterman, T. H. (1960). Respiration. In T. H. Waterman(Ed.), The Physiology of Crustacea, Vol. I. New York: Academic Press, Inc.
VARIATIONS OF CORE EXPERIMENTAfter completing the Core Experiment, students should use the results to develop avariation on that experiment. The following directions are meant only as a guide forthe teacher. They suggest possible hypotheses students may develop and data thatmay result.
Note to Teachers: Only information that is unique to each Variation of the Core Experi-ment is found in this section. Unless otherwise noted, teacher information not listed foreach variation is the same as that found in the Core Experiment. Materials listed in thissection are needed in addition to the materials listed for the Core Experiment.
VARIATION 1The Effect of Different Concentrations of Ethanol on the
Heart Rate of Daphnia
SYNOPSIS
Students will compare the heart rates of Daphnia exposed to different concentra-tions of ethanol.
ADDITIONAL MATERIALS NEEDEDYou will need the following for each group of three to four students in a class of 24:
♥ 5 mL 8.0% solution of ethanol
♥ 5 mL 4.0% solution of ethanol
♥ 5 mL 2.0% solution of ethanol
♥ 5 mL 1.0% solution of ethanol
♥ 10 to 12 Daphnia
• Provide the students with test tubesor small beakers and a syringe orgraduated pipette and have themprepare their own dilutions fromthe 8.0% solution you provide.
• There is a lot of counting and thereare several wait periods for the waterfleas to adjust to their surroundings.Two or three teams might beencouraged to cooperate on anexercise as demanding as this. Theteams could reciprocate by helpingone another on another variationthey propose. This kind of cooperationis common in large research labs.
• Remind students that the pondwater and 2.0% ethanol measure-ments of another day are betterrepeated under the conditions ofthis day.
VA
RIA
TIO
N 1
TEACHING TIPS
♥344 Student Research Nature’s Early Warning
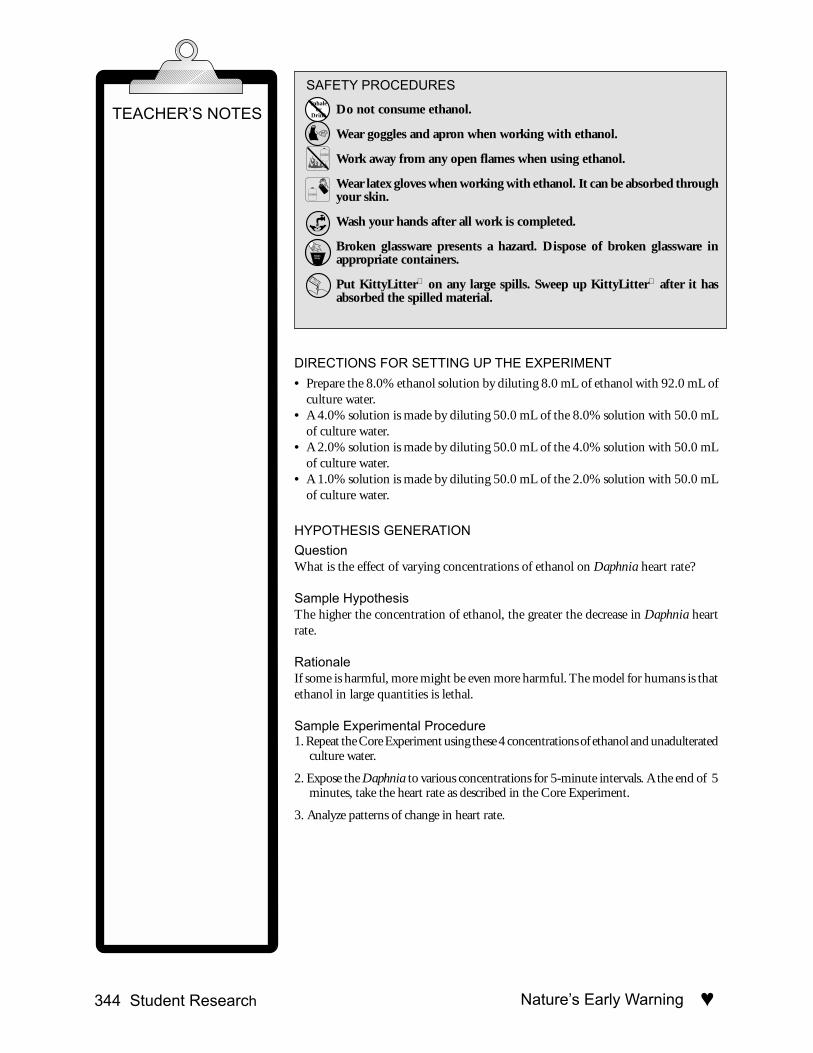
SAFETY PROCEDURES
Do not consume ethanol.
Wear goggles and apron when working with ethanol.
Work away from any open flames when using ethanol.
Wear latex gloves when working with ethanol. It can be absorbed throughyour skin.
Wash your hands after all work is completed.
Broken glassware presents a hazard. Dispose of broken glassware inappropriate containers.
Put KittyLitter on any large spills. Sweep up KittyLitter after it hasabsorbed the spilled material.
DIRECTIONS FOR SETTING UP THE EXPERIMENT
• Prepare the 8.0% ethanol solution by diluting 8.0 mL of ethanol with 92.0 mL ofculture water.
• A 4.0% solution is made by diluting 50.0 mL of the 8.0% solution with 50.0 mLof culture water.
• A 2.0% solution is made by diluting 50.0 mL of the 4.0% solution with 50.0 mLof culture water.
• A 1.0% solution is made by diluting 50.0 mL of the 2.0% solution with 50.0 mLof culture water.
HYPOTHESIS GENERATION
QuestionWhat is the effect of varying concentrations of ethanol on Daphnia heart rate?
Sample HypothesisThe higher the concentration of ethanol, the greater the decrease in Daphnia heartrate.
RationaleIf some is harmful, more might be even more harmful. The model for humans is thatethanol in large quantities is lethal.
Sample Experimental Procedure1. Repeat the Core Experiment using these 4 concentrations of ethanol and unadulterated
culture water.
2. Expose the Daphnia to various concentrations for 5-minute intervals. A the end of 5minutes, take the heart rate as described in the Core Experiment.
3. Analyze patterns of change in heart rate.
TEACHER’S NOTESInhale
orDrink
ALCOHOL
GlassOnly
✴�✵��
ALCOHOL
♥ Student Research 345Nature’s Early Warning
DATA ANALYSIS AND INTERPRETATION
Sample Data
Table 2. Effect of ethanol concentration on Daphnia heart rate. Values reported arethe average rates for 10 animals.
Percent ethanol Exposed Unexposed
1.0 160 184
2.0 170 200
4.0 184 224
8.0 186 216
Graph D. Effect of varying ethanol concentrations on Daphnia heartbeat rate perminute.
TEST QUESTION
How could you determine if the results of your experiment represent differences indiffusion rates resulting from using solutions of different concentrations?
SUGGESTED MODIFICATIONS FOR STUDENTS WHO ARE EXCEPTIONAL
Blind or Visually Impaired• Provide syringes or plastic graduated cylinders in a variety of sizes to allow the
visually impaired student to prepare the ethanol solutions indicated in the lab.
InterpretationThese data show a slight increase of13% at 1.0% ethanol to 18% at 4.0%ethanol. These three concentrations of1.0%, 2.0%, and 4.0% support thehypothesis that increasing concen-trations of ethanol will result in increas-ing depressions of heart rate. Thedepression of heart rate was less withexposure to 8.0% ethanol than it waswith exposure to 4.0% ethanol. Thesetrials were done sequentially and earlyin the day with the 8.0% observationsmade first. It may be that some dailyrhythm in the water fleas hasconfounded the results. It is recom-mended that this exercise be repeatedrandomizing the treatments.
Answer to Test QuestionOne would expect that the greater thedifference in the concentration ofsolutions of the internal and externalenvironments of the water flea, thegreater the diffusion will be and themore quickly the effect will bedetected. With the exception of themost concentrated solution, that iswhat was found. While the results areconsistent with the effects of diffusion,they do not prove that the observeddifferences are caused by diffusion. Itcould be that water fleas are able todetoxify ethanol. One could test thisby leaving them in a dilute ethanolsolution for a longer time. If they areable to detoxify the ethanol, theextended time will not result in theirdeath.
Exposed
1.0 2.0 4.0 8.0160
170
180
190
200
210
220
Daphniaheart rate
(beats/minute)
Percent ethanol (axis not to scale)
Effect of ethanol concentration on Daphnia heart rate
Unexposed
230
♥346 Student Research Nature’s Early Warning
VA
RIA
TIO
N 2
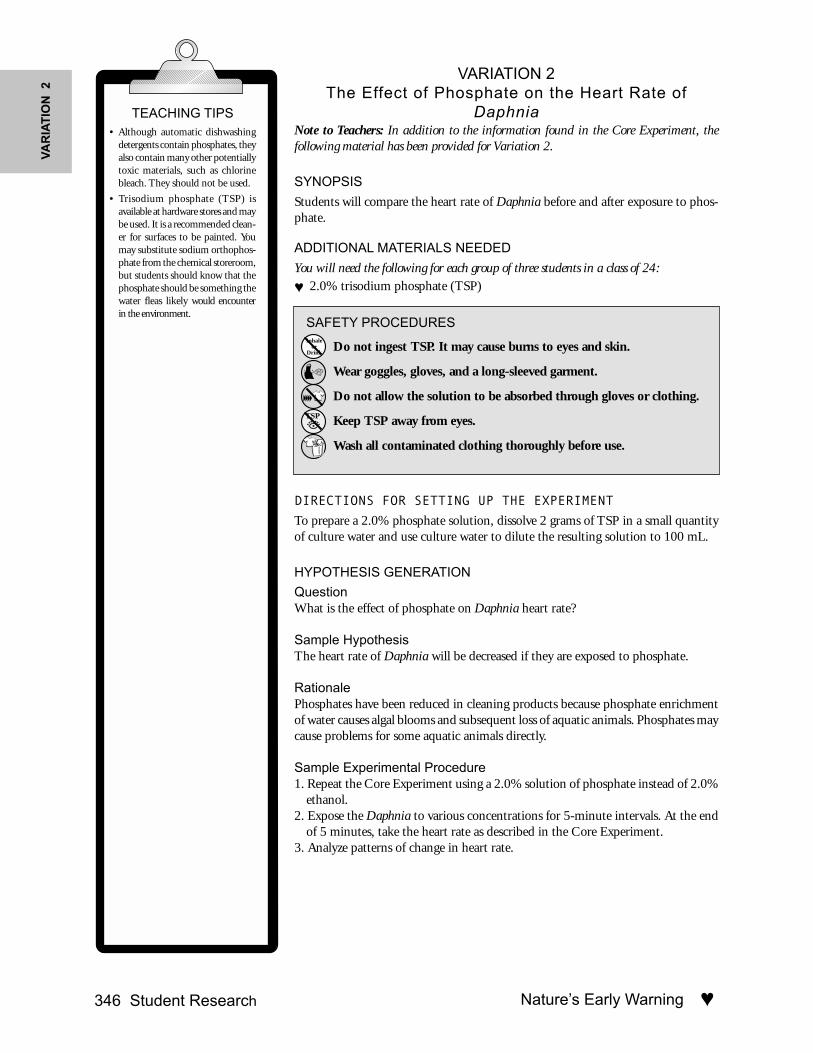
VARIATION 2The Effect of Phosphate on the Heart Rate of
DaphniaNote to Teachers: In addition to the information found in the Core Experiment, thefollowing material has been provided for Variation 2.
SYNOPSIS
Students will compare the heart rate of Daphnia before and after exposure to phos-phate.
ADDITIONAL MATERIALS NEEDED
You will need the following for each group of three students in a class of 24:
♥ 2.0% trisodium phosphate (TSP)
SAFETY PROCEDURES
Do not ingest TSP. It may cause burns to eyes and skin.
Wear goggles, gloves, and a long-sleeved garment.
Do not allow the solution to be absorbed through gloves or clothing.
Keep TSP away from eyes.
Wash all contaminated clothing thoroughly before use.
DIRECTIONS FOR SETTING UP THE EXPERIMENT
To prepare a 2.0% phosphate solution, dissolve 2 grams of TSP in a small quantityof culture water and use culture water to dilute the resulting solution to 100 mL.
HYPOTHESIS GENERATION
QuestionWhat is the effect of phosphate on Daphnia heart rate?
Sample HypothesisThe heart rate of Daphnia will be decreased if they are exposed to phosphate.
RationalePhosphates have been reduced in cleaning products because phosphate enrichmentof water causes algal blooms and subsequent loss of aquatic animals. Phosphates maycause problems for some aquatic animals directly.
Sample Experimental Procedure1. Repeat the Core Experiment using a 2.0% solution of phosphate instead of 2.0%
ethanol.2. Expose the Daphnia to various concentrations for 5-minute intervals. At the end
of 5 minutes, take the heart rate as described in the Core Experiment.3. Analyze patterns of change in heart rate.
TEACHING TIPS• Although automatic dishwashing
detergents contain phosphates, theyalso contain many other potentiallytoxic materials, such as chlorinebleach. They should not be used.
• Trisodium phosphate (TSP) isavailable at hardware stores and maybe used. It is a recommended clean-er for surfaces to be painted. Youmay substitute sodium orthophos-phate from the chemical storeroom,but students should know that thephosphate should be something thewater fleas likely would encounterin the environment.
Inhaleor
Drink
TSP
♥ Student Research 347Nature’s Early Warning
DATA ANALYSIS AND INTERPRETATION
Sample Data
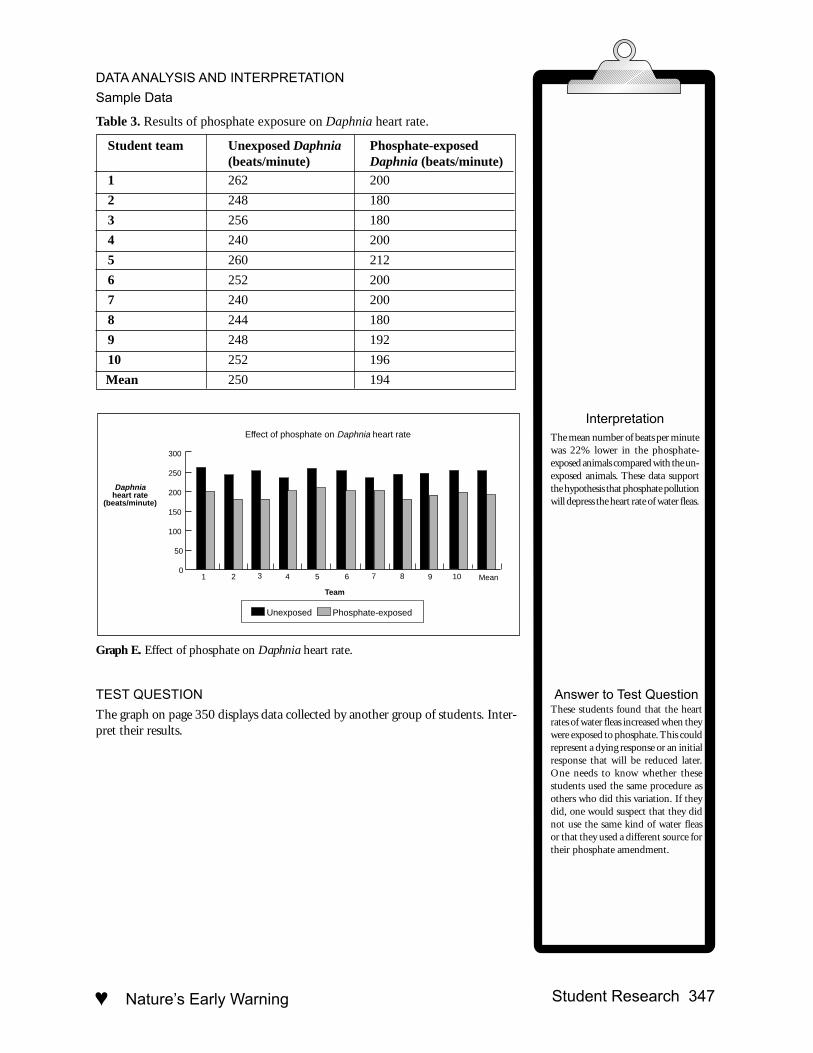
Table 3. Results of phosphate exposure on Daphnia heart rate.
Student team Unexposed Daphnia Phosphate-exposed(beats/minute) Daphnia (beats/minute)
1 262 200
2 248 180
3 256 180
4 240 200
5 260 212
6 252 200
7 240 200
8 244 180
9 248 192
10 252 196
Mean 250 194
Graph E. Effect of phosphate on Daphnia heart rate.
TEST QUESTION
The graph on page 350 displays data collected by another group of students. Inter-pret their results.
InterpretationThe mean number of beats per minutewas 22% lower in the phosphate-exposed animals compared with the un-exposed animals. These data supportthe hypothesis that phosphate pollutionwill depress the heart rate of water fleas.
Answer to Test QuestionThese students found that the heartrates of water fleas increased when theywere exposed to phosphate. This couldrepresent a dying response or an initialresponse that will be reduced later.One needs to know whether thesestudents used the same procedure asothers who did this variation. If theydid, one would suspect that they didnot use the same kind of water fleasor that they used a different source fortheir phosphate amendment.
0
50
100
150
200
250
300
Daphniaheart rate
(beats/minute)
Team
Effect of phosphate on Daphnia heart rate
1 2 3 4 5 6 7 8
Unexposed Phosphate-exposed
Mean9 10
♥348 Student Research Nature’s Early Warning
VA
RIA
TIO
N 3
Unexposed
10.0 1.0 0.1 0.0180
100
120
140
160
180
200
Daphniaheart rate
(beats/minute)
Percent phosphate (axis not to scale)
Effect of increasing concentrations of phosphateon Daphnia heart rate
Exposed
220
240
260
Graph F. Influence of phosphate on Daphnia heart rate.
SUGGESTED MODIFICATIONS FOR STUDENTS WHO ARE EXCEPTIONAL
Blind or Visually Impaired• See Variation 1. Use chemicals specified for Variation 2.
VARIATION 3The Effect of Different Concentrations of Phosphate on the
Heart Rate of Daphnia
Note to Teachers: In addition to the information found in the Core Experiment, thefollowing material has been provided for Variation 3.
SYNOPSIS
Students will compare the heart rates of Daphnia exposed to different concentra-tions of phosphate.
ADDITIONAL MATERIALS NEEDEDYou will need the following for each group of three students in a class of 24:
♥ 8.0% solution of phosphate
♥ 4.0% solution of phosphate
♥ 2.0% solution of phosphate
♥ 1.0% solution of phosphate
♥ 10 Daphnia
SAFETY PROCEDURES
See Variation 2.
TEACHER’S NOTES
TEACHING TIPProvide students with syringes orpipettes, several test tubes or smallbeakers, and an 8.0% phosphatesolution. Allow them to prepare theirown dilutions.
♥ Student Research 349Nature’s Early Warning
DIRECTIONS FOR SETTING UP THE EXPERIMENT
• Prepare the 8.0% phosphate solution by dissolving 8.0 g of phosphate (trisodiumphosphate, TSP) in a small amount of culture water and dilute the resulting solu-tion to 100.0 mL.
• A 4.0% solution is made by diluting 50.0 mL of the 8.0% solution with 50.0 mLof culture water.
• A 2.0% solution is made by diluting 50.0 mL of the 4.0% solution with 50.0 mLof culture water.
• A 1.0% solution is made by diluting 50.0 mL of the 2.0% solution with 50.0 mLof culture water.
HYPOTHESIS GENERATION
QuestionWhat is the effect of varying concentrations of phosphate on Daphnia heart rate?
Sample HypothesisThe higher the concentration of phosphate, the greater the decrease in Daphniaheart rate.
RationaleIf some is harmful, more should be even more harmful. A decrease in the heart ratemay signal impending death.
Sample Experimental Procedure1. Repeat the Core Experiment using these 4 concentrations of phosphate and un-
adulterated culture water.2. Expose the Daphnia to various concentrations for 5-minute intervals. At the end
of 5 minutes, take the heart rate as described in the Core Experiment.3. Analyze patterns of change in heart rate.
DATA ANALYSIS AND INTERPRETATION
Sample Data
Table 4. Effect of increasing phosphate concentrations on Daphnia heart rate. Valuesreported are the average rates of 10 animals.
Percent phosphate Exposed Unexposed
1.0 160 184
2.0 227 250
4.0 170 174
8.0 92 153
TEACHER’S NOTES
♥350 Student Research Nature’s Early Warning
VA
RIA
TIO
N 4
1.0 2.0 4.00
50
100
150
200
250
300
350
Daphniaheart rate
(beats/minute)
Percent phosphate
Effect of increasing concentrations of phosphate onDaphnia heart rate
UnexposedExposed
8.0
Graph G. Effect of increasing concentrations of phosphate on Daphnia heart rate.
TEST QUESTION
Over a period of 2 to 3 weeks, an increase in phosphate concentration in a pond orlake initially can cause an increase in water flea population, then a decrease. Theseobservations are independent of any changes in the heart rates, but involve the changesin the lake community. How could you account for the change in water flea popula-tions?
SUGGESTED MODIFICATIONS FOR STUDENTS WHO ARE EXCEPTIONAL
Blind or Visually Impaired• See Variation 1. Use chemicals specified for Variation 3.
VARIATION 4The Effect of Vinegar on the Heart Rate of Daphnia
Note to Teachers: In addition to the information found in the Core Experiment, thefollowing material has been provided for Variation 4.
SYNOPSIS
Students will compare the heart rates of Daphnia before and after exposure to vin-egar.
ADDITIONAL MATERIALS NEEDED
You will need the following for each group of three students in a class of 24:♥ 5.0 mL 2.0% distilled vinegar in culture water♥ 10 to 12 Daphnia
InterpretationThese data show irregular changes inheart rate. The greatest depression(40%) occurs with the highestphosphate concentration, but thenext greatest depression (13%) occursat the lowest concentration. If thesewere the only 2 concentrations tested,one would conclude that these datasupport the hypothesis. Here,however, less depression in the heartrate was found at 2.0% phosphate(9%) and 4.0% phosphate (2%) thanat the extremes tested. Perhaps theother team that collected data did notfollow the same procedure exactly.The 5-minute adjustment periodcould be crucial for obtainingrepeatable results.
Answer to Test QuestionThe initial increase in water fleanumbers could be caused by anincrease in unicellular algae on whichthey feed. The subsequent decreasecould be caused by an increase in thesize and appetite of the fish predatorsof the water fleas. It also could becaused by a decrease in the oxygenconcentration of the water as thealgae die and bacterial decay of theircarcasses reduces the oxygen in thewater.
TEACHING TIPS• Lowering an alkaline pH causes
more oxygen to be released fromsome crustaceans’ hemoglobin.The oxygen is released until acritical value is reached where theeffect is reversed (Wolvekamp &Waterman, 1960).
• Lowering the pH mimics themetabolic effects of increasing thecarbon dioxide concentration. Forsome crustaceans, the result is aninitial increase in respiration ratefollowed by a decrease in respirationrate. For others, an initial decreaseis followed by an initial increase(Wolvekamp & Waterman, 1960).
♥ Student Research 351Nature’s Early Warning
Practice safe handling of acids. Add acid to water rather than water toacid.
Wear goggles and lab apron when working with acids.
Clean all spills immediately.
DIRECTIONS FOR SETTING UP THE EXPERIMENT
Prepare a 10.0% vinegar solution by adding 10.0 mL of distilled vinegar (5.0%acetic acid) to 90.0 mL of culture water.
HYPOTHESIS GENERATION
QuestionWhat is the effect of vinegar on Daphnia heart rate?
Sample HypothesisThe heart rate of Daphnia will decrease if they are exposed to vinegar.
RationaleAcid rain has killed the animals in many lakes. Vinegar is an acid that may have thesame effect as the acids of acid rain.
Sample Experimental Procedure1. Repeat the Core Experiment with the 10.0% vinegar solution and unadulterated
culture water.2. Expose the Daphnia to various concentrations for 5-minute intervals. At the end
of 5 minutes, take the heart rate as described in the Core Experiment.3. Analyze patterns of change in heart rate.
DATA ANALYSIS AND INTERPRETATION
Sample Data
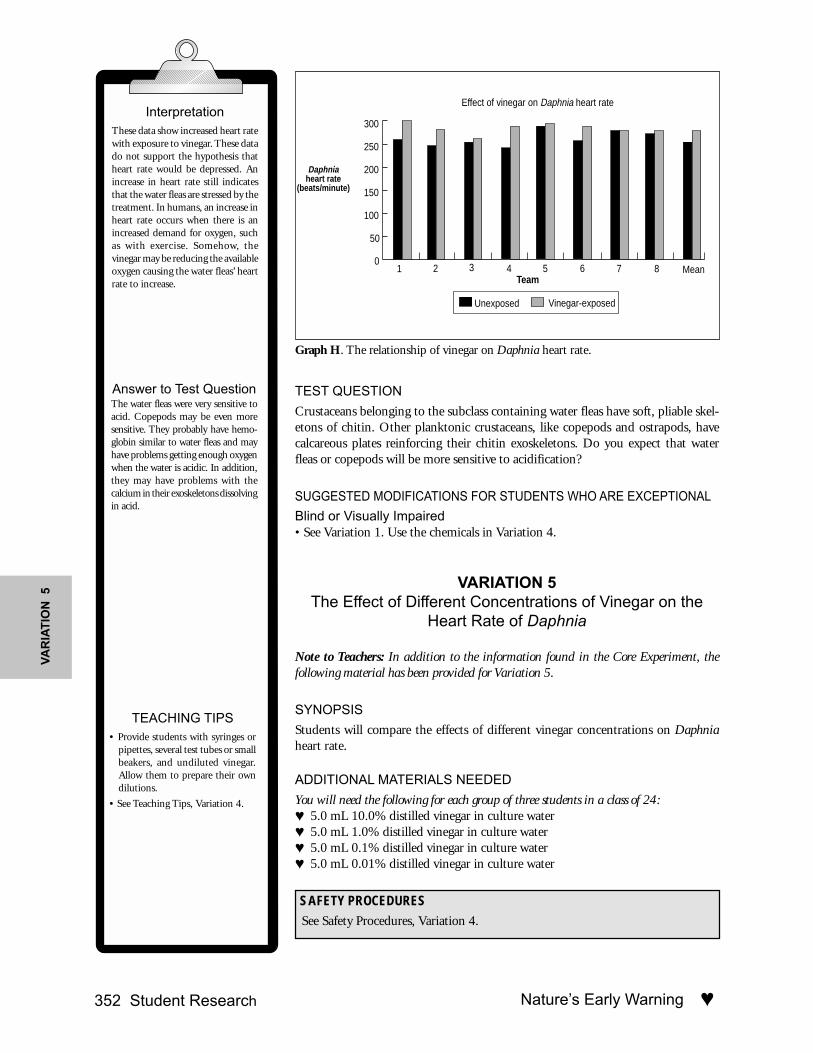
Table 5. Effect of vinegar on Daphnia heart rates.
Student team Unexposed (beats/minute) Vinegar-exposed(beats/minute)
1 262 300
2 248 280
3 256 260
4 240 290
5 290 300
6 262 290
7 280 280
8 278 280
Mean 265 285
TEACHER’S NOTESAcid
Pour
to
Water
SAFETY PROCEDURES
♥352 Student Research Nature’s Early Warning
VA
RIA
TIO
N 5
Daphniaheart rate
(beats/minute)
Team
Effect of vinegar on Daphnia heart rate
Unexposed Vinegar-exposed
0
50
100
150
200
250
300
1 2 3 4 5 6 7 8 Mean
Graph H. The relationship of vinegar on Daphnia heart rate.
TEST QUESTION
Crustaceans belonging to the subclass containing water fleas have soft, pliable skel-etons of chitin. Other planktonic crustaceans, like copepods and ostrapods, havecalcareous plates reinforcing their chitin exoskeletons. Do you expect that waterfleas or copepods will be more sensitive to acidification?
SUGGESTED MODIFICATIONS FOR STUDENTS WHO ARE EXCEPTIONAL
Blind or Visually Impaired• See Variation 1. Use the chemicals in Variation 4.
VARIATION 5The Effect of Different Concentrations of Vinegar on the
Heart Rate of Daphnia
Note to Teachers: In addition to the information found in the Core Experiment, thefollowing material has been provided for Variation 5.
SYNOPSIS
Students will compare the effects of different vinegar concentrations on Daphniaheart rate.
ADDITIONAL MATERIALS NEEDED
You will need the following for each group of three students in a class of 24:♥ 5.0 mL 10.0% distilled vinegar in culture water♥ 5.0 mL 1.0% distilled vinegar in culture water♥ 5.0 mL 0.1% distilled vinegar in culture water♥ 5.0 mL 0.01% distilled vinegar in culture water
SAFETY PROCEDURES
See Safety Procedures, Variation 4.
InterpretationThese data show increased heart ratewith exposure to vinegar. These datado not support the hypothesis thatheart rate would be depressed. Anincrease in heart rate still indicatesthat the water fleas are stressed by thetreatment. In humans, an increase inheart rate occurs when there is anincreased demand for oxygen, suchas with exercise. Somehow, thevinegar may be reducing the availableoxygen causing the water fleas’ heartrate to increase.
Answer to Test QuestionThe water fleas were very sensitive toacid. Copepods may be even moresensitive. They probably have hemo-globin similar to water fleas and mayhave problems getting enough oxygenwhen the water is acidic. In addition,they may have problems with thecalcium in their exoskeletons dissolvingin acid.
TEACHING TIPS• Provide students with syringes or
pipettes, several test tubes or smallbeakers, and undiluted vinegar.Allow them to prepare their owndilutions.
• See Teaching Tips, Variation 4.
♥ Student Research 353Nature’s Early Warning
DIRECTIONS FOR SETTING UP THE EXPERIMENT
• Prepare the 10.0% vinegar solution by adding 10.0 mL of distilled vinegar (5.0%)to 90.0 mL of culture water.
• A 1.0% solution is made by adding 1.0 mL of the 10.0% solution to 9.0 mL ofculture water.
• A 0.1% solution is made by adding 1.0 mL of the 1.0% solution to 9.0 mL ofculture water.
• A 0.01% solution is made by adding 1.0 mL of the 0.1% solution to 9.0 mL ofculture water.
HYPOTHESIS GENERATION
QuestionWhat is the effect of varying concentrations of vinegar on Daphnia heart rate?
Sample HypothesisThe heart rate of Daphnia decreases more with exposure to increasing concentra-tions of vinegar.
RationaleAcid rain has killed the animals in many lakes. Vinegar is an acid that may have thesame effect as the acids of acid rain. In the Core Experiment, the ethanol-stressed,sometimes dying, water fleas had reduced heart rates. Increasing the concentrationof a toxin should increase the stress it creates in an animal.
Sample Experimental Procedure1. Repeat the Core Experiment using these 4 concentrations of vinegar and unadul-
terated culture water.2. Expose the Daphnia to the concentrations for 5-minute intervals. At the end of 5
minutes, take the heart rate as described in the Core Experiment.3. Analyze patterns of change in heart rate.
DATA ANALYSIS AND INTERPRETATION
Sample Data
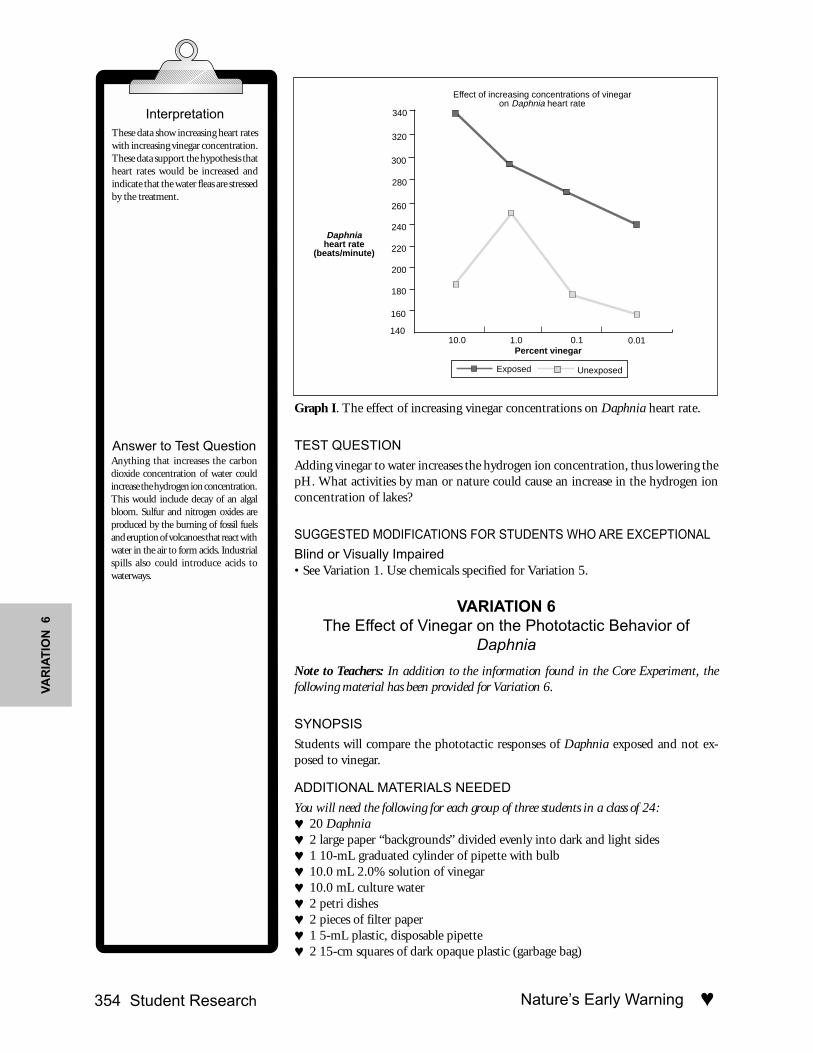
Table 6. Effect of increasing concentrations of vinegar on the Daphnia heart rate.Values reported are the average of rates of 10 animals.
Percent vinegar Exposed Unexposed
10.0 340 184
1.0 288 250
0.1 270 174
0.01 240 153
TEACHER’S NOTES
♥354 Student Research Nature’s Early Warning
VA
RIA
TIO
N 6
Graph I. The effect of increasing vinegar concentrations on Daphnia heart rate.
TEST QUESTION
Adding vinegar to water increases the hydrogen ion concentration, thus lowering thepH. What activities by man or nature could cause an increase in the hydrogen ionconcentration of lakes?
SUGGESTED MODIFICATIONS FOR STUDENTS WHO ARE EXCEPTIONAL
Blind or Visually Impaired• See Variation 1. Use chemicals specified for Variation 5.
VARIATION 6The Effect of Vinegar on the Phototactic Behavior of
Daphnia
Note to Teachers: In addition to the information found in the Core Experiment, thefollowing material has been provided for Variation 6.
SYNOPSIS
Students will compare the phototactic responses of Daphnia exposed and not ex-posed to vinegar.
ADDITIONAL MATERIALS NEEDED
You will need the following for each group of three students in a class of 24:♥ 20 Daphnia♥ 2 large paper “backgrounds” divided evenly into dark and light sides♥ 1 10-mL graduated cylinder of pipette with bulb♥ 10.0 mL 2.0% solution of vinegar♥ 10.0 mL culture water♥ 2 petri dishes♥ 2 pieces of filter paper♥ 1 5-mL plastic, disposable pipette♥ 2 15-cm squares of dark opaque plastic (garbage bag)
InterpretationThese data show increasing heart rateswith increasing vinegar concentration.These data support the hypothesis thatheart rates would be increased andindicate that the water fleas are stressedby the treatment.
Answer to Test QuestionAnything that increases the carbondioxide concentration of water couldincrease the hydrogen ion concentration.This would include decay of an algalbloom. Sulfur and nitrogen oxides areproduced by the burning of fossil fuelsand eruption of volcanoes that react withwater in the air to form acids. Industrialspills also could introduce acids towaterways.
Unexposed
10.0 1.0 0.1 0.01140
160
180
200
220
240
260
Daphniaheart rate
(beats/minute)
Percent vinegar
Effect of increasing concentrations of vinegaron Daphnia heart rate
Exposed
280
300
320
340
♥ Student Research 355Nature’s Early Warning
HYPOTHESIS GENERATION
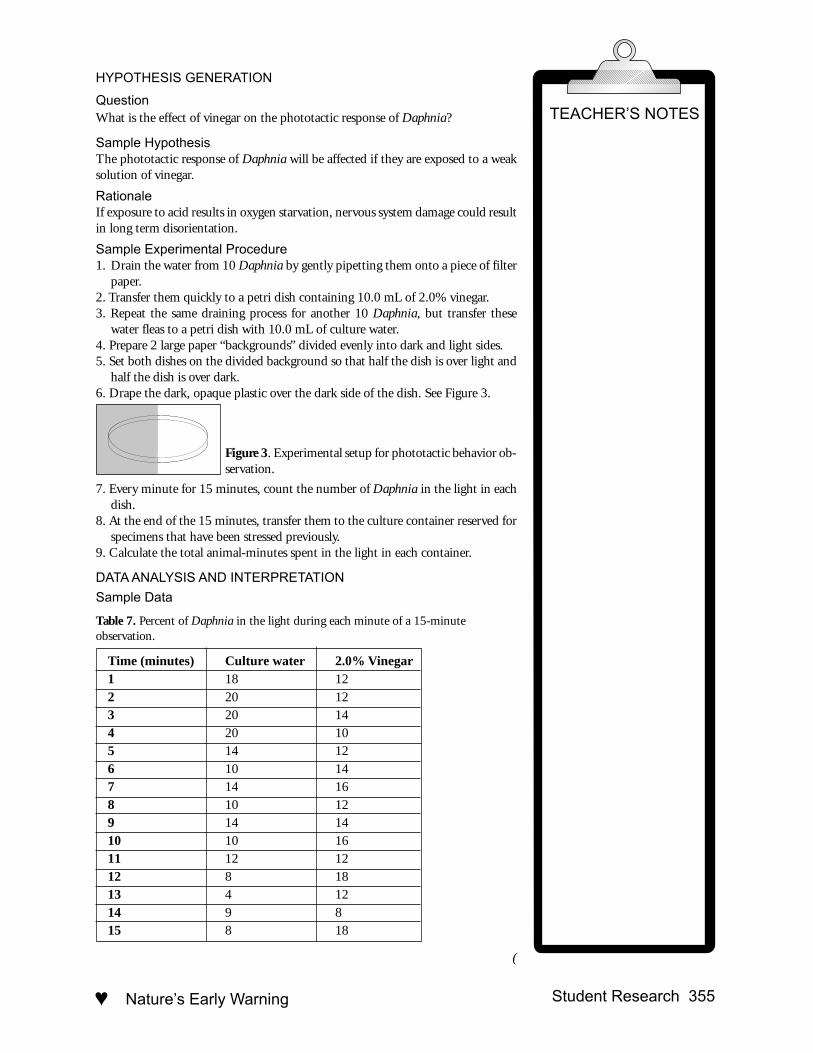
QuestionWhat is the effect of vinegar on the phototactic response of Daphnia?
Sample HypothesisThe phototactic response of Daphnia will be affected if they are exposed to a weaksolution of vinegar.
RationaleIf exposure to acid results in oxygen starvation, nervous system damage could resultin long term disorientation.
Sample Experimental Procedure1. Drain the water from 10 Daphnia by gently pipetting them onto a piece of filter
paper.2. Transfer them quickly to a petri dish containing 10.0 mL of 2.0% vinegar.3. Repeat the same draining process for another 10 Daphnia, but transfer these
water fleas to a petri dish with 10.0 mL of culture water.4. Prepare 2 large paper “backgrounds” divided evenly into dark and light sides.5. Set both dishes on the divided background so that half the dish is over light and
half the dish is over dark.6. Drape the dark, opaque plastic over the dark side of the dish. See Figure 3.
7. Every minute for 15 minutes, count the number of Daphnia in the light in eachdish.
8. At the end of the 15 minutes, transfer them to the culture container reserved forspecimens that have been stressed previously.
9. Calculate the total animal-minutes spent in the light in each container.
DATA ANALYSIS AND INTERPRETATION
Sample Data
Table 7. Percent of Daphnia in the light during each minute of a 15-minuteobservation.
Figure 3. Experimental setup for phototactic behavior ob-servation.
♥356 Student Research Nature’s Early Warning
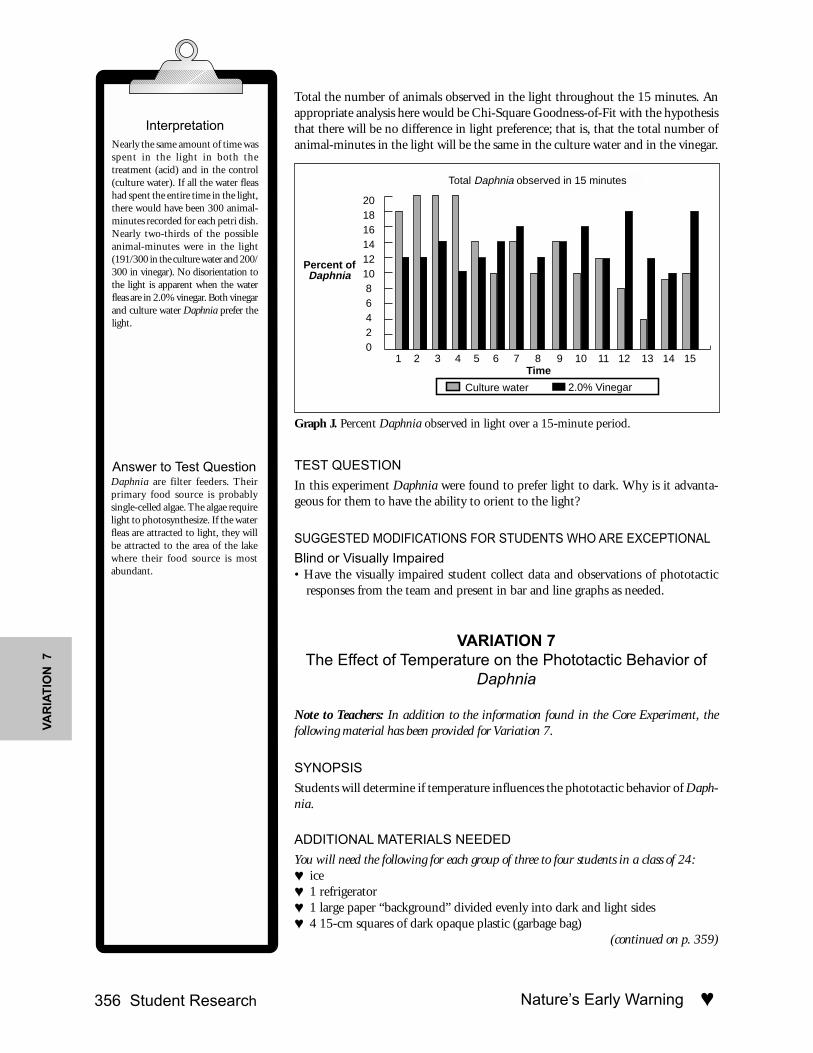
Total the number of animals observed in the light throughout the 15 minutes. Anappropriate analysis here would be Chi-Square Goodness-of-Fit with the hypothesisthat there will be no difference in light preference; that is, that the total number ofanimal-minutes in the light will be the same in the culture water and in the vinegar.
Graph J. Percent Daphnia observed in light over a 15-minute period.
TEST QUESTION
In this experiment Daphnia were found to prefer light to dark. Why is it advanta-geous for them to have the ability to orient to the light?
SUGGESTED MODIFICATIONS FOR STUDENTS WHO ARE EXCEPTIONAL
Blind or Visually Impaired• Have the visually impaired student collect data and observations of phototactic
responses from the team and present in bar and line graphs as needed.
VARIATION 7The Effect of Temperature on the Phototactic Behavior of
Daphnia
Note to Teachers: In addition to the information found in the Core Experiment, thefollowing material has been provided for Variation 7.
SYNOPSIS
Students will determine if temperature influences the phototactic behavior of Daph-nia.
ADDITIONAL MATERIALS NEEDED
You will need the following for each group of three to four students in a class of 24:♥ ice♥ 1 refrigerator♥ 1 large paper “background” divided evenly into dark and light sides♥ 4 15-cm squares of dark opaque plastic (garbage bag)
(continued on p. 359)
InterpretationNearly the same amount of time wasspent in the light in both thetreatment (acid) and in the control(culture water). If all the water fleashad spent the entire time in the light,there would have been 300 animal-minutes recorded for each petri dish.Nearly two-thirds of the possibleanimal-minutes were in the light(191/300 in the culture water and 200/300 in vinegar). No disorientation tothe light is apparent when the waterfleas are in 2.0% vinegar. Both vinegarand culture water Daphnia prefer thelight.
Answer to Test QuestionDaphnia are filter feeders. Theirprimary food source is probablysingle-celled algae. The algae requirelight to photosynthesize. If the waterfleas are attracted to light, they willbe attracted to the area of the lakewhere their food source is mostabundant.
Total of Daphnia observed in 15 minutes
2.0% VinegarCulture water
Percent ofDaphnia
20181614121086420
Time1 2 3 4 5 6 7 8 9 10 11 12 13 14 15
VA
RIA
TIO
N 7
Total Daphnia observed in 15 minutes
♥ Student Research 357Nature’s Early Warning
♥ 10-mL graduated cylinder of pipette with bulb♥ 1 thermometer (°C)♥ 4 petri dishes♥ 40 Daphnia♥ 4 culture dishes larger than the petri dishes to serve as water baths♥ 2 water baths♥ 1 ice bath (optional)♥ 1 bright light source♥ 2 pieces of filter paper
SAFETY PROCEDURES
Use caution when preparing and using the hot water bath.
DIRECTIONS FOR SETTING UP THE EXPERIMENT
• Preheat 100.0 mL of culture water to 25°C and another 100.0 mL to 30°C.Maintain the temperatures with water baths.
• Chill 100.0 mL of culture water in the refrigerator or an ice bath to 5°C andanother 100.0 mL to 15°C.
HYPOTHESIS GENERATION
QuestionWhat is the effect of temperature on the phototactic behavior of Daphnia?
Sample HypothesisWater temperature will affect the phototactic behavior of Daphnia.
RationaleDuring a bright sunny day, Daphnia’s algal food source should be at the surface ofthe water that is slightly warmer than the water below it. Optimal temperature forenzyme activity is fairly narrow. Daphnia should be able to migrate to their optimaltemperature independent of the light intensity.
Sample Experimental Procedure1. Set up 4 petri dishes containing 100.0 mL water each at the following tempera-
tures: 5°C, 15°C, 25°C, and 30°C.2. Maintain the desired temperature in each petri dish by setting it in a larger dish
with water of the same temperature.3. Drain the water from 10 Daphnia by gently pipetting them onto filter paper.
Quickly transfer them to a petri dish with 10.0 mL of water at the desired tem-perature.
4. Repeat the same draining process for another 10 Daphnia, but transfer thesewater fleas to a petri dish with 10.0 mL of water at another desired temperature.Continue this process until dishes of all desired temperatures are prepared.
5. Prepare 1 large plastic or laminated paper “background” divided evenly into darkand light sides to hold the 4 petri dishes.
6. See Sample Experimental Procedure Variation 6. Repeat Steps 6 and 7.7. Return Daphnia to container of previously stressed organisms.8. Calculate the total animal-minutes spent in the light in each container.
TEACHER’S NOTES
♥358 Student Research Nature’s Early Warning
DATA ANALYSIS AND INTERPRETATION
Sample Data
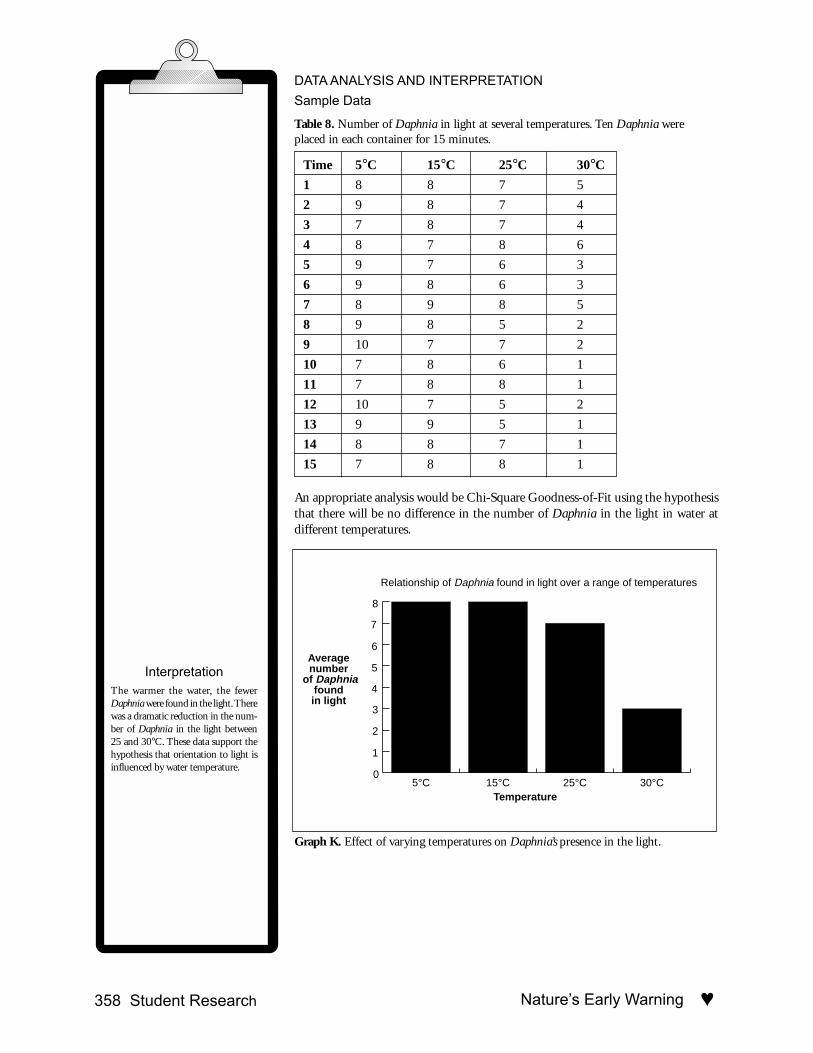
Table 8. Number of Daphnia in light at several temperatures. Ten Daphnia wereplaced in each container for 15 minutes.
Time 5°C 15°C 25°C 30°C
1 8 8 7 5
2 9 8 7 4
3 7 8 7 4
4 8 7 8 6
5 9 7 6 3
6 9 8 6 3
7 8 9 8 5
8 9 8 5 2
9 10 7 7 2
10 7 8 6 1
11 7 8 8 1
12 10 7 5 2
13 9 9 5 1
14 8 8 7 1
15 7 8 8 1
An appropriate analysis would be Chi-Square Goodness-of-Fit using the hypothesisthat there will be no difference in the number of Daphnia in the light in water atdifferent temperatures.
5°C 15°C 25°C 30°C0
1
2
3
4
5
6
7
8
Averagenumber
of Daphniafoundin light
Relationship of Daphnia found in light over a range of temperatures
Temperature
Graph K. Effect of varying temperatures on Daphnia’s presence in the light.
InterpretationThe warmer the water, the fewerDaphnia were found in the light. Therewas a dramatic reduction in the num-ber of Daphnia in the light between25 and 30°C. These data support thehypothesis that orientation to light isinfluenced by water temperature.
♥ Student Research 359Nature’s Early Warning
TEST QUESTION
Compare the student data graphed below with the results of your experiment.
Graph L. Influence of temperature on the phototactic response of Daphnia.
SUGGESTED MODIFICATIONS FOR STUDENTS WHO ARE EXCEPTIONAL
Blind or Visually Impaired• Provide blind students with Talking Thermometers so they can record tempera-
tures of various cultures.
VARIATION 8The Effect of Seltzer Water on the Phototactic Behavior of
Daphnia
Note to Teachers: In addition to the information found in the Core Experiment, thefollowing material has been provided for Variation 8.
SYNOPSIS
Students will compare the phototactic responses of Daphnia exposed to seltzer wa-ter with those of Daphnia not exposed to seltzer water.
ADDITIONAL MATERIALS NEEDED
You will need the following for each group of three students in a class of 24:♥ 1 large paper “background” divided evenly into dark and light sides.♥ 10.0 mL seltzer water♥ 10.0 mL culture water♥ 1 1-mL disposable pipette♥ 20 Daphnia♥ 2 pieces of filter paper♥ 2 petri dishes♥ 2 15-cm squares of dark opaque plastic (garbage bag)♥ 1 10-mL graduated cylinder
Answer to Test QuestionThese students should find a similartrend in their water fleas’ response tolight at different temperatures.
VA
RIA
TIO
N 8
♥360 Student Research Nature’s Early Warning
HYPOTHESIS GENERATION
QuestionWhat is the effect of seltzer water on the phototactic behavior of Daphnia?
Sample HypothesisThe phototactic responses of Daphnia will be affected if they are exposed to seltzerwater.
RationaleStudents should provide their own rationale for the hypothesis.
Sample Experimental Procedure
1. Drain the water from 10 Daphnia by gently pipetting them onto filter paper.Quickly transfer them to a petri dish with 10.0 mL of 10% seltzer water.
2. Repeat the same draining process for another 10 Daphnia, but transfer these wa-ter fleas to a petri dish with 10.0 mL of culture water.
3. Prepare 1 large paper “background” divided evenly into dark and light sides.4. Set both dishes on the divided background so that half the dish is over light and
half the dish is over dark.5. See Sample Experimental Procedure, Variation 6. Repeat Steps 6 to 9 with the
exception of Step 8 where the draining process will remove seltzer water, not acidas described in Variation 6.
DATA ANALYSIS AND INTERPRETATION
Sample Data
Table 9. Number of Daphnia in light when incubated in 10% seltzer water and inculture water. Ten Daphnia were in each container for 15 minutes.
Time 10% Seltzer water Culture water
1 8 8
2 7 8
3 8 8
4 8 7
5 7 7
6 8 8
7 9 9
8 9 8
9 8 7
10 8 8
11 7 8
12 7 7
13 7 9
14 8 8
15 7 8
TEACHER’S NOTES
♥ Student Research 361Nature’s Early Warning
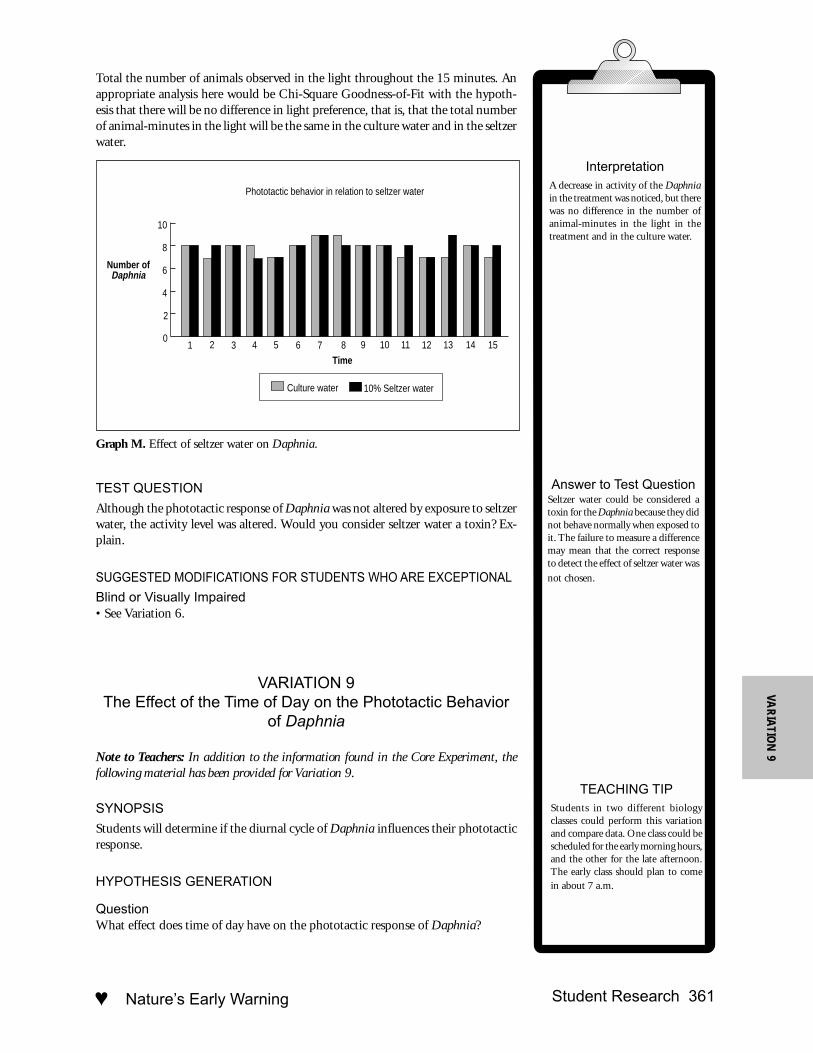
Total the number of animals observed in the light throughout the 15 minutes. Anappropriate analysis here would be Chi-Square Goodness-of-Fit with the hypoth-esis that there will be no difference in light preference, that is, that the total numberof animal-minutes in the light will be the same in the culture water and in the seltzerwater.
Graph M. Effect of seltzer water on Daphnia.
TEST QUESTION
Although the phototactic response of Daphnia was not altered by exposure to seltzerwater, the activity level was altered. Would you consider seltzer water a toxin? Ex-plain.
SUGGESTED MODIFICATIONS FOR STUDENTS WHO ARE EXCEPTIONAL
Blind or Visually Impaired• See Variation 6.
VARIATION 9The Effect of the Time of Day on the Phototactic Behavior
of Daphnia
Note to Teachers: In addition to the information found in the Core Experiment, thefollowing material has been provided for Variation 9.
SYNOPSIS
Students will determine if the diurnal cycle of Daphnia influences their phototacticresponse.
HYPOTHESIS GENERATION
QuestionWhat effect does time of day have on the phototactic response of Daphnia?
InterpretationA decrease in activity of the Daphniain the treatment was noticed, but therewas no difference in the number ofanimal-minutes in the light in thetreatment and in the culture water.
Answer to Test QuestionSeltzer water could be considered atoxin for the Daphnia because they didnot behave normally when exposed toit. The failure to measure a differencemay mean that the correct responseto detect the effect of seltzer water wasnot chosen.
TEACHING TIPStudents in two different biologyclasses could perform this variationand compare data. One class could bescheduled for the early morning hours,and the other for the late afternoon.The early class should plan to comein about 7 a.m.
0
2
4
6
8
10
Number ofDaphnia
Time
Phototactic behavior in relation to seltzer water
1 2 3 4 5 6 7 8
Culture water 10% Seltzer water
9 10 11 12 13 14 15
VA
RIA
TIO
N 9
♥362 Student Research Nature’s Early Warning
Sample HypothesisDaphnia will show a stronger phototactic behavior in the early morning than in thelate afternoon.
RationaleDuring the early morning hours, Daphnia should be following their food source tothe surface. In the heat of the afternoon or in the waning hours of light, they mayretreat from the lighted surface, again following their food source.
Sample Experimental Procedure1. Drain the water from 20 Daphnia by gently pipetting them onto filter paper.
Quickly transfer them to a petri dish with 10.0 mL of culture water.2. Prepare 1 large paper “background” divided evenly into dark and light sides.3. Set the dish on the divided background so that half the dish is over light and half
is over dark.4. Count the number of water fleas in the light in each dish for 15 minutes at 2
different times of the day, such as in the morning and at midday.
DATA ANALYSIS AND INTERPRETATION
Sample Data
Table 10. Number of Daphnia in the light during each minute of a 15-minuteobservation at different times of day. There were 20 Daphnia in each observation dish.
Time (minutes) 7:20 to 7:35 a.m. 12:30 to 12:45 p.m.
1 18 12
2 20 12
3 20 14
4 20 8
5 14 8
6 10 14
7 14 8
8 10 12
9 14 7
10 10 7
11 12 4
12 8 10
13 4 10
14 9 8
15 8 18
TEACHER’S NOTES
♥ Student Research 363Nature’s Early Warning
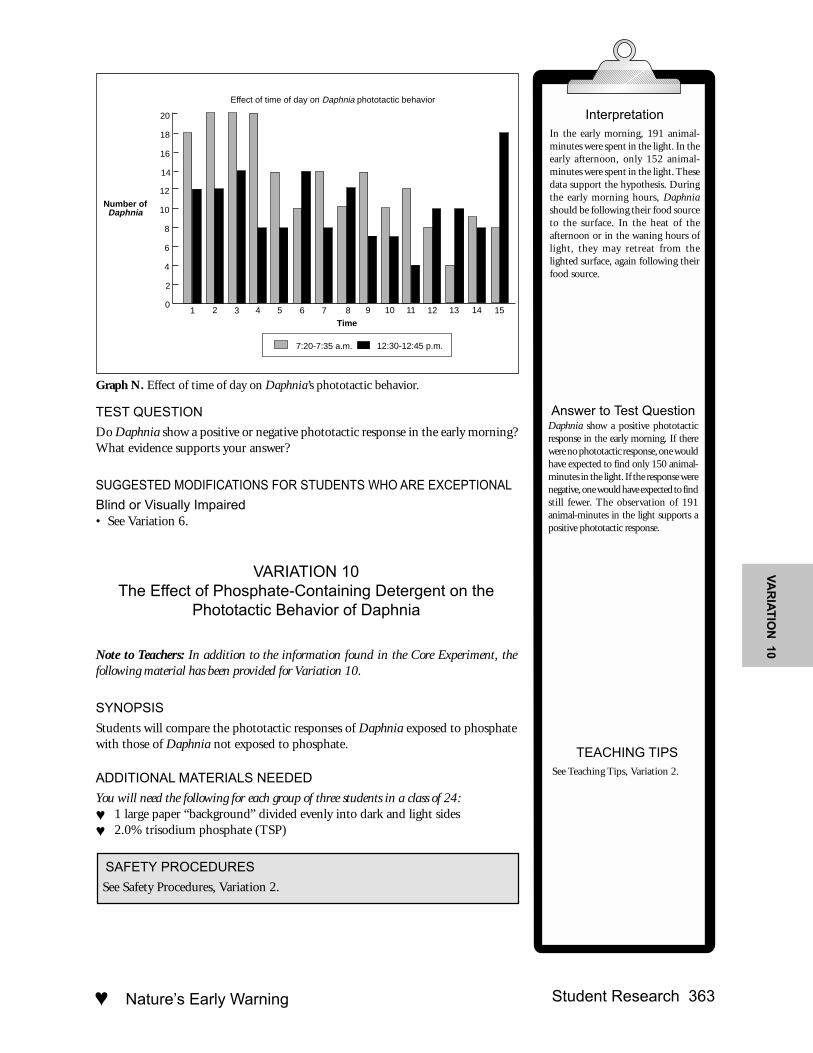
Graph N. Effect of time of day on Daphnia’s phototactic behavior.
TEST QUESTION
Do Daphnia show a positive or negative phototactic response in the early morning?What evidence supports your answer?
SUGGESTED MODIFICATIONS FOR STUDENTS WHO ARE EXCEPTIONAL
Blind or Visually Impaired• See Variation 6.
VARIATION 10The Effect of Phosphate-Containing Detergent on the
Phototactic Behavior of Daphnia
Note to Teachers: In addition to the information found in the Core Experiment, thefollowing material has been provided for Variation 10.
SYNOPSIS
Students will compare the phototactic responses of Daphnia exposed to phosphatewith those of Daphnia not exposed to phosphate.
ADDITIONAL MATERIALS NEEDED
You will need the following for each group of three students in a class of 24:♥ 1 large paper “background” divided evenly into dark and light sides♥ 2.0% trisodium phosphate (TSP)
SAFETY PROCEDURES
See Safety Procedures, Variation 2.
InterpretationIn the early morning, 191 animal-minutes were spent in the light. In theearly afternoon, only 152 animal-minutes were spent in the light. Thesedata support the hypothesis. Duringthe early morning hours, Daphniashould be following their food sourceto the surface. In the heat of theafternoon or in the waning hours oflight, they may retreat from thelighted surface, again following theirfood source.
Answer to Test QuestionDaphnia show a positive phototacticresponse in the early morning. If therewere no phototactic response, one wouldhave expected to find only 150 animal-minutes in the light. If the response werenegative, one would have expected to findstill fewer. The observation of 191animal-minutes in the light supports apositive phototactic response.
TEACHING TIPSSee Teaching Tips, Variation 2.
VA
RIA
TIO
N 10
0
2
4
6
8
10
12
Number ofDaphnia
Time
Effect of time of day on Daphnia phototactic behavior
1 2 3 4 5 6 7 8
7:20-7:35 a.m. 12:30-12:45 p.m.
9 10 11 12 13 14 15
14
16
18
20
♥364 Student Research Nature’s Early Warning
HYPOTHESIS GENERATION
QuestionWhat is the effect of phosphate-containing detergent on the phototactic response ofDaphnia?
Sample HypothesisThe phototactic responses of Daphnia will be affected if they are exposed to phos-phate-containing detergent.
RationalePhosphate is a recognized pollutant. It should be assumed to be harmful to thenormal functioning of an organism.
Sample Experimental Procedure1. Drain the water from 10 Daphnia by gently pipetting them onto filter paper.
Quickly transfer them to a petri dish with 10.0 mL of 2.0% TSP.2. Repeat the same draining process for another 10 Daphnia, but transfer these water
fleas to a petri dish with 10.0 mL of culture water.3. Prepare 1 large paper “background” divided evenly into dark and light sides.4. Set both dishes on the divided background so that half the dish is over light and
half the dish is over dark.5. See Sample Experimental Procedure, Variation 6. Repeat Steps 6 to 9 with the
exception of Step 8 where the draining process will remove TSP, not acid as de-scribed in Variation 6.
DATA ANALYSIS AND INTERPRETATION
Sample Data
Table 11. Number of Daphnia in light when incubated in 2.0% TSP and in culturewater. Ten Daphnia were in each container for 15 minutes.
Time 2.0% TSP Culture water1 9 42 9 4
3 10 7
4 10 55 9 8
6 7 4
7 9 48 7 4
9 8 7
10 2 211 1 7
12 0 4
13 0 414 1 4
15 1 4
An appropriate analysis would be Chi-Square Goodness-of-Fit using the hypothesisthat there will be no difference in the number of Daphnia in the light in differentsolutions.
TEACHER’S NOTES
♥ Student Research 365Nature’s Early Warning
Graph O. The effect of phosphate on the phototactic behavior of Daphnia.
TEST QUESTION
Create graphs to display the following experimental results obtained by two differ-ent researchers.
Table 12a. Number of Daphnia in light when incubated in 2.0% TSP and in culturewater. Ten Daphnia were in each container for 15 minutes.
Time 2.0% TSP Culture water
1 9 8
2 9 7
3 10 8
4 10 9
5 9 7
6 7 7
7 9 7
8 7 7
9 8 8
10 2 8
11 1 7
12 0 6
13 0 8
14 1 8
15 1 8
InterpretationMore animal-minutes in the light wereobserved in the phosphate treatment(83) than in the culture water (72).These data support the hypothesis thatphosphate pollution alters the photo-tactic response of Daphnia.
Answer to Test QuestionGraphs P and Q. Influence of phosphateon phototactic response of Daphnia asfound by two different researchers.
0
2
4
6
8
10
Number ofDaphnia
Time in minutes1 2 3 4 5 6 7 8
2.0% TSP Culture water
9 10 11 12 13 14 15
Number of Daphnia in light when incubated in 2.0% TSP and in culture water
♥366 Student Research Nature’s Early Warning
Table 12b.Time 2.0% TSP Culture water
1 9 4
2 9 4
3 10 7
4 10 5
5 9 8
6 7 4
7 9 4
8 7 4
9 8 7
10 2 2
11 1 7
12 0 4
13 0 4
14 1 4
15 1 4
0
2
4
6
8
10
Number ofDaphnia
Time in minutes
Influence of phosphate on phototactic response ofDaphnia as shown by Researcher A
1 2 3 4 5 6 7 8
2.0%TSP Culture water
9 10 11 12 13 14 15
Graph P. Researcher A’s graphed results.
TEACHER’S NOTES
♥ Student Research 367Nature’s Early Warning
Graph Q. Researcher B’s graphed results.
SUGGESTED MODIFICATIONS FOR STUDENTS WHO ARE EXCEPTIONAL
Blind or Visually Impaired• See Variation 6.
InterpretationThese results are the opposite. Group Pshows a stronger, positive phototacticresponse in TSP than in culture water.Graph Q shows the stronger responsein culture water. It is possible thatResearcher A did the experiment at adifferent time of day or at a differenttemperature. The influence of thesevariables on the response was not tested.
0
2
4
6
8
10
Number ofDaphnia
Time in minutes
Influence of phosphate on phototactic response ofDaphnia as shown by Researcher B
1 2 3 4 5 6 7 8
2.0% TSP Culture water
9 10 11 12 13 14 15
♥368 Student Research Nature’s Early Warning
Antennae
Compound eye
Esophagus
Intestine
Heart
Breathing legs
Brood sac
Abdominal claw
Beak(rostrum)
Figure 1. A species of Daphnia with several internalstructures identified. (Used with permission. Collins, K. &B. (1985). Daphnia — A Handy Guide. The AmericanBiology Teacher, 47(50), 299.
NATURE’S EARLY WARNING SYSTEMS
Directions for StudentsINTRODUCTION
The sun is barely up, and near the shore of a shallow lake there seem to be hundreds of identical little water fleas about 5centimeters long. By early afternoon this bright sunny day, the fleas have nearly all disappeared. Where did they go? Are theyreally fleas? Could they bite you? Are they really all identical, or do you just need to look closer to recognize differencesbetween them? Are they in all shallow lakes and ponds?
Some of these questions are answered easily. For instance, if the small fish have not eaten them and if the lake has notchanged during the day, they are probably resting on the mud at the bottom in the early afternoon. They will be back to thesurface later in the afternoon, as they follow a rhythm set by light reception and their biological clocks. They are not reallyfleas, even though they make a jerky, flea-like movement, and they will not bite you. A good meal for these crustaceans(Daphnia) is single-celled green algae, a few diatoms, and some bacteria. At some times of the year, they really are all alike.Under some conditions, Daphnia produce nearly identical offspring–at least, they’re all daughters!
The last two questions are harder to answer. What accounts for the absence of an animal could be just that it was never there,or that conditions were not right for its survival when it arrived, or that conditions have changed since it arrived. Accordingto wildlife officials, Daphnia are transported easily by birds. We also know that Daphnia are extremely sensitive to sometoxins, such as low concentrations of industrial wastes or run-off from lawn care chemicals. They are more sensitive to mostmaterials that will harm them than are the fish who feast on them. Their sensitivity, small size, and ease of culture makethem excellent subjects for assaying the toxicity of waters be-fore other organisms show any signs of damage. You will ex-plore the effect of a toxic material on the physiology of Daph-nia at levels too low to be lethal. See Figure 1.
OBJECTIVES
At the end of this lab, you should be able to:• Describe possible physiological or behavioral effects of sub-
lethal doses of ethanol on Daphnia.
SAFETY PROCEDURES
Wear goggles and a lab apron when working withchemicals.
Work away from any open flames when usingethanol, especially when wearing gloves.
Wear latex gloves when working with ethanol. Itcan be absorbed through your skin.
Wash your hands after all work is completed.
Do not consume ethanol.
Dispose of broken glassware in appropriatecontainers.
Use KittyLitter to absorb any large spills. Sweepup the KittyLitter after it has absorbed the spilledmaterial.
ALCOHOL
ALCOHOL
Inhaleor
Drink
GlassOnly
✴�✵��
♥ Student Research 369Nature’s Early Warning
MATERIALS NEEDED
You will need the following for each group of three students in a class of 24:♥ 10 Daphnia♥ 1 culture dish♥ 1 50-mL jar or beaker♥ 1 wide-bore pipette♥ 2 1-mL plastic, disposable pipettes♥ 1 compound microscope♥ 1 depression slide and cover slip♥ 1 lab journal♥ 1 pencil♥ 1 clock with second hand or a stopwatch♥ 1 calculator♥ several paper towels or filter paper♥ 2 pairs of latex gloves (optional)♥ 25.0 mL of 2.0% ethanol solution
STUDENT LITERATURE SEARCH SUMMARY WITH REFERENCES
Do a literature search on the topic of chemical toxicity and Daphnia. Summarize your findings and cite your references.Your teacher may be able to suggest some references.
HYPOTHESIS GENERATION
From the information you have on this topic, develop a hypothesis that could be tested in a controlled experiment thatgathers quantitative data. Explain the reasoning behind your hypothesis. Answer the following questions:1. What is the question you are investigating?2. What makes this question an interesting or important topic for investigation?3. What is the variable in your experiment?4. What other variables will you need to control?5. Why is controlling variables important?
PLAN OF INVESTIGATION
Make a numbered list of the steps you will use to investigate your topic. Answer the following questions:1. How many samples have you included?2. What will you measure?3. How can you show your results in a graph?
Design an experiment to test your hypothesis. Be sure that you include an experimental control and enough replicates toprovide reliable data. Consider how you will analyze and present your results. Write the procedures you will follow.
QUESTIONS AND ANALYSIS
Once you have collected and analyzed your data and graphed your results, answer the following questions:1. Combine your results with those of all your classmates. Construct a graph showing the heart rates of Daphnia exposed to
ethanol and not exposed to ethanol.2. Do these data support or refute your hypothesis? Explain.3. If half of the ethanol-treated animals had depressed heart rates and the other half did not, would you accept or reject your
hypothesis? Explain.4. Suppose all of the animals showed a 20% depression in heart rates when exposed to ethanol, while those tested from
another lake by students across town showed a 10% depression. How could you explain the difference?5. Propose a test of your explanation to the question above.
You must have your teacher approve this protocol before you begin this experiment.
♥370 Student Research Nature’s Early Warning
DESIGN AND VARIATIONS OF THE CORE EXPERIMENT
After collecting and analyzing these data from the Core Experiment and sharing the results and conclusions with the class,brainstorm ideas for experiments you could do next. Think of questions that occurred to you as you conducted the CoreExperiment on Daphnia and their role as environmental indicators. What quantifiable experiments could be done basedon the observations you made? Questions other students have studied include the following:• What is the effect of ethanol on Daphnia heart rates?• What is the effect of varying concentrations of ethanol on Daphnia heart rates?• What is the effect of phosphate on Daphnia heart rates?• What is the effect of varying concentrations of phosphate on Daphnia heart rates?• What is the effect of vinegar on Daphnia heart rates?• What is the effect of varying concentrations of vinegar on Daphnia heart rates?• What is the effect of vinegar on the phototactic response of Daphnia?• What is the effect of temperature on the phototactic behavior of Daphnia?• What is the effect of seltzer water on the phototactic behavior of Daphnia?• What is the effect of phosphate-containing detergent on the phototactic response of Daphnia?