+ All Categories
Home > Documents > NAVAL POSTGRADUATE SCHOOL - Defense Technical … · C. COMBINED SF-153 INVENTORY ... COMFISCS...

NAVAL POSTGRADUATE SCHOOL - Defense Technical … · C. COMBINED SF-153 INVENTORY ... COMFISCS...

Date post: 30-Apr-2018
Category:
Upload: nguyendat
View: 225 times
Download: 3 times
Share this document with a friend
60
NAVAL POSTGRADUATE SCHOOL MONTEREY, CALIFORNIA JOINT APPLIED PROJECT The Implementation of Unique Item Identification for the Navy’s Communications Security Equipment By: Jeremie Calimlim, Kelly Cooney, and Diane Phan March 2010 Advisor: Geraldo Ferrer Approved for public release; distribution is unlimited
Transcript

NAVAL POSTGRADUATE

SCHOOL

MONTEREY, CALIFORNIA

JOINT APPLIED PROJECT

The Implementation of Unique Item Identification for the Navy’s

Communications Security Equipment

By: Jeremie Calimlim, Kelly Cooney, and Diane Phan

March 2010

Advisor: Geraldo Ferrer

Approved for public release; distribution is unlimited

i

REPORT DOCUMENTATION PAGE Form Approved OMB No. 0704-0188 Public reporting burden for this collection of information is estimated to average 1 hour per response, including the time for reviewing instruction, searching existing data sources, gathering and maintaining the data needed, and completing and reviewing the collection of information. Send comments regarding this burden estimate or any other aspect of this collection of information, including suggestions for reducing this burden, to Washington headquarters Services, Directorate for Information Operations and Reports, 1215 Jefferson Davis Highway, Suite 1204, Arlington, VA 22202-4302, and to the Office of Management and Budget, Paperwork Reduction Project (0704-0188) Washington DC 20503.

1. AGENCY U.S.E ONLY (Leave blank)

2. REPORT DATE March 2010

3. REPORT TYPE AND DATES COVERED Joint Applied Project

4. TITLE AND SUBTITLE: The Implementation of Unique Item Identification for the Navy’s Communications Security Equipment

6. AUTHOR(S) Calimlim, J., Cooney, K., and Phan, D.

5. FUNDING NUMBERS

7. PERFORMING ORGANIZATION NAME(S) AND ADDRESS(ES) Naval Postgraduate School Monterey, CA 93943-5000

8. PERFORMING ORGANIZATION REPORT NUMBER

9. SPONSORING /MONITORING AGENCY NAME(S) AND ADDRESS(ES) N/A

10. SPONSORING/MONITORING AGENCY REPORT NUMBER

11. SUPPLEMENTARY NOTES The views expressed in this thesis are those of the author and do not reflect the official policy or position of the Department of Defense or the U.S. Government. IRB Protocol number ________________.

12a. DISTRIBUTION / AVAILABILITY STATEMENT Approved for public release; distribution is unlimited

12b. DISTRIBUTION CODE

13. ABSTRACT (maximum 200 words)

The purpose of this project is to conduct an analysis of Unique Item Identification implementation for the Navy’s Communications Security equipment. This project will review the existing inventory process and system. The team will utilize previous papers from Naval Postgraduate School to assist in the evaluation of Return on Investment and the Knowledge Value Added analysis of the implementation.

15. NUMBER OF PAGES

61

14. SUBJECT TERMS Unique Item Identification, UID, Communications Security, COMSEC

16. PRICE CODE

17. SECURITY CLASSIFICATION OF REPORT

Unclassified

18. SECURITY CLASSIFICATION OF THIS PAGE

Unclassified

19. SECURITY CLASSIFICATION OF ABSTRACT

Unclassified

20. LIMITATION OF ABSTRACT

UU

NSN 7540-01-280-5500 Standard Form 298 (Rev. 2-89) Prescribed by ANSI Std. 239-18

ii

THIS PAGE INTENTIONALLY LEFT BLANK

iii

Approved for public release; distribution is unlimited

THE IMPLEMENTATION OF UNIQUE ITEM IDENTIFICATION FOR THE NAVY’S COMMUNICATIONS SECURITY EQUIPMENT

Jeremie Calimlim, civilian, United States Navy Kelly Cooney, civilian, United States Navy Diane Phan, civilian, United States Navy

Submitted in partial fulfillment of the requirements for the degree of

MASTER OF SCIENCE IN PROGRAM MANAGEMENT

from the

NAVAL POSTGRADUATE SCHOOL March 2010

Authors: _____________________________________

Jeremie Calimlim _____________________________________

Kelly Cooney _____________________________________

Diane Phan Approved by: _____________________________________ Geraldo Ferrer, Lead Advisor _____________________________________ William R. Gates, Dean

Graduate School of Business and Public Policy

iv

THIS PAGE INTENTIONALLY LEFT BLANK

v

THE IMPLEMENTATION OF UNIQUE ITEM IDENTIFICATION FOR THE NAVY’S COMMUNICATIONS SECURITY EQUIPMENT

ABSTRACT

The purpose of this project is to conduct an analysis of Unique Item Identification

implementation for the Navy’s Communications Security equipment. This project will

review the existing inventory process and system. The team will utilize previous papers

from Naval Postgraduate School to assist in the evaluation of Return on Investment and

the Knowledge Value Added analysis of the implementation.

vi

THIS PAGE INTENTIONALLY LEFT BLANK

vii

TABLE OF CONTENTS

I. INTRODUCTION..................................................................................................1

II. ITEM UNIQUE IDENTIFICATION POLICIES...............................................3 A. POLICIES ..................................................................................................3 B. IUID LIFE CYCLE ...................................................................................6 C. WHAT ITEMS NEED UNIQUE IDENTIFICATION?.........................8 D. ITEM UNIQUE IDENTIFIER MARK ...................................................9 E. UII READER............................................................................................10 F. IUID REGISTRY.....................................................................................10 G. SUMMARY ..............................................................................................11

III. ORGANIZATIONS AND SYSTEM..................................................................13 A. NATIONAL SECURITY AGENCY (NSA) ..........................................13 B. CHIEF OF NAVAL OPERATIONS (CNO) .........................................13 C. COMMANDER, NAVAL NETWORK WARFARE COMMAND

(COMNAVNETWARCOM)...................................................................14 D. NAVAL COMMUNICATIONS SECURITY MATERIAL SYSTEM

(NCMS) .....................................................................................................14 E. COMSEC MATERIAL ISSUING OFFICE (CMIO) ..........................16 F. UNITED STATES NATIONAL DISTRIBUTION AUTHORITY

(U.S. NDA) ................................................................................................16 G. CONTROLLING AUTHORITY (CONAUTH) ...................................16 H. ELECTRONIC KEY MANAGEMENT SYSTEM (EKMS)...............16

IV. CURRENT NAVY INVENTORY PROCESS ..................................................19 A. SEMI-ANNUAL INVENTORY REPORT (SAIR)...............................19 B. CHANGE OF CUSTODIAN INVENTORY REPORT (CCIR) .........20 C. COMBINED SF-153 INVENTORY.......................................................20 D. WHO MAY INVENTORY COMSEC MATERIAL............................21 E. HOW TO INVENTORY COMSEC MATERIAL ...............................21 F. YEARLY COST OF PERFORMING INVENTORY AT CRYPTO

REPAIR FACILITIES ............................................................................23

V. RETURN ON INVESTMENT OF UID IMPLEMENTATION AT THE CRYPTO REPAIR FACILITIES ......................................................................25 A. INTRODUCTION....................................................................................25 B. THE KVA VALUATION FRAMEWORK AND OVERVIEW..........26 C. KVA METHODOLOGY.........................................................................27 D. QUANTIFICATION OF KVA VALUE AND COST DATA ..............30 E. ANALYSIS OF WORKFLOW PROCESSES WITH KVA................34

1. “As Is” Inventory Process Analysis............................................34 2. “To Be” Inventory Process Analysis ..........................................36

VI. SUMMARY AND RECOMMENDATIONS.....................................................39 A. SUMMARY ..............................................................................................39

viii

B. RECOMMENDATIONS.........................................................................40

LIST OF REFERENCES................................................................................................41

INITIAL DISTRIBUTION LIST ...................................................................................43

ix

LIST OF FIGURES

Figure 1. IUID Life Cycle (From Leibrandt, 2009) ....................................................7 Figure 2. IUID Decision Tree (DFARS 211.274-2) (From Leibrant, 2009)...............9 Figure 3. 2D Data Matrix Symbol.............................................................................10 Figure 4. EKMS Overview Diagram (From McCardle, 2006) .................................18 Figure 5. Measuring Output (From Housel et al., 2006)...........................................28

x

THIS PAGE INTENTIONALLY LEFT BLANK

xi

LIST OF TABLES

Table 1. Significant Item Unique Identification Policy Memoranda.........................4 Table 2. IUID Labels Cost Comparison.....................................................................6 Table 3. IUID and RFID Technology Comparison....................................................7 Table 4. Fixed-Cycle (FC) Inventory Schedule .......................................................20 Table 5. CT1 Inventory Flow Summary (From Henry, 2008).................................23 Table 6. Yearly Inventory Processing Cost .............................................................24 Table 7. NPS Valuation Framework ........................................................................27 Table 8. Comparison of Traditional Accounting versus Process Based Costing

(From Housel et al., 2006) .........................................................................30 Table 9. CRF “As Is” and “To Be” Inventory Subprocesses. The Improved or

Eliminated Subprocesses are Indicated in Bold Italics. .............................33 Table 10. “As Is” Inventory Process Analysis...........................................................35 Table 11. “To Be” Inventory Process Analysis .........................................................37

xii

THIS PAGE INTENTIONALLY LEFT BLANK

xiii

LIST OF ACRONYMS AND ABBREVIATIONS

A&A Advice and Assistance

AIS Automated Information System

AIT Automatic Identification Technology

AL Accounting Legend

CCIR Change of Custodian Inventory Report

CMIO COMSEC Material Issuing Office

CNO Chief of Naval Operations

CO Commanding Officer

COI Course of Instruction

COMFISCS Commander Fleet & Industrial Supply Center

COMNAVNETWARCOM Commander, Naval Network Warfare Command

COMSEC Communications Security

CONAUTH Controlling Authority

COR Central Office of Record

CRF Crypto Repair Facilities

CY Calendar Year

DFARS Defense Federal Acquisition Regulation Supplement

DoD Department of Defense

DON Department of the Navy

DTD Data Transfer Device

EKMS Electronic Key Management System

FOC Final Operational Capability

GAO General Accounting Office

GFP Government Furnished Property

ICP Inventory Control Point

IRST Inventory Reconciliation Status Transaction

IUID Item Unique Identification

KMI Key Management Infrastructure

xiv

KP Key Processor

KVA Knowledge Value Added

LCMS Local COMSEC Management Software

LE Local Element

LMD Local Management Device

MCPC Market Comparable Process Cost

MCR Market Comparable Revenue

NCMS Naval Communications Security Material System

NSA National Security Agency

PfM Portfolio Management

PIPC Property in the Possession of Contractors

PMHS Physical Material Handling Segment

POC Point of Contact

RA Registration Authority

RFI Ready for Issue

RFID Radio Frequency Identification

RIT Request for Inventory Transaction

ROB Reserve on Board

ROI Return on Investment

ROKA Return on Knowledge Assets

ROKI Return on Knowledge Investments

SAIR Semi-Annual Inventory Report

SERVAUTH Service Authority

UID Unique Item Identification

UII Unique Item Identifier

U.S.NDA United States National Distribution Authority

VDLS Vault Distribution Logistics System

xv

ACKNOWLEDGMENTS

The authors would like to thank all the individuals that have contributed to the

completion of this project. Specifically, we would like to thank Mr. Clifford Henry, Mr.

Rodney Quibilan, Mr. Roger Lebel, Mr. James Kral, Mr. Francisco Canez, and Mr.

Orville Ayers for providing us with an understanding of how communications security

equipment are tracked within the Department of the Navy. To all those individuals both

named and unnamed, we would like to say thanks for all that you have done.

Jeremie Calimlim, Kelly Cooney, and Diane Phan

xvi

THIS PAGE INTENTIONALLY LEFT BLANK

1

I. INTRODUCTION

The Department of Defense (DoD) considers implementation of Item Unique

Identification (IUID) a strategic requirement. This effort is to efficiently move supplies

among U.S. and coalition troops. IUID implementation will allow the DoD to improve

logistics transactions, consistently control the items purchased, capture their value, and

provide property, inventory and financial accountability. Per DoD 4140.1R, IUID,

implementation has the potential to provide increased systems operational availability,

lowered asset management and infrastructure costs, and yield enhanced visibility to in-

transit shipping processes.

This thesis leverages existing studies, teleconferences, DoD policy and mandates,

and analysis to determine if the implementation of IUID will yield a Return on

Investment (ROI) and value added to an existing automated management system of

Communications Security (COMSEC) assets in the Department of the Navy (DON).

Existing studies include reports, magazine articles, and papers from the Naval

Postgraduate School, which were used to gain insight into IUID technologies and

implementation.

Several interviews were conducted to gain a better understanding of COMSEC

inventory management procedures and to gather information on the implementation of

IUID in the Navy. Interviews were conducted with Ms. Jane Zimmerman, Logistics

Automation Manager, from the Commander Fleet & Industrial Supply Center

(COMFISCS); Mr. Clifford Henry, Operations Department Head from the Naval

Communications Security Material System (NCMS); Mr. Frank Canez; and Mr. Orville

Ayers from the San Diego, CA, and Norfolk, VA, Crypto Repair Facilities (CRFs).

Additional information was requested from Space and Naval Warfare Systems Center

Atlantic (SSC LANT) for the IUID demonstration project for cryptographic equipment

within the DON.

The goal of this thesis is to analyze the ROI and value added of IUID

implementation to an existing automated management system of COMSEC devices that

2

support key organizations within the DON and other services. The first objective is to

examine the involvement, progress and procedures of organizations that are supporting

the DON cryptographic management processes. The second objective is to explore the

feasibility of implementing IUID technologies into the current crypto management

system. Practicability and compatibility will be determined by examining the existing

organizations, current business processes, and information technology systems. The final

objective is to provide recommendations for implementation of these technologies in the

Electronic Key Management System (EKMS), and to determine the need and way ahead

for IUID.

The thesis is divided into chapters that explore the achievability of implementing

IUID technologies and their application within the DON cryptographic inventory system.

Chapter II discusses the Item Unique Identification policies. Chapter III reviews the

organizations, operations, and procedures of the current cryptographic equipment

distribution and accountability process. Chapter IV is the analysis of the current process.

Chapter V provides an analysis of the ROI of IUID implementation. Finally, Chapter VI

concludes with recommendations on the way ahead for IUID implementation as it

pertains to COMSEC equipment management.

3

II. ITEM UNIQUE IDENTIFICATION POLICIES

A. POLICIES

The focus of this project is to examine the personal property component of

Unique Item Identification (UID) and is referred to as Item Unique Identification (IUID).

The enactment of DoD IUID initiatives was in response to the General Accounting

Office’s (GAO) criticism of the DoD’s ability to control property, plant and equipment,

while claiming DoD non-compliance with financial reform legislation (GAO-02-447G,

2003). In order to address the GAO’s criticism, the DoD initiated a business

transformation process that includes IUID implementation. The Office of the

Undersecretary of Defense for Acquisition, Technology, and Logistics mandated the use

of UID for all solicitations on or after January 1, 2004, for equipment, major

modifications, and spares under the “Policy for Unique Identification of Tangible Items

New Equipment, Major Modifications, and Reprocurements of Equipment and Spares.”

This mandate was an initial step toward uniquely identifying all DoD assets that meet

certain cost and management criteria. Additional steps toward this goal include uniquely

identifying DoD-manufactured items, as well as those assets currently in service. The

objective is to provide accountability and valuation of property, and provide tools to

manage historical data, status of personnel and equipment, and inter-organizational

relationships. The Navy is in the process of reviewing these policies and working with

the National Security Agency (NSA) to determine whether COMSEC equipment will

need to comply with these guidelines.

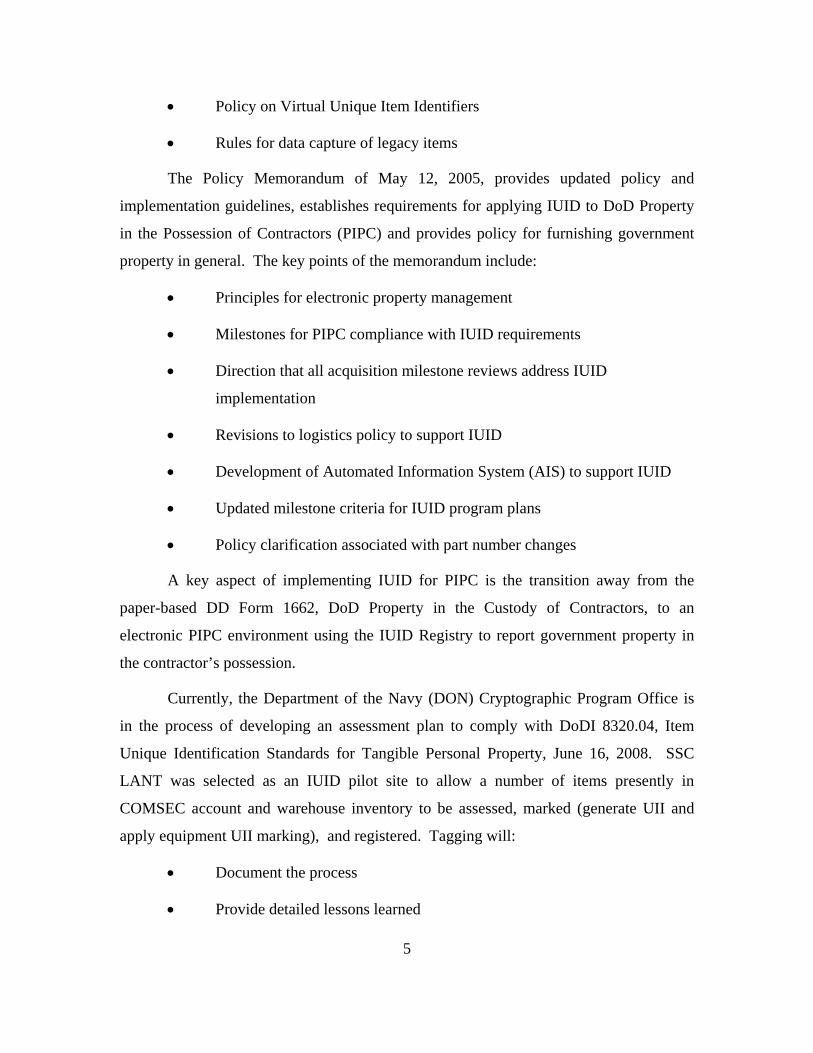
IUID Implementation Announcement Policy for Unique Identification (UID) of Tangible Items – New Equipment, Major Modifications, and Reprocurements of Equipment and Spares

U.S. D (AT&L) Memo of July 29, 2003

Contract Pricing and Cost Accounting – Compliance with DFARS 252.211-7003, “Item Identification and Valuation”

U.S. D (AT&L) Memo of July 9, 2004

Policy for Unique Identification (UID) of tangible personal property legacy items in inventory and operational use including Government Furnished Property (GFP)

U.S. D (AT&L) Memo of December 23, 2004

Policy update for Item Unique Identification (IUID) of tangible personal property including government property in the possession of contractors

U.S. D (AT&L) Memo of May 12, 2005

Item Unique Identification (IUID) Standards for Tangible Personal Property

U.S. D (AT&L) Instruction of June 16, 2008

Table 1. Significant Item Unique Identification Policy Memoranda

The Policy Memorandum of July 9, 2004, provides guidance for DoD contracting

personnel in the pricing and accounting associated with implementing the DFARS clause

252.211-7003. This policy memorandum states that when new procurements are planned

containing items meeting the IUID guidance for marking, DFARS Clause 252.211-7003

must be included in the contract. In addition, the contract must list the items requiring an

IUID.

The Policy Memorandum of December 23, 2004, defines step-by-step procedures

for IUID management, milestones, procedures, and processes of legacy items in

inventory and operational use as well as government furnished property. The key points

of the memorandum include:

Planning guidelines for IUID implementation

Guidance for preparation of Program Plans

Establishment of Depot capabilities for management of IUID

Identification of IUID International standards

IUID Quality Assurance Standards

Policy on IUID data for embedded items

4

5

Policy on Virtual Unique Item Identifiers

Rules for data capture of legacy items

The Policy Memorandum of May 12, 2005, provides updated policy and

implementation guidelines, establishes requirements for applying IUID to DoD Property

in the Possession of Contractors (PIPC) and provides policy for furnishing government

property in general. The key points of the memorandum include:

Principles for electronic property management

Milestones for PIPC compliance with IUID requirements

Direction that all acquisition milestone reviews address IUID

implementation

Revisions to logistics policy to support IUID

Development of Automated Information System (AIS) to support IUID

Updated milestone criteria for IUID program plans

Policy clarification associated with part number changes

A key aspect of implementing IUID for PIPC is the transition away from the

paper-based DD Form 1662, DoD Property in the Custody of Contractors, to an

electronic PIPC environment using the IUID Registry to report government property in

the contractor’s possession.

Currently, the Department of the Navy (DON) Cryptographic Program Office is

in the process of developing an assessment plan to comply with DoDI 8320.04, Item

Unique Identification Standards for Tangible Personal Property, June 16, 2008. SSC

LANT was selected as an IUID pilot site to allow a number of items presently in

COMSEC account and warehouse inventory to be assessed, marked (generate UII and

apply equipment UII marking), and registered. Tagging will:

Document the process

Provide detailed lessons learned

Develop metrics

Identify/resolve IUID issues

ITEM SSC-LANT (CAEI) SSC-PAC (NIEF) w/Govt Fee Army Air Force (WPAFB) Contractor (Camcode)

Number of Labels 81 81 81 81 81

Registration YES YES YES YES YES

Projected Turnaround Time 2 Weeks 7 Weeks 5 Days 5 Days/15 Days 12-15 Work Days

Drawing Included YES YES YES YES YES

Qty Discount N/A YES >1,000 (30% discount) NO NO YES (based on Qty)

Material Cost $167.06 $360.00 $167.06 $282.69 Included in cost per unit fee

Labor Cost $2,322.23 $1,440.00 $1,440.00 $1,440.00 Included in cost per unit fee

ODC $483.80 $200.00 $100.00 $100.00 $100.00

Svc Center Fee $128.83 $169.00 $75.00 $75.00 $75.00

Other Fees $247.75 $4,449.00 $0.00 $20.00 $1,200.00

Actual Cost per Unit $41.35 $81.70 $22.00 $23.68 $24.83

Total Cost $3,349.67 $6,618.00 $1,782.06 $1,917.69 $2,010.85

Table 2. IUID Labels Cost Comparison

SSC LANT solicited cost proposals from five sources to make eighty-one IUID

labels. Table 2 summarized the responses from the sources. The Army was the least

costly, with the unit price of $22 per label without quantity discount. If the Navy

proceeds with tagging all 440,000 items currently in inventory, it would cost $9.7 million

just for labels. This cost does not include sending teams to Local Elements to locate the

equipment and tag the items, nor does the cost include developing an IUID application

interface to the existing EKMS application.

B. IUID LIFE CYCLE

IUID enables traceability of the item throughout its life within the DoD inventory

and maintenance systems. Figure 1 illustrates the IUID life cycle and business rules at

each phase.

6

Figure 1. IUID Life Cycle (From Leibrandt, 2009)

Table 3 compares IUID with the Radio Frequency Identification (RFID)

initiatives. They are separate but integrated initiatives using different technologies and

different business rules.

IUID RFID

Mark Item Package

Technology 2D Data Matrix UHF RF w/EPC encoding

Purpose Life cycle visibility Supply chain visibility

Threshold Value > $5000 + Ship To DDC; Class of Supply

Implementation 1 Jan 04 1 Jan 05

Data Submission WAWF ASN + WAWF ASN

Table 3. IUID and RFID Technology Comparison

7

8

C. WHAT ITEMS NEED UNIQUE IDENTIFICATION?

All solicitations, contracts or delivery orders for tangible items delivered to the

government will require item unique identification or a DoD recognized unique

identification equivalent, if:

All delivered items for which the government’s unit acquisition cost is

$5,000 or more

Items for which the government’s unit acquisition cost is less than $5,000,

when identified by the requiring activity as serially managed, mission

essential, or controlled inventory

Items for which the government’s unit acquisition cost is less than $5,000,

then the requiring activity determines if permanent identification is

required

Regardless of value:

Any DoD serially managed sub-assembly, component, or part

embedded within a delivered item, and

The parent item [as defined in 252.211-7003(a)] contains the

embedded subassembly, component, or part.

Figure 2 provides a decision tree defining the business rules for determining what

items should be uniquely identified. The DoD requiring activity issuing the solicitation is

responsible for identifying items for IUID when they are under the $5,000 threshold or

are embedded items.

Figure 2. IUID Decision Tree (DFARS 211.274-2) (From Leibrant, 2009)

D. ITEM UNIQUE IDENTIFIER MARK

The Unique Item Identifier (UII) identifies an item with a set of data that is

globally unique and unambiguous. The symbology used for the mark on an item is a two-

dimensional (2D) Data Matrix symbol with Error Correction Code 200 (See Figure 3).

The UII is encoded into a Data Matrix symbol with a software package.

9

Figure 3. 2D Data Matrix Symbol

Data Matrix symbols have a checkerboard appearance, with each uniformly

spaced square shaped cell corresponding to a data bit. They are constructed of a mosaic

of light and dark elements that must all be read before any characters can be recognized.

Matrix symbols are encoded with a binary code requiring an imager to read them. A Data

Matrix can store from 1 to about 2,000 characters. The symbol is square or rectangular

and can range from 0.001 inch per side up to 14 inches per side (Leibrandt, 2009).

E. UII READER

The data matrix symbol requires a 2D imager; they cannot be read using an

ordinary linear barcode laser scanner. Automatic Identification Technology (AIT) is the

basic building block in the DoD’s efforts to provide timely asset visibility. AIT gives the

DoD the capability to electronically capture information about items as they move

through the operational environment, providing both reliable and accurate data capture

and transmission throughout the item life cycle.

The AIT reader will accurately and reliably machine read the data elements and

output a UII. The data will be transmitted to a DoD automated information system. The

data can then be used as a primary or alternate key across DoD databases (Leibrandt,

2009).

F. IUID REGISTRY

The IUID Registry is the ultimate repository where all IUID data will be captured.

The IUID Registry will serve as an acquisition gateway to:

Identify what the item is

Identify who receives the item originally

10

11

Identify the initial value of the item

Identify the contract and organization the item is acquired from

Intersect with other systems (e.g., property management, logistics, and

inventory management) (Leibrandt, 2009).

The National Security Agency (NSA) has a concern with the registration of

COMSEC data in one centralized location. The aggregation of data may require the

classification of the registry to be at a higher security level.

G. SUMMARY

The desirable end state that DoD envisions is the integration of item data across

DoD, federal and industry asset management systems, enabling improved data quality

and global interoperability and rationalization of systems and infrastructure. It is

expected that unique identification of items will help achieve that goal by:

Improved item management and accountability.

Improved asset visibility and life cycle management.

Enabling clean audit opinions on item portions, Property, Plant and

Equipment, Inventory, and Operating Materials and Supplies, of DoD

financial statements.

The Government Accountability Office (GAO) report, dated January 2009, “Lack

of Key Information May Impede DoD’s Ability to Improve Supply Chain Management,”

determined that although DoD has taken several steps toward implementing IUID and

passive RFID technologies that enable electronic identification and tracking of

equipment and supplies, the DoD may face challenges achieving widespread

implementation because it is unable to fully demonstrate return on investment associated

with these efforts to the military components that have primary responsibility for

determining how and where these technologies are implemented. Additionally,

performance measures are either not being collected or address the status of

implementation efforts rather than the effect of implementation. Without the ability to

12

fully demonstrate that the benefits of IUID and passive RFID justify the costs and efforts

involved in their implementation, it may be difficult for DoD to gain the support needed

from the military components to make the significant commitments in resources

necessary to achieve widespread implementation of these technologies.

13

III. ORGANIZATIONS AND SYSTEM

There are various organizations and systems involved in the supply and

management of COMSEC equipment. As outlined in the “Communications Security

Material System Policy & Procedures Manual, 2007,” each organization and system has a

role in the management process.

COMSEC material is equipment used to protect U.S. government transmissions,

communications, and the processing of classified or sensitive unclassified information

related to national security from unauthorized persons. COMSEC material consists of

online transmitter, receivers, and various encryption and decryption devices, which

convert data and vocal transmissions to a form unintelligible to interceptors and then

subsequently reconvert the information to its original state. The protection of vital and

sensitive information moving over government communications systems is crucial to the

effective conduct of government operations.

A. NATIONAL SECURITY AGENCY (NSA)

The National Security Agency serves as TIER 0 and is the executive agent for

developing and implementing national level policy affecting the control of COMSEC

material. NSA is also responsible for the production and distribution of most COMSEC

material used to secure communications as well as for the development and production of

cryptographic equipment.

B. CHIEF OF NAVAL OPERATIONS (CNO)

CNO has overall responsibility and authority for implementing National

COMSEC policy within the Department of the Navy (DON) and is the resource sponsor

for the DON COMSEC program.

14

C. COMMANDER, NAVAL NETWORK WARFARE COMMAND (COMNAVNETWARCOM)

The Commander, Naval Network Warfare Command, a subordinate command of

Commander, Fleet Forces Command, is responsible for implementation of national

COMSEC policies and procedures within DON.

D. NAVAL COMMUNICATIONS SECURITY MATERIAL SYSTEM (NCMS)

The Naval Communications Security Material System, which reports to

COMNAVNETWARCOM, is responsible for tracking COMSEC material from cradle to

grave and issues directives, standards, and policies concerning the control and

management of COMSEC material for DON. NCMS administers the DON CMS

program and acts as the Service Authority (SERVAUTH) for all DON Electronic Key

Management System (EKMS) accounts. NCMS also maintains the Central Office of

Record (COR) database, which is a central accounting database for all DON COMSEC

material.

NCMS performs these specific functions:

Drafts and publishes COMSEC policy directives, standards, and

procedures pertaining to COMSEC material security, distribution, training,

handling, and accounting within the DON.

Operates, maintains, and exercises administrative, operational, and

technical control over the COMSEC Material Issuing Office (CMIO) for

distribution of COMSEC equipment.

Develops procedures for and monitors compliance with proper physical

storage and account management of COMSEC material.

Monitors compliance with national standards of the Protective Packaging

Program for cryptographic keying material.

Reviews requests for and authorizes waivers to physical security

requirements and the release of DON COMSEC material to contractors.

15

Coordinates fleet requirements for the acquisition of all COMSEC

material and publication for DON commands.

Establishes and disestablishes DON EKMS numbered accounts.

Based on Combatant Commanders’ requirements, ensures distribution of

COMSEC material to Vault Distribution Logistics System (VDLS)

components to ensure quantities are sufficient for EKMS account

requirements, exercises, and contingency operations.

Provides status of Navy COMSEC material to EKMS accounts and

planners.

Provides disposition instructions for DON COMSEC material.

Evaluates instances of loss, compromise, and procedural violations of

COMSEC procedures to determine the adequacy of existing procedures as

well as overall compliance with existing policy.

Manages the CMS Advice and Assistance (A&A) Training Team program

within the DON, including training and certification of EKMS Inspectors.

Conducts liaison and acts as the Technical Advisor with the Navy training

community regarding the EKMS Manager Course of Instruction (COI) (V-

4C-0013).

Is the Inventory Control Point (ICP) for COMSEC equipment throughout

DON and manages cryptographic equipment assets for DON.

As the DON Registration Authority (RA), responsible for registering

using activities/commands with Tiers 1 and 0 and for assigning EKMS

IDs to them. The RA is also responsible for ordering initialization key for

Key Processors, and maintaining registration data on its

activities/commands.

FIREFLY POC (Point of Contact) for modern key privileges.

16

E. COMSEC MATERIAL ISSUING OFFICE (CMIO)

Receives, stores, and ships Ready for Issue (RFI) equipment and is the Physical

Material Handling Segment (PMHS) for Navy in the EKMS.

F. UNITED STATES NATIONAL DISTRIBUTION AUTHORITY (U.S. NDA)

The U.S. NDA is the consolidated (Air Force, Army, Navy and NSA) COMSEC

distribution facility for keying material. U.S. NDA processes and automatically ships

Reserve on Board (ROB) material to the DCS delivery address of record for an account.

G. CONTROLLING AUTHORITY (CONAUTH)

Each item of COMSEC material is controlled or managed by a designated official

known as a CONAUTH. A CONAUTH is responsible for evaluating COMSEC incidents

and authorizing the issue/destruction of COMSEC material under its control. By

definition, a CONAUTH is the command that has designated responsibility for directing

the establishment and operation of a cryptonet/circuit and managing the operational use

and control of keying material assigned to a cryptonet/circuit.

H. ELECTRONIC KEY MANAGEMENT SYSTEM (EKMS)

A system has been established to distribute, control, and safeguard COMSEC

material. The EKMS is a key management, COMSEC material distribution, and logistics

support system consisting of interoperable Service and civil agency key management

systems. NSA established the EKMS program to meet multiple objectives, which include

supplying electronic key to COMSEC devices in a secure and timely manner and

providing COMSEC managers with an automated system capable of ordering, generation,

production, distribution, storage, security, accounting, and access control. Other features

of EKMS includes automated auditing capabilities to monitor and record security-

relevant events, account registration, and extensive system and operator privilege

management techniques that provide flexible access control to sensitive key, data, and

functions within the system. The common EKMS components and standards will

facilitate interoperability and commonality among the Services

17

The overall EKMS architecture consists of four layers, or tiers:

Tier 0 (Central Facility) : The Central Facility is a composite of the

National Security Agencies Fort Meade and Finksburg key facilities that

provides centralized key management services for all forms of key

material.

Tier 1: The layer of the EKMS that serves as the intermediate key

generation and distribution center, Central Offices of Record (CORs),

privilege managers, and registration authorities for EKMS/COMSEC

accounts. Management of the system is a cooperative effort involving the

Army, Navy, Air Force, NSA and the Joint Staff (J6).

Common Tier 1 (CT1) – The EKMS system is the COR

for all military service accounts. The CT1 also provides generation

and distribution of many traditional key types for large nets. The

CT1 comprises of two Primary Tier 1 sites (Lackland AFB, San

Antonio, TX and Ft. Huachuca, AZ), one Extension Tier 1 site

(Manheim Germany) and other physical distribution handling

systems at several service sites.

Servicing Primary Tier 1 Segment (PT1S) – Term used

to refer to the Tier 1 site having primary COR responsibility for a

Tier 2 account. There are currently two PT1Ss. One is located at

Lackland AFB, San Antonio TX and the other is at Ft. Huachuca

AZ. All Army, Air Force, and DON Tier 2 accounts will be

serviced by one or the other of these PT1Ss or CORs. The terms

“Tier 1” or “servicing PT1S” are synonymous with “COR.”

Tier 2: The layer of EKMS comprised of the EKMS Accounts that

manage key and other COMSEC material. Most Tier 2 accounts

are equipped with a Local Management Device (LMD) that runs

Local COMSEC Management Software (LCMS) and that

interfaces with a Key Processor (KP). This suite of equipment is

referred to as a LMD/KP.

Tier 3: The lowest tier or layer of the EKMS architecture, which includes

the Data Transfer Device (DTD) and all other means used to fill key to

end cryptographic units, and hard copy material holdings.

18

Figure 4. EKMS Overview Diagram (From McCardle, 2006)

U.S. National Distribution Authority

(U.S. NDA)

Electronic Orders

EKMS Tier 1

NSA Central Facility (EKMS Tier

Electronic Distribution

Navy COMSEC Material Issuing Office

(CMIO)

LM

KP

EKMS Local Account (Tier 2)

Electronic Receipts and Accounting Reports

EKMS Local Element/End User (Tier 3)

SKL

SKL

Electronic Distribution

19

IV. CURRENT NAVY INVENTORY PROCESS

There are three types of EKMS inventories: Semi-Annual Inventory Report

(SAIR), Change of Custodian Inventory Report (CCIR), and Combined (CMS Policy and

Procedures, 2007).

A. SEMI-ANNUAL INVENTORY REPORT (SAIR)

The purpose of inventories is to ensure that all accounts satisfy the national

requirement for a semi-annual inventory of keying material and an annual inventory of

equipment and publications.

Twice each calendar year (CY), at six-month intervals as shown in Table 4, and as

determined by the EKMS account number, the COR will transmit a Request for Inventory

Transaction (RIT) to each account electronically. Once opened, this request will prompt

the account to submit a SAIR.

The inventory generated by your account must be sent via the message server,

twice a year, to the COR no later than 30 days after the initial request for the inventory is

made. Each inventory must be printed and completed in its entirety (i.e., all key,

equipment, manuals/publications must be inventoried). If there are no discrepancies, the

EKMS system will process the SAIR in its entirety. The inventory will automatically

update the accounting data, close out the inventory cycle, and notify the account of the

completed inventory reconciliation using the Inventory Reconciliation Status Transaction

(IRST). If discrepancies have been identified in the IRST, the EKMS system will notify

the COR operator, who will access all available information in the system such as the

transaction log/history files and in-transit files and check the status of transferred

materials and local transactions to determine whether the discrepancies can be resolved.

Once resolved, the system will update and close out the inventory cycle. If not resolved

and manual intervention is necessary, the COR will correspond with the account to

correct the discrepancies. The COR Manager will assist the account in clearing all

discrepancies on the IRST. It is the responsibility of the EKMS Account Manager to

pursue resolution of all IRST discrepancies in order to achieve a final reconciliation of

20

that inventory. The IRST must be reconciled with the COR and all discrepancies

resolved or documented to the COR Account Manager within 60 days from the date of

the original IRST.

If your EKMS ID number is: 1st FC SAIR for CY: 2nd FC SAIR for CY:

100000 through 158500 January July 158501 through 199999 February August 200000 through 258100 March September 258101 through 299999 April October 300000 through 358200 May November 358201 through 399999 June December

Table 4. Fixed-Cycle (FC) Inventory Schedule

Example: If your EKMS ID number is 123456, your account is prompted to generate its

first FC SAIR in January of each calendar year. The FC SAIR must be completed in its

entirety (i.e., key, equipment, and publications/manuals must be inventoried) and sent via

the message server to the COR for reconciliation. In July of each year, your account will

again be prompted to send a second FC SAIR. All COMSEC material must be

inventoried in its entirety (i.e., key, equipment, and publications/manuals must be

inventoried) and sent via the message server.

B. CHANGE OF CUSTODIAN INVENTORY REPORT (CCIR)

The purpose of the CCIR is to satisfy the Navy requirement to conduct and

document Change of Command and EKMS Manager inventories. The CCIR must be

reconciled by the COR. The account must notify the COR prior to sending the CCIR.

The CCIR will be created by the account and send to the COR for reconciliation.

C. COMBINED SF-153 INVENTORY

This type of inventory may be used sometimes to satisfy both the requirements for

a FC SAIR and a CCIR. A FC SAIR may be combined with a CCIR only if the CCIR

will not interfere with the command being able to complete a normal SAIR inventory-

cycle to the COR no later than 30 days after the initial request for the SAIR was

requested.

21

D. WHO MAY INVENTORY COMSEC MATERIAL

A CCIR Inventory conducted due to a Change of Manager must be conducted by

the outgoing manager and witnessed by the incoming manager. If the outgoing manager

is physically incapacitated, the inventory must be conducted by the Primary Alternate

Manager of the account and incoming manager. All other inventories must be conducted

by the account EKMS Manager or Alternate and a qualified witness. Local Element (LE)

Inventories must be conducted by the person having local custody responsible for the

material and a qualified witness.

E. HOW TO INVENTORY COMSEC MATERIAL

Accounting Legend (AL) codes determine how COMSEC material is accounted

for within CMCS. Five AL codes are used to identify the minimum accounting controls

required for COMSEC material.

AL codes assigned to traditional hardcopy COMSEC material:

AL Code 1: COMSEC material is continuously accountable to the COR

by accounting (serial/register) number from production to destruction.

AL Code 2: COMSEC material is continuously accountable to the COR

by quantity from production to destruction.

AL Code 4: After initial receipt to the COR, COMSEC material is locally

accountable by quantity and handled/safeguarded based on its

classification (Top Secret, Secret, Confidential, or Unclassified).

AL codes assigned to electronically generated key:

AL Code 6: COMSEC material that is electronically generated and

continuously accountable to the COR from production to destruction

AL Code 7: COMSEC material that is electronically generated and locally

accountable to the generating facility.

22

All individuals conducting an inventory must cite the short title, edition suffix,

and, if applicable, accounting (serial/register) number of each item of AL Code 1, 2, or 4

COMSEC material held by the command.

Table 5 presents the SAIR Tier 1 Inventory Process:

1. Twice each calendar year, the COR sends a Request Inventory Transaction to

a Tier 2 account per the FC SAIR schedule.

2. The Tier 2 account receives and processes the transaction, creating a SAIR

with the COR identified as the destination account.

3. The Tier 2 account wraps the generated inventory and sends it to the COR via

a secure telephone unit. Tier 2 accounts must send the generated inventory to

the COR as soon as possible and must not wait until completing the physical

inventory. This must be done within 30 days of the Request Inventory

Transaction date.

4. The Tier 2 account prints and conducts the inventory. When completed, the

account retains the original copy locally. A copy should be forwarded to the

COR only if requested by the COR Account Manager. Accounts need to

notify NCMS via record message stating completion of inventory. Retain

copy of record message with signed inventory in the chronological file.

5. The COR will respond with an Inventory Reconciliation Status Transaction

(IRST), which shows the differences between the COR and the Tier 2

account’s databases.

6. The Tier 2 account submits appropriate accounting transactions to the COR

electronically, if possible, to clear the IRST. There is no need to line out or to

make adjustments to the IRST or to return the IRST to the COR. Items that

appear as “Short” mean that the COR has something in the inventory that the

Tier 2 does not have in its inventory. Tier 2 will respond by sending the

appropriate transfer, destruction, or other accounting transaction to the COR

to show why the item or items are no longer held in inventory. Items that

appear as “Excess” mean that the Tier 2 has something in inventory that the

COR does not have in its record. The Tier 2 will respond by sending

appropriate accounting transaction (e.g., receipt) to the COR.

7. Notice of Reconciliation will not be provided without notification of

completed inventory. Failure to complete the inventory will result in a loss of

accountability COMSEC incident.

NCMS [Common Tier 1 (CT1) system]

Tier 1 sends “Request Inventory” Transaction to account (via CT1 System)

Electronic

Tier 2 [EKMS Account Manager (ship, Sub, Battalion)]

Tier 2 Process the “Request”, create an inventory (30 days) (from the locally maintained database)

Electronic

Tier 2 “Electronically Wrap” and send the inventory to Tier 1

Electronic

Tier 2 Print the inventory and conduct physical inventory

Manual

Tier 2 Don’t wait until physical inventory is completed to wrap and send the electronically generated inventory to NCMS

N/A

Tier 1 Tier 1 automatically performs an electronic reconciliation (Line Item-by-Line Item comparison of data)

Electronic

Tier 1 Results given to Account Manager is an IRST (Discrepancy between submitted inventory list and what is being tracked in the CT-1 database)

Electronic

Tier 1 & Tier 2

NCMS (Tier 1) works with the Account (Tier 2) to Clear up discrepancies on the IRST

Labor intensive, Manual Burden

Table 5. CT1 Inventory Flow Summary (From Henry, 2008)

F. YEARLY COST OF PERFORMING INVENTORY AT CRYPTO REPAIR FACILITIES

As part of our research, we interviewed supervisors of the Crypto Repair

Facilities (CRF) in San Diego, CA, and Norfolk, VA. Currently, the San Diego CRF

only has one EKMS account, which is comprised of 9,837 items in inventory. The 23

Norfolk CRF has a total of 7,860 items for two EKMS accounts. However, the Norfolk

CRF has 17 Local Elements within the Hampton Roads area that fall under its area of

responsibility. Therefore, in order to perform the physical inventory, the personnel have

to travel to the Local Element facilities. The travel time and personnel availabilities at

the Local Elements contribute to the longer inventory processing time for Norfolk CRF.

Table 6 summarizes the yearly cost of performing the physical inventory at the CRFs.

The inventory processing time assumes that there are no inventory discrepancies with the

CT1 database. If there are inventory discrepancies to resolve with the COR, the time to

track and resolve the issues may increase the overall cost. Due to locality and cost of

living expenses, the technician loaded labor rate in San Diego is 37% higher than

Norfolk.

No. of EKMS Accounts

Inv. Qty

Inv. Process Time (Hours)

No. of Personnel

Loaded Labor Rate

Sub Total

Yearly Total

CRF San Diego, CA 1 9837 80 2 $115.00 $18,400 $36,800

CRF Norfolk, VA 2 7860 160 2 $42.00 $13,440 $26,880

Table 6. Yearly Inventory Processing Cost

In summary, the inventories are generated locally, conducted and signed by the

Commanding Officer (CO). Each account retains a hard copy of inventory, electronically

wrap inventory and forward to CT1. The IRST is a comparison of the inventory

forwarded (electronically) to CT1 and the CT1 database. Upon 100% data match, IRST

process is complete and CT1/NCMS will report completion by generating a Message to

the account. Account may resume normal Archive Policy upon receipt of this

notification and retain Message with CO signed inventory.

24

25

V. RETURN ON INVESTMENT OF UID IMPLEMENTATION AT THE CRYPTO REPAIR FACILITIES

A. INTRODUCTION

Portfolio Management (PfM) is the management of selected groupings of

investments using integrated strategic planning, integrated architectures, measures of

performance, risk management techniques, transition plans, and portfolio investment

strategies (IT PfM Directive, 2004.) Portfolio Management within the federal

government has become a fundamental business necessity because of legislation such as

the Clinger Cohen Act (CCA) of 1996. These Acts provide operational efficiency and

effectiveness guidance of investments. In October 2005, DoD issued Directive 8115.01

“ASD(NII)/DoD CIO Subject: “Information Technology Portfolio Management” to

provide guidance on the use of portfolio management within the DoD. Portfolio

management focuses on five key objectives:

Defining goals and objectives — clearly articulate what the portfolio is

expected to achieve.

Understanding, accepting, and making tradeoffs — determine what to

invest in and how much to invest.

Identifying, eliminating, minimizing, and diversifying risk — select a mix

of investments that will avoid undue risk, will not exceed acceptable risk

tolerance levels, and will spread risks across projects and initiatives to

minimize adverse impacts.

Monitoring portfolio performance — understanding the progress your

portfolio is making towards achieving of the goals and objectives of your

organization.

Achieving a desired objective — have the confidence that the desired

outcome will likely be achieved given the aggregate of investments that

are made (http://www.army.mil/ArmyBTKC/gov/pfm.htm, 2009).

26

Our team leveraged the work on Integrated Portfolio Analysis: Return on

Investment and Real Options Analysis of Intelligence Information Systems (Cryptologic

Carry on Programs) by Dr. Thomas Housel, Dr. Jonathan Mun, and LCDR Cesar G.

Rios Jr., of the Naval Postgraduate School, 2006. They applied the Knowledge Value

Added (KVA) framework to estimate the ROI on IT investments with an analytical tool

set that supports strategic, performance-based investment decisions. Our team also

reviewed the thesis on The Concurrent Implementation of Radio Frequency Identification

and Unique Item Identification at Naval Surface Warfare Center, Crane, IN, as a Model

for a Navy Supply Chain Application by Travis Colleran, Ryan Lookabill, and Ernan

Obellos, 2007. KVA methodology is used in this section to conduct a return on

investment business case analysis of the UID implementation at the Crypto Repair

Facilities.

B. THE KVA VALUATION FRAMEWORK AND OVERVIEW

The KVA valuation framework not only captures metrics for operating

performance, cost-effectiveness and return on investments, but it also incorporates

portfolio management techniques to value programs. The KVA framework also takes into

account uncertainty and risk in estimating future benefits (Housel, Mun, & Rios, 2006).

The DoD applicability of KVA is focused on the outputs of core processes and

subprocesses that provide several products or benefits to include:

Defines value of specific processes and functions of departments,

divisions, or organizations.

Captures historical data of cost and revenues of specific processes.

Provides a methodology that will facilitate regulatory compliance in

the public sector with legislation (such as the Clinger-Cohen Act of

1996) mandating portfolio management for all federal agencies.

Uses other portfolio investments by estimating the potential total

value created.

Organizations can use the framework to understand specific processes in terms of

the cost of each process and its contribution to the bottom line. In the public sector,

government can use the framework to enhance existing performance tools (Housel et al.,

2006).

C. KVA METHODOLOGY

Table 7 summarizes the KVA methodology process. This includes the general

data collection process guidelines according to Housel et al.

Data Collection KVA Methodology

Collect baseline data

Identify subprocesses

Research market

comparable data

Conduct market

analysis

Determine key

metrics

Step 1: Calculate time to learn

Step 2: Calculate value of Output (K) for each

subprocesses

Step 3: Calculate Total K for process

Step 4: Derive Proxy Revenue Stream

Step 5: Develop the Value Equation Numerator by

assigning revenue streams to subprocesses

Step 6: Develop value equation denominator by assigning

cost to subprocesses

Steps 7, 8 , 9: Calculate metrics:

Return on Investment (ROI)

Return on Knowledge Assets (ROKA)

Return on Knowledge Investments (ROKI)

Table 7. NPS Valuation Framework

27

The first step is data collection on processes and subprocesses required to produce

an output. After all process data are documented, they are supplemented by market

research to compare cost and revenue data to establish baseline information. The KVA

methodology is then applied to estimate value and costs for each process. Cost-per-unit

of output calculated by KVA, along with price-per-unit of output estimates, provides raw

data required for ROI analysis.

According to Housel et al., KVA identifies the actual cost and revenue of a

product or service by isolating the value of knowledge embedded in an organization’s

core processes, employees and IT. The methodology identifies every process required to

produce an output. It identifies the historical costs of those processes and the unit costs

and calculates the unit prices of products and services. An output is defined as the end

result, such as a product or service, of an organization’s operations, as shown in Figure 5.

Figure 5. Measuring Output (From Housel et al., 2006)

The DoD has applied the KVA methodology within 35 areas, ranging from flight

scheduling, ship maintenance and modernization processes. KVA methodology has been

used as a performance tool in DoD to:

28

29

Compare all processes in terms of relative productivity.

Allocate revenues to common units of output.

Measure value added by IT by the outputs it produces.

Relate outputs to cost of producing those outputs in common units.

Provide common unit measures for organizational productivity (Housel et

al., 2006).

KVA assumes that humans and technology in organizations add value by taking

inputs and changing them into outputs through core processes. The amount of change an

asset or process produces can be a measure of value or benefit. Other assumptions

include:

Describing all process outputs in common units (i.e., the time it takes to

learn to produce the required outputs) allows historical revenue and cost

data to be assigned to those processes at any given point in time.

All outputs can be described in terms of the time required to learn how to

produce them.

Learning Time is measured in common units of time. Consequently, Units

of Learning Time = Common Units of Output (K).

Common unit of output makes it possible to compare all outputs in terms

of cost-per-unit as well as price-per-unit, because revenue can now be

assigned at the sub-organizational level.

Once cost and revenue streams have been assigned to sub-organizational

outputs, normal accounting and financial performance and profitability

metrics can be applied (Housel et al., 2006).

It is important for a non-profit organization such as the DoD to describe processes

in common units because it allows the generation of market comparable data. Market-

comparable data from the commercial sector can be used to estimate price per common

unit, allowing for revenue estimates of process outputs for nonprofits. This methodology

also provides a common basis to define benefit streams regardless of process analyzed.

As depicted in Table 8, KVA differs from other ROI models because it allows for

revenue estimates, enabling use of traditional accounting, financial performance and

profitability measures (Housel et al., 2006).

KVA ranks processes in terms of the degree to which they add value to the

organization or its processes. The ranking enables decision makers to identify what

processes add value—those that will most likely accomplish a mission, deliver a service,

or meet customer demand. Value is quantified in four key metrics: Return-on-

Knowledge (ROK), Return on Knowledge Assets (ROKA), Return on Knowledge

Investment (ROKI) and Return on Investment (ROI).

Table 8. Comparison of Traditional Accounting versus Process Based Costing (From Housel et al., 2006)

D. QUANTIFICATION OF KVA VALUE AND COST DATA

Our thesis team used the KVA methodology to quantify the value of

implementing UID technology with the Electronic Key Management System. The

efficiency and effectiveness of the inventory process were measured by comparing the

values created by human capital elements and UID technology elements utilized in 30

31

inventory processes. The identification of processes and subprocesses provided the

foundation for the value measurement, quantification and analysis.

Process outputs are determined by “amount of time to learn” estimates and

include the total aggregate process outputs and a revenue stream used to monetize the

outputs. The analysis of all subprocesses includes time-to-learn, how-to perform, and the

number of times each subprocess is accomplished.

Allocation of asset value and cost is distributed within all subprocesses in which a

product was contributed. The revenue allocated at the subprocess level was computed by

multiplying the “time-to-learn” by the number of personnel involved, the number of

times the subprocess was repeated and the market comparable revenue. The revenue

allocated at the subprocess level serves as the baseline for revenue allocation (Housel et

al., 2006).

In this analysis, the yearly salary of a GS-12, Step 5, employee was converted to

an hourly wage and used to represent the Market Comparable Revenue (MCR) value for

each subprocess accomplished by the Tier 1 Administrator. This logic was also applied

in using the yearly salary of a GS-10, Step 5, employee to represent the MCR value for

each subprocess accomplished by the Inventory Clerk. Summing the values computed

for each subprocess leads to the total revenue of the entire inventory process. Multiyear

totals are computed by multiplying the total annual revenue by the number of years. Five

years was used in this study to represent the number of EKMS life-usefulness before

transition to the next generation Key Management Infrastructure (KMI) System.

Cost allocated to each subprocess in the inventory process was computed by

multiplying the Work Time (actual time performing task) by the number of personnel

involved, the number of times the subprocess was repeated and the market comparable

cost. The salary rate of a GS-12, Step 5, and GS-10, Step 5, were applied as before to

represent the Market Comparable Process Cost (MCPC).

The output of each subprocess in terms of Knowledge Units was calculated by

adding the Knowledge Amount Embedded in Information Technology percentage value

32

to the product of estimated learning time (ALT) and the number of employees involved in

the subprocess. Total output is computed by summing the Knowledge Units of each

subprocess within the overall Inventory Process.

The ROK productivity ratios were computed with Total MCR in the numerator

and Total MCPC in the denominator. ROI financial ratios were calculated with Total

MCPC minus Total MCPC in the numerator and Total MCPC in the denominator.

In order to analyze the benefits of automation in the inventory workflow process,

this study compared the current “As Is” inventory process with the recommended “To

Be” inventory process. The “As Is” process is a basic, highly automated inventory

operation and the “To Be” process assumes UID implementation in that inventory

operation. The “As Is” and “To Be” inventory subprocesses are listed in Table 9, with

the improved or eliminated subprocesses indicated in bold italics.

“As Is” Inventory Sub-Processes “To-Be” Inventory Sub-Processes

1. Tier 1 sends “Request Inventory” Transaction to account (via CT-1 System) 2. Tier 2 Clerk creates an inventory from the locally maintained database 3. Tier 2 Clerk “Electronically Wrap” and sends the inventory to Tier 1 4. Tier 2 Clerk prints the inventory and conducts physical inventory 5. Tier 1 automatically performs an electronic reconciliation (Line Item-by-Line Item comparison of data) 6. Tier 1 electronically sends discrepancy report to Account Manager 7. Tier 2 to locate/clear up discrepancies 8. Tier 2 Clerk “Electronically Wrap” and sends the inventory to Tier 1 9. Tier 1 to clear up discrepancies with CT-1 database 10. Tier 1 records inventory as “Completed”

1. Tier 1 sends “Request Inventory” Transaction to account 2. Tier 2 Clerk conducts inventory with handheld device and data is transmitted wirelessly to Tier 1. 3. Tier 1 performs electronic reconciliation 4. Tier 1 sends discrepancy report

5. Tier 2 resolve discrepancies and data is transmitted wirelessly to Tier 1. 6. Tier 1 records inventory as “Completed”

Table 9. CRF “As Is” and “To Be” Inventory Subprocesses. The Improved or Eliminated Subprocesses are Indicated in Bold Italics.

33

34

E. ANALYSIS OF WORKFLOW PROCESSES WITH KVA

1. “As Is” Inventory Process Analysis

Analysis of the current inventory process reveals that subprocesses using EKMS

system provides high KVA to the Navy’s crypto inventory operations. Overall, the Navy

has a highly automated and efficient system in place for managing COMSEC equipment.

However, subprocesses such as conducting inventory and time spent on clearing up

discrepancies provide minimal KVA. These subprocesses are not automated and are

extremely labor intensive. Another area of potential improvement is the elimination of

the local database. As presented in Table 10, the calculated ROK and ROI for the

inventory process is 15 percent and negative 85 percent using a five-year period until

EKMS end of life. Based on the analysis, subprocesses 2, 3, 4, 5, 7, 8, and 9 in Table 10

can be more efficient with UID technology implementation.

StepsEstimated

Learning Time (ALT) (hrs)

Work Time

No. of Employees

Number of times task completed (Annual)

Sum of task completion (Annual)

Knowledge Amt

Embedded in IT (%)

Amt of Knowledge Units (per

task)

Total Amt of Knowledge

Units (Annual)

% Total Knowledge

Market Comparable

Revenue

Total Market Comparable

Revenue (Annual)

Process Cost

Total Process

Cost (Annual)

ROK

A B C D E=A*C*D F G=(A*C)+F H=E*G I=G/TotalG J K=E*J L=B*J M=E*L N=J/L1. Tier 1 sends “Request Inventory” Transaction to account

1 0.25 1 2 2 90.0 91 182 12% $34.51 $69.02 $8.63 $17.26 400%

*2. Tier 2 Clerk creates an inventory from the locally maintained database

1 0.25 1 2 2 90.0 91 182 12% $26.21 $52.42 $6.55 $13.11 400%

*3. Tier 2 Clerk “Electronically Wrap” and sends the inventory to Tier 1

0.5 0.25 1 2 1 90.0 90.5 90.5 12% $13.11 $13.11 $3.28 $3.28 400%

*4. Tier 2 Clerk prints the inventory and conducts physical inventory

0.5 16 2 2 2 0.0 1 2 0% $13.11 $26.21 $209.68 $419.36 6.25%

*5. Tier 1 automatically performs an electronic reconciliation (Line Item-by-Line Item comparison of data)

0.5 0.5 1 2 1 90.0 90.5 90.5 12% $17.26 $17.26 $8.63 $8.63 200%

6. Tier 1 electronically sends discrepancy report to Account Manager

0.5 0.25 1 2 1 90.0 90.5 90.5 12% $17.26 $17.26 $4.31 $4.31 400%

*7. Tier 2 to locate/clear up discrepancies

1 16 2 2 4 0.0 2 8 0% $26.21 $104.84 $419.36 $1,677.44 6.25%

*8. Tier 2 Clerk “Electronically Wrap” and sends the updated inventory to Tier 1

0.5 0.25 1 2 1 90.0 90.5 90.5 12% $13.11 $13.11 $3.28 $3.28 400%

*9. Tier 1 to clear up discrepancies with CT-1 database

1 8 1 2 2 90.0 91 182 12% $34.51 $69.02 $276.08 $552.16 12.50%

10 Tier 1 records inventory as "Completed"

0.5 0.25 1 2 2 90.0 90.5 181 12% $17.26 $34.51 $4.31 $8.63 400%

Table 10. “As Is” Inventory Process Analysis

35

36

2. “To Be” Inventory Process Analysis

The analysis from Table 11 shows the potential increase in productivity and

efficiency after UID implementation. In this scenario, the seven steps identified in Table

10 are replaced or improved with UID technology. The technology potentially reduces

the overall annual inventory process cost from $2,708.00 to $286.00. The productivity

ratio (ROR) increased by 30%.

In summary, the implementation of UID technology increased output in terms of

operations efficiency, efficient use of personnel resources, elimination of multiple

databases, and improve total visibility of material. Even though there is not a high return

on investment with UID implementation, the Navy can significantly realize savings in

labor and time required to conduct inventories.

Steps

Estimated Learning

Time (ALT) (hrs)

Work Time

No. of Employees

Number of times task completed (Annual)

Sum of task completion (Annual)

Knowledge Amt

Embedded in IT (%)

Amt of Knowledge Units (per

task)

Total Amt of Knowledge

Units (Annual)

% Total Knowledge

Market Comparable

Revenue

Total Market Comparable

Revenue (Annual)

Process Cost

Total Process

Cost (Annual)

ROK

A B C D E=A*C*D F G=(A*C)+F H=E*G I=G/TotalG J K=E*J L=B*J M=E*L N=J/L

1. Tier 1 sends “Request Inventory” Transaction to account 1 0.25 1 2 2 90.0 91.00 182.00 16% $34.51 $69.02 $8.63 $17.26 400%2. Tier 2 Clerk conducts inventory with handheld device and data is transmitted wirelessly to Tier 0.5 8 2 2 2 95.0 96.00 192.00 17% $13.11 $26.22 $104.88 $209.76 12.50%

3. Tier 1 performs electronic reconciliation 0.25 0.25 1 2 0.5 90.0 90.25 45.13 16% $8.63 $4.31 $2.16 $1.08 400%4. Tier 1 sends discrepancy report 0.25 0.25 1 2 0.5 90.0 90.25 45.13 16% $8.63 $4.31 $2.16 $1.08 400%5. Tier 2 resolve discrepancies and data is transmitted wirelessly to Tier 1.

0.25 8 2 2 1 95.0 95.50 95.50 17% $6.55 $6.55 $52.42 $52.42 12.50%6. Tier 1 records inventory as “Completed” 0.5 0.25 1 2 1 90.0 90.50 90.50 16% $17.26 $17.26 $4.31 $4.31 400%

Totals 2.75 17 12 7 553.50 650.25 $88.68 $127.68 $174.56 $285.91$638.38 $1,429.53

45%-55%

5 Year Total

ROR (Total K/ Total M)=ROI ((Total K-Total M) / Total M=

Table 11. “To Be” Inventory Process Analysis

37

38

THIS PAGE INTENTIONALLY LEFT BLANK

39

VI. SUMMARY AND RECOMMENDATIONS

A. SUMMARY

The implementation of UID technology in military supply chain operations was

mandated by the DoD in 2003, but to date very few Navy organizations have complied

with these directives. Adoption of the UID will enable the Navy COMSEC community

to successfully fulfill the DoD’s UID mandates.

This project presented a review of UID technology that provided the reader a

thorough background of what the technology may bring to process improvement within

the DoD sector. It covered technology, policy, organizations, and system. The project

then presented the current COMSEC inventory management process and analyzed current

cost of performing inventory.

IUID implementation increases the output of the inventory process while

improving the accuracy of that output. The automation of certain subprocesses creates

efficiency and reduces the amount of time to complete the subprocess. IUID

implementation translates to improved efficiency, as both the amount and value of the

output are enhanced. This leads to less time and resources wasted in rework and

recounting. The time and resources available for other tasking and customer service is

also increased.

To express the potential cost savings with IUID implementation, the team chose

KVA analysis as a means to demonstrate a return for this IT investment. The analysis

proved that IUID implementation increases productivity and efficiency, and potentially

eliminates the need to maintain multiple local databases of COMSEC equipment.

However, the initial investment cost for identifying, tagging, and registering legacy

COMSEC material may be too high for the Navy to gain ROI within an acceptable time

frame.

40

B. RECOMMENDATIONS

Due to EKMS transition to the next generation Key Management Infrastructure

(KMI) System in 2014, the thesis team does not recommend the Navy implement

engineering change proposals to EKMS in order to have an application interface with

IUID technology at this time.

Therefore, the team recommends a more detailed business case analysis be

performed by the Navy Crypto Modernization Program Office. The business case

analysis needs to address:

Defining what items need to be accounted in inventory

Manufacturing methods of IUID labels

Tagging and registering in the national database

Working with NSA and OSD in determining the classification level of the

national database due to sensitivity of data aggregation

Working with KMI Program Office to develop the engineering change

proposals to design an IUID application interface with the system

41

LIST OF REFERENCES

Colleran, T., Lookabill, R., & Obellos, E. (2007). The Concurrent Implementation of Radio Frequency Identification and Unique Item Identification at Naval Surface Warfare Center, Crane, IN as a Model for a Navy Supply Chain Application. Master’s thesis, Naval Postgraduate School. Retrieved October 17, 2009, from http://edocs.nps.edu/npspubs/scholarly/MBAPR/2007/Dec/07Dec_Obellos_MBA.pdf

Defense Procurement and Acquisition Policy. (2006). Item Unique Identification 101, The Basic. Retrieved October 17, 2009, from http://www.acq.osd.mil/dpap/UID/attachments/iuid-101-20060130.pdf

Deputy Undersecretary of the Army. (2009). About Portfolio Management. Retrieved November 11, 2009, from http://www.army.mil/ArmyBTKC/gov/pfm.htm

DoD 4140.1-R. (2003). DoD Supply Chain Materiel Management Regulation. Retrieved October 17, 2009, from http://www.dtic.mil/whs/directives/corres/pdf/414001r.pdf

GAO-02-447G. (2002). Executive Guide, Best Practices in Achieving Consistent, Accurate Physical Counts of Inventory and Related Property. Retrieved October 19, 2009, from http://www.gao.gov/new.items/d02447g.pdf

GAO-09-150. (2009). DEFENSE LOGISTICS Lack of Key Information May Impede DOD’s Ability to Improve Supply Chain Management. Retrieved October 15, 2009, from http://www.gao.gov/new.items/d09150.pdf

Henry, Clifford. (2008). CT1 Inventory Process Town Hall Brief. Retrieved October 15, 2009, from https://ncms.navy.smil.mil

Housel, T., Mun, J., & Rios, C. (2006). Integrated Portfolio Analysis: Return on Investment and Real Options Analysis of Intelligence Information Systems Cryptologic Carry on Programs. Master’s thesis, Naval Postgraduate School. Retrieved October 15, 2009, from http://edocs.nps.edu/npspubs/scholarly/TR/2006/NPS-GSBPP-06-018.pdf

Leibrandt, Rob. (2009). The Key is Maintaining Interoperability of Asset Visibility Across All Commodities. Retrieved October 30, 2009, from http://denverrockymt.npma.org/Chapters/11/4-7-315-IUIDNATO-Leibrandt.pdf

McCardle, Scott. (2006). EKMS Project Overview. PEO C4I, San Diego, CA

NCMS. (2007) Communications Security Material System Policy & Procedures Manual. Retrieved October 15, 2009, from https://ncms.navy.smil.mil

42

THIS PAGE INTENTIONALLY LEFT BLANK

43

INITIAL DISTRIBUTION LIST

1. Defense Technical Information Center Ft. Belvoir, Virginia

2. Dudley Knox Library Naval Postgraduate School Monterey, California


Recommended