FY18 to end on a healthier note FMCG companies continue to enjoy favorable base: Our FMCG
coverage universe is expected to register 10/13% YoY revenue/EBITDA growth during 4QFY18 vs. 12/16% YoY in 3QFY18 and 8/9% YoY in 4QFY17. Consumer offtake is gradually improving with normalising distribution channels (post GST). Therefore, along with a favorable base (also in 1QFY19), FMCG companies would be able to accelerate revenue growth. Macro economic factors are improving steadily and further gains are expected on account of govt’s focus on agricultural & rural incomes. Rural used to grow 2.5-3% faster than Urban but the delta has now narrowed down to ~1.5%. Management commentary also suggests green shoots in the rural economy and a pickup in demand. International business is expected to recover due to improving consumer confidence index for key geographies and favorable base (geo-political issues, unfavorable currencies). Outliers : Jubilant FoodWorks, Britannia, Colgate, HUL
Our top picks in FMCG: ITC, Jubilant FoodWorks and Marico Appliances companies to sustain robust growth: Majority of the
appliance companies will grow faster (rev. and EBITDA) vs. staples owing to favourable GST rate revision (Nov-17), seasonal restocking, better pricing discipline (high promotions in base qtr due to demonet) and lower penetration in many categories. Moreover, cooling products (Fans, Coolers and ACs) are expected to report strong growth, since the summer of 2018 is likely to be harsh (as per IMD). We model sales/EBITDA growth of 15/32% YoY (14/9% in 4QFY17) for our appliances universe. Outliers : Symphony, Havells, V-Guard
Our top picks in Appliances: Havells, Crompton and Symphony Aviation: Driven by higher ASKMs and higher PLFs, Interglobe and
Spicejet are expected to report ~15%/218% growth in earnings despite +11.6% YoY higher ATF prices. Interglobe posted lower ASKM growth and slightly lower operating leverage. Going into FY19, sustained hardening in ATF prices poses a key challenge to our earnings estimates. Spicejet is our preferred pick due to lower valuations.
FMCG: Expect 10% Sales And 13% EBITDA Growth
Appliances*: Expect 15% Sales And 32% EBITDA Growth
Source: Company, HDFC sec Inst Research * Havells excluding Lloyd consumer biz
CONSUMER: 4QFY18E RESULTS PREVIEW
-
10.0
20.0
30.0
40.0
ITC
HU
L
GCP
L
Dab
ur
Bri
tann
ia
Mar
ico
Colg
ate
Emam
i
Jub
ila
nt
Fo
od
Sales Gr. (%) EBITDA Gr. (%)> 40.0
-
11.0
22.0
33.0
44.0
Hav
ells
Vol
tas
Cro
mp
ton
Sym
phon
y
V-G
uar
d
TTK
Pre
stig
e
Sales Gr. (%) EBITDA Gr. (%)
3
FMCG: Mixed bag
COMPANY 4QFY18E
OUTLOOK WHAT’S LIKELY KEY MONITORABLES
ITC AVG
We expect Cigarette revenue growth of 7% YoY, while volumes would contract by ~2% YoY (-4% in 3QFY18 and -0.5% in 4QFY17). Price hike would support the cigarette revenue growth. Non-Cigarette business is expected to grow by ~10% with FMCG/Hotel/Agri/Paper business to register 13/8/8/7% growth, respectively
We expect Cigarette EBIT growth of 9.1% YoY (7.8% in 3QFY18 and 8% in 4QFY17)
Overall EBITDA margin to expand by 118bps to 36%. EBITDA to grow by 10.1% YoY
Cigarette volume growth
FMCG business EBIT margin
Outlook on Agri and Hotel businesses
HUL GOOD
We expect revenue growth of 12%, 3QFY18 was at 17% (like-to-like growth) and 4QFY17 at 6.5%. Domestic volume growth is model at 6.5% (11% in 3QFY18 and 4% in 4QFY17)
We model 12/11/15/14% growth in Home Care/PC/Foods/Refreshment segments, respectively
EBITDA margin to expand by 62bps YoY to 20.7% (+197bps YoY in 3QFY18 and +103bps YoY in 4QFY17)
Improvement in rural and wholesale channels
Commentary on competition, especially in Shampoo, Oral Care And Detergent categories
Pricing actions and new launches strategy
Godrej Consumer Products
AVG
We model 10% (9% in 3QFY18 and 12% in 4QFY17) revenue growth. Domestic growth is expected at 9% driven by 3% revenue growth in HI and 13% in personal wash. International business to grow by 12%.
We model 99bps expansion in EBITDA margin to 24%. EBITDA to grow by 15% YoY.
Commentary on recovery in trade channels and rural demand
Outlook on Indonesia and other geographies
Competitive intensity across categories
FMCG: 4QFY18E RESULTS PREVIEW
4
FMCG: Mixed bag
COMPANY 4QFY18E
OUTLOOK WHAT’S LIKELY KEY MONITORABLES
Dabur AVG
Consolidated revenue to grow by 6%, with domestic business growth at ~7.4% and ~1% of international. We modeled hair care/oral care/health supplements/home care/food growth of 7/10/5/8/9%.
We expect international business to grow by ~1% (-4.5% in 3QFY18 and -20% in 4QFY17). Currency depreciation is now anniversarised and demand in most geographies are improving
EBITDA margin to expand by 33bps YoY to 22.1% (250bps YoY in 3QFY18 and 115bps in 4QFY17). EBITDA to grow by 7.5% YoY
Commentary on rural growth and wholesale channels
Commentary on competition, especially Patanjali
New launches strategy
Britannia GOOD
We model 11.5% revenue growth with volume growth of 10% (12% in 3QFY18 and 2% in 4QFY17)
Input price softening and cost-control initiatives would result in expanding EBITDA margin by 104bps YoY to 14.8%. EBITDA to grow by 20% YoY
Change in competitiveness post GST, especially after a rise in taxes in the value segment
Commentary on new launches
Scope for further cost control
Marico AVG
We model 12% domestic revenue growth, with volume growth of ~3% (9% in 3QFY18 and 10% in 4QFY17). We model Parachute, Saffola and VAHO to clock value/volume growth of 25/2%, 0/2% and 12/12% YoY respectively.
International business to grow by ~13%, with healthy growth from Bangladesh. Currency impact to anniversarise, hence minimal forex impact
Copra inflation remained high at ~45% YoY. Marico has taken ~11% price hike on Parachute during Jan’18 (cumulative price hike of ~23%). We model 266bps fall in gross margins and 152bps fall YoY in EBITDA margin
Commentary on copra prices
Outlook on youth product category and strategy on new launches
Pricing strategy for the next few quarters
CSD channel improvement
Improvement in the international business
FMCG: 4QFY18E RESULTS PREVIEW
5
FMCG: Mixed bag
COMPANY 4QFY18E
OUTLOOK WHAT’S LIKELY KEY MONITORABLES
Colgate AVG
We expect 11% revenue growth with 6% volume growth (-3% in 4QFY17 and 12% in 3QFY18)
Gross margin would continue to expand, we model 117bps YoY expansion to 63.8%. We expect that ASP expense would continue to increase in support of new launches. We model 15% increase in ASP despite high base (up 24% in 4QFY17)
EBITDA margin to expand by 113bps YoY to 24.7%. EBITDA to grow by 16.3%
Toothpaste volume growth and market share change
New product launches
ASP spends, especially with increased competition from Patanjali
Emami AVG
We expect 10% revenue growth, with domestic business to grow by ~9% and international by 18% (-38% in 4QFY17). We model 6% domestic volume growth
We expect gross margin to expand by 60bps YoY to ~63%. We model higher ASP spend (17% YoY) to factor the company’s strategy to focus more on volume growth. EBITDA margin to down by 26bps to 30.6%. EBITDA to grow by 9% YoY
Outlook on Mentha oil
Kesh King growth outlook
Price hike strategy
Commentary on new launches
Commentary on international business
Jubilant FoodWorks
GOOD
We model 25% revenue growth, driven by 22% SSG (-7.5% in 4QFY17 and 17.8% in 3QFY18). ‘Everyday value offers’, upgrade in pizza quality and closure of loss making stores have been supporting the acceleration in SSG since last 2-3 quarters. We model 15 Dominos stores addition in 4QFY18
We model gross margin to contract by 156bps YoY and 80bps QoQ to 75.3%. EBITDA margin can expand to 16.7% vs. 9.9% in 4QFY17 and 17.2% in 3QFY18. EBITDA to grow by 112% YoY.
Customer feedback on change in pizza taste
Strategy of the new management team
Outlook on store addition in FY19-20
Competitive intensity, pricing strategy
Outlook on SSG post GST rate revision
FMCG: 4QFY18E RESULTS PREVIEW
6
Appliances: Robust performance to continue
COMPANY 4QFY18E
OUTLOOK WHAT’S LIKELY KEY MONITORABLES
Havells India GOOD
We expect Havells (ex-Lloyd ) to register ~14% revenue growth. Cables, Fan and Switchgears to benefit from GST rate revision (Nov’17). We model 72% revenue growth (inc. Lloyd), significantly higher as this will be the first seasonal quarter for Lloyd since the acquisition.
We model 7/12/18/20% for Switch Gears/Cables/Lighting/Consumer durables
We model EBITDA margin (ex-Lloyd) to expand by 273bps YoY to 16.2% (-177bps YoY in 4QFY17), while with Lloyd, we expect margins contraction of -6bps to 13.4%
Outlook on housing activities
GST rate revision impact on Cables and Fan
Updates on Lloyd’s Consumer business particularly post change in energy efficiency norms and seasonal offtake
Voltas GOOD
We expect net revenue growth of 17%, led by 20% growth in UCP (28% in 4QFY17) and 15% growth in EMPS segment (-9% in 4QFY17 and 7% in 3QFY18)
We model UCP and EMPS EBIT margin of 16.8% (+ 40bps YoY) and 6.3% (+60bps YoY)
EBITDA margin to expand by 66bps to 11.6% during the quarter
Update on impact from change in energy efficiency norms
Consumer offtake and realizations
Outlook on EMPS revenue and margin
Crompton Consumer
GOOD
We expect 14% revenue growth, driven by 14% growth from Lighting and ECD segment each. Full channel restocking in fans (Post GST) is expected during the quarter
We model 103bps EBITDA margin expansion to 13.9% driven by continued operational excellence and premiumisation in fans
Growth in premium fans
Distribution expansion
Performance of new launches
APPLIANCES: 4QFY18E RESULTS PREVIEW
7
Appliances: Robust performance to continue
COMPANY 4QFY18E
OUTLOOK WHAT’S LIKELY KEY MONITORABLES
Symphony GOOD
We expect net revenue growth of 18.3% (20.9% in 3QFY18 and 33% in 4QFY17) driven by 19% growth in domestic and 17% growth in exports
We model gross margin expansion of 750bps (down 769bps YoY in 4QFY17 on account of introductory launch of Touch series) to 58.5%. EBITDA margin is expected to expand by 1,305bps (down 1,534bps in 4QFY17) to 40%.
Performance of new product launches
Inventory levels in trade channels
GST impact on unorganised players
Outlook on exports and IMPCO
V-Guard Industries
GOOD
We model 15% YoY revenue growth (21% in 4QFY17 and 19% in 3QFY18) for the quarter. We expect healthy growth across the products.
We expect 13/14/16/15/14/16% growth for Stabilisers/UPS/Pumps/Cables/Water Heaters/Fans
We model 272bps expansion in gross margin (-193bps in 4QFY17 and 168bps in 3QFY18) to 31.5%. V-Guard is spending on the brand rejuvenation exercise (one-time) and we model 80% YoY jump in ASP expense during the quarter. Hence, we expect 198bps increase in EBITDA margin to 11.5% (-284bps in 4QFY17 and 125bps in 3QFY18)
GST rate revision impact on Cables and Fan
Non-south performance
Performance of new launches
Outlook on input cost inflation
TTK Prestige GOOD
We expect net revenue growth of 15%, led by 14/13/15/20% growth in Cookers/Cookware/Appliances/Others respectively
We model EBITDA margin expansion of 58bps YoY (98bps in 4QFY17 and 316bps in 3QFY18) to 13.2%
Performance of new product launches
Commentary on recovery in trade channels
Witnessing any green shoots in rural demand
APPLIANCES: 4QFY18E RESULTS PREVIEW
8
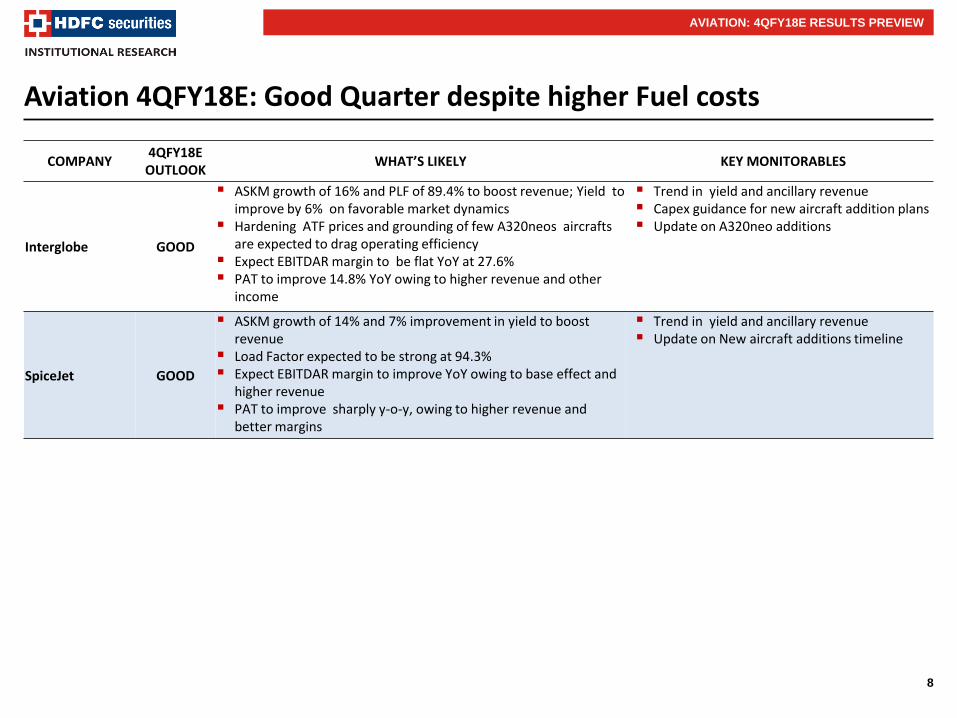
Aviation 4QFY18E: Good Quarter despite higher Fuel costs
COMPANY 4QFY18E
OUTLOOK WHAT’S LIKELY KEY MONITORABLES
Interglobe GOOD
ASKM growth of 16% and PLF of 89.4% to boost revenue; Yield to improve by 6% on favorable market dynamics
Hardening ATF prices and grounding of few A320neos aircrafts are expected to drag operating efficiency
Expect EBITDAR margin to be flat YoY at 27.6% PAT to improve 14.8% YoY owing to higher revenue and other
income
Trend in yield and ancillary revenue Capex guidance for new aircraft addition plans Update on A320neo additions
SpiceJet GOOD
ASKM growth of 14% and 7% improvement in yield to boost revenue
Load Factor expected to be strong at 94.3% Expect EBITDAR margin to improve YoY owing to base effect and
higher revenue PAT to improve sharply y-o-y, owing to higher revenue and
better margins
Trend in yield and ancillary revenue Update on New aircraft additions timeline
AVIATION: 4QFY18E RESULTS PREVIEW
9
Lubricants: New capacity to drive growth
COMPANY 4QFY18E
OUTLOOK WHAT’S LIKELY KEY MONITORABLES
Gulf Oil GOOD
Expect revenue growth of 27% YoY, driven by 24.6% YoY volume growth and 1.7% YoY realization growth
EBITDA margin expected to be higher by 211bps on YoY to 17.6%, led by operating leverage, and higher B2C contribution
APAT to grow strongly by 39.3% YoY to Rs 0.4bn, owing to higher operating profit
Volume growth
Realization and product mix trend
Capacity utilization of new plant
LUBRICANTS & BUILDING MATERIALS: 4QFY18E RESULTS PREVIEW
Building Materials: Pressure on realization to continue
COMPANY 4QFY18E
OUTLOOK WHAT’S LIKELY KEY MONITORABLES
Finolex Industries AVG
Expect revenue growth of ~20% YoY, driven by 13/6% YoY growth in Pipes & Fittings/PVC segment
Except pressure on EBITDA margins (-263bps YoY to 17.5%), led by drop in realization of Pipes & Fittings/PVC by 20/15% YoY respectively
Except APAT to remain unchanged on YoY at Rs 1.2bn, owing to marginal growth in operating profit
Target Price includes the value of holding in Finolex Cable, assigned holding company discount at 30% (SOTP Target Price = Core business value per share Rs 826 + Finolex Cables value per share Rs 86)
Volume growth
Realization and product mix trend
Status of capacity expansion plans
10
Alco-Bev: Modest operating performance
ALCO-BEVERAGES: 4QFY18E RESULTS PREVIEW
COMPANY 4QFY18E
OUTLOOK WHAT’S LIKELY KEY MONITORABLES
United Spirits AVG
Adjusted for franchising model in several states from 1-Jan-17, we expect underlying volume to decline by 1% YoY and revenue to grow by 9% led by mix change and price increases. Reported volumes to decline by 10.5% YoY and revenue to grow by 2.8% owing to third part franchising in several states
We model 120 bps YoY expansion in EBITDA margin aided by 330 bps expansion in GM due to lower input costs and partly due to franchising of lower margin Popular segment in several states. GM expansion is offset by higher advertising and marketing expenses (+130 bps YoY) and employee costs (+80 bps) due to base effect
Outlook on recovery in volumes especially in states of Haryana, Punjab, UP and West Bengal owing to route to market changes
Update on premiumisation
Regulatory environment especially excise hikes in various states for FY19 and importantly in Maharashtra
11
Financial Summary
Source: Company, HDFC sec Inst Research * Havells includes Lloyd consumer
CONSUMER: 4QFY18E RESULTS PREVIEW
Company NET SALES (Rs bn) EBITDA (Rs bn) EBITDA Margin (%) APAT (Rs bn) Adj. EPS (Rs/sh)
*RoE has been used for Aviation stocks Source: Company, HDFC sec Inst Research NR: Not Rated TP is fair value for GCPL and TTK Prestige since we don’t have active coverage
BUY : Where the stock is expected to deliver more than 10% returns over the next 12 month period
NEUTRAL : Where the stock is expected to deliver (-) 10% to 10% returns over the next 12 month period
SELL : Where the stock is expected to deliver less than (-) 10% returns over the next 12 month period
Disclosure: We, Naveen Trivedi , MBA, Siddhant Chhabria, PGDBM, Madhukar Ladha, CFA, Basanth Patil, MBA & Himanshu Shah, CA authors and the names subscribed to this report, hereby certify that all of the views expressed in this research report accurately reflect our views about the subject issuer(s) or securities. HSL has no material adverse disciplinary history as on the date of publication of this report. We also certify that no part of our compensation was, is, or will be directly or indirectly related to the specific recommendation(s) or view(s) in this report. Research Analyst or his/her relative or HDFC Securities Ltd. does not have any financial interest in the subject company. Also Research Analyst or his relative or HDFC Securities Ltd. or its Associate may have beneficial ownership of 1% or more in the subject company at the end of the month immediately preceding the date of publication of the Research Report. Further Research Analyst or his relative or HDFC Securities Ltd. or its associate does not have any material conflict of interest. Any holding in stock –No HDFC Securities Limited (HSL) is a SEBI Registered Research Analyst having registration no. INH000002475. Disclaimer: This report has been prepared by HDFC Securities Ltd and is meant for sole use by the recipient and not for circulation. The information and opinions contained herein have been compiled or arrived at, based upon information obtained in good faith from sources believed to be reliable. Such information has not been independently verified and no guaranty, representation of warranty, express or implied, is made as to its accuracy, completeness or correctness. All such information and opinions are subject to change without notice. This document is for information purposes only. Descriptions of any company or companies or their securities mentioned herein are not intended to be complete and this document is not, and should not be construed as an offer or solicitation of an offer, to buy or sell any securities or other financial instruments. This report is not directed to, or intended for display, downloading, printing, reproducing or for distribution to or use by, any person or entity who is a citizen or resident or located in any locality, state, country or other jurisdiction where such distribution, publication, reproduction, availability or use would be contrary to law or regulation or what would subject HSL or its affiliates to any registration or licensing requirement within such jurisdiction. If this report is inadvertently send or has reached any individual in such country, especially, USA, the same may be ignored and brought to the attention of the sender. This document may not be reproduced, distributed or published for any purposes without prior written approval of HSL. Foreign currencies denominated securities, wherever mentioned, are subject to exchange rate fluctuations, which could have an adverse effect on their value or price, or the income derived from them. In addition, investors in securities such as ADRs, the values of which are influenced by foreign currencies effectively assume currency risk. It should not be considered to be taken as an offer to sell or a solicitation to buy any security. HSL may from time to time solicit from, or perform broking, or other services for, any company mentioned in this mail and/or its attachments. HSL and its affiliated company(ies), their directors and employees may; (a) from time to time, have a long or short position in, and buy or sell the securities of the company(ies) mentioned herein or (b) be engaged in any other transaction involving such securities and earn brokerage or other compensation or act as a market maker in the financial instruments of the company(ies) discussed herein or act as an advisor or lender/borrower to such company(ies) or may have any other potential conflict of interests with respect to any recommendation and other related information and opinions. HSL, its directors, analysts or employees do not take any responsibility, financial or otherwise, of the losses or the damages sustained due to the investments made or any action taken on basis of this report, including but not restricted to, fluctuation in the prices of shares and bonds, changes in the currency rates, diminution in the NAVs, reduction in the dividend or income, etc. HSL and other group companies, its directors, associates, employees may have various positions in any of the stocks, securities and financial instruments dealt in the report, or may make sell or purchase or other deals in these securities from time to time or may deal in other securities of the companies / organizations described in this report. HSL or its associates might have managed or co-managed public offering of securities for the subject company or might have been mandated by the subject company for any other assignment in the past twelve months. HSL or its associates might have received any compensation from the companies mentioned in the report during the period preceding twelve months from t date of this report for services in respect of managing or co-managing public offerings, corporate finance, investment banking or merchant banking, brokerage services or other advisory service in a merger or specific transaction in the normal course of business. HSL or its analysts did not receive any compensation or other benefits from the companies mentioned in the report or third party in connection with preparation of the research report. Accordingly, neither HSL nor Research Analysts have any material conflict of interest at the time of publication of this report. Compensation of our Research Analysts is not based on any specific merchant banking, investment banking or brokerage service transactions. HSL may have issued other reports that are inconsistent with and reach different conclusion from the information presented in this report. Research entity has not been engaged in market making activity for the subject company. Research analyst has not served as an officer, director or employee of the subject company. We have not received any compensation/benefits from the subject company or third party in connection with the Research Report. HDFC securities Limited, I Think Techno Campus, Building - B, "Alpha", Office Floor 8, Near Kanjurmarg Station, Opp. Crompton Greaves, Kanjurmarg (East), Mumbai 400 042 Phone: (022) 3075 3400 Fax: (022) 2496 5066 Compliance Officer: Binkle R. Oza Email: [email protected] Phone: (022) 3045 3600 HDFC Securities Limited, SEBI Reg. No.: NSE-INB/F/E 231109431, BSE-INB/F 011109437, AMFI Reg. No. ARN: 13549, PFRDA Reg. No. POP: 04102015, IRDA Corporate Agent License No.: HDF 2806925/HDF C000222657, SEBI Research Analyst Reg. No.: INH000002475, CIN - U67120MH2000PLC152193 Mutual Funds Investments are subject to market risk. Please read the offer and scheme related documents carefully before investing.