Navient Reports First-Quarter 2018 Financial Results Originated $500 Million of Private Education Refinance Loans Private Education Loan Charge-Offs Decreased 43 Percent from Year-Ago Quarter Business Processing Fee Revenue Increased 32 Percent Organically from Year-Ago Quarter WILMINGTON, Del., April 24, 2018 — Navient (Nasdaq: NAVI) today released its first-quarter 2018 financial results that included the origination of $500 million of private education refinance loans, a 43 percent decrease in private education loan charge-offs and a 32 percent organic increase in business processing fee revenue from the year-ago quarter. “2018 is off to a very good start, with adjusted core earnings of $0.43 per share,” said Jack Remondi, president and CEO, Navient. “We delivered strong growth rates in business processing revenue and in private education refi loan originations. Credit continued to improve, with the private education charge-off rate falling to 1.4 percent, as the economy continues to grow. In addition, profitability this quarter was aided by our focus on operating efficiency and the new lower tax rates. This quarter’s results lay a strong foundation for the balance of the year for our business and the customers who depend on us to serve them. As our business model has evolved, we changed our reporting segments to provide greater insight on performance and direction for investors.” For the first-quarter 2018, GAAP net income was $126 million ($0.47 diluted earnings per share), compared with $88 million ($0.30 diluted earnings per share) for the year-ago quarter. Core earnings for the quarter were $107 million ($0.40 diluted core earnings per share), compared with $107 million ($0.36 diluted core earnings per share) for the year-ago quarter. The increase in diluted core earnings per share was primarily the result of a $20 million reduction in provisions for loan losses, a $20 million reduction in income tax expense as a result of a lower tax rate in connection with the passage of the “Tax Cuts and Jobs Act” (“TCJA”), and fewer common shares outstanding. First-quarter 2018 and 2017 diluted core earnings per share were $0.43 and $0.37, respectively, excluding restructuring and regulatory-related expenses of $11 million and $4 million, respectively. Navient reports core earnings because management makes its financial decisions based on such measures. The changes in GAAP net income for the periods presented in this Earnings Release are impacted by the same items in core earnings that are discussed above, as well as changes in net income attributable to (1) unrealized, mark-to-market gains/losses on derivatives and (2) goodwill and acquired intangible asset amortization and impairment. These items are recognized in GAAP results but are not included in core earnings results. First- quarter 2018 GAAP results included gains of $31 million from derivative accounting treatment that are excluded from core earnings results, compared with losses of $23 million from this derivative accounting treatment in the year-ago period. See “Differences between Core Earnings and GAAP” on page 17 for a complete reconciliation between GAAP net income and core earnings. New Reporting Segments Navient changed its reportable operating segments this quarter to align with changes in how the company manages the business, reviews operating performance and allocates resources. The new reportable operating segments are Federal Education Loans, Consumer Lending, Business Processing and Other. As a result of this change, prior periods have been recast for comparison purposes. 1
Transcript
Navient Reports First-Quarter 2018 Financial ResultsOriginated $500 Million of Private Education Refinance Loans
Private Education Loan Charge-Offs Decreased 43 Percent from Year-Ago QuarterBusiness Processing Fee Revenue Increased 32 Percent Organically from Year-Ago Quarter
WILMINGTON, Del., April 24, 2018 — Navient (Nasdaq: NAVI) today released its first-quarter 2018financial results that included the origination of $500 million of private education refinance loans, a 43 percentdecrease in private education loan charge-offs and a 32 percent organic increase in business processing feerevenue from the year-ago quarter.
“2018 is off to a very good start, with adjusted core earnings of $0.43 per share,” said Jack Remondi, presidentand CEO, Navient. “We delivered strong growth rates in business processing revenue and in private educationrefi loan originations. Credit continued to improve, with the private education charge-off rate falling to1.4 percent, as the economy continues to grow. In addition, profitability this quarter was aided by our focus onoperating efficiency and the new lower tax rates. This quarter’s results lay a strong foundation for the balance ofthe year for our business and the customers who depend on us to serve them. As our business model has evolved,we changed our reporting segments to provide greater insight on performance and direction for investors.”
For the first-quarter 2018, GAAP net income was $126 million ($0.47 diluted earnings per share), compared with$88 million ($0.30 diluted earnings per share) for the year-ago quarter.
Core earnings for the quarter were $107 million ($0.40 diluted core earnings per share), compared with$107 million ($0.36 diluted core earnings per share) for the year-ago quarter. The increase in diluted coreearnings per share was primarily the result of a $20 million reduction in provisions for loan losses, a $20 millionreduction in income tax expense as a result of a lower tax rate in connection with the passage of the “Tax Cutsand Jobs Act” (“TCJA”), and fewer common shares outstanding. First-quarter 2018 and 2017 diluted coreearnings per share were $0.43 and $0.37, respectively, excluding restructuring and regulatory-related expenses of$11 million and $4 million, respectively.
Navient reports core earnings because management makes its financial decisions based on such measures. Thechanges in GAAP net income for the periods presented in this Earnings Release are impacted by the same itemsin core earnings that are discussed above, as well as changes in net income attributable to (1) unrealized,mark-to-market gains/losses on derivatives and (2) goodwill and acquired intangible asset amortization andimpairment. These items are recognized in GAAP results but are not included in core earnings results. First-quarter 2018 GAAP results included gains of $31 million from derivative accounting treatment that are excludedfrom core earnings results, compared with losses of $23 million from this derivative accounting treatment in theyear-ago period. See “Differences between Core Earnings and GAAP” on page 17 for a complete reconciliationbetween GAAP net income and core earnings.
New Reporting Segments
Navient changed its reportable operating segments this quarter to align with changes in how the companymanages the business, reviews operating performance and allocates resources. The new reportable operatingsegments are Federal Education Loans, Consumer Lending, Business Processing and Other. As a result of thischange, prior periods have been recast for comparison purposes.
1
Federal Education Loans
In its Federal Education Loans segment, Navient holds and acquires FFELP loans and performs servicing andasset recovery services on its own loan portfolio, federal education loans owned by the U.S. Department ofEducation and other institutions.
Core earnings for the segment were $141 million in first-quarter 2018, compared with the year-ago quarter’s$129 million. This increase was primarily the result of a $6 million decrease in operating expenses and a$26 million decrease in income tax expense as a result of the TCJA. These items were partially offset by a$3 million decrease in net interest income and a $26 million decrease in fee income. The decrease in fee incomewas primarily the result of the new terms contained in a previously disclosed modified asset recovery andportfolio management contract.
The company acquired $283 million of FFELP loans in the first-quarter 2018. At March 31, 2018, Navient held$79.4 billion of FFELP loans, compared with $85.3 billion of FFELP loans held at March 31, 2017.
Consumer Lending
In its Consumer Lending segment, Navient holds, originates and acquires consumer loans and performs servicingactivities on its own loan portfolio.
Core earnings for the segment were $50 million in first-quarter 2018, compared with the year-ago quarter’s$38 million. This increase was primarily the result of a $7 million increase in net interest income, an $18 milliondecrease in provision for loan losses and a $9 million decrease in income tax expense as a result of the TCJA.These items were partially offset by a $21 million increase in operating expenses primarily related to operatingcosts for Earnest, acquired in November 2017, and a $9 million one-time fee paid to convert $3 billion of privateeducation loans from a third-party servicer to Navient’s servicing platform.
Segment portfolio results for first-quarter 2018 vs. first-quarter 2017 are as follows:
‰ Private education loan delinquencies of 90 days or more of $547 million, down $199 million from$746 million in first-quarter 2017.
‰ Private education loan total delinquencies of $1.3 billion, down $173 million from first-quarter 2017.
‰ Private education loan charge-offs of $78 million, down $59 million from $137 million in first-quarter2017.
‰ Provision for private education loan losses of $77 million, down from $95 million.
• Net interest margin on a core earnings basis of 3.23 percent, up from 3.16 percent.
Navient originated $500 million of private education refinance loans in the first-quarter 2018. The companyacquired (originated and purchased) $541 million of private education loans in the first-quarter 2018. AtMarch 31, 2018, Navient held $22.9 billion of private education loans (of which $1.2 billion were refinanceloans), compared with $22.6 billion of private education loans held at March 31, 2017.
Business Processing
In its Business Processing segment, Navient performs business processing services for non-education relatedgovernment and health care clients. The company provides services to over 600 clients in the health care andpublic sectors.
Core earnings for the segment were $10 million in first-quarter 2018, compared with $3 million in the year-agoquarter. This increase was primarily the result of a $29 million increase in fee income partially offset by a$20 million increase in operating expenses. The increases in fee income and operating expenses were primarilyrelated to organic growth of business processing contracts as well as to Duncan Solutions, acquired in July 2017.
2
Expenses
First-quarter 2018 and 2017 core earnings expenses were $271 million and $234 million, respectively, excludingrestructuring and regulatory-related expenses of $11 and $4 million, respectively. This $37 million increase overthe year-ago quarter was primarily due to $29 million of operating costs related to both Duncan Solutions,acquired in July 2017, and Earnest, acquired in November 2017. First-quarter 2018 operating expenses alsoincluded a $9 million one-time fee paid to convert $3 billion of private education loans from a third-partyservicer to Navient’s servicing platform and $14 million in connection with a new revenue recognitionaccounting standard adopted (see page 13 for further discussion). These increases to operating expenses werepartially offset by a general reduction in operating expenses across the business in connection with cost-savingsinitiatives.
Income Tax Expense
As a result of the TCJA, the core earnings effective tax rate in first-quarter 2018 was 23 percent compared to37 percent in the year-ago quarter.
Funding and Liquidity
During the first-quarter 2018, Navient issued $2.0 billion in FFELP loan ABS and $507 million in privateeducation loan ABS, and closed on private education loan ABS repurchase facilities totaling $1.4 billion. Navientretired or repurchased $167 million of senior unsecured debt during the first-quarter 2018, including $60 millionscheduled to mature in 2019. Additionally, on March 29, 2018, Navient announced a make-whole call, effectiveApril 27, 2018, for $1.2 billion par amount of unsecured debt due June 2018.
Shareholder Distributions
In the first-quarter 2018, Navient paid a common stock dividend of $0.16 per share.
On January 24, 2018, Navient announced that it expects to restart its share repurchases in the second half of2018. No shares were repurchased in first-quarter 2018.
* * *
Non-GAAP Financial Measures
In addition to financial results reported on a GAAP basis, Navient also provides certain core earningsperformance measures which are non-GAAP financial measures. The difference between the company’s coreearnings and its GAAP results for the periods presented in this Earnings Release is attributable to (1) unrealized,mark-to-market gains/losses on derivatives and (2) goodwill and acquired intangible asset amortization andimpairment. While these items are recognized under GAAP, they are excluded from core earnings results.Management uses core earnings in making decisions regarding the company’s performance and the allocation ofcorporate resources. In addition, Navient’s equity investors, credit rating agencies and debt capital investors usethese core earnings measures to monitor the company’s business performance. See “‘Core Earnings’ —Definition and Limitations” for a further discussion and a complete reconciliation between GAAP net incomeand core earnings.
Definitions for capitalized terms in this release can be found in Navient’s Annual Report on Form 10-K for theyear ended Dec. 31, 2017 (filed with the SEC on Feb. 26, 2018). Certain reclassifications have been made to thebalances as of and for the three months ended March 31, 2017, to be consistent with classifications adopted for2018, and had no effect on net income, total assets or total liabilities.
* * *
Navient will host an earnings conference call tomorrow, April 25, at 8 a.m. EDT. Navient executives will be onhand to discuss various highlights of the quarter and to answer questions related to the company’s performance.To participate, join a live audio webcast at navient.com/investors or dial 855-838-4156 (USA and Canada) or dial267-751-3600 (international) and use access code 50696460 starting at 7:45 a.m. EDT.
3
Presentation slides for the conference call, as well as additional information about the company’s loan portfolios,operating segments and other details, may be accessed at www.navient.com/investors under the webcasts tab.
A replay of the conference call will be available approximately two hours after the call’s conclusion throughMay 9 at navient.com/investors or by dialing 855-859-2056 (USA and Canada) or 404-537-3406 (international)with access code 50696460.
This press release contains “forward-looking statements” and other information that is based onmanagement’s current expectations as of the date of this release. Statements that are not historical facts,including statements about the company’s beliefs, opinions or expectations and statements that assume or aredependent upon future events, are forward-looking statements and often contain words such as “expect,”“anticipate,” “intend,” “plan,” “believe,” “seek,” “see,” “will,” “would,” or “target.” Forward-looking statementsare subject to risks, uncertainties, assumptions and other factors that may cause actual results to be materiallydifferent from those reflected in such forward-looking statements. For Navient, these factors include, amongothers, the risks and uncertainties associated with increases in financing costs; the availability of financing orlimits on our liquidity resulting from disruptions in the capital markets or other factors; unanticipated increases incosts associated with compliance with federal, state or local laws and regulations; changes in the demand forasset management and business processing solutions or other changes in marketplaces in which we compete(including increased competition); changes in accounting standards including but not limited to changespertaining to loan loss reserves and estimates or other accounting standards that may impact our operations;adverse outcomes in any significant litigation to which the company is a party; credit risk associated with thecompany’s underwriting standards or exposure to third parties, including counterparties to hedging transactions;and changes in the terms of education loans and the educational credit marketplace (including changes resultingfrom new laws and the implementation of existing laws). The company could also be affected by, among otherthings: unanticipated repayment trends on loans including prepayments or deferrals in our FFELP securitizationtrusts that could accelerate or delay repayment of the bonds beyond their legal final maturity date; reductions toour credit ratings, the credit ratings of asset-backed securitizations we sponsor or the credit ratings of theUnited States of America; failures of our operating systems or infrastructure or those of third-party vendors; risksrelated to cybersecurity including the potential disruption of our systems or those of our third-party vendors orcustomers, or potential disclosure of confidential customer information; damage to our reputation resulting fromcyber-breaches, litigation, the politicization of student loan servicing or other actions or factors; failure tosuccessfully implement cost-cutting initiatives and adverse effects of such initiatives on our business; failure toadequately integrate acquisitions or realize anticipated benefits from acquisitions including delays or errors inconverting portfolio acquisitions to our servicing platform; changes in law and regulations whether new laws orregulations, or new interpretations of existing laws and regulations applicable to any of our businesses oractivities or those of our vendors, suppliers or customers; changes in the general interest rate environment,including the availability of any relevant money-market index rate, including LIBOR, or the relationship betweenthe relevant money-market index rate and the rate at which our assets are priced; our ability to successfullyeffectuate any acquisitions and other strategic initiatives; changes in general economic conditions; and the otherfactors that are described in the “Risk Factors” section of Navient’s Annual Report on Form 10-K and in ourother reports filed with the Securities and Exchange Commission. The preparation of the company’s consolidatedfinancial statements also requires management to make certain estimates and assumptions including estimatesand assumptions about future events. These estimates or assumptions may prove to be incorrect and actual resultscould differ materially. All forward-looking statements contained in this release are qualified by these cautionarystatements and are made only as of the date of this release. The company does not undertake any obligation toupdate or revise these forward-looking statements except as required by law.
* * *
About Navient
Navient (Nasdaq: NAVI) is a leading provider of asset management and business processing solutions foreducation, health care, and government clients at the federal, state, and local levels. The company helps its clients
4
and millions of Americans achieve financial success through services and support. Headquartered in Wilmington,Delaware, Navient also employs team members in western New York, northeastern Pennsylvania, Indiana,Tennessee, Texas, Virginia, Wisconsin, California and other locations. Learn more at navient.com.
(1) Results include $208 million and $224 million of DTA Remeasurement Loss in the fourth quarter of 2017 on a GAAP and “CoreEarnings” basis, respectively, in connection with the enactment of the TCJA in December 2017. See our Annual Report on Form 10-K forthe year ended December 31, 2017 for further discussion.
(2) “Core Earnings” are non-GAAP financial measures and do not represent a comprehensive basis of accounting. For a greater explanationof “Core Earnings,” see the section titled “‘Core Earnings’ — Definition and Limitations” and subsequent sections.
6
New Reporting Segments
In the fourth quarter of 2017, Navient entered the Private Education Refinance Loan origination market.This new activity changed the way the Company manages the business, reviews operating performance andallocates resources. This resulted in the following four new reportable operating segments, effective first quarter2018: (1) Federal Education Loans (2) Consumer Lending (3) Business Processing and (4) Other. These newreportable operating segments now primarily distinguish between our legacy federal education loan businessesand our growth businesses. In connection with this change in reportable operating segments, there was also achange in how unallocated overhead is defined.
The following table shows the realignment of our business lines (operating segments) from the priorreportable operating segments to the new reportable operating segments:
Business Lines New Reportable Operating Segment Prior Reportable Operating Segment
FFELP Loans Federal Education Loans FFELP LoansFederal Education Loans Servicing Federal Education Loans Business ServicesFederal Education Loans Asset Recovery Federal Education Loans Business Services
Non-Education Government Services Business Processing Business ServicesNon-Education Health Care RCM Services Business Processing Business Services
Unallocated Overhead Expenses Other OtherCorporate Liquidity Portfolio Other Other
These segments meet the quantitative thresholds for reportable segments. Accordingly, the results ofoperations of these reportable operating segments are presented separately. The underlying operating segmentsare used by the Company’s chief operating decision maker to manage the business, review operatingperformance and allocate resources, and qualify to be aggregated as part of the reportable operating segments. Asdiscussed further below, we measure the profitability of our operating segments based on “Core Earnings” netincome. Accordingly, information regarding our reportable segments is provided on a “Core Earnings” basis. Asa result of this change in segment reporting in the first quarter of 2018, prior periods have been recast forcomparison purposes.
7
Federal Education Loans Segment — “Core Earnings”
In its Federal Education Loans segment, Navient holds and acquires FFELP Loans and performs servicingand asset recovery services on its own loan portfolio, federal education loans owned by the Department ofEducation and other institutions. Although FFELP Loans are no longer originated, we continue to pursueacquisitions of FFELP Loan portfolios as well as servicing and asset recovery services contracts. Theseacquisitions leverage our servicing scale and generate incremental earnings and cash flow. In this segment, wegenerate revenue primarily through net interest income on the FFELP Loan portfolio (after provision for loanlosses) as well as servicing and asset recovery services revenue. This segment is expected to generate significantamounts of earnings and cash flow over the remaining life of the portfolio.
In its Consumer Lending segment, Navient holds, originates and acquires consumer loans and performsservicing activities on its own loan portfolio. Originations and acquisitions leverage our servicing scale andgenerate incremental earnings and cash flow. In this segment, we generate revenue primarily through net interestincome on the Private Education Loan portfolio (after provision for loan losses). This segment is expected togenerate significant amounts of earnings and cash flow over the remaining life of the portfolio.
(1) Includes $8 million of revenue recognized in first-quater 2018 in connection with a new revenue recognition accounting standard (seepage 13 for further detail).
Other Segment — “Core Earnings”
Our Other segment primarily consists of the following activities: our corporate liquidity portfolio and therepurchase of debt, unallocated overhead (corporate overhead and certain information technology costs),restructuring/other reorganization expenses, regulatory-related costs, and the deferred tax asset remeasurementloss recognized due to the enactment of the TCJA in the fourth quarter of 2017.
Unallocated corporate overhead is comprised of costs primarily related to certain executive management,the board of directors, accounting, finance, legal, human resources, compliance and risk management, and stock-based compensation expense. Unallocated information technology costs are related to infrastructure andoperations.
9
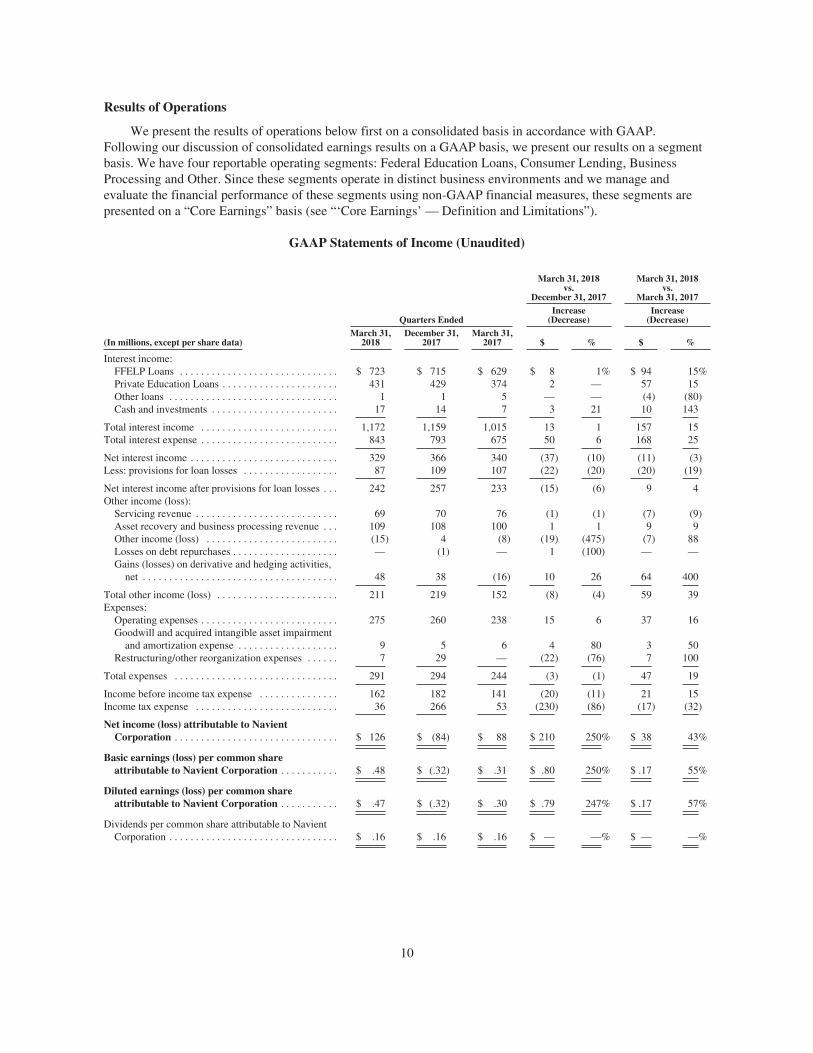
Results of Operations
We present the results of operations below first on a consolidated basis in accordance with GAAP.Following our discussion of consolidated earnings results on a GAAP basis, we present our results on a segmentbasis. We have four reportable operating segments: Federal Education Loans, Consumer Lending, BusinessProcessing and Other. Since these segments operate in distinct business environments and we manage andevaluate the financial performance of these segments using non-GAAP financial measures, these segments arepresented on a “Core Earnings” basis (see “‘Core Earnings’ — Definition and Limitations”).
Total Navient Corporation stockholders’ equity before treasury stock . . . . . 6,377 6,146 6,003Less: Common stock held in treasury: 180 million, 177 million and
Three Months Ended March 31, 2018 Compared with Three Months Ended March 31, 2017
For the three months ended March 31, 2018, net income was $126 million, or $0.47 diluted earnings percommon share, compared with net income of $88 million, or $0.30 diluted earnings per common share, for thethree months ended March 31, 2017. The increase in net income was primarily due to a $20 million decrease inthe provision for loan losses, a $64 million increase in net gains on derivative and hedging activities and a$17 million decrease in income tax expense. This was partially offset by an $11 million decrease in net interestincome and a $37 million increase in operating expenses.
The primary contributors to each of the identified drivers of changes in net income for the current quartercompared with the year-ago quarter are as follows:
‰ Net interest income decreased by $11 million, primarily as a result of the amortization of the educationloan portfolio.
‰ Provisions for loan losses decreased $20 million from the year-ago quarter, primarily related to theprovision for Private Education Loan losses. The provision for Private Education Loan losses was$77 million in the first quarter of 2018, down $18 million from the first quarter of 2017. Excluding thePurchased Non-Credit Impaired Private Education Loans acquired at a discount, Private Educationprovision for loan losses decreased $24 million, outstanding loans decreased $1.8 billion, charge-offsdecreased $65 million and loan delinquencies of 90 days or more decreased $234 million compared withthe year-ago quarter. These items were the primary drivers of the decrease in the provisions for loanlosses. See “Financial Condition — Private Education Loan Portfolio Performance — Allowance forPrivate Education Loan Losses— GAAP and ‘Core Earnings’ Basis,” for a discussion of our allowancefor loan losses accounting policy related to the Purchased Non-Credit Impaired Private Education Loanspurchased at a discount.
‰ Net gains on derivative and hedging activities increased $64 million. The primary factors affecting thechange were interest rate and foreign currency fluctuations, which primarily affected the valuations of ourFloor Income Contracts, basis swaps and foreign currency hedges during each period. Valuations ofderivative instruments fluctuate based upon many factors including changes in interest rates, credit risk,foreign currency fluctuations and other market factors. As a result, net gains and losses on derivative andhedging activities may vary significantly in future periods.
‰ First-quarter 2018 and 2017 operating expenses included regulatory-related costs of $4 million in eachperiod. Excluding these regulatory-related costs, operating expenses were $271 million in first-quarter2018, a $37 million increase from first-quarter 2017. This increase was primarily due to $29 million ofoperating costs related to Duncan Solutions (acquired in July 2017) and to Earnest (acquired in November2017). First-quarter 2018 operating expenses also included a $9 million one-time fee paid to convert$3 billion of Private Education Loans from a third-party servicer to Navient’s servicing platform and$14 million in connection with a new revenue recognition accounting standard adopted (see below forfurther discussion). These items were partially offset by a general reduction in operating expenses acrossthe business in connection with cost savings initiatives.
During the first quarter of 2018, the Company incurred $7 million of restructuring/other reorganizationexpenses in connection with an effort that will reduce costs and improve operating efficiency. Thesecharges were due primarily to severance-related costs.
• The effective income tax rates for the first quarters of 2018 and 2017 were 22 percent and 37 percent,respectively. The decrease in the effective income tax rate was primarily the result of the TCJA. Incometax expense decreased $17 million of which $23 million was a result of the lower tax rate in connectionwith the passage of the TCJA.
We repurchased 7 million shares of our common stock during the first-quarter 2017. There were norepurchases in the current quarter. As a result of repurchases made prior to the first-quarter 2018, our averageoutstanding diluted shares decreased by 27 million common shares (or 9 percent) from the year-ago period.
12
As of January 1, 2018, we adopted Accounting Standard Codification (“ASC”) 606, “Revenue fromContracts with Customers,” which requires an entity to recognize the amount of revenue to which it expects to beentitled for the transfer of promised goods or services to its customers. The contract transaction price is allocatedto each distinct contractual performance obligation and recognized as revenue at a point in time or over timewhen or as the good or service is provided to the customer and the performance obligation is satisfied. Generally,our performance obligations are satisfied over time. In conjunction with our implementation plan, we identifiedrevenue streams related to asset recovery and other business processing within our Federal Education Loans andBusiness Processing segments that are within the scope of the new standard and reviewed related contracts. Wedetermined there was no material change in the timing of our recognition of our asset recovery and businessprocessing revenue or expenses and we did not record a cumulative adjustment as of January 1, 2018 as a resultof the adoption of ASC 606. In connection with ASC 606, we recognized $8 million of revenue and $5 million ofexpenses in first-quarter 2018 related to a contract in our Business Processing segment that would have not beenrecognized under the prior accounting standard until later in 2018.
The new guidance does not apply to financial instruments and transfers and servicing that are accounted forunder other U.S. GAAP. Accordingly, the new revenue recognition guidance does not have an impact on ourrecognition of revenue and costs associated with our loan portfolios, investments, derivatives and servicingcontracts. However, we considered the ASC 606 principal versus agent guidance with respect to certain assetrecovery guarantor servicing contracts pursuant to which we serve in a portfolio management role and use third-party collection agencies. We determined that we are required under the new accounting standard to reflectpayments to third-party collection agencies as revenue and operating expense. Under the prior accountingstandards, we netted payments to third-party collection agencies against revenue. We adopted the new accountingstandard using the “cumulative effect transition adjustment” which results in prospectively making this change in2018. This change in accounting policy resulted in both asset recovery revenue and operating expense in theFederal Education Loan segment being $9 million higher in the first-quarter 2018 with no impact on net income.
“Core Earnings” — Definition and Limitations
We prepare financial statements and present financial results in accordance with GAAP. However, we alsoevaluate our business segments and present financial results on a basis that differs from GAAP. We refer to thisdifferent basis of presentation as “Core Earnings.” We provide this “Core Earnings” basis of presentation on aconsolidated basis for each business segment because this is what we review internally when makingmanagement decisions regarding our performance and how we allocate resources. We also refer to thisinformation in our presentations with credit rating agencies, lenders and investors. Because our “Core Earnings”basis of presentation corresponds to our segment financial presentations, we are required by GAAP to provide“Core Earnings” disclosure in the notes to our consolidated financial statements for our business segments.
“Core Earnings” are not a substitute for reported results under GAAP. We use “Core Earnings” to manageour business segments because “Core Earnings” reflect adjustments to GAAP financial results for two items,discussed below, that create significant volatility mostly due to timing factors generally beyond the control ofmanagement. Accordingly, we believe that “Core Earnings” provide management with a useful basis from whichto better evaluate results from ongoing operations against the business plan or against results from prior periods.Consequently, we disclose this information because we believe it provides investors with additional informationregarding the operational and performance indicators that are most closely assessed by management. Whencompared to GAAP results, the two items we remove to result in our “Core Earnings” presentations are:
1. Unrealized mark-to-market gains/losses resulting from our use of derivative instruments to hedge oureconomic risks that do not qualify for hedge accounting treatment or do qualify for hedge accountingtreatment but result in ineffectiveness; and
2. The accounting for goodwill and acquired intangible assets.
While GAAP provides a uniform, comprehensive basis of accounting, for the reasons described above, our“Core Earnings” basis of presentation does not. “Core Earnings” are subject to certain general and specificlimitations that investors should carefully consider. For example, there is no comprehensive, authoritativeguidance for management reporting. Our “Core Earnings” are not defined terms within GAAP and may not be
13
comparable to similarly titled measures reported by other companies. Accordingly, our “Core Earnings”presentation does not represent a comprehensive basis of accounting. Investors, therefore, may not be able tocompare our performance with that of other financial services companies based upon “Core Earnings.” “CoreEarnings” results are only meant to supplement GAAP results by providing additional information regarding theoperational and performance indicators that are most closely used by management, our board of directors, creditrating agencies, lenders and investors to assess performance.
(2) With the adoption of ASC 606, asset recovery and business processing revenue is $17 million higher and operating expense is $14 millionhigher than what they would have been under the prior accounting standard (see page 13 for further detail).
(3) Income taxes are based on a percentage of net income before tax for the individual reportable segment.
(2) Income taxes are based on a percentage of net income before tax for the individual reportable segment.
16
Differences between “Core Earnings” and GAAP
The following discussion summarizes the differences between “Core Earnings” and GAAP net income anddetails each specific adjustment required to reconcile our “Core Earnings” segment presentation to our GAAPearnings.
GAAP net income attributable to Navient Corporation . . . . . . . . . . . . . . . $126 $ (84) $ 88
(1) Derivative Accounting: “Core Earnings” exclude periodic unrealized gains and losses that are caused bythe mark-to-market valuations on derivatives that do not qualify for hedge accounting treatment underGAAP, as well as the periodic unrealized gains and losses that are a result of ineffectiveness recognizedrelated to effective hedges under GAAP. These unrealized gains and losses occur in our Federal EducationLoans, Consumer Lending and Other reportable segments. Under GAAP, for our derivatives that are held tomaturity, the cumulative net unrealized gain or loss over the life of the contract will equal $0 except forFloor Income Contracts, where the cumulative unrealized gain will equal the amount for which we sold thecontract. In our “Core Earnings” presentation, we recognize the economic effect of these hedges, whichgenerally results in any net settlement cash paid or received being recognized ratably as an interest expenseor revenue over the hedged item’s life.
17
The table below quantifies the adjustments for derivative accounting between GAAP and “Core Earnings”net income.
Quarters Ended
(Dollars in millions)March 31,
2018December 31,
2017March 31,
2017
“Core Earnings” derivative adjustments:Gains (losses) on derivative and hedging activities, net,
included in other income . . . . . . . . . . . . . . . . . . . . . . . . . . . . $ 48 $ 38 $(16)Plus: Realized losses on derivative and hedging activities,
Total net impact of derivative accounting . . . . . . . . . . . . . . . . . $ 31 $ 47 $(23)
(1) See “Reclassification of Realized Gains (Losses) on Derivative and Hedging Activities” below for a detailed breakdown of thecomponents of realized losses on derivative and hedging activities.
(2) “Unrealized gains on derivative and hedging activities, net” comprises the following unrealized mark-to-market gains (losses):
(3) Other derivative accounting adjustments consist of adjustments related to: (1) foreign currency denominated debt that is adjusted tospot foreign exchange rates for GAAP where such adjustments are reversed for “Core Earnings” and (2) certain terminatedderivatives that did not receive hedge accounting treatment under GAAP but were economic hedges under “Core Earnings” and, asa result, such gains or losses are amortized into “Core Earnings” over the life of the hedged item.
18
Reclassification of Realized Gains (Losses) on Derivative and Hedging Activities
Derivative accounting requires net settlement income/expense on derivatives and realized gains/lossesrelated to derivative dispositions (collectively referred to as “realized gains (losses) on derivative andhedging activities”) that do not qualify as hedges to be recorded in a separate income statement lineitem below net interest income. Under our “Core Earnings” presentation, these gains and losses arereclassified to the income statement line item of the economically hedged item. For our “CoreEarnings” net interest margin, this would primarily include: (a) reclassifying the net settlementamounts related to our Floor Income Contracts to education loan interest income; and (b) reclassifyingthe net settlement amounts related to certain of our basis swaps to debt interest expense. The tablebelow summarizes the realized losses on derivative and hedging activities and the associatedreclassification on a “Core Earnings” basis.
Quarters Ended
(Dollars in millions)March 31,
2018December 31,
2017March 31,
2017
Reclassification of realized gains (losses) on derivative andhedging activities:
Net settlement expense on Floor Income Contracts reclassifiedto net interest income . . . . . . . . . . . . . . . . . . . . . . . . . . . . . . . $ (8) $(15) $(20)
Net settlement income on interest rate swaps reclassified to netinterest income . . . . . . . . . . . . . . . . . . . . . . . . . . . . . . . . . . . . (7) (5) 3
Cumulative Impact of Derivative Accounting under GAAP compared to “Core Earnings”
As of March 31, 2018, derivative accounting has increased GAAP equity by approximately$115 million as a result of cumulative net unrealized gains (after tax) recognized under GAAP, but notin “Core Earnings.” The following table rolls forward the cumulative impact to GAAP equity due tothese unrealized after tax net gains related to derivative accounting.
Quarters Ended
(Dollars in millions)March 31,
2018December 31,
2017March 31,
2017
Beginning impact of derivative accounting on GAAP equity . . . . . $ 5 $(83) $ (90)Net impact of net unrealized gains (losses) under derivative
(a) See “‘Core Earnings’ derivative adjustments” table above.
Hedging FFELP Loan Embedded Floor Income
Net Floor premiums received on Floor Income Contracts that have not been amortized into “CoreEarnings” as of the respective period-ends are presented in the table below. These net premiums will berecognized in “Core Earnings” in future periods and are presented net of tax. As of March 31, 2018, theremaining amortization term of the net floor premiums was approximately 5 years. Historically, wehave sold Floor Income Contracts on a periodic basis and depending upon market conditions andpricing, we may enter into additional Floor Income Contracts in the future. The balance of unamortizedFloor Income Contracts will increase as we sell new contracts and decline due to the amortization ofexisting contracts.
In addition to using Floor Income Contracts, we also use pay-fixed interest rate swaps to hedge theembedded Floor Income within FFELP Loans. These interest rate swaps qualify as GAAP hedges andare accounted for as cash flow hedges of variable rate debt. For GAAP, gains and losses on theeffective portion of these hedges are recorded in accumulated other comprehensive income and gainsand losses on the ineffective portion are recorded immediately to earnings. Hedged Floor Income fromthese cash flow hedges that has not been recognized into “Core Earnings” and GAAP as of therespective period-ends is presented in the table below. This hedged Floor Income will be recognized in“Core Earnings” and GAAP in future periods and is presented net of tax. As of March 31, 2018, theremaining hedged period is approximately 5 years. Historically, we have used pay-fixed interest rateswaps on a periodic basis to hedge embedded Floor Income and depending upon market conditions and
20
pricing, we may enter into swaps in the future. The balance of unrecognized hedged Floor Income willincrease as we enter into new swaps and decline as revenue is recognized.
(Dollars in millions)March 31,
2018(1)December 31,
2017(1)March 31,
2017
Unamortized net Floor premiums (net of tax) . . . . . . $(160) $(168) $(158)Unrecognized hedged Floor Income related to pay
Total hedged Floor Income, net of tax(2)(3) . . . . . . . . . $(838) $(871) $(695)
(1) Reflects a 23 percent effective tax rate at March 31, 2018 and December 31, 2017 as a result of the TCJA enacted onDecember 22, 2017. Year-ago period reflects a 37 percent effective tax rate.
(2) $(1.1) billion, $(1.1) billion and $(1.1) billion on a pre-tax basis as of March 31, 2018, December 31, 2017 and March 31,2017, respectively.
(3) Of the $838 million as of March 31, 2018, approximately $176 million, $218 million and $189 million will be recognized aspart of “Core Earnings” net income in 2018, 2019 and 2020, respectively.
(2) Goodwill and Acquired Intangible Assets: Our “Core Earnings” exclude goodwill and intangible assetimpairment and the amortization of acquired intangible assets. The following table summarizes the goodwilland acquired intangible asset adjustments.
(1) Deferment includes customers who have returned to school or are engaged in other permitted educational activities and are not yetrequired to make payments on the loans, e.g., residency periods for medical students or a grace period for bar exam preparation.
(2) Loans for customers who have requested extension of grace period generally during employment transition or who have temporarilyceased making full payments due to hardship or other factors such as disaster relief, consistent with established loan program servicingpolicies and procedures.
(3) The period of delinquency is based on the number of days scheduled payments are contractually past due.
22
Allowance for Private Education Loan Losses — GAAP and “Core Earnings” Basis
Purchased Credit Impaired (“PCI”) Loans
Loans acquired with evidence of deterioration of credit quality since origination for which it is probable, atacquisition, that the investor will be unable to collect all contractually required payments receivable are PCIloans accounted for under Accounting Standard Codification (“ASC”) 310-30, “Loans and Debt SecuritiesAcquired with Deteriorated Credit Quality.” When considering whether evidence of credit quality deteriorationexists as of the purchase date, the Company considers loan guarantees and the following credit attributes:delinquency status, use of forbearance, recent borrower FICO scores, use of loan modification programs, andborrowers who have filed for bankruptcy.
The Company aggregates loans with common risk characteristics into pools and accounts for each pool as asingle asset with a single composite interest rate and an aggregate expectation of cash flows. The pools areinitially recorded at fair value. The Company recognizes interest income based on each pool’s effective interestrate which is based on our estimate of all cash flows expected to be received and includes an assumption aboutprepayment rates. The pools are tested quarterly for impairment by re-estimating the future cash flows to bereceived from the pools. If the new estimated cash flows result in a pool’s effective interest rate increasing, thenthis new yield is used prospectively over the remaining life of the pool. If the new estimated cash flows result ina pool’s effective interest rate decreasing, the pool is impaired and written down through a valuation allowance tomaintain the effective interest rate. Loans classified as PCI do not have charge-offs reported nor are they reportedas Trouble Debt Restructuring (“TDR”) loans.
Based on the credit attributes discussed above, we determined that $261 million principal amount of PrivateEducation Loans acquired in 2017 are accounted for as PCI loans with a fair value and resulting carrying value of$101 million as of the acquisition date. As of acquisition, this portfolio’s contractually required paymentsreceivable (the total undiscounted amount of all uncollected contractual principal and interest payments both pastdue and scheduled for the future, adjusted for prepayments) was $411 million with an estimated accretable yield(income expected to be recognized in future periods) of $108 million. As of March 31, 2018, the carrying amountwas $95 million with no valuation allowance recorded.
Purchased Non-Credit Impaired Loans
Loans acquired that do not have evidence of credit deterioration since origination are recorded at fair valuewith no allowance for loan losses established at the acquisition date. Loan premiums and discounts are amortizedas a part of interest income using the interest method under ASC 310-20, “Nonrefundable Fees and Other Costs.”An allowance for loan losses would be established if incurred losses in the loans exceed the remainingunamortized discount recorded at the time of acquisition (i.e., the next two years of expected charge-offs as wellas any additional TDR allowance required is greater than the remaining discount). As a result of this policy, tothe extent that actual charge-offs exceed any related allowance for loan losses recognized post-acquisition,provision for loan losses is recorded when the loans are charged off. Charge-offs are recorded through theallowance for loan losses. In 2017, we acquired Private Education Loans with unpaid principal balance of$2.8 billion at a discount of $424 million that are accounted for under this policy. No allowance for loan losseshas been established for these loans as of March 31, 2018, as the remaining purchased discount associated withthe Private Education Loans of $378 million as of March 31, 2018 remains greater than the incurred losses.
23
Allowance for Loan Losses
As discussed above, our allowance for Private Education Loan losses does not include PCI loans as thoseloans are separately reserved for, as needed. Related to the $2.8 billion of Purchased Non-Credit Impaired Loansacquired in 2017 at a discount, there is no allowance for loan losses established as of March 31, 2018. However,in accordance with our policy described above, there was $6 million of both charge-offs and provision recordedfor Purchased Non-Credit Impaired Loans in first-quarter 2018.
(1) Charge-offs are reported net of expected recoveries. The expected recovery amount is transferred to the receivable for partiallycharged-off loan balance. Charge-offs include charge-offs against the receivable for partially charged-off loans which represents thedifference between what was expected to be collected and any shortfalls in what was actually collected in the period. See “Receivable forPartially Charged-Off Private Education Loans” for further discussion.
(2) Represents the additional allowance related to the amount of uncollectible interest reserved within interest income that is transferred in theperiod to the allowance for loan losses when interest is capitalized to a loan’s principal balance.
(3) As discussed above, Purchased Credit Impaired Loans’ losses are not provided for by the allowance for loan losses in the above table asthese loans are separately reserved for, if needed. Related to the Purchased Non-Credit Impaired Loans acquired at a discount, noallowance for loan losses has been established for these loans as of March 31, 2018. As a result, excluding these loans that are accountedfor under these two accounting policies, the allowance as a percentage of the ending total loan balance and the allowance as a percentageof the ending loans in repayment would be 5.8 percent and 6.6 percent as of March 31, 2018, respectively, and 5.7 percent and 6.4 percentas of December 31, 2017, respectively.
(4) Ending total loans represents gross Private Education Loans, plus the receivable for partially charged-off loans.
24
In establishing the allowance for Private Education Loan losses as of March 31, 2018, we considered severalfactors with respect to our Private Education Loan portfolio. As discussed above, there is no allowance for loanlosses recorded as of March 31, 2018 related to the $3.0 billion of loans purchased in 2017 at a discount.Excluding the $3.0 billion of Private Education Loans purchased in 2017, there was a $1.8 billion decrease inPrivate Education Loans outstanding, total loan delinquencies of $1.2 billion were down $246 million from$1.4 billion in the year-ago quarter and loan delinquencies of 90 days or more decreased to $512 million, down$234 million from $746 million in the year-ago quarter. Charge-offs decreased to $72 million, down $65 millionfrom $137 million in the year-ago quarter. Loans in forbearance increased to $880 million, up $87 million from$793 million in the year-ago quarter.
The provision for Private Education Loan losses was $77 million in the first quarter of 2018, down$18 million from the first quarter of 2017. Excluding the $3.0 billion of Private Education Loans purchased in2017 at a discount, the provision for loan losses decreased $24 million primarily as a result of the items discussedin the preceding paragraph.
Receivable for Partially Charged-Off Private Education Loans
At the end of each month, for loans that are 212 or more days past due, we charge off the estimated loss of adefaulted loan balance. Actual recoveries are applied against the remaining loan balance that was not charged off.We refer to this remaining loan balance as the “receivable for partially charged-off loans.” If actual periodicrecoveries are less than expected, the difference is immediately charged off through the allowance for PrivateEducation Loan losses with an offsetting reduction in the receivable for partially charged-off Private EducationLoans. If actual periodic recoveries are greater than expected, they will be reflected as a recovery through theallowance for Private Education Loan losses once the cumulative recovery amount exceeds the cumulativeamount originally expected to be recovered.
The following table summarizes the activity in the receivable for partially charged-off Private EducationLoans (GAAP-basis and “Core Earnings”-basis are the same).
Receivable at end of period . . . . . . . . . . . . . . . . . . . . . . . . . . . . $741 $760 $800
(1) Represents our estimate of the amount to be collected in the future.
(2) Current period cash collections.
(3) Represents the current period recovery shortfall — the difference between what was expected to be collected and what was actuallycollected. These amounts are included in total charge-offs as reported in the “Allowance for Private Education Loan Losses” table.
Liquidity and Capital Resources
We expect to fund our ongoing liquidity needs, including the repayment of $2.4 billion of senior unsecurednotes that mature in the next twelve months, primarily through our current cash, investments and unencumberedFFELP Loan portfolio, the predictable operating cash flows provided by operating activities, the repayment ofprincipal on unencumbered education loan assets, and the distribution of overcollateralization from oursecuritization trusts. We may also, depending on market conditions and availability, draw down on our securedFFELP Loan and Private Education Loan facilities, issue term asset-backed securities (“ABS”), enter intoadditional Private Education Loan ABS repurchase facilities, or issue additional unsecured debt.
25
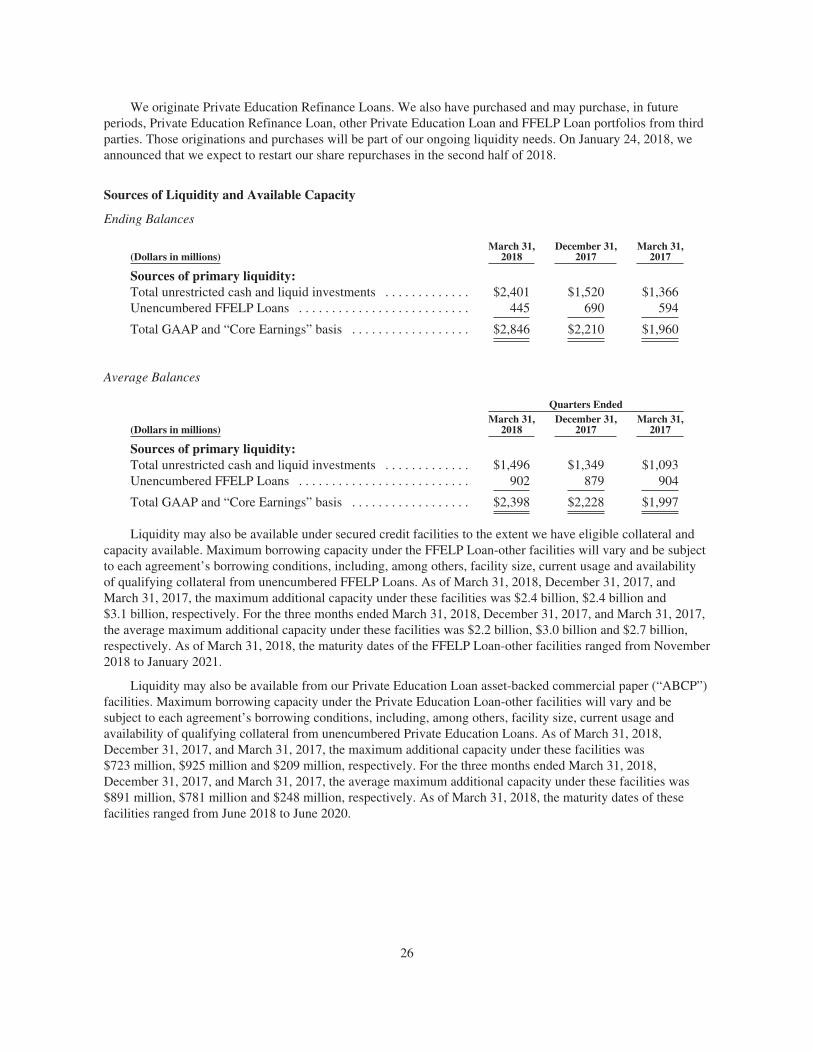
We originate Private Education Refinance Loans. We also have purchased and may purchase, in futureperiods, Private Education Refinance Loan, other Private Education Loan and FFELP Loan portfolios from thirdparties. Those originations and purchases will be part of our ongoing liquidity needs. On January 24, 2018, weannounced that we expect to restart our share repurchases in the second half of 2018.
Liquidity may also be available under secured credit facilities to the extent we have eligible collateral andcapacity available. Maximum borrowing capacity under the FFELP Loan-other facilities will vary and be subjectto each agreement’s borrowing conditions, including, among others, facility size, current usage and availabilityof qualifying collateral from unencumbered FFELP Loans. As of March 31, 2018, December 31, 2017, andMarch 31, 2017, the maximum additional capacity under these facilities was $2.4 billion, $2.4 billion and$3.1 billion, respectively. For the three months ended March 31, 2018, December 31, 2017, and March 31, 2017,the average maximum additional capacity under these facilities was $2.2 billion, $3.0 billion and $2.7 billion,respectively. As of March 31, 2018, the maturity dates of the FFELP Loan-other facilities ranged from November2018 to January 2021.
Liquidity may also be available from our Private Education Loan asset-backed commercial paper (“ABCP”)facilities. Maximum borrowing capacity under the Private Education Loan-other facilities will vary and besubject to each agreement’s borrowing conditions, including, among others, facility size, current usage andavailability of qualifying collateral from unencumbered Private Education Loans. As of March 31, 2018,December 31, 2017, and March 31, 2017, the maximum additional capacity under these facilities was$723 million, $925 million and $209 million, respectively. For the three months ended March 31, 2018,December 31, 2017, and March 31, 2017, the average maximum additional capacity under these facilities was$891 million, $781 million and $248 million, respectively. As of March 31, 2018, the maturity dates of thesefacilities ranged from June 2018 to June 2020.
26
At March 31, 2018, we had a total of $7.2 billion of unencumbered tangible assets inclusive of those listedin the table above as sources of primary liquidity. Total unencumbered education loans comprised $3.0 billion ofour unencumbered tangible assets of which $2.6 billion and $0.4 billion related to Private Education Loans andFFELP Loans, respectively. In addition, as of March 31, 2018, we had $9.8 billion of encumbered net assets (i.e.,overcollateralization) in our various financing facilities (consolidated variable interest entities). Since the fourthquarter of 2015, we have closed on $4.0 billion of Private Education Loan ABS Repurchase Facilities. Theserepurchase facilities are collateralized by Residual Interests in previously issued Private Education Loan ABStrusts. These are examples of how we can effectively finance previously encumbered assets to generate additionalliquidity in addition to the unencumbered assets we traditionally have encumbered in the past. Additionally, theserepurchase facilities had a cost of funds lower than that of a new unsecured debt issuance.
For further discussion of our various sources of liquidity, our access to the ABS market, our asset-backedfinancing facilities, and our issuance of unsecured debt, see “Note 6 — Borrowings” in our Annual Report onForm 10-K for the year ended December 31, 2017.
The following table reconciles encumbered and unencumbered assets and their net impact on GAAP totaltangible equity.
(1) At March 31, 2018, December 31, 2017 and March 31, 2017, excludes goodwill and acquired intangible assets, net, of $802 million,$810 million and $664 million, respectively.
(2) At March 31, 2018, December 31, 2017 and March 31, 2017, there were $1 million, $189 million and $319 million, respectively, ofnet gains on derivatives hedging this debt in unencumbered assets, which partially offset these losses.